


Abstract
Accurate, simple, cost-effective, and non-destructive estimation of heartwood content is essential for the sustainable management and commercial valuation of Pterocarpus santalinus L.f. (red sanders), one of the world’s most valuable tropical timber species. Conventional methods for heartwood assessment, including increment coring and destructive sampling, are invasive, time-consuming, and unsuitable for large-scale field applications. Electrical Resistance Tomography (ERT) offers a promising alternative by exploiting differences in electrical resistivity associated with variations in wood moisture content and anatomical characteristics. The present study standardized the application of ERT for the identification and quantification of heartwood in standing red sanders trees and validated its performance against conventional core sampling. Fifty-eight trees representing two diameter classes (10–20 cm and 20–30 cm) were evaluated using a PiCUS TreeTronic Electrical Resistance Tomograph, followed by increment core extraction at breast height for validation. Distinct resistivity gradients were observed, with higher electrical resistivity in the central heartwood region and lower resistivity in the peripheral sapwood. The resistivity values ranged from 153 to 1031 Ω in trees with diameters of 10–20 cm and from 342 to 1444 Ω in trees with diameters of 20–30 cm. Linear regression analysis showed excellent agreement between ERT-estimated and measured heartwood diameters (R2 = 0.98), with an average similarity of 91.5%. The observed resistivity distribution closely reflected variations in moisture content, wood density, and anatomical structure across the stem radius. The findings demonstrate that ERT is a reliable and non-destructive technique for estimating heartwood content in standing red sanders trees. These results demonstrate that ERT can accurately estimate heartwood dimensions in standing Pterocarpus santalinus trees under the conditions of the present study and provide a reliable approach for non-destructive assessment of heartwood in this species. The technique has considerable potential for timber valuation, harvest planning, tree breeding, forest inventory, and conservation programs involving high-value tropical hardwood species.
1. Introduction
Heartwood formation is one of the most important biological processes determining the quality and commercial value of timber. Compared with sapwood, heartwood contains higher concentrations of extractives, phenolic compounds, and secondary metabolites that impart its characteristic color, durability, dimensional stability, and natural resistance to biological degradation [1,2,3]. In high-value timber species, heartwood represents the economically valuable portion of the stem and largely determines timber quality and market price. Consequently, accurate estimation of heartwood dimensions in standing trees is essential for sustainable forest management, tree improvement programs, timber valuation, and determination of the optimum harvest age.
Pterocarpus santalinus L.f. (red sanders) is an endemic and endangered tropical hardwood species native to southern India and is internationally valued for its dense, richly colored heartwood. The wood is highly prized for luxury furniture, handicrafts, musical instruments, decorative carvings, natural dyes, and traditional medicinal products owing to its unique physical properties and high concentration of valuable extractives [4,5]. Because of its slow growth, restricted natural distribution, and exceptionally high market demand, reliable non-destructive methods for assessing heartwood development are increasingly important for conservation, plantation management, breeding programs, and timber quality evaluation.
Traditionally, heartwood assessment has relied on destructive or semi-destructive methods such as tree felling, cross-sectional analysis, and increment core sampling [1,6]. Although increment coring provides reasonably accurate estimates of heartwood dimensions, it samples only a small portion of the stem and may not adequately represent the spatial variability of heartwood or reveal localized internal defects. Repeated coring can also create entry points for pathogens, reduce timber quality, and adversely affect tree health [7]. Furthermore, destructive methods are labor-intensive, expensive, and incompatible with sustainable forest management, particularly for valuable, protected, or endangered tree species [8,9]. These limitations have stimulated increasing interest in reliable non-destructive techniques for evaluating internal stem characteristics while preserving tree integrity.
Among the available non-destructive approaches, Electrical Resistance Tomography (ERT) has emerged as a promising technique for assessing the internal condition of standing trees. Originally developed for geophysical investigations, ERT has been adapted for tree assessment by measuring electrical resistivity across the stem cross-section and reconstructing two-dimensional tomographic images [8,9]. Electrical resistivity in wood is primarily influenced by moisture content, electrolyte concentration, extractive content, temperature, and wood anatomy. Sapwood, which contains higher moisture content and physiologically active conducting tissues, generally exhibits lower resistivity, whereas heartwood, characterized by lower moisture content and greater accumulation of extractives, displays comparatively higher resistivity [10,11,12]. Consequently, radial resistivity patterns can be used to distinguish sapwood and heartwood and to identify internal structural variations.
Several studies have demonstrated the applicability of ERT for delineating sapwood and heartwood boundaries and detecting internal decay in temperate hardwoods and conifers [9,11,12,13,14,15]. These studies established that the pronounced moisture gradient between sapwood and heartwood produces distinct electrical resistivity patterns that can be visualized using tomographic reconstruction [16,17,18]. Although ERT directly measures electrical resistivity rather than wood quality attributes, the resulting resistivity distribution provides valuable information on internal wood characteristics when interpreted together with moisture distribution, extractive accumulation, and anatomical structure [9,19]. Therefore, ERT has considerable potential for supporting non-destructive timber evaluation, tree improvement, harvest planning, and monitoring of heartwood development.
The dense, extractive-rich heartwood of P. santalinus is responsible for its exceptional mechanical strength, durability, and dimensional stability [20,21]. These wood characteristics are also associated with higher electrical resistivity than the surrounding sapwood, suggesting that ERT can effectively delineate heartwood dimensions while providing indirect information on radial variation in wood properties. However, the relationship between electrical resistivity and wood characteristics is influenced by multiple interacting factors, including moisture content, extractive composition, electrolyte concentration, and anatomical features. Therefore, interpretation of ERT results requires species-specific calibration and validation.
Despite considerable progress in temperate tree species, the application of ERT to tropical hardwoods remains limited [18,22]. Tropical species differ markedly in wood anatomy, density, extractive chemistry, and moisture dynamics, all of which influence electrical resistivity and may affect the accuracy of tomographic interpretation [3,5]. Consequently, methodologies developed for temperate species cannot be directly extrapolated to tropical hardwoods without validation. In particular, no standardized methodology has been established for non-destructive estimation of heartwood diameter in standing P. santalinus trees despite its immense commercial and conservation importance.
Therefore, the objectives of the present study were to (i) characterize the electrical resistivity distribution across the stem cross-section of standing P. santalinus trees, (ii) standardize the application of ERT for heartwood identification and heartwood diameter estimation, (iii) validate the ERT-derived heartwood diameter using increment core measurements, and (iv) evaluate the potential of ERT as a reliable non-destructive tool for heartwood assessment in tropical hardwood species. We hypothesized that the marked differences in moisture content and associated wood characteristics between sapwood and heartwood generate distinct electrical resistivity patterns that enable accurate delineation and estimation of heartwood diameter in standing red sanders trees.
2. Materials and Methods
2.1. Study Site Description and Trees
The study was conducted in two 51-year-old naturalized plantations of Pterocarpus santalinus L.f. located in Mandya District, Karnataka, India. The first site was situated in Hulikere Lower Block Forest, Mandya Range (12.523731° N, 76.894684° E), while the second site was located in K. Shettihalli Forest, Srirangapatna Range (12.4226° N, 76.6844° E). Both sites are situated within the Southern Dry Zone (Agro-climatic Zone 6) of Karnataka and experience a tropical semi-arid climate characterized by distinct summer, monsoon, and winter seasons. Long-term average annual rainfall in the region ranges from 700 to 750 mm, with approximately 70–80% of the precipitation received during the southwest monsoon (June–September). The mean annual temperature ranges from 25 to 27 °C, with summer maximum temperatures often exceeding 35 °C and winter minimum temperatures ranging between 15 and 18 °C.
The study sites are characterized by well-drained red loamy to red sandy loam soils, derived primarily from granitic and gneissic parent materials. These soils are generally slightly acidic to neutral, moderately deep, well aerated, and exhibit moderate water-holding capacity, making them suitable for the growth of red sanders. The natural vegetation is representative of Southern Tropical Dry Deciduous Forests, interspersed with scrub vegetation and plantation species.
A total of 58 healthy standing trees with diameters at breast height (DBH) ranging from 10 to 33 cm were selected for the study. Trees exhibiting visible stem defects, cavities, branch unions at breast height, or symptoms of disease and decay were excluded to minimize measurement errors during tomographic scanning. Based on DBH, the selected trees were grouped into two diameter classes: 10–20 cm (n = 25) and 20–30 cm (n = 33). Twenty-five trees were sampled from Hulikere Lower Block Forest and thirty-three from K. Shettihalli Forest. The selected trees represented a wide range of heartwood development, enabling comprehensive evaluation of the applicability of ERT for non-destructive heartwood estimation.
2.2. Electrical Resistance Tomograph
ERT measurements were performed using a PiCUS TreeTronic Electrical Resistance Tomograph (Argus Electronic GmbH, Rostock, Germany), a portable multi-electrode resistivity system designed for non-destructive assessment of standing trees. The instrument estimates the internal electrical resistivity distribution of the stem by measuring voltage responses generated from low-frequency electrical currents sequentially injected between electrodes installed around the tree circumference [8,9].
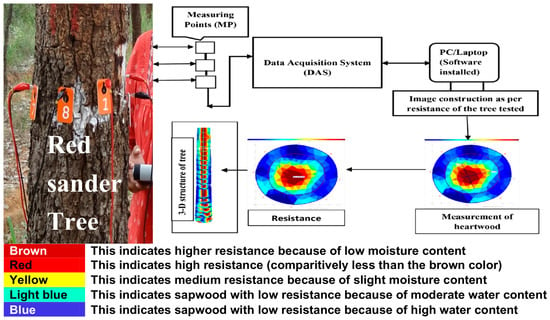
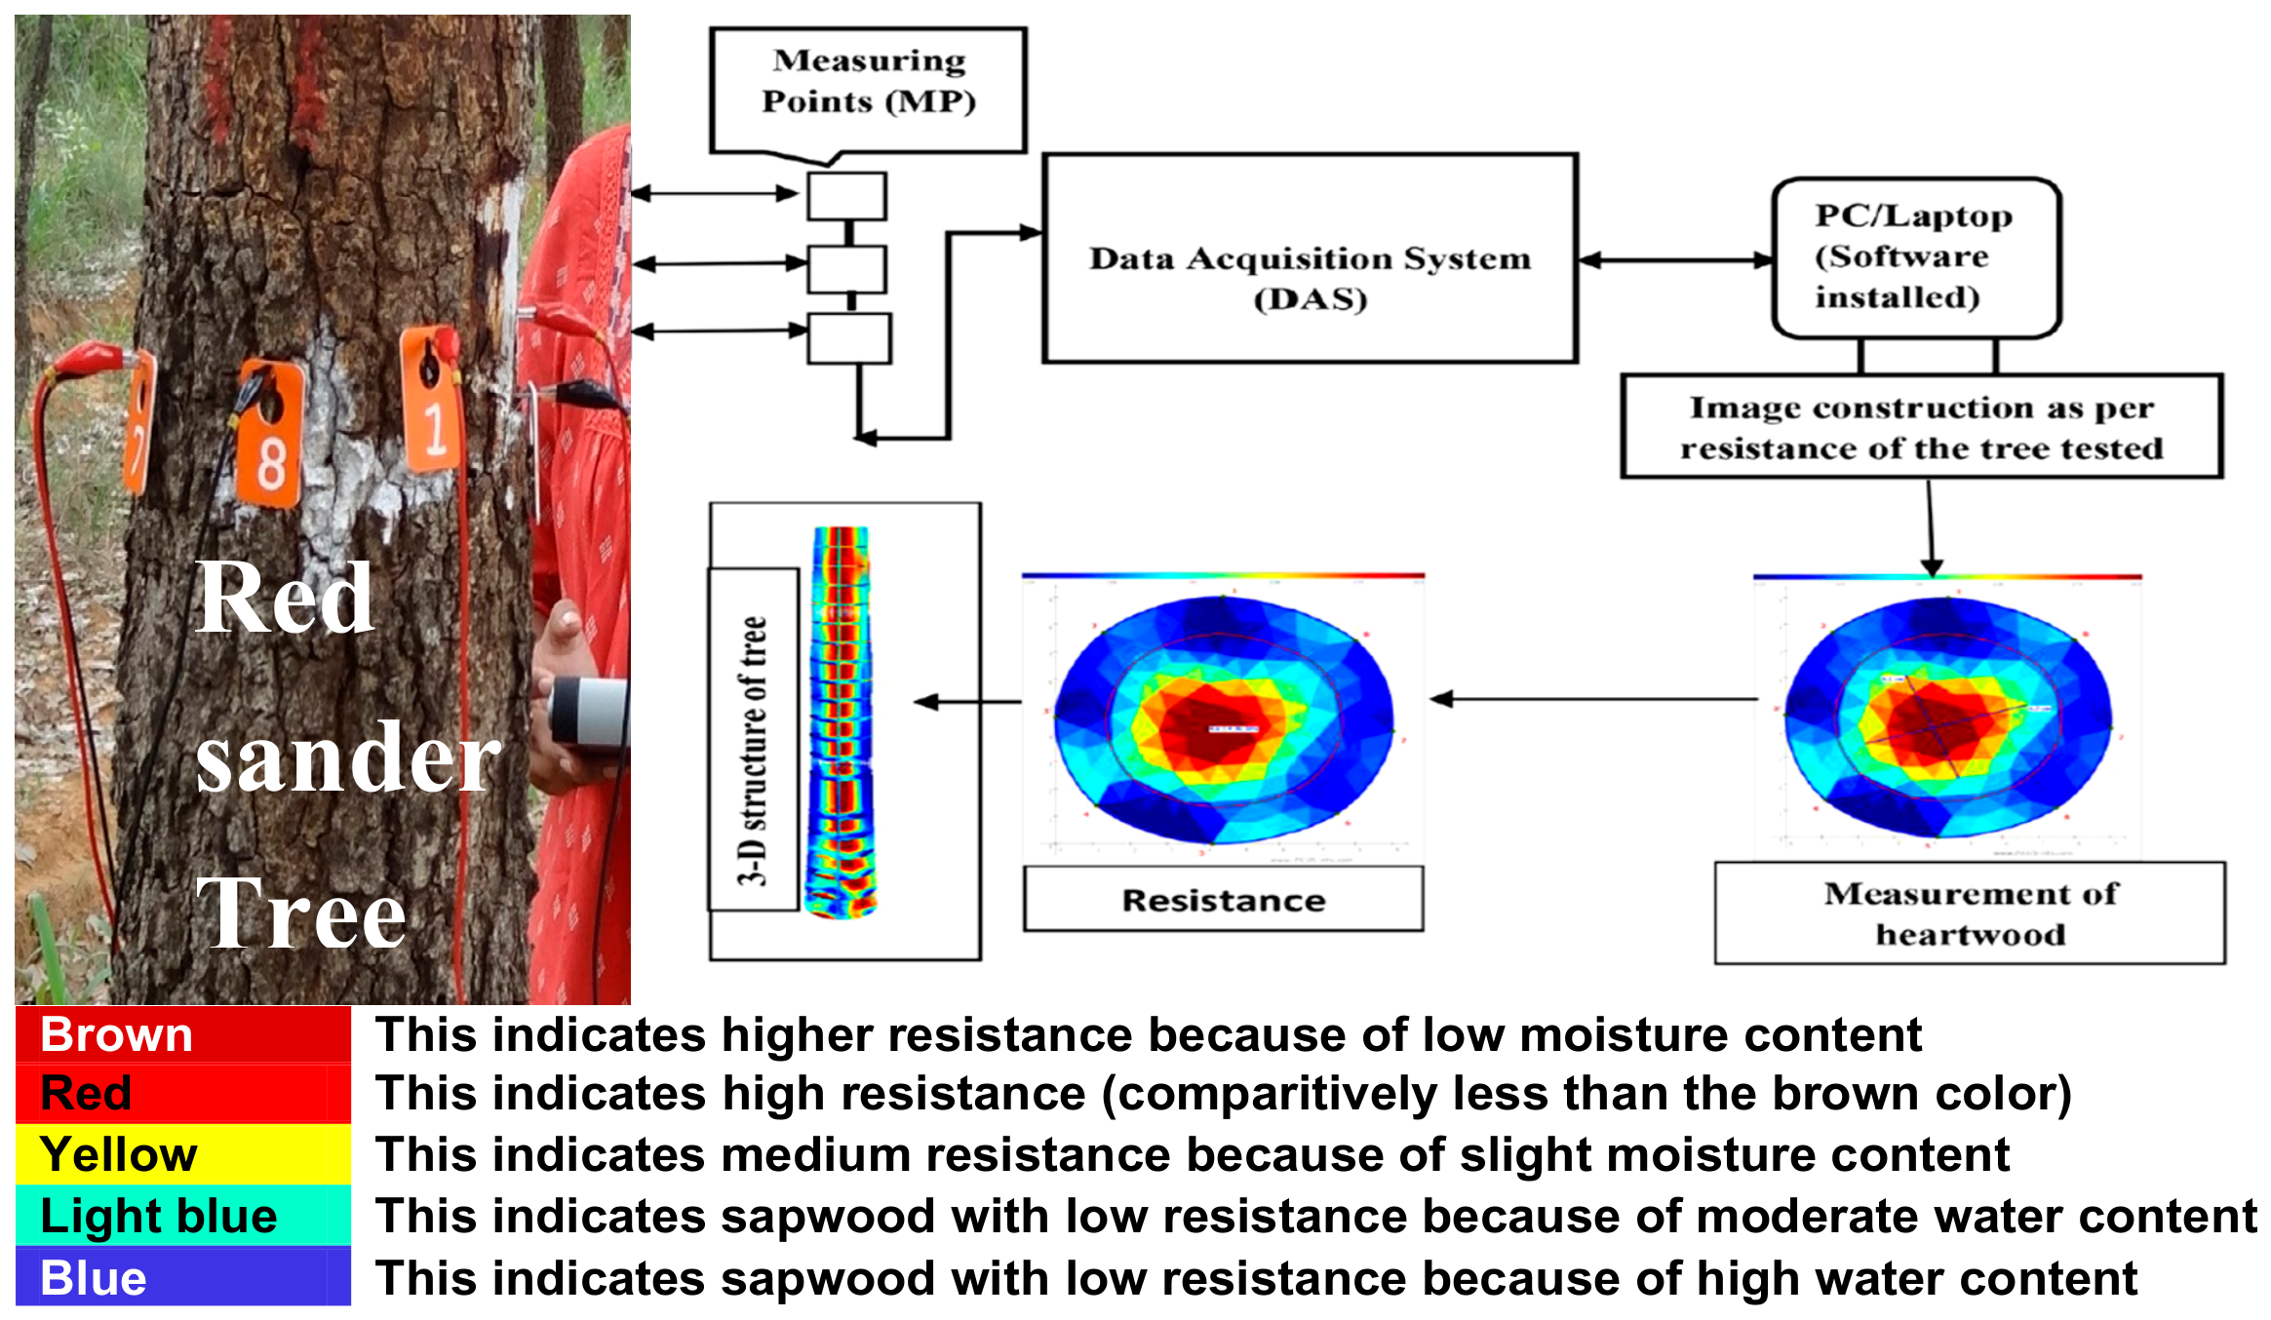
All measurements were conducted on standing, living trees under natural field conditions; therefore, the wood remained in its green (undried) state, preserving its natural moisture distribution required for reliable resistivity measurements. All ERT measurements were performed during the dry season to minimize the influence of seasonal moisture fluctuations on electrical resistivity and to ensure consistent measurement conditions across all sampled trees. Measurements were carried out at breast height (1.37 m), where the stem was straight and free from branch unions, buttresses, or other deformities that could distort the electrical field. Eight stainless-steel electrodes (nails) were installed uniformly around the stem circumference at 45° angular intervals (360°/8). The electrodes were inserted perpendicular to the tree trunk (90° to the stem surface) to ensure consistent electrical contact (Figure 1). The use of eight electrodes was standardized for all trees included in the study, based on preliminary standardization trials showing that increasing the number of electrodes did not result in any appreciable change in the measured electrical resistance or estimated heartwood size. Therefore, the eight-electrode configuration was adopted as it provided reliable tomographic reconstruction while minimizing field time and operational complexity. The electrodes penetrated the bark until firm electrical contact with the conductive sapwood was achieved without removing the bark. The electrodes were connected to the Tree Tronic data acquisition unit using insulated cables fitted with crocodile clips. Figure 1 clearly illustrate the sensor configuration, electrode placement, electrical connections, and the overall measurement procedure.
Figure 1.
Schematic and photographic representation of the Electrical Resistance Tomography (ERT) experimental setup.
Before each scan, tree identification, stem circumference, and electrode configuration were entered into the PiCUS Tree Tronic software (version 3), which automatically generated the measurement geometry. The instrument then performed its built-in diagnostic procedure to verify cable continuity, electrode connectivity, and contact quality. Measurements were initiated only after all electrodes satisfied the manufacturer’s quality criteria. Electrodes exhibiting poor contact were repositioned and rechecked until satisfactory electrical continuity was achieved. Since the PiCUS Tree Tronic system employs an internally referenced measurement protocol with automatic quality verification, no additional external calibration was required under field conditions.
The system sequentially injected low-frequency electrical currents between multiple electrode pairs, using a dipole–dipole measurement configuration while simultaneously recording the corresponding voltage responses. These transfer resistance measurements were processed using the inverse finite-element reconstruction algorithm implemented in the PiCUS TreeTronic software to estimate the spatial distribution of electrical resistivity throughout the stem cross-section [9]. Consequently, the tomograms represent reconstructed electrical resistivity distributions rather than direct point measurements. During data acquisition, particular care was taken to ensure that the electrodes, connecting cables, and tree remained completely stationary to minimize contact resistance and measurement artifacts. Each scan required approximately 10–15 min, after which the data were stored on the instrument’s SD card for subsequent analysis.
Tomographic reconstruction was performed using PiCUS TreeTronic PC software. The software reconstructed two-dimensional resistivity tomograms composed of triangular finite elements representing the spatial distribution of electrical resistivity within the stem. Reconstruction was performed using a mesh fitness value of 8 and a smoothness parameter of 20 following Divakara et al. [23]. Mesh fitness controls the density of the computational mesh used for tomographic image reconstruction. Higher values produce a finer mesh and improved spatial resolution but increase computational time. A mesh fitness value of 8 was selected as it provides a good balance between image resolution, computational efficiency, and reconstruction stability. The smoothness parameter controls the degree of smoothing applied during image inversion. Lower values preserve local resistivity variations but may increase noise, whereas higher values reduce noise but can blur internal boundaries. A smoothness value of 20 was selected to minimize noise while maintaining clear resistivity contrasts between heartwood and sapwood. These parameters were applied consistently to all trees to ensure uniform image reconstruction and reliable comparisons.
Heartwood boundaries were manually interpreted from the ERT tomograms using the PiCUS TreeTronic software by identifying the transition between the high-resistivity central zone and the lower-resistivity sapwood. No universal resistivity threshold was used because resistivity values vary among trees depending on moisture content, stem characteristics, and physiological conditions.
The reconstructed resistivity distribution was expressed in ohms (Ω) using a continuous color scale ranging from blue (low resistivity/high moisture content) to dark brown (high resistivity/low moisture content). Because heartwood generally contains lower moisture content and higher concentrations of extractives than sapwood, regions exhibiting higher resistivity were interpreted as heartwood, whereas peripheral low-resistance regions corresponded to sapwood.
For quantitative analysis, reconstructed resistivity values were extracted along the radial axis passing through the center of each tomogram. Radial resistivity profiles obtained from individual trees were subsequently averaged within each diameter class to generate representative radial resistivity curves.
Immediately after completion of the ERT scan, increment cores were extracted at the same measurement height (1.37 m) for validation of ERT-derived heartwood dimensions. Bark thickness, sapwood width, and heartwood width were measured immediately under field conditions before any appreciable moisture loss could occur. Since the increment cores were used solely for anatomical validation and not for electrical measurements, minor moisture changes after extraction did not influence the ERT results. Following measurements, boreholes were sealed with tree wax to minimize moisture loss and reduce the risk of fungal infection.
The stainless-steel electrodes produced only small puncture wounds and did not remove wood tissue or compromise the structural integrity of the standing trees. Consequently, the ERT procedure was regarded as a non-destructive method for assessing internal stem characteristics.
The PiCUS TreeTronic system consists of equally spaced 2 mm sized stainless-steel electrodes/nails inserted around the stem circumference and connected to the data acquisition unit. Sequential current injection and voltage measurements are processed using inverse finite-element reconstruction to generate two-dimensional electrical resistivity tomograms depicting the internal distribution of heartwood and sapwood. The figure also illustrates the electrode arrangement, sensor configuration, data acquisition unit, and tomographic reconstruction workflow.
In the healthy red sanders trees examined in the present study, the ERT color scale showed brown areas representing relatively higher electrical resistance, associated with comparatively lower moisture content, followed by red areas with high resistance. Yellow represented intermediate resistance, while light blue and blue areas represented relatively lower resistance, corresponding to moderate and higher moisture content, respectively, and were predominantly associated with sapwood. These color-resistivity interpretations are specific to the healthy red sanders trees investigated in this study and should not be considered universally applicable. In trees affected by decay, cavities, cracks, or other internal structural abnormalities, high- or low-resistivity anomalies may occur and should therefore be interpreted in relation to the tree condition and other supporting observations.
2.3. Core Sample Extraction for Traditional Measurement of Heartwood Content
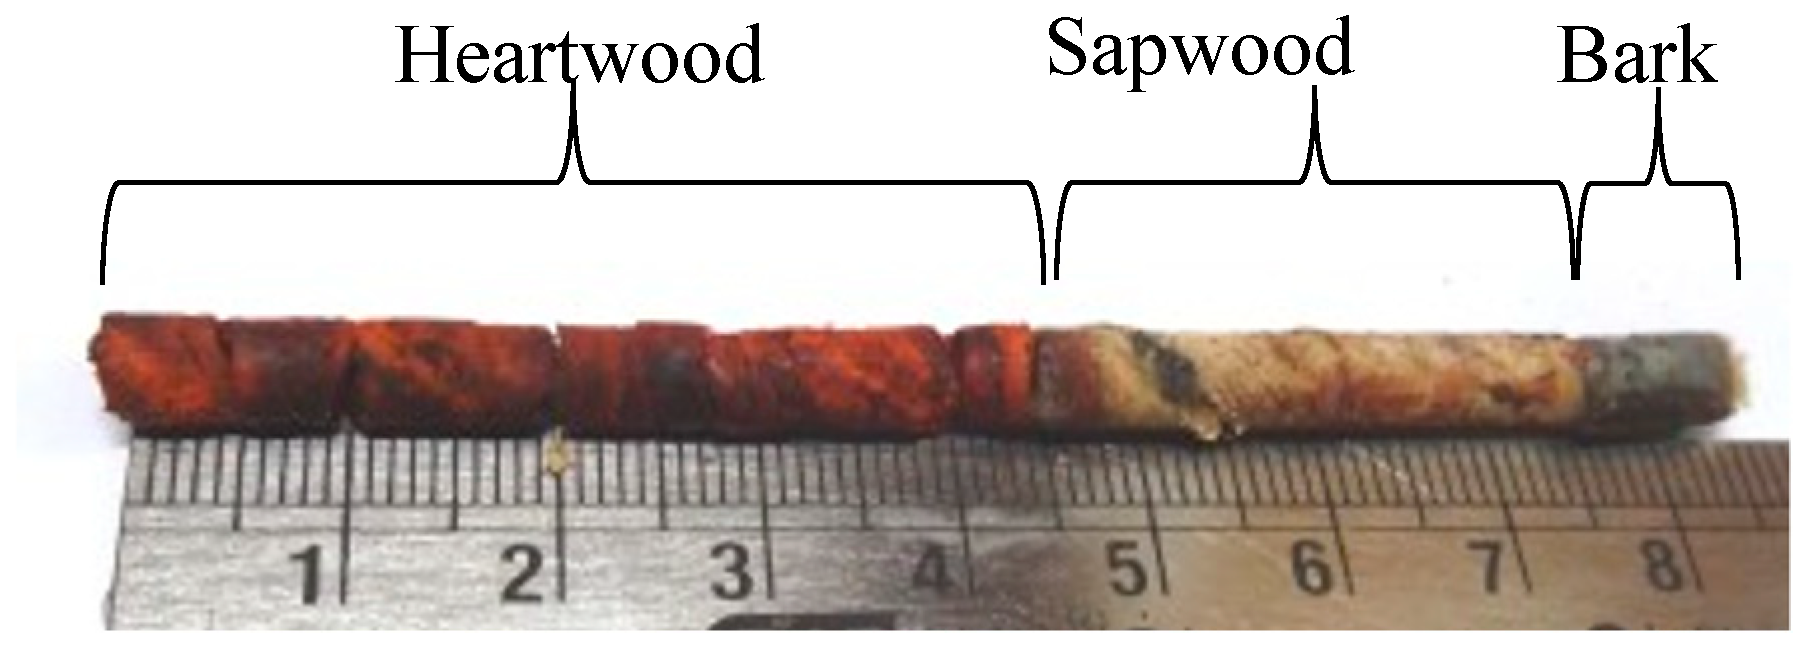
To validate ERT-derived heartwood estimates, increment cores were extracted from the same trees immediately after tomographic scanning, using a power increment borer. Core samples were collected at the same measurement height (1.37 m) to ensure direct comparison between ERT images and physical observations. Following extraction, the boreholes were sealed with tree wax to minimize moisture loss and reduce the risk of fungal infection. Each core was labeled and transported to the laboratory for measurement. Heartwood and sapwood were distinguished visually based on their natural color differences, with the darker central region representing heartwood due to the accumulation of phenolic extractives, while the lighter outer region represented sapwood (Figure 2). Bark thickness, sapwood width, and heartwood width were measured using a digital Vernier caliper with an accuracy of 0.01 mm. The heartwood was calculated using the formula below.
where
Circumference/girth = 2πr
r = radius of the tree (cm)
Figure 2.
Quantifying core sample of P. santalinus.
Using radius, the heartwood radius is calculated by,
Heartwood radius (cm) = Radius of the tree − (Bark radius + Sapwood radius)
2.4. Statistical Analysis
The accuracy of ERT for estimating heartwood diameter was evaluated by comparing ERT-derived measurements with observed heartwood diameters obtained from increment cores. Linear regression analysis was performed using observed heartwood diameter as the dependent variable and ERT-estimated heartwood diameter as the independent variable. The goodness of fit of the regression model was assessed using the coefficient of determination (R2), which represents the proportion of variation in the observed heartwood explained by the ERT estimates. Model performance was further evaluated by examining the agreement between observed and predicted values using scatter plots and regression statistics. The closer the regression coefficient became to unity and the higher the R2 value, the greater the predictive accuracy of the ERT technique. Scatter plots were prepared to visualize the relationship between the observed and ERT-estimated heartwood diameters across all sampled trees.
3. Results and Discussion
3.1. Electrical Resistance Tomograph (ERT) Pattern in P. santalinus
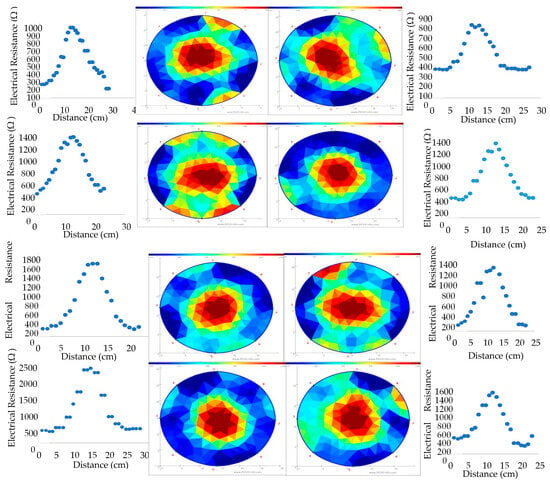
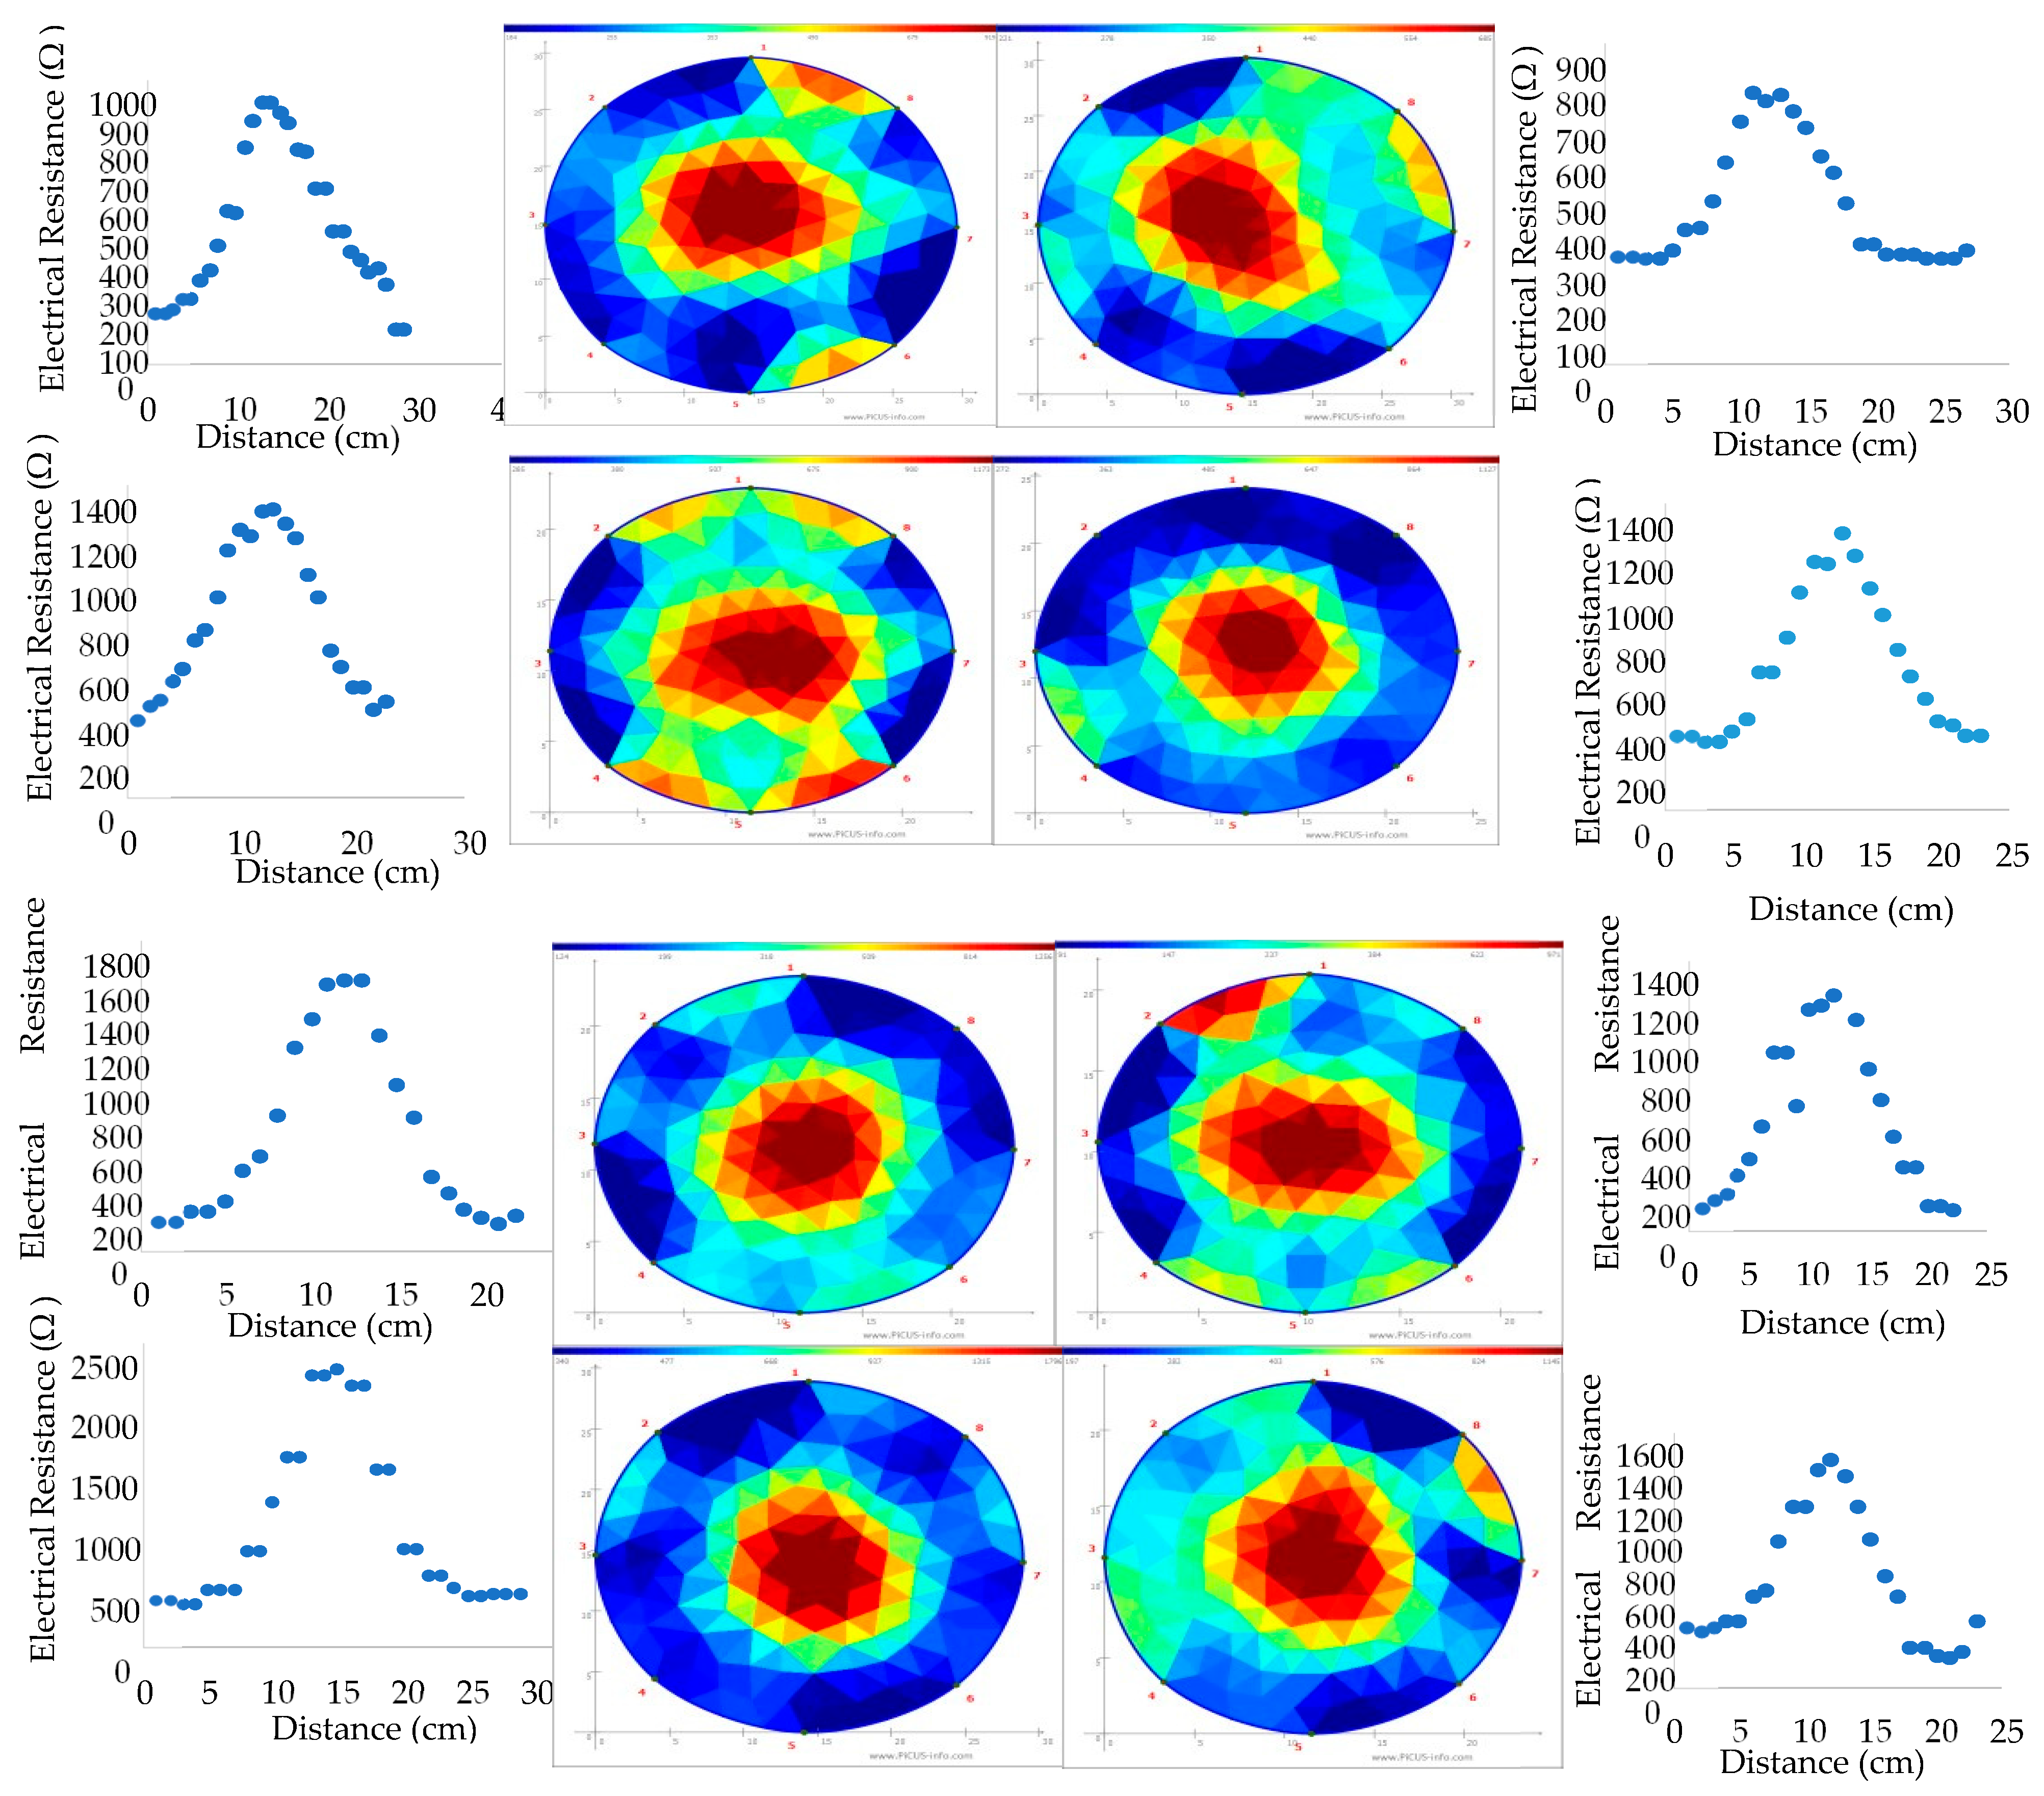
The average radial resistivity profile was generated by averaging the electrical resistance measured along multiple transects extending across the stem cross-section of all 58 sampled trees. The resulting resistivity distribution at breast height (1.37 m) is presented in Figure 3.
Figure 3.
Resistivity pattern of red sanders trees expressed using ERTThe ERT profiles consistently exhibited a characteristic bell-shaped (Gaussian-like) distribution, with maximum resistivity occurring near the center of the stem and progressively decreasing towards the outer peripheral regions. This pattern clearly distinguishes the highly resistive heartwood from the less resistive sapwood. Although absolute resistivity values differed among individual trees, the overall radial distribution remained remarkably consistent, indicating that ERT reliably captures the internal wood zonation in P. santalinus. The observed increase in resistivity towards the stem center reflects the lower moisture content and reduced ionic conductivity of heartwood, whereas the lower resistivity observed in the peripheral sapwood corresponds to its higher moisture content and active physiological status. Similar radial resistivity gradients have previously been reported in several hardwood and conifer species, where electrical conductivity is primarily governed by moisture distribution and the wood’s anatomical characteristics.
The present investigation demonstrated a consistent radial electrical resistivity pattern in standing P. santalinus trees, characterized by maximum resistivity at the stem center and progressively decreasing values toward the bark. Such a bell-shaped (Gaussian) resistivity profile clearly distinguishes the central heartwood from the peripheral sapwood and confirms that ERT accurately depicts the internal wood zonation of red sanders. Similar radial resistivity gradients have previously been reported in Quercus robur [9], Pinus sylvestris [13], several conifer species [11], Australian hardwoods [12], and diffuse- and ring-porous hardwoods [15]. The present study extends these observations to P. santalinus, an endangered tropical hardwood species characterized by exceptionally dense and extractive-rich heartwood.
The higher electrical resistivity observed in the heartwood region is primarily attributed to reduced moisture content, lower ionic conductivity, and greater deposition of secondary metabolites during heartwood formation [3,10,24]. Heartwood formation involves programmed death of parenchyma cells followed by deposition of phenolic compounds, tannins, quinones, and other extractives that obstruct conductive pathways and reduce free water movement [1,2]. Consequently, the electrical current encounters greater resistance in heartwood than in physiologically active sapwood where moisture and dissolved ions facilitate conductivity.
Unlike temperate hardwoods, tropical species exhibit considerable variation in extractive composition, wood density, vessel architecture, and moisture dynamics, all of which influence electrical resistivity. Therefore, calibration developed for temperate species cannot be directly transferred to tropical hardwoods. The present study establishes the first species-specific resistivity profile for P. santalinus, thereby providing an important methodological foundation for future non-destructive evaluation of this economically important species.
3.1.1. Influence of Tree Diameter on Resistivity Distribution
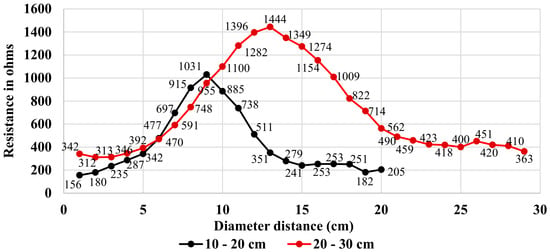
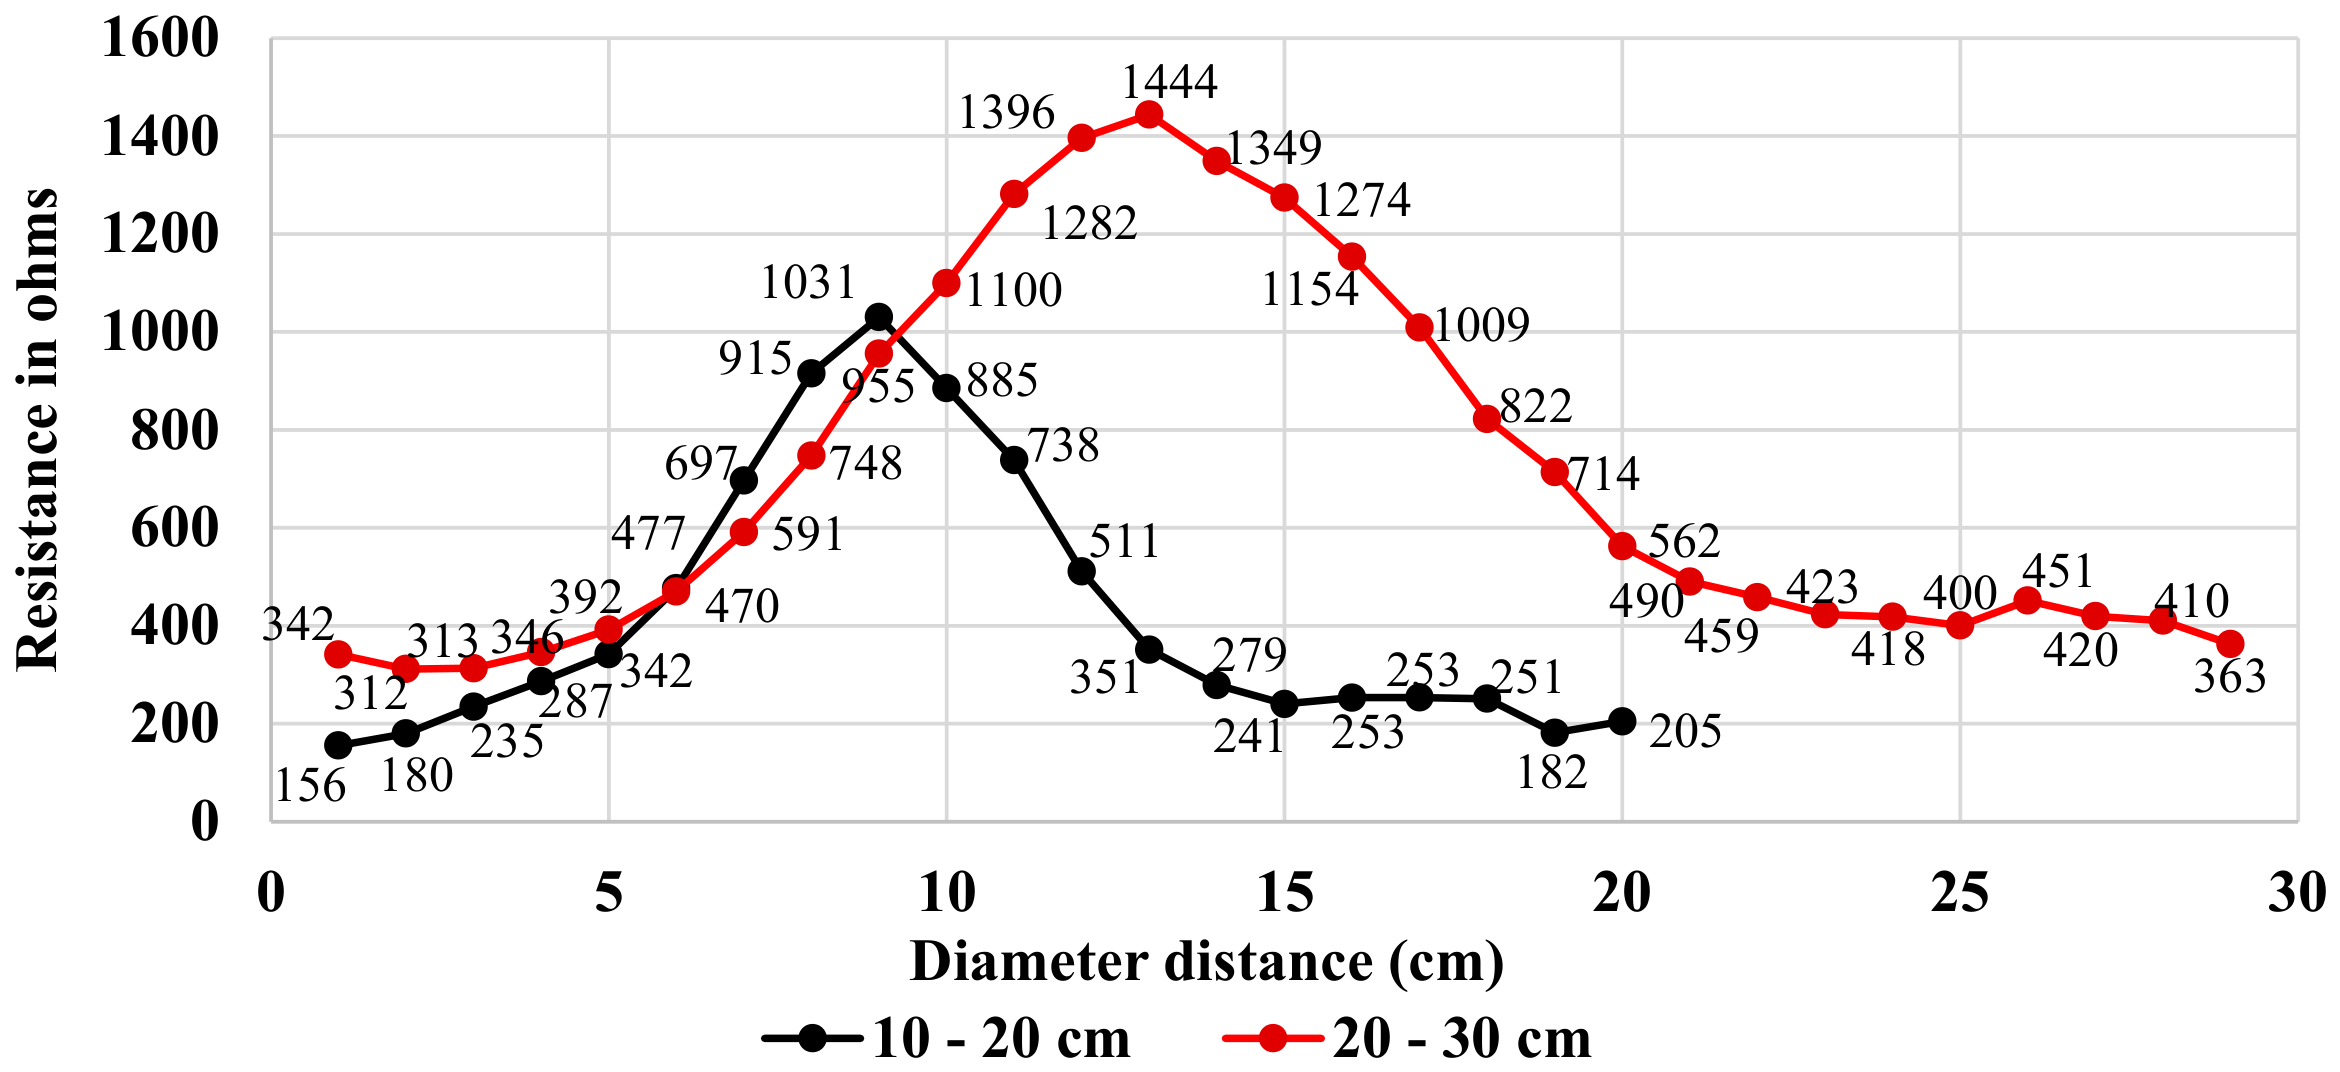
Distinct differences in radial resistivity patterns were observed between diameter classes. Trees belonging to the 10–20 cm diameter class exhibited maximum average resistivity values of approximately 1031 Ω at the stem center and minimum values of 156 Ω near the bark (Figure 4). The peripheral sapwood exhibited resistivity values ranging from 156 to 253 Ω, indicating relatively high moisture content in younger trees and a comparatively smaller proportion of heartwood.
Figure 4.
Resistivity pattern in diameter class of red sanders trees.
In contrast, trees within the 20–30 cm diameter class showed substantially higher central resistivity, reaching approximately 1444 Ω, while peripheral resistivity increased to approximately 342 Ω (Figure 4). The overall increase in resistivity with tree diameter is likely associated with progressive heartwood formation during stem maturation. As heartwood occupies a greater proportion of the cross-sectional area in larger trees, average stem resistivity correspondingly increases.
These findings demonstrate that radial electrical resistivity is strongly influenced by stem development and heartwood accumulation, suggesting that ERT has considerable potential for monitoring heartwood formation during tree growth.
The resistivity pattern from one end to another end of the cross-section in red sander trees exhibited a symmetric Gaussian shape (bell curve shape). The finding for the range of resistivity values for red sanders was reported for first time and was similar to the results obtained for other species like Quercus where the resistivity pattern is shown in the bell-shaped curve reported by [9]. The resistivity pattern in which the inner part shows higher resistivity and the outer part shows lower resistivity may be due to variation in moisture and wood density in conifers [11]. The strong differences in wood moisture content between sapwood and heartwood, as found in conifers, allow for the accurate estimation of different zonation in tropical species. Variations in anatomical (vessel, ray and fiber morphology) and physical (moisture content, specific gravity) features of the heartwood is also one of the reasons for the resistivity variations all along the cross-section of red sanders trees.
Tree diameter significantly influenced radial resistivity distribution. Trees belonging to the 20–30 cm diameter class exhibited considerably higher central resistivity (approximately 1444 Ω) than trees in the 10–20 cm diameter class (approximately 1031 Ω). This increase is consistent with progressive heartwood development during tree maturation. As trees age, sapwood is gradually transformed into heartwood through the dehydration and deposition of extractives, resulting in an enlarged heartwood zone and consequently higher overall stem resistivity [2,3].
The increased peripheral resistivity observed in larger trees may also indicate gradual changes in sapwood moisture distribution accompanying stem maturation. Similar age-dependent increases in electrical resistivity have been reported in Scots pine and oak [9,13], suggesting that ERT may be useful for monitoring heartwood development throughout the rotation period.
3.1.2. Relationship Between DBH and Maximum Electrical Resistivity
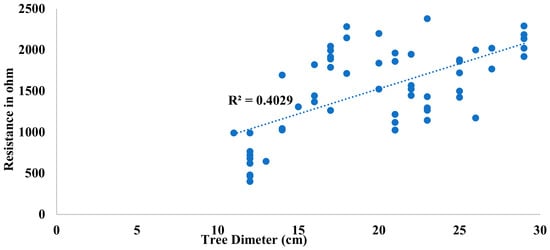
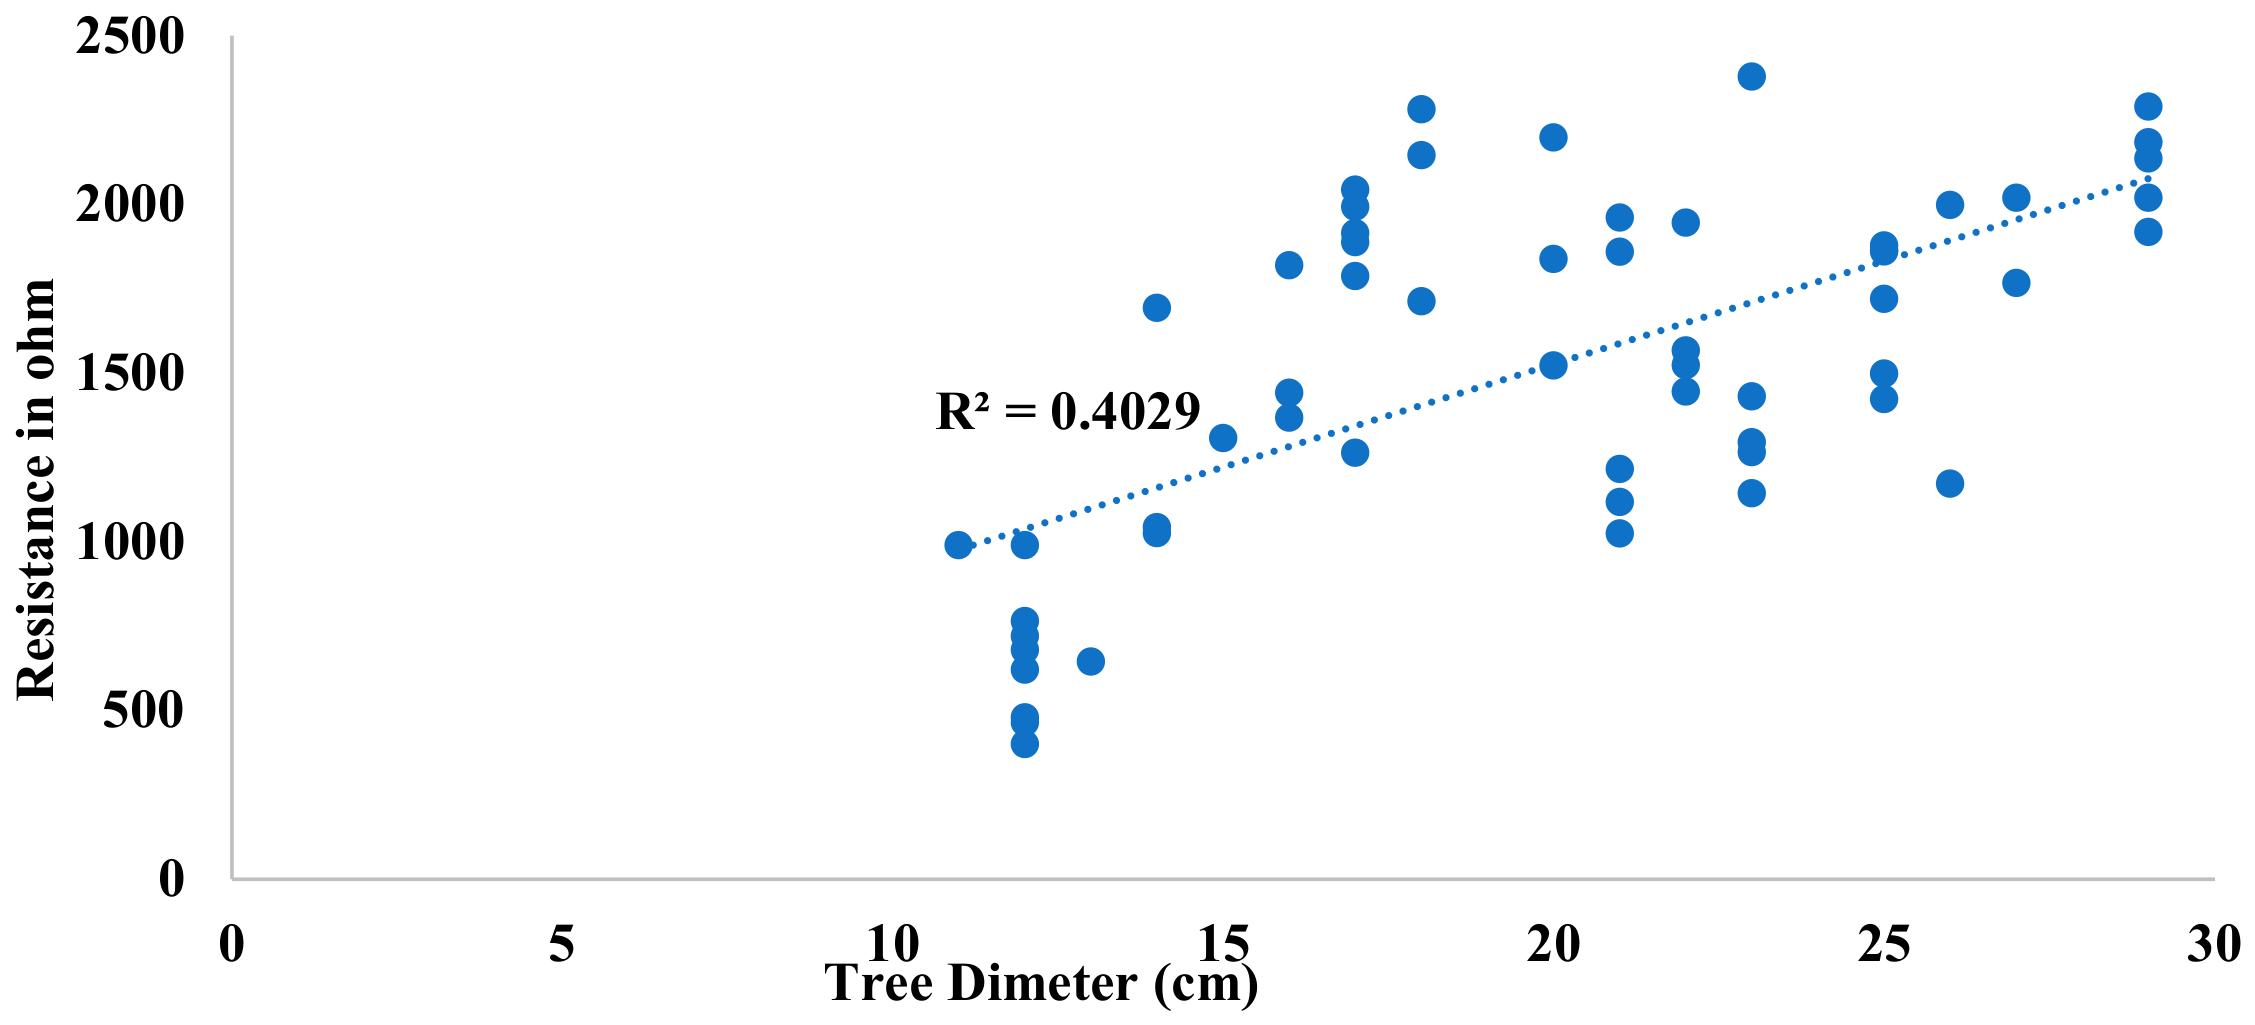
The relationship between diameter at breast height (DBH) and maximum electrical resistivity obtained from the ERT tomograms is presented in Figure 5. A positive linear relationship was observed between DBH and maximum resistivity, with a coefficient of determination (R2) of 0.4029. This indicates that approximately 40.3% of the variation in maximum resistivity is explained by differences in tree diameter, suggesting that DBH has a moderate influence on the electrical properties of the stem.
Figure 5.
Relationship between DBH and the maximum resistivity.
Maximum resistivity generally increased with increasing DBH, rising from approximately 400–1000 Ω in trees with diameters of 11–13 cm to values exceeding 2000 Ω in trees larger than 20 cm. This trend is consistent with the progressive formation of heartwood as trees mature. Larger diameter trees typically possess a greater proportion of heartwood, which has lower moisture content, fewer mobile ions, and higher concentrations of hydrophobic extractives than sapwood. These characteristics reduce electrical conductivity and result in higher electrical resistivity. Similar relationships between heartwood formation and increased resistivity have been reported in previous studies on wood species [9,11,25].
Despite the overall positive trend, considerable variability was evident among trees of similar diameter, particularly within the 20–25 cm DBH class. For example, trees with a DBH of approximately 22 cm exhibited maximum resistivity values ranging from about 1000 Ω to more than 2300 Ω. This variability indicates that stem diameter alone cannot fully explain the electrical characteristics of the wood. Electrical resistivity is governed by several interacting factors, including heartwood proportion, moisture distribution, wood density, electrolyte concentration, extractive content, tree age, site conditions, and physiological status. In addition, localized defects, decay, or internal moisture accumulation may reduce resistivity in individual trees, contributing to the observed scatter.
The moderate coefficient of determination (R2 = 0.4029) suggests that DBH is a useful but incomplete predictor of maximum resistivity. Although increasing stem diameter is generally associated with greater heartwood development and higher resistivity, direct ERT measurements remain essential for accurately characterizing the internal condition of standing trees. The unexplained variation (approximately 60%) further demonstrates that electrical resistivity reflects the combined influence of multiple anatomical and physiological properties rather than stem size alone.
Overall, the positive relationship between DBH and maximum resistivity provides quantitative evidence that heartwood development increases with tree growth and supports the biological interpretation of the ERT measurements. Integrating conventional dendrometric measurements such as DBH with ERT-derived resistivity improves the prediction of heartwood characteristics and highlights the value of ERT as a reliable non-destructive technique for assessing internal wood properties in standing trees.
3.1.3. Relationship Between Resistivity and Wood’s Physical Properties
The radial resistivity distribution observed in P. santalinus is closely associated with the spatial variation in several of wood’s physical properties, particularly moisture content, specific gravity, and wood density.
Moisture Content
Moisture content is one of the principal determinants of wood electrical conductivity because water facilitates ionic movement within xylem tissues. The lower moisture content characteristic of heartwood reduces ionic mobility, resulting in higher electrical resistivity, whereas the moisture-rich sapwood exhibits substantially lower resistivity. Previous studies have demonstrated that the moisture content of P. santalinus ranges from approximately 26.09% (wet basis) to 16.46% (dry basis), with moisture decreasing progressively during heartwood formation [5]. Consequently, the distinct resistivity contrast observed between sapwood and heartwood primarily reflects differences in moisture distribution.
Specific Gravity
Wood’s specific gravity may also contribute to the observed variation in electrical resistivity. Pterocarpus santalinus possesses exceptionally dense wood, with reported specific gravity values of approximately 0.99 for air-dried wood and 0.89 for oven-dried wood [5]. Heartwood formation is associated with the deposition of extractives and structural compounds, which increases wood density while reducing moisture content, thereby contributing to higher electrical resistivity. However, ERT measures the electrical resistivity of wood, which is governed by several interacting factors, including moisture content, electrolyte concentration, wood anatomy, extractive content, temperature, and, to some extent, tissue density [9,26]. Consequently, the resistivity patterns observed in ERT tomograms primarily reflect variations in the electrical properties of the stem rather than directly measuring wood density or mechanical properties. Although differences in density and structural characteristics may influence electrical resistivity, these parameters were not directly quantified in the present study. Therefore, the observed resistivity distribution should be interpreted as an indirect indicator of internal wood condition and heartwood characteristics rather than as a direct measure of wood density or mechanical strength.
Wood Density
Reported wood density values for Pterocarpus santalinus range from approximately 0.77 to 0.85 g cm−3, with radial variation occurring from the pith towards the bark as wood matures [5]. Such variations in wood density and anatomical structure influence the movement of electrical currents and contribute to the gradual radial resistivity gradient observed across the stem cross-section.
Electrical resistivity in wood is governed by several interacting physical and chemical properties, including moisture content, wood density, specific gravity, electrolyte concentration, temperature, and extractive content [24,26,27]. Among these factors, moisture content exerts the strongest influence because electrical conduction occurs primarily through free water and dissolved ions present within the cell lumina and cell walls. Consequently, the lower moisture content and reduced ionic conductivity of heartwood result in substantially higher electrical resistivity than the surrounding sapwood [9,24,28].
Pterocarpus santalinus is characterized by exceptionally dense wood, high specific gravity, and abundant phenolic extractives that impart its characteristic dark red color and superior natural durability [5]. These characteristics increase electrical resistance while simultaneously enhancing mechanical strength, dimensional stability, and decay resistance. Therefore, the radial resistivity gradient observed in the present study reflects not only differences in moisture distribution but also the combined influence of wood density, extractive accumulation, and other anatomical and physicochemical properties associated with heartwood formation.
3.1.4. Resistivity Pattern and Wood Anatomical Properties of P. santalinus
Anatomical properties of wood can be affected by several environmental and genetic factors. In general, the anatomical properties of trees vary significantly from the pith outward within the tree. Anatomical properties of P. santalinus wood viz. vessel, ray and fiber morphology vary from pith to outward within the same tree and contribute to the changes in resistivity pattern. Hence, the resistivity pattern in red sanders will indirectly depict the anatomical variations in the wood.
Vessel Morphology
Vessel dimensions vary considerably from the pith towards the cambium. The increase in vessel diameter and lumen area towards the outer growth rings enhances water transport efficiency and consequently lowers electrical resistivity. Conversely, the smaller vessel lumina characteristic of the inner heartwood restrict electrical conduction and contribute to the higher resistivity observed in the stem center. Vessel morphology in P. santalinus wood viz. vessel area (26,710.65 μm2), vessel frequency (160.11 No/mm2), vessel diameter (160.11 μm) and vessel vulnerability (51.42) are observed [5].
Ray Morphology
Ray frequency and ray dimensions also influence radial conductivity. Previous anatomical investigations have shown that P. santalinus possesses relatively narrow rays with moderate frequency [5]. Radial variation in ray abundance may therefore affect the movement of an electrical current through the wood matrix. Anoop et al. [5] studied the ray morphology features viz. ray height (168.69 μm), ray width (16.51 μm) and ray frequency (36.77 No/mm2) of red sanders. Since P. santalinus is a slow growing tree, rays tend to become less numerous and narrow per unit tangential area. Marked decrease in the number ray cells affect the resistivity pattern in red sanders.
Wood Fiber Morphology
Variations in fiber dimensions and wall thickness likewise contribute to differences in electrical resistance. The outer wood generally contains larger conducting elements, whereas the inner wood is characterized by shorter fibers and thicker cell walls. Collectively, these anatomical differences modify current pathways and reinforce the radial resistivity gradient detected by ERT. Fiber morphological features of P. santalinus wood viz. fiber length (773.51 μm), fiber width (26.28 μm), fiber wall thickness (6.28 μm) and fiber lumen width (14.22 μm) were observed [5].
Wood anatomy also contributes substantially to resistivity distribution. Vessel dimensions generally increase from pith toward cambium, facilitating greater water transport and lower resistivity in sapwood. Conversely, the smaller vessel lumina, thicker fiber walls, and reduced ray abundance characteristic of heartwood restrict current flow and increase electrical resistance.
Anoop et al. [5] demonstrated that P. santalinus possesses relatively narrow rays, dense fibers, and characteristic vessel morphology that differ across the stem radius. These anatomical transitions coincide closely with the resistivity gradients observed in the present investigation. Thus, ERT indirectly reflects changes in cellular organization occurring during heartwood formation and maturation.
3.2. Validation of Heartwood Estimation Using ERT in P. santalinus
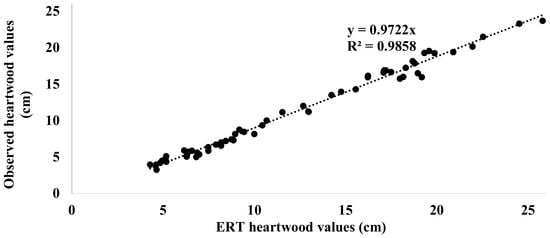
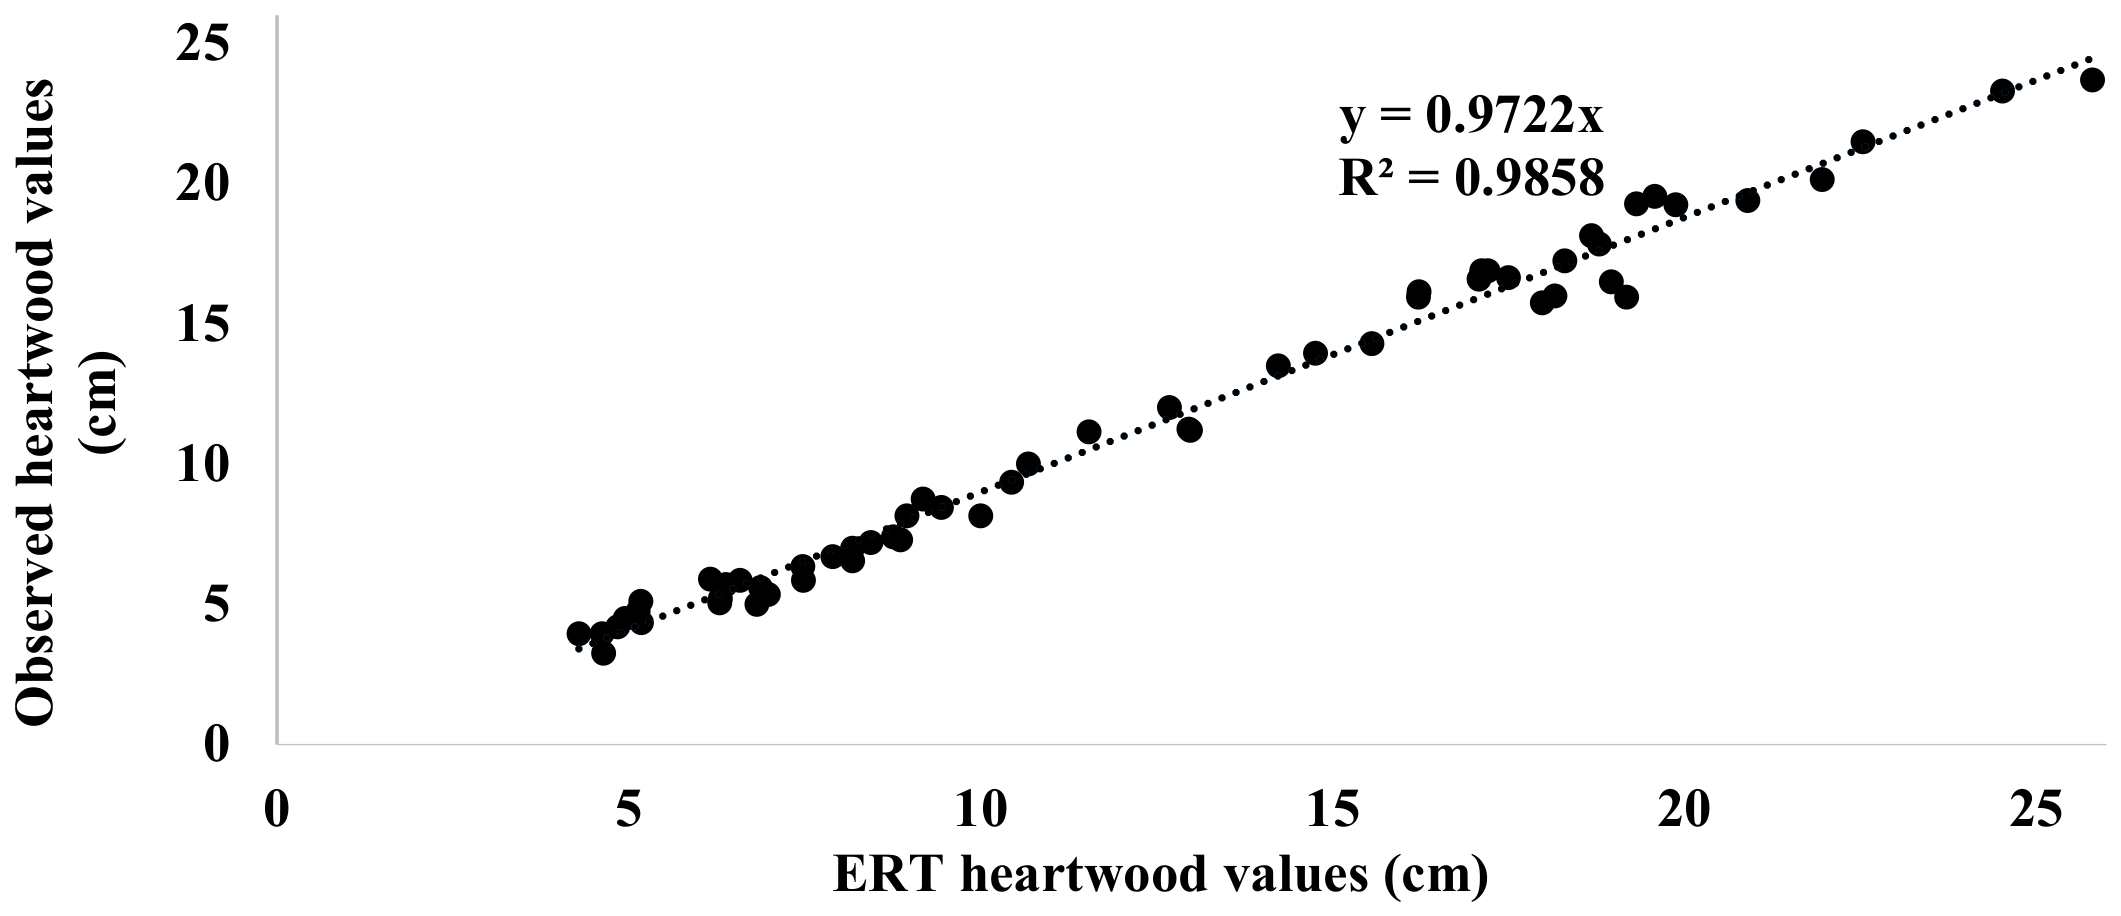
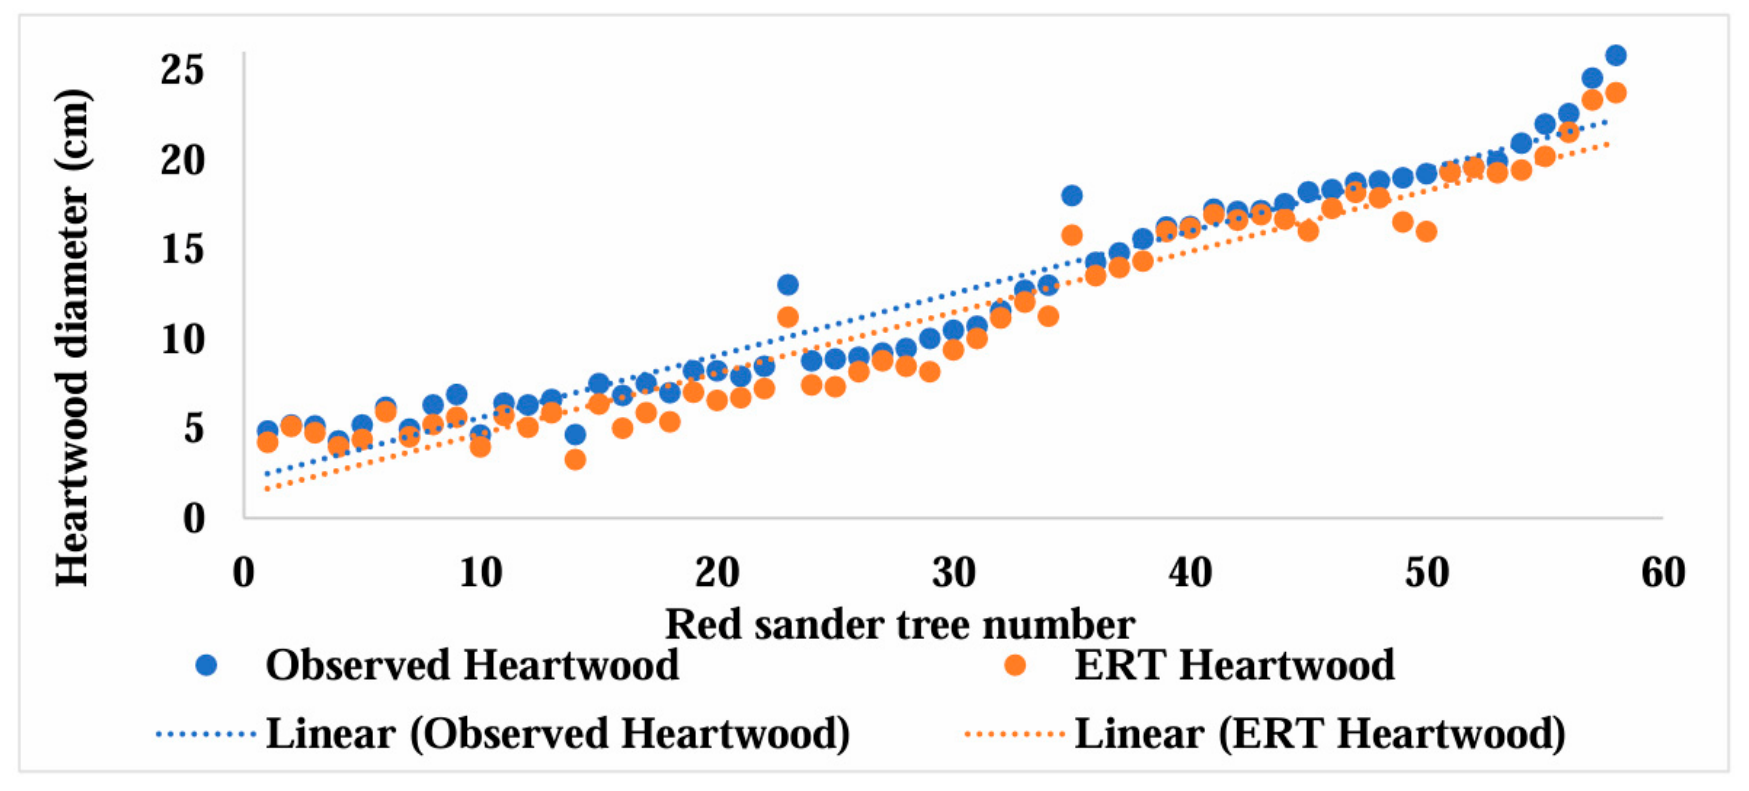
The effectiveness of ERT for non-destructive estimation of heartwood diameter was evaluated by comparing ERT-derived measurements with heartwood diameters obtained from increment cores collected from the same trees. Linear regression analysis revealed an exceptionally strong relationship between the measured and predicted heartwood diameter (R2 = 0.98) (Figure 6).
Figure 6.
Linear regression of the observed heartwood and ERT heartwood content.
The high coefficient of determination demonstrates that ERT accurately predicts heartwood dimensions in P. santalinus. Scatter plot analysis (Figure 7) further confirmed that most observations were closely distributed around the regression line, indicating minimal prediction error and excellent agreement between destructive and non-destructive measurements.
Figure 7.
Relationship between core-measured and ERT-estimated heartwood content.
These findings validate the reliability of ERT as a rapid and non-destructive technique for estimating heartwood dimensions in standing red sanders trees. Comparable levels of agreement between ERT and direct measurements have previously been reported in Australian hardwood species [12], diffuse-porous and ring-porous species [15], and conifers [9], demonstrating the broad applicability of ERT across diverse wood types.
Importantly, this study represents one of the first systematic validations of ERT for heartwood estimation in P. santalinus, providing strong evidence that the technique can be used for field-based assessment of heartwood development without causing significant injury to valuable standing trees.
Increment coring has traditionally been regarded as the standard method for estimating heartwood in standing trees. Nevertheless, repeated coring may introduce fungal infections, reduce timber quality, and create permanent wounds, particularly in high-value species such as red sanders. ERT eliminates these limitations by providing rapid, minimally invasive, and repeatable measurements while preserving tree integrity. This advantage is especially important for protected species where destructive sampling is undesirable or prohibited.
A limitation of the present study is that validation of the ERT-derived heartwood diameter was based on a single increment core extracted from each tree. While ERT reconstructs a two-dimensional image representing the electrical resistivity distribution across the stem cross-section, an increment core provides information only along a single radial direction. Consequently, a single core cannot fully validate the entire tomographic reconstruction or capture circumferential variation in heartwood boundaries and internal wood properties [9,29]. However, increment coring is widely accepted as a reference method for validating non-destructive estimates of heartwood dimensions because it provides direct measurements of the sapwood–heartwood transition along the sampled radius [1,6]. In the present study, cores were extracted through the estimated pith to intersect the maximum heartwood diameter, providing a representative reference for comparison with the corresponding ERT-derived heartwood diameter. Furthermore, the sampled trees were healthy and exhibited regular stem form with no visible signs of decay or eccentric heartwood formation, thereby minimizing circumferential variability. The strong agreement observed between ERT and increment core measurements therefore supports the reliability of ERT for estimating heartwood diameter under these conditions. Nevertheless, future studies should validate ERT reconstructions using multiple increment cores collected at different radial orientations or complete cross-sectional discs from harvested trees to better quantify circumferential variability and further improve the robustness of ERT-based heartwood assessment [9,11,12].
Although ERT provides a reliable non-destructive approach for estimating heartwood diameter, several limitations should be acknowledged. First, electrical resistivity is strongly influenced by seasonal variations in stem moisture content. During periods of high moisture availability, such as the rainy season, the resistivity contrast between sapwood and heartwood may diminish, resulting in less distinct heartwood boundaries. Consequently, ERT measurements are generally more reliable under relatively stable or dry moisture conditions [30,31]. Second, electrode contact quality can influence measurement accuracy. Factors such as poor nail insertion, thick or loose bark, and inadequate electrode contact may increase contact resistance and introduce measurement errors [31]. Third, stem irregularities, including eccentric growth, buttresses, bark fissures, knots, and reaction wood, can alter current flow paths and affect tomographic reconstruction, thereby reducing the accuracy of the reconstructed image [30,31]. Fourth, resistivity patterns are species-specific because moisture content, extractive composition, vessel distribution, and wood anatomy vary among species. Therefore, calibration models developed for one species should not be directly applied to another without appropriate validation [9,31]. Finally, ERT images are generated through mathematical inversion of electrical measurements; thus, the reconstructed resistivity distribution represents an estimate rather than a direct measurement of internal wood properties. The spatial resolution and accuracy of the tomograms depend on electrode configuration, data quality, and the assumptions of the inversion algorithm, introducing an inherent degree of uncertainty [30]. In the present study, these limitations were minimized by employing standardized electrode installation, conducting measurements at breast height under comparable field conditions, and validating ERT-derived heartwood diameter estimates against increment core observations. Nevertheless, future studies incorporating multi-season measurements, validation using multiple increment cores or cross-sectional discs where feasible, and quantitative uncertainty analyses would further improve the robustness, accuracy, and wider applicability of ERT for heartwood assessment.
4. Conclusions
The present study demonstrated that ERT is a reliable and effective non-destructive technique for estimating heartwood diameter in standing Pterocarpus santalinus (red sanders) trees. The standardized ERT methodology successfully distinguished heartwood from sapwood by exploiting differences in electrical resistivity associated with radial variations in wood moisture content, extractive accumulation, and anatomical characteristics. The reconstructed tomograms consistently exhibited a characteristic bell-shaped resistivity profile, with the highest resistivity occurring in the central heartwood and progressively lower resistivity towards the sapwood, confirming the ability of ERT to delineate internal stem zonation.
A clear influence of tree diameter on resistivity distribution was observed. Larger trees (20–30 cm DBH) exhibited substantially higher central resistivity than smaller trees (10–20 cm DBH), reflecting progressive heartwood development during stem maturation. Although DBH showed a positive relationship with maximum resistivity (R2 = 0.4029), the moderate coefficient of determination indicates that electrical resistivity is governed by multiple interacting factors, including moisture content, extractive concentration, electrolyte content, and wood anatomy, rather than stem size alone.
Validation against the incremental core measurements demonstrated excellent agreement between ERT-estimated and observed heartwood diameters (R2 ≈ 0.98), confirming the high accuracy of the technique for heartwood assessment in standing red sanders trees. The study therefore establishes a standardized, species-specific ERT protocol for P. santalinus that can support non-destructive timber evaluation while minimizing damage to valuable trees.
Because ERT directly measures electrical resistivity, the observed resistivity patterns should be interpreted as reflecting changes in the electrical properties of wood arising from moisture content, extractive accumulation, electrolyte concentration, and anatomical variation. Although these factors are associated with heartwood formation, wood density, and other wood characteristics, the present study did not directly measure the density or mechanical properties; therefore, ERT should be regarded as an indirect indicator of the internal wood condition rather than a direct measure of these properties.
Overall, the findings demonstrate that ERT has considerable potential for non-destructive heartwood assessment in red sanders and can contribute to sustainable forest management, tree improvement programs, timber valuation, harvest planning, and conservation of this economically and ecologically important tropical hardwood species.
5. Recommendations
ERT may be adopted as a non-destructive tool for estimating heartwood diameter in standing Pterocarpus santalinus trees, with potential applications in timber valuation, breeding programs, plantation management, and conservation. For operational use, measurements should preferably be conducted during the dry season, when stem moisture conditions are relatively stable, to reduce seasonal variability in electrical resistivity. As resistivity is influenced by moisture content, extractives, electrolyte concentration, temperature, and wood anatomy, species-specific calibration is recommended before extending ERT to other tropical timber species. Integration of ERT-derived heartwood estimates with conventional tree measurements such as DBH and predictive models could further support practical decision-making related to heartwood yield and harvest planning.
Future studies should strengthen validation by using multiple increment cores at different radial positions or stem discs from harvested trees to better assess the spatial accuracy of tomographic reconstructions. Development of objective or semi-automated methods for heartwood boundary delineation would reduce operator dependence and improve reproducibility. The standardized protocol should also be evaluated across different age classes, plantation conditions, climatic regions, and seasons to establish its robustness and wider applicability. In addition, combining ERT with direct measurements of moisture content, wood density, extractive content, and mechanical properties would help clarify the factors governing electrical resistivity and their relationships with wood quality attributes.
Author Contributions
Conceptualization, B.N.D.; Methodology, B.N.D.; Software, B.N.D.; Validation, B.N.D.; Formal analysis, B.N.D. and M.P.; Investigation, B.N.D., H.K.S. and M.P.; Resources, B.N.D. and M.P.; Data curation, B.N.D., H.K.S. and M.P.; Writing—original draft, B.N.D.; Writing—review & editing, B.N.D. and H.K.S.; Visualization, B.N.D.; Supervision, B.N.D.; Project administration, B.N.D.; Funding acquisition, B.N.D. All authors have read and agreed to the published version of the manuscript.
Funding
National Authority for Compensatory Afforestation Fund Management and Planning Authority (NA-CAMPA), New Delhi.
Data Availability Statement
The datasets generated and/or analyzed during the current study are available from the corresponding author upon reasonable request.
Acknowledgments
The authors are thankful to the officials of the Karnataka Forest Departments for granting permission to conduct the study in their red sander plantations and for extending help and support during the field work. The authors wish to thank the Director, IWST, for providing all necessary facilities for this study. Authors also express gratitude to Compensatory Afforestation Fund Management and Planning Authority (CAMPA), New Delhi, for funding the All India Coordinated Research Project (AICRP–8) on the Red sanders project.
Conflicts of Interest
The authors declare that they have received no financial support for the preparation of this manuscript and have no competing interests to disclose.
References
- Taylor, A.M.; Gartner, B.L.; Morrell, J.J. Heartwood formation and natural durability: A review. Wood Fiber Sci. 2002, 34, 587–611. [Google Scholar]
- Spicer, R. Senescence in secondary xylem: Heartwood formation as an active developmental program. In Vascular Transport in Plants; Holbrook, N.M., Zwieniecki, M.A., Eds.; Elsevier Academic Press: Amsterdam, The Netherlands, 2005; pp. 457–475. [Google Scholar] [CrossRef] [Scilit]
- Celedon, J.M.; Bohlmann, J. An extended model of heartwood secondary metabolism in formed by functional genomics. Tree Physiol. 2018, 38, 311–319. [Google Scholar] [CrossRef] [Scilit] [PubMed]
- Arunkumar, A.N.; Joshi, G. Pterocarpus santalinus (Red Sanders) an Endemic, Endangered Tree of India: Current Status, Improvement and the Future. J. Trop. For. Environ. 2014, 4. [Google Scholar] [CrossRef] [Scilit]
- Anoop, E.V.; Rao, R.V.; Mukundan, G. Red Sanders: Silviculture and Conservation; Pullaiah, T., Balasubramanya, S., Anuradha, M., Eds.; Springer Nature Singapore Pte Ltd.: Berlin/Heidelberg, Germany, 2019; pp. 131–152. [Google Scholar] [CrossRef] [Scilit] [PubMed]
- Pérez Cordero, L.D.; Kanninen, M. Heartwood, sapwood and bark content, and wood dry density of young and mature teak (Tectona grandis) trees grown in Costa Rica. Silva Fenn. 2003, 37, 45–54. [Google Scholar] [CrossRef] [Scilit]
- Johnstone, D.; Moore, G.; Tausz, M.; Nicolas, M. The measurement of wood decay in landscape trees. Arboric. Urban For. 2010, 36, 121–127. [Google Scholar] [CrossRef] [Scilit]
- Just, A.; Jacobs, F. Elektrische Widerstandstomographie zur Untersuchung des Gesundheitszustandes von Bäumen. In Tagungsband des VII; Arbeitsseminars Hochauflösende Geoelektrik; Institut für Geophysik und Geologie der Universität Leipzig: Leipzig, Germany, 1998. [Google Scholar]
- Bieker, D.; Rust, S. Electric resistivity tomography shows radial variation of electrolytes in Quercus robur. Can. J. For. Res. 2010, 40, 1189–1193. [Google Scholar] [CrossRef] [Scilit]
- Fensom, D. On measuring electrical resistance in situ in higher plants. Can. J. Plant Sci. 1966, 46, 169–175. [Google Scholar] [CrossRef] [Scilit]
- Guyot, A.; Ostergaard, K.T.; Lenkopane, M.; Fan, J.; Lockington, D.A. Using electrical resistivity tomography to differentiate sapwood from heartwood: Application to conifers. Tree Physiol. 2013, 33, 187–194. [Google Scholar] [CrossRef] [Scilit] [PubMed]
- Wang, H.; Guan, H.; Guyot, A.; Simmons, C.T.; Lockington, D.A. Quantifying sapwood width for three Australian native species using electrical resistivity tomography. Ecohydrology 2016, 9, 83–92. [Google Scholar] [CrossRef] [Scilit]
- Bieker, D.; Rust, S. Non-destructive estimation of sapwood and heartwood width in Scots pine (Pinus sylvestris L.). Silva Fenn. 2010, 44, 267–273. Available online: https://www.silvafennica.fi/article/153 (accessed on 12 July 2026). [CrossRef] [Scilit]
- Lin, C.J.; Chung, C.H.; Yang, T.H.; Lin, F.C. Detection of electric resistivity tomography and evaluation of the sapwood-heartwood demarcation in three Asia gymnosperm species. Silva Fenn. 2012, 46, 415–424. Available online: https://www.silvafennica.fi/article/440 (accessed on 12 July 2026). [CrossRef] [Scilit]
- Benson, A.R.; Koeser, A.K.; Morgenroth, J. Estimating conductive sapwood area in diffuse and ring porous trees with electronic resistance tomography. Tree Physiol. 2018, 39, 484–494. [Google Scholar] [CrossRef] [Scilit] [PubMed]
- Rust, S. Comparison of three methods for determining conductive xylem area of Scots pine (Pinus sylvestris). For. Int. J. For. Res. 1999, 72, 103–110. [Google Scholar] [CrossRef] [Scilit][Green Version]
- Kravka, M.; Krejzar, T.; Cermak, J. Water content in stem wood of large pine and spruce trees in natural forests in central Sweden. Agric. For. Meteorol. 1999, 98–99, 555–562. [Google Scholar] [CrossRef] [Scilit]
- Divakara, B.N.; Singh, M.P. Application of Electric Resistance Tomograph (ERT): Innovative non-destructive method in analysing interiors of standing trees in tropics. Can. J. For. Res. 2015, 55, 1–15. [Google Scholar] [CrossRef] [Scilit]
- Shortle, W.C.; Smith, K.T. Electrical properties and rate of decay in spruce and fir wood. Phytopathology 1987, 77, 811–814. [Google Scholar] [CrossRef] [Scilit]
- Panshin, A.J.; de Zeeuw, C. Textbook of Wood Technology; McGraw-Hill Book Company: New York, NY, USA, 1980; 722p. [Google Scholar]
- Rowell, R.M. Handbook of Wood Chemistry and Wood Composites, 2nd ed.; CRC Press: Boca Raton, FL, USA, 2012. [Google Scholar] [CrossRef] [Scilit]
- Divakara, B.N.; Chaithra, S. Electric Resistance Tomograph (ERT): A review as non-destructive Tool (NDT) in deciphering interiors of standing trees. Sens. Imaging 2022, 23, 18. [Google Scholar] [CrossRef] [Scilit]
- Divakara, B.N.; Nikitha, C.U.; Chauhan, S.S. Deciphering interiors of commercially important Indian trees using 3D Electric Resistance Tomograph (ERT). Indian For. 2020, 146, 1149–1153. [Google Scholar] [CrossRef] [Scilit]
- Skaar, C. Wood-Water Relations; Springer Series in Wood Science; Springer: Berlin/Heidelberg, Germany, 1988. [Google Scholar]
- Brazee, N.J.; Marra, R.E.; Göcke, L.; Van Wassenaer, P. Non-destructive assessment of internal decay in three hardwood species of northeastern North America using sonic and electrical impedance tomography. For. Int. J. For. Res. 2011, 84, 33–39. [Google Scholar] [CrossRef] [Scilit]
- Bucur, V. Nondestructive Characterization and Imaging of Wood; Springer Series in Wood Science; Springer: Berlin/Heidelberg, Germany, 2003; p. xiv+354. ISBN 3-540-438140-8. [Google Scholar] [CrossRef] [Scilit]
- Stamm, A.J. The electrical resistance of wood as a measure of its moisture content. Ind. Eng. Chem. 1927, 19, 1021–1025. [Google Scholar] [CrossRef] [Scilit]
- James, W.L. Electric Moisture Meters for Wood; General Technical Report FPL-GTR-6; USDA Forest Service; U.S. Department of Agriculture, Forest Service, Forest Products Laboratory: Madison, WI, USA, 1988; 17p. [CrossRef] [Scilit]
- Gilbert, E.A.; Smiley, E.T. Picus sonic tomography for the quantification of decay in white oak (Quercus alba) and hickory (Carya spp.). Arboric. Urban For. 2004, 30, 277–281. [Google Scholar] [CrossRef] [Scilit]
- Al Hagrey, S.A. Electrical resistivity imaging of tree trunks. Near Surf. Geophys. 2006, 4, 179–187. [Google Scholar] [CrossRef] [Scilit]
- Ganthaler, A.; Sailer, J.; Bär, A.; Losso, A.; Mayr, S. Noninvasive Analysis of Tree Stems by Electrical Resistivity Tomography: Unraveling the Effects of Temperature, Water Status, and Electrode Installation. Front. Plant Sci. 2019, 10, 1455. [Google Scholar] [CrossRef] [Scilit] [PubMed] [PubMed Central]
Disclaimer/Publisher’s Note: The statements, opinions and data contained in all publications are solely those of the individual author(s) and contributor(s) and not of MDPI and/or the editor(s). MDPI and/or the editor(s) disclaim responsibility for any injury to people or property resulting from any ideas, methods, instructions or products referred to in the content. |
© 2026 by the authors. Licensee MDPI, Basel, Switzerland. This article is an open access article distributed under the terms and conditions of the Creative Commons Attribution (CC BY) license.