
Article

Metal Magnetic Memory-Based Electromagnetic Non-Destructive Evaluation of Steel-Core Damage in UHV ACSR Conductors
Gansu Electric Power Research Institute Technology Center Co., Ltd., Lanzhou 730070, China
*
Author to whom correspondence should be addressed.
Submission received: 13 July 2026 / Revised: 3 August 2026 / Accepted: 8 August 2026 / Published: 17 August 2026
(This article belongs to the Topic Nondestructive Testing and Evaluation-2nd Edition)

Abstract

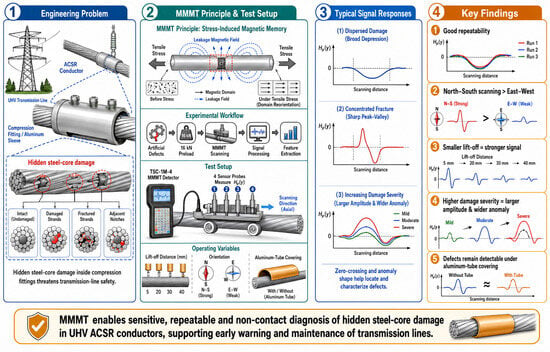
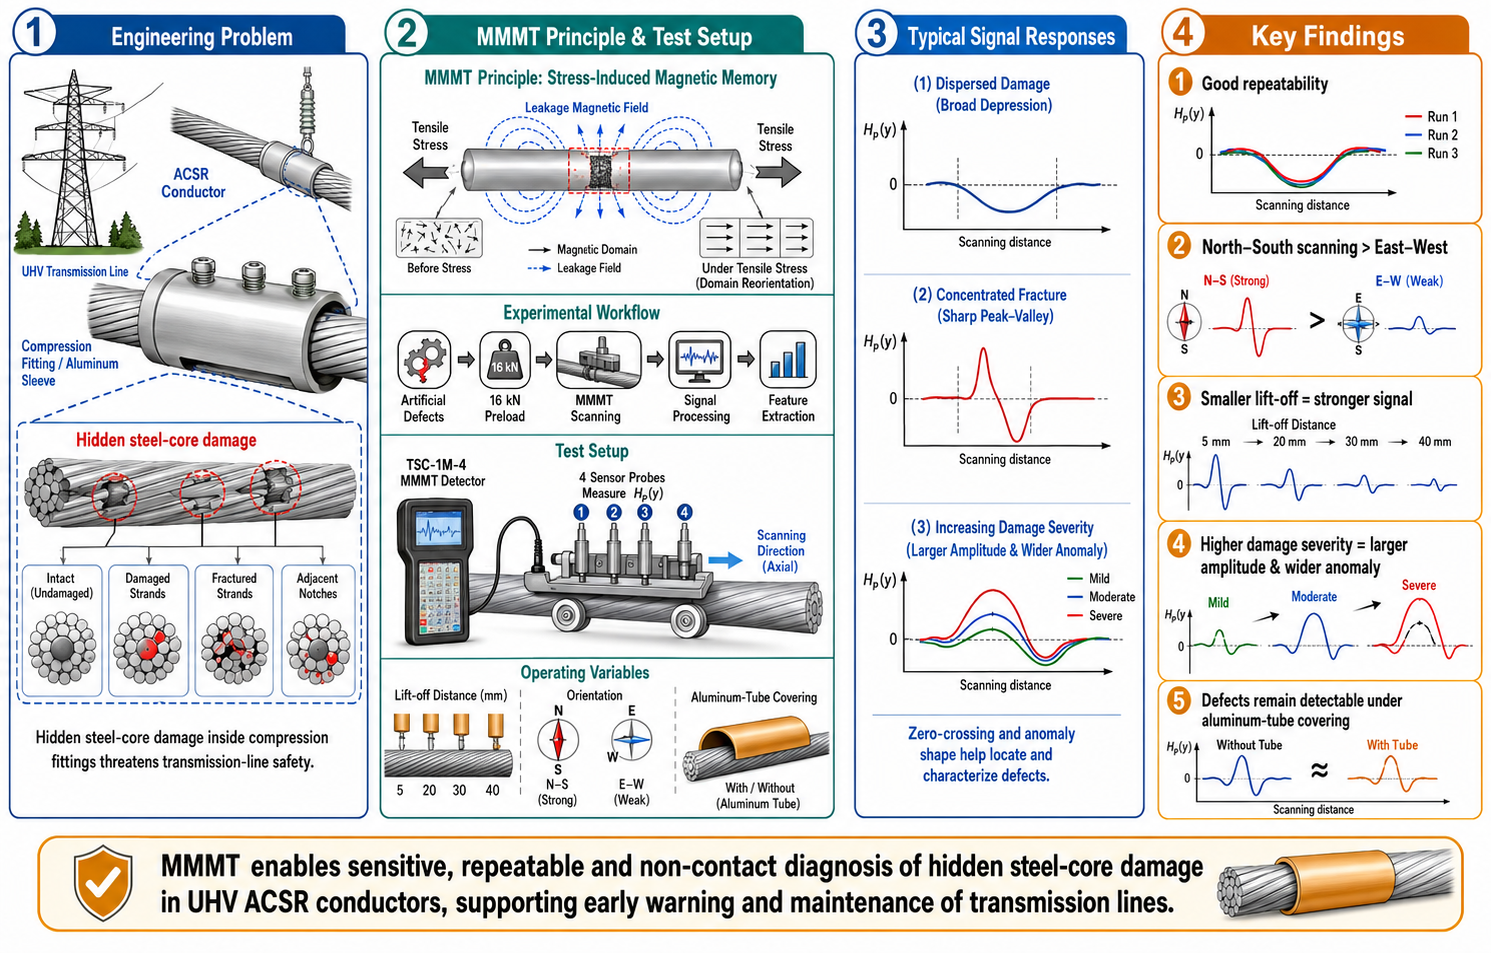
Internal steel-core damage hidden within aluminum conductor steel-reinforced (ACSR) compression components may threaten the mechanical integrity of ultra-high-voltage transmission lines. This laboratory study evaluates metal magnetic memory testing (MMMT) responses to artificial discontinuities in seven-strand ACSR steel cores under four nominal lift-off distances, two nominal orthogonal specimen orientations, and a simplified aluminum-tube-covered condition. One intact specimen and five artificially damaged 1 m specimens were preloaded to 16 kN for 2 min, unloaded, and scanned using the normal magnetic-field component recorded by Channel 1 of a TSC-1M-4 detector. Quantitative descriptors included peak-to-peak amplitude, abnormal-field width, maximum gradient, and short-term within-specimen repeatability. At 5 mm lift-off, peak-to-peak amplitudes ranged from 18.7 to 91.4 A/m. Across three repeated repositioning scans, amplitude coefficients of variation ranged from 0.83% to 8.04%. Relative to 5 mm, the descriptive mean amplitude loss reached 66.3%, 81.9%, and 89.8% at 20, 30, and 40 mm, respectively. Orientation changed signal polarity and amplitude in a specimen-dependent manner. Anomalies remained visible under the aluminum-tube configuration, although covering and effective lift-off effects could not be separated. The results provide preliminary laboratory evidence for further evaluation of MMMT as a screening approach; the reported feature values are not field detection thresholds.

Graphical Abstract

1. Introduction

A reliable power transmission system is fundamental to cross-regional energy allocation and the development of modern power systems. Compression fittings, including tension clamps and splicing sleeves, are essential connections in overhead transmission lines, and the quality of their crimping directly affects mechanical stability, electrical reliability, and operational safety [1].
A crimped tension clamp generally consists of an outer aluminum tube and an internal steel anchor. The aluminum tube provides mechanical anchoring and electrical continuity, whereas the steel anchor secures the conductor steel core to the transmission structure. ACSR conductors commonly contain seven central steel strands surrounded by helically stranded aluminum wires, with the steel core carrying most of the tensile load [2]. Manufacturing defects, inappropriate crimping, overload, corrosion, and stress concentration can damage or fracture the steel core without producing obvious external indications. Such hidden damage can ultimately cause conductor breakage or drop; therefore, an effective method for inspecting the steel core within fittings is required.
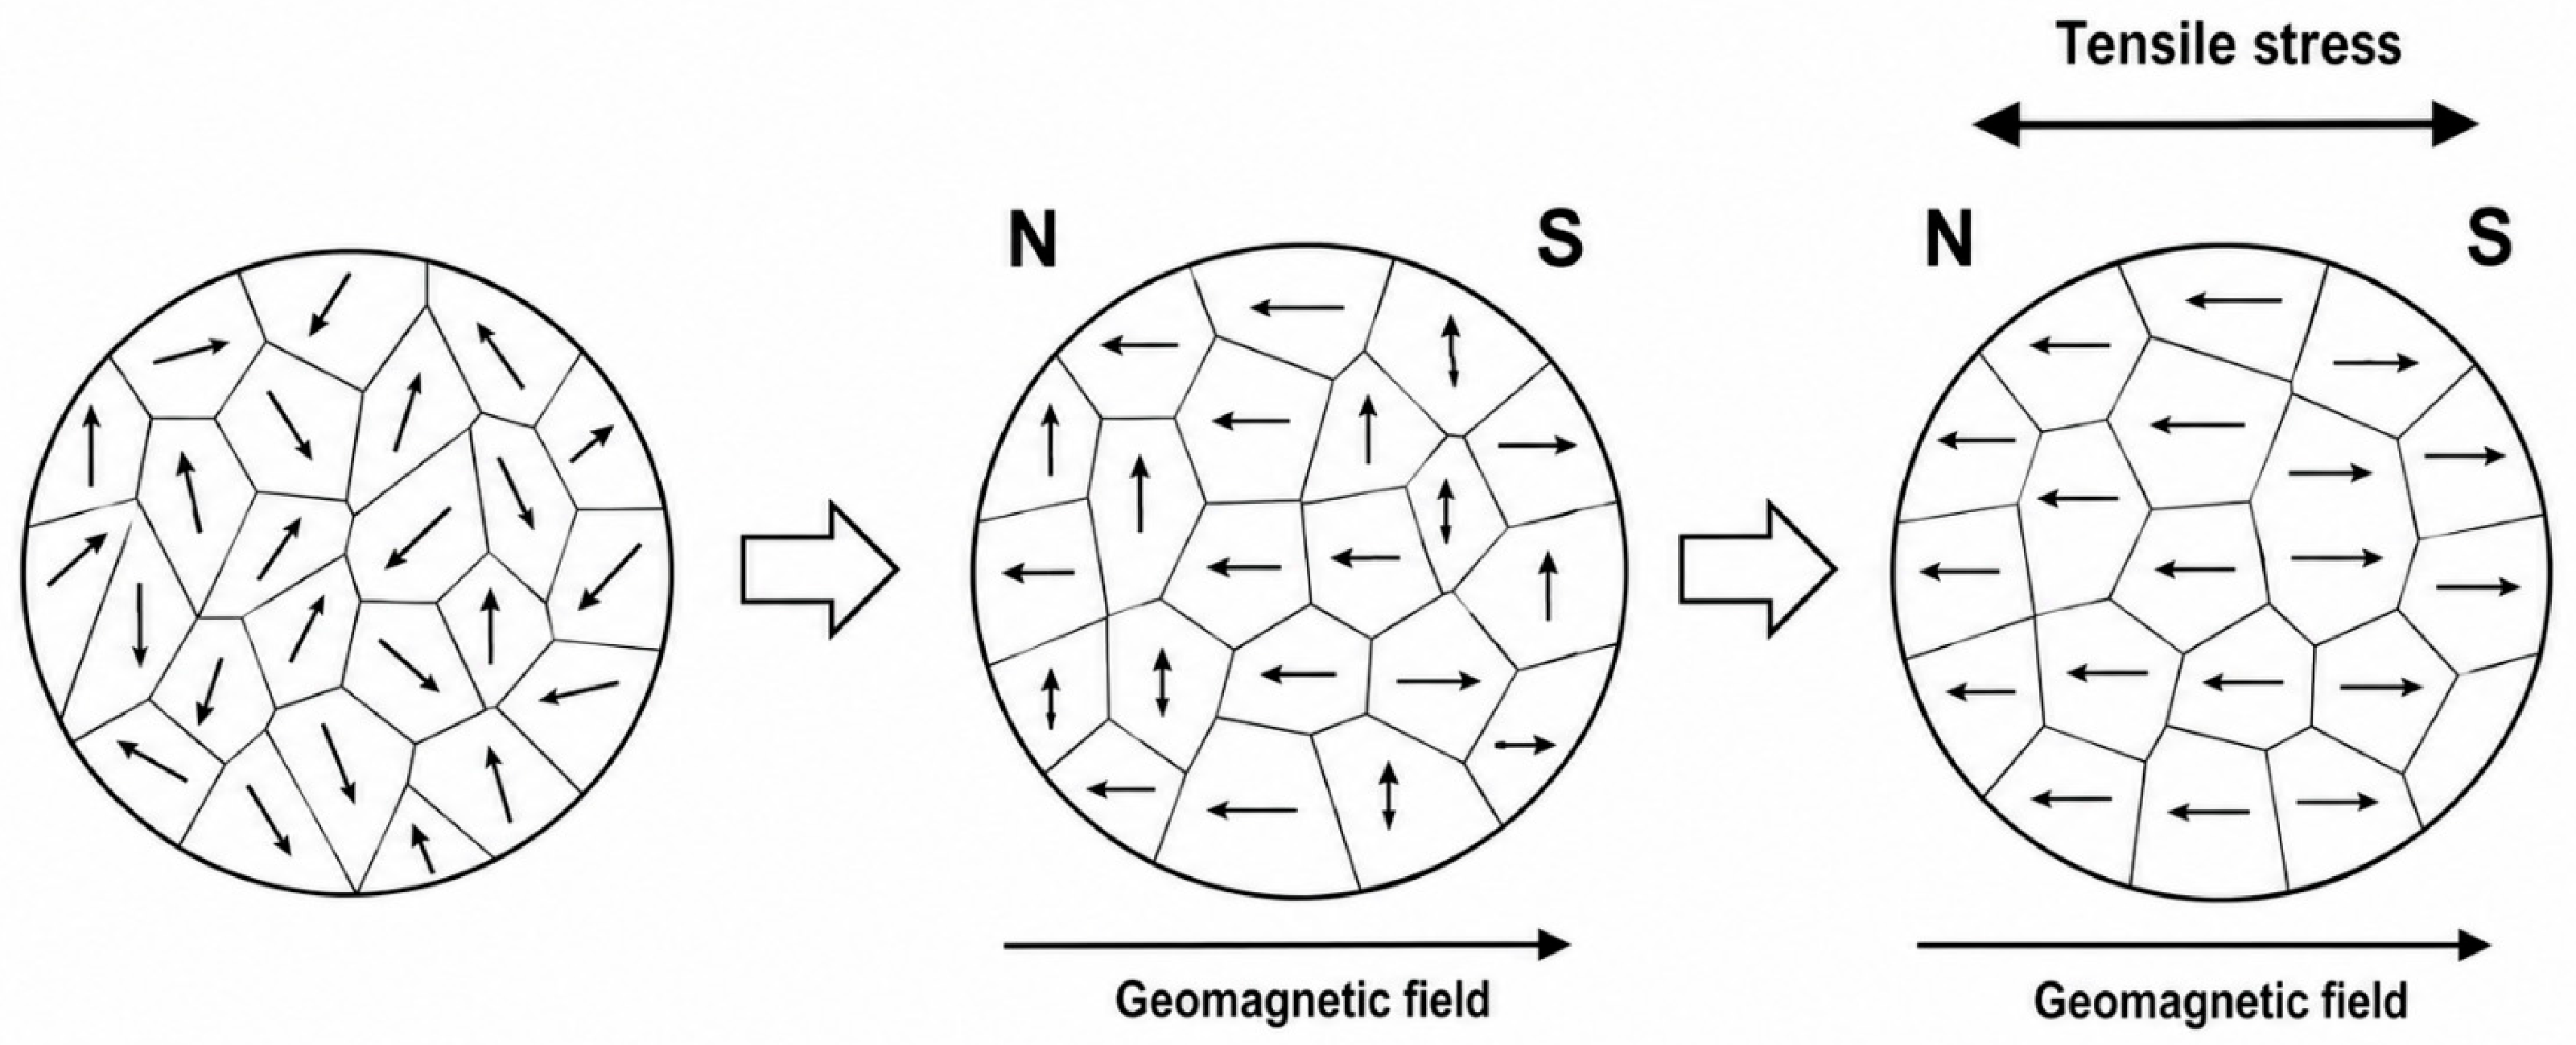
Metal magnetic memory testing (MMMT) is a passive, nondestructive magnetic testing method that uses the self-magnetic leakage field of a ferromagnetic component. In contrast to conventional magnetic-flux-leakage testing, MMMT does not require deliberate premagnetization and can be implemented with compact, non-contact instrumentation [3,4,5]. When a ferromagnetic material is loaded in the geomagnetic field, magneto-mechanical coupling changes the local domain configuration. Stress concentration, plastic deformation, and defects can therefore produce residual magnetic anomalies that remain detectable after unloading [4,5,6], as schematically illustrated in Figure 1.
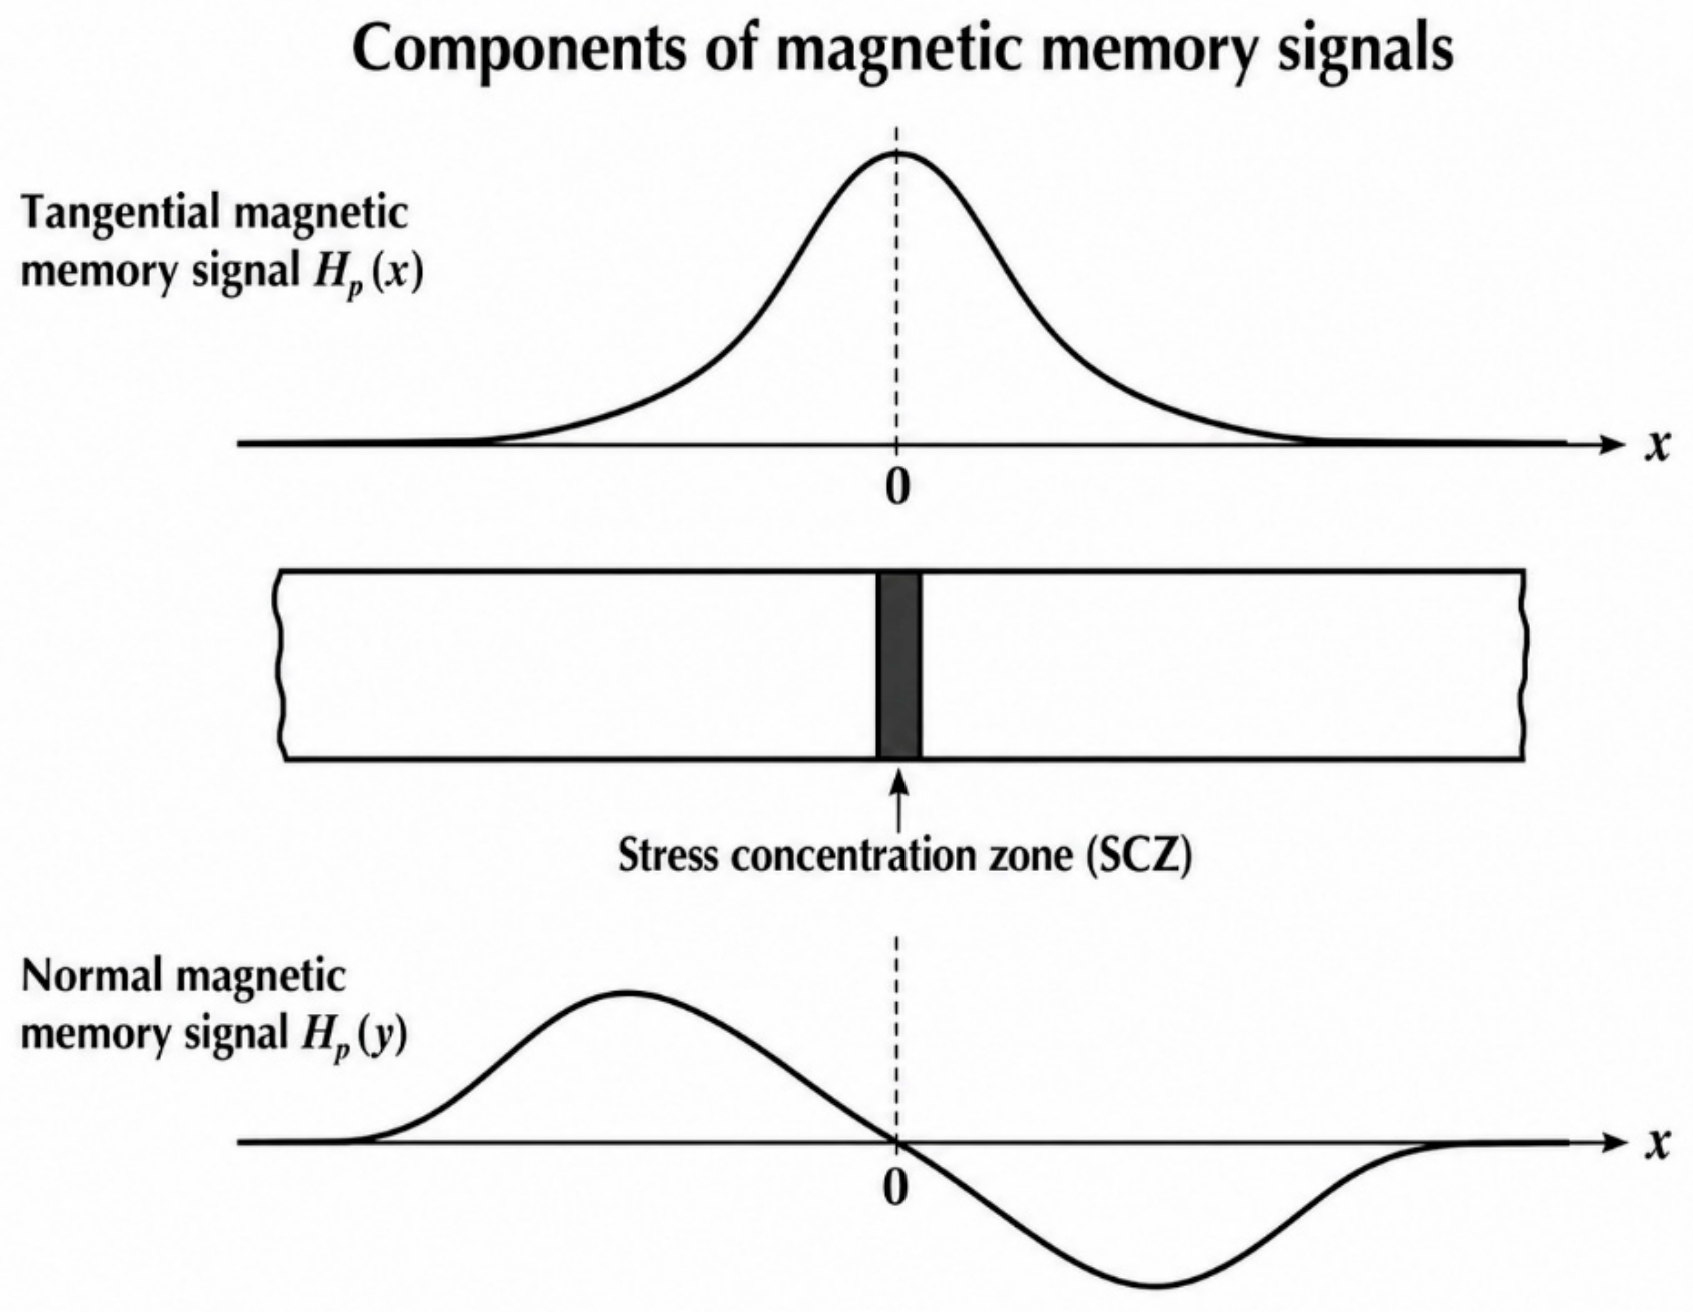
Dubov [4] and subsequent studies [7] associated stress-concentration zones with characteristic changes in the tangential and normal magnetic components. In an idealized response, the tangential component Hp(x) reaches an extremum, and the normal component Hp(y) changes polarity near the stress-concentration zone. In practical multi-strand components, however, defect geometry, background magnetization, lift-off distance, and scanning orientation can shift the extrema and zero-crossing positions. Quantitative interpretation therefore requires explicit feature definitions rather than visual comparison alone.
The components of magnetic memory signals are illustrated in Figure 2. Stress and plastic deformation alter the magnetic free-energy balance and can drive irreversible domain-wall motion or domain rotation [4,5,8]. The resulting self-magnetic leakage field contains information about the stress history and local discontinuities, although its magnitude and spatial distribution also depend on specimen geometry and measurement conditions [3,8,9,10,11,12].
Previous MMMT studies have mainly examined plates, bars, welded joints, notched specimens, and plastically deformed ferromagnetic samples. Bao et al. [3] summarized the method’s physical basis, capabilities, and unresolved quantitative issues. Shi et al. [8,9], Wang et al. [10,11], and Yao et al. [12] modeled the effects of defect geometry, deformation, and magneto-mechanical coupling on magnetic-memory signals. Roskosz [13] and Roskosz and Gawrilenko [14] examined residual magnetic-field changes in welded and notched specimens.More recent investigations have extended MMMT to three-dimensional discontinuities, complex industrial components, and data-driven defect recognition [15,16,17]. These studies demonstrate that magnetic-memory features depend not only on the presence of a discontinuity but also on component geometry, material magnetic history, stress distribution, sensor orientation, and lift-off distance.
Existing electromagnetic approaches for inspecting ACSR conductors include actively magnetized magnetic probes and pulsed-eddy-current sensors designed to detect broken strands, metallic-area loss, and steel-core splice defects [18,19]. These methods differ in their excitation requirements, access conditions, sensitivity to aluminum coverings and lift-off, and capability for defect imaging or sizing. MMMT does not require deliberate premagnetization and can be implemented using compact, non-contact sensors. However, its response depends on stress history, initial magnetization, geomagnetic orientation, lift-off, component geometry, and environmental magnetic fields. MMMT should therefore be considered as a potentially complementary screening method rather than a replacement for established confirmatory inspection techniques.
The contribution of this study is a controlled laboratory investigation of the normal-component magnetic-memory responses of seven-strand ACSR steel cores under a limited set of experimental variables. Five artificial damage configurations were examined together with four nominal lift-off distances, two nominal orthogonal specimen orientations, and a simplified aluminum-tube covering condition. Quantitative descriptors, including peak-to-peak amplitude, abnormal-field width, maximum gradient, and short-term within-specimen repeatability, were used to characterize the measured responses. The study is intended to identify condition-specific laboratory trends and experimental factors requiring control in future validation studies; it does not establish field detection thresholds or demonstrate equivalence between the simplified aluminum tube and an actual compression fitting.

2. Materials and Methods

2.1. Experimental Design

This study investigated the laboratory feasibility and parameter sensitivity of normal-component MMMT responses in artificially damaged ACSR steel cores. Six steel-core specimens were examined under controlled conditions. The normal component Hp(y) was measured at four nominal lift-off distances, in two nominal orthogonal specimen orientations, and under uncovered and simplified aluminum-tube-covered configurations. The analysis combined waveform inspection with quantitative feature extraction and repeatability statistics.
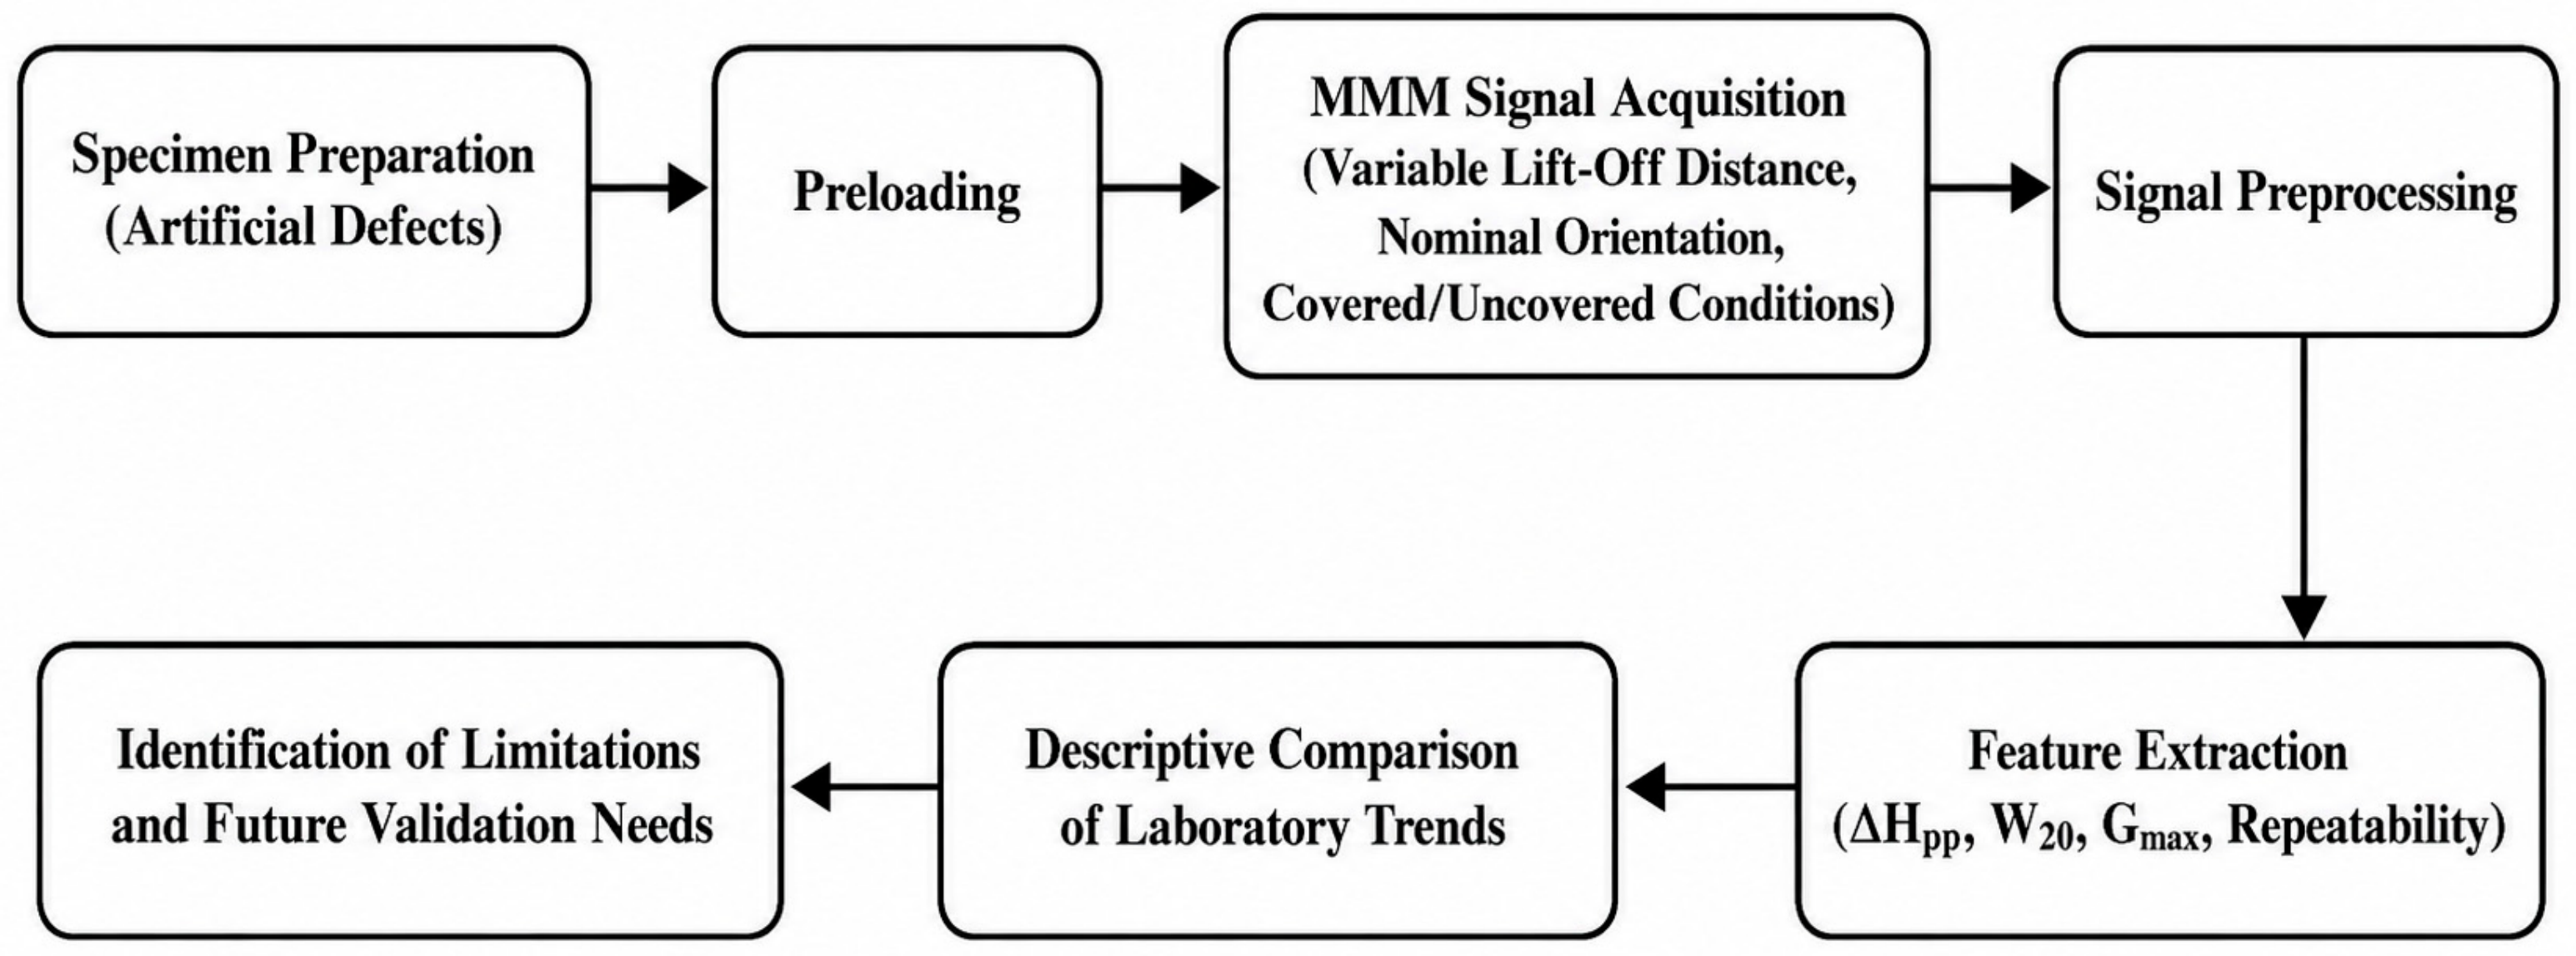
The experimental workflow comprised specimen preparation, tensile preloading, sensor and fixture checks, axial scanning, signal preprocessing, feature extraction, and comparison among damage states and test conditions (Figure 3).
The extracted features were the maximum value Hp,max, the minimum value Hp,min, the peak-to-peak amplitude ΔHpp, the abnormal-field width W20, and the maximum absolute gradient Gmax. Repeatability was evaluated using the standard deviation, coefficient of variation, and maximum relative deviation of ΔHpp.
Only one specimen was prepared for each damage morphology. Consequently, the effects attributed to damage morphology cannot be separated from specimen-specific differences in residual stress, initial magnetization, strand contact, and material variability. The comparisons among damage states should therefore be regarded as descriptive comparisons among the tested specimens rather than population-level statistical comparisons.
One intact specimen was prepared; however, it was not systematically tested under every lift-off, orientation, repeatability, and aluminum-covering condition. Consequently, the present experimental matrix does not provide a complete intact-control distribution and cannot be used to establish a statistically validated damage-detection threshold.

2.2. Specimen Preparation and Damage Design

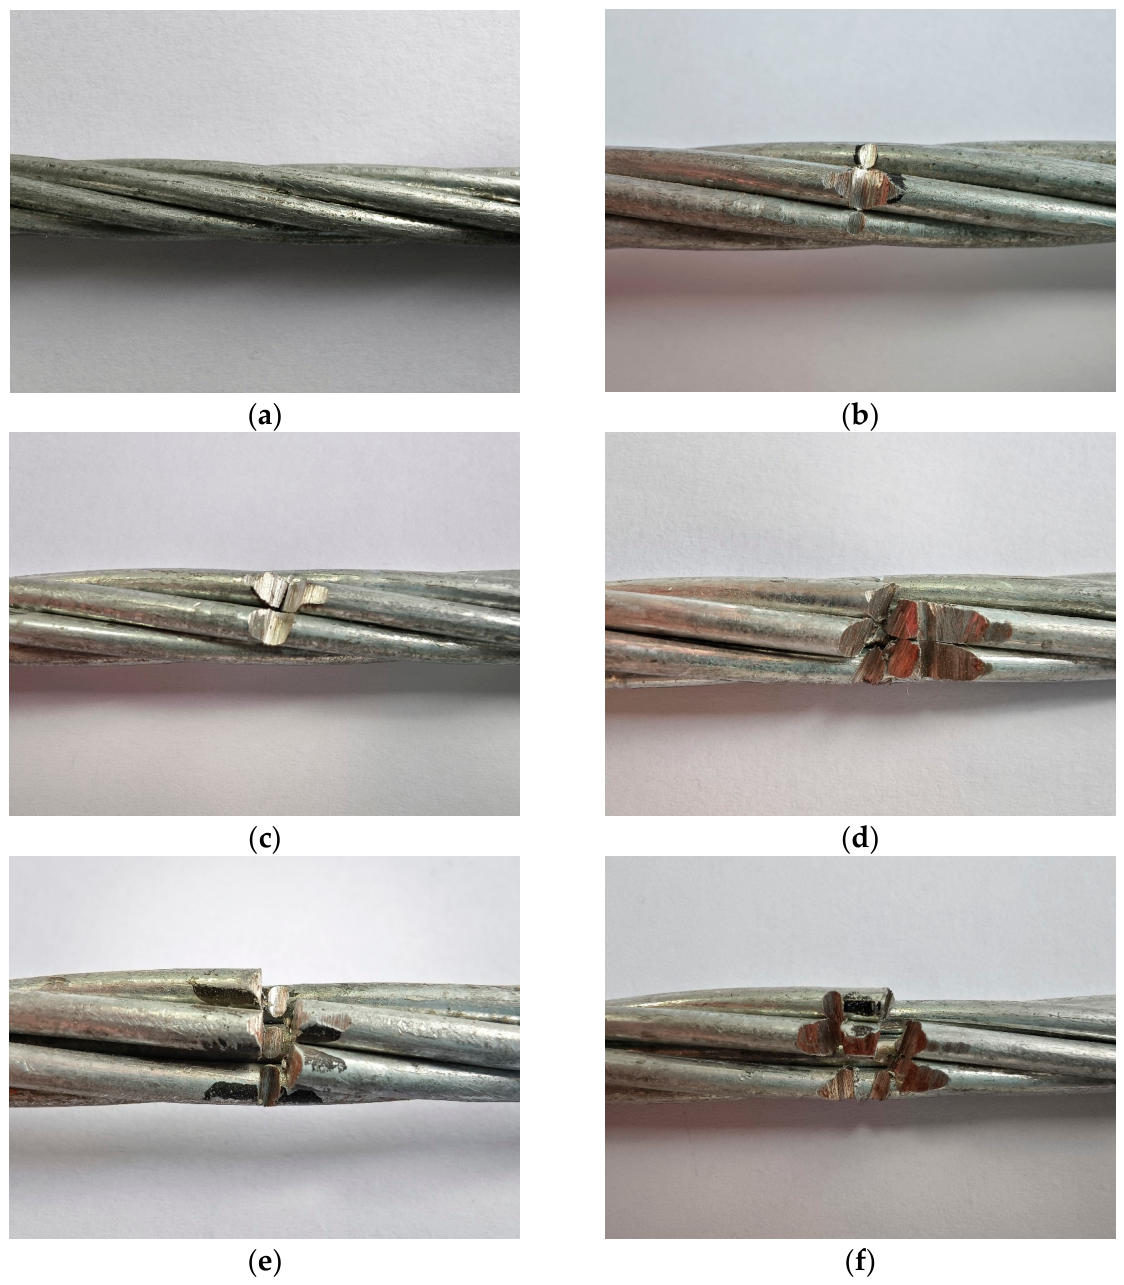
Steel-core specimens were fabricated from seven-wire galvanized high-carbon steel strands (Grade 65 steel; Tianjin Galvanized Steel Wire Co., Ltd., Tianjin, China), with an individual wire diameter of 3.57 mm. Six 1 m-long specimens were prepared: one intact specimen; one specimen with three partially notched strands; one with one severed strand and one partially notched strand; one with two severed strands and one partially notched strand; one with two severed strands and three partially notched strands; and one with two closely spaced adjacent notches (Figure 4). The artificial notches were approximately 3 mm wide. The nominal tool penetrations into the strand bundle were 2.0 mm for the three partially notched strand specimen, 3.57 mm for the one severed strand and one partially notched strand specimen, 4.0 mm for the two severed strands and one partially notched strand specimen, and 4.5 mm for both the two severed strands and three partially notched strands specimen and the specimen with two adjacent notches. The reported penetration value describes the nominal cutting-tool displacement relative to the strand bundle and should not be interpreted as the residual depth of an individual 3.57 mm wire. For the latter, the two notches were separated by approximately 0.5 mm. All defects were introduced at the midpoint of the specimens, corresponding to a position of 0.5 m from either end. For each damage condition, the same specimen was used in all lift-off-distance tests to prevent specimen-to-specimen variability from confounding the observed lift-off effect.
Before MMMT, each specimen was subjected to the same controlled tensile preload of 16 kN for 2 min and was then fully unloaded before scanning. This loading procedure was used to establish a consistent laboratory stress history among the specimens and was not selected as a simulation of the rated tensile load or long-term service condition of an ACSR conductor. The 2 min holding period was used to allow the applied load and fixture response to stabilize. Only one preload level and one holding duration were investigated; therefore, the effects of preload magnitude, loading duration, cyclic loading, and loaded-state measurement were outside the scope of the present study.

2.3. Magnetic Memory Testing System

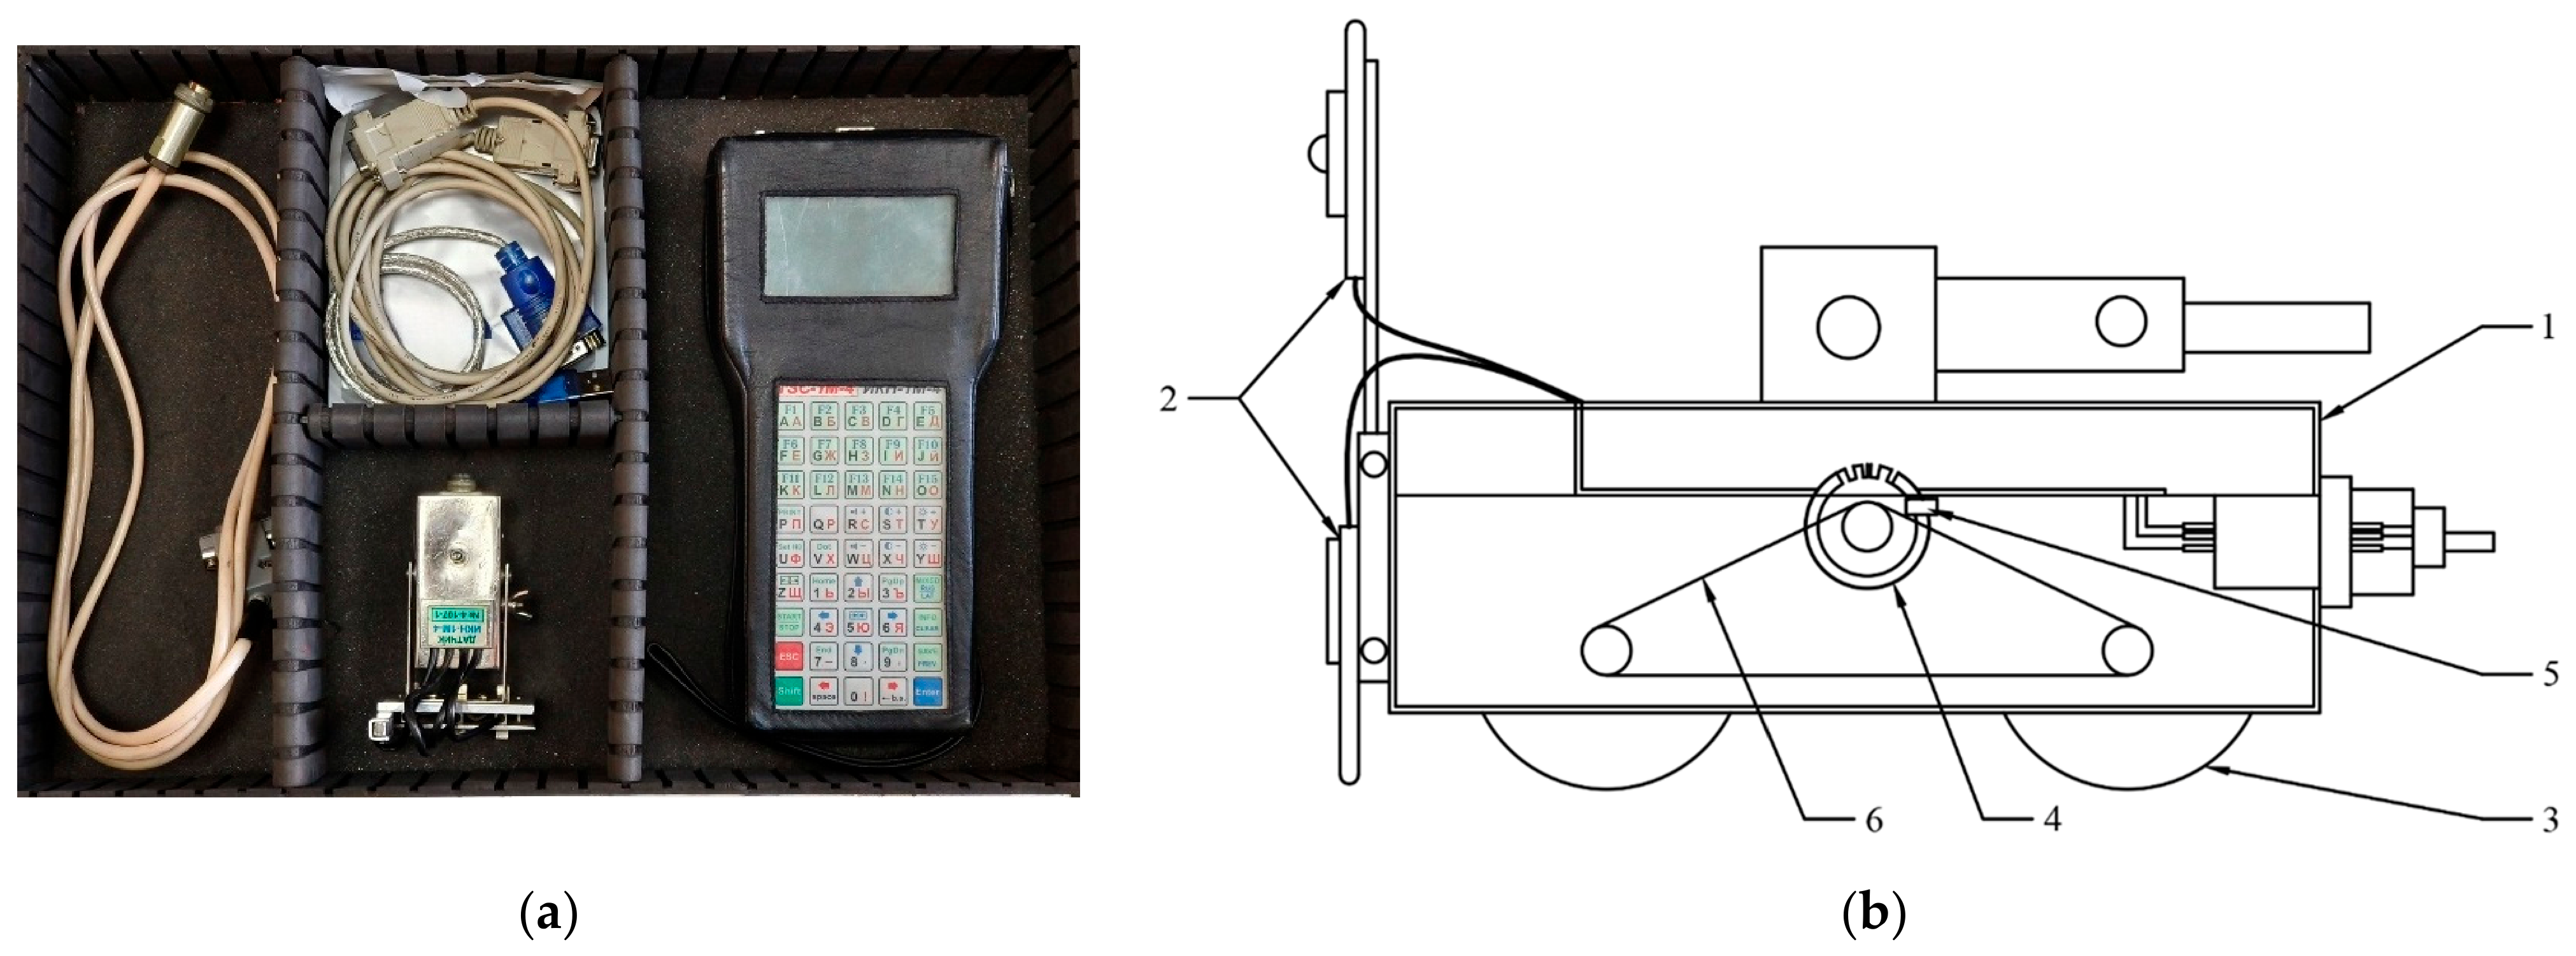
Magnetic-memory signals were acquired using a TSC-1M-4 detector (Energodiagnostika Co. Ltd., Reutov, Moscow Region, Russia) equipped with a Type-I wheeled scanning device (Figure 5). Although the scanning device contained four sensor channels, only Channel 1 was used in the present analysis. Channel 1 was located at the central position of the scanning head and was aligned approximately above the longitudinal centerline of the steel core. Channels 2–4 were not used. Consequently, all Hp(y) waveforms and derived features reported in this study were obtained exclusively from Channel 1 and were not calculated by averaging or selecting among multiple channels.
Before each series of measurements, the detector was zeroed and calibrated in accordance with the manufacturer’s operating procedure. The magnetic-field intensity was recorded in A/m as a function of axial displacement in millimeters and exported using the MMM-System software (version 4; Energodiagnostika Co. Ltd., Reutov, Moscow Region, Russia). Each specimen was placed on a nonmagnetic support and scanned axially along a predefined path at a nominal speed of 3 mm/s, with a spatial sampling interval of 1 mm. The probe orientation, lift-off distance, scanning direction, starting position, and fixture arrangement were kept unchanged for all comparable measurements. For the short-term within-specimen repeatability evaluation, three repeated repositioning scans were performed on the same specimen under identical nominal conditions. After each scan, the probe was removed from the specimen, returned to the initial position, and repositioned before the subsequent measurement. These repeated scans evaluated short-term measurement and probe-repositioning variability; they did not evaluate specimen-to-specimen reproducibility.
Only the normal magnetic-field component Hp(y) acquired by Channel 1 was analyzed in this study. Classical MMMT interpretation may use both tangential and normal components; however, the present experimental configuration and analysis focused on the normal component because it provided consistently recorded peak, trough, and bipolar waveform features for the tested specimens. The tangential and other vector components were not evaluated.

2.4. Lift-Off Distance and Scanning Direction

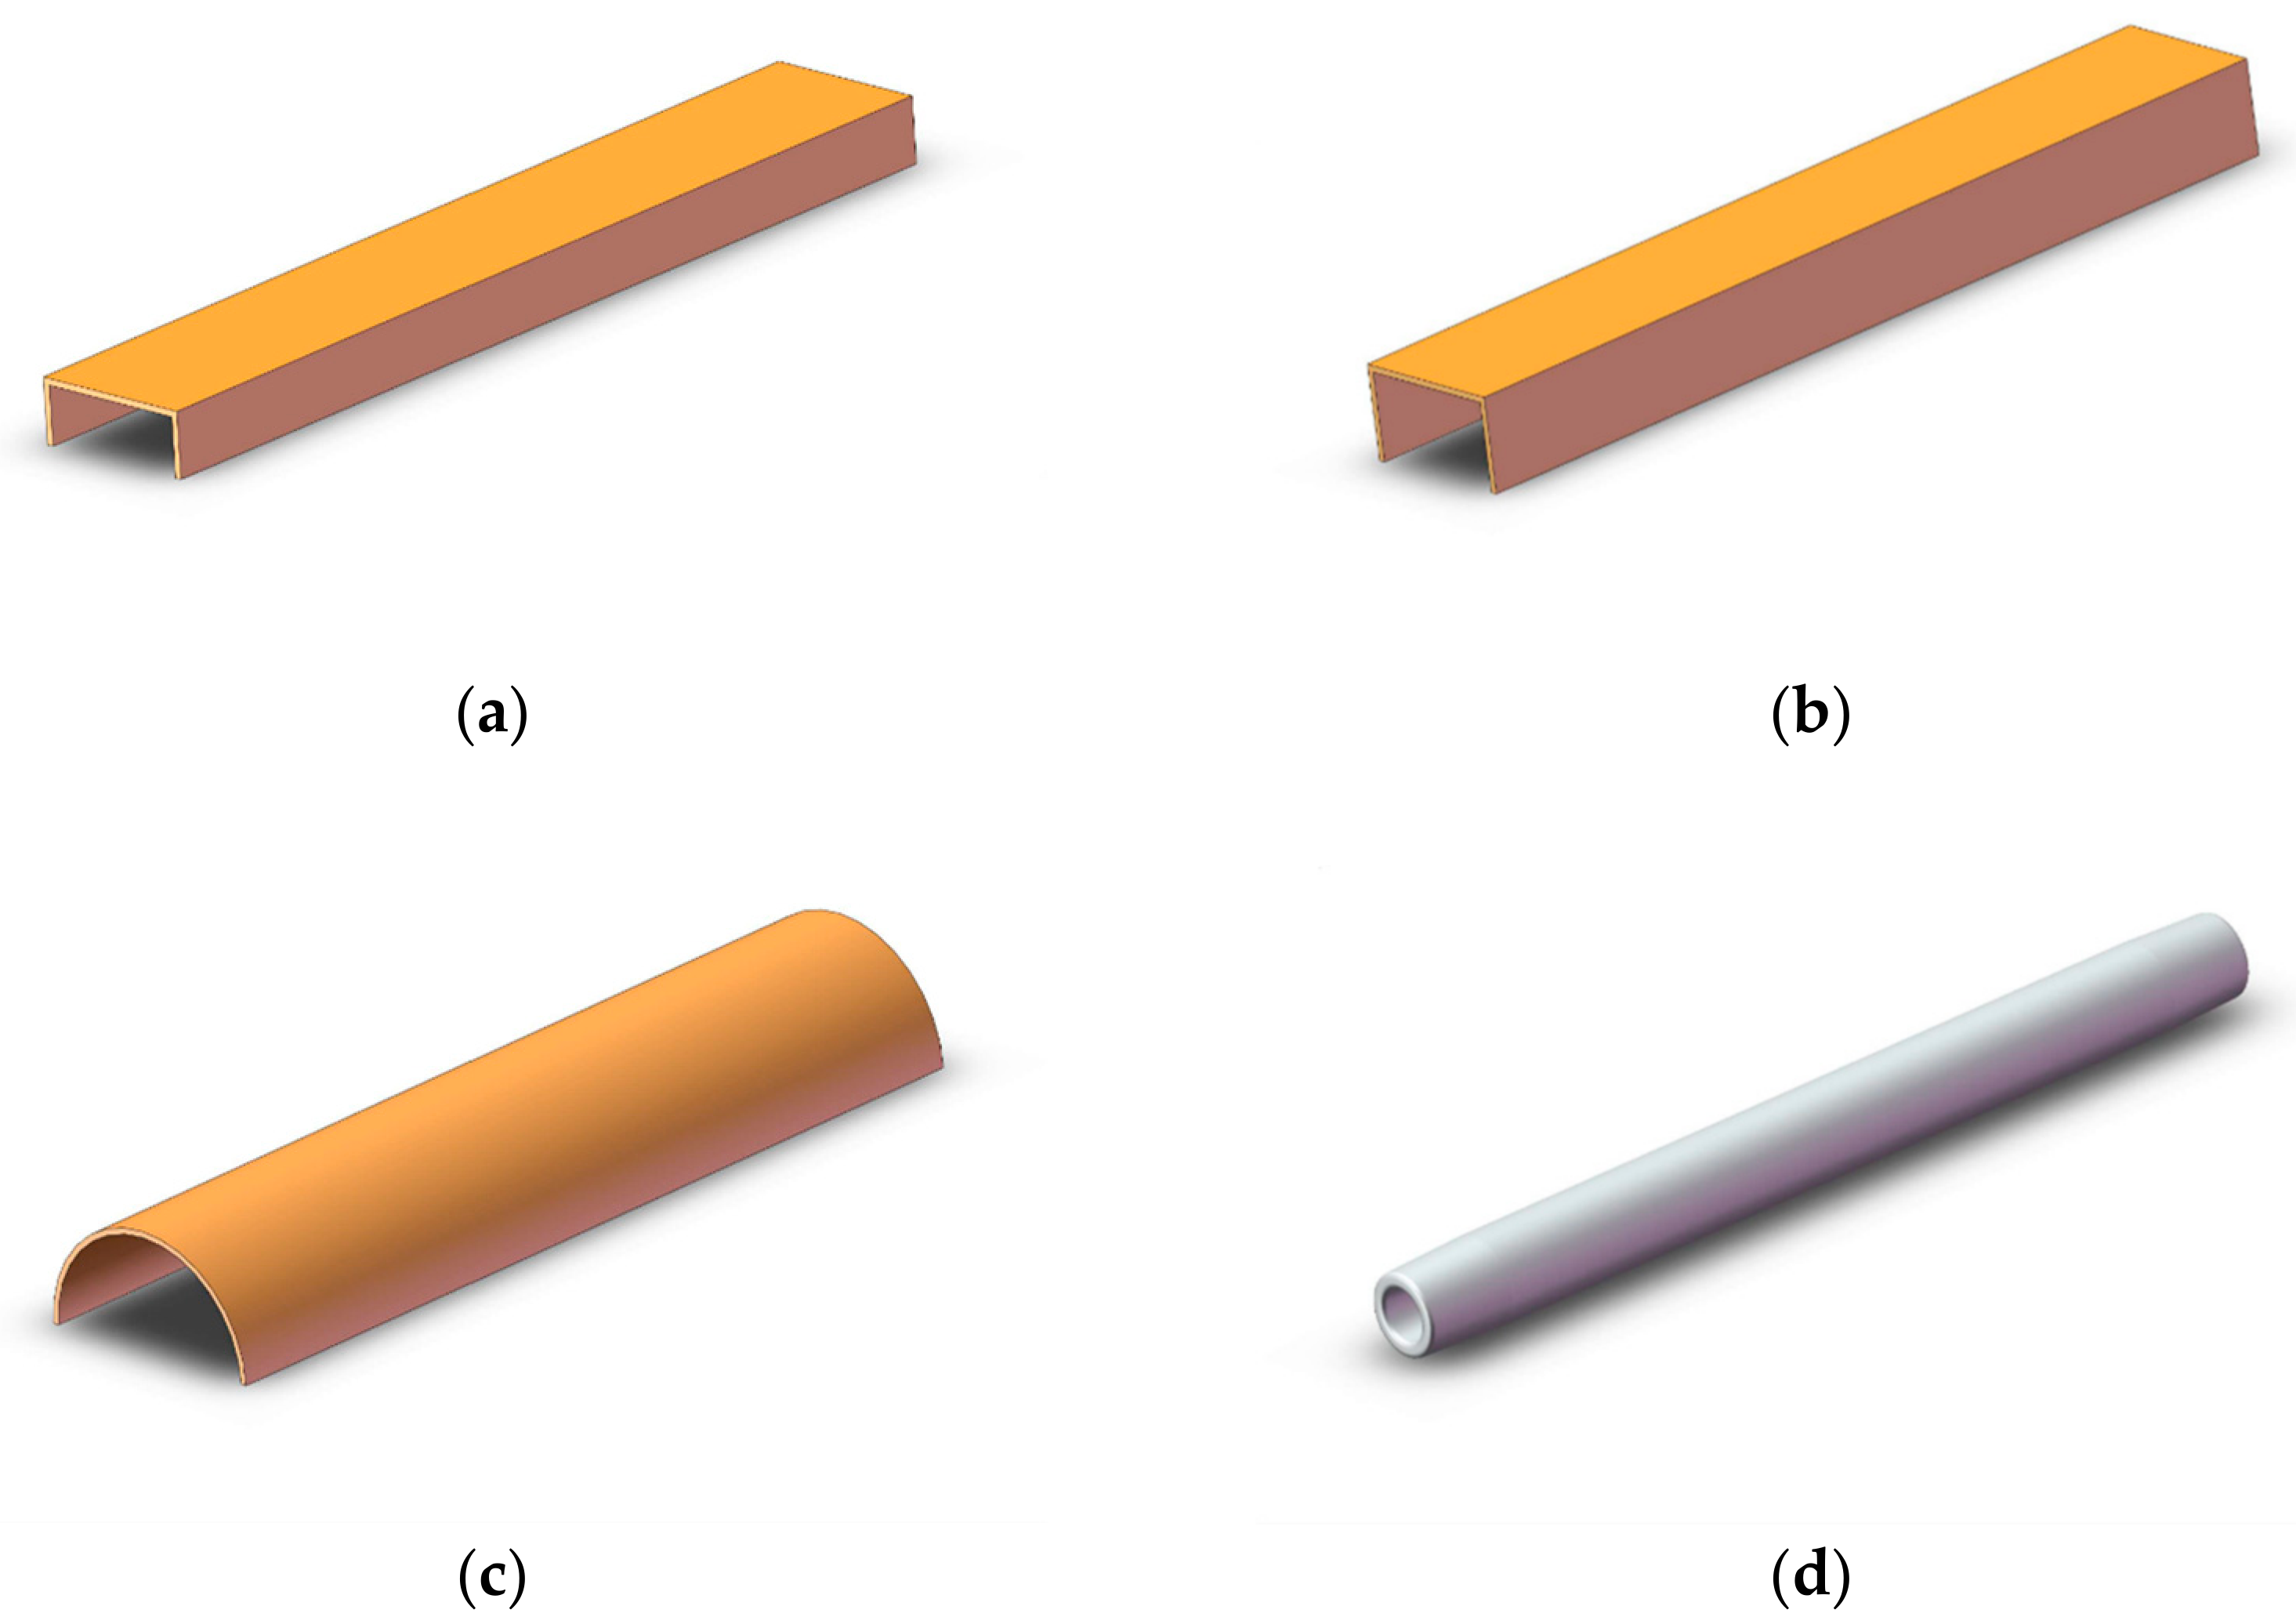
To investigate the influence of lift-off distance on magnetic-memory signal amplitude and waveform characteristics, four nominal lift-off distances were examined: 5 mm, 20 mm, 30 mm, and 40 mm. The spacers, arched mold, and aluminum tube used in these configurations are shown in Figure 6.
The four lift-off distances (5, 20, 30, and 40 mm) represented progressively less favorable inspection geometries. Nonmagnetic cardboard spacers and an arched mold maintained the nominal sensor-to-specimen distance. The lift-off value was measured from the sensor-sensitive plane to the nearest steel-core surface.
Orientation sensitivity was evaluated using two nominally orthogonal specimen orientations, referred to as north–south and east–west. The same fixture and axial scanning direction were used in both configurations. The exact specimen azimuths, angular alignment errors, and local geomagnetic-field components were not recorded during the original experiments. Therefore, the terms “north–south” and “east–west” denote nominal laboratory orientations rather than precisely calibrated geomagnetic directions.
The orientation experiment should consequently be interpreted as a comparison between two nominal orthogonal configurations, rather than as a quantitative characterization of magnetic response as a function of geomagnetic angle.
Spacer deformation, probe tilt, and the uncertainty of the nominal lift-off distances were not quantified during the original experiments.

2.5. Simplified Aluminum-Tube Covering Feasibility Test

For the covering test, selected damaged steel cores were placed inside an aluminum tube with a 30 mm outer diameter and 1.25 mm wall thickness. The aluminum tube provided a simplified conductive non-ferromagnetic cover and increased the effective sensor-to-steel-core distance. However, it did not reproduce the material temper, crimp-induced contact pressure, plastic deformation, variable wall thickness, steel-anchor geometry, or residual stress of an actual compression fitting. The covering experiment should therefore be interpreted as a feasibility test rather than a validated fitting-equivalence test.

2.6. Signal Processing and Feature Extraction

The physical specimen coordinate was defined with x = 0 mm at the scanning start end and x = 1000 mm at the opposite end. The nominal defect center was located at xd = 500 mm. The baseline regions were x = 0–100 mm and x = 900–1000 mm, and the defect-analysis window was x = 350–650 mm.
Raw Hp(y) signals obtained under all test conditions were processed using an identical procedure. The baseline was estimated from nominally defect-free regions at the beginning and end of each scan. The mean values of these regions were used to construct a linear baseline, which was then subtracted from the raw signal. The baseline-corrected signals were smoothed using a third-order Savitzky–Golay filter with an 11-point moving window. The same baseline correction and filtering parameters were applied across all specimens, repeated scans, scanning orientations, lift-off distances, and covering conditions to ensure comparability. The quantitative signal features used in this study are summarized in Table 1.
For each processed curve, the maximum and minimum values within the predefined defect-analysis window were denoted as Hp,max and Hp,min, respectively, and the peak-to-peak amplitude was calculated as H p p = H p , m a x H p , m i n . Because all artificial defects were located at the midpoint of the specimen, the nominal defect position was xd = 500 mm. The abnormal-field width, W20, was defined as the continuous axial range over which the absolute baseline-corrected signal exceeded 20% of its maximum absolute amplitude. The maximum signal gradient, Gmax, was calculated as the maximum absolute spatial derivative, max d H p / d x , using the central finite-difference method. These features were used to characterize the amplitude, spatial extent, and local sharpness of the defect-related magnetic anomalies.

2.7. Short-Term Within-Specimen Repeatability Evaluation

Three repeated repositioning scans were performed on each damaged specimen under identical nominal conditions. For each specimen, the mean, standard deviation, coefficient of variation, and maximum relative deviation of ΔHpp were calculated. Because only one specimen was available for each damage morphology, these statistics characterize short-term within-specimen measurement repeatability and should not be interpreted as specimen-to-specimen reproducibility. No inferential statistical comparison among damage morphologies was performed because the repeated scans were not independent specimen-level replicates.

3. Results

Because a complete intact-control dataset was not available, the following results describe condition-specific signal trends among the five artificially damaged specimens. The reported values should not be interpreted as damage-versus-intact classification thresholds.

3.1. Short-Term Within-Specimen Repeatability

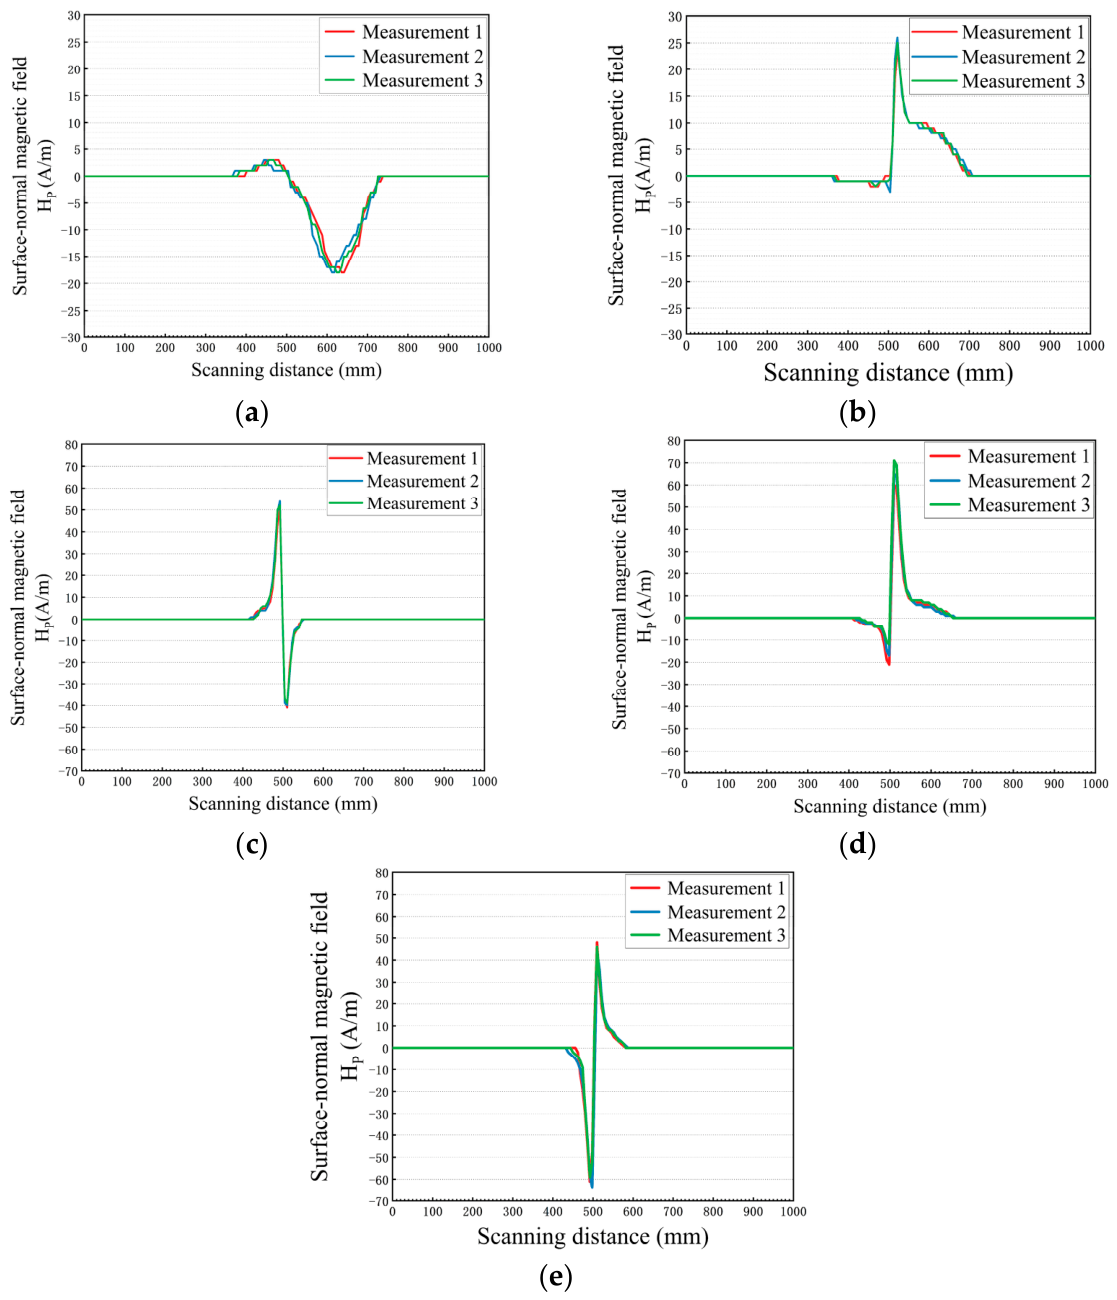
Short-term within-specimen repeatability was evaluated for the five damaged specimens using three repeated repositioning scans of each specimen (Figure 7). The analysis used the mean, standard deviation, coefficient of variation, and maximum relative deviation of ΔHpp, rather than relying solely on visual curve overlap.
Table 2 shows that the mean ΔHpp ranged from 21.10 to 105.09 A/m. The amplitude coefficients of variation ranged from 0.83% to 8.04%, while the maximum relative deviations ranged from 0.95% to 9.26%. These numerical indices indicate generally good short-term within-specimen amplitude repeatability under the controlled laboratory conditions.

3.2. Effect of Scanning Orientation

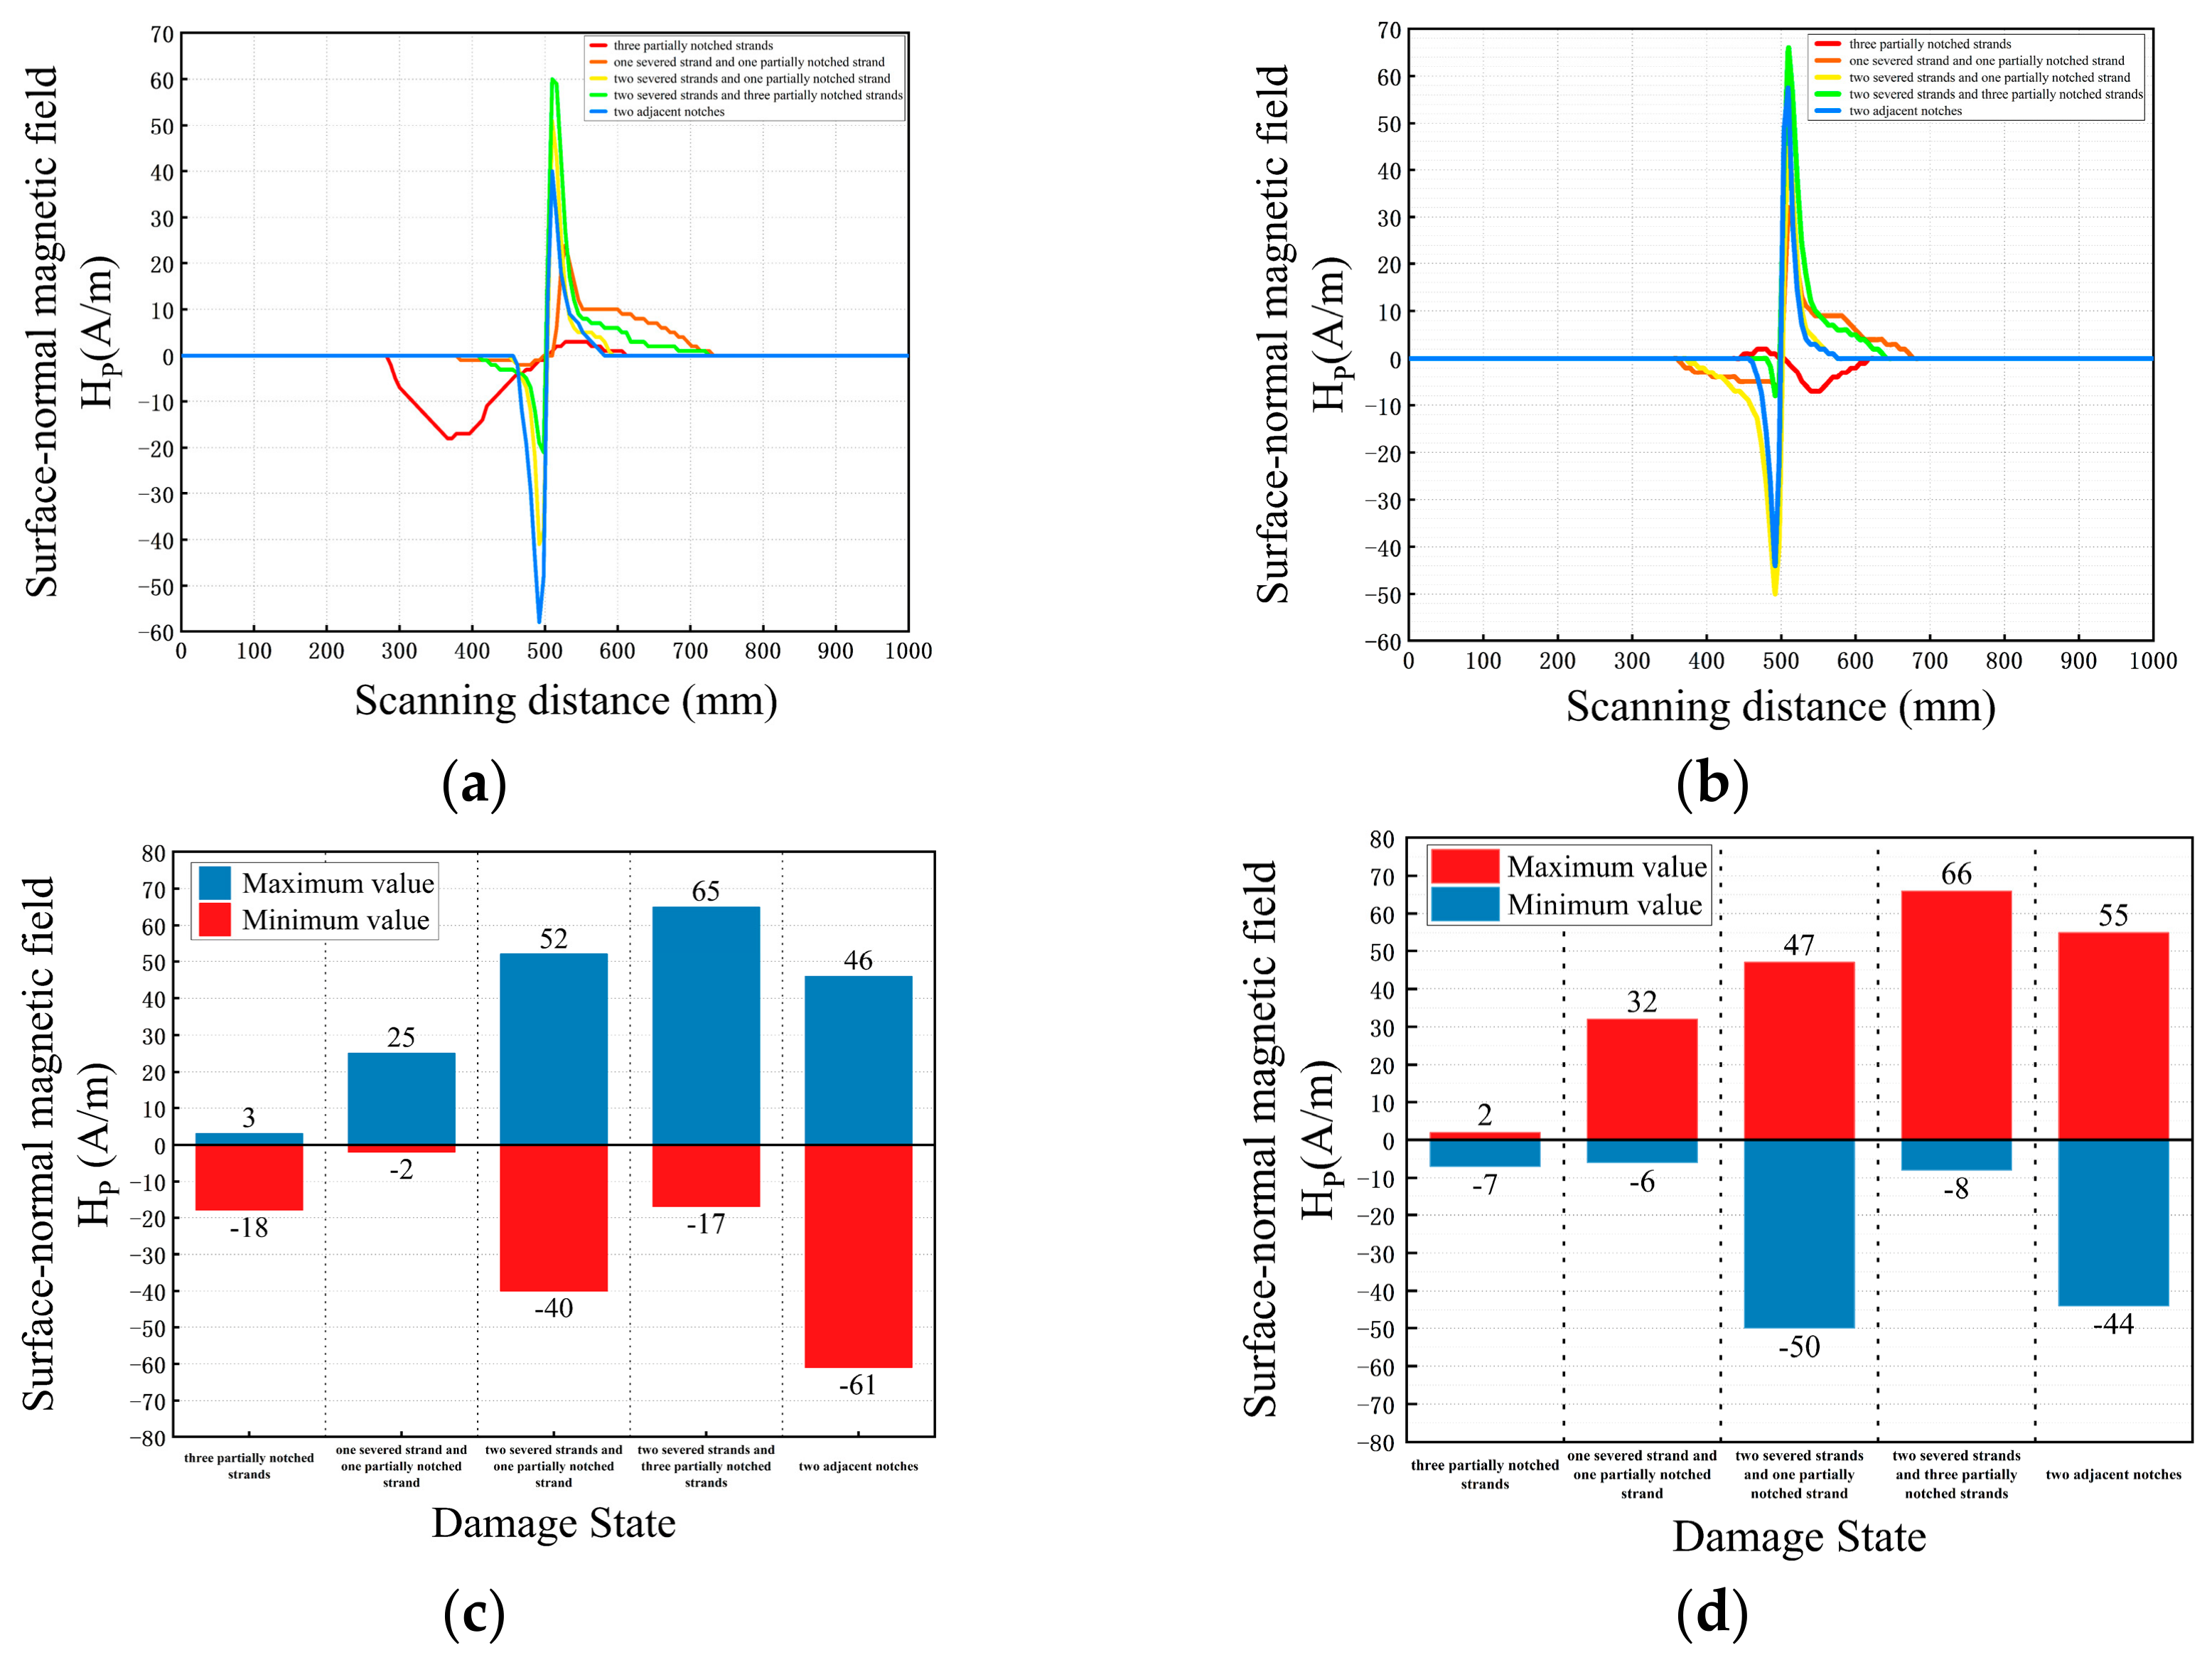
The north–south and east–west scans preserved the main defect-related waveform features but changed polarity and amplitude (Figure 8). Table 3 quantifies this effect using peak-to-peak amplitude.
The descriptive average across the five tested damaged specimens was 63.4 A/m in the north–south orientation and 65.8 A/m in the east–west orientation, a difference of only −3.6%. Specimen-specific changes ranged from −57.1% to +40.7%, and neither of the two tested orientations produced a consistently larger response across the five tested damaged specimens. Because each damage morphology was represented by one specimen, this average is provided only as a descriptive summary and does not represent a population estimate.
The orientation dependence is consistent with the interaction among geomagnetic bias, residual magnetization, strand geometry, and stress-induced domain reorientation. The present observations suggest that specimen orientation should be recorded and controlled in future validation studies. Where practical, orthogonal confirmation scans may also be considered. However, because the exact azimuths and local geomagnetic-field components were not measured, the present results do not establish a standardized field-orientation protocol.

3.3. Effect of Lift-Off Distance

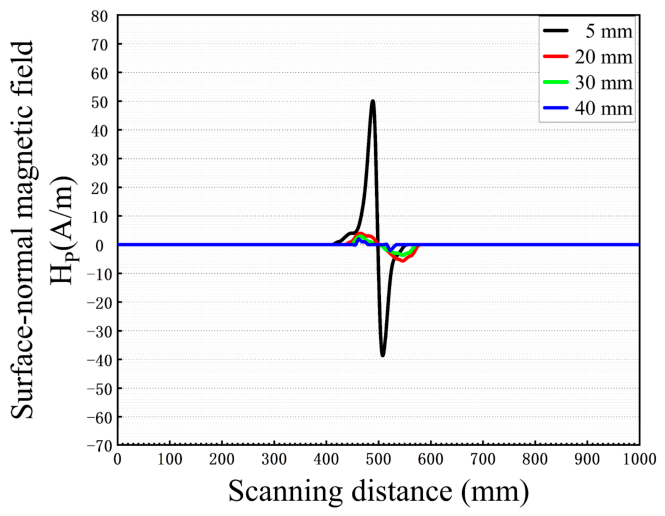
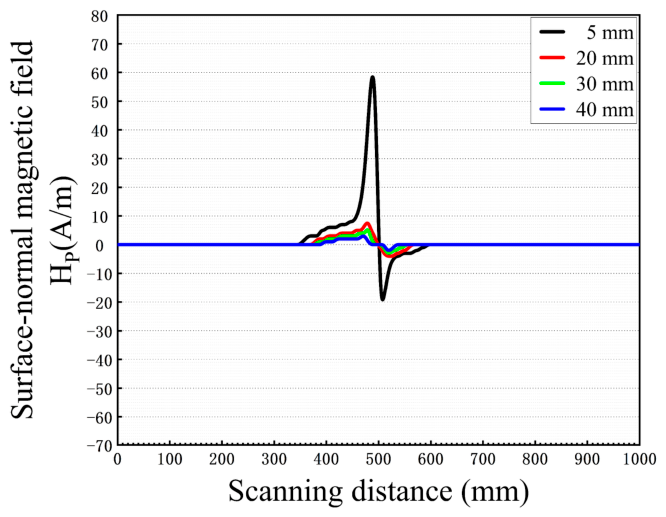
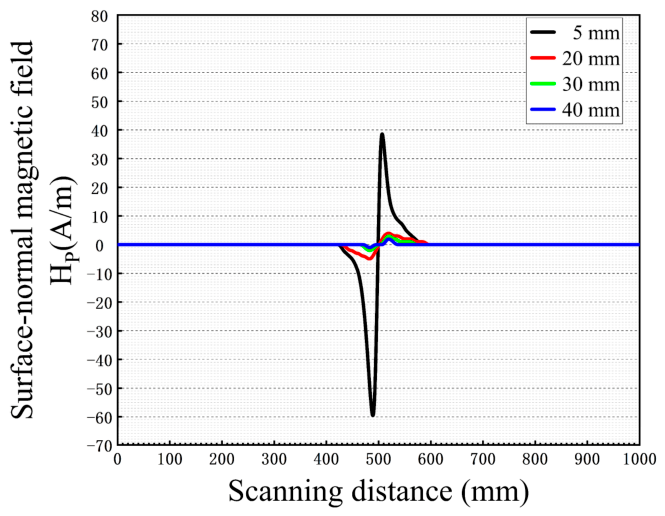
Lift-off distance strongly affected signal amplitude, gradient, and spatial sharpness. Table 4 summarizes the quantitative descriptors of the 5 mm scans, and Table 5 gives the peak-to-peak loss at 20–40 mm. At 5 mm, ΔHpp ranged from 18.7 to 91.4 A/m, W20 ranged from 31.9 to 144.3 mm, and Gmax ranged from 0.49 to 7.54 (A/m)/mm. Among the tested specimens, those containing severed strands or adjacent notches exhibited relatively high gradients and narrow abnormal-field widths, whereas the specimen containing three partially notched strands exhibited a broader, lower-gradient response.

3.3.1. Steel Core with Three Partially Notched Strands

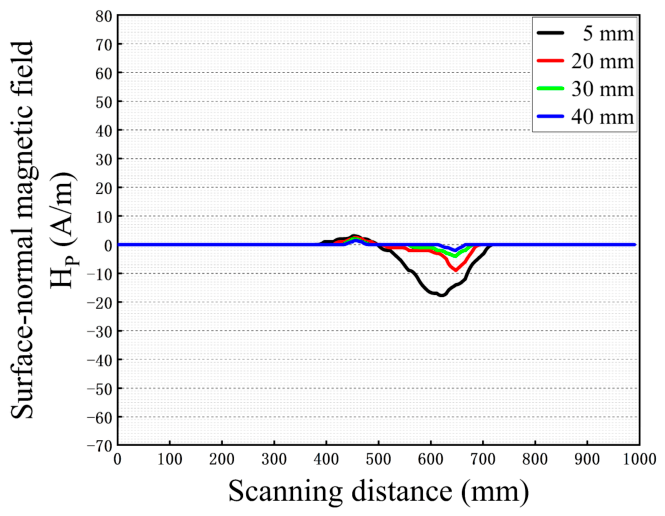
For the specimen with three partially notched strands, ΔHpp decreased from 18.7 A/m at 5 mm to 11.9, 6.6, and 4.4 A/m at 20, 30, and 40 mm, respectively (Figure 9). The corresponding losses were 36.6%, 64.7%, and 76.4%. The broad W20 of 142.7 mm and low Gmax of 0.49 (A/m)/mm quantify the distributed, slowly varying trough.
A waveform anomaly remained observable near the known defect region at 20 and 30 mm, but the amplitude and spatial contrast were substantially reduced. At 40 mm, the residual 4.4 A/m peak-to-peak response approached the processed baseline and became difficult to localize visually under the present conditions, limiting reliable localization.

3.3.2. Steel Core with One Severed Strand and One Partially Notched Strand

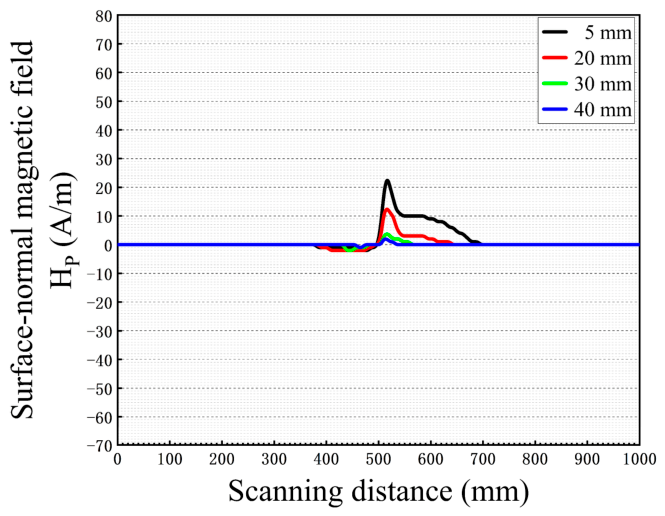
For one severed strand and one partially notched strand, ΔHpp decreased from 24.2 A/m at 5 mm to 15.2, 6.8, and 3.3 A/m at 20, 30, and 40 mm, corresponding to losses of 37.4%, 72.1%, and 86.4% (Figure 10). The 5 mm response exhibited a positive peak near the nominal defect region centered at xd = 500 mm.
Compared with the specimen containing three partially notched strands, this response had a higher gradient (1.68 (A/m)/mm) but a similarly broad low-amplitude tail. The tested specimen containing one severed and one partially notched strand exhibited a sharper local response than the specimen containing three partially notched strands.

3.3.3. Steel Core with Two Severed Strands and One Partially Notched Strand

For two severed strands and one partially notched strand, ΔHpp was 88.3 A/m at 5 mm and fell to 10.7, 7.6, and 3.5 A/m at 20, 30, and 40 mm (Figure 11). For this tested specimen, the losses of 87.9–96.0% indicate that the sharp bipolar response was particularly sensitive to increasing lift-off.
The 5 mm response combined a narrow W20 of 31.9 mm with the largest Gmax (7.54 (A/m)/mm), corresponding to a more spatially concentrated response under the 5 mm condition. At larger lift-off distances, the positive and negative extrema were smoothed into low-amplitude features near the baseline.

3.3.4. Steel Core with Two Severed Strands and Three Partially Notched Strands

For two severed strands and three partially notched strands, ΔHpp decreased from 74.2 A/m at 5 mm to 12.8, 7.6, and 3.9 A/m at 20, 30, and 40 mm (Figure 12), corresponding to losses of 82.8%, 89.8%, and 94.8%.
The tested specimen containing two severed strands and three partially notched strands exhibited a composite response with W20 = 52.1 mm and Gmax = 4.79 (A/m)/mm. These values were intermediate between those measured for the tested specimen with three partially notched strands and the tested specimen with two severed strands and one partially notched strand.

3.3.5. Steel Core with Two Adjacent Notches

The two-adjacent-notch specimen produced ΔHpp = 91.4 A/m, W20 = 38.9 mm, and Gmax = 7.22 (A/m)/mm at 5 mm (Figure 13). At 20, 30, and 40 mm, ΔHpp decreased to 12.2, 7.9, and 4.5 A/m, equivalent to losses of 86.7%, 91.3%, and 95.1%.
The rapid attenuation of the high-gradient peak–trough pair suggests that the response associated with the tested closely spaced notches was particularly sensitive to lift-off. At 40 mm, only 4.9% of the 5 mm peak-to-peak amplitude remained.

3.4. Magnetic Memory Testing Under Aluminum-Tube Covering

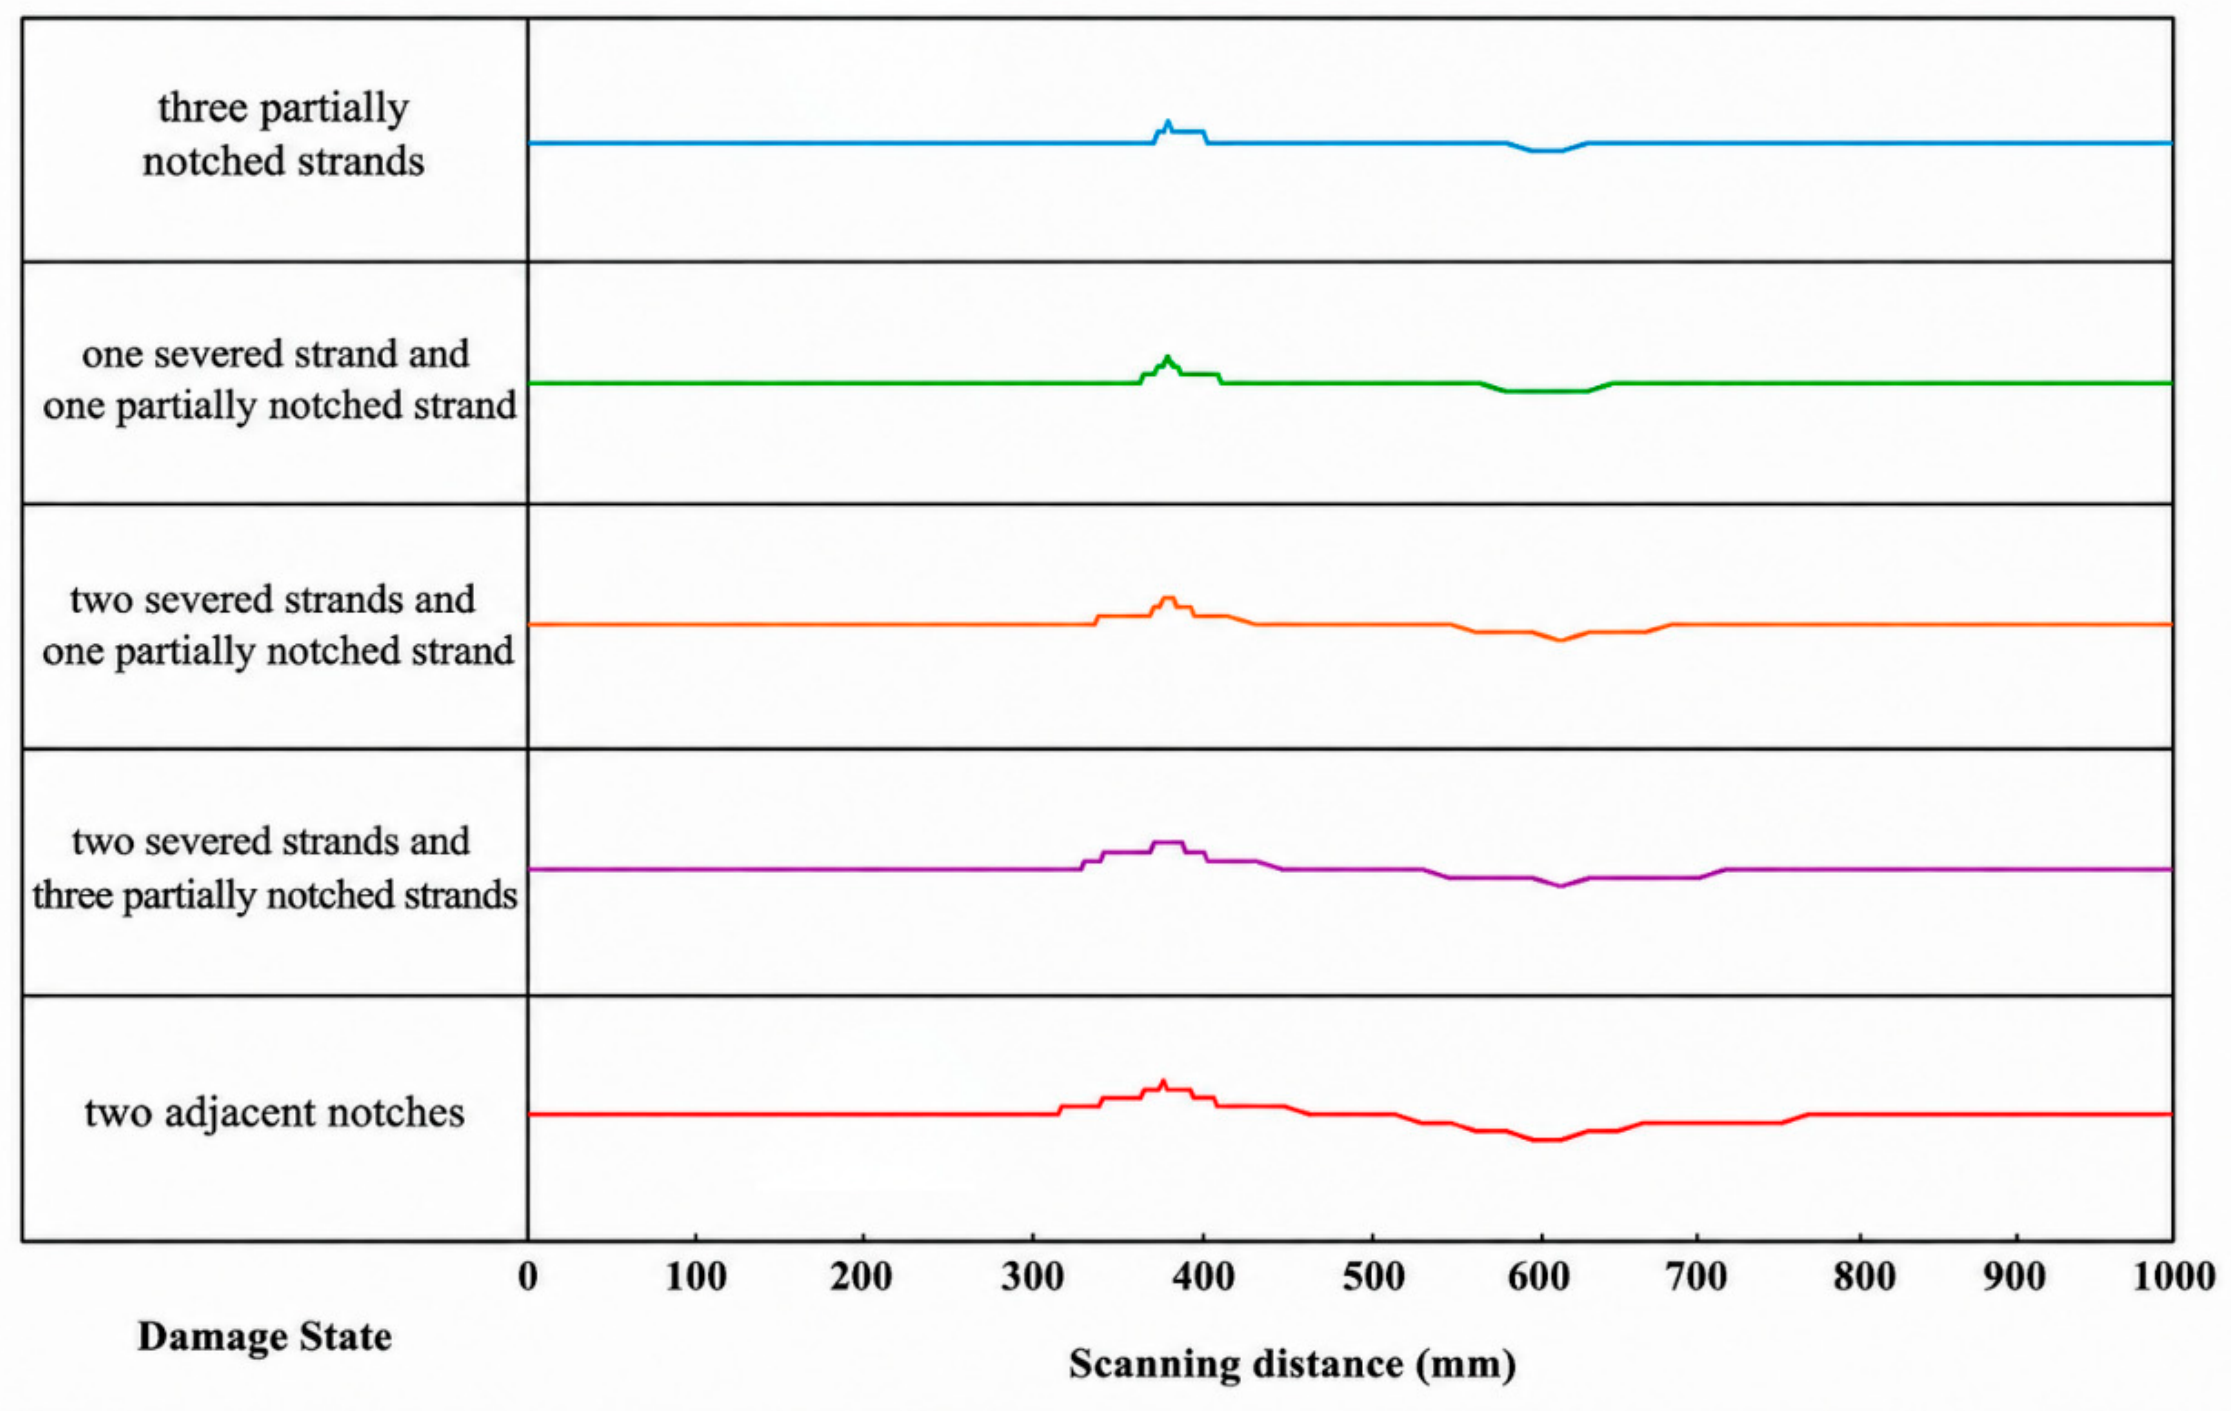
The aluminum-tube experiment evaluated whether defect-related anomalies remained observable through a non-ferromagnetic cover (Figure 14). The stacked traces were vertically offset for comparison.
Figure 14 shows the magnetic-memory responses of the five damaged specimens under the aluminum-tube covering condition. To quantify the influence of the covering, the maximum, minimum, and peak-to-peak amplitudes of each signal were extracted. The covered peak-to-peak amplitudes were 3, 4, 5, 5, and 7 A/m for the specimens with three partially notched strands, one severed strand and one partially notched strand, two severed strands and one partially notched strand, two severed strands and three partially notched strands, and two adjacent notches, respectively. The quantitative comparison between the uncovered and covered conditions is presented in Table 6.
As shown in Table 6, the aluminum-tube-covered specimens retained measurable defect-related magnetic anomalies, although the signal amplitudes were substantially reduced. The two-adjacent-notch specimen exhibited the largest covered peak-to-peak amplitude of 7 A/m, whereas the specimen with three partially notched strands exhibited the smallest value of 3 A/m. Relative to the uncovered 5 mm measurements, the amplitude-retention ratios ranged from 5.7% to 16.5%, corresponding to total attenuation rates of 83.5–94.3%. The mean attenuation was approximately 91.9%. Despite this substantial amplitude reduction, positive and negative anomaly features remained visible near the known artificial defect regions. This observation indicates that the measured Channel 1 responses were not completely eliminated under the tested covered configuration; it does not establish validated damage-detection capability.

4. Discussion

4.1. Main Laboratory Observations

This study examined normal-component magnetic-memory responses from five artificially damaged seven-strand steel-core specimens under a limited laboratory test matrix. Under the investigated conditions, the tested specimens exhibited different waveform amplitudes, spatial widths, gradients, and qualitative waveform characteristics. Increasing nominal lift-off substantially attenuated the measured signals, changing between two nominal orthogonal orientations altered polarity and amplitude, and measurable anomalies remained under the simplified aluminum-tube configuration. These observations represent condition-specific laboratory trends and should not be interpreted as validated damage-classification criteria.

4.2. Short-Term Repeatability and Statistical Scope

The coefficients of variation of ΔHpp ranged from 0.83% to 8.04% across three repeated repositioning scans. These values indicate short-term within-specimen amplitude stability under the controlled laboratory setup. They do not demonstrate specimen-to-specimen reproducibility because only one specimen represented each damage morphology. The repeated scans also cannot be treated as independent specimen-level observations for inferential comparisons. Accordingly, no hypothesis tests were performed among damage morphologies, and the observed differences are presented descriptively. The reported scan-to-scan variation characterizes short-term repeatability but does not constitute a complete measurement-uncertainty budget. A complete uncertainty analysis would additionally require quantified contributions from instrument calibration, electronic noise, lift-off variation, probe tilt, angular alignment, scanning-position error, baseline selection, and signal-processing parameters.
In addition, the intact specimen was not systematically included in the complete test matrix. Therefore, no damage threshold, false-alarm rate, ROC curve, or probability-of-detection relationship can be established from the current dataset.

4.3. Limitation of the Normal-Component Measurement

The present analysis was limited to the normal magnetic-field component Hp(y) measured by the centrally located Channel 1 sensor. Classical MMMT interpretation frequently considers the complementary behavior of tangential and normal magnetic components. The normal component was selected here because it provided consistently recorded extrema and bipolar or trough-like responses from which ΔHpp, W20, and Gmax could be extracted. Nevertheless, analysis of a single component reduces the available magnetic-field information and may increase sensitivity to probe orientation, background magnetization, and strand geometry. The present conclusions therefore apply only to the measured normal component. Future studies should evaluate simultaneous tangential, normal, and multi-axis measurements and determine whether feature fusion improves robustness and damage discrimination.

4.4. Orientation and Lift-Off Effects

Changing between the two nominal orthogonal orientations altered signal polarity and amplitude in a specimen-dependent manner. However, exact azimuths and local geomagnetic-field components were not measured. The results therefore do not establish a universally preferred scanning direction. They suggest only that orientation should be recorded and controlled in future validation studies.
Increasing nominal lift-off from 5 to 40 mm reduced peak-to-peak amplitude and smoothed localized waveform features for the tested specimens. The four investigated distances provide evidence of strong lift-off sensitivity under the present fixture conditions, but they do not define a universal maximum permissible lift-off. Additional tests involving smaller distance increments, probe tilt, fitting curvature, and direct lift-off measurement are required.

4.5. Simplified Aluminum-Tube Test and Engineering Positioning

The aluminum-tube experiment showed that measurable waveform anomalies remained under the tested generic conductive-cover configuration. However, the tube did not reproduce crimping deformation, residual stress, irregular contact, material temper, variable wall thickness, or steel-anchor geometry. Moreover, the covered configuration introduced a larger effective lift-off, and no matched uncovered lift-off control was available. The calculated attenuation therefore represents a combined configuration effect and cannot be attributed solely to aluminum covering.
MMMT should consequently be positioned as a potential preliminary screening approach rather than a stand-alone method for defect sizing or residual-strength assessment. Any suspicious region identified by MMMT would require confirmation using an established structural inspection method.

4.6. Environmental Effects, Measurement Limitations, and Future Validation

The present experiments were conducted under controlled laboratory conditions and did not reproduce the electromagnetic and mechanical environment of an energized transmission line. In practical operation, the measured magnetic field may be affected by conductor current and its temporal variation, neighboring phase conductors, steel towers and fittings, nearby ferromagnetic objects, probe motion, and geomagnetic variation. These factors may alter the signal baseline, polarity, amplitude, and signal-to-noise ratio. Therefore, the laboratory amplitudes reported in this study cannot be directly transferred to live-line inspection conditions. Future field investigations should record conductor current and three-axis background magnetic fields and should evaluate reference-sensor, differential, or gradiometric compensation methods.
The variation observed among the three repeated repositioning scans characterizes short-term within-specimen repeatability but does not constitute a complete measurement-uncertainty analysis. Potential uncertainty sources include instrument calibration, electronic noise, environmental magnetic-background variation, nominal lift-off uncertainty, spacer deformation, probe tilt, angular alignment, scanning-position error, baseline selection, and signal-processing parameters. Several of these contributions were not independently quantified during the original experiments. In addition, the sensitivity of the extracted features, particularly Gmax, to the Savitzky–Golay window length was not systematically evaluated. The reported feature values should therefore be interpreted as results obtained using the adopted third-order, 11-point filtering procedure rather than as processing-independent quantities.
The magnetic hysteresis behavior, permeability, coercivity, remanence, galvanized-coating thickness, and microstructural characteristics of the Grade 65 steel strands were not independently characterized. Consequently, differences among the measured responses cannot be attributed solely to artificial damage geometry. Furthermore, no coupled magneto-mechanical finite-element simulation or Jiles–Atherton-type constitutive analysis was performed. The discussion of domain-wall motion and magnetic-domain reorientation therefore provides a qualitative physical interpretation of the observed trends rather than a quantitative validation of a specific magneto-mechanical model.
A quantitative localization error was not reported because the tested damage configurations produced different dominant waveform patterns, including peaks, troughs, and bipolar responses, and a single morphology-independent localization marker was not predefined. A signal-to-noise ratio was also not calculated because independent noise-only measurements and a systematic intact-control background distribution were unavailable. These metrics should be established in future blinded validation studies using predefined localization and decision criteria.
The principal experimental limitations include the use of only one specimen for each damage morphology, artificial defects located at a single midpoint position, one tensile-preload history, measurements performed only after unloading, analysis of one magnetic-field component and one sensor channel, nominal rather than calibrated orientation control, incomplete intact-control data, and the use of a simplified aluminum tube rather than an actual crimped compression fitting. These limitations prevent the establishment of statistically validated detection thresholds, false-alarm rates, receiver operating characteristic curves, or probability-of-detection relationships. Future validation should include independently replicated intact and damaged specimens, naturally degraded conductors, multiple defect sizes and positions, measurements under both loaded and unloaded conditions, multi-component magnetic sensing, direct lift-off and orientation metrology, matched uncovered lift-off controls, actual compression fittings, environmental-interference testing, and blinded performance evaluation.

5. Conclusions

This study investigated the normal-component magnetic-memory responses of five artificially damaged seven-strand ACSR steel-core specimens under a limited set of controlled laboratory conditions. The three repeated repositioning scans indicated generally good short-term within-specimen amplitude repeatability, with coefficients of variation ranging from 0.83% to 8.04%. Because each damage morphology was represented by only one specimen, no conclusion regarding specimen-to-specimen reproducibility or population-level differences among damage morphologies can be drawn.
For the tested specimens, increasing nominal lift-off from 5 to 40 mm substantially reduced peak-to-peak amplitude and smoothed localized waveform features. Changing between the two tested nominal orthogonal orientations altered signal polarity and amplitude in a specimen-dependent manner. These observations suggest that lift-off and orientation should be recorded and controlled in future studies, but the present test matrix does not establish a universal preferred orientation or a maximum permissible field lift-off.
Measurable anomalies remained under the simplified aluminum-tube configuration. However, the experiment did not separate the effects of the conductive cover, increased effective lift-off, and geometric positioning. The aluminum tube should therefore not be regarded as equivalent to an actual crimped compression fitting.
Overall, the results provide preliminary laboratory evidence supporting further investigation of MMMT as a potential screening approach for hidden steel-core damage. The reported ΔHpp, W20, and Gmax values are specific to the tested specimens and should not be used as field detection thresholds. Validation requires independently replicated specimens, systematic intact controls, naturally damaged conductors, loaded-state measurements, multi-component sensing, environmental-interference testing, actual compression fittings, matched lift-off controls, and ROC or probability-of-detection analysis.

Author Contributions

Conceptualization, Y.T. and H.L.; methodology, H.S.; software, L.Z.; validation, Y.T., H.L. and H.S.; formal analysis, L.Z.; investigation, Y.T.; resources, H.L.; data curation, H.S.; writing—original draft preparation, Y.T.; writing—review and editing, H.L.; visualization, H.S.; supervision, L.Z.; project administration, Y.T.; funding acquisition, H.L. All authors have read and agreed to the published version of the manuscript.

Funding

This research was funded by the Science and Technology Project of State Grid Gansu Electric Power Company, entitled “Failure Mechanism and Improvement Measures for Cracking of Compression Fittings in Ultra-High-Voltage Transmission Lines” (Project No. 20310056Q2025000171).

Data Availability Statement

The raw and processed data supporting the findings of this study are available from the corresponding author upon reasonable request.

Conflicts of Interest

The authors declare that this study received funding from the Science and Technology Project of State Grid Gansu Electric Power Company. The funder was not involved in the study design, collection, analysis, interpretation of data, the writing of this article, or the decision to submit it for publication.

References

  1. Liu, Z.; Zhang, J.; Liu, J.; Li, Y.; Cheng, S.; Zhang, X. Development of mid-span tension joint and tension clamp for large-section energy-saving conductor in 1100 kV UHV DC transmission. J. Phys. Conf. Ser. 2021, 2033, 012118. [Google Scholar] [CrossRef] [Scilit]
  2. Rashmi; Shivashankar, G.S.; Poornima. Overview of different overhead transmission-line conductors. Mater. Today Proc. 2017, 4, 11318–11324. [Google Scholar] [CrossRef] [Scilit]
  3. Bao, S.; Jin, P.; Zhao, Z.; Fu, M. A review of the metal magnetic memory method. J. Nondestruct. Eval. 2020, 39, 11. [Google Scholar] [CrossRef] [Scilit]
  4. Dubov, A.A. A study of metal properties using the method of magnetic memory. Met. Sci. Heat Treat. 1997, 39, 401–405. [Google Scholar] [CrossRef] [Scilit]
  5. Dubov, A.A.; Kolokolnikov, S.M.; Baharin, M.N.; Yusof, M.F.M.; Roslin, N.M. Purpose and practical capabilities of the metal magnetic memory method. In Proceedings of the 2nd World Congress on Condition Monitoring, WCCM 2019; Lecture Notes in Mechanical Engineering; Springer: Berlin/Heidelberg, Germany, 2021; pp. 481–487. [Google Scholar] [CrossRef] [Scilit]
  6. Baigalimaa, T.; Tumendemberel, B.; Munkhtuya, T. Study of acceptance-criteria problems in the metal magnetic memory method of NDT. In Proceedings of the 8th International Forum on Strategic Technology (IFOST 2013), Ulaanbaatar, Mongolia, 28 June–1 July 2013; Volume 1, pp. 809–811. [Google Scholar] [CrossRef] [Scilit]
  7. Kuleev, V.G.; Dubov, A.A.; Lopatin, V.V. Nodal lines of normal components of scattered fields on surfaces of boiler pipelines with arbitrary positions of flawed areas with respect to an external magnetic field perpendicular to their axes. Russ. J. Nondestruct. Test. 2002, 38, 1–9. [Google Scholar] [CrossRef] [Scilit]
  8. Shi, P.; Jin, K.; Zheng, X. A magneto-mechanical model for the magnetic memory method. Int. J. Mech. Sci. 2017, 124–125, 229–241. [Google Scholar] [CrossRef] [Scilit]
  9. Shi, P.; Zheng, X. Magnetic charge model for three-dimensional MMM signals. Nondestruct. Test. Eval. 2016, 31, 45–60. [Google Scholar] [CrossRef] [Scilit]
  10. Wang, Z.D.; Yao, K.; Deng, B.; Ding, K.Q. Theoretical studies of the metal magnetic memory technique on magnetic flux leakage signals. NDT E Int. 2010, 43, 354–359. [Google Scholar] [CrossRef] [Scilit]
  11. Wang, Z.D.; Gu, Y.; Wang, Y.S. A review of three magnetic NDT technologies. J. Magn. Magn. Mater. 2012, 324, 382–388. [Google Scholar] [CrossRef] [Scilit]
  12. Yao, K.; Deng, B.; Wang, Z.D. Numerical studies of signal characteristics associated with the metal magnetic memory effect in plastically deformed samples. NDT E Int. 2012, 47, 7–17. [Google Scholar] [CrossRef] [Scilit]
  13. Roskosz, M. Metal magnetic memory testing of welded joints of ferritic and austenitic steels. NDT E Int. 2011, 44, 305–310. [Google Scholar] [CrossRef] [Scilit]
  14. Roskosz, M.; Gawrilenko, P. Analysis of changes in residual magnetic field in loaded notched samples. NDT E Int. 2008, 41, 570–576. [Google Scholar] [CrossRef] [Scilit]
  15. Yang, B.; Liu, Z.; Gao, Y. Research on three-dimensional magnetic memory signals induced by circular-hole defects. Magnetochemistry 2025, 11, 46. [Google Scholar] [CrossRef] [Scilit]
  16. Liu, X.; Fan, J. Research on nondestructive-testing technology for drilling risers based on magnetic memory and deep learning. Sustainability 2024, 16, 7389. [Google Scholar] [CrossRef] [Scilit]
  17. Dimova, G. Metal examination of welded joints of the main circulation pipeline in nuclear power plants using the metal magnetic memory method. C. R. Acad. Bulg. Sci. 2025, 78, 1438–1446. [Google Scholar] [CrossRef] [Scilit]
  18. Iben Brahim, Y.; Bellemare, J.; Rousseau, G.; Pouliot, N.; Ménard, D.; Sirois, F. Ultrasensitive lightweight magnetic probe for non-destructive inspection of high-voltage overhead lines. NDT E Int. 2023, 134, 102781. [Google Scholar] [CrossRef] [Scilit]
  19. Liao, C.; Yi, Y.; Chen, T.; Cai, C.; Deng, Z.; Song, X.; Lv, C. Detecting broken strands in transmission lines based on pulsed eddy current. Metals 2022, 12, 1014. [Google Scholar] [CrossRef] [Scilit]
Figure 1. Schematic diagram of magnetic-domain reorientation.
Ndt 04 00025 g001
Figure 2. Components of magnetic memory signals.
Ndt 04 00025 g002
Figure 3. Overall laboratory workflow for characterizing magnetic-memory responses of artificially damaged steel-core specimens.
Ndt 04 00025 g003
Figure 4. Artificially designed defect types of steel-core specimens: (a) intact specimen; (b) three partially notched strands; (c) one severed strand and one partially notched strand; (d) two severed strands and one partially notched strand; (e) two severed strands and three partially notched strands; and (f) two adjacent notches.
Ndt 04 00025 g004
Figure 5. Components of the magnetic-memory testing system: (a) TSC-1M-4 magnetic-memory detector; (b) schematic of the Type-I scanning device: (1) housing; (2) Type-I ferromagnetic sensor; (3) wheel; (4) perforated wheel; (5) photoelectric sensor; and (6) motion-linkage mechanism. Channel 1, located at the center of the scanning head, was used in the present study.
Ndt 04 00025 g005
Figure 6. Molds used to simulate different lift-off distances and the aluminum-tube covering condition: (a) 20 mm cardboard spacer; (b) 30 mm cardboard spacer; (c) 40 mm arched cardboard mold; (d) aluminum tube with an outer diameter of 30 mm and a wall thickness of 1.25 mm.
Ndt 04 00025 g006
Figure 7. Results of three repeated repositioning scans of each damaged specimen: (a) three partially notched strands; (b) one severed strand and one partially notched strand; (c) two severed strands and one partially notched strand; (d) two severed strands and three partially notched strands; and (e) two adjacent notches.
Ndt 04 00025 g007
Figure 8. Magnetic-memory testing results and amplitude comparison under different scanning orientations: (a) north–south direction; (b) east–west direction; (c) signal amplitude in the north–south direction; (d) signal amplitude in the east–west direction.
Ndt 04 00025 g008
Figure 9. Magnetic-memory testing results of the steel core with three partially notched strands under different lift-off distances.
Ndt 04 00025 g009
Figure 10. Magnetic-memory testing results of the steel core with one severed strand and one partially notched strand under different lift-off distances.
Ndt 04 00025 g010
Figure 11. Magnetic-memory testing results of the steel core with two severed strands and one partially notched strand under different lift-off distances.
Ndt 04 00025 g011
Figure 12. Magnetic-memory testing results of the steel core with two severed strands and three partially notched strands under different lift-off distances.
Ndt 04 00025 g012
Figure 13. Magnetic-memory testing results of the steel core with two adjacent notches under different lift-off distances.
Ndt 04 00025 g013
Figure 14. Magnetic-memory responses of the five artificially damaged steel-core specimens under the aluminum-tube-covered configuration. The traces were vertically offset only for visualization.
Ndt 04 00025 g014
Table 1. Quantitative magnetic-memory features used in the revised analysis.
FeatureDefinitionFeature Interpretation
Hp,max; Hp,minMaximum and minimum Hp(y) in the analysis window (A/m)Signal polarity and extreme response
ΔHppHp,maxHp,min (A/m)Overall anomaly amplitude
W20Width where |Hp − baseline| ≥ 0.2 max|Hp − baseline| (mm)Spatial extent of the abnormal field
Gmaxmax|dHp/dx| [(A/m)/mm]Local waveform sharpness
CVΔHpp100·SD(ΔHpp)/mean(ΔHpp) (%)Amplitude repeatability
Table 2. Quantitative short-term within-specimen repeatability indices obtained from three repeated repositioning scans of each damaged specimen.
Damage StateMean ΔHppSDCVMax Rel. Dev.
Three partially notched strands21.100.190.891.03
One severed strand and one partially notched strand28.962.338.049.26
Two severed strands and one partially notched strand97.622.452.512.83
Two severed strands and three partially notched strands81.850.680.830.95
Two adjacent notches105.093.823.644.18
ΔHpp and SD are in A/m; CV and maximum relative deviation are in %.
Table 3. Orientation-dependent extrema and peak-to-peak amplitudes.
Damage StateN–S MaxN–S MinN–S ΔHppE–W MaxE–W MinE–W ΔHppΔ(N–S/E–W)
Three partially notched strands2−793−1821−57.1
One Severed Strand and One Partially Notched Strand32−63825−227+40.7
Two Severed Strands and One Partially Notched Strand47−509752−4092+5.4
Two Severed Strands and Three Partially Notched Strands66−87465−1782−9.8
Two Adjacent Notches55−449946−61107−7.5
Magnetic-field values are in A/m; the final column is 100(ΔHpp, N–S − ΔHpp, E–W)/ΔHpp, E–W.
Table 4. Quantitative descriptors of the 5 mm lift-off scans.
Damage StateHp,maxHp,minΔHppW20Gmax
Three Partially Notched Strands4.37−14.3118.68142.70.49
One Severed Strand and One Partially Notched Strand22.35−1.8824.23144.31.68
Two Severed Strands and One Partially Notched Strand49.60−38.7188.3131.97.54
Two Severed Strands and Three Partially Notched Strands61.00−13.2174.2252.14.79
Two Adjacent Notches40.31−51.0891.3938.97.22
Hp,max, Hp,min, and ΔHpp are in A/m; W20 are in mm; Gmax is in (A/m)/mm.
Table 5. Peak-to-peak amplitude attenuation with increasing nominal lift-off distance.
Damage State5 mm20 mmAmplitude Loss (%)30 mmAmplitude Loss (%)40 mmAmplitude Loss (%)
Three Partially Notched Strands18.711.936.66.664.74.476.4
One Severed Strand and One Partially Notched Strand24.215.237.46.872.13.386.4
Two Severed Strands and One Partially Notched Strand88.310.787.97.691.43.596.0
Two Severed Strands and Three Partially Notched Strands74.212.882.87.689.83.994.8
Two Adjacent Notches91.412.286.77.991.34.595.1
Descriptive mean across the five tested specimens59.312.666.37.381.94.089.8
Peak-to-peak amplitudes are in A/m; loss is relative to the 5 mm value for the same specimen (%). The descriptive mean summarizes the five tested damaged specimens and does not represent a population estimate.
Table 6. Comparison of the peak-to-peak amplitudes measured under uncovered and aluminum-tube-covered conditions.
Damage StateUncovered, Nominal 5 mm Condition
ΔHpp
Aluminum-Tube-Covered Configuration
ΔHpp
Overall Amplitude Retention
R c (%)
Combined Attenuation
η c
Three Partially Notched Strands18.683.0016.1%83.9%
One Severed Strand and One Partially Notched Strand24.234.0016.5%83.5%
Two Severed Strands and One Partially Notched Strand88.315.005.7%94.3%
Two Severed Strands and Three Partially Notched Strands74.225.006.7%93.3%
Two Adjacent Notches91.397.007.7%92.3%
Rc = (ΔHpp, covered/ΔHpp, uncovered) × 100%; ηc = [1 − (ΔHpp, covered/ΔHpp, uncovered)] × 100%. The reported attenuation includes the combined effects of the aluminum tube, increased effective lift-off, and geometric positioning. It should not be interpreted as the attenuation caused solely by the aluminum material.
Disclaimer/Publisher’s Note: The statements, opinions and data contained in all publications are solely those of the individual author(s) and contributor(s) and not of MDPI and/or the editor(s). MDPI and/or the editor(s) disclaim responsibility for any injury to people or property resulting from any ideas, methods, instructions or products referred to in the content.