Technical Note

Electrical Resistivity as a Non-Destructive Technique for Fatigue Damage Detection in Aluminium Alloy 6082


by
Viththagan Vivekanandam
*,
Shubham Sanjay Joshi
,
Ebad Bagherpour
and
Zhongyun Fan
Brunel Centre for Advanced Solidification Technology (BCAST), Brunel University of London, Uxbridge UB8 3PH, UK
*
Author to whom correspondence should be addressed.
Submission received: 30 June 2026 / Revised: 7 August 2026 / Accepted: 7 August 2026 / Published: 9 August 2026
(This article belongs to the Special Issue NDT for Digital Transformation, Diagnostics, and Preservation)

Abstract

Metals are widely used in various types of structural applications such as the automotive, aerospace and construction industries. However, their service life is limited due to the various loads they experience during operation. Specifically, cyclic loading can lead to the early fatigue failure of these structures. Therefore, early detection of fatigue deformation is essential to prevent catastrophic failures. In this study, an automated electrical resistance data acquisition system was developed using LabVIEW to obtain measurements from a Keithley 6221 current source for fatigue damage detection. The results showed an increase in electrical resistivity after the application of cyclic loading. It was observed that electrical resistivity increased after each set of loading cycles, with an average increase of 7.38%, a stress level of 260 MPa (high-cycle fatigue), and a 6.5% increase after the application of 25,000 cycles at 165 MPa (low-cycle fatigue). Scanning Transmission Electron Microscopy (S/TEM) was used for microstructural investigation as a proof of concept for the high-cycle fatigue sample interrupted after 25,000 cycles to analyse the modification in dislocation structures as well as a qualitative increment in the dislocation density with respect to the initial microstructural state of the as-machined sample. Such a modification in dislocation structures as well as an increment in dislocation density corroborates the findings proposed by electrical resistivity measurement. The results demonstrated that electrical resistivity measurement provides a promising non-destructive approach for the early detection of fatigue damage in metallic materials.

1. Introduction

Metals have been widely used for load bearing structural components in industries such as automotive, marine and aerospace construction due to their specific mechanical properties [1,2,3,4,5]. These structures are designed to withstand various types of loading; however, their service life is limited due to the nature of the loading. Fatigue damage accumulation is a crucial factor in structures subjected to cyclic loading and will eventually lead to failure if not detected [3,4,5,6]. Detecting fatigue deformation is challenging, as monitoring the fatigue deformation during its service is often difficult. Microstructural characterisation can be one of the methods to investigate the fatigue deformation [7,8,9,10,11,12,13,14]. However, this investigation generally requires destructive material testing. Therefore, non-destructive test (NDT) methods could provide a suitable solution for detecting fatigue deformation which could eventually prevent structural failures [15,16,17,18,19].
Among the available non-destructive techniques, electrical resistivity measurement has attracted considerable attention because it is highly sensitive to microstructural evolution associated with plastic deformation and fatigue damage [20,21,22,23]. Conventional resistance-based fatigue measurements often depend on manual data acquisition and are time consuming. An automated data acquisition system consumes less time, provides large data collection and improves repeatability.
Electrical resistivity (ρ) is a material property that quantifies how strongly a material opposes the flow of electric current. It is mathematically defined as
ρ = R A L
where R is the electrical resistance, A is the cross-sectional area of the conductor and L is the length through which current flows.
Plastic deformation disrupts the crystal structure and generates defects including dislocations, slip bands, voids and microcracks. These imperfections interfere with the free flow of electrons, leading to an increase in the resistance and consequently the resistivity of the material [20].
Nobile et al. used a four-probe electrical resistance measurement technique and observed a rapid increase in electrical resistance in real time when carbon steel samples reached 30% of the fatigue life [21]. The four-probe measurement technique is commonly used in electrical resistivity investigations because it minimises the influence of contact resistance and enables accurate determination of the intrinsic resistance of the specimen [21].
Saberi et al. measured the electrical resistivity of several alloys, including aluminium 6062, in situ during plastic deformation, and reported that the plastic deformation has a significant influence on all the investigated alloys [22]. Sauer et al. investigated the resistance-based fatigue damage of steels and observed that electrical resistance can serve as a damage indicator, as it increases during fatigue due to microstructural changes [24]. Sun et al. observed that the microstructural defects increase the resistivity and reported that the resistance measurements are sensitive to fatigue damage [23].
This work presents the development of an automated electrical resistance data acquisition system using Keithley instruments integrated with LabVIEW software, based on the four-probe resistance measurement technique to detect fatigue deformation. The system integrates a Keithley 6221 AC/DC current source and a Keithley 2182A nanovoltmeter through a LabVIEW-based control interface. It enables automatic acquisition of continuous, high-resolution and repeatable electrical resistance measurements with minimal operator intervention. Compared with conventional resistance measurements methods, the proposed approach provides efficient and long-duration data acquisition. The sensitivity of electrical resistance to fatigue induced microstructural evolution enables the proposed system to detect damage accumulation at an early stage, prior to macroscopic failure. Additionally, Scanning Transmission Electron Microscopy (S/TEM) was used to validate the results through microstructural characterisation.

2. Materials and Methods

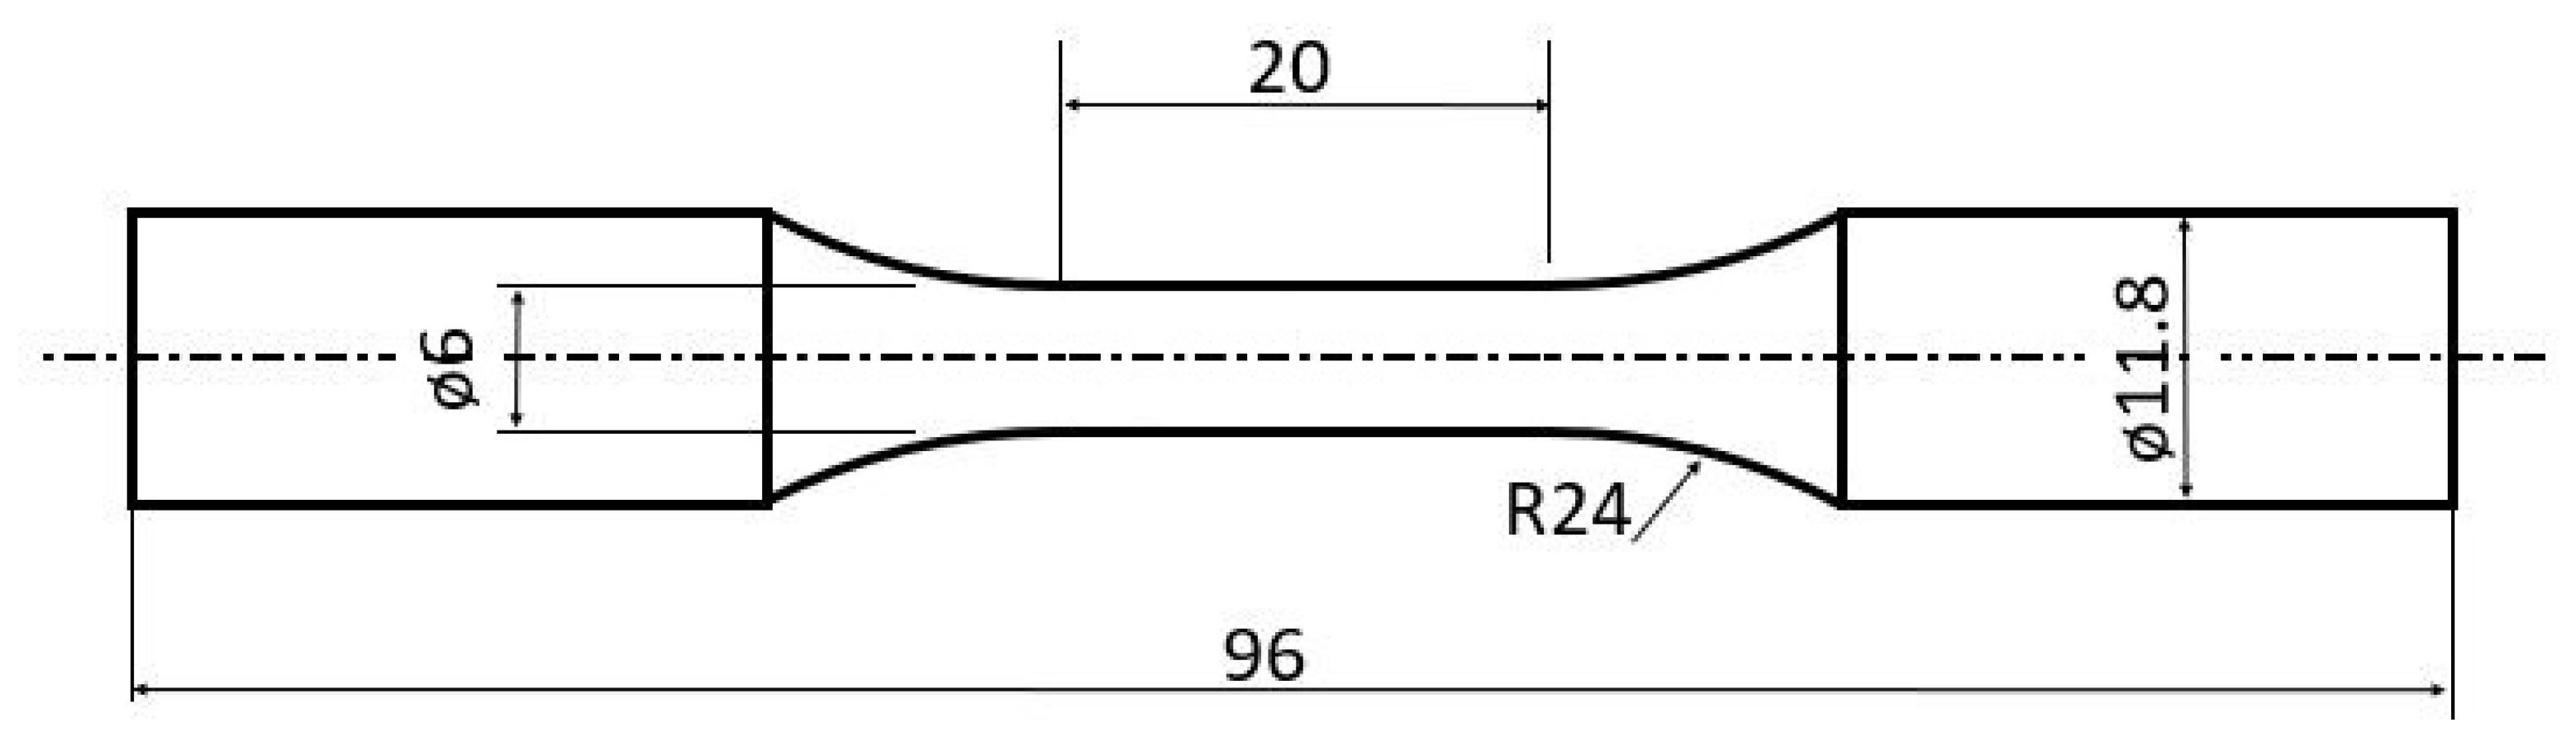
Aluminium 6082 alloy used in this study was commercially obtained in an as-extruded form in T6-treated cylindrical bars with a diameter of 20 mm. The tested yield stress of the material is 308 ± 2 MPa. The bars were then machined into fatigue test samples of 6 mm gauge diameter and 20 mm gauge length. The fatigue tests were conducted in accordance with ASTM E466. The dimensions of the sample are presented in Figure 1.

2.1. Fatigue Tests

Low-cycle fatigue (LCF) and high-cycle fatigue (HCF) tests were conducted to investigate the electrical resistivity to assess their sensitivity to deformation and dislocations induced by cyclic loading. The LCF [25] and HCF [26] tests were conducted in steps to evaluate the microstructural changes, while the present study investigated the electrical resistivity evolution in steps. The samples were tested using the Instron 8801 fatigue machine (Instron, Norwood, MA, USA) with a load capacity of 100 kN.

2.1.1. Low-Cycle Fatigue Tests

This test consists of two samples (Sample 1 and 2), which were subjected to a stress level of 260 MPa with a stress ratio of −1 and a frequency of 15 Hz. The tests were paused after total cycle counts of 100, 300, 800 and, 1800 and the electrical resistance was measured at each pause.

2.1.2. High-Cycle Fatigue Tests

The second fatigue test was conducted on a single sample (Sample 3) subjected to a stress level of 165 MPa with a stress ratio of −1 and a frequency of 15 Hz. The fatigue life of the sample at 165 MPa was 192,851 cycles. The electrical resistance measurement was taken after the application of 25,000 cycles. The microstructure of the sample was then investigated using Thermo Scientific Talos F200i S-FEG S/TEM (Thermo Fisher Scientific/FEI, Eindhoven, The Netherlands) to analyse the deformation induced by the application of cyclic loading.

2.2. Electrical Resistivity and Data Acquisition

2.2.1. Keithley 6221 and 2182A

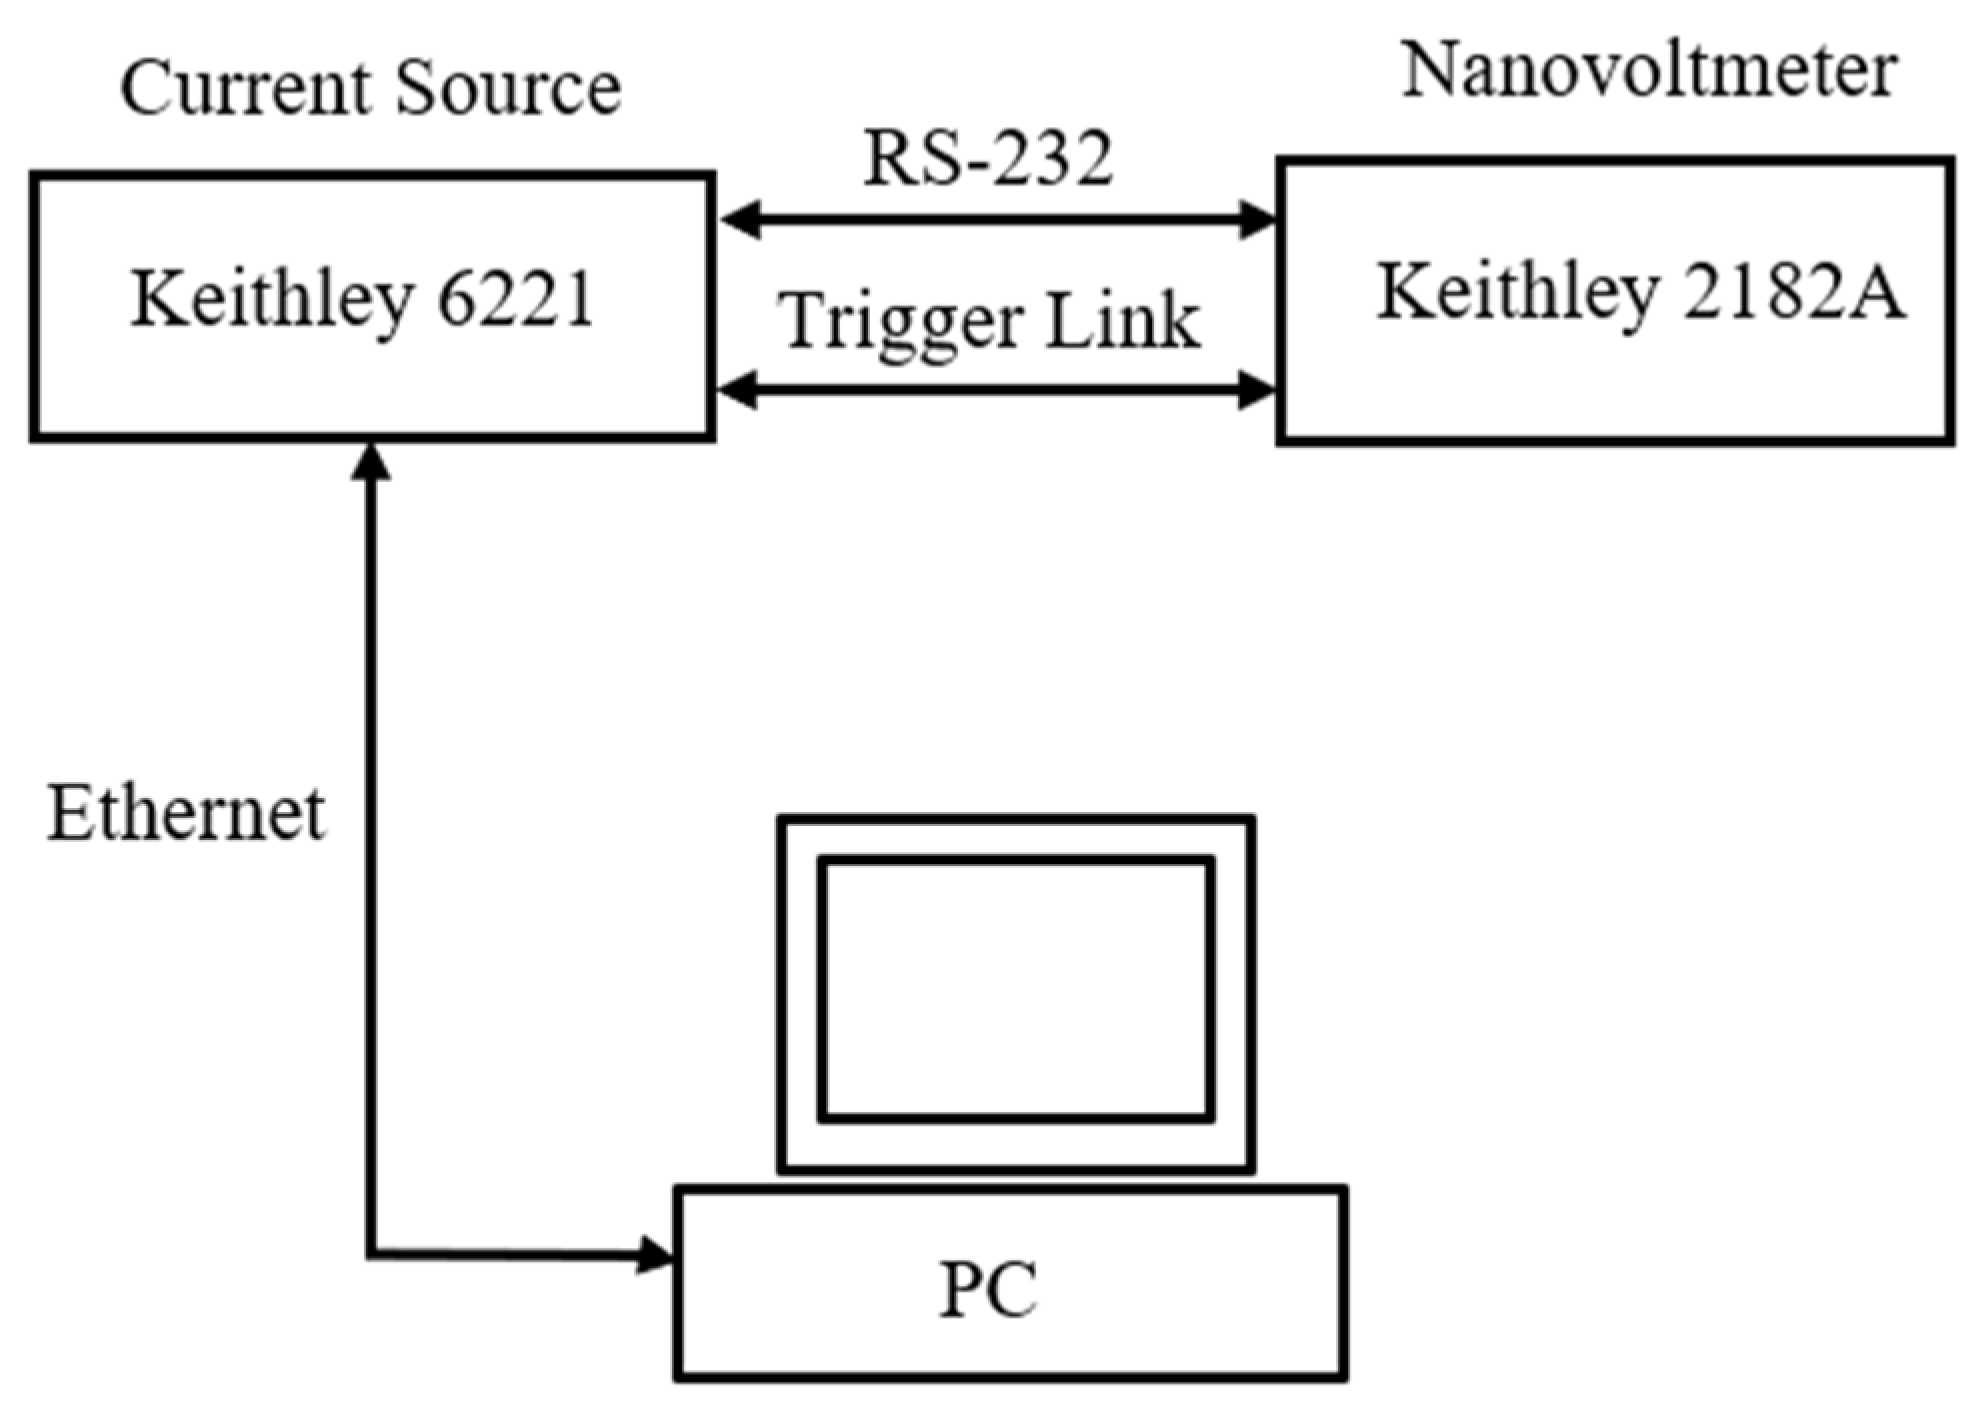
The Keithley 6221 (Keithley, Solon, OH, USA) is a precision current source designed for applications requiring high stable current output with low current noise. The instrument provides multiple communication interfaces including RS-232, Trigger Link, digital input/output (I/O), GPIB (General Purpose Interface Bus), and Ethernet. It has an internal memory capable of temporarily storing up to 65,000 data points. The Keithley 2182A is a two-channel high-definition nanovoltmeter designed for low-voltage measurements. In this study, the Keithley 6221 and 2182A were connected and operated via the RS-232 interface and Trigger Link, which synchronises the current source with the nanovoltmeter [27].

2.2.2. Delta Mode

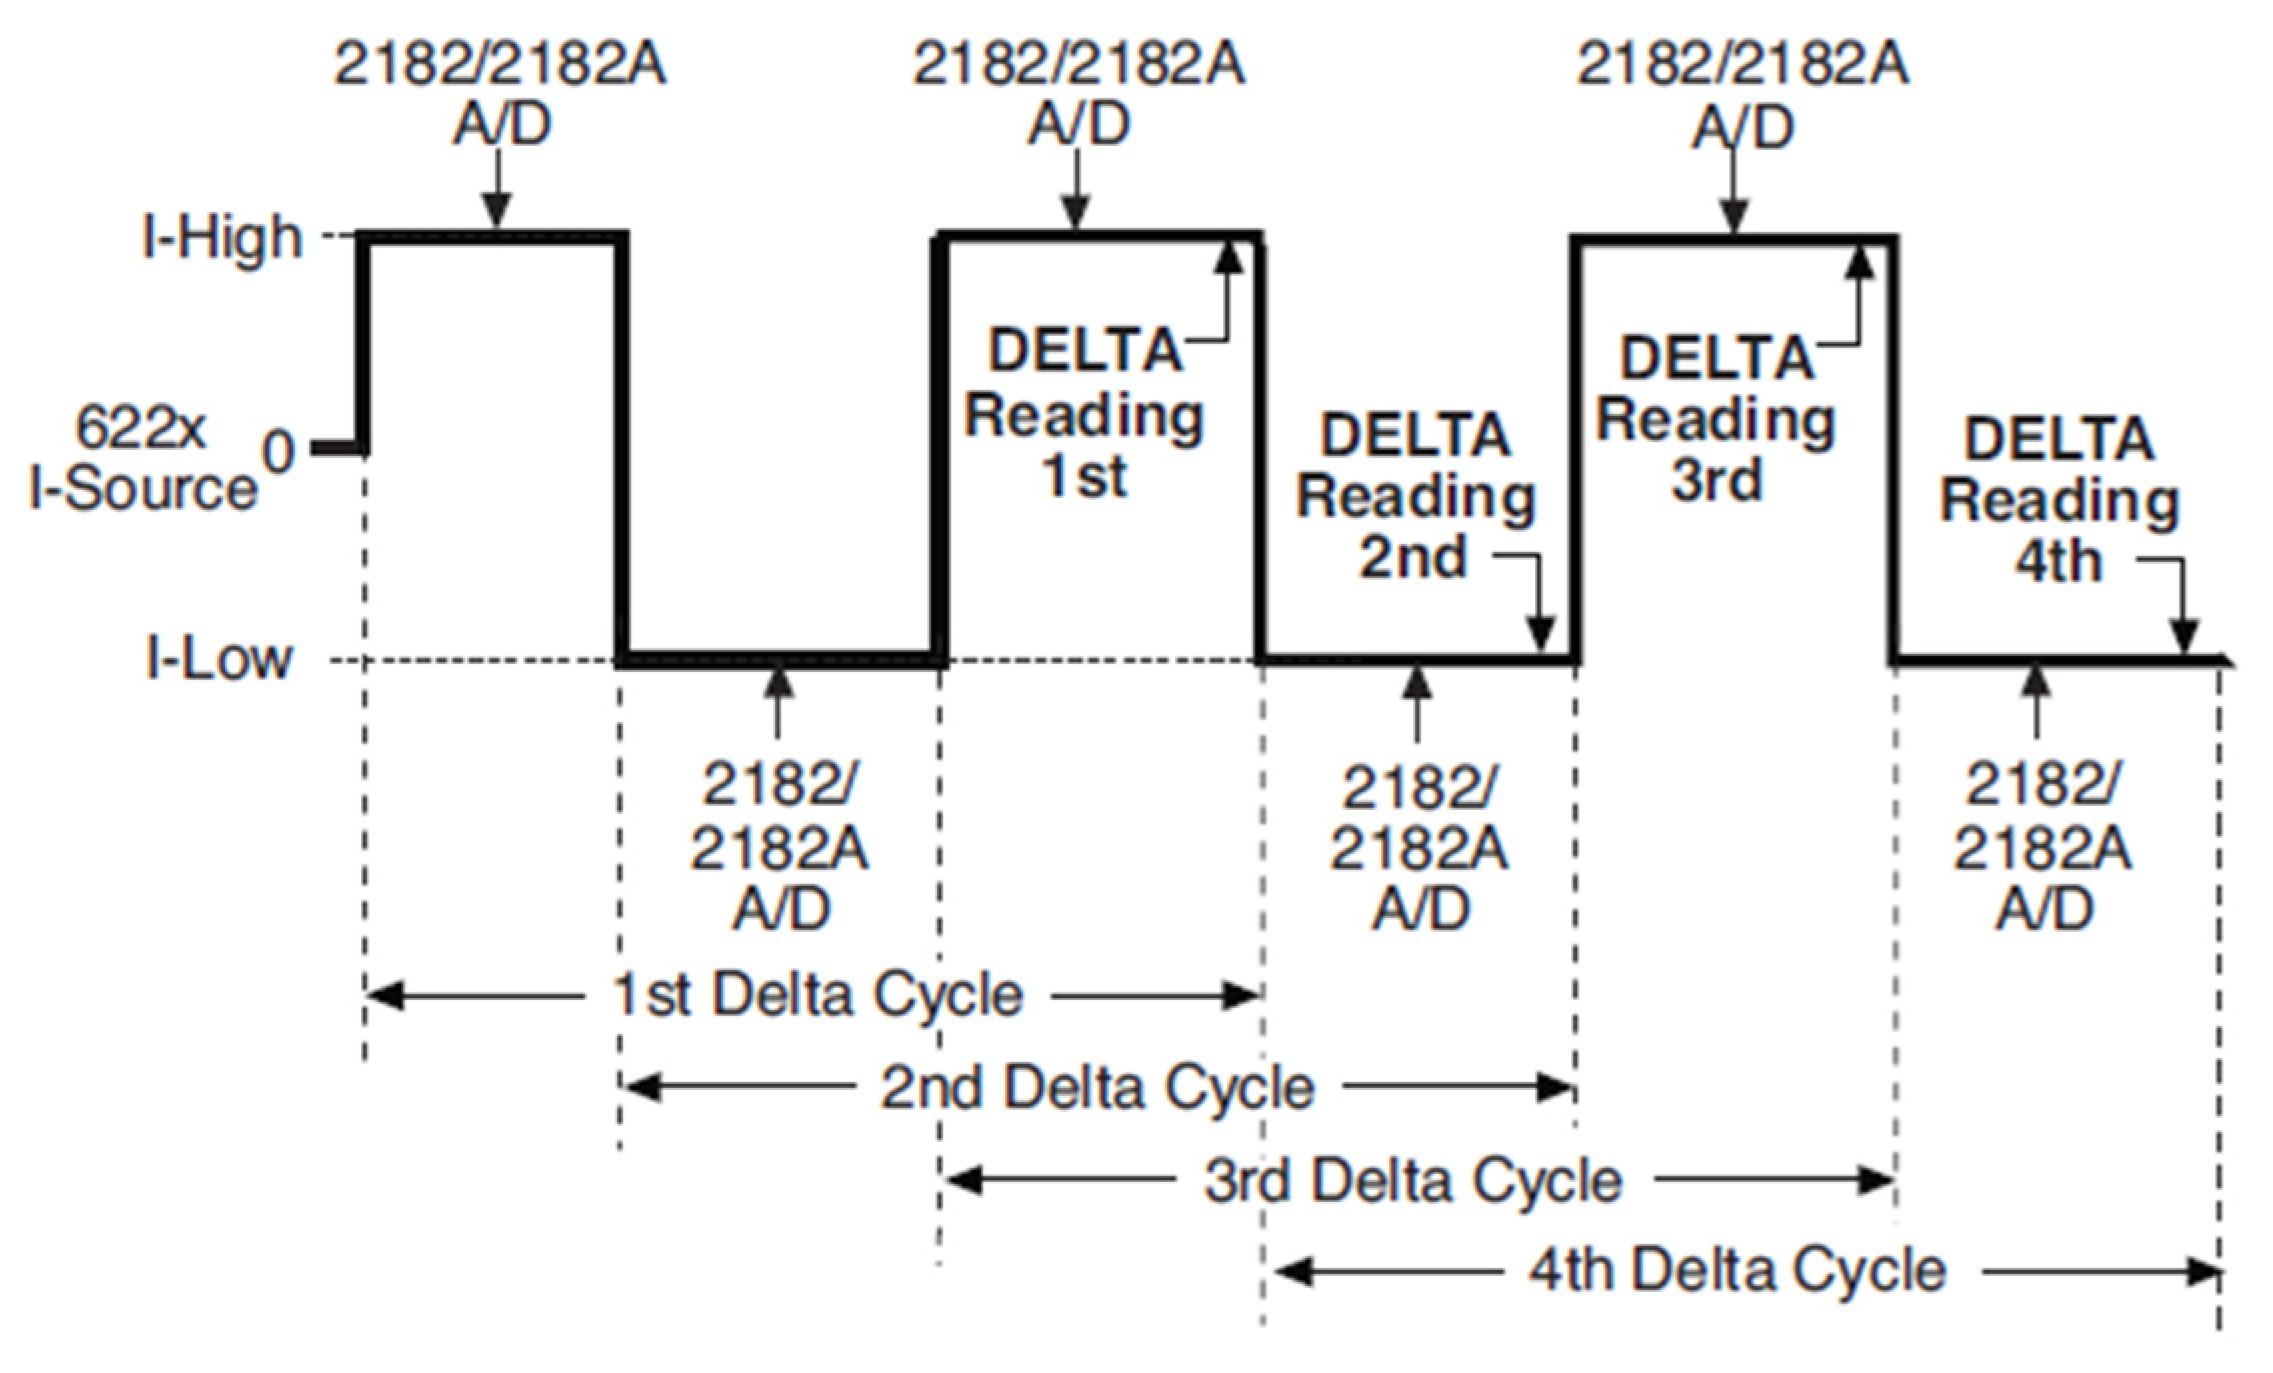
The Keithley 6221 provides a square-wave current output, alternating between positive and negative current levels, a high current +1 mA and a low current −1 mA. The Keithley 2182A performs analogue-to-digital (A/D) conversion measurements at each high and low output level. The resistance value is calculated from the measured voltage difference between the positive and negative current output according to Equation (2).
R = V + I − V − I 2 I
where R is the electrical resistivity of the specimen, V+I is the measured voltage when positive current is applied, V−I is the measured voltage when the current polarity is reversed and I is the magnitude of the applied current.
A three-point moving average algorithm is used to calculate Delta readings. As shown in Figure 2, the first three A/D conversions from Keithley 2182A yield the initial Delta reading. Each subsequent A/D conversion then produces a single Delta reading, with each Delta reading calculated using the three preceding A/D measurements [27]. This averaging approach reduces the measurement noise while maintaining a high acquisition rate, making a Delta mode suitable for continuous monitoring of small resistance changes during fatigue testing.
The system was configured to enable communication between the PC and the Keithley 6221 via the Ethernet interface using a LAN cable. The schematic diagram illustrates the connections between Keithley 6221, 2182A, and the PC is shown in Figure 3.
LabVIEW (2024 Q3) software was installed on the PC along with National Instrument (NI) components, including NI MAX (Measurement and Automation Explorer). The connection between the Keithley 6221 and the PC was established via an Ethernet cable.
The communication settings are:
The instrument and computer IP: 169.254.216.130;
Subnet mask: 255.255.0.0.
The instrument’s IP address was configured with the PC’s network settings to establish communication. A TCP/IP (Transmission Control Protocol/Internet Protocol) resource was then created in NI MAX under Devices and Interfaces. The TCP/IP resource serves as the standard communication protocol used by computers and instruments to exchange data, enabling communication with the Keithley instrument via Ethernet (LAN). Once communication is established, the resource appears as a VISA (Virtual Instrument Software Architecture) resource name within the LabVIEW data acquisition program.

2.2.3. Data Acquisition Using LabVIEW Software

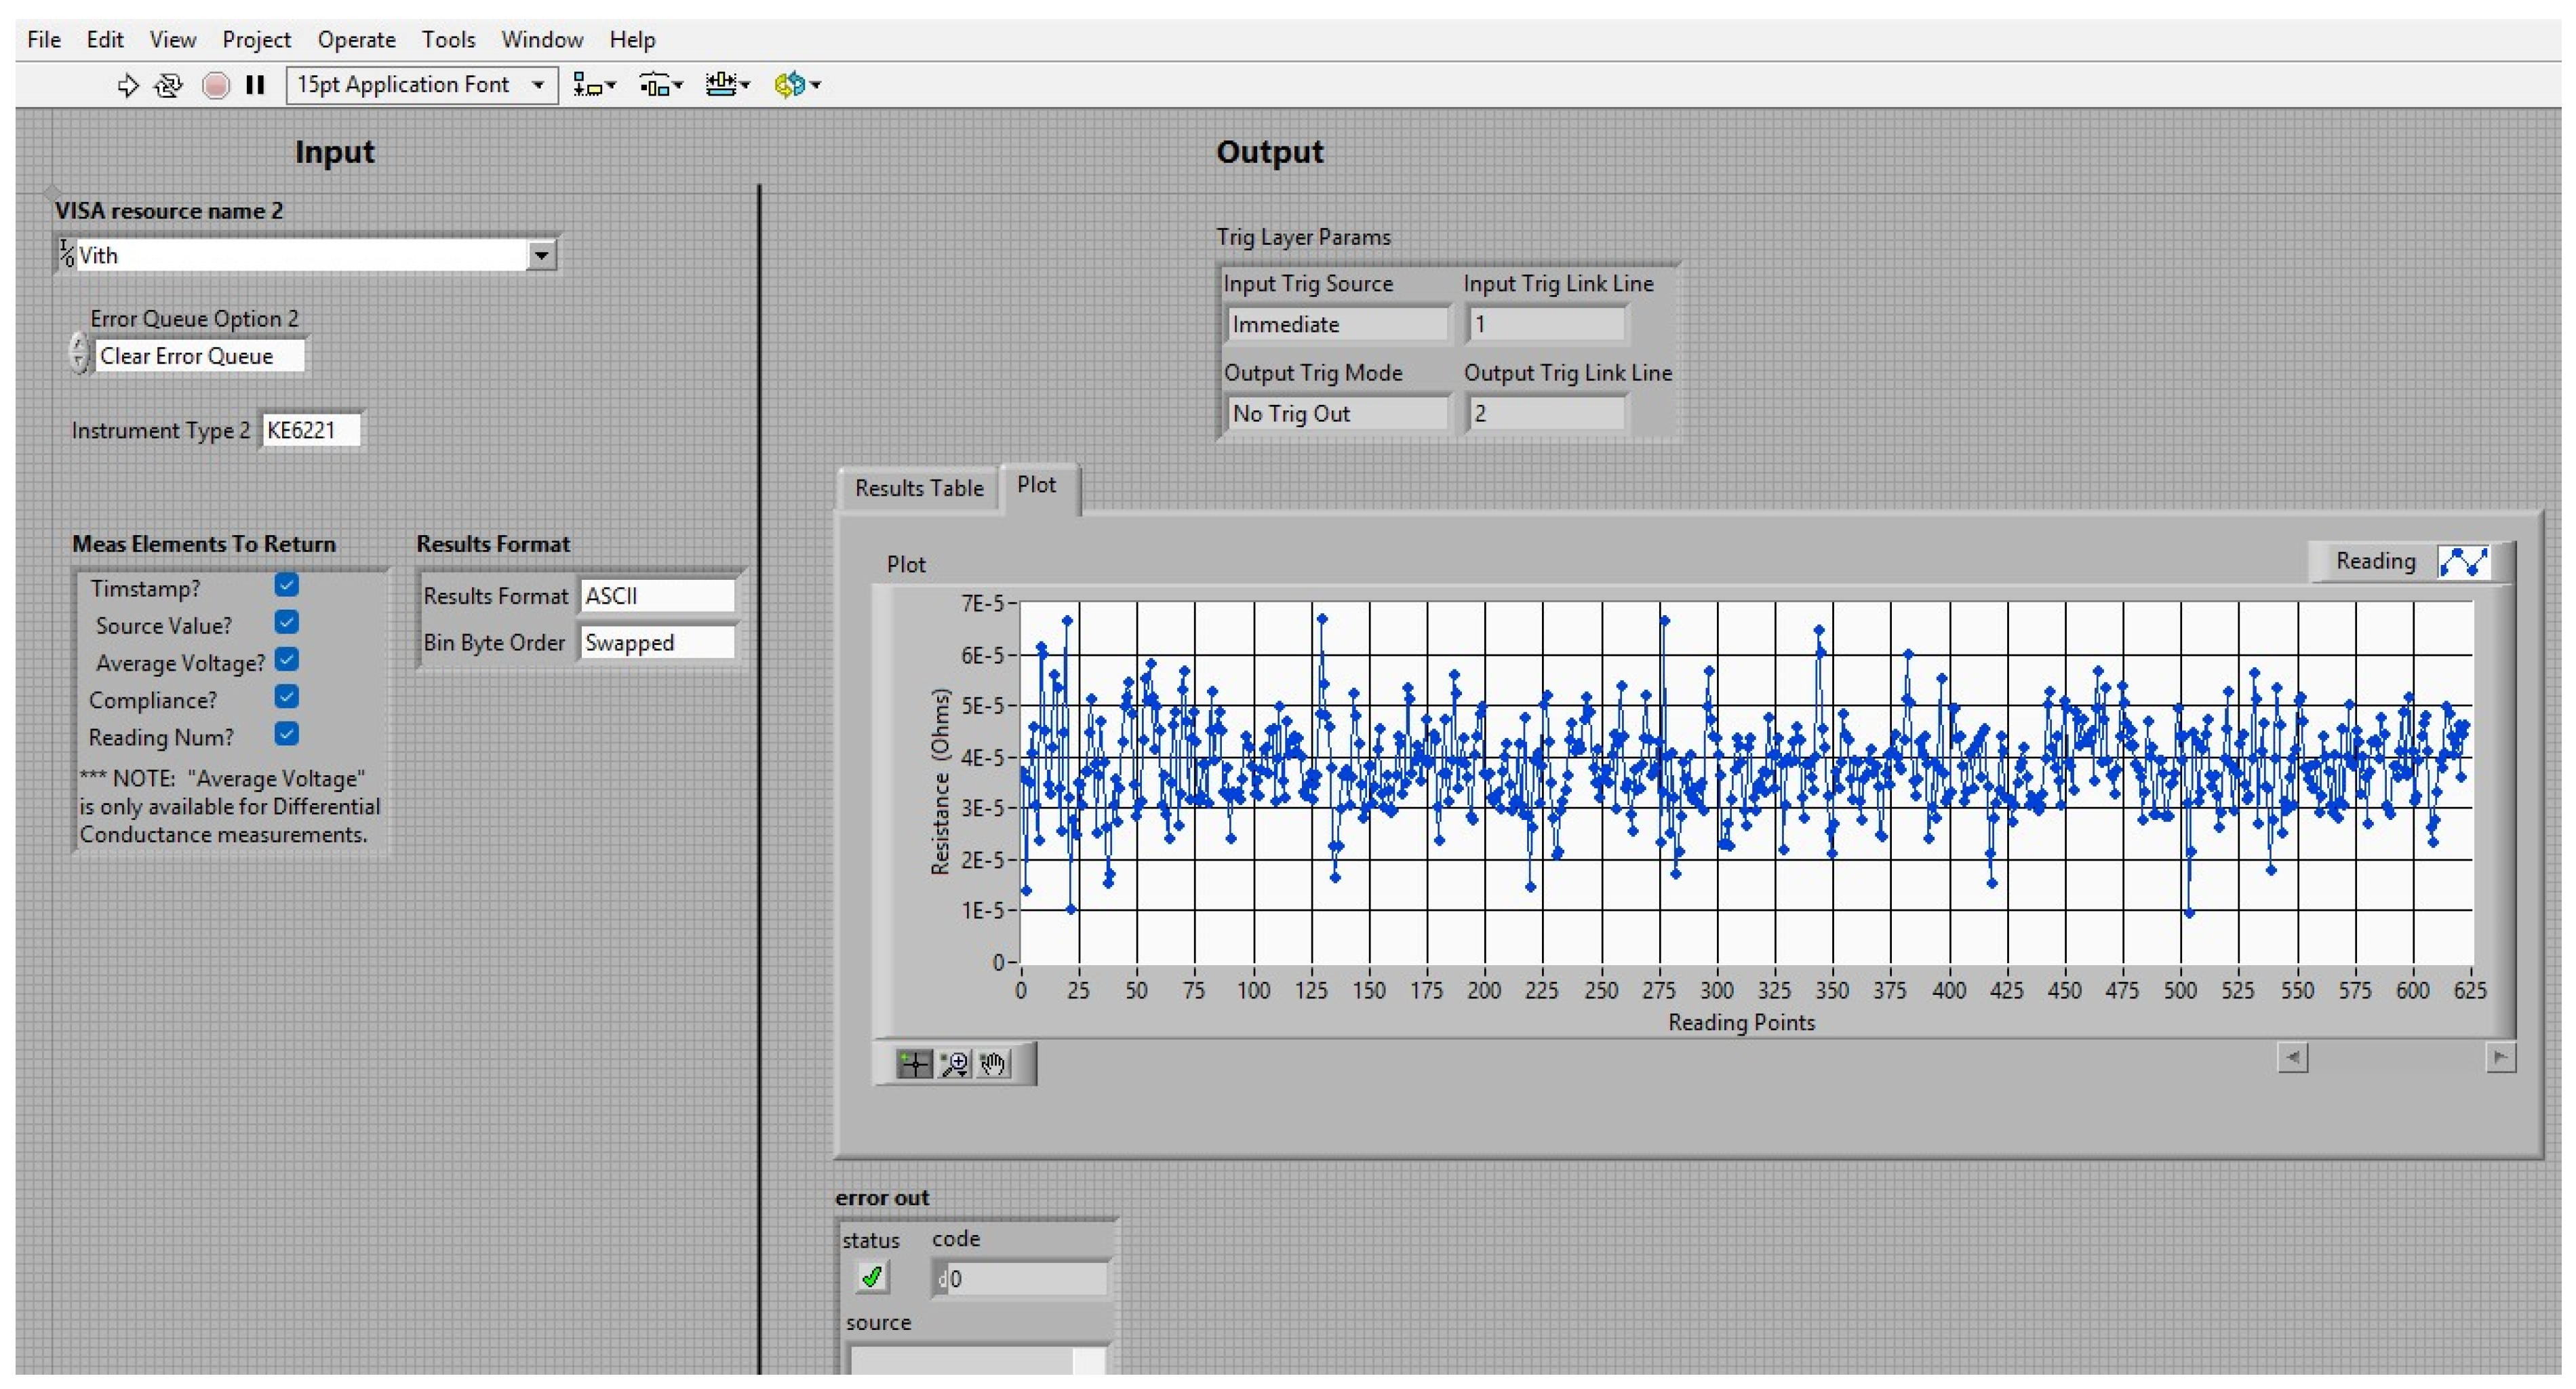
A data acquisition program was developed in LabVIEW to acquire resistance measurements from the Keithley 6221. When connected to a sample and operated in Delta mode, the Keithley 6221 temporarily stores the measured resistance values in its internal memory. Upon pressing the “Run” button in the LabVIEW interface, the program communicates with the instrument, stops further measurements, and transfers all stored values to the acquisition program. For each sample, 600 resistance measurements were collected to ensure consistency. The electrical resistivity was subsequently calculated using Equation (1).

2.2.4. Experimental Setup

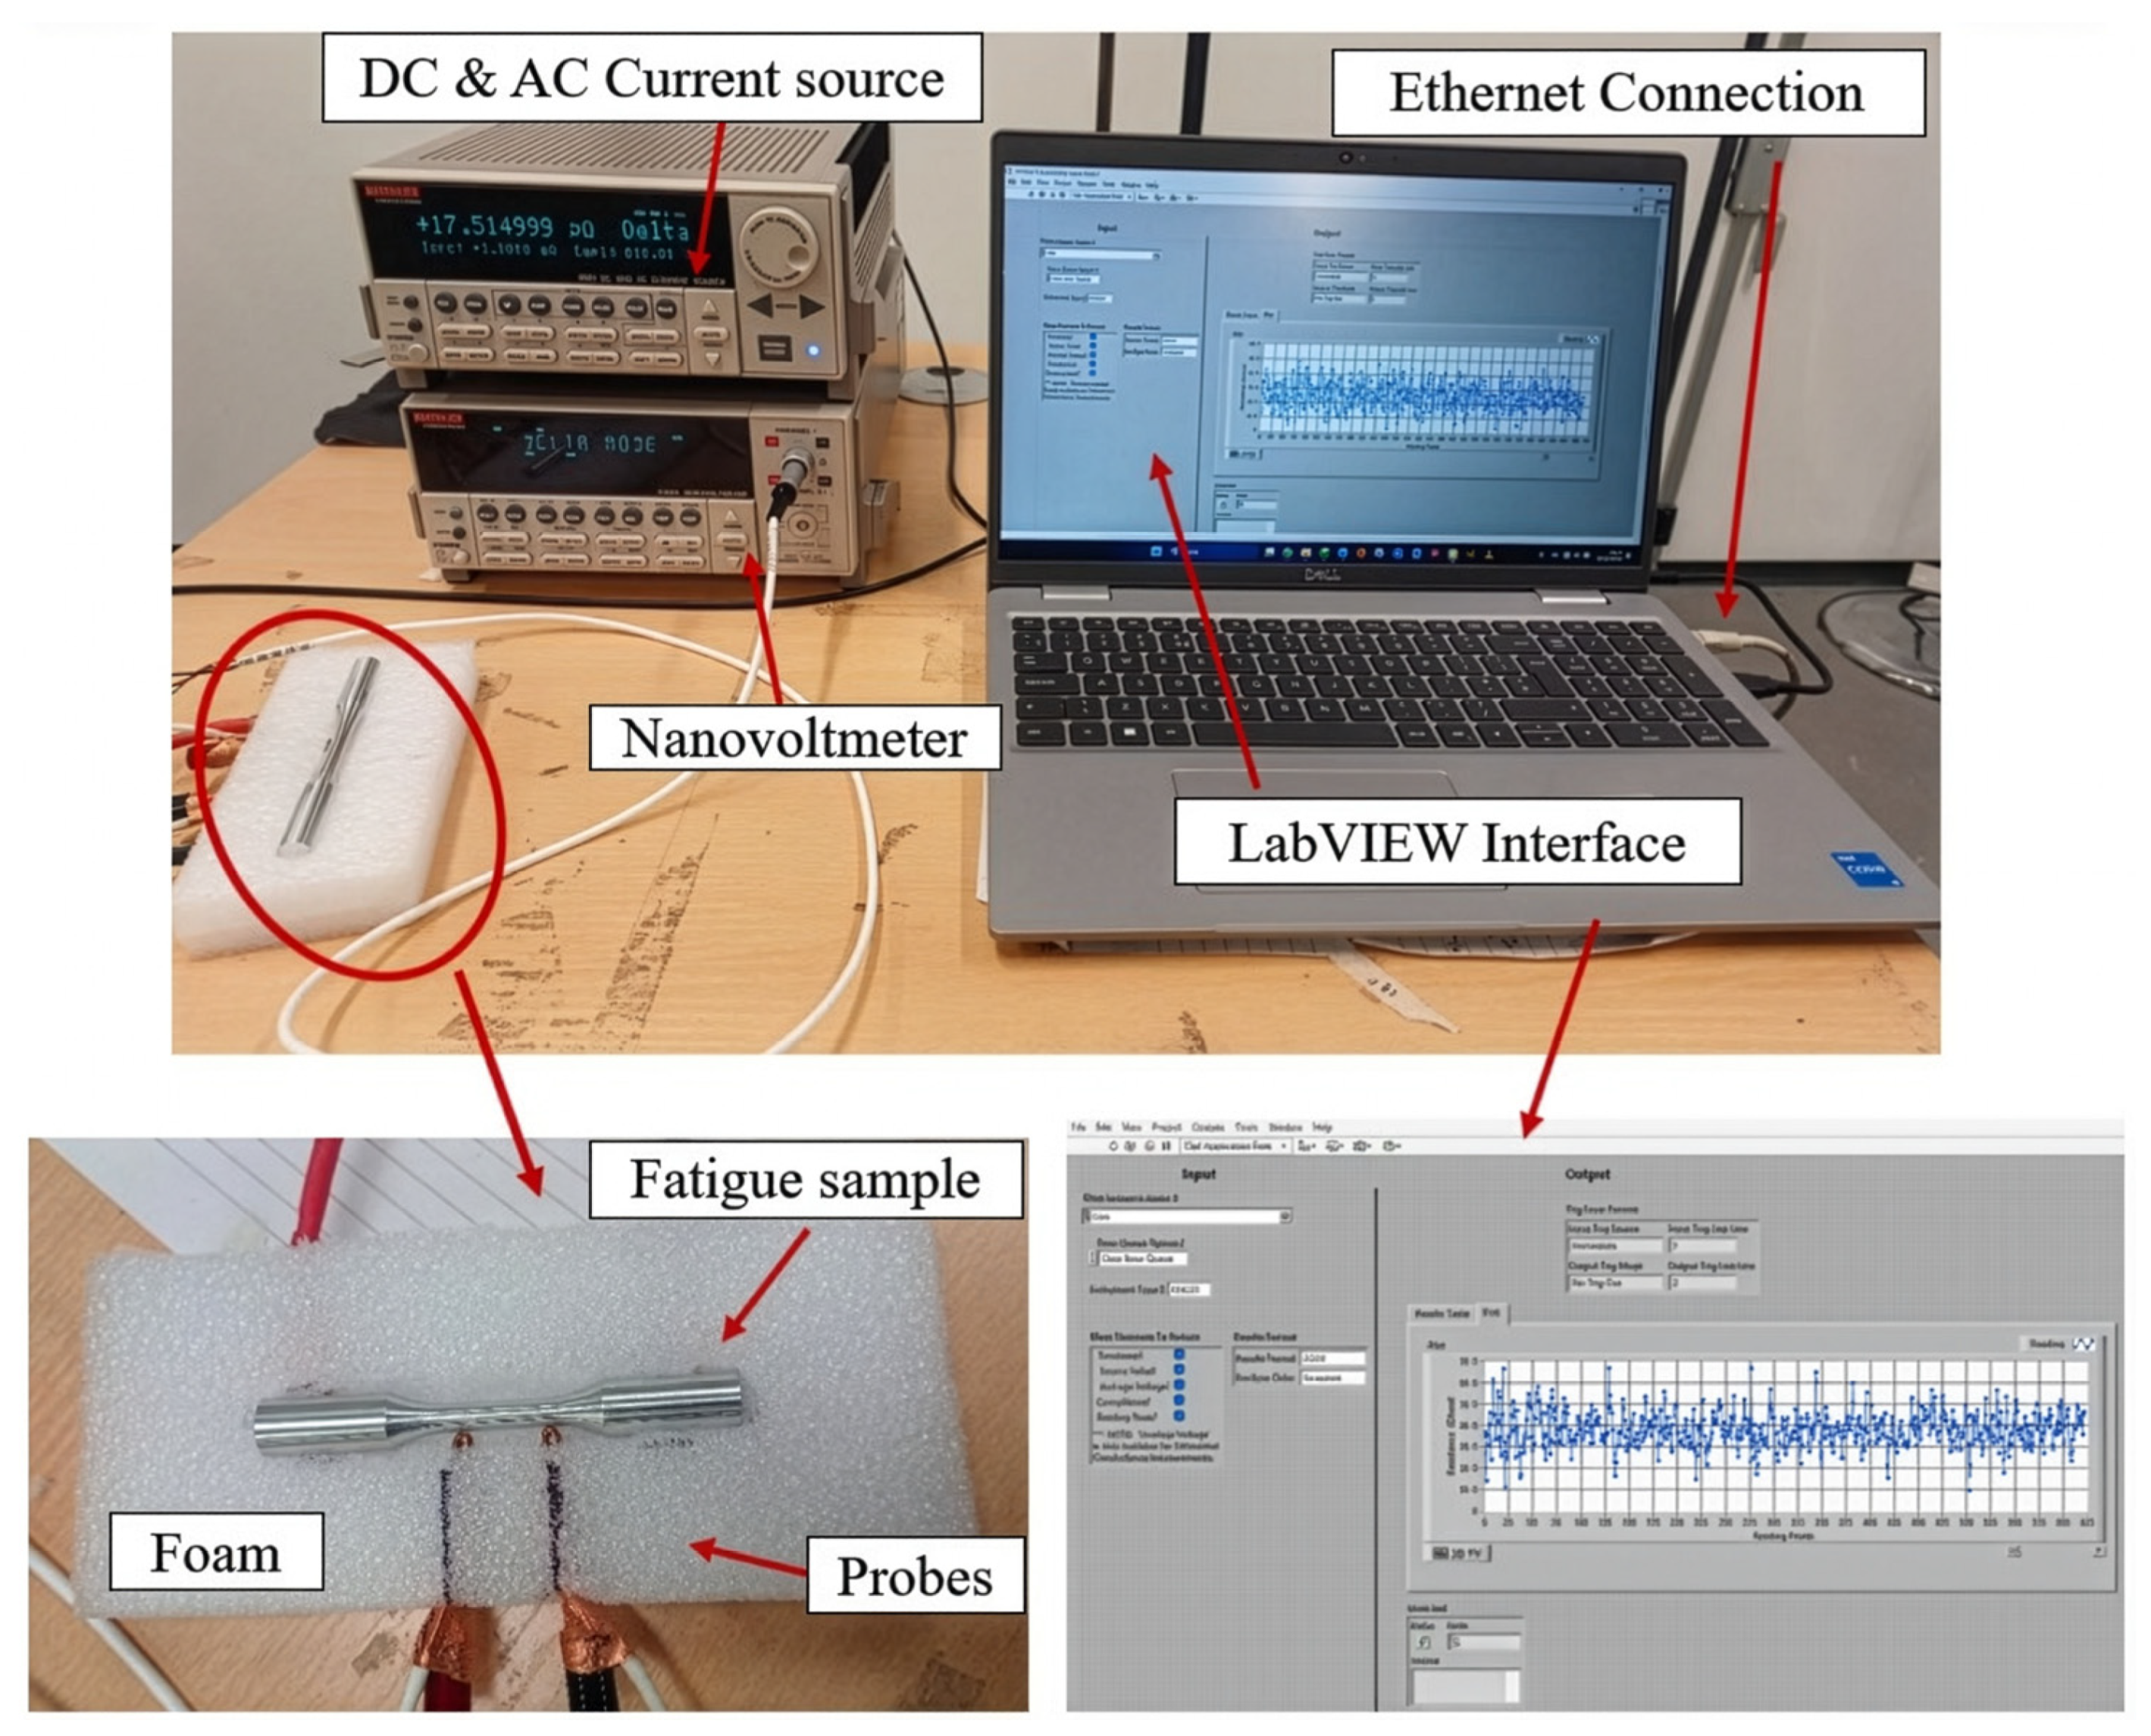
A four-wire resistance measurement method was adapted to make electrical contacts on the machined samples, as shown in Figure 4. The specimen was placed and secured on a foam support to prevent movement during the measurement process. The support also ensured that the probes were positioned at the same locations on each specimen. Additionally, the probes were positioned at a fixed distance of 20 mm apart on each sample to ensure measurement consistency. Sauer et al. discussed the influence of cyclic creep on the geometry of steel samples [28]. However, the fatigue tests in the present study were conducted at room temperature with no measurable temperature increase in the material. Therefore, thermally activated creep is not expected to occur in aluminium at these conditions [29,30]. Consequently, no significant dimensional changes are expected. The diameter and gauge length of the sample were measured before the electrical resistance measurement to ensure that the specimen dimensions had remained unchanged. Therefore, the original specimen dimensions were used in the electrical resistivity calculations. The voltage probes were connected across the gauge length of the sample, where most of the deformation occurs during cyclic loading. Communication between Keithley 6221 and the PC was established via LAN. The required measurement units (Ohms) were selected on the instrument, and the Delta mode was enabled. The resistance measurement sequence was then initiated using the Trigger function. The acquired data were then extracted using the LabVIEW program.

3. Results and Discussion

Initially, the electrical resistivities of the machined samples were determined. The initial electrical resistivity values of Samples 1, 2 and 3 were 3.37 × 10⁻⁸ Ωm, 3.35 × 10⁻⁸ Ωm and 3.21 × 10⁻⁸ Ωm, respectively. Around 600 electrical resistance data points were obtained using the LabVIEW software to determine the electrical resistivity of each sample. Figure 5 shows the data acquisition interface of the LabVIEW program.

3.1. Electrical Resistivity Change at Low-Cycle Fatigue Tests

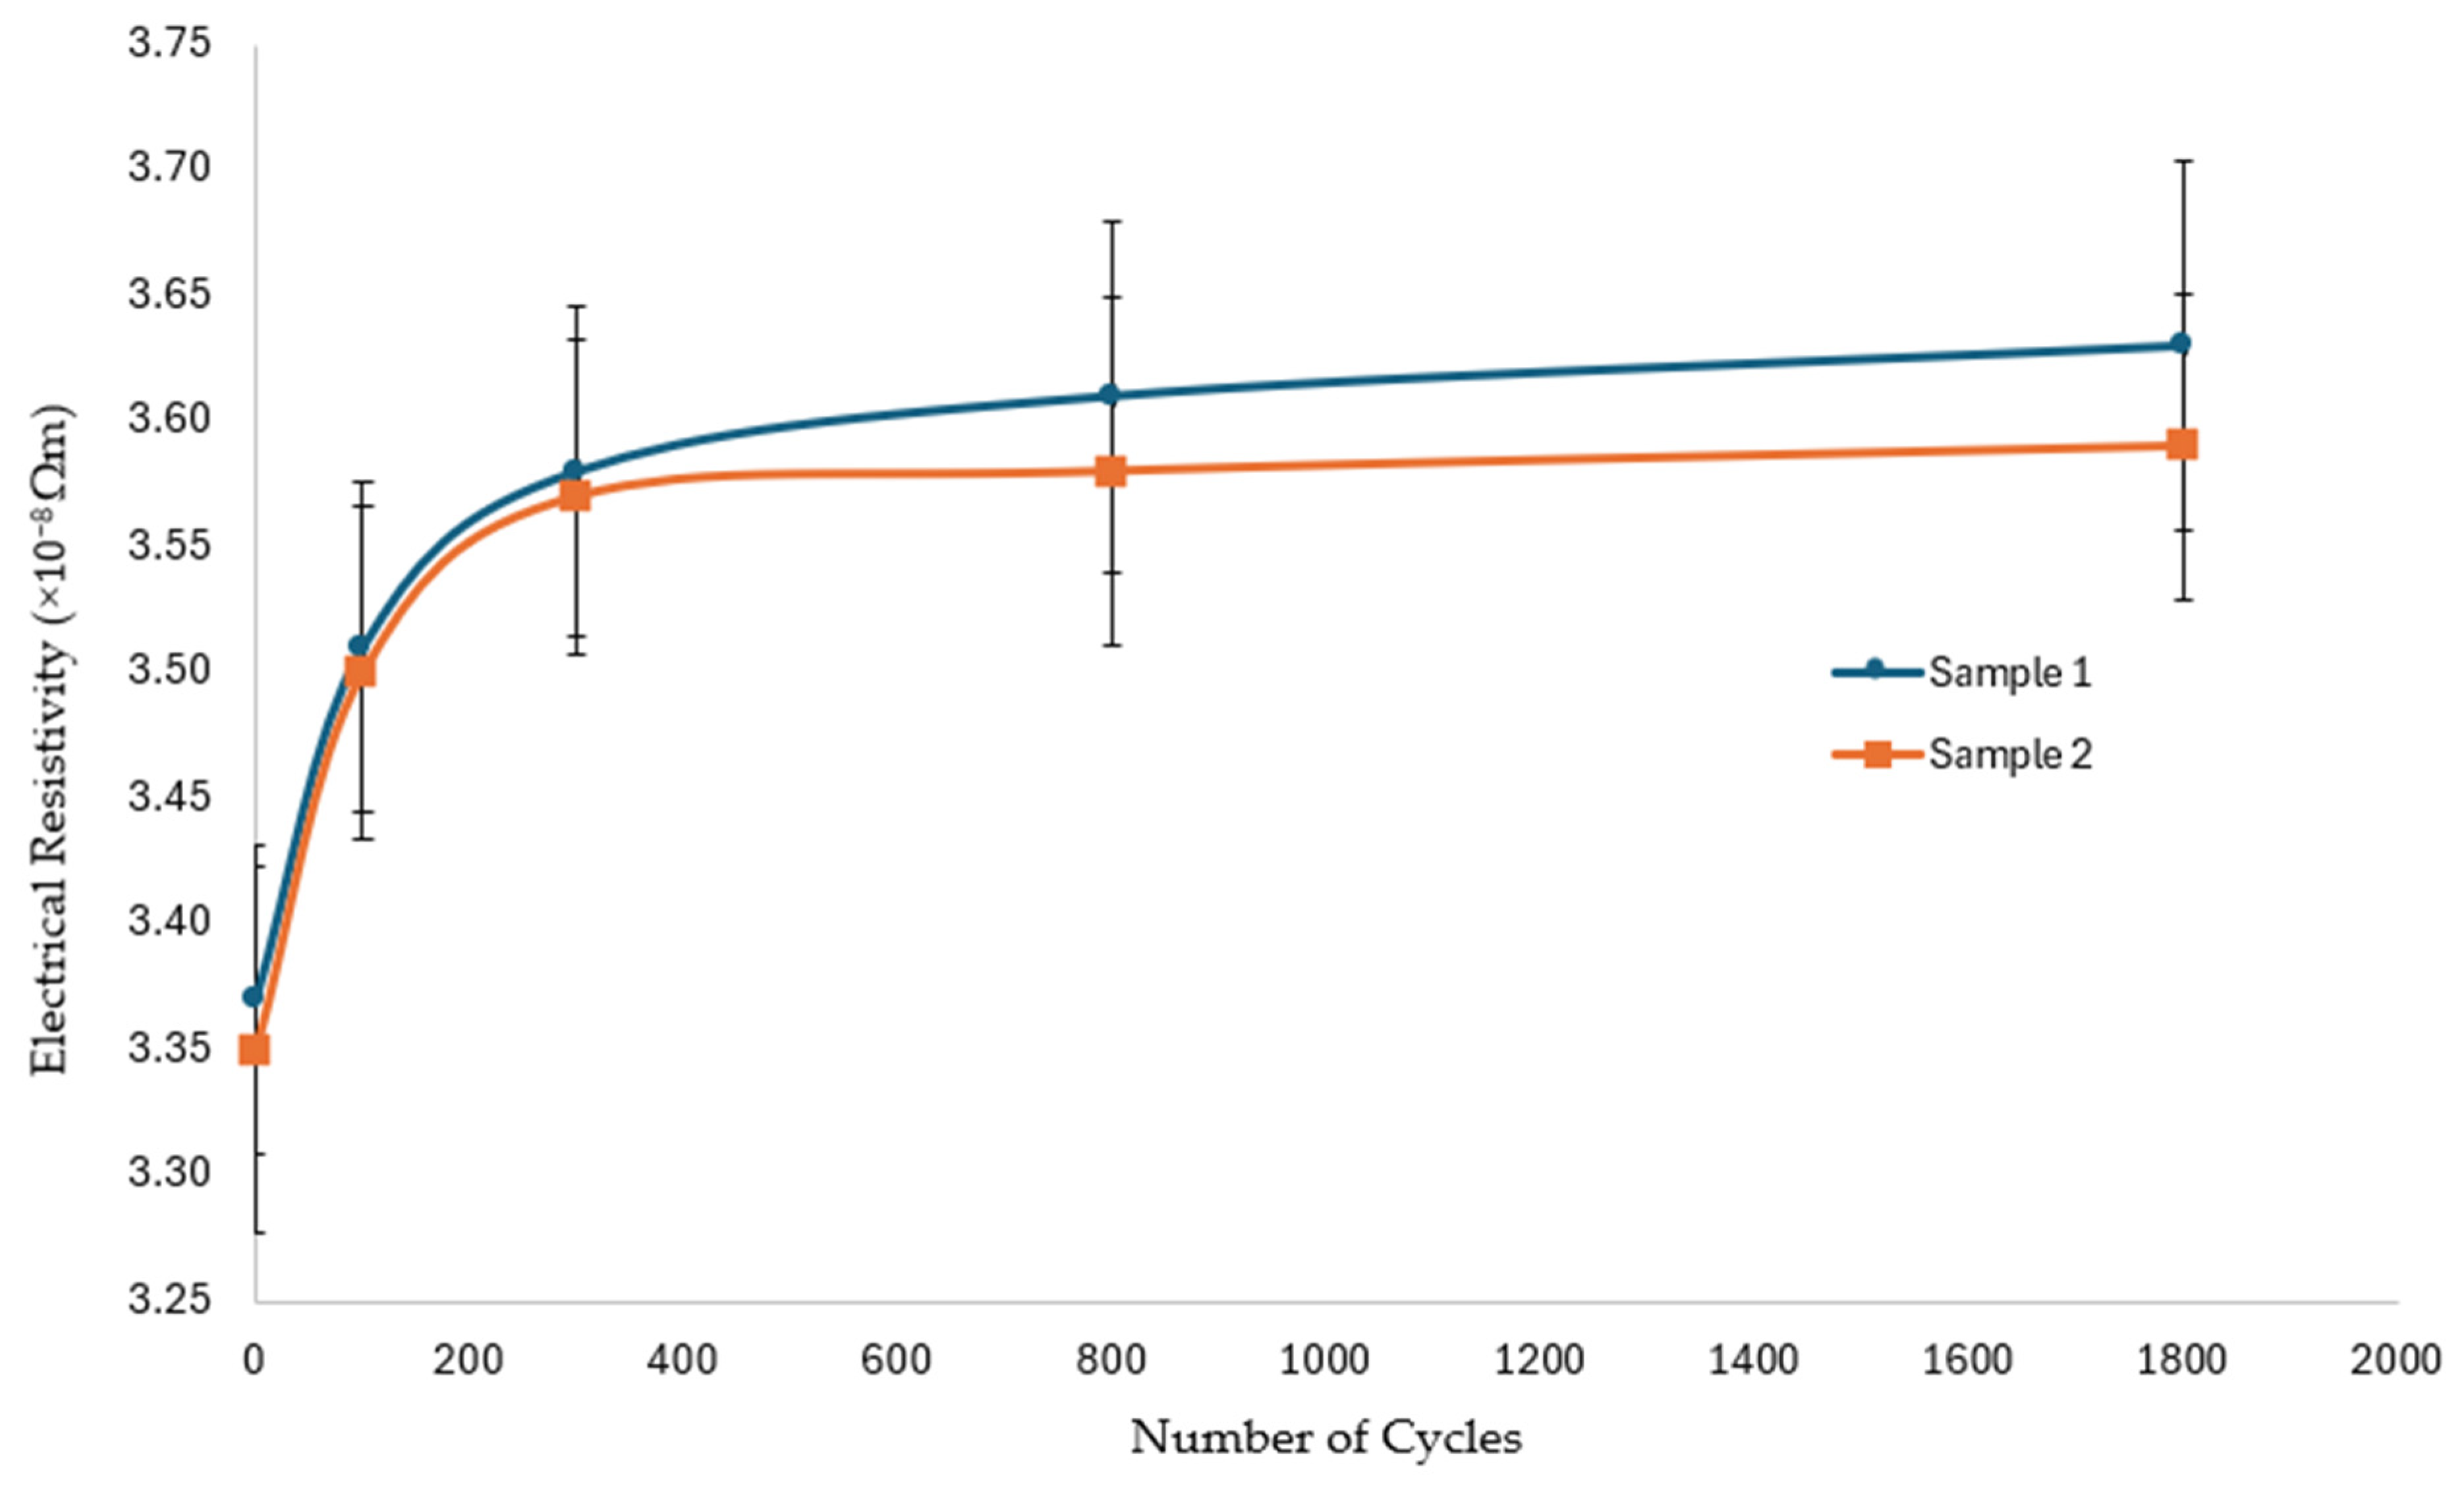
The electrical resistivity of the samples was determined after each interval of interruption at 100, 200, 500 and 1000 cycles until the sample failed. It was observed that the electrical resistivity increased after every pause. The samples ultimately failed at 6315 and 5046 cycles, respectively. Table 1 presents the average electrical resistivity values after every pause and Figure 6 shows the increase in resistivity before the failure. The standard errors of the mean values shown in electrical resistivity calculations have been calculated using a confidence interval level of 95% [31].
It is evident from Table 1 and Figure 6 that electrical resistivity increased following the application of cyclic loading. Ultimately, an increase of 7.58% and 7.17% was observed in Samples 1 and 2, respectively. These results indicate that electrical resistivity measurements can be used to detect deformation and dislocation accumulation induced by cyclic loading. Furthermore, the increase in electrical resistivity appears to be directly related to the level of deformation in the material.

3.2. Electrical Resistivity Change at High-Cycle Fatigue Tests

The electrical resistivity of the sample increased to 3.42 × 10⁻⁸ Ωm after the application of 25,000 cycles, as presented in Table 2. This represents an increase of 6.5% compared to the initial electrical resistivity. A consistent resistivity evolution was observed in both LCF tests, suggesting good measurement reliability despite the variability in individual readings.

3.3. S/TEM Analysis of Sample 3

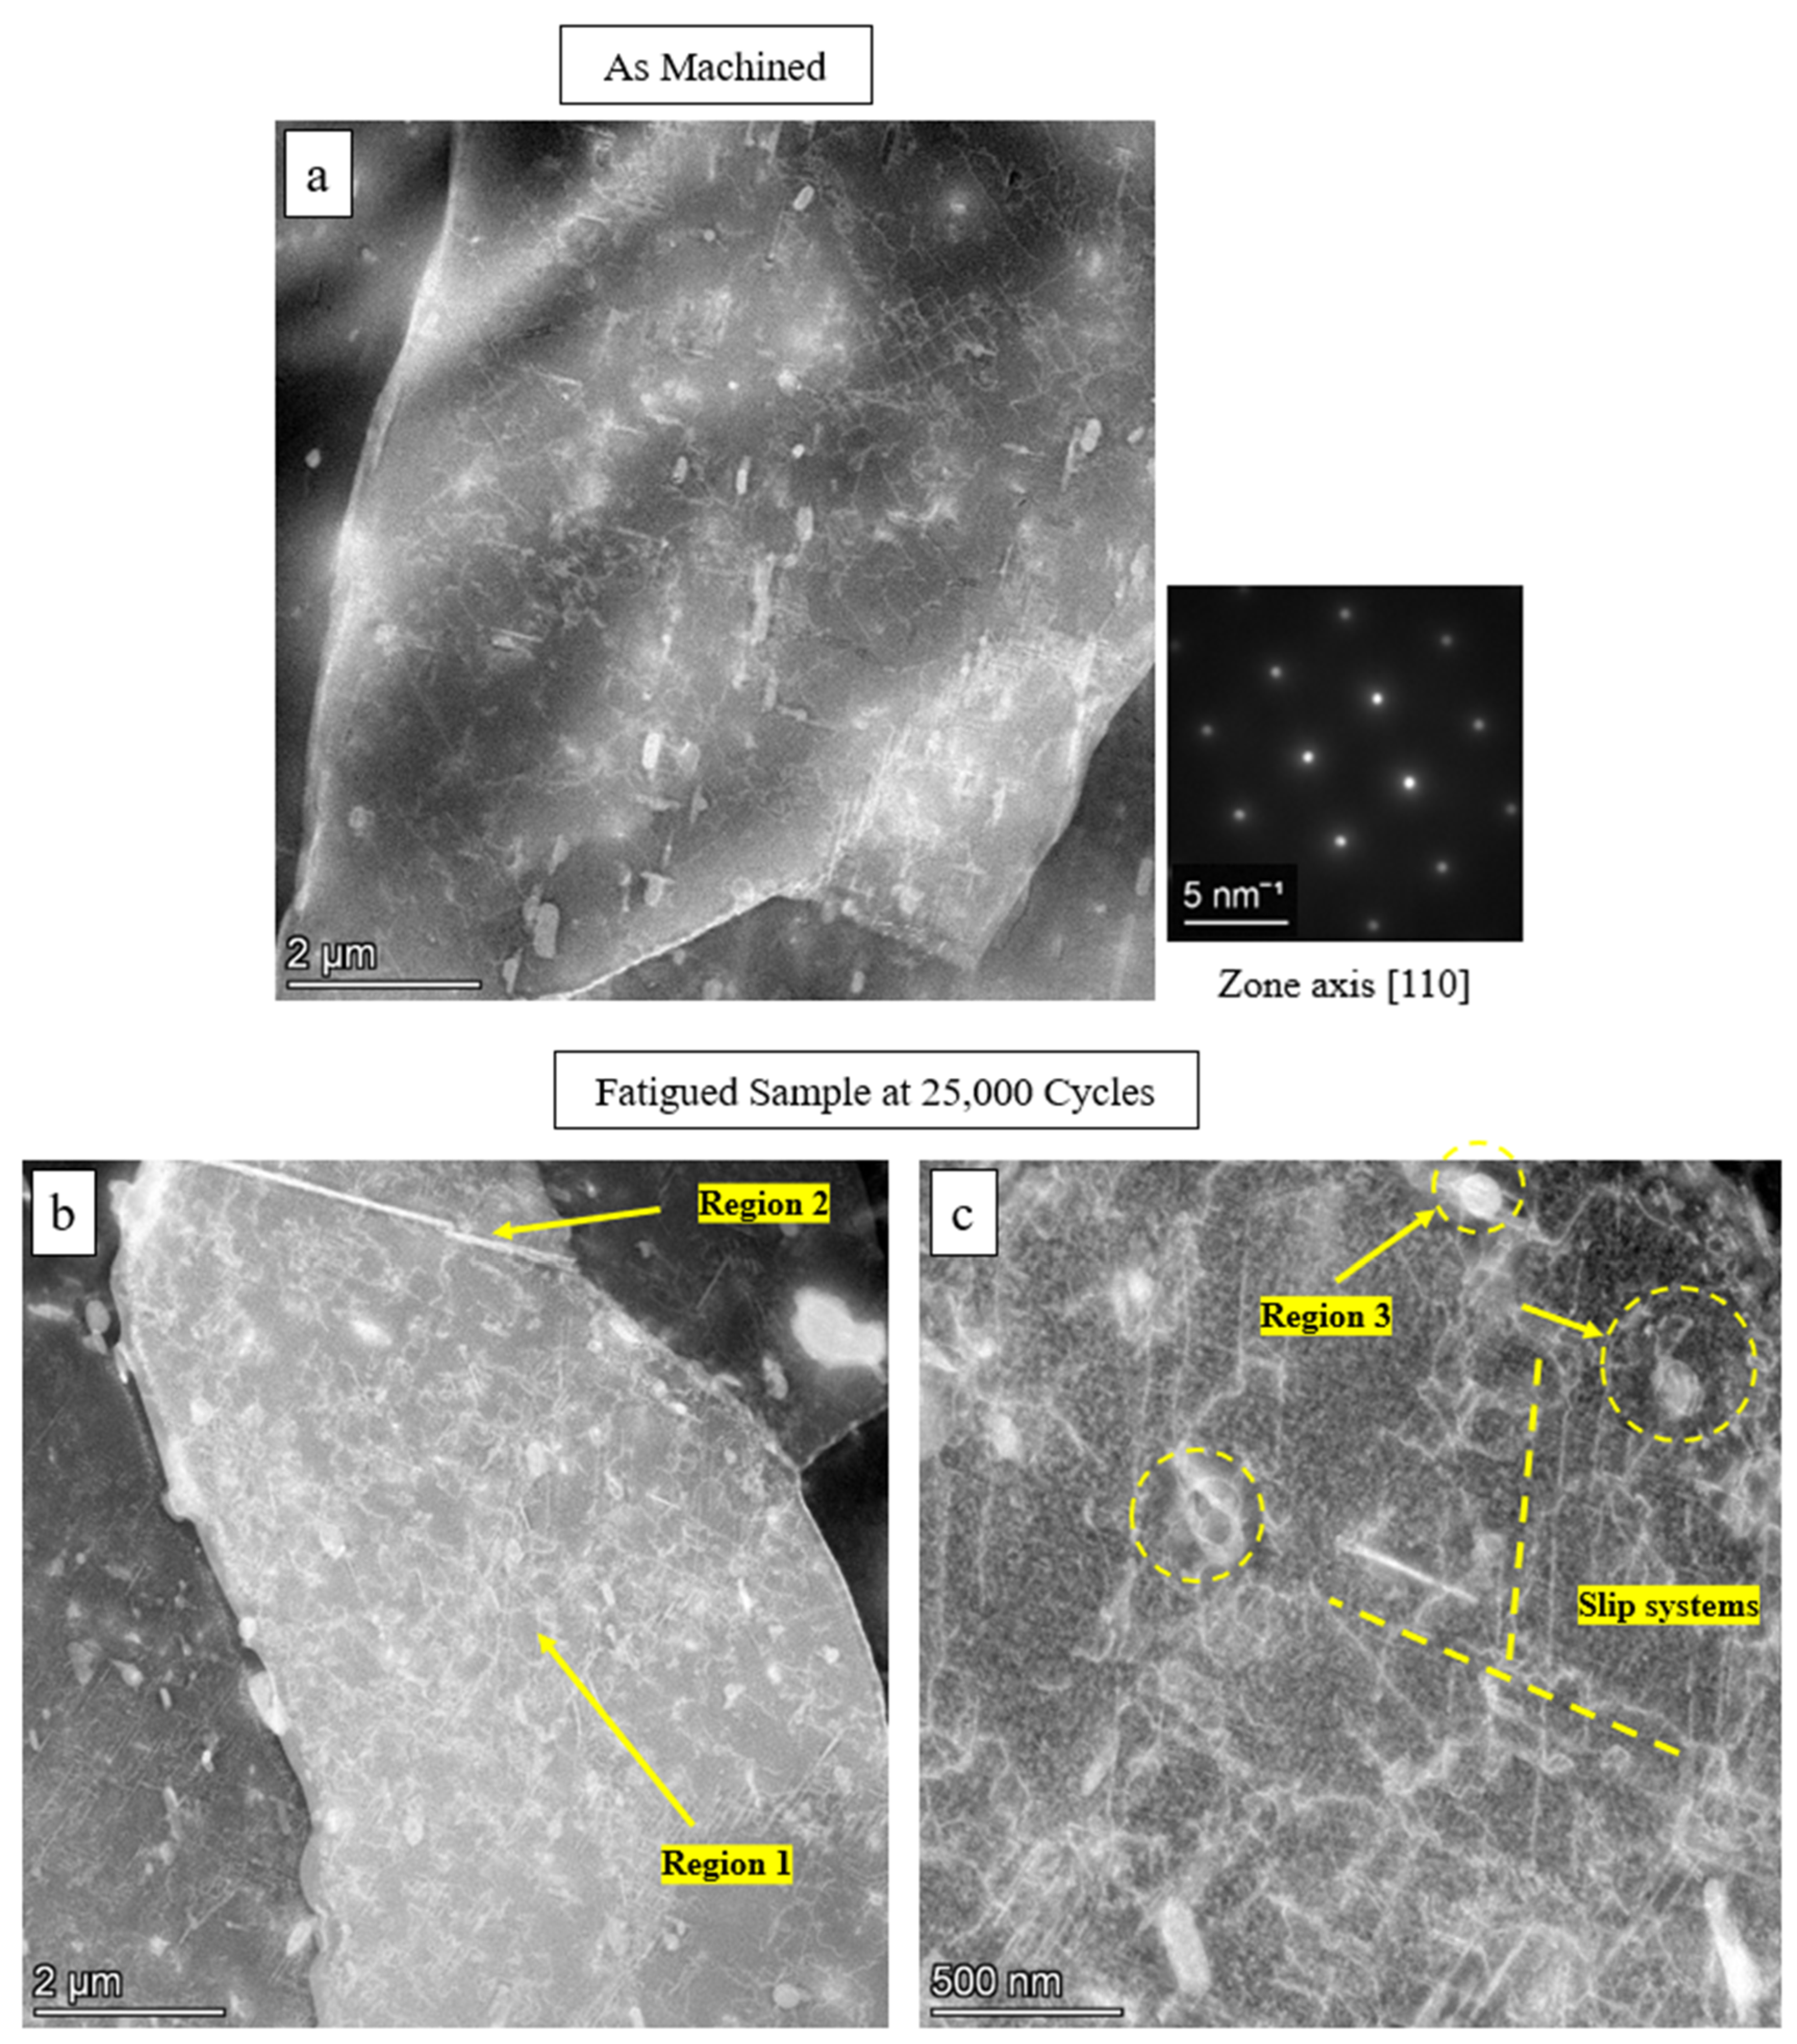
Sample 3 was then analysed using S/TEM to investigate the microstructural changes after the application of cyclic loading. Figure 7 shows a comparison of the microstructures before and after the application of 25,000 fatigue cycles.
The as-machined sample, as shown in Figure 7a, indicates typical microstructural features like intermetallic particles, precipitates (Mg2Si-based β″ phase), and finally process-induced dislocations, as published in several studies [7,11,12]. However, after 25,000 cycles of fatigue in Sample 3, the microstructure evolves, as demonstrated in Figure 7b,c. Region 1 shows an extensive increment in dislocations with a higher density of tangles, indicating the formation of dislocations owing to plastic deformation, as shown by Xiaoshan et al. for another 6xxx series aluminium alloy [32].
Region 2 shows that the sub-grain boundary or low-angle grain boundary (LAGB) is also observed, which is probably formed due to the arrangement of newly generated dislocations. Slip lines can also be seen to be associated with the activation of multiple slip systems; second particles are also observed to have entangled with dislocations, as shown in Region 3 [32]. The aforementioned aspects imply microstructural evolution in the direction of plastic deformation due to fatigue, which can be associated with the increment in the electrical resistivity of samples (as in Table 2). Generally, it is understood that electrical conductivity has a direct proportionality with defects like dislocation density, slip bands owing to lattice distortion and increased resistance to the mean free path of electrons, as published by Khangholi et al. [33].
The S/TEM characterisation in this work was primarily intended as qualitative evidence to depict the microstructural evolution owing to fatigue deformation such as dislocation tangles, low-angle grain boundaries or sub-grain boundary formation and interaction between dislocations and second-phase particles, which are associated with the resistivity increment. Quantitative characterisation (e.g., calculating dislocation density, dislocation interactions with second-phase particles, and Geometrically Necessary Dislocations (GNDs) using Kernel Average Misorientation (KAM) via EBSD analysis) adds significant scientific value associated with individual microstructural features. However, it is beyond the scope of this work and remains as a prospective investigation.

4. Conclusions

This study investigated the change in electrical resistivity of cyclically loaded samples to detect fatigue deformation.
  • An electrical resistance data acquisition method was developed using a Keithley current source in combination with LabVIEW software. The resistance values of cyclically deformed samples were acquired, and the corresponding electrical resistivities were calculated.
  • Low-cycle fatigue tests showed an increase in electrical resistivity with an increasing number of loading cycles at a high stress level of 260 MPa. The fatigue samples exhibited a final resistivity increase of 7.58% and 7.17%, respectively.
  • High-cycle fatigue tests revealed an increase in electrical resistivity of 6.5% after the application of 25,000 cycles at a stress level of 165 MPa.
  • Scanning Transmission Electron Microscopy-based microstructural characterisation indicates that, after 25,000 cycles of fatigue, there is an increment in defects like dislocation tangles, slip lines and interaction between dislocations with second particles, sub-grain boundaries or low-angle grain boundaries in comparison to the initial state. While quantitative microstructural evaluation remains out of scope for this work, the presented qualitative evolution directly supports the trends observed in electrical resistivity measurements.
The results of this study demonstrate that monitoring electrical resistivity can be used as a non-destructive testing (NDT) method for detecting fatigue damage. While this study focuses on the development of an automated system for electrical resistance data acquisition, the developed approach provides a foundation for potential applications in real-time structural health monitoring. The system can be adapted for different monitoring scenarios with minor modifications, such as integrating additional sensors or combining it with other NDT techniques.

Author Contributions

Conceptualisation, V.V.; formal analysis, V.V.; funding acquisition, Z.F.; investigation, V.V. and S.S.J.; software, V.V.; methodology, V.V. and E.B.; project administration, Z.F. and E.B.; supervision, Z.F. and E.B.; validation, V.V., S.S.J. and E.B.; writing—original draft, V.V. and S.S.J.; writing—review and editing, V.V., S.S.J. and E.B. All authors have read and agreed to the published version of the manuscript.

Funding

This research was funded by EPSRC (UK) for Circular Metals Project and grant number EP/V011804/1.

Data Availability Statement

Data will be made available on request.

Acknowledgments

The authors would like to acknowledge the use of the BCAST Advanced Characterisation Suite (BACS) set up through the funding received from the UKRI Infrastructure grant entitled “Future Metallurgy Centre”.

Conflicts of Interest

The authors declare no conflicts of interest.

References

  1. Jiang, J.; Cui, J.; Wang, Y.; Huang, M.; Dong, J.; Yan, J. Effect of T6 heat treatment on microstructure and mechanical properties of 6082 aluminum alloy automotive flange components formed by squeeze casting. Mater. Sci. Eng. A 2024, 912, 146974. [Google Scholar] [CrossRef] [Scilit]
  2. Klemenc, J.; Glodež, S.; Steinacher, M.; Zupanič, F. LCF behaviour of high strength aluminium alloys AA 6110A and AA 6086. Int. J. Fatigue 2023, 177, 107971. [Google Scholar] [CrossRef] [Scilit]
  3. Suresh, S. Fatigue of Materials, 2nd ed.; Cambridge University Press: Cambridge, UK; New York, NY, USA, 1998. [Google Scholar]
  4. Schijve, J. Fatigue of Structures and Materials, 2nd ed.; Springer: Dordrecht, The Netherlands, 2010. [Google Scholar]
  5. Raabe, D.; Tasan, C.C.; Olivetti, E.A. Strategies for improving the sustainability of structural metals. Nature 2019, 575, 64–74. [Google Scholar] [CrossRef] [Scilit] [PubMed]
  6. Bannantine, J.A.; Comer, J.J.; Handrock, J.L. Fundamentals of Metal Fatigue Analysis; Prentice Hall: Englewood Cliffs, NJ, USA, 1990. [Google Scholar]
  7. Kumar, N.; Goel, S.; Jayaganthan, R.; Owolabi, G.M. The influence of metallurgical factors on low cycle fatigue behavior of ultra-fine grained 6082 Al alloy. Int. J. Fatigue 2018, 110, 130–143. [Google Scholar] [CrossRef] [Scilit]
  8. Nanninga, N.; White, C. The relationship between extrusion die line roughness and high cycle fatigue life of an AA6082 alloy. Int. J. Fatigue 2009, 31, 1215–1224. [Google Scholar] [CrossRef] [Scilit]
  9. Zupanič, F.; Klemenc, J.; Steinacher, M.; Glodež, S. Microstructure, mechanical properties and fatigue behaviour of a new high-strength aluminium alloy AA 6086. J. Alloys Compd. 2023, 941, 168976. [Google Scholar] [CrossRef] [Scilit]
  10. Hamada, A.S.; Järvenpää, A.; Ahmed, M.M.Z.; Jaskari, M.; Wynne, B.P.; Porter, D.A.; Karjalainen, L.P. The microstructural evolution of friction stir welded AA6082-T6 aluminum alloy during cyclic deformation. Mater. Sci. Eng. A 2015, 642, 366–376. [Google Scholar] [CrossRef] [Scilit]
  11. Poletti, C.; Bureau, R.; Loidolt, P.; Simon, P.; Mitsche, S.; Spuller, M. Microstructure Evolution in a 6082 Aluminium Alloy during Thermomechanical Treatment. Materials 2018, 11, 1319. [Google Scholar] [CrossRef] [Scilit] [PubMed]
  12. Viththagan, V.; Joshi, S.S.; Lazaro-Nebreda, J.; Fan, Z. Effect of Processing-Induced Oxides on the Fatigue Life Variability of 6082 Al-Mg-Si Alloy Extruded Components. J. Manuf. Mater. Process. 2025, 9, 247. [Google Scholar] [CrossRef] [Scilit]
  13. Tian, N.; Li, Y.; Zhang, P.; Gao, Z.; Zhang, T.; Zhang, Y.; Zhou, Y.; Lv, M.; Zhao, G.; Qin, G. Differences in microstructures and properties of Al-0.81Mg-0.84Si-0.53Cu hot-rolled sheet and hot-extrusion in T6 temper. J. Mater. Res. Technol. 2025, 38, 3437–3446. [Google Scholar] [CrossRef] [Scilit]
  14. Avramenko, T.; Michel, S.; Stutz, A.; Kollender, J.; Burda, I.; Hans, U.; Affolter, C.; Terrasi, G.P. A Comparative Study on Corrosion Fatigue Susceptibility and Microstructural Effects in 6061-T6 and 6082-T6 Aluminum Alloys. Metals 2025, 15, 653. [Google Scholar] [CrossRef] [Scilit]
  15. Carson, J.M. An Ultrasonic Nondestructive Test Procedure for the Early Detection of Fatigue Damage and the Prediction of Remaining Life. Ph.D. Thesis, Drexel University, Philadelphia, PA, USA, 1978. [Google Scholar] [CrossRef] [Scilit]
  16. Dwivedi, S.K.; Vishwakarma, M.; Soni, A. Advances and Researches on Non Destructive Testing: A Review. Mater. Today Proc. 2018, 5, 3690–3698. [Google Scholar] [CrossRef] [Scilit]
  17. Yan, L.; Luo, L.; Zhong, F.; Zhao, Z.; Fan, J.; Huang, L.; Bao, S.; Mao, J. Detection of Fatigue Damage in Aluminum Alloy Structures Using Nonlinear Ultrasonic Modulation. In Volume 1: Acoustics, Vibration, and Phononics, Proceedings of the American Society of Mechanical Engineers, Virtual, Online, 1–5 November 2021; ASME: New York, NY, USA, 2021; p. V001T01A013. [Google Scholar] [CrossRef] [Scilit]
  18. Jhang, K.-Y. Nonlinear ultrasonic techniques for nondestructive assessment of micro damage in material: A review. Int. J. Precis. Eng. Manuf. 2009, 10, 123–135. [Google Scholar] [CrossRef] [Scilit]
  19. Sampath, S.; Sohn, H. Detection and localization of fatigue crack using nonlinear ultrasonic three-wave mixing technique. Int. J. Fatigue 2022, 155, 106582. [Google Scholar] [CrossRef] [Scilit]
  20. Mao, H.; Yi, X.; Mao, H.; Tang, W.; Huang, Z.; Li, X.; Sun, L. Fatigue damage detection and location of metal materials by electrical impedance tomography. Results Phys. 2019, 15, 102664. [Google Scholar] [CrossRef] [Scilit]
  21. Nobile, R.; Saponaro, A. Real-time monitoring of fatigue damage by electrical resistance change method. Int. J. Fatigue 2021, 151, 106404. [Google Scholar] [CrossRef] [Scilit]
  22. Saberi, S.; Stockinger, M.; Stoeckl, C.; Buchmayr, B.; Weiss, H.; Afsharnia, R.; Hartl, K. A new development of four-point method to measure the electrical resistivity in situ during plastic deformation. Measurement 2021, 180, 109547. [Google Scholar] [CrossRef] [Scilit]
  23. Sun, B. High-cycle fatigue damage measurement based on electrical resistance change considering variable electrical resistivity and uneven damage. Int. J. Fatigue 2004, 26, 457–462. [Google Scholar] [CrossRef] [Scilit]
  24. Sauer, L.M.; Otto, J.L.; Lingnau, L.A.; Ziman, J.A.; Starke, P.; Walther, F. Electrical resistance-based fatigue damage assessment of steels. Procedia Struct. Integr. 2025, 68, 432–438. [Google Scholar] [CrossRef] [Scilit]
  25. Omari, M.A.; Sevostianov, I. Evaluation of the Growth of Dislocations Density in Fatigue Loading Process via Electrical Resistivity Measurements. Int. J. Fract. 2013, 179, 229–235. [Google Scholar] [CrossRef] [Scilit]
  26. Sauer, L.M.; Otto, J.L.; Ziman, J.A.; Starke, P.; Walther, F. Test setup for analyzing the electrical resistance during fatigue loading for metastable austenite AISI 304L and its diffusion-brazed joints. J. Mater. Res. Technol. 2025, 35, 535–544. [Google Scholar] [CrossRef] [Scilit]
  27. Keithley Instruments, Inc. Model 6220 DC Current Source, Model 6221 AC and DC Current Source Reference Manual; Keithley Instruments, Inc.: Solon, OH, USA, 2005; p. 454. [Google Scholar]
  28. Sauer, L.M.; Lingnau, L.A.; Walther, F. Electrical-resistance-based fatigue damage evaluation in full-forward rod extruded 16MnCrS5. Procedia Struct. Integr. 2026, 77, 34–40. [Google Scholar] [CrossRef] [Scilit]
  29. Wagner, D.; Ranc, N.; Bathias, C.; Paris, P.C. Fatigue crack initiation detection by an infrared thermography method. Fatigue Fract. Eng. Mat. Struct. 2010, 33, 12–21. [Google Scholar] [CrossRef] [Scilit]
  30. Zhang, L.; Liu, X.S.; Wu, S.H.; Ma, Z.Q.; Fang, H.Y. Rapid determination of fatigue life based on temperature evolution. Int. J. Fatigue 2013, 54, 1–6. [Google Scholar] [CrossRef] [Scilit]
  31. Ulm, K. A Brief Original Contribution: A Simple Method to Calculate the Confidence Interval of a Standardized Mortality Ratio (SMR). Am. J. Epidemiol. 1990, 131, 373–375. [Google Scholar] [PubMed]
  32. Xiaoshan, L.; He, G.; Ding, X.; Mo, D.; Zhang, W. Fatigue behavior and dislocation substructures for 6063 aluminum alloy under nonproportional loadings. Int. J. Fatigue 2009, 31, 1190–1195. [Google Scholar] [CrossRef] [Scilit]
  33. Khangholi, S.N.; Javidani, M.; Maltais, A.; Chen, X.G. Review on recent progress in Al–Mg–Si 6xxx conductor alloys. J. Mater. Res. 2022, 37, 670–691. [Google Scholar] [CrossRef] [Scilit]
Figure 1. Geometry and dimensions of 6 mm sample.
Ndt 04 00023 g001
Figure 2. Delta mode measurements [27].
Ndt 04 00023 g002
Figure 3. Schematic connection between PC, Keithley 6221 and 2182A.
Ndt 04 00023 g003
Figure 4. Experimental setup of electrical resistance measurements.
Ndt 04 00023 g004
Figure 5. LabVIEW program interface of electrical resistance data acquisition.
Ndt 04 00023 g005
Figure 6. Electrical resistivity increment after every stop.
Ndt 04 00023 g006
Figure 7. High-angle annular dark-field scanning transmission electron microscope (HAADF-STEM) micrograph of (a) as-machined sample and (b,c) fatigued sample stopping at 25,000 cycles with zone axis [110].
Ndt 04 00023 g007
Table 1. Average electrical resistivity of the samples after every stop.
Total Number of CyclesSample 1Sample 2
Average Electrical Resistivity (Ωm)Standard Error of the MeanAverage Electrical Resistivity (Ωm)Standard Error of the Mean
As-Machined 3.37 × 10−86.14 × 10−103.35 × 10−87.31 × 10−10
100 Cycles3.51 × 10−86.54 × 10−103.50 × 10−86.67 × 10−10
300 Cycles3.58 × 10−86.59 × 10−103.57 × 10−86.25 × 10−10
800 Cycles3.61 × 10−87.00 × 10−103.58 × 10−86.92 × 10−10
1800 Cycles3.63 × 10−87.36 × 10−103.59 × 10−86.07 × 10−10
Failed at6315 Cycles5046 Cycles
Table 2. Average electrical resistivity of Sample 3.
Total Number of CyclesSample 3
Average Electrical Resistivity (Ωm)Standard Error of the Mean
As-Machined 3.21 × 10−87.55 × 10−10
25,000 Cycles3.42 × 10−87.24 × 10⁻¹⁰
Disclaimer/Publisher’s Note: The statements, opinions and data contained in all publications are solely those of the individual author(s) and contributor(s) and not of MDPI and/or the editor(s). MDPI and/or the editor(s) disclaim responsibility for any injury to people or property resulting from any ideas, methods, instructions or products referred to in the content.