


Abstract
This study investigates how students evaluate digitalisation in European higher education, focusing on Business and Administration. Drawing on EUROSTUDENT 8 data from 25 education systems, we contrasted student groups and examined links between digital learning, satisfaction, peer integration and intentions to leave higher education. Correlation and exploratory cluster analyses covered 22 systems, with p-values adjusted for multiple testing via Holm’s method. Business and Administration students displayed a stronger preference for online learning and reported higher satisfaction with digital services than the wider student population. Satisfaction differences were modest and stayed statistically significant for four of the six services following adjustment. Their integration with fellow students was lower. Across systems, higher reported online learning scores were linked to greater satisfaction (r = 0.67) and weaker peer integration (r = −0.55). Both associations remained significant after adjustment. The evidence was insufficient to support the hypothesised relationships between digital capital and satisfaction, or between learning-mode mismatch and dropout intention. Two clusters showed clearer separation, while three clusters offered a more detailed exploratory description. The findings indicate that satisfaction with digital learning can coexist with weaker peer integration, underscoring the value of considering both when evaluating teaching within programmes.
1. Introduction
The COVID-19 pandemic accelerated the digitalisation of higher education and expanded the role of digital technologies in European education systems [1,2,3]. Within the space of only a few semesters, online lectures, digital examinations, and electronic administrative services became more widely used [4,5]. Following the return to in-person instruction, attention shifted to how these formats should be combined and how well they meet the needs of different students. The Rome Communiqué places digitalisation within a broader commitment to social inclusion and quality learning, while acknowledging that digital technologies do not offer universal solutions [6]. Similarly, the European Commission’s Digital Education Action Plan 2021–2027 identifies the development of a high-performing digital education ecosystem as a strategic priority [7].
These policy commitments raise a practical question: how closely does the digital learning offered by institutions match students’ needs and preferences? The volume and forms of digital learning are determined primarily by institutional supply [4,8], whilst student preferences are heterogeneous and do not always align with it [9,10,11]. While some students value the flexibility of online formats [10,12], others report difficulties maintaining ties with fellow students and a sense of belonging to the academic community [13,14]. Both peer relationships and belonging have been associated with academic success and student retention [15,16,17,18].
Evidence on learning outcomes and engagement is also mixed. Bernard et al. [19] report average differences between distance and classroom instruction close to zero, alongside substantial variation across studies. Means et al. [20] find an advantage for blended learning, but not a statistically significant advantage for fully online learning, over classroom instruction; they also note that additional learning time and resources may contribute to the blended-learning results. Experimental and quasi-experimental studies, including studies of introductory economics courses, identify lower performance in fully online formats and smaller or no differences in blended formats [21,22,23]. Evidence on engagement likewise varies: web-based learning technologies have been positively associated with student engagement [24], while fully online students report fewer collaborative learning experiences than their campus-based peers [25].
These findings make it important to examine how students’ experiences vary across fields of study. Teaching methods and the role of digital technologies in future professional practice differ between disciplines, giving students different grounds for evaluating digital learning [26,27,28]. Cross-national comparisons by field can therefore reveal differences that are less visible when the student population is considered as a whole.
The present article focuses on students in Business and Administration—a field encompassing accounting, finance, management, and marketing. Digital technologies are changing professional practice in these areas through developments such as automated accounting, electronic invoicing and reporting, and cloud-based management systems [29,30]. Data from the eighth round of EUROSTUDENT show that these students express one of the strongest preferences for online learning across all fields and attach particularly high importance to digital tools in the current work environment, whilst simultaneously reporting lower integration with fellow students [9]. This combination makes the field relevant to understanding how digital learning preferences coexist with students’ social experiences. It also raises questions for curriculum design, including in accounting education, from which the impetus for this study originates.
The disciplinary scope requires clarification. In the ISCED-F 2013 classification used by EUROSTUDENT, economics (ISCED-F 0311) belongs to the social sciences rather than to Business and Administration (ISCED-F 041) [31]. Moreover, the published data do not distinguish between the subfields of Business and Administration. The analysis therefore concerns this broad field, and its findings cannot be attributed to individual subfields or transferred automatically to economics programmes.
The study builds on the EUROSTUDENT 8 topical module report [9], which presents descriptive field-of-study comparisons for selected indicators. It extends these comparisons by examining whether differences between Business and Administration students and other students recur across education systems. It also examines system-level relationships between digital provision, digital capital, satisfaction, peer integration, and dropout intention. These analyses complement disciplinary research that focuses mainly on learning outcomes in individual courses or institutions [21,22,23,26].
The aim of the study is to establish how students in European higher education assess the digitalisation of teaching and learning, and in what respects Business and Administration students differ from the overall student population and from students in other fields. Three research questions are addressed: first, how do Business and Administration students differ from these two comparison groups in terms of satisfaction with digital services, preferred modes of study, and digital capital; second, what national profiles of the digitalisation of learning emerge and how do European education systems cluster; and third, how, at the system level, digital capital and the reported online learning score relate to satisfaction with digital services, and how online learning and the mismatch between preferred and actual modes relate to peer integration and dropout intention.
The empirical basis comprises the aggregated indicators from the official EUROSTUDENT 8 database, covering 25 systems with over 290,000 surveyed students. The analyses use published system-level indicators rather than individual student records, and the number of systems included varies with indicator availability. The contribution of the article is threefold: it compares Business and Administration students with both the overall student population and students in all other fields across education systems; it identifies exploratory profiles of systems based on their digital learning characteristics; and it examines associations between digital provision, student resources, and students’ reported experiences. These associations describe differences between systems and do not establish causal relationships or relationships between individual students.
2. Literature Review
2.1. The Digitalisation of Higher Education Before and After the Pandemic
The digitalisation of higher education predates the pandemic: even prior to 2020, prospective analyses outlined a future of flexible learning pathways, hybrid learning environments, and an increasing role for digital technologies in teaching [32]. The pandemic, however, accelerated this process, shifting instruction to remote mode within weeks and revealing both the potential and the limitations of digital formats [1,33]. This crisis-driven transition must be distinguished from pre-planned online learning, because institutions had little time for pedagogical and technological preparation. It is therefore more precisely characterised as “emergency remote teaching” [34].
The European University Association survey on digitally enhanced learning and teaching [4] and the final report of the DIGI-HE project [8] document this transition from an institutional perspective. The survey shows that digitally supported learning was already widespread among participating institutions before the pandemic and was increasingly being integrated into institutional strategies and quality assurance [4]. The DIGI-HE final report highlights the importance of curriculum design, digital competencies, institutional support, and the needs of students and staff [8]. The NESET review of emerging evidence on the impact of COVID-19 on higher education provides a broader synthesis of the consequences for teaching, learning, and inclusion [3]. Research in financial accounting education also examines how traditional teaching methods can be combined with digital tools [35].
Research on student preferences points both to the value of flexibility and to the continued importance of in-person interaction. EUROSTUDENT 8 documents differences in preferences between student groups [9], while post-pandemic accounting research shows that preferred delivery modes differ between calculation-based and theoretical modules [12]. Pre-pandemic studies likewise found that students valued online learning for access to materials and independent study, but often preferred face-to-face settings for discussion and shared understanding [10,11]. These findings suggest that preferences concern particular learning activities as well as the overall mode of study.
Findings on engagement also require careful interpretation. The use of web-based learning technologies has been positively associated with student engagement [24,36], whereas fully online students report fewer collaborative learning experiences than their campus-based peers [25]. These findings concern different aspects of engagement and different teaching contexts. They suggest that engagement with digital resources and opportunities for peer collaboration should be examined separately.
A similar distinction is relevant to social integration. During emergency remote teaching, studies identified lower social integration and smaller student networks [13,14]. Research on online communities, however, highlights how interaction and course design can support a sense of community and belonging [37,38]. These findings suggest that social integration depends partly on how opportunities for interaction are organised, rather than simply on whether teaching takes place online.
Taken together, the literature suggests that differences in findings may reflect the forms of provision examined, including synchronous and asynchronous learning, the learning tasks, and the student groups involved [19,39]. Whilst student perceptions feature extensively in the pandemic literature, much of the early research is descriptive and cross-sectional, with uneven coverage of fields of study [2]. Comparative cross-national research on students’ assessment of digitalisation across fields of study remains limited. The present study addresses this gap through comparisons based on a common dataset, while interpreting the results as associations at the level of education systems.
2.2. Students’ Digital Capital
The concept of “digital capital” provides a framework for examining students’ digital resources. Drawing on Bourdieu’s theory of capital, it combines digital competences and access to digital technologies, which can be accumulated and converted into other forms of capital [40]. An empirical index combining access and skills shows associations with socio-economic and demographic characteristics such as income, education, age, and place of residence [41]. In higher education, this distinction matters because access to a device and an internet connection does not necessarily mean that students can use digital resources effectively for learning.
Research conducted amongst students challenges the assumption that “digital natives” constitute a homogeneous group with high digital competencies. Considerable variation in internet skills and in modes of technology use has been found even amongst members of the same generation [42]. Earlier research also found that students used a limited range of established technologies for learning purposes, whilst making comparatively little use of newer collaborative and content-creation tools [43]. A study of 4822 first-year students from nine higher education institutions in Austria likewise identifies substantial differences in access, patterns of use, and self-assessed competences, supporting the need to examine students’ digital resources in the specific context of their studies [44].
The systematic literature reviews identify inconsistencies in the use and definition of the concepts of “digital competence” and “digital literacy” [45], as well as frequent reliance on self-assessment instruments for measuring digital competence [46]. Such instruments capture perceived competence and do not provide a direct test of students’ performance.
Within the EUROSTUDENT 8 framework, digital capital is examined through students’ assessments of whether their digital skills are sufficient for their studies, together with their access at home to a computer, a desk, the internet, and a quiet place in which to study [9]. This operationalisation, adopted in the present study, covers selected aspects of digital capital, including perceived skills and the technological and spatial conditions for digital learning. The skills indicator should therefore be interpreted as perceived sufficiency rather than as objectively measured competence. Whether these resources are associated with satisfaction with digital services is an empirical question addressed in the present study.
2.3. Modes of Study, Integration, and Academic Achievement
Research in higher education has long examined the role of academic and social integration in student persistence. The classical interactionist model of student departure places academic and social integration at the centre of the student’s decision to continue or discontinue their studies [15,16]. Empirical research also highlights the importance of contacts with fellow students and academic staff for student persistence and development [17].
In a digital environment, the concept of “social presence” helps explain how participants perceive and connect with others online. The Community of Inquiry model regards social, cognitive, and teaching presence as interrelated components of meaningful online learning [47]. The meta-analysis by Richardson et al. [48] likewise reports positive associations between social presence and both student satisfaction and perceived learning outcomes. These findings concern students’ perceptions of learning and should not be interpreted as direct evidence of higher academic achievement.
Digital communication provides additional ways for students to maintain social connections. Research on Facebook use, for example, identifies positive associations with students’ social capital [49]. However, the conditions under which online interaction takes place are important. During the period of emergency remote learning in Austria, students reported declines in both social and academic integration [13]. Data from EUROSTUDENT 8 also indicate that students studying primarily online tend to report weaker ties with fellow students with whom they can discuss academic matters. However, the relationship between mode of study and dropout intention varies across countries [9]. These findings describe associations and do not establish that online learning causes lower integration or a greater intention to leave higher education.
The distinction between synchronous and asynchronous formats helps clarify the different opportunities for interaction within online learning. Synchronous formats, such as live online sessions, enable real-time exchange and may support interpersonal connection. Asynchronous formats, including recorded lectures and discussion forums, offer flexibility and time for reflection. They can also support interaction when students exchange and respond to contributions [39]. Thus, asynchronous provision should not be treated as inherently isolating; opportunities for peer interaction depend on how learning activities are organised.
The question of how these relationships manifest at the level of education systems, and how reported integration differs across fields of study, remains open. Individual-level findings provide a theoretical basis for this inquiry, but their applicability to comparisons between systems requires separate empirical assessment.
2.4. Digitalisation in Business, Administration, and Accounting Education
Digitalisation affects both how students in Business, Administration, and Accounting are taught and what they need to learn for professional practice. The automation of routine operations, electronic invoicing and reporting, cloud-based accounting systems, and data analytics are transforming both professional practice and the competences that educational programmes must develop [29]. Research amongst accounting educators reveals an expectation of substantial restructuring of professional roles and of a stronger integration of traditional accounting knowledge with technological skills, problem-solving, and critical thinking [30].
The literature emphasises that technological competences should not be confined to a single specialist course. Sledgianowski, Gomaa and Tan [50] propose the integration of information systems, big data, and business analytics across the various accounting disciplines. The study by Dzuranin, Jones and Olvera [51] reports faculty support for a hybrid approach to curriculum design, in which a standalone data analytics course is combined with practical applications embedded within other accounting courses. Blockchain technologies and artificial intelligence are also discussed as topics for inclusion in accounting curricula [52]. The development of generative artificial intelligence further highlights the importance of preserving professional judgement, critical thinking, and the human dimension of the accounting profession [53].
With regard to the mode of study itself, an international collection of reflections by accounting educators from 45 countries describes opportunities to adapt teaching practices, alongside difficulties involving stress, interaction, and the organisation of learning [54]. A study of economics disciplines in Croatia records a comparatively swift move to an online environment, but also identifies a need for a national framework and appropriate funding, while noting that fully online programmes remained uncommon [55]. A comparative analysis covering secondary and higher education in Croatia, Germany, Poland, and Serbia likewise reveals the prominent role of particular platforms in different activities: Google for networked services, Microsoft for document management, and Zoom for online meetings [56].
Research on online and blended learning across management, marketing, finance, information systems, and economics highlights the importance of disciplinary context and the uneven development of evidence across fields [57]. A review of management education also identifies course design, subject matter, and programme level as issues requiring closer examination [58]. Experimental studies in introductory economics examine the relationship between delivery formats, classroom time, and student performance [21,22,59]. These economics studies provide context for the discussion of teaching formats; the empirical analysis here concerns Business and Administration as classified in EUROSTUDENT.
Taken together, these studies offer evidence on curriculum development, digital tools, and particular teaching formats, but their different scopes and measures limit direct comparisons of students’ experiences across education systems. How students in the broader field of Business and Administration assess the digitalisation of learning across different European education systems remains insufficiently examined. The present study contributes to addressing this gap by drawing on the harmonised data of EUROSTUDENT 8, which allow comparisons of students’ preferred modes of study, satisfaction with digital services, digital capital, and social integration.
3. Conceptual Framework, Research Questions and Hypotheses
The conceptual framework of the study (Figure 1) adapts the logic of the thematic module of EUROSTUDENT 8 [9] to a comparative design at the level of the education system. It distinguishes between the learning conditions provided by institutions and the resources available to students. The first encompasses institutional provision: the available digital services and the actual mode—online, in-person, or blended—in which learning takes place. The second comprises students’ individual resources, captured through the concept of “digital capital”: the self-assessed sufficiency of digital skills and the material prerequisites of the home learning environment [40,41]. These indicators capture selected aspects of digital capital, as discussed in Section 2.2. The distinction between institutional conditions and student resources is consistent with the “educational interface” perspective, which explains engagement through the interaction between students’ characteristics and their institutional environment [60].
Figure 1.
Conceptual framework of the study. Solid arrows indicate the hypothesised associations between education systems (H2–H4). The dash-dot arrow indicates the within-system group comparison (H1), and the dashed arrow indicates an exploratory association. The links represent hypothesised or exploratory relationships, not established causal effects. The reported and preferred online learning scores are reconstructed as means of five ordered response categories. The correlational hypotheses use 22 complete systems. The preferred-score comparison for H1 uses 23 systems.
The framework examines whether digital capital and institutional provision are associated with satisfaction with digital services. The reported online learning score serves as an indicator of the mode of provision; it does not measure the quality of teaching or the full range of institutional digital services. Its association with satisfaction is examined on an exploratory basis, alongside the hypothesised relationship between digital capital and satisfaction.
The relationship between the preferred and actual mode of study constitutes another central variable in the framework: the degree of mismatch between desired and received learning, measured using students’ reported correspondence between the two modes. The analysis distinguishes the absolute deviation of the system mean from full correspondence from the mean absolute deviation of individual responses. The latter captures mismatches that may cancel each other out in the system mean (Section 4.2). Both measures are calculated from published response distributions and analysed at the system level. The framework examines whether greater mismatch is associated with higher dropout intention and whether a higher reported online learning score is associated with weaker integration with fellow students. Dropout intention refers to students’ stated intention to leave higher education; actual withdrawal is not observed.
Academic integration, represented by students’ assessments of lecturers’ feedback, motivation, and clarity, provides a further theoretical dimension of the framework. Tinto’s interactionist model emphasises the relevance of academic and social integration to student persistence [15,16]. In this study, academic integration is included in the descriptive comparisons between Business and Administration students, all students, and students in other fields (Section 5.2). It is not included in the system-level correlational or cluster analyses. Field of study therefore provides the basis for examining differences in students’ resources, preferences, satisfaction, and integration, without assuming that the field itself causes these differences.
An important measurement limitation is that all constructs are observed as aggregated characteristics of education systems. The relationships identified therefore describe associations between systems and must not be interpreted as relationships between individual students.
The use of individual-level theory to formulate system-level hypotheses requires an explicit assumption. Differences in how widely students experience particular learning conditions or possess particular resources may be reflected in system averages. This provides a rationale for examining corresponding patterns across systems, but does not guarantee that individual-level relationships will appear at that level. System-level associations may also reflect differences in student composition, institutional practices, funding, digital infrastructure, or survey timing. Their strength and even direction may differ from those observed among individuals [61]. H2–H4 are therefore tested as expectations about associations between systems. Establishing the underlying individual mechanisms would require individual-level data and a multilevel research design.
Three research questions arise from the conceptual framework and the literature review:
RQ1. In what respects do Business and Administration students differ from the overall student population and from students in other fields in terms of satisfaction with digital services, preferred mode of study, and digital capital?
RQ2. What national profiles of the digitalisation of learning emerge, and how do European education systems cluster?
RQ3. At the level of the education system, how are digital capital and the reported online learning score related to satisfaction with digital services? How are the reported online learning score and learning-mode mismatch related to peer integration and dropout intention, respectively?
Four hypotheses guide the analysis. H1 concerns differences between student groups within education systems, assessed across the participating systems. H2–H4 concern associations between system-level indicators.
H1.
The preferred online learning score amongst Business and Administration students is systematically higher than the average level for all students and than that of students in other fields. This expectation is motivated by research on digital competency needs in accounting [29] and on the relevance of attitudes towards online learning to Business students’ motivation and engagement [62]. Whether these considerations are reflected in a higher preference for online learning across the broader field of Business and Administration remains an empirical question.
H2.
Systems with higher student digital capital exhibit greater satisfaction with digital services. The expectation is that access to suitable equipment and study conditions, together with sufficient digital skills, may help students use digital services more effectively. Research on online learning identifies self-efficacy and interaction with learning content and academic staff as relevant to satisfaction and perceived learning [63]. These individual-level findings motivate the hypothesis; they do not establish the expected relationship between system-level resources and satisfaction indicators.
H3.
A higher reported online learning score is associated with lower integration with fellow students at the level of the education system. The hypothesis draws on findings concerning weaker peer ties among students studying predominantly online and reported declines in social integration during emergency remote education [9,13]. These findings motivate the expected association, while leaving its contextual explanations open. Because the reported online learning score does not distinguish between synchronous and asynchronous teaching, H3 does not attribute the expected association to either format.
H4.
Systems with greater mismatch between preferred and actual mode of study exhibit higher mean dropout intention. The hypothesis rests on the assumption that a mismatch between desired and received learning may weaken engagement and the sense of belonging—mechanisms associated with persistence and academic achievement [15,16,60]. It is examined using both the deviation of the system mean from full correspondence and measures derived from the distribution of individual responses (Section 4.2).
RQ1 and H1 are examined through paired comparisons within education systems and the Wilcoxon signed-rank test, complemented by Holm-adjusted p-values and effect sizes. RQ2 is investigated through exploratory k-means cluster analysis with stability checks, whilst RQ3 and hypotheses H2–H4 are addressed through correlational analysis at the level of the education system, supplemented by sensitivity analyses. The methods are presented in Section 4 and the results in Section 5.
4. Materials and Methods
4.1. Data
The study draws on the official EUROSTUDENT 8 database on the social and economic conditions of student life in European higher education. The eighth round covers the project period 2021–2024 and draws on responses from more than 290,000 students across 25 education systems. The target population encompasses students enrolled in ISCED 5–7 programmes within the respective system during the semester of data collection, excluding doctoral candidates. Unlike earlier rounds, EUROSTUDENT 8 also includes students enrolled in formally defined distance-learning programmes, including fully online degrees, provided that they live in the country of survey during the current lecture period. Distance-learning students living outside that country are excluded. Coverage is subject to the national deviations documented by EUROSTUDENT.
National surveys follow a common questionnaire framework and are conducted predominantly online, although some systems use additional collection methods. National teams apply weights to improve the correspondence between their samples and the respective student populations. Weighting procedures and variables differ across systems and may include sex, age, study programme, institution type, and field of study. These procedures support comparability but do not eliminate all differences in sampling coverage or non-response.
Fieldwork was conducted primarily in the spring and summer of 2022; in Austria, Spain, France, Portugal, and Romania data collection took place in 2023, whilst Germany and Switzerland contribute data from 2021 and 2020, respectively. The implications of these different survey periods for the composition of the analytical samples and the interpretation of results are addressed in Section 4.4.
The empirical basis of the article comprises the aggregated system-level indicators published in the database, drawn from three thematic areas: “P. Digitalisation” (the thematic module of the eighth round on the digitalisation of teaching, learning, and student life), “O. Equipment at home”, and “K. Assessment of studies and performance”. The analysis uses published response distributions and field-of-study breakdowns rather than individual student records. The construction of the analytical indicators is explained in Section 4.2.
Alongside values for all students, the database provides breakdowns by focus groups, including a classification of 20 fields of study used in this analysis. The focus is on “Business and Administration” (field 8 according to the ES8 classification, encompassing accounting, finance, and management). All students provide a general benchmark, while students in all other fields (“non-Business students”) form a comparison group that does not overlap with Business and Administration (Section 4.2). Comparisons across the 20 fields also position Business and Administration within the wider disciplinary spectrum.
Two classification constraints limit the interpretation. First, the published breakdowns do not distinguish the subfields of Business and Administration, such as accounting, finance, management, and marketing. Second, economics (ISCED-F 0311) belongs to ES8 field 6, “Social sciences, journalism and information”, alongside disciplines such as political science and sociology, and cannot be analysed separately [31]. The findings therefore concern Business and Administration as a broad field and cannot be attributed to its individual subfields or extended directly to economics students.
Where cells contain an insufficient number of observations, the database applies value suppression; consequently, data availability differs across indicators and student groups. The selected indicators are available for 22–24 systems, while the correlational and cluster analyses use 22 systems with complete data. Section 4.4 summarises the available indicators and the inclusion of each system in the analyses, and the relevant number of systems is reported in each results table.
4.2. Construction of Variables
For the indicators used in this study, means are reconstructed from the categorical response distributions published in the database. For each indicator and each system, a mean on the five-point scale is computed as the weighted average of categories using the published proportions, with the categories “I do not need it” and “not applicable to my studies” excluded in advance—a procedure consistent with the official thematic report of the consortium. After these exclusions, the proportions in the five substantive response categories are rescaled to sum to one. The national survey weights are already reflected in the published distributions. Treating the five ordered categories as equally spaced permits the calculation of means, but remains a simplifying assumption about ordinal responses.
The categories are recoded so that higher values indicate greater satisfaction, greater perceived importance of digital tools, more sufficient digital skills, better access to home-learning resources, or stronger integration, as appropriate. For dropout intention, higher values indicate stronger agreement with the intention to leave higher education. For the actual and preferred online/in-person mode indicators, higher values indicate a greater extent of online learning. We refer to the reconstructed system means as the reported and preferred online learning scores. Both are based on five ordered categories and do not measure the percentage of instruction delivered online. For the match indicator, 3 denotes full correspondence, values above 3 indicate more in-person teaching than wanted, and values below 3 indicate more online teaching than wanted. Table 1 summarises the variables, sources, and scale orientations.
Table 1.
Variables, sources, and scales.
As a consistency check, the reconstructed means for self-assessed digital skills and the four home-learning resources were compared with the corresponding figures in the consortium’s thematic report. The five indicators therefore comprise one skills indicator and four resource indicators: access to a computer, a desk, a sufficient internet connection, and a quiet place to study.
For the purposes of the correlational analysis, three derived variables were also constructed: a composite digital capital score (the mean of the five components of skills and home environment), a composite satisfaction with digital services score (the mean of the six services), and a mode mismatch variable (the absolute deviation of the correspondence indicator from the full-correspondence value of 3). The composites are calculated from system-level item means. Equal weighting provides a transparent summary of components measured on the same five-point scale, in the absence of an external criterion for assigning different weights. It does not imply that the components are equally important to every student.
Across the systems included in the correlational analysis, the satisfaction indicators show high internal consistency (Cronbach’s α = 0.91). Their first principal component explains 69% of the variance and has similar component coefficients of 0.38–0.45. The digital-capital indicators have lower internal consistency (α = 0.58). Self-assessed skill sufficiency captures students’ perceived ability to meet study demands, whereas the other four items describe resources available at home. A similar composite score can therefore reflect different combinations of skills and study conditions. We use the five-item mean as a descriptive index of these resources. The α values describe covariation among system-level item means. Reliability at the student level would require individual responses. For H2, we examine the skills item, the four home-resource items individually and as a composite, and alternative principal-component-based and z-standardised composites (Section 5.4).
Because Business and Administration students are included in the overall student population, comparing them with all students reduces the observed contrast with students in other fields. A non-overlapping comparison group is reconstructed from the published weighted response counts: for each system, indicator, and response category, the Business and Administration count is subtracted from the all-student count. The remaining counts are then converted into proportions and used to calculate the non-Business mean. For a given indicator, if w denotes the weighted share of Business and Administration students among valid responses, the difference “Business − non-Business” equals “Business − all students” divided by (1 − w). The two differences consequently have the same direction. For the actual-mode indicator, the Business and Administration share ranges from 7.9% to 22.5% across systems, with a mean of 16.8%. In the reported comparisons, differences relative to non-Business students are approximately 1.2 times larger on average.
The mismatch measure |mean − 3| captures the deviation of the system mean from full correspondence. It can conceal individual mismatches because opposite deviations may cancel each other out. Additional measures are therefore calculated from the published distribution of the match indicator: the mean absolute deviation of individual responses, Σ pk × |k − 3|, where pk is the proportion in recoded category k and k ranges from 1 to 5; and the proportion reporting any mismatch, comprising all categories except 3. Further checks use the proportion reporting considerable mismatch (categories 1 and 5) and the directional proportions: more online teaching than wanted (recoded categories 1 and 2) and more in-person teaching than wanted (recoded categories 4 and 5). Although these measures capture the distribution of individual experiences, they remain system-level indicators in the analysis and do not require access to individual student records.
For dropout intention, the sensitivity analyses additionally use the proportion selecting the two strongest agreement categories (top-two-box), alongside the mean score (Section 5.4). Unavailable or suppressed values are treated as missing and are not imputed. The correlational and cluster analyses use systems with complete data for the required indicators.
4.3. Methods of Analysis
The unit of analysis is the education system, which determines the choice of statistical methods and the level at which findings are interpreted. The comparison between Business and Administration students and the overall student population is complemented by a comparison with students in all other fields. Both comparisons use paired differences calculated within each education system, with each system contributing one observation to the relevant comparison. The statistical significance of the differences is tested using the two-tailed Wilcoxon signed-rank test, which does not require normally distributed differences. Its interpretation as a comparison of location assumes an approximately symmetric distribution of paired differences. Zero differences are omitted from the signed-rank calculation, and tied absolute differences receive average ranks. Exact p-values are used when there are no ties or zero differences; otherwise, a tie-adjusted normal approximation is used.
Each education system receives equal weight in the between-system analyses. This matches the research questions, which concern differences and associations across participating education systems. Weighting by national sample size would give more influence to larger surveys and would address a different question. National survey weights are already incorporated in the published distributions used to calculate each system’s scores. Equal weight across systems does not imply equal precision of those scores.
The Holm–Bonferroni procedure [64] adjusts for multiple testing across the 22 indicators separately for each comparison group: Business and Administration versus all students, and Business and Administration versus non-Business students. Effect sizes are reported using the matched-pairs rank-biserial correlation (r_rb; range −1 to 1) [65], where positive values indicate higher scores among Business and Administration students. Mean paired differences are accompanied by 95% confidence intervals calculated using the t distribution across systems. To help assess practical relevance, mean differences are also expressed relative to the cross-system standard deviation of the corresponding all-student indicator. Statistical significance is distinguished from practical importance, and non-significant results are interpreted as insufficient evidence of a difference or association, rather than evidence of its absence [66,67].
The correlational analysis examines five main relationships between system-level indicators: digital capital and satisfaction with digital services (H2); the reported online learning score and peer integration (H3); learning-mode mismatch and dropout intention (H4); and the exploratory relationships of the preferred online learning score with peer integration and of the reported online learning score with satisfaction. Pearson coefficients describe linear associations. Spearman rank coefficients provide a complementary assessment of monotonic associations, using ranks to reduce sensitivity to extreme numerical values. The associated Spearman p-values are approximate and are interpreted as supplementary evidence given the limited number of systems.
The main Pearson coefficients are reported with 95% confidence intervals based on Fisher’s z transformation, and their p-values are Holm-adjusted across the five relationships. The influence of individual systems is examined by recalculating the correlations after omitting each system in turn (leave-one-out analysis). For H2, a quadratic regression supplements the linear correlation: satisfaction is regressed on the centred digital-capital score and its squared term to examine a possible curved relationship. Additional checks involving survey timing, alternative indicators, and the exclusion of selected systems are described in Section 4.4 and reported in Section 5.4.
To derive a typology of national profiles, k-means clustering is applied to standardised z-scores of eight indicators: the five components of digital capital, the reported online learning score, the composite satisfaction with digital services score, and integration with fellow students. Standardisation places the indicators on a common scale before clustering. Solutions with two, three, and four clusters are compared using the silhouette coefficient [68], which summarises how closely systems resemble their own cluster relative to other clusters. For each main solution, the best of 300 k-means++ initialisations is retained, defined by the lowest within-cluster sum of squares. The comparison of solutions and the justification for the retained typology are presented in Section 5.3.
Stability and sensitivity are examined through leave-one-out re-estimation, comparison with Ward’s hierarchical clustering, re-estimation without Azerbaijan and Georgia, and an alternative specification in which digital capital enters as a single composite. In the latter specification, the four domains—digital capital, online learning, satisfaction, and peer integration—are standardised and each contributes one indicator. The agreement between partitions is assessed using the adjusted Rand index (ARI) [69]. Kruskal–Wallis tests, Holm-adjusted across the eight clustering variables within each solution, additionally describe differences between the resulting groups. Because these variables also determine cluster membership, the tests are treated as exploratory comparisons rather than independent confirmation of the existence of clusters. Given the small number of observations, the clustering is treated as an exploratory typology rather than a definitive classification of national systems.
Statistical processing and data analysis were carried out using IBM SPSS Statistics 29.0 and Python 3.12.14. The transformations applied and the analytical decisions taken are described sequentially, such that the analysis can be reproduced from the published EUROSTUDENT 8 files. The system-level analytical dataset and the analysis code are provided as Supplementary Materials (Table S1 and File S2).
The confidence intervals describe uncertainty in estimates based on the observed differences between systems. For example, the intervals around the paired mean differences use the variation in those differences across systems. They do not propagate the sampling uncertainty of each national survey estimate. The correlations describe relationships between systems. Estimating associations among individual students or identifying causal effects would require other data and designs.
4.4. Survey Timing, Data Availability, and Sensitivity Analyses
Table 2 summarises survey timing and the availability of the 22 main indicators in the analytical dataset. Availability differs between systems and determines their inclusion in each analysis. Germany (2021) contributes five of these indicators: peer integration, three assessments of lecturers, and dropout intention. Switzerland (2020) contributes peer integration and dropout intention. These systems therefore enter paired comparisons only for the available indicators and are excluded from the main correlational and cluster analyses. France (2023) contributes eight indicators covering actual and preferred learning modes, their correspondence, digital skills, and home-learning resources. It is excluded from the main correlational and cluster analyses because the required satisfaction and integration indicators are unavailable.
Table 2.
Survey timing, indicator availability, and inclusion of education systems in the analyses.
The main correlational and cluster analyses consequently use 22 systems with complete data: 18 surveyed in 2022 and four surveyed in 2023—Austria, Spain, Portugal, and Romania. The supplementary analysis of institutional belonging uses 21 systems because that indicator is unavailable for Austria. Data from Germany and Switzerland, collected in 2021 and 2020 respectively, are therefore not combined with the 2022–2023 observations in the main correlation matrix.
Sensitivity to survey timing is examined separately for group comparisons and correlations. Selected paired comparisons are repeated after excluding Germany and Switzerland, after excluding all five systems surveyed in 2023, and after excluding both groups. The five main correlations are recalculated without the four 2023 systems in the correlational sample, leaving 18 systems surveyed in 2022. Additional partial correlations examine the relationships of the reported online learning score with peer integration and with satisfaction, controlling for an indicator distinguishing 2023 from 2022, both alone and together with digital capital.
Further checks exclude Azerbaijan and Georgia to assess their influence on the observed relationships. Analyses also use the alternative digital-capital specifications and mismatch measures described in Section 4.2. For H4, dropout intention is examined using both the mean score and the proportion selecting the two strongest agreement categories. The results of these checks are reported alongside the relevant findings in Section 5.2, Section 5.3 and Section 5.4.
These analyses assess whether the findings depend on particular systems, survey periods, or measurement choices. They cannot fully separate survey-year effects from national characteristics because each system is observed at a single point in time. Residual differences in pandemic conditions, institutional practices, and student composition therefore remain possible explanations for cross-system variation.
5. Results
5.1. The Digitalisation Profile of European Higher Education Systems
Table 3 presents the descriptive statistics for the twenty-two indicators across the overall student population. The reported means summarise system-level assessments, with each available system contributing equally to the cross-system average. The number of systems varies by indicator, as shown in the table.
Table 3.
Descriptive statistics of the digitalisation indicators, all students (country level).
The importance of digital tools for successful learning receives a high mean rating (4.74 on a five-point scale) with low variation between system means (standard deviation 0.12). This indicates broadly similar assessments of their importance across the participating systems. The resource indicators also receive generally high ratings, although differences remain between components. Access to a computer has the highest mean among the four home-learning resources (4.85), while access to a quiet place to study has the lowest (4.08). The mean rating for self-assessed digital skill sufficiency is 4.32, with system means ranging from 3.89 in Georgia to 4.66 in Croatia.
The cross-system averages indicate a preference for more online learning than students received at the time of the survey: the mean reported online learning score is 2.42 and the mean preferred online learning score is 2.63. Both are measured on the five-point mode scale described in Section 4.2. Reported online learning scores vary considerably, from 1.39 in Portugal to 3.52 in Finland, the lowest and highest system means, respectively. These values describe the extent of online teaching rather than the overall quality or maturity of digital education.
The indicator of correspondence between actual and preferred mode (mean 3.13 against the full-correspondence value of 3.00) is above 3 in 15 of 23 systems, indicating that students in these systems receive, on average, more in-person teaching than they would wish. This is consistent with the difference between the actual and preferred mode scores. The correspondence indicator ranges from 2.74 in Latvia to 3.61 in Austria.
The distribution of responses reveals mismatches that are less visible in the system means. Across the 23 systems with available data, the average national proportion of students whose actual mode differs from their preferred mode is 58.7%, ranging from 38.0% in Georgia to 70.4% in Austria. The average national proportions receiving more in-person and more online teaching than wanted are 35.0% and 23.7%, respectively. These figures are averages of national proportions, rather than pooled estimates for all European students.
Mean satisfaction ratings for the six digital services range from 3.21 to 3.71. The digital accessibility of administrative services (3.71) and of learning materials (3.69) receives the highest ratings, whilst counselling services (3.21) score the lowest. Recorded lectures receive a mean rating of 3.40, with system means ranging from 2.67 in Portugal to 4.03 in Iceland. These results describe satisfaction with digital availability; they do not directly measure service quality or differences in provision between individual institutions.
The mean peer-integration score is 3.48, while the mean dropout intention is 1.64. The latter indicates relatively low average agreement with the intention to leave higher education and should not be interpreted as an observed dropout rate.
5.2. Digital Learning Among Business and Administration Students
Table 4 compares Business and Administration students with both the overall student population and students in all other fields, using paired differences within education systems. The interpretation considers Holm-adjusted p-values, confidence intervals, and effect sizes, as described in Section 4.3.
Table 4.
Paired differences between Business and Administration students and (a) all students and (b) non-Business students across systems.
The results support the first hypothesis: in 96% of systems (22 out of 23), Business students have a higher mean preferred online learning score than all students, with a mean difference of +0.24 (p < 0.001; 95% CI 0.17–0.31; r_rb = 0.91). Relative to non-Business students, the difference is +0.29 and remains significant after Holm correction (pHolm < 0.001). These differences concern scores on the five-point preferred-mode scale.
Business students also report more online teaching in 91% of systems (mean difference +0.19; p < 0.001; pHolm = 0.008). They assign greater importance to digital tools in the work environment (+0.24; p < 0.001). These are additional findings from the group comparison, rather than direct tests of H1, which concerns the preferred mode of learning. Among the twenty fields distinguished in ES8, only ICT has a larger mean difference from the all-student average in preferred online learning (+0.26). The broader field “Social sciences, journalism and information”, which includes economics, lies slightly below that average (−0.07). This comparison concerns the broader field and does not isolate economics students.
Average satisfaction is higher among Business students for all six digital services, with mean differences ranging from +0.06 for recorded lectures to +0.13 for online examinations. After Holm correction, the differences remain statistically significant for four services: live online lectures, online examinations, study materials, and administrative services. The differences for recorded lectures (pHolm = 0.35) and counselling services (pHolm = 0.11) do not remain significant. The differences are small in scale: 0.06–0.13 points on a five-point scale, equivalent to 0.17–0.41 cross-system standard deviations. They therefore indicate modest differences in reported satisfaction.
For learning resources, Business students report better internet connections and greater access to a quiet place to study; both differences remain statistically significant after Holm correction. The differences in digital skills, access to a computer, and access to a desk are not statistically significant. Thus, the group’s greater preference for online learning is accompanied by advantages in some aspects of the home learning environment.
Integration with fellow students is below the average (−0.09; p = 0.002; pHolm = 0.027; r_rb = −0.69; −0.12 relative to non-Business students), with a positive difference in only 29% of systems. Business students therefore report both a stronger preference for online learning and weaker integration with fellow students. This co-occurrence is descriptive: the data do not show that online learning causes lower integration. Differences in age, employment, study intensity, or programme organisation may also contribute to this pattern.
The three indicators concerning relationships with academic staff—feedback, motivation, and clarity of teaching—and the indicator of dropout intention show no statistically significant differences. These results do not establish that the groups are identical, nor do they demonstrate that online learning has no effect on teaching experiences or intentions to leave.
Selected sensitivity checks retain the main findings. Excluding Germany and Switzerland, the systems surveyed in 2023, or both groups, leave the preferred-mode difference positive (+0.24 to +0.29; p < 0.001) and the peer-integration difference negative (−0.11 to −0.13; p ≤ 0.002). These are unadjusted p-values for the selected comparisons. Excluding Azerbaijan and Georgia also preserves the direction of the key differences. These checks reduce concerns about dependence on particular systems or survey years, although they do not remove other differences between national contexts.
5.3. Three Exploratory Profiles of National Systems
The k-means clustering applied to eight standardised indicators (the five components of digital capital, the reported extent of online teaching, the composite satisfaction with digital services score, and integration with fellow students) encompasses twenty-two systems with complete data.
The two-cluster solution has the highest silhouette coefficient (0.45). It separates Azerbaijan and Georgia from the remaining twenty systems, mainly reflecting differences in digital capital, whose five indicators account for five of the eight clustering variables. It also agrees with Ward’s two-cluster solution (ARI = 1.00). The two groups show no statistically significant differences in the reported online learning score, satisfaction with digital services, or peer integration after Holm correction (pHolm ≥ 0.20). The three-cluster solution retains the same two-system group and divides the remaining twenty systems into two profiles (Table 5, Panel A). The additional distinction shows a combination of higher online learning and satisfaction scores and lower peer integration that is obscured when the twenty systems are pooled. This is the substantive reason for displaying the three-cluster solution. Its low silhouette coefficient (0.21) indicates considerable overlap. The four-cluster solution has a silhouette coefficient of 0.24 and introduces a single-system cluster for Azerbaijan. We use the two-cluster solution as the better-separated summary and the three-cluster solution as a more detailed exploratory description.
Table 5.
Comparison of the two- and three-cluster solutions (Panel A) and detailed profiles for three clusters (Panel B).
Four checks assess the stability and sensitivity of this solution. When individual systems are excluded in turn, the grouping of the remaining systems is unchanged in 19 of 22 cases, with a mean adjusted Rand index (ARI) of 0.96. When the five digital-capital indicators are replaced by one composite, giving equal weight to the four domains, the silhouette coefficient increases to 0.36 and the grouping remains very similar (ARI = 0.92). Ward’s hierarchical clustering also separates Azerbaijan and Georgia and broadly reproduces the online-intensive group, although agreement is more limited (ARI = 0.54). Finally, excluding Azerbaijan and Georgia produces two groups among the remaining twenty systems that reproduce the main distinction between the online-intensive and in-person-oriented profiles, with only Norway assigned differently.
Ireland is a borderline case, with a silhouette value close to zero and an assignment that changes across specifications. The solution obtained with 300 random initialisations places Ireland in the first cluster. This uncertainty, the moderate agreement with Ward’s three-cluster solution (ARI = 0.54), and the two-system third cluster limit the stability and transferability of the three-profile description.
Table 5, Panel B, presents the detailed three-cluster profiles and Kruskal–Wallis comparisons. The Holm-adjusted p-values are at or below 0.036 for the reported online learning score, satisfaction with digital services, and peer integration. None of the individual digital-capital indicators is statistically significant after correction. These comparisons describe differences on the same indicators used to form the clusters. They therefore provide an exploratory description of the fitted groups, without independently establishing that distinct clusters exist.
The first cluster has an online-intensive profile and includes eight systems: Estonia, Finland, Iceland, Ireland, Lithuania, Latvia, Malta, and Sweden. It combines the highest reported online learning score (3.02) with high satisfaction with digital services (3.76) and the lowest peer integration (3.34). The second cluster includes twelve systems and has an in-person-oriented profile. It records the lowest reported online learning score (2.06), the lowest satisfaction with digital services (3.38), and intermediate peer integration (3.53). The third cluster comprises Azerbaijan and Georgia. Its resource constraints are most apparent in digital skills (3.96), computer access (4.29), and internet access (4.17), while peer integration is the highest of the three groups (3.78). The labels describe average patterns within this dataset.
The comparison between the first two profiles suggests that more online teaching can coexist with higher satisfaction with digital services and weaker peer integration. As in Section 5.2, this is a descriptive association. The profiles concern system averages and do not establish that online teaching causes either greater satisfaction or lower integration among individual students.
5.4. Digitalisation, Integration, and Dropout Intention: Cross-National Relationships
Table 6 summarises five system-level correlations across twenty-two education systems, with confidence intervals and Holm-adjusted p-values. Figure 2 shows the same relationships with each point labelled by education system. Table 7 presents additional exploratory and sensitivity analyses. Its p-values are unadjusted.
Table 6.
Country-level correlations (n = 22, all students).
Figure 2.
Five system-level correlations for all students (n = 22). Panels (A,B) show the reported online learning score against satisfaction and peer integration, respectively. Panel (C) uses the preferred online learning score. Panels (D,E) show H2 and H4. The dashed lines are descriptive linear fits. Holm adjustment covers the five Pearson correlations in Table 6.
Table 7.
Sensitivity analyses at the system level.
The results support H3 at the system level: a higher reported online learning score is negatively associated with integration with fellow students (r = −0.55; p = 0.008; 95% CI −0.79 to −0.17; pHolm = 0.031). The Spearman correlation has the same direction (ρ = −0.48; p = 0.025). In the leave-one-out checks, Pearson’s r remains negative, ranging from −0.63 to −0.42. The association also remains negative when the systems surveyed in 2023 are excluded (r = −0.60; p = 0.009), when Azerbaijan and Georgia are excluded (r = −0.64; p = 0.002), and after jointly controlling for survey year and digital capital (partial r = −0.66; p = 0.002). These checks indicate that the observed association does not depend on the inclusion of a single system, although other contextual explanations remain possible.
Additional analyses find a negative association between online teaching and peer integration among Business and Administration students across systems (r = −0.63; p = 0.002). A larger Business–non-Business difference in online teaching is also associated with a more negative Business–non-Business difference in peer integration (r = −0.70; p < 0.001). Both analyses compare system-level indicators; they do not estimate relationships between individual students’ experiences.
For general belonging to the institution, the estimate is small and statistically non-significant (r = −0.16; p = 0.502; n = 21). Satisfaction with live online and recorded lectures also shows no statistically significant association with peer integration (r = −0.17 and −0.09, respectively). These findings do not establish an absence of relationships. Moreover, satisfaction with these services does not measure how much synchronous or asynchronous teaching students receive. The learning-mode questions do not distinguish between these forms, so their separate contributions to peer integration cannot be assessed.
A positive association is observed between the reported online learning score and satisfaction with digital services (r = 0.67; p < 0.001; 95% CI 0.35–0.85; pHolm = 0.003). The coefficient remains positive when the systems surveyed in 2023 are excluded (r = 0.53; unadjusted p = 0.025) and after jointly controlling for survey year and digital capital (partial r = 0.53; p = 0.016). The service-specific analyses in Table 7 show positive correlations for satisfaction with live online lectures (r = 0.64), recorded lectures (r = 0.63), online examinations (r = 0.77), and counselling services (r = 0.51), with unadjusted p-values below 0.05. The estimates for study materials (r = 0.27) and administrative services (r = 0.38) do not reach this threshold. These exploratory findings describe reported satisfaction and do not directly establish the quality of institutional provision.
In Figure 2A, omitting one system at a time gives correlations from 0.61 to 0.77 (Table 6). The corresponding range for Figure 2B is −0.63 to −0.42. These ranges show that the direction of each association is stable to omitting any one system. The spread of points also shows that systems with similar online learning scores can differ in satisfaction and peer integration.
H2 is not supported by the system-level analysis. The digital capital composite is weakly negatively correlated with satisfaction (r = −0.20, 95% CI −0.57 to 0.24, p = 0.371). The component estimates clarify what the composite averages together (Table 7). Self-assessed skill sufficiency is close to zero (r = −0.03, p = 0.882), whereas the home-resource composite has a more negative point estimate (r = −0.24, p = 0.275). Among the four home items, correlations with overall satisfaction range from −0.19 for computer access to −0.09 for internet access. These estimates are imprecise and do not establish a difference between the skills and resource associations. Across the 49 exploratory component and composite comparisons, the only unadjusted p-value below 0.05 was for computer access and satisfaction with study materials (r = −0.51). This result did not survive the Holm correction. Alternative PCA-based and z-standardised composites also yield negative estimates (r = −0.16 and −0.20). The quadratic term is statistically non-significant (b = −2.19, p = 0.452), and R2 increases from 0.04 to 0.07. The data provide insufficient evidence for the tested quadratic relationship.
H4 is likewise not supported. The correlation between mode mismatch and dropout intention is small and statistically non-significant (r = 0.13; 95% CI −0.31 to 0.52; p = 0.573). The wide interval makes the result inconclusive. Measures calculated from the distributions of individual responses give similar findings: mean absolute deviation from full correspondence (r = −0.05; p = 0.818), the share reporting any mismatch (r = −0.06; p = 0.805), and the share reporting considerable mismatch (r = −0.01; p = 0.975). No statistically significant associations are found for the directional mismatch shares or when dropout intention is expressed as the share selecting the top two agreement categories. All these relationships are tested between systems.
The absolute deviation of the system-mean match score and the mean absolute deviation of individual responses are only weakly correlated (r = 0.10). This illustrates why the two measures are not interchangeable: opposing individual preferences can offset one another in a system’s mean. Neither operationalisation provides sufficient evidence for H4 in these data. The findings concern reported intentions to leave, rather than observed withdrawal from higher education.
These findings must be read with the explicit caveat that they pertain to education systems rather than to individual students: the absence of a relationship at the aggregate level does not preclude its presence at the individual level, and vice versa. The cross-sectional associations also remain open to differences in student composition, programme organisation, and national context. They do not establish causal effects of online teaching on satisfaction, integration, or dropout intention.
6. Discussion
The disciplinary contribution comes from comparing Business and Administration students with students in other fields within the same education systems. Their mean preferred online learning score exceeded that of all students in 22 of 23 systems. The average difference was larger when the comparison was restricted to students in other fields. Business and Administration students also reported higher satisfaction with all six digital services and lower peer integration. The satisfaction differences were small and remained statistically significant for four services after Holm correction. Together these findings show that a stronger preference for online learning and weaker peer integration can coexist in this broad field.
The greater importance that Business and Administration students attach to digital tools at work provides context for their learning preferences. The data do not establish whether professional expectations explain those preferences. Sangster, Stoner and Flood [54] bring together reflections from accounting educators in 45 countries, identifying opportunities to redesign teaching alongside difficulties involving stress and well-being. Sever Mališ, Mamić Sačer and Žager’s Croatian study [55] documents institutions’ capacity to move teaching online while highlighting the need for a national digitalisation framework and funding. These studies help frame questions for accounting, finance, and management programmes. Our data cover Business and Administration as a single field, so differences among those disciplines remain unknown.
A stronger relative preference for online learning does not establish support for fully online programmes or for the same delivery mode across all courses. Mistry, Megally and Rashed [12], studying accounting and finance students at one UK university, report preferences that vary across modules: calculation-based subjects such as financial accounting are preferred on campus, while theoretical subjects such as business law are preferred online. Students cite access to recordings, flexibility, and time saved as the advantages of the online format, and better concentration, immediate assistance from academic staff, and learning within a community as the reasons for preferring in-person instruction. Our broader field-level comparison cannot identify preferences within individual accounting courses. It complements this literature by examining whether the relative preference for online learning is observed across national contexts.
The cross-system correlations address a separate question. Among all students in the 22 systems, a higher reported online learning score is associated with lower peer integration (H3, r = −0.55) and higher satisfaction with digital services (r = 0.67). Both estimates remain statistically significant after Holm correction. Their magnitudes describe how the system averages vary together. The estimates do not quantify how much satisfaction or integration would change if a programme changed its delivery mode. Resch, Alnahdi and Schwab [13] report declines in social and academic integration during emergency remote education in Austria. Our system averages describe a different period and do not track those students over time. The Community of Inquiry framework [47] offers a conceptual basis for considering interaction, placing social presence alongside cognitive and teaching presence in the educational experience.
Several contextual explanations remain possible. Institutional digital strategies and support arrangements, discussed in the EUA reports [4,8], may influence both teaching arrangements and students’ assessments. National digital conditions, documented for EU countries through DESI [70], provide another relevant context. Student composition, including age, employment, and study intensity [9], may also contribute to differences in preferences and opportunities for campus interaction. The sensitivity checks retain the negative association between online teaching and peer integration, but they do not remove all national, institutional, or compositional differences. Testing these explanations would require additional contextual indicators or individual-level data.
Variation between system estimates and sampling uncertainty within each survey are distinct. Two systems may have different published scores even when their underlying values are similar, and a smaller or more complex national sample can yield a less precise estimate. Our tests and confidence intervals use the system estimates as observed. They do not incorporate the national survey design or propagate the sampling error of each estimate. The results therefore describe the participating systems under the equal-weight specification.
The organisation of online interaction is another consideration. Hrastinski [39] distinguishes the flexibility and opportunities for reflection offered by asynchronous communication from the immediate exchange supported by synchronous communication. Asynchronous discussion can also sustain interaction between students; its social role depends on how it is designed and used. EUROSTUDENT 8 distinguishes satisfaction with live online and recorded lectures, but does not measure their separate contributions to the overall extent of online teaching. The present analysis therefore cannot determine whether either form explains the observed peer-integration pattern.
Research on online belonging also identifies possibilities for building community. Peacock et al.’s small-scale exploratory study [37] identifies interaction and engagement, learning culture, and support as important themes in postgraduate online learners’ experiences of belonging. These findings suggest questions about how opportunities for peer contact are organised. Our negative correlation does not identify a particular shortcoming in course design. Equally, the non-significant estimate for general institutional belonging does not establish that attachment to the institution is unaffected. Peer integration and institutional belonging should remain distinct outcomes in the interpretation.
The findings for H4 require similar caution. Tinto’s models [15,16] and Kahu and Nelson’s engagement framework [60] highlight relationships involving integration, engagement, and student persistence. Our test addresses the narrower association between learning-mode mismatch and reported dropout intention across systems. It does not directly assess the full pathways described by these frameworks. Neither operationalisation of mismatch provides sufficient support for H4, and the main confidence interval is wide (−0.31 to 0.52). Measures derived from individual response distributions improve the description of mismatch, but their correlations are still calculated between systems. The results do not establish how mismatch influences an individual student’s intention to leave, or whether that intention leads to actual withdrawal.
Digital-capital theory [40] and research on differences in students’ digitalisation [44] draw attention to resources, skills, and inequalities that national averages may conceal. The low internal consistency of the composite (α = 0.58) limits its interpretation as a single dimension. Self-assessed skill sufficiency can be high in a system where study space or internet access is less widely available. Conversely, widespread equipment access says little about perceived readiness to learn digitally. High average access ratings can also compress differences between systems. The near-zero estimate for skills and the more negative, uncertain estimate for home resources suggest that the composite alone gives an incomplete account. Neither component analysis provides clear evidence of a positive system-level association with satisfaction. Individual-level data would be needed to assess how these resources relate to students’ experiences.
The systematic review by Martin, Sun and Westine [71], encompassing 619 studies, shows that the online learning literature is focused primarily on learner characteristics and engagement, whilst the organisational level—policy, governance, support, access, and inclusion—remains comparatively under-examined. The present system-level comparison contributes to this broader discussion, while leaving the institutional mechanisms unresolved. The additional analyses in Table 7 are exploratory and use unadjusted p-values; they identify questions for further investigation.
The positive association between online teaching and satisfaction with digital services must not be interpreted causally. The positive association between the reported online learning score and satisfaction may reflect more developed services, expansion of online provision where students receive it favourably, or other conditions affecting both indicators. The reported online learning score is not a direct measure of institutional quality, and satisfaction is a student assessment. The data therefore motivate closer examination of institutional conditions without establishing that expanding online teaching would itself increase satisfaction.
The two-cluster solution distinguishes Azerbaijan and Georgia from the other twenty systems. Splitting those twenty systems into two exploratory profiles highlights how higher reported online learning and satisfaction scores coexist with weaker peer integration in one group. Azerbaijan and Georgia combine lower scores for digital skills, computer access, and internet access with high satisfaction and peer integration. These profiles are consistent with the Rome Communiqué’s recognition that digitalisation requires approaches suited to different contexts [6]. The lower silhouette coefficient of the three-cluster solution, moderate agreement with Ward’s method, Ireland’s borderline assignment, and the two-system group limit its use as a classification beyond the observed data.
The observed combination of stronger online learning preferences and lower peer integration in Business and Administration identifies two outcomes that faculties can monitor when evaluating delivery formats. Previous research [10,12] suggests testing combinations of accessible recordings and online materials with in-person seminars, tutorials, or case work, depending on the learning objectives. Structured teamwork, regular contact with academic staff, and opportunities to build community are further approaches informed by the literature [37]. The present analyses do not estimate the effects of these practices. Institutions and programmes would need to assess their suitability using student feedback and measures of learning, participation, and peer interaction. Separate evaluations in accounting, finance, and management would be needed to establish whether the approaches work similarly across those disciplines.
7. Conclusions
Using aggregated EUROSTUDENT 8 indicators from 25 education systems, this study compares Business and Administration students with all students and students in other fields. The field group shows a stronger relative preference for online learning and lower peer integration. Its higher mean satisfaction scores span all six services, with small differences that remain statistically significant for four services after Holm correction. Among all students in the 22 systems used for the main correlational analysis, the reported online learning score is positively associated with satisfaction and negatively associated with peer integration. The evidence is insufficient to support H2 concerning digital capital and satisfaction, or H4 concerning mode mismatch and dropout intention. The two-cluster solution is better separated, while the three-cluster solution provides a more detailed exploratory description of the same 22 systems.
For universities, particularly business faculties, these patterns motivate evaluating delivery formats alongside opportunities for peer interaction. The approaches discussed in Section 6 are drawn from previous research and require evaluation within specific institutions and programmes. The present data do not estimate their effects on learning, engagement, or persistence.
The conclusions must be considered within the context of several limitations. All correlations concern aggregated characteristics of education systems. Individual relationships may differ from the patterns observed between national averages and require individual-level data for assessment. The main correlation and cluster analyses include twenty-two systems, which limits statistical power and the precision of some estimates. The reported confidence intervals do not incorporate the full sampling uncertainty of each national survey. Selected sensitivity checks assess dependence on sample composition, but cannot remove all contextual differences. The low silhouette coefficient, Ireland’s borderline position, and the two-system third cluster further limit the strength of the exploratory typology.
The 22 systems with complete data are a subset of the 25 systems covered by the dataset. The associations and cluster profiles describe that subset for the survey periods observed. Extending them to other systems or periods requires further evidence. Inferences about individual students require individual-level data.
Fieldwork periods range from 2020 to 2023. Germany and Switzerland, surveyed in 2021 and 2020, respectively, contribute only to selected paired comparisons and are excluded from the main correlation and cluster analyses. The latter use data from 2022–2023. Selected paired comparisons were repeated without the earlier systems, while the main correlations were reassessed without the four systems surveyed in 2023. Controls for survey year and digital capital were applied to the relationships of online teaching with integration and satisfaction. These checks do not fully separate survey timing from national characteristics or establish causal direction.
Additional limitations arise from the nature of the data. The EUROSTUDENT target population encompasses only enrolled students and therefore does not capture the experiences of those who have already left higher education, whilst the dropout intention indicator measures stated intention rather than actual behaviour. The analysis uses aggregated self-reports, and national averages may conceal inequalities and differing experiences within systems. Means calculated from published categorical distributions also involve treating ordinal response categories as approximately equally spaced. The digital-capital composite covers selected resources and self-assessed skill sufficiency, rather than the full theoretical concept or objectively tested competence.
Fully online students are included in the standard EUROSTUDENT 8 target population when they reside in the survey country during the current lecture period; distance students living outside that country are excluded. National deviations from the standard target population also need to be considered. Breakdowns by field of study are not available for every indicator in every system owing to the suppression of cells with small numbers of observations. The Business and Administration category does not permit separate analysis of accounting, finance, management, or marketing. Economics is included within the broader social-sciences category and cannot be isolated in these comparisons. Findings for Business and Administration therefore cannot automatically be attributed to its individual subfields or extended to economics programmes.
A further limitation concerns the changing technological context. The 2020–2023 fieldwork largely precedes, or overlaps with the early diffusion of, generative AI in education. The implications for learning, assessment, and business and accounting curricula discussed in the literature [53,72,73] are not directly measured by the indicators analysed here. The findings describe digital teaching and student assessments during that period. Whether the observed associations persist in AI-supported learning environments requires updated evidence, including direct measures of AI use and its relationship with peer interaction and support.
Future research should first examine these relationships using individual-level microdata. An application for access to the EUROSTUDENT 8 research file has been submitted. Multilevel models could distinguish individual and system-level associations and assess the roles of resources, learning-mode preferences, mismatch, and integration more precisely. Further comparative studies could link student indicators with national and institutional contextual data, distinguish synchronous from asynchronous teaching, and analyse disciplinary subfields separately. Longitudinal evidence would also help establish how preferences, integration, and intentions change over time and whether intentions are followed by withdrawal. Subsequent studies should include generative AI use and evaluate specific teaching arrangements for their capacity to combine flexibility, learning, and participation in an academic community.
Supplementary Materials
The following supporting information can be downloaded at https://www.mdpi.com/article/10.3390/higheredu5040139/s1, Table S1: System-level analytical dataset (EUROSTUDENT 8 indicators for all, Business and Administration, and non-Business students, including the derived mismatch measures); File S2: Analysis code, documented aggregate inputs, and instructions for reproducing the results and figures.
Author Contributions
Conceptualization, V.G. and R.K.-H.; methodology, V.G.; software, V.G.; validation, V.G. and R.K.-H.; formal analysis, V.G.; investigation, V.G. and R.K.-H.; resources, V.G.; data curation, V.G.; writing—original draft preparation, V.G. and R.K.-H.; writing—review and editing, V.G. and R.K.-H.; visualization, V.G.; supervision, V.G. and R.K.-H.; project administration, V.G.; funding acquisition, V.G. All authors have read and agreed to the published version of the manuscript.
Funding
This research received no external funding.
Institutional Review Board Statement
Not applicable. The study is based exclusively on publicly available aggregate statistical data and does not involve human participants or animals.
Informed Consent Statement
Not applicable.
Data Availability Statement
The aggregate data analysed in this study are publicly available through the EUROSTUDENT 8 Database (Data Reporting Module) at https://database.eurostudent.eu/drm/ (accessed on 28 August 2026). The analyses use downloadable data files from the thematic areas K—Assessment of Studies and Performance, O—Equipment at Home, and P—Digitalisation. The system-level analytical dataset was derived from the published country- and focus-group distributions using the procedures described in Section 4. No individual-level or restricted-access microdata were used. The derived system-level analytical dataset (Table S1) and the documented code and aggregate inputs (File S2) are provided as Supplementary Materials.
Acknowledgments
During the preparation of this manuscript, the authors used OpenAI Codex (GPT-6.1 Sol) solely for language and editorial refinement. The authors have reviewed, verified, and edited all content and take full responsibility for the content of this publication.
Conflicts of Interest
The authors declare no conflicts of interest.
References
- Rapanta, C.; Botturi, L.; Goodyear, P.; Guàrdia, L.; Koole, M. Balancing Technology, Pedagogy and the New Normal: Post-Pandemic Challenges for Higher Education. Postdigit. Sci. Educ. 2021, 3, 715–742. [Google Scholar] [CrossRef] [Scilit] [PubMed]
- Bond, M.; Bedenlier, S.; Marín, V.I.; Händel, M. Emergency Remote Teaching in Higher Education: Mapping the First Global Online Semester. Int. J. Educ. Technol. High. Educ. 2021, 18, 50, Correction in 2021, 18, 61. https://doi.org/10.1186/s41239-021-00298-3. [Google Scholar] [CrossRef] [Scilit] [PubMed]
- Farnell, T.; Skledar Matijević, A.; Šćukanec Schmidt, N. The Impact of COVID-19 on Higher Education: A Review of Emerging Evidence; NESET Analytical Report; Publications Office of the European Union: Luxembourg, 2021. [Google Scholar] [CrossRef]
- Gaebel, M.; Zhang, T.; Stoeber, H.; Morrisroe, A. Digitally Enhanced Learning and Teaching in European Higher Education Institutions: Survey Report; European University Association: Brussels, Belgium; Geneva, Switzerland, 2021; Available online: https://www.eua.eu/publications/reports/digitally-enhanced-learning-and-teaching-in-european-higher-education-institutions.html (accessed on 28 August 2026).
- Aristovnik, A.; Keržič, D.; Ravšelj, D.; Tomaževič, N.; Umek, L. Impacts of the COVID-19 Pandemic on Life of Higher Education Students: A Global Perspective. Sustainability 2020, 12, 8438. [Google Scholar] [CrossRef] [Scilit]
- EHEA. Rome Ministerial Communiqué, 19 November 2020; European Higher Education Area: Rome, Italy, 2020; Available online: https://ehea.info/Upload/Rome_Ministerial_Communique.pdf (accessed on 28 August 2026).
- European Commission. Digital Education Action Plan 2021–2027: Resetting Education and Training for the Digital Age; COM(2020) 624 final; European Commission: Brussels, Belgium, 2020; Available online: https://eur-lex.europa.eu/legal-content/EN/TXT/?uri=CELEX:52020DC0624 (accessed on 28 August 2026).
- Gaebel, M.; Morrisroe, A. The Future of Digitally Enhanced Learning and Teaching in European Higher Education Institutions: DIGI-HE Final Report; European University Association: Brussels, Belgium; Geneva, Switzerland, 2023; Available online: https://www.eua.eu/publications/reports/the-future-of-digitally-enhanced-learning-and-teaching-in-european-higher-education-institutions.html (accessed on 28 August 2026).
- Schirmer, H. Digitalisation of Teaching, Learning, and Student Life: EUROSTUDENT 8 Topical Module Report; German Centre for Higher Education Research and Science Studies (DZHW): Hannover, Germany, 2024; Available online: https://www.eurostudent.eu/download_files/documents/TM_Digitalisation.pdf (accessed on 28 August 2026).
- Paechter, M.; Maier, B. Online or Face-to-Face? Students’ Experiences and Preferences in E-Learning. Internet High. Educ. 2010, 13, 292–297. [Google Scholar] [CrossRef] [Scilit]
- Kemp, N.; Grieve, R. Face-to-Face or Face-to-Screen? Undergraduates’ Opinions and Test Performance in Classroom vs. Online Learning. Front. Psychol. 2014, 5, 1278. [Google Scholar] [CrossRef] [Scilit] [PubMed]
- Mistry, U.; Megally, R.; Rashed, R.A. Students’ Preferences for Teaching and Exam Delivery Modes in Accounting Education Post-COVID-19 Pandemic. Account. Educ. 2025, 34, 533–565. [Google Scholar] [CrossRef] [Scilit]
- Resch, K.; Alnahdi, G.H.; Schwab, S. Exploring the Effects of the COVID-19 Emergency Remote Education on Students’ Social and Academic Integration in Higher Education in Austria. High. Educ. Res. Dev. 2023, 42, 215–229. [Google Scholar] [CrossRef] [Scilit]
- Elmer, T.; Mepham, K.; Stadtfeld, C. Students under Lockdown: Comparisons of Students’ Social Networks and Mental Health before and during the COVID-19 Crisis in Switzerland. PLoS ONE 2020, 15, e0236337. [Google Scholar] [CrossRef] [Scilit] [PubMed]
- Tinto, V. Dropout from Higher Education: A Theoretical Synthesis of Recent Research. Rev. Educ. Res. 1975, 45, 89–125. [Google Scholar] [CrossRef]
- Tinto, V. Leaving College: Rethinking the Causes and Cures of Student Attrition, 2nd ed.; University of Chicago Press: Chicago, IL, USA, 1993. [Google Scholar]
- Pascarella, E.T.; Terenzini, P.T. How College Affects Students: A Third Decade of Research; Jossey-Bass: San Francisco, CA, USA, 2005; Volume 2. [Google Scholar]
- Strayhorn, T.L. College Students’ Sense of Belonging: A Key to Educational Success for All Students, 2nd ed.; Routledge: New York, NY, USA, 2019. [Google Scholar]
- Bernard, R.M.; Abrami, P.C.; Lou, Y.; Borokhovski, E.; Wade, A.; Wozney, L.; Wallet, P.A.; Fiset, M.; Huang, B. How Does Distance Education Compare with Classroom Instruction? A Meta-Analysis of the Empirical Literature. Rev. Educ. Res. 2004, 74, 379–439. [Google Scholar] [CrossRef] [Scilit]
- Means, B.; Toyama, Y.; Murphy, R.; Baki, M. The Effectiveness of Online and Blended Learning: A Meta-Analysis of the Empirical Literature. Teach. Coll. Rec. 2013, 115, 1–47. [Google Scholar] [CrossRef] [Scilit]
- Figlio, D.; Rush, M.; Yin, L. Is It Live or Is It Internet? Experimental Estimates of the Effects of Online Instruction on Student Learning. J. Labor Econ. 2013, 31, 763–784. [Google Scholar] [CrossRef] [Scilit]
- Alpert, W.T.; Couch, K.A.; Harmon, O.R. A Randomized Assessment of Online Learning. Am. Econ. Rev. 2016, 106, 378–382. [Google Scholar] [CrossRef] [Scilit]
- Bettinger, E.P.; Fox, L.; Loeb, S.; Taylor, E.S. Virtual Classrooms: How Online College Courses Affect Student Success. Am. Econ. Rev. 2017, 107, 2855–2875. [Google Scholar] [CrossRef] [Scilit]
- Chen, P.-S.D.; Lambert, A.D.; Guidry, K.R. Engaging Online Learners: The Impact of Web-Based Learning Technology on College Student Engagement. Comput. Educ. 2010, 54, 1222–1232. [Google Scholar] [CrossRef] [Scilit]
- Dumford, A.D.; Miller, A.L. Online Learning in Higher Education: Exploring Advantages and Disadvantages for Engagement. J. Comput. High. Educ. 2018, 30, 452–465. [Google Scholar] [CrossRef] [Scilit]
- Xu, D.; Jaggars, S.S. Performance Gaps between Online and Face-to-Face Courses: Differences across Types of Students and Academic Subject Areas. J. High. Educ. 2014, 85, 633–659. [Google Scholar] [CrossRef] [Scilit]
- Neumann, R.; Parry, S.; Becher, T. Teaching and Learning in Their Disciplinary Contexts: A Conceptual Analysis. Stud. High. Educ. 2002, 27, 405–417. [Google Scholar] [CrossRef] [Scilit]
- Biglan, A. The Characteristics of Subject Matter in Different Academic Areas. J. Appl. Psychol. 1973, 57, 195–203. [Google Scholar] [CrossRef] [Scilit]
- Pan, G.; Seow, P.-S. Preparing Accounting Graduates for Digital Revolution: A Critical Review of Information Technology Competencies and Skills Development. J. Educ. Bus. 2016, 91, 166–175. [Google Scholar] [CrossRef] [Scilit]
- Al-Htaybat, K.; von Alberti-Alhtaybat, L.; Alhatabat, Z. Educating Digital Natives for the Future: Accounting Educators’ Evaluation of the Accounting Curriculum. Account. Educ. 2018, 27, 333–357. [Google Scholar] [CrossRef] [Scilit]
- UNESCO Institute for Statistics. ISCED Fields of Education and Training 2013 (ISCED-F 2013); UNESCO Institute for Statistics: Montreal, QC, Canada, 2014. [Google Scholar] [CrossRef] [Scilit]
- Orr, D.; Luebcke, M.; Schmidt, J.P.; Ebner, M.; Wannemacher, K.; Ebner, M.; Dohmen, D. Higher Education Landscape 2030: A Trend Analysis Based on the AHEAD International Horizon Scanning; SpringerBriefs in Education; Springer: Cham, Switzerland, 2020. [Google Scholar] [CrossRef] [Scilit]
- Jakoet-Salie, A.; Ramalobe, K. The Digitalization of Learning and Teaching Practices in Higher Education Institutions during the COVID-19 Pandemic. Teach. Public Adm. 2023, 41, 59–71. [Google Scholar] [CrossRef] [Scilit]
- Hodges, C.B.; Moore, S.; Lockee, B.B.; Trust, T.; Bond, M.A. The Difference between Emergency Remote Teaching and Online Learning. EDUCAUSE Review, 27 March 2020. Available online: https://er.educause.edu/articles/2020/3/the-difference-between-emergency-remote-teaching-and-online-learning (accessed on 28 August 2026).
- Chipriyanova, G.; Atanasov, A.; Krasteva-Hristova, R.; Luchkov, K. Contemporary Training in Financial Accounting—Synthesis between Traditional Methods and New Digital Instruments. IJAEDU Int. E-J. Adv. Educ. 2022, 8, 49–59. [Google Scholar] [CrossRef] [Scilit]
- Bond, M.; Buntins, K.; Bedenlier, S.; Zawacki-Richter, O.; Kerres, M. Mapping Research in Student Engagement and Educational Technology in Higher Education: A Systematic Evidence Map. Int. J. Educ. Technol. High. Educ. 2020, 17, 2. [Google Scholar] [CrossRef] [Scilit]
- Peacock, S.; Cowan, J.; Irvine, L.; Williams, J. An Exploration into the Importance of a Sense of Belonging for Online Learners. Int. Rev. Res. Open Distrib. Learn. 2020, 21, 18–35. [Google Scholar] [CrossRef] [Scilit]
- Rovai, A.P. Building Sense of Community at a Distance. Int. Rev. Res. Open Distrib. Learn. 2002, 3, 1–16. [Google Scholar] [CrossRef] [Scilit]
- Hrastinski, S. Asynchronous and Synchronous E-Learning. Educ. Q. 2008, 31, 51–55. [Google Scholar]
- Ragnedda, M.; Ruiu, M.L. Digital Capital: A Bourdieusian Perspective on the Digital Divide; Emerald Publishing: Bingley, UK, 2020. [Google Scholar] [CrossRef] [Scilit]
- Ragnedda, M.; Ruiu, M.L.; Addeo, F. Measuring Digital Capital: An Empirical Investigation. New Media Soc. 2020, 22, 793–816. [Google Scholar] [CrossRef] [Scilit]
- Hargittai, E. Digital Na(t)ives? Variation in Internet Skills and Uses among Members of the “Net Generation”. Sociol. Inq. 2010, 80, 92–113. [Google Scholar] [CrossRef] [Scilit]
- Margaryan, A.; Littlejohn, A.; Vojt, G. Are Digital Natives a Myth or Reality? University Students’ Use of Digital Technologies. Comput. Educ. 2011, 56, 429–440. [Google Scholar] [CrossRef] [Scilit]
- Janschitz, G.; Penker, M. How Digital Are “Digital Natives” Actually? Developing an Instrument to Measure the Degree of Digitalisation of University Students—The DDS-Index. Bull. Sociol. Methodol. 2022, 153, 127–159. [Google Scholar] [CrossRef] [Scilit]
- Spante, M.; Sofkova Hashemi, S.; Lundin, M.; Algers, A. Digital Competence and Digital Literacy in Higher Education Research: Systematic Review of Concept Use. Cogent Educ. 2018, 5, 1519143. [Google Scholar] [CrossRef] [Scilit]
- Zhao, Y.; Pinto Llorente, A.M.; Sánchez Gómez, M.C. Digital Competence in Higher Education Research: A Systematic Literature Review. Comput. Educ. 2021, 168, 104212. [Google Scholar] [CrossRef] [Scilit] [PubMed]
- Garrison, D.R.; Anderson, T.; Archer, W. Critical Inquiry in a Text-Based Environment: Computer Conferencing in Higher Education. Internet High. Educ. 2000, 2, 87–105. [Google Scholar] [CrossRef] [Scilit]
- Richardson, J.C.; Maeda, Y.; Lv, J.; Caskurlu, S. Social Presence in Relation to Students’ Satisfaction and Learning in the Online Environment: A Meta-Analysis. Comput. Hum. Behav. 2017, 71, 402–417. [Google Scholar] [CrossRef] [Scilit]
- Ellison, N.B.; Steinfield, C.; Lampe, C. The Benefits of Facebook “Friends”: Social Capital and College Students’ Use of Online Social Network Sites. J. Comput.-Mediat. Commun. 2007, 12, 1143–1168. [Google Scholar] [CrossRef] [Scilit]
- Sledgianowski, D.; Gomaa, M.; Tan, C. Toward Integration of Big Data, Technology and Information Systems Competencies into the Accounting Curriculum. J. Account. Educ. 2017, 38, 81–93. [Google Scholar] [CrossRef] [Scilit]
- Dzuranin, A.C.; Jones, J.R.; Olvera, R.M. Infusing Data Analytics into the Accounting Curriculum: A Framework and Insights from Faculty. J. Account. Educ. 2018, 43, 24–39. [Google Scholar] [CrossRef] [Scilit]
- Qasim, A.; Kharbat, F.F. Blockchain Technology, Business Data Analytics, and Artificial Intelligence: Use in the Accounting Profession and Ideas for Inclusion into the Accounting Curriculum. J. Emerg. Technol. Account. 2020, 17, 107–117. [Google Scholar] [CrossRef] [Scilit]
- Ballantine, J.A.; Boyce, G.; Stoner, G. A Critical Review of AI in Accounting Education: Threat and Opportunity. Crit. Perspect. Account. 2024, 99, 102711. [Google Scholar] [CrossRef] [Scilit]
- Sangster, A.; Stoner, G.; Flood, B. Insights into Accounting Education in a COVID-19 World. Account. Educ. 2020, 29, 431–562. [Google Scholar] [CrossRef] [Scilit]
- Sever Mališ, S.; Mamić Sačer, I.; Žager, K. Landscape of e-Learning during COVID-19: Case Study of Economic Disciplines in Croatia. Bus. Syst. Res. 2022, 13, 8–27. [Google Scholar] [CrossRef] [Scilit]
- Pavić, I.; Mijušković, V.M.; Žager, L. Which Digital Tools Dominate Secondary and Higher Education in Economics: Google, Microsoft or Zoom? Bus. Syst. Res. 2022, 13, 117–134. [Google Scholar] [CrossRef] [Scilit]
- Arbaugh, J.B.; Godfrey, M.R.; Johnson, M.; Pollack, B.L.; Niendorf, B.; Wresch, W. Research in Online and Blended Learning in the Business Disciplines: Key Findings and Possible Future Directions. Internet High. Educ. 2009, 12, 71–87. [Google Scholar] [CrossRef] [Scilit]
- Arbaugh, J.B. What Might Online Delivery Teach Us about Blended Management Education? Prior Perspectives and Future Directions. J. Manag. Educ. 2014, 38, 784–817. [Google Scholar] [CrossRef] [Scilit]
- Joyce, T.; Crockett, S.; Jaeger, D.A.; Altindag, O.; O’Connell, S.D. Does Classroom Time Matter? Econ. Educ. Rev. 2015, 46, 64–77. [Google Scholar] [CrossRef] [Scilit]
- Kahu, E.R.; Nelson, K. Student Engagement in the Educational Interface: Understanding the Mechanisms of Student Success. High. Educ. Res. Dev. 2018, 37, 58–71. [Google Scholar] [CrossRef] [Scilit]
- Robinson, W.S. Ecological Correlations and the Behavior of Individuals. Am. Sociol. Rev. 1950, 15, 351–357. [Google Scholar] [CrossRef] [Scilit]
- Ferrer, J.; Ringer, A.; Saville, K.; Parris, M.A.; Kashi, K. Students’ Motivation and Engagement in Higher Education: The Importance of Attitude to Online Learning. High. Educ. 2022, 83, 317–338. [Google Scholar] [CrossRef] [Scilit]
- Alqurashi, E. Predicting Student Satisfaction and Perceived Learning within Online Learning Environments. Distance Educ. 2019, 40, 133–148. [Google Scholar] [CrossRef] [Scilit]
- Holm, S. A Simple Sequentially Rejective Multiple Test Procedure. Scand. J. Stat. 1979, 6, 65–70. [Google Scholar]
- Kerby, D.S. The Simple Difference Formula: An Approach to Teaching Nonparametric Correlation. Compr. Psychol. 2014, 3, 11.IT.3.1. [Google Scholar] [CrossRef] [Scilit]
- Wasserstein, R.L.; Lazar, N.A. The ASA Statement on p-Values: Context, Process, and Purpose. Am. Stat. 2016, 70, 129–133. [Google Scholar] [CrossRef] [Scilit]
- Altman, D.G.; Bland, J.M. Absence of Evidence Is Not Evidence of Absence. BMJ 1995, 311, 485. [Google Scholar] [CrossRef] [Scilit] [PubMed]
- Rousseeuw, P.J. Silhouettes: A Graphical Aid to the Interpretation and Validation of Cluster Analysis. J. Comput. Appl. Math. 1987, 20, 53–65. [Google Scholar] [CrossRef] [Scilit]
- Hubert, L.; Arabie, P. Comparing Partitions. J. Classif. 1985, 2, 193–218. [Google Scholar] [CrossRef] [Scilit]
- European Commission. Digital Economy and Society Index (DESI) 2022; European Commission: Brussels, Belgium, 2022; Available online: https://digital-strategy.ec.europa.eu/en/policies/desi (accessed on 23 October 2026).
- Martin, F.; Sun, T.; Westine, C.D. A Systematic Review of Research on Online Teaching and Learning from 2009 to 2018. Comput. Educ. 2020, 159, 104009. [Google Scholar] [CrossRef] [Scilit] [PubMed]
- Kasneci, E.; Sessler, K.; Küchemann, S.; Bannert, M.; Dementieva, D.; Fischer, F.; Gasser, U.; Groh, G.; Günnemann, S.; Hüllermeier, E.; et al. ChatGPT for Good? On Opportunities and Challenges of Large Language Models for Education. Learn. Individ. Differ. 2023, 103, 102274. [Google Scholar] [CrossRef] [Scilit]
- Lim, W.M.; Gunasekara, A.; Pallant, J.L.; Pallant, J.I.; Pechenkina, E. Generative AI and the Future of Education: Ragnarök or Reformation? A Paradoxical Perspective from Management Educators. Int. J. Manag. Educ. 2023, 21, 100790. [Google Scholar] [CrossRef] [Scilit]
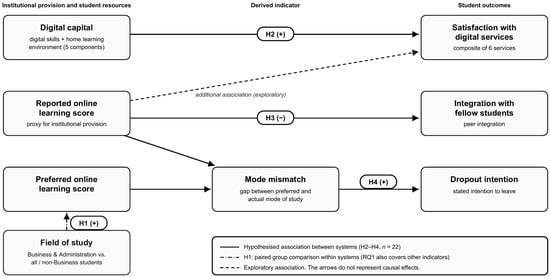
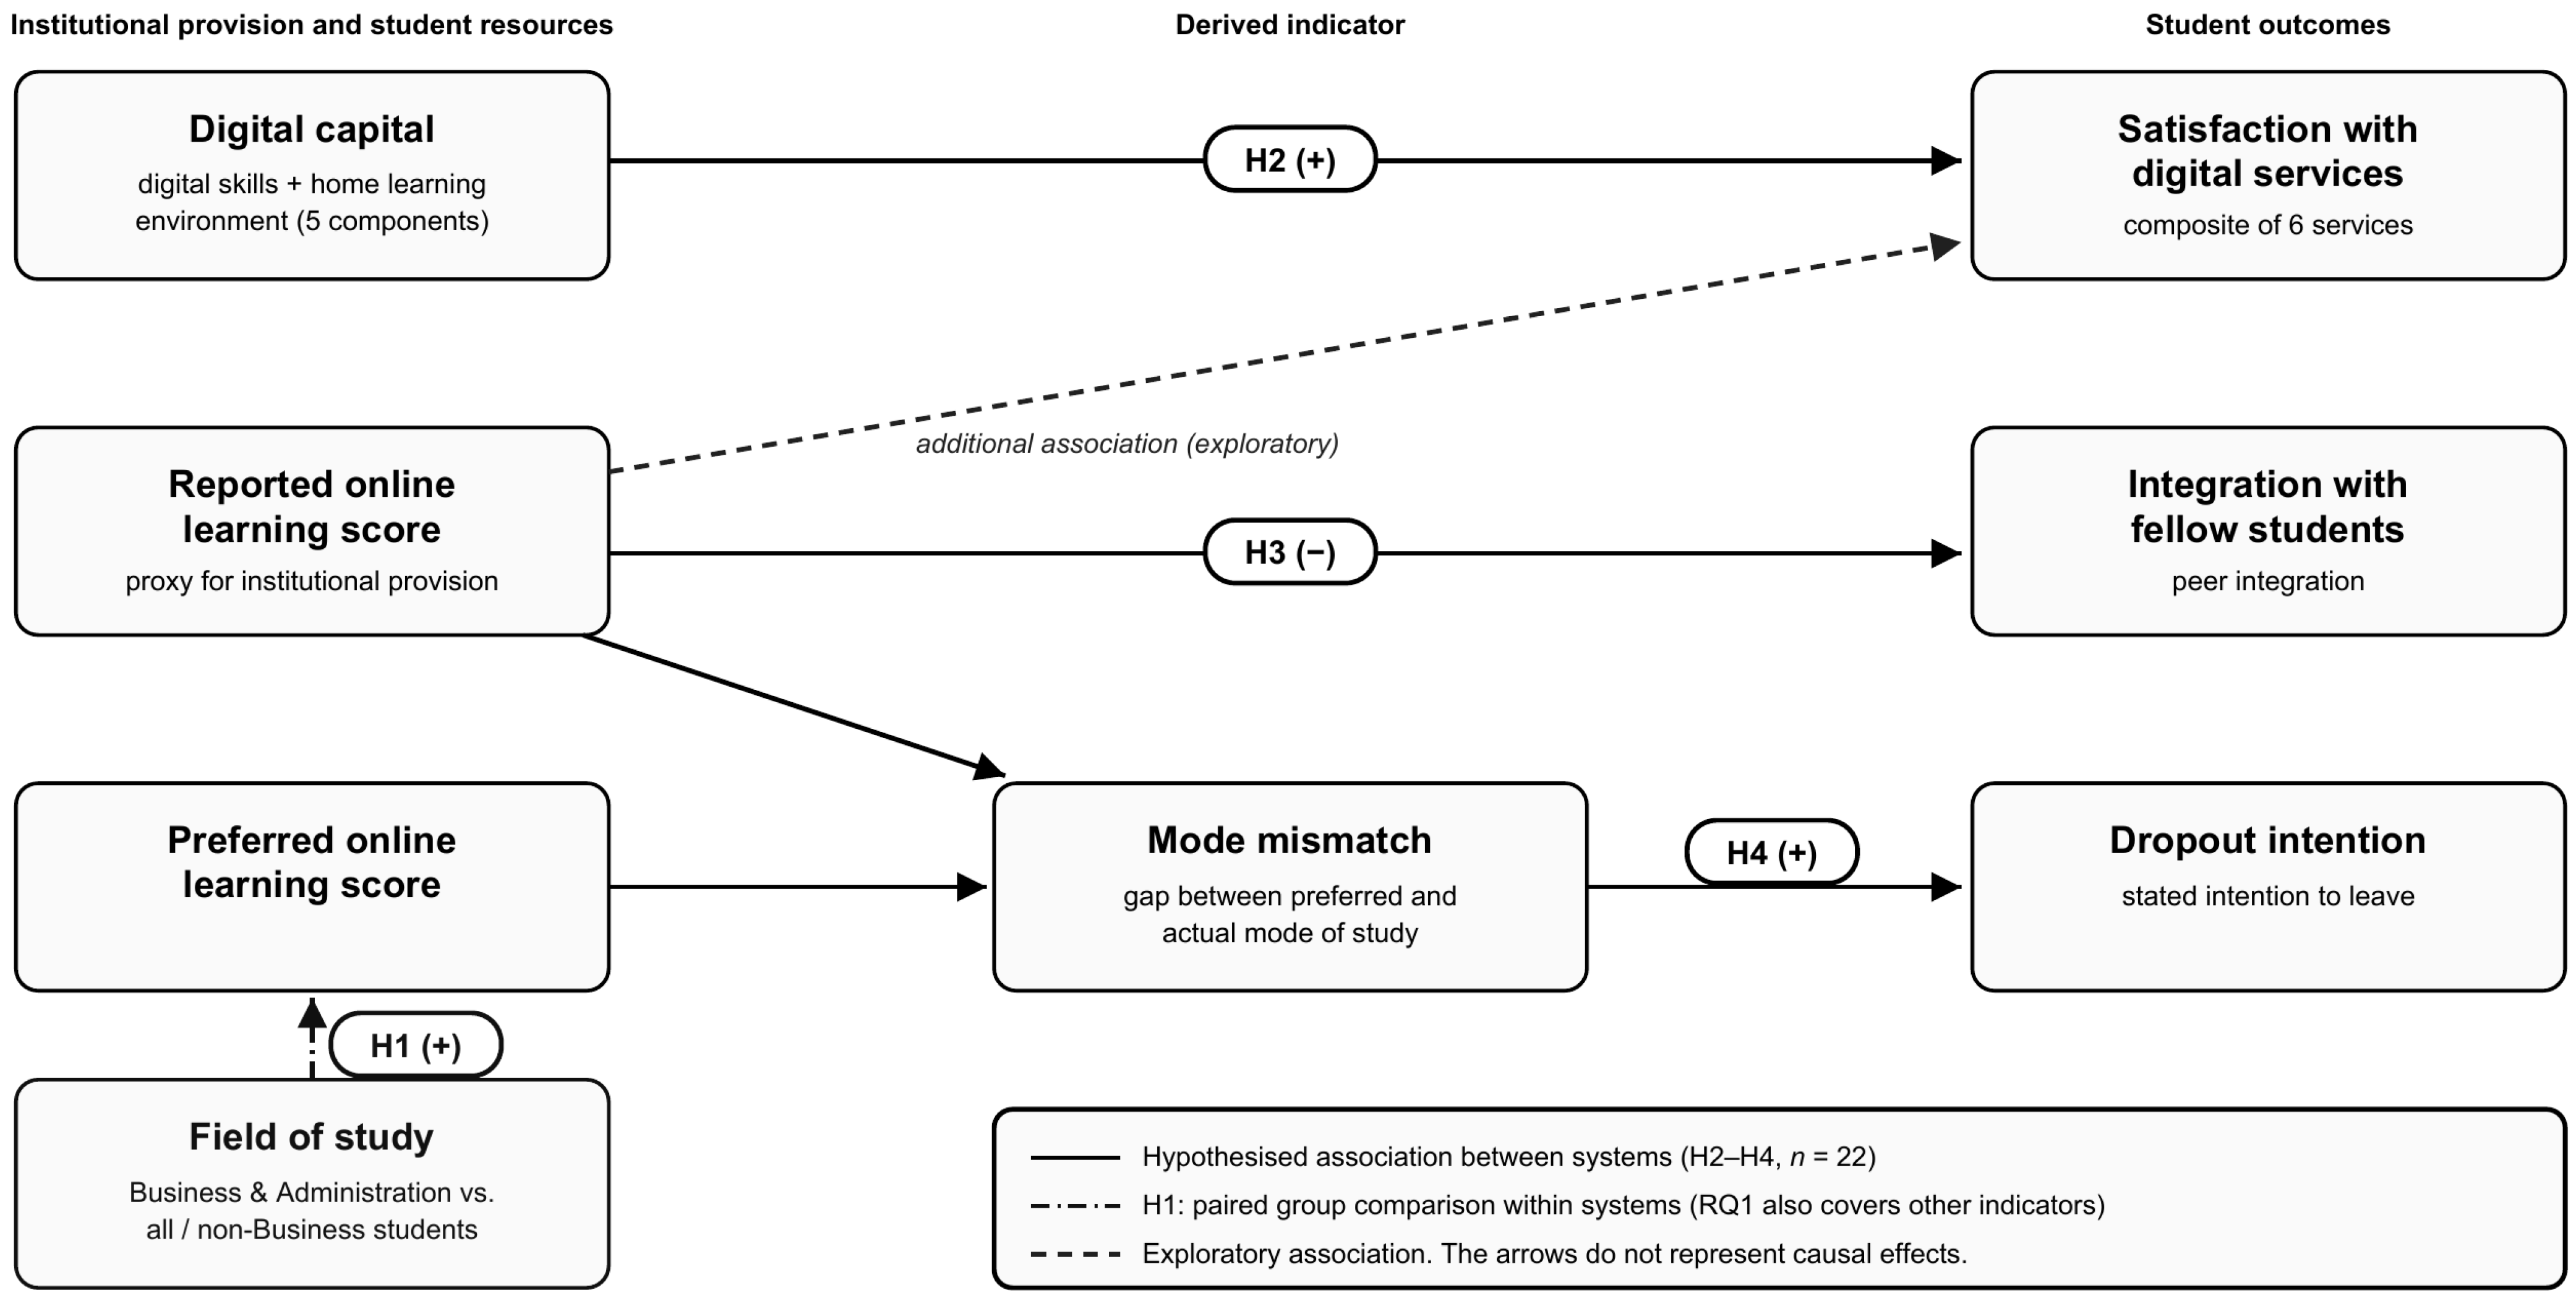
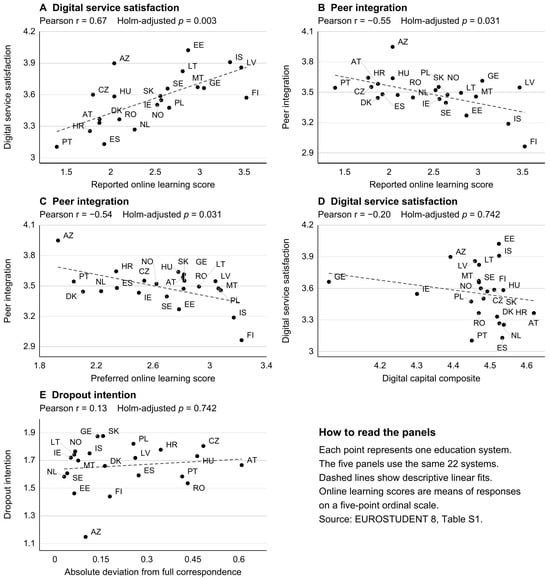
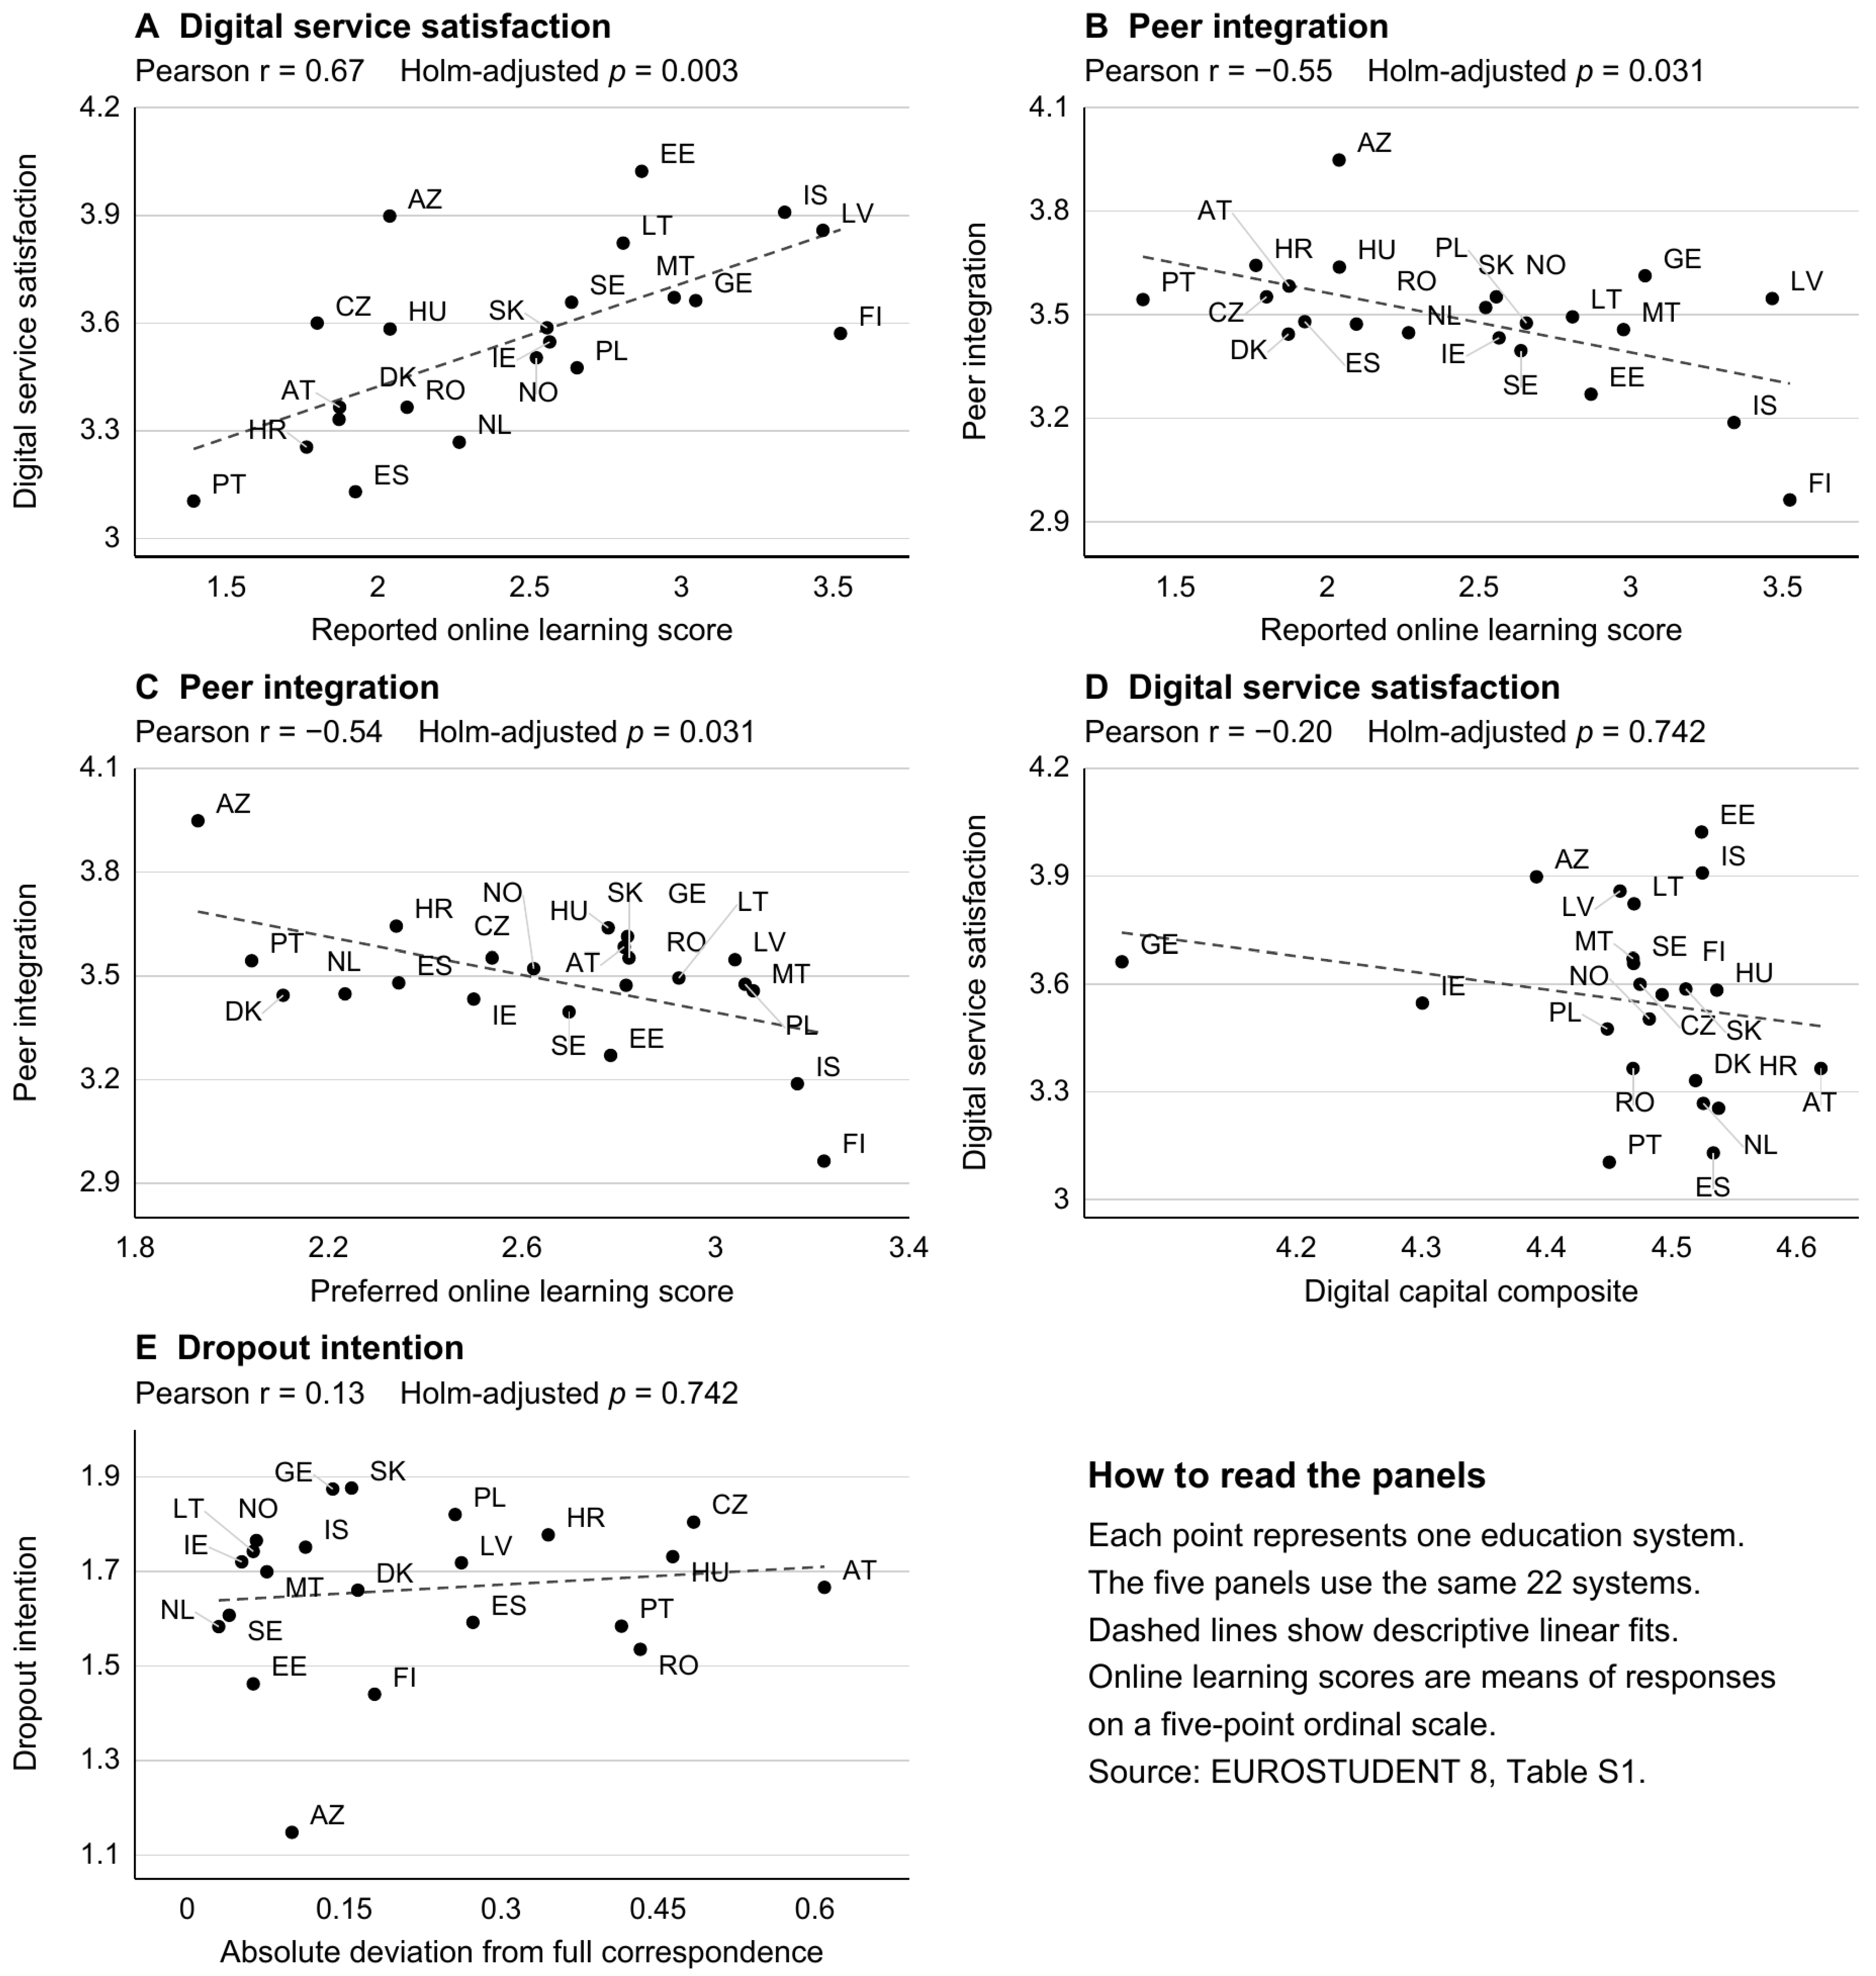

Disclaimer/Publisher’s Note: The statements, opinions and data contained in all publications are solely those of the individual author(s) and contributor(s) and not of MDPI and/or the editor(s). MDPI and/or the editor(s) disclaim responsibility for any injury to people or property resulting from any ideas, methods, instructions or products referred to in the content. |
© 2026 by the authors. Licensee MDPI, Basel, Switzerland. This article is an open access article distributed under the terms and conditions of the Creative Commons Attribution (CC BY) license.