1. Introduction
The COVID-19 pandemic shifted the world around us in numerous ways and significantly impacted different industries for better or worse. For the retail sector, “the pandemic pushed even more U.S. consumers online and pushed more consumers to spend more online and more frequently” [
1]. The digitalization of retail included the implementation of augmented reality (AR), which catapulted AR and other virtual experiences into everyday life. However, it has been found that some retail markets, such as the fashion retail market, are not yet prepared to use AR adequately [
2].
Augmented reality simultaneously integrates the real and virtual worlds of computer-generated graphics [
3,
4,
5]. AR can also be accessed in various ways, including through AR-focused apps, AR capabilities in existing apps, and marketing campaigns. AR has many benefits, one of which allows consumers to “try before you buy,” which is highly beneficial for online apparel and furniture purchases. The mixed reality of computer graphics overlaying the physical world provides an enriching experience [
5,
6] and allows users to try on clothes without the effort or time of physically putting them on. Users can rotate, zoom in, and interact with products, which can help reduce the risk involved in buying online. AR can also help deliver value and build relationships with loyal repeat customers [
7].
As we have seen in the past, AR has helped consumers solve their consumption problems during difficult times [
8]. Consumers have also been found to appreciate the immersive shopping experience provided through AR apps, which simulate an in-store shopping experience [
9]. In addition, through a systematic literature review on AR in retail, Lavoye et al. [
10] found that the benefits of AR for consumers include the formation of hedonic and utilitarian value, building of a relationship with one’s virtual “self,” and assisting in consumer decision making when purchasing products [
10]. Verma et al. [
11] also found that using AR in retail was influenced by consumer feelings of fantasy, curiosity, experience, convenience and social influence.
Many retailers are starting to offer AR features, including retailers focused on apparel and furniture. AR has many advantages when applied to retail, such as enriching a user’s experience, reducing uncertainty, providing additional product information, and being appealing. AR helps compensate through audio, visuals, and text for the lack of product information and the inability to physically handle products [
3]. Users can evaluate products and make purchase decisions with more certainty and higher comfort levels through AR when compared to web pages [
4,
6].
While retailers are starting to create AR experiences for their customers, how consumers perceive the technology is unclear. Thus far, researchers have determined that consumer-brand relationships can be facilitated through AR [
4] and that AR is also viewed to be an enjoyable way to improve consumers’ daily lives [
12]. However, retailers are wasting time and money on technological innovations, as consumers may not understand the innovation [
13]. Other negative aspects of AR exist, including privacy concerns and a lack of ease when using AR technologies [
10]. Thus, the purpose of this study was to explore Millennials’ diverse perceptions of AR in retail.
AR is considered an emerging marketing technique, but little is known about how to use the technology effectively. Scholz and Smith [
14] also stated that AR needs to be consumer-driven instead of simply unrolling technology to be considered innovative. However, the potential of AR technology can be seen in recent retail usage statistics. Before the pandemic, 51% of consumers said they were willing to use AR to assess products, and that growth continued beyond 2019. Shopify, an e-commerce platform, indicated that products with AR options had a 94% higher conversion rate than products that did not have AR capabilities [
8]. Thus, the use of AR could help retailers grow revenue if executed effectively.
The findings from this study highlight the importance of retailers moving beyond a one-size-fits-all approach by developing an in-depth understanding of different consumer segments to guide AR investment decisions and maximize engagement and revenue. In addition, the proposed model offers a foundation for future research to further test its applicability across diverse retail contexts and consumer groups.
2. Literature
AR provides an enriching experience due to the mixed reality of computer graphics overlaying the physical world in real-time [
5,
6]. Such digital overlays are accessible through apps on digital devices, and AR content can include text, visuals, or animations. To understand the overall AR experience, Scholz and Duffy’s [
4] study investigated users’ experiences, motivations, and reactions to AR apps. They found that users partake in AR for both utilitarian and hedonic reasons. When using AR for hedonic reasons, more social signaling effects were identified, and a more significant impact on attitude was determined. When using AR for utilitarian reasons, more functional, practical, helpful, and useful benefits were found, such as virtually trying on garments [
4]. Previous studies have also found that the quality of the users’ AR experience is an important attribute [
3,
4,
15]. Interestingly, Yim et al. [
5] also found that user satisfaction, attitude, and willingness to buy relate to how vivid or real the virtual content looks to the user. However, little is known about how consumers use mobile AR apps within their domestic space [
4].
Some AR experiences are generic AR browsers that provide a broad experience, but retail brands can also create custom AR applications and experiences [
14]. Due to the physical environment, Scholz and Smith [
14] describe five essential elements of an AR business campaign, including the need for specific AR content, users, targets (physical objects supplemented with digital information), bystanders (people watching the use of AR), and the background (physical environment). AR can help deliver value to customers, make them repeat customers, and create a relationship with users [
7]. Similarly, Xue et al.’s [
2] participants felt that AR would drive consumers to shop in-store and adds value to the shopping experience.
AR could have many advantages when deployed by the retail industry, including the enrichment of a user’s experience, the reduction in uncertainty or risk, the availability of additional product information, and the overall visual appeal [
3]. Due to the interactive nature of AR, the technology can help provide product information and mitigate the inability to physically handle products through audio, visuals, and text [
3]. Users can interact with products (including rotation and zoom functions), which can help reduce the risk involved in buying online. AR also allows users to try on clothes without the effort or time of physically putting them on [
7]. Thus, users can evaluate products and make purchase decisions with more certainty and higher comfort levels through AR than when compared to typical web pages [
4,
6].
AR content’s passive and active elements can also be used by retailers to target specific markets and convey distinct communication goals [
14]. It has been found that consumer-brand relationships can be facilitated through augmented reality [
4]. It is also believed that AR can be used to draw customers to shop in-store [
2].
2.1. Retail Motivations to Use AR
The retail industry is considered an early adopter of AR experiences. Specifically, the furniture, eyewear, accessories (especially watches), and beauty industries are jumping on board by creating AR apps. Furniture retailers like IKEA, Target, and Wayfair are beginning to offer this feature [
4,
6], as it is hard for people to envision the furniture in their own space [
16]. For various reasons, selling furniture is challenging for multiple reasons, as pictures may not translate well online, shipping costs are extensive for heavy items, and customers want to see and touch the items in real life to assess the product’s colors and comfort. Consumers do not want just an online photo. Overall, AR helps counteract the online shopping challenge of not being able to see the products in person [
16].
AR can be used in innovative ways within the actual retail space. Mobile AR apps can help provide additional information to consumers, including an aisle number for the product the consumer is searching for. Consumers can also access product information, see the product on a model, and see size information and other specifications [
17]. AR also helps the consumer visualize the product in mixed reality (virtual and real environment) and provides information about the product to reduce product uncertainty [
18]. Consumer use of AR develops a stronger brand attitude for retailers [
19]. It can help build brand image, association awareness, and perceptions of quality [
20].
AR creates an experience and is viewed as entertaining. A study by Scholz and Duffy [
4] found that the entertainment provided by AR is more important than the transactions completed on an AR app. The entertainment value builds a stronger relationship between the brand and the consumer [
4]. Such engagements with the brand through the AR mobile apps have been found to positively influence the intention to use the brand [
21]. AR can also emulate frontline services and assist consumers in identifying products, encouraging word-of-mouth discussions about the retailer, and promoting increased spending by displaying more expensive product options [
22].
A study by Spreer and Kallweit [
23] found that AR’s perceived usefulness and enjoyment positively influenced the intention to reuse AR [
23]. For consumers new to the retailer’s online shopping or the product category, the usage of AR positively impacted sales, especially when brands are less popular, the product is more expensive, or the product is from a niche market [
24]. Consumers’ behavioral intention to use AR was also impacted by the perceived usefulness, attitude, pressure to adopt AR by competitors, pressure from customers to adopt AR, and existing technological knowledge toward AR [
25]. However, building an AR experience is expensive, as it impacts retailers’ margins [
2].
2.2. Consumer Motivations to Use AR
Consumers use AR for utilitarian and hedonic reasons; however, how AR is used does not depend on whether the consumers engage in hedonic or utilitarian shopping behaviors. AR app attributes through hedonic and utilitarian benefits have led to a continuous intention to use the AR app and pay premium prices for the product. However, it should be noted that the interactivity of an AR app tends to be driven by hedonic attributes, such as excitement and entertainment, rather than utilitarian functionality [
26].
In a study by Jiang et al. [
27], it was found that consumers’ intention to use AR was impacted by consumers’ attitudes toward using AR for shopping. If the consumer perceives the value of AR for shopping, then consumers are more likely to use AR [
27]. The quality of the AR experience has also been found to positively impact attitude and perceived value [
28]. Similarly, consumers exposed to AR tend to have a higher purchase intention [
29].
When consumers control a virtual space, they can more easily process information, which has been found to indirectly influence the attitude toward a product. Consumers can also more easily process product information when it is an experiential product over a more utilitarian “search” product [
30]. Similarly, consumers’ uncertainty about a product’s quality and fit can be reduced through an increase in AR’s informativeness, mixed-reality presence, and ability for the consumer to mentally visualize the virtual product in a real space [
18]. Users can provide their body measurements and virtually try on clothes without going into the store. Consumers prefer not to submit any personal information before trying the AR experience and aim to try on apparel and compare previous items from every angle, which enhances the shopping experience [
3]. AR also assists consumers with their cognitive processes and makes them more comfortable in their purchase decisions [
31]. Thus, AR significantly impacts user experience by implying product quality, and the user experience has been found to influence user satisfaction and the willingness to buy a product [
15]. Innovative consumers who routinely use AR mobile apps demonstrate a higher behavioral intention to use AR [
32]; however, if more effort is needed to engage in AR, the behavioral intention to use AR decreases [
32].
2.3. Millennials
Born between 1981 and 1996, the Millennial generation is shaped by the economic recession of the 2000s [
33]. However, this generation has ample spending power despite little monetary savings, as they are the largest generation in U.S. history [
34]. Millennials prefer online shopping and are the largest demographic (37%) of the furniture-buying market [
16]. Millennials also look for personalized experiences and indicated that they wanted AR when shopping digitally more than Gen Z [
35].
3. Materials and Methods
This research study used Q methodology, utilizing a Q sort and an open-ended post-survey to collect data. A typical Q methodology study begins with developing a comprehensive set of statements representing the researchers’ research question (also called a concourse). Statements in the concourse were derived from an extensive literature review of AR in retail, in which key terms were pulled from the literature shared within the literature review. Once the concourse is created, the terms are merged and narrowed into a representative subset of statements, called a Q set. After the Q set is finalized, data collection begins, and participants are asked to rank each statement of the Q set within a Q sort grid.
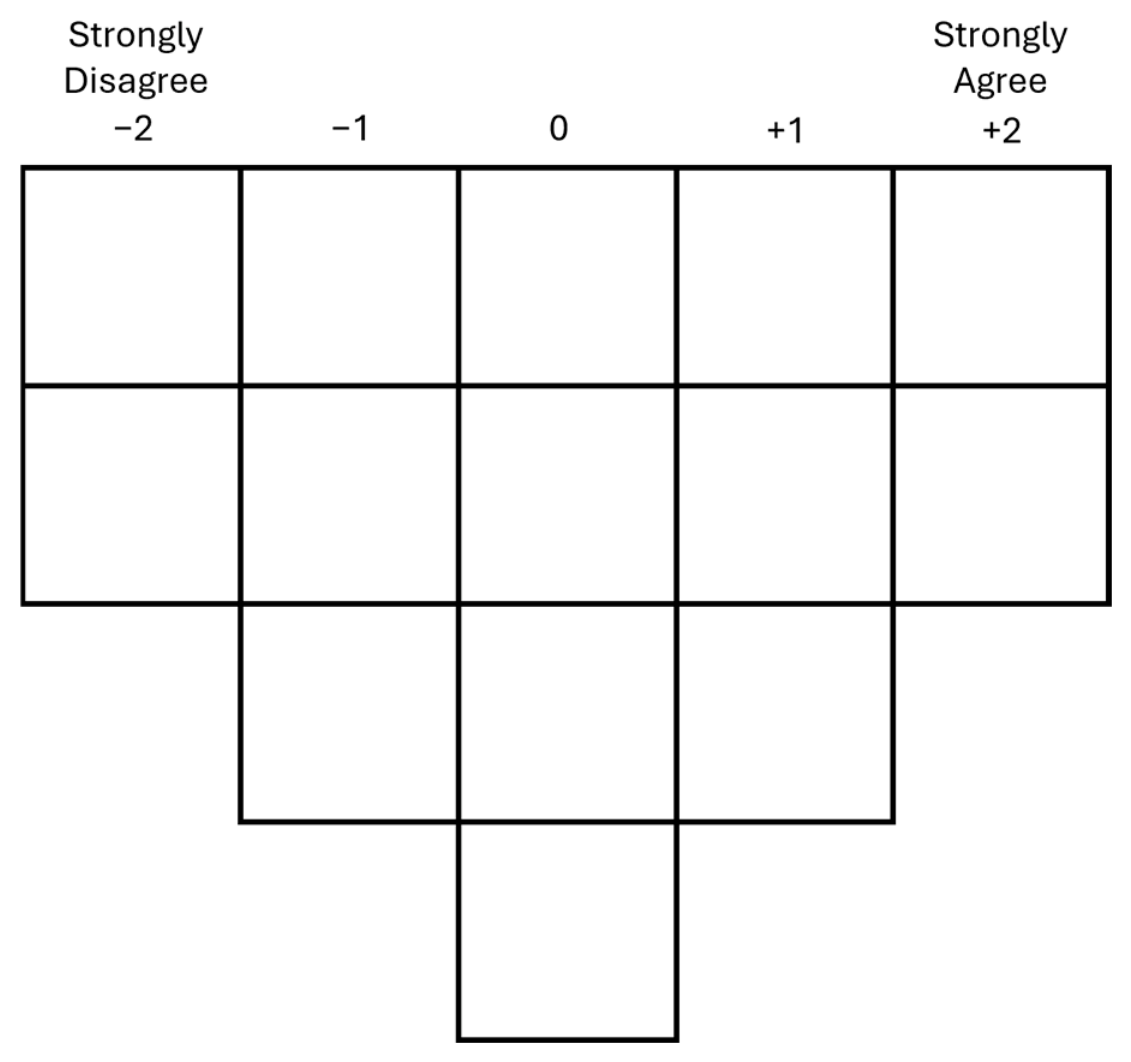
Figure 1 displays the layout of the Q sort grid.
The ranking of each statement in the Q sort represents the strength of opinion each Q set statement generates within the participant, typically ranging from “strongly agree” to “strongly disagree.” Using factor analysis, data is then analyzed to determine factors that describe participant patterns [
36]. In this study, participants referenced their completed Q-sorts when responding to the open-ended survey questions, with their answers grounded in how they had arranged the statements. A flow chart outlining the Q methodology process is available in
Figure 2.
Data Collection
Q Methodology helps identify factors, which in this study correspond to patterns of perceptions prevalent among Millennials on using AR in retail. Participants were shown a set of 14 statements and ranked each statement in a Q sort grid. An extensive literature review was conducted on AR to build a concourse of information on the topic, and the information was consolidated to determine the final Q set statements [
5,
7,
15,
37,
38]. The final Q set is available in
Table 1. The appropriate Institutional Review Board reviewed the study, and informed consent was obtained before the participant started the Q sort and survey.
Participants were recruited through Amazon MTurk and were paid $0.10 for their time. Data was collected by providing participants with a digital Q sort with 14 Q set statements describing AR in the retail industry. The participants were asked to rank the statements from “strongly agree” to “strongly disagree” within the digital Q sort diagram. Participants were also provided screening questions and examples of AR apps in the retail industry, including Sephora, Ikea Place, Wayfair, and Lowe’s. After the Q sort was complete, participants were given a series of open-ended survey questions about the ranking of each statement. Once the participants had completed the open-ended questions, they received their $0.10 compensation for their time. Qualtrics collected survey responses, and all responses were automatically coded for analysis. The data was then analyzed and coded through PQ Method software (version 2.35) to determine Millennials’ perception of AR.
A total of 65 Q sorts were collected, and 47 met the researchers’ criteria for inclusion in this study. This number of participants is considered adequate for Q Methodology, as the required number of participants in Q studies is smaller than in typical R studies [
36]. Of the participants in this study, 52% were female and 48% were male, all of which were Millennials between the ages of 23 and 40. A majority of participants represented Asian (57%) and Caucasian (27%) ethnicities, while all household income ranges were represented. It is important to note that these ethnicity proportions are not representative of the U.S. Millennial population, in which approximately 55.8% identify as Caucasian and approximately 6% identify as Asian [
39]. When asked if the participants had used augmented reality in retail in the past, 82.25% stated that they had used AR. The sample’s limited demographic diversity may introduce biases in technology use and motivation to engage with AR, particularly due to likely levels of comfort with technology based on their use of the Amazon MTurk platform.
Table 2 describes the demographic information of this study’s participants.
4. Results and Findings
A factor analysis was used to analyze the data. Through factor analysis, five different factors emerged for this study. Factor loadings for each factor are available in
Table 3.
The factor exemplifying q-sorts for each factor, alongside the Z-scores, are available in
Table 4. The qualitative data from the survey’s open-ended questions were coded line-by-line [
40].
Factor 1, entitled “The Captivated, “explains 15% of the study’s variance. Participants who loaded purely on this factor found AR in a retail setting to be enjoyable (+2) and entertaining (+2). These participants also determined AR to be interactive (+1), immersive (+1), and innovative (+1). However, participants did not find AR to be effective (−2) or to enhance (−2) the retail experience. It is also not realistic (−1), useful (−1) or pleasing (−1). Participants discussed that “It’s fun to play with/see.” A participant also stated, “I think it’s really cool and it’s almost like playing a game.” AR was useful for helping individuals shop, as they indicated the convenience of shopping from the comfort of their own homes and how helpful AR can be when shopping for furniture. Participants loading on this factor represented diverse races and ethnicities, a wide age range spanning a decade, different genders, and income levels below $70,000.
Factor 2 explained 13% of the variance and is entitled “The Convinced.” Participants who loaded purely on this factor found AR to be pleasing (+2) and believable (+2) in a retail setting. Participants also believed that AR for retail was effortless (+1), useful (+1), and enjoyable (+1). However, AR was not determined to be enriching (−2) or enhancing (−2) the retail experience. It is also not considered to be interactive (−1), immersive (−1), or realistic (−1). Participants described AR apps as “…quite fun and enjoyable,” and “…it is fun to watch and very entertaining to see what you would look like.” One participant also noted, “… I find it entertaining and enjoyable when browsing through these sites.” Participants loading on this factor were all Asian males aged 28–32 with incomes below $70,000.
Factor 3 accounted for 14% of the variance and is entitled “The Cutting Edge.” Participants who contributed to this factor found AR in a retail setting to be effective (+2) and innovative (+2). AR was also found to be interactive (+1), enhancing (+1), and entertaining (+1), but was not found to be immersive (−2) or effortless (−2). Participants also did not believe that AR was realistic (−1), pleasing (−1), or believable (−1). One participant outlined the challenges that AR has in a retail setting, which echoed statements by others, by stating that “… I believe contents from these sites do not really enhance my knowledge about a product and attract me to buy it eagerly” is an example of a respondent not finding the technology to be effective. Participants loading on this factor represented diverse races and ethnicities, an age range spanning five years, different genders, and income levels below $90,000.
Factor 4, entitled “The Amused, “explained 11% of the variance. Participants who loaded purely on this factor found AR to be enjoyable (+2) and believable (+2). AR in retail was also found to be interactive (+1), enhancing (+1), and realistic (+1). However, participants did not think AR is innovative (−2) or effective (−2) in retail. It also was not found to be enriching (−1), effortless (−1), or attractive (−1). They thought AR was not effortless, as “…it’s not always easy to navigate…,” “…it sometimes takes a little bit of extra time,” and “…they come with a lot of effort and price.” Participants loading on this factor represented diverse races and ethnicities, an age range spanning eight years, different genders, and income levels between $30,000 to over $100,001.
Factor 5 explained 9% of the variance and is called “The Realists.” These participants found AR to be immersive (+2) and realistic (+2), but the experience was not considered to be interactive (−2). While the AR in retail was useful (+1), enjoyable (+1), and entertaining (+1), it was not considered to be believable (−2). At this point, participants did not determine AR to be innovative (−1), enriching (−1), or enhancing (−1) in a retail setting. When asked about their additional thoughts on AR, numerous participants stated that they believed the technology would improve over time and become more useful in the future. Participants loading on this factor were all female, represented diverse races and ethnicities, spanned an age range of over five years, and had incomes below
$70,000.
Table 5 summarizes the results and findings of each factor.
5. Discussion
In recent years, research on AR in retail has taken a generalized approach to determine how the technology can be used. In contrast, this study investigated the diverse consumer perspectives of AR in retail found among the Millennial generation. As the use of AR continues to grow in popularity, opportunities for retailers to target specific customers through various AR-based tasks will continue to emerge. Not only can consumers use AR for shopping, but AR may also have other benefits, such as advertising [
41]. However, different subgroups within a generation may perceive AR differently, as demonstrated through the five factors that emerged from this study. Overall, participants fell on a spectrum from finding the technology useful to entertaining. Thus, this study more deeply investigated how AR app attributes have been found to have both hedonic and utilitarian consumer benefits [
26].
Factor 1 demonstrated that a subgroup of the Millennial population found AR in retail entertaining, enjoyable, and game-like. It appears that this subgroup is focused on the hedonic properties of AR and is not considering the utilitarian component of the technology. Similarly, Nickhashemi et al. [
26] shared that AR apps should focus on driving excitement and entertainment beyond just their utilitarian elements [
26]. Papagiannis [
8] also found that AR is expected to become a gamified way to socialize and purchase virtual goods [
8]. Overall, AR experiences are more enjoyable than non-AR online shopping [
42].
AR can also create a believable landscape where people can use the information presented for utilitarian purposes. Factor 2 of this study highlighted the usability of AR in retail and was pleasing to engage with from a consumer’s standpoint. AR may be able to provide more information to the consumer, which is linked to the perception of quality [
3]. The overall quality of an AR app was found to have a positive but insignificant relationship with attitude [
19], while consumers’ perceived informativeness of the AR information was linked to purchase intention [
42]. AR used within mobile applications can also help consumers navigate and visualize products and related information (e.g., product specifications, sizes, available models) in a physical retail space [
17]. The use of AR on the frontlines of retail also helps alleviate consumers’ cognitive processes by lessening decision discomfort, generating positive word-of-mouth, and highlighting the benefits of higher valued products [
31].
Some consumers find AR more innovative than strictly providing utilitarian or hedonic benefits. Factor 3 demonstrated that participants found AR effective and innovative but shared that it was not realistic or believable. Thus, the technology was perceived to take on a modern role in consumers’ lives. Parallel to this finding, Nikhashemi et al. found a nonlinear relationship between AR app engagement and hedonic and utilitarian shopping benefits [
26]. Similarly, Rauschnabel et al.’s results demonstrated that both hedonic and utilitarian benefits influenced attitudes toward AR apps [
19]. It has also been found that less-than-perfect AR experiences are typically overlooked by consumers [
4].
Factor 4 of this study highlighted the hedonic perceptions of AR in a subgroup of Millennial consumers. Participants in Factor 4 shared that they found AR in retail to be enjoyable, enhancing, and realistic. In relation, the user experience is positively linked to AR. Users’ experience with AR has also been found to be more entertaining and provide additional interactive opportunities [
15].
AR can represent a wide range of opportunities for retail. Factor 5 represented the conflicting aspect of AR, where the technology can be immersive and realistic but not interactive enough. Engagement through AR can take various forms, including direct engagement with the consumer, retailer, and socialization between consumers. These AR experiences allow for simultaneous communication between the retailer and consumers, potentially resulting in the spread of word-of-mouth by consumers about the retail brand [
14]. AR can also reduce product uncertainty through the visualization of the product, information presented, and mixed reality of virtual and real environments [
18]. In contrast, Nikhashemi et al. [
26] found that AR interactivity did not have a relationship with utilitarian benefits. These conflicting results further demonstrate the need for targeted AR experiences based on the perceptions of generational subgroups.
AR can also present challenges for both consumers and retailers. Rejeb et al. [
43] identify four key barriers to AR adoption in retail. First, technical limitations include concerns related to privacy, constraints in optical performance and visualization capabilities, and the perceived complexity of the technology from the retailer’s perspective. Second, consumer-oriented challenges arise from consumers’ varying levels of receptiveness to AR, as well as their intentions to adopt and use the technology. Third, the relative immaturity of AR technologies continues to pose limitations, with ongoing uncertainty and ambiguity surrounding their optimal application. Finally, organizational barriers persist within retailers, as teams work to integrate AR into existing structures and practices. This challenge is also compounded by the costs involved and the lack of established marketing practices for effectively leveraging AR.
As Scholz and Smith [
14] state, marketing professionals should be driven by consumer insights about AR experiences and shouldn’t be facilitated by the technology itself. The value must be created for consumers and companies, and using AR to merge the physical, virtual, and social worlds is recommended [
14]. Consumers’ continuous intention to use AR apps is predicted by customer engagement with the AR app and psychological inspiration [
26]. Thus, the more consumers engage and are inspired by the AR experience, the more the retailer will benefit. As Poushneh and Vasquez-Parraga share, AR developers must continually pay more attention to consumers’ wants and needs [
15]. Thus, the factors that emerged from this study were pivotal to the model developed for future inquiry, offering a critical pathway for retailers to enhance customer engagement and drive revenue growth.
5.1. Limitations
The use of Amazon Mechanical Turk can be considered a limitation of this study. Kan and Drummy believe demographic deception is a considerable limitation when recruiting participants from MTurk. Participants may be driven to lie to qualify for a study [
44], but broad screening questions may lower deception rates. It is difficult to know if deception occurred in this study, but the screening questions to qualify were broad to reduce deception. Participants were provided a small (versus a large) compensation for completing the survey. MTurk’s participants were adequate for this study, as researchers could access a sizeable, diverse participant pool at a low cost in a timely manner [
45]. However, another limitation includes the limited diversity of participants in terms of race and ethnicity. Future studies would benefit from using a random sample across various generations to gain additional insights into the use of AR in retail.
5.2. Theoretical Implications
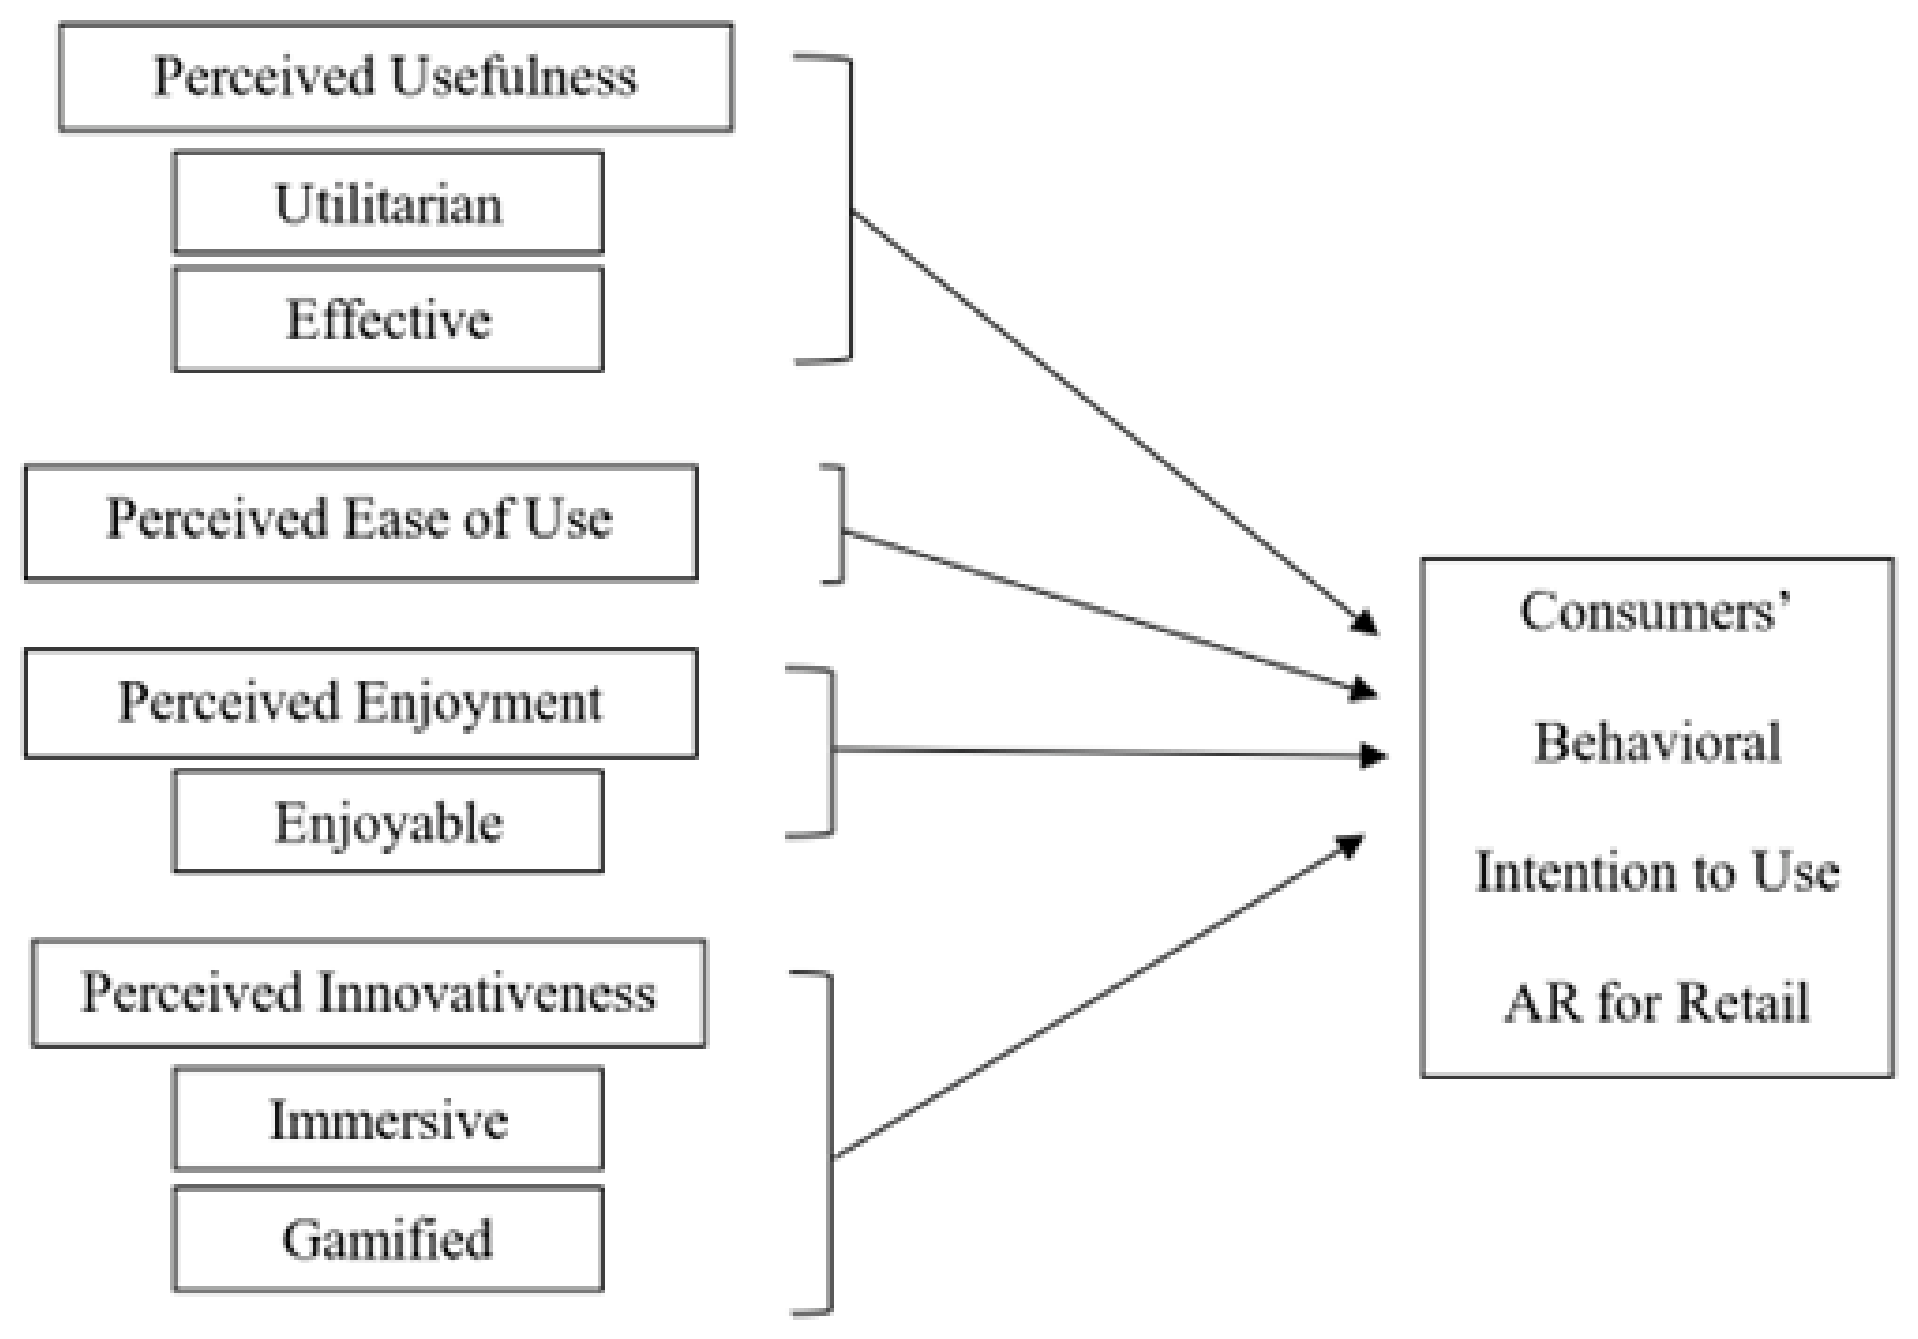
Since Q Methodology is exploratory in nature, this study aimed to develop a model for future inquiry into the perception of AR experiences in retail. Based on the findings of this study, five different patterns of perceptions were determined. These patterns suggest that AR in retail is not a one-size-fits-all approach. Instead, different AR experiences should be tailored to specific target market segments. For example, some groups valued features aligned with gaming, while others viewed AR primarily as useful or entertaining, which will help guide future testing of various theories and models. As outlined by the factors, Factor 1 highlighted that a subgroup viewed AR as a game, while Factor 2 found AR to be utilitarian. Aligned with Factor 2, Factor 3 shares that AR is innovative and effective. Conversely, Factor 4 highlights the enjoyable aspects of AR, while Factor 5 finds that the AR experience is perceived to be immersive but not interactive. Such findings are hypothesized to align with the Technology Acceptance Model, outlining the traditional variables of perceived usefulness and perceived ease of use [
46], as well as perceived innovativeness and perceived enjoyment [
47,
48,
49], which may have an influence on the intention to use that technology. The connections between the TAM and the findings of this study are outlined in
Figure 3. Thus, a call for future research utilizing the proposed model would provide greater insights and impacts on the use of AR in retail for the Millennial generation and beyond.
5.3. Managerial Implications
AR allows retailers and marketers to engage with a targeted audience, in which high engagement can lead to increased revenue through increased knowledge of the product and purchase frequency, stronger brand loyalty, and greater personalization of the AR experience. This study identifies the varied viewpoints that Millennial consumers have when considering AR in the retail industry and outlines the need for varied approaches to AR use. Specifically, this current study identifies that diverse sub-groups of Millennials view AR as having different benefits when interacting with the technology in the retail space. Based on these sub-groups, retailers can determine an effective marketing campaign to attract each group. Aligned with this study, Scholz and Smith [
14] state that marketing campaigns need to be guided by consumers and advise companies to refrain from selecting a single AR device to unroll brand content. Examples could include personalization through the collection and analysis of consumer data, the use of user-generated content, and the development of online and brand communities. Scholz and Smith [
14] also found that AR content must be focused on the target market, communication goals, and how AR content will be accessed and integrated with the physical space. Since AR provides a unique experience, retailers can build meaningful relationships with consumers [
4]. Retailers may consider the development of AR in their existing brand space or add AR features to apps to increase sales when shopping for apparel for specific generational subgroups.
The popularity of AR is believed to increase with added social elements, similar to social media aspects. The additional social aspect can increase word-of-mouth and the sharing of visuals [
14]. Other generations are also drawn to visual technologies and may benefit from AR options. In particular, the tech-savvy Generation Z would be an excellent generation for future investigation as they continue to enter the workforce and may rely on technology to acquire products. Conversely, a sub-group of the Baby Boomer generation or rural populations may find AR to be helpful to access products through augmented reality when there are travel limitations.
6. Conclusions
A single generation cannot be adequately measured through generalizations when considering the use of AR technology in retail. Understanding Millennials’ diverse perceptions of AR helps to determine opportunities for refining the use of the technology to benefit retailers’ enterprises. The findings through the use of Q methodology demonstrated five different patterns across the participants in this study. Factor 1 shared that AR was perceived as a game and used primarily for fun, while Factor 4 found AR enjoyable and realistic when using the technology in retail. Conversely, Factor 2 found AR to be useful and believable. Factors 3 and 5 also had diverse viewpoints on using AR in retail, as Factor 3 demonstrated that AR was perceived to be innovative and effective. At the same time, Factor 5 found AR to be immersive but lacked interactivity. These different factors show how retailers can use AR in different ways to satisfy different subgroups of Millennials. Greater exploration of the differences between immersion and interaction in AR and how it influences the acceptance of AR as demonstrated in Factor 5 is needed. Thus, this research study serves as a foundation for future research on AR in retail. Researchers should further investigate how retail AR apps should be designed to be more intuitive and how other generations perceive AR. Overall, retailers should actively consider the presence of AR in today’s retail environment and target different subgroups of Millennials through various uses of AR technologies when interacting with retailers.
These findings highlight the need for retailers to move beyond a one-size-fits-all approach and develop an in-depth understanding of distinct target market segments when determining which elements of AR to invest in. By aligning specific AR features, such as gaming elements, functionality, realism, or interactivity, with the preferences of consumers, retailers can more effectively allocate resources and maximize both engagement and revenue. In addition, the model proposed in this research requires testing in future studies to assess its applicability across contexts, refine its components, and strengthen its utility as a decision-making framework for retailers. Future research will be essential to ensure that AR strategies are not only theoretically grounded but also practically effective across different retail environments and consumer segments.