


Abstract
Background/Objectives: Comparator selection can change disproportionality findings when multidrug therapies are represented by report-level listings rather than verified treatment histories. We evaluated a proxy-comparator framework for cardiometabolic reporting with long-acting cabotegravir/rilpivirine (CAB/RPV), including sensitivity to comparator definition and reporting context. Methods: We conducted a disproportionality analysis of publicly available individual case safety reports from the U.S. Food and Drug Administration Adverse Event Reporting System (FAERS), restricted to study-defined markets and the period from the first quarter of 2022 through the second quarter of 2025. Reports were classified as CAB/RPV, regimen-only (a complete oral regimen listing alone), or regimen-plus (that listing plus other antiretrovirals). Three contrasts assessed 3-point and expanded major adverse cardiovascular events (MACE), diabetes, dyslipidemia, and hypertension using inverse probability weighting and adjusted reporting odds ratios (aRORs). Post-review analyses examined demographic completeness, reporter source, geography, and tenofovir disoproxil fumarate (TDF) inclusion. No binary signal threshold, case-by-case review, or causality adjudication was used. Results: The cohorts comprised 10,082 CAB/RPV, 4434 regimen-plus, and 14,559 regimen-only reports. In the internal oral contrast, regimen-plus showed statistically supported upward disproportionality for 3-point MACE (aROR 1.88, 95% confidence interval 1.44–2.15), expanded MACE (1.88, 1.47–2.40), and dyslipidemia (3.03, 2.39–3.84). CAB/RPV estimates were below 1 versus both proxies, although CAB/RPV versus regimen-plus lacked acceptable balance. Sensitivity analyses changed estimates and diagnostics; TDF inclusion left the CAB/RPV versus regimen-plus dyslipidemia estimate essentially unchanged but altered proxy-comparator findings. Conclusions: Proxy-comparator construction influenced cardiometabolic reporting patterns; reporting-context analyses qualified their interpretation. These hypothesis-generating findings do not establish incidence, clinical risk, causal effects, comparative safety, or a protective effect.
1. Introduction
Comparator definition is a central design choice in disproportionality analyses of individual case safety reports. Spontaneous reporting systems (SRSs), including the U.S. Food and Drug Administration Adverse Event Reporting System (FAERS), provide broad post-marketing coverage for hypothesis-generating characterization of reporting patterns. However, they lack exposure denominators and verified longitudinal clinical information and are affected by incomplete, duplicate, and differential reporting. Reporting odds ratios, therefore, describe relative reporting within the analyzed database rather than incidence or causal effects [1,2,3,4,5]. Because each estimate is defined against a reference set, active-comparator, class-exclusion, and full-database reference sets answer different questions and may change observed reporting patterns [6,7].
These challenges are amplified in human immunodeficiency virus (HIV) pharmacovigilance. Antiretroviral therapy (ART) is used as complete regimens, whereas FAERS records report-level drug entries without verified treatment sequence, duration, or adherence. Contemporary guidelines include oral integrase strand transfer inhibitor (INSTI)-based regimens and long-acting maintenance strategies [8,9], and restriction to therapeutically related reports may reduce heterogeneity from unrelated reference reports [10,11]. We, therefore, distinguished reports containing only a complete index oral INSTI regimen listing (regimen-only) from those containing the same listing plus additional antiretroviral entries (regimen-plus). These labels describe report-level listing patterns, not verified treatment regimens; additional entries may reflect prior therapy, switching, duplicate documentation, possible concurrent use, or reporting practice [12]. Long-acting injectable cabotegravir/rilpivirine (CAB/RPV), an intramuscular two-drug maintenance regimen combining an integrase inhibitor with a non-nucleoside reverse transcriptase inhibitor, is used in adults with virologically suppressed HIV-1 [13,14,15,16,17]. The outcomes studied span serious cardiovascular events and chronic metabolic conditions—diabetes, dyslipidemia, and hypertension—whose occurrence and clinical consequences vary with underlying cardiometabolic risk and clinical context. Cardiovascular prevention is important in long-term HIV care [18]. CAB/RPV-specific evidence has examined weight and metabolic changes [19], while broader studies of INSTI-based therapy have evaluated weight, metabolic, and cardiovascular outcomes [20,21,22]; direct comparative evidence for the full outcome set considered here remains limited.
Despite growing attention to comparator selection, the combined influence of ART-listing definitions, demographic completeness, reporter source, and geography on cardiometabolic disproportionality remains insufficiently characterized. FAERS is suitable for this methodological question because alternative report-level definitions can be applied within a common reporting source, and the resulting disproportionality estimates can be compared. We evaluated how these comparator definitions and reporting-context restrictions influenced estimates for 3-point major adverse cardiovascular events (MACE), expanded MACE, diabetes, dyslipidemia, and hypertension, using CAB/RPV as a pharmacovigilance case study. Three report-level contrasts were examined: regimen-plus versus regimen-only, CAB/RPV versus regimen-plus, and CAB/RPV versus regimen-only [23]. This hypothesis-generating analysis does not estimate incidence or clinical risk, infer causal effects, or establish comparative safety or a protective effect of CAB/RPV.
2. Materials and Methods
2.1. Design, Data Source, and Reporting Framework
We conducted a FAERS-based disproportionality analysis of individual case safety reports to assess sensitivity to report-level comparator construction and reporting context, using CAB/RPV as a case study. Public FAERS quarterly files contain structured report fields, verbatim drug product entries, therapy date records when available, and adverse events coded using MedDRA [3]. Files downloaded on 7 September 2025, were analyzed for the period from the first quarter of 2022 through the second quarter of 2025 and were restricted to the study-defined reporting-market set described in Supplementary Table S2. CAB/RPV was approved by the U.S. Food and Drug Administration on 21 January 2021; accordingly, the study window began in January 2022, approximately one year after approval, to avoid the earliest post-approval reporting period. Reports outside the study-defined reporting-market set or with missing or uninformative country fields were excluded. Reports were deduplicated at the level of the FAERS primary report identifier (PRIMARYID). All regimen definitions were report-level proxies, not confirmed patient-level exposure histories. Reporting followed the Reporting of Disproportionality Analyses Using Individual Case Safety Reports in Pharmacovigilance (READUS-PV) statement [2], with a completed checklist in Online Resource 1. No drug-versus-all-other-drugs comparison was performed. Complete-case, HCP-only, US-only, TDF-inclusive, and weighting-diagnostic analyses were conducted after peer review and are identified as post-review analyses. Further details of data processing and analytical procedures are provided in the Supplementary Methods.
2.2. Case Processing and Report-Level Proxy Cohorts
FAERS tables were linked using report identifiers, and duplicate or follow-up records were handled according to the original versioning rules, retaining the most recent report version. Chronological consistency checks were applied when both event and therapy start dates were available; the absence of therapy date records was not an exclusion criterion. Drug names were standardized to mapped active ingredients, and report strata were assigned from antiretroviral listings without inferring treatment timing from reporter-assigned drug roles.
CAB/RPV reports listed both cabotegravir and rilpivirine. The original oral INSTI proxy comparators were restricted to the following complete regimens: bictegravir/tenofovir alafenamide/emtricitabine, dolutegravir plus tenofovir alafenamide/emtricitabine, or dolutegravir/lamivudine. TDF-containing INSTI regimens were not included in the original index definitions. Oral comparator reports listing only one such complete regimen were classified as regimen-only; those with additional antiretroviral entries elsewhere in the report were classified as regimen-plus. Regimen-plus versus regimen-only served as an internal report-level proxy-comparator diagnostic. Co-listed antiretroviral entries may reflect prior therapy, switching, possible concomitant use, case-version updates, or reporting practices; however, they do not establish clinical regimen complexity, confirmed concurrent exposure, treatment sequence, adherence, treatment duration, or treatment phase. No external denominator or clinical data source was used.
For the post-review TDF-inclusive analysis, dolutegravir plus tenofovir disoproxil fumarate/emtricitabine and dolutegravir plus tenofovir disoproxil fumarate/lamivudine were added as eligible index regimens. The comparator definitions were reapplied to all eligible reports, permitting reclassification between regimen-only and regimen-plus. A harmonized reconstructed no-TDF reference was generated using the same reconstruction and analytical specifications. The formal TDF-specific comparison was made between the reconstructed no-TDF and TDF-inclusive analyses; the submitted original analysis was retained separately.
2.3. Outcomes, Eligibility Restrictions, Covariates, and Missing Data
Before each outcome-specific analysis, the same outcome-specific MedDRA term set used to identify target-event reporting in the reaction preferred-term field (REAC_PT) was also applied to the indication preferred-term field (INDI_PT). Reports were excluded from a given outcome-specific eligible population when INDI_PT contained a term from the corresponding outcome set because the target condition could have been pre-existing at the report level. This restriction was applied separately for 3-point MACE-related reporting, expanded MACE-related reporting, diabetes-related reporting, dyslipidemia-related reporting, and hypertension-related reporting; consequently, eligible report counts differed across outcomes. The procedure was intended to reduce likely prevalent condition reporting but did not establish true incident or first-ever events because FAERS does not provide complete longitudinal clinical histories. Primary reporting outcomes were 3-point MACE-related reporting and expanded MACE-related reporting. Secondary reporting outcomes included diabetes-, dyslipidemia-, and hypertension-related reporting. Outcomes were defined using MedDRA version 28.1 preferred terms, Standardised MedDRA Queries, and custom preferred term sets where appropriate. A minor fall-related soft-tissue injury reporting outcome was used as a negative control outcome for residual-bias diagnostics [24]. Complete operational definitions are provided in Online Resource 2 and Supplementary Table S1. Outcomes were not mutually exclusive.
The propensity score model included age category, sex, and reporter type as categorical factors. Available report-level pre-existing condition indicators for diabetes mellitus, dyslipidemia, and hypertension were not included in the propensity score model but were assessed as ancillary balance variables. Because reports with the target condition indicator were excluded from the corresponding outcome-specific eligible population, that indicator was not evaluated as a balance variable for that outcome; the remaining non-target pre-existing condition indicators were assessed for balance. Age was categorized as <40 years, 40–59 years, ≥60 years, or unknown. Reporter type was classified as healthcare professional, non-healthcare professional, or unknown; physician (MD), pharmacist (PH), and health professional (HP) codeswere classified as healthcare professional, while consumer (CN) and lawyer (LW) codes were classified as non-healthcare professional. When multiple reporter codes were present, any healthcare professional code defined that category. Missing or blank covariate values were retained as unknown categories; this represented patterns of missingness rather than imputation of the underlying values. Stratified analyses were restricted to reports with known stratification variables.
The post-review complete-case analyses were restricted to reports with known age and sex and were conducted for all three contrasts and five outcomes. HCP-only analyses were restricted to MD, PH, and HP reports and evaluated CAB/RPV versus regimen-plus across all five outcomes; reporter type was omitted from these propensity score models because it was constant. US-only analyses were restricted to reports originating from the United States and were conducted for all three contrasts and five outcomes.
2.4. Statistical Analysis and Diagnostics
Report characteristics, including cohort characteristics, geographic distribution, co-listed antiretroviral classes in regimen-plus reports, and quarterly CAB/RPV reporting counts, were summarized using counts and percentages. Baseline null-hypothesis testing was not performed; balance was assessed diagnostically. The original proxy-comparator contrasts were regimen-plus versus regimen-only, CAB/RPV versus regimen-plus, and CAB/RPV versus regimen-only. These contrasts were used to triangulate comparator-definition sensitivity across alternative report-level proxy comparator constructions [23].
For each outcome and comparison, propensity scores were estimated using logistic regression [25], using the propensity score covariates defined above. IPTW was then applied to balance these measured report-level covariates. Balance of the propensity score covariates and the available ancillary pre-existing condition indicators was assessed using standardized mean differences (SMDs) before and after weighting, with |SMD| < 0.1 considered acceptable measured balance. If any measured balance variable remained imbalanced after weighting (post-IPTW |SMD| ≥ 0.1), that variable was additionally included as a covariate in the IPTW-weighted outcome model. Because this additional outcome-model adjustment did not alter the propensity scores or weights, it did not correct inadequate propensity score overlap.
Post-review diagnostic assessment additionally included maximum weights and group-specific effective sample sizes (ESSs) across the outcome-specific analyses. Unweighted propensity score distributions were visually inspected for the 3-point MACE-related CAB/RPV versus regimen-plus analyses in the original, complete-case, HCP-only, and US-only populations. These distributions were used as a descriptive assessment of overlap; visual overlap was not interpreted as evidence of clinical exchangeability.
Adjusted reporting odds ratios (aRORs) and 95% confidence intervals (CIs) were estimated using IPTW-weighted logistic regression with Huber–White robust standard errors, with variance estimation handled according to recommendations for IPTW-based estimators [26]. Binary outcome indicators were analyzed within each outcome-specific eligible report set, and counts were reported as outcome reports over eligible reports. No binary aROR threshold defined a signal; estimates and CIs were used for transparent signal characterization rather than statistical labeling. The magnitude of an aROR was not interpreted as the magnitude of clinical risk or signal strength, and estimates below 1 were not interpreted as protective effects.
For the post-review analyses, propensity scores were re-estimated within each outcome, contrast, and analysis population. Stabilized average-treatment-effect IPTW was used without weight trimming or truncation. Complete-case and US-only analyses evaluated all three contrasts and five outcomes; HCP-only analyses evaluated CAB/RPV versus regimen-plus across five outcomes. The formal reconstructed no-TDF versus TDF-inclusive analysis evaluated all three contrasts and five outcomes.
The negative control outcome analysis was used as a residual-bias diagnostic, not as evidence that bias or confounding was absent [24]. The original non-IPTW sensitivity analysis used covariate-adjusted logistic regression without IPTW. Exploratory subgroup analyses were performed by sex and age. No case-by-case clinical review, causality adjudication, literature-based case series review, or external-data statistical analysis was performed.
2.5. Ethics, Software, and Transparency
Analyses, including the post-review sensitivity and diagnostic analyses, were conducted using Easy R (EZR) version 1.68 (R version 4.3.1; R Commander version 2.9-1), as described previously [27]. Analyses were executed through the EZR/R Commander environment, and no standalone custom R scripts were written by the authors. Figures were prepared using Microsoft Excel for Microsoft 365, Version 2607 (Build 16.0.20228.20190), 64-bit (Microsoft Corporation, Redmond, WA, USA). Technical quality assurance included checks of concordance between the MedDRA outcome definitions and analytical code, report-level outcome assignment, duplicate handling, drug-name and active-ingredient mapping, regimen classification, and reconciliation of cohort and outcome counts. These procedures constituted technical data-processing checks and not source-record or clinical validation.
Online Resource 1 provides the READUS-PV checklist, and Online Resource 2 provides operational definitions, balance diagnostics, model outputs, geographic summaries, regimen-plus composition, negative control outcome analysis, subgroup analyses, and reporting-volume summaries. This study used de-identified, publicly available FAERS data. Ethics committee approval and informed consent were not required. No public protocol was registered; analyses added in response to peer review are identified as post-review analyses. A generative artificial intelligence tool was used for language editing and manuscript organization. The tool was not used for data extraction, data processing, statistical analysis, result generation, or reference verification. The authors verified all content and take full responsibility for the final manuscript.
3. Results
3.1. Report-Level Cohort Assembly and Analytic Cohort Characteristics
The Medical Dictionary for Regulatory Activities (MedDRA)-based operational definitions for 3-point major adverse cardiovascular events (MACE)-related reporting, expanded MACE-related reporting, diabetes-related reporting, dyslipidemia-related reporting, hypertension-related reporting, and negative control outcome reporting are provided in Supplementary Table S1. The study-defined reporting-market set is listed in Supplementary Table S2.
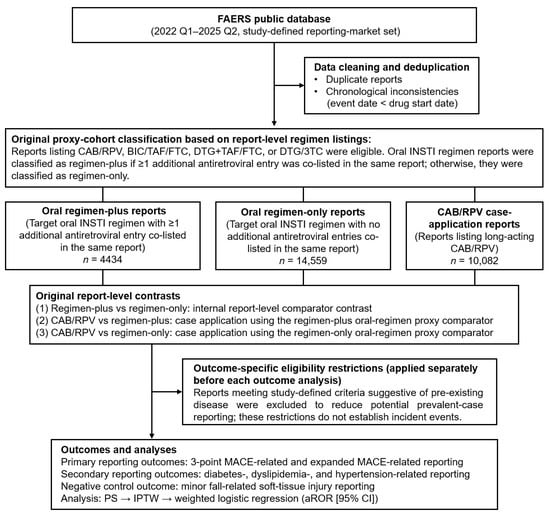
After initial file linkage, 5,914,205 FAERS report records were screened. We excluded 1747 records outside the study window from the first quarter of 2022 through the second quarter of 2025 and 148,144 records during application of the study-defined reporting-market restriction. Case-version processing and deduplication removed 2,672,951 records, retaining the most recent version of each case. Chronological consistency checks, applied when both event and therapy start dates were available, excluded 609,938 reports in which the reported event date preceded therapy initiation. The resulting pool comprised 2,481,425 reports eligible for regimen screening (Figure 1). Of these, 29,075 met one of the original report-level cohort definitions: 10,082 CAB/RPV reports, 4434 regimen-plus reports, and 14,559 regimen-only reports.
Figure 1.
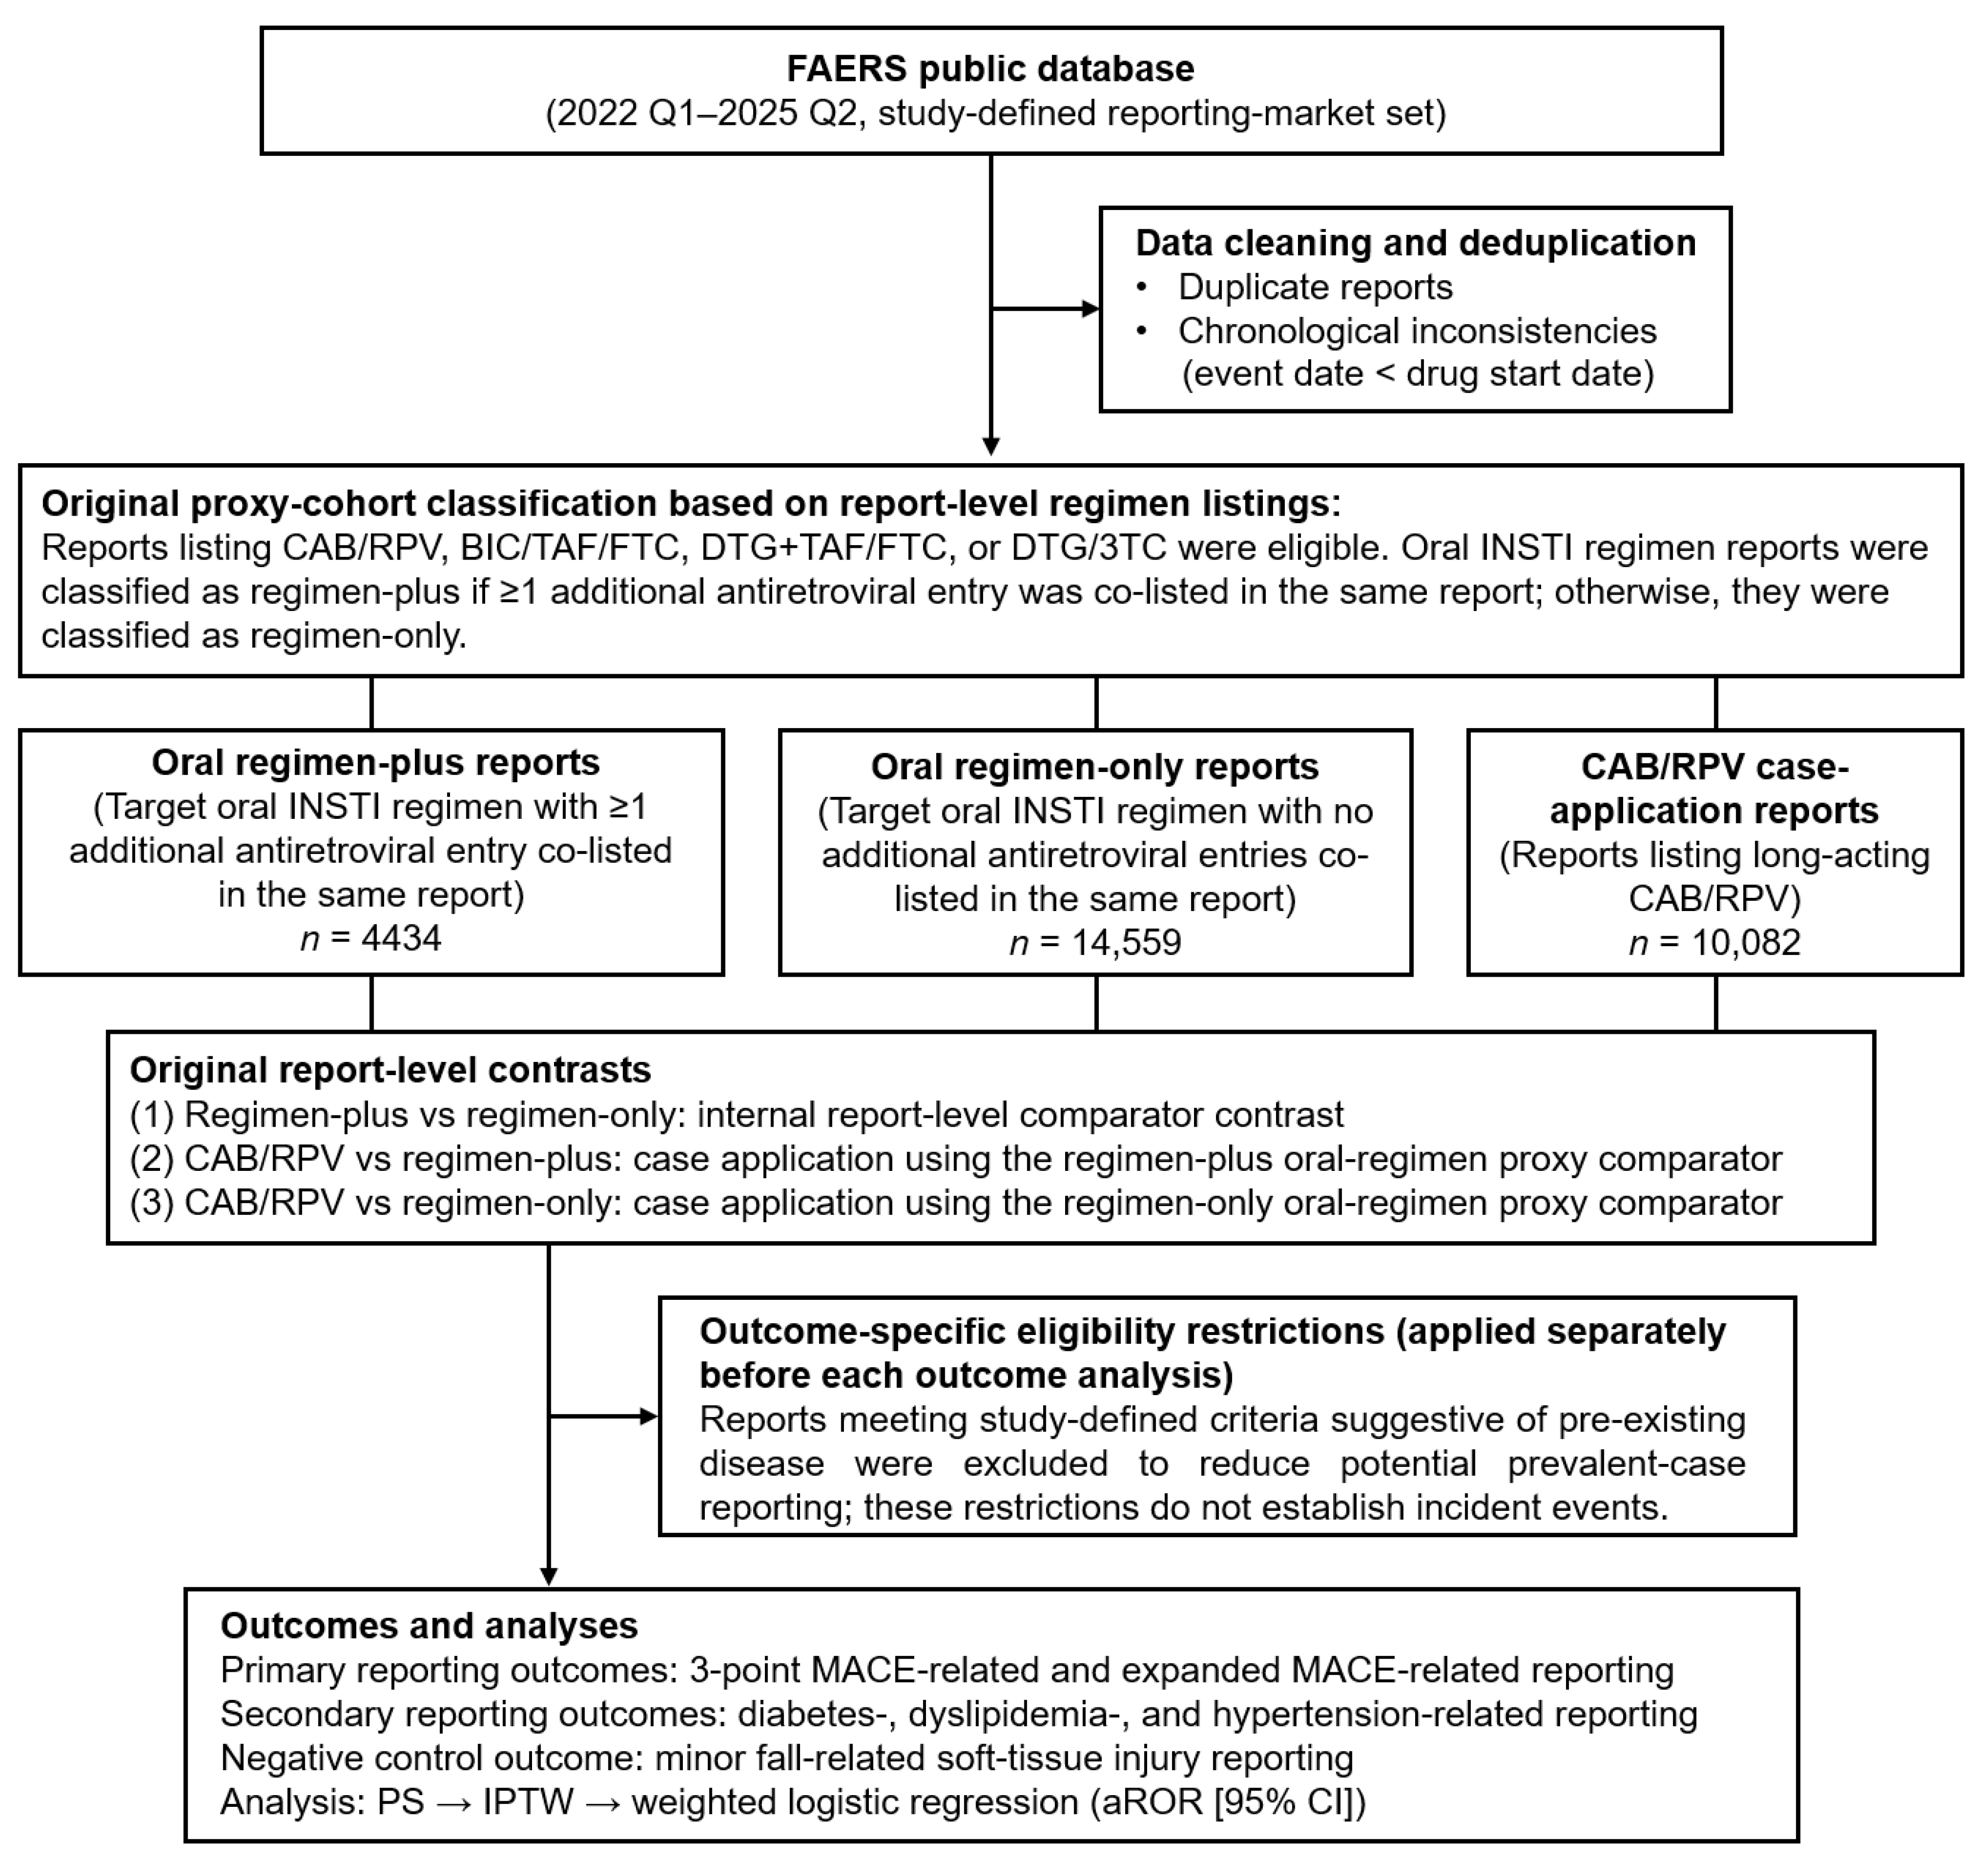
Assembly of the Original FAERS report-level cohorts and overview of the analytical framework. Key preprocessing steps, original report-level cohort definitions, and final cohort counts are shown. The original cohort definitions were applied after regimen screening. Outcome-specific eligibility restrictions were applied separately before each outcome analysis; the corresponding outcome-specific eligible denominators are reported in Figure 2 and Supplementary Tables S7–S9. Abbreviations: 3TC, lamivudine; aROR, adjusted reporting odds ratio; BIC, bictegravir; CAB/RPV, long-acting cabotegravir/rilpivirine; CI, confidence interval; DTG, dolutegravir; FAERS, U.S. Food and Drug Administration Adverse Event Reporting System; FTC, emtricitabine; INSTI, integrase strand transfer inhibitor; IPTW, inverse probability of treatment weighting; MACE, major adverse cardiovascular events; n, number of reports; PS, propensity score; Q, calendar quarter; TAF, tenofovir alafenamide; vs, versus.
Available report-level demographic, reporter, geographic, and pre-existing condition indicators are summarized in Table 1. Age was unknown in 59.3% of CAB/RPV reports, 27.3% of regimen-plus reports, and 44.1% of regimen-only reports; the corresponding proportions with unknown sex were 29.5%, 6.5%, and 18.0%, respectively. Healthcare professional (HCP) reports accounted for 78.7% of CAB/RPV reports, 15.8% of regimen-plus reports, and 47.8% of regimen-only reports. Reports from the United States (US) accounted for 8506 of 10,082 CAB/RPV reports (84.4%), 3916 of 4434 regimen-plus reports (88.3%), and 10,791 of 14,559 regimen-only reports (74.1%). Report-level pre-existing condition indicators were infrequent across the three strata and were used in the outcome-specific eligibility restrictions; they did not constitute verified diagnoses or complete clinical histories.
Table 1.
Available report characteristics across the original analytic strata.
3.2. Original Disproportionality Estimates and Weighting Diagnostics
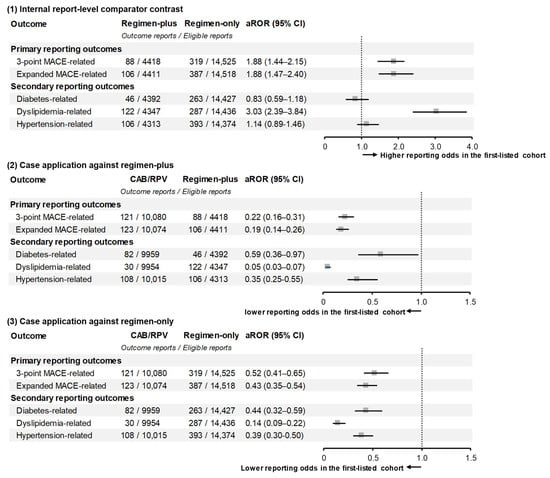
The original outcome-specific adjusted reporting odds ratios (aRORs) and 95% confidence intervals (CIs) across the three report-level contrasts are shown in Figure 2. Propensity scores (PSs) and inverse probability of treatment weighting (IPTW) were estimated separately for each contrast and outcome-specific eligible population. Because the eligibility restrictions were applied separately for each outcome, eligible denominators differed across analyses.
Figure 2.
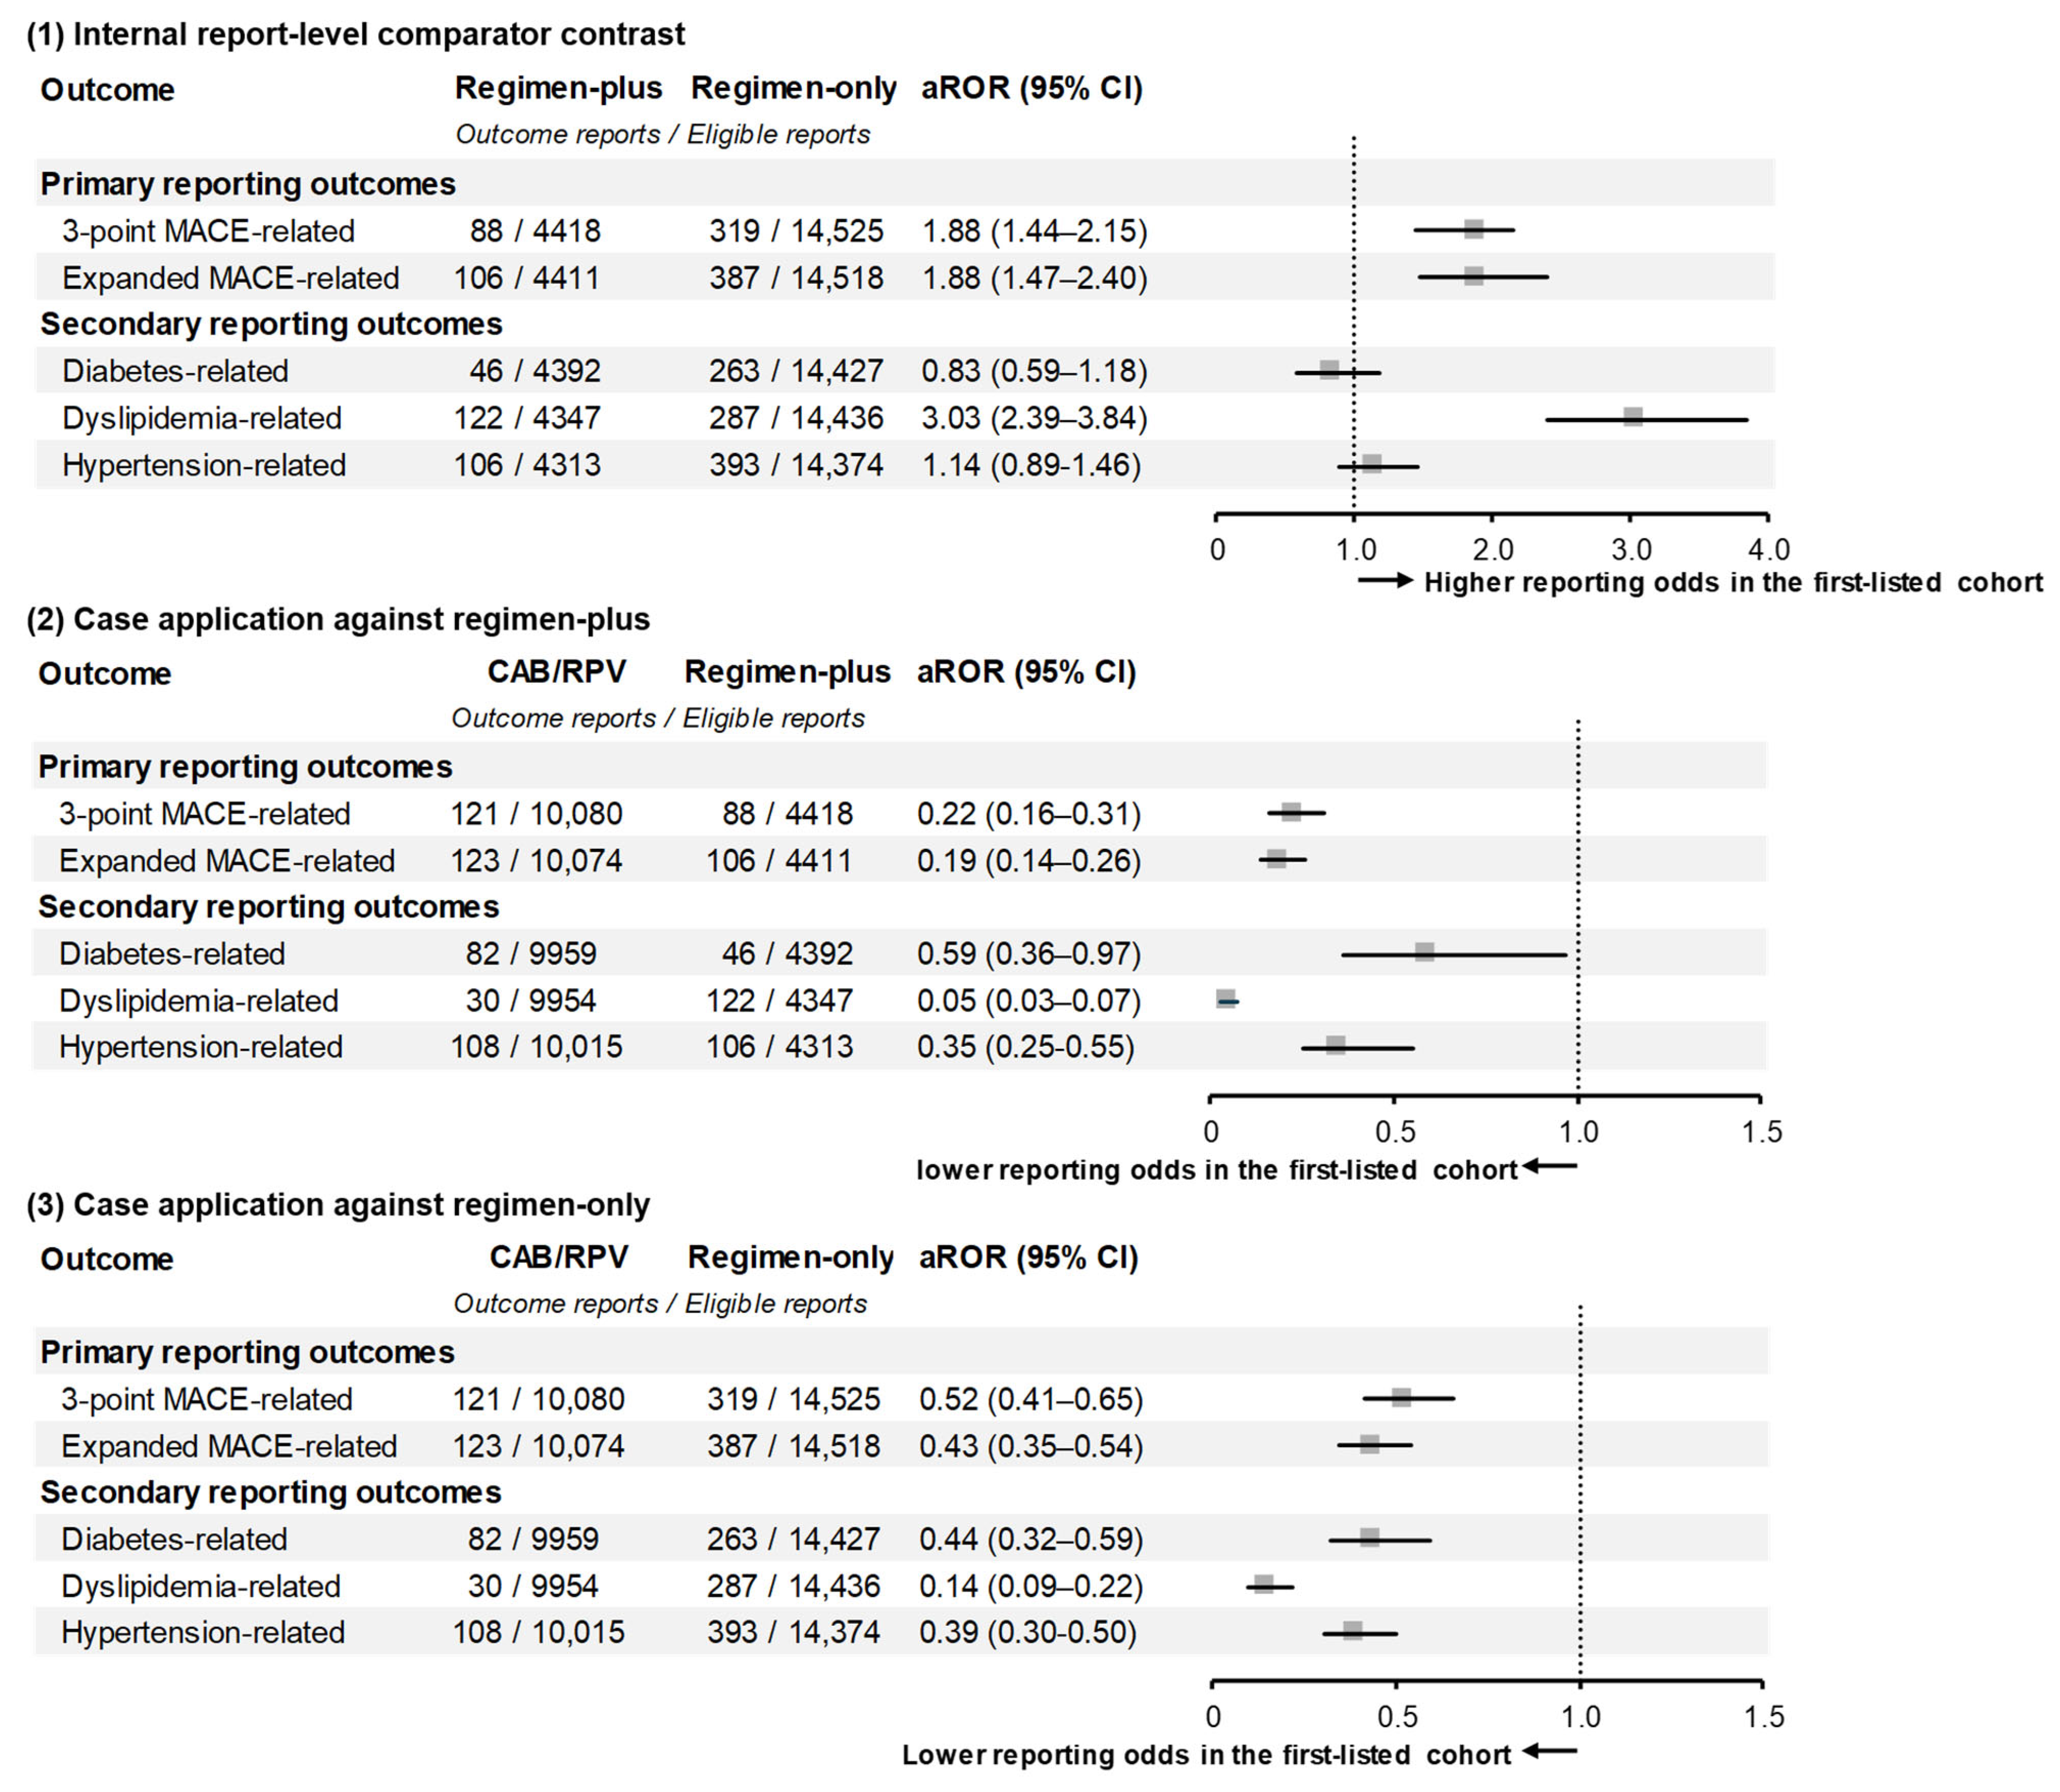
Original adjusted reporting odds ratios for cardiometabolic reporting outcomes across the three report-level contrasts. Panel (1) shows regimen-plus versus regimen-only, Panel (2) shows CAB/RPV versus regimen-plus, and Panel (3) shows CAB/RPV versus regimen-only. Estimates are expressed for the first-listed report stratum relative to the second-listed stratum. Counts are shown as outcome reports/eligible reports, where eligible reports denote outcome-specific analytic sets after the study-defined eligibility restrictions. aRORs and 95% CIs were estimated using IPTW and weighted logistic regression with Huber–White robust standard errors. The magnitude of an aROR reflects relative reporting within the analyzed database and should not be interpreted as the magnitude of clinical risk. Estimates below 1 do not indicate a protective effect. Acceptable post-weighting balance was not achieved for the original CAB/RPV versus regimen-plus contrast. X-axis ranges differ across panels to improve readability; numerical estimates and 95% CIs should be used for cross-panel comparison. Report-level comparator definitions do not establish treatment sequence, adherence, confirmed concurrent exposure, or treatment phase. Report-level stratum definitions: regimen-only, reports containing a complete index oral antiretroviral regimen listing without additional antiretroviral entries; regimen-plus, reports containing a complete index oral antiretroviral regimen listing together with additional antiretroviral entries. Abbreviations: aROR, adjusted reporting odds ratio; CAB/RPV, long-acting cabotegravir/rilpivirine; CI, confidence interval; IPTW, inverse probability of treatmnt weighting; MACE, major adverse cardiovascular events.
In the internal regimen-plus versus regimen-only contrast, statistically supported upward disproportionality was observed for 3-point MACE-related reporting, with an aROR of 1.88 (95% CI, 1.44–2.15); expanded MACE-related reporting, with an aROR of 1.88 (95% CI, 1.47–2.40); and dyslipidemia-related reporting, with an aROR of 3.03 (95% CI, 2.39–3.84). The CIs for the diabetes- and hypertension-related estimates included 1. For CAB/RPV versus regimen-plus, the 3-point and expanded MACE-related estimates were 0.22 (95% CI, 0.16–0.31) and 0.19 (95% CI, 0.14–0.26), respectively. For CAB/RPV versus regimen-only, the corresponding estimates were 0.52 (95% CI, 0.41–0.65) and 0.43 (95% CI, 0.35–0.54). The complete original results for all three contrasts and five outcomes, including outcome reports and outcome-specific eligible denominators, are presented in Figure 2.
In the post-review diagnostic reanalysis of the original CAB/RPV versus regimen-plus population, acceptable post-IPTW balance was not achieved across the five outcomes. Maximum post-IPTW standardized mean differences (SMDs) were 0.261–0.278, minimum group-specific effective sample size (ESS) values were 31.1–33.7%, and maximum weights were 29.9–32.4. Additional adjustment for residually imbalanced covariates in the weighted outcome models did not restore inadequate propensity score overlap or resolve the extreme-weight and effective sample size limitations of the weighting procedure. The submitted original balance results are retained in Supplementary Table S3, whereas the post-review integrated diagnostic summary is reported in Supplementary Table S10.
3.3. Additional Original Sensitivity, Descriptive, and Exploratory Analyses
In the covariate-adjusted analysis without IPTW, the 3-point MACE-related estimates were 0.40 (95% CI, 0.28–0.58) for CAB/RPV versus regimen-plus, 1.34 (95% CI, 1.04–1.73) for regimen-plus versus regimen-only, and 0.48 (95% CI, 0.39–0.61) for CAB/RPV versus regimen-only (Supplementary Table S4).
Detailed geographic distributions are provided in Supplementary Table S5. Co-listed antiretroviral entry classes within the regimen-plus stratum are summarized in Supplementary Table S6. The most frequently co-listed classes were nucleos(t)ide reverse transcriptase inhibitor entries (91.5%), non-nucleoside reverse transcriptase inhibitor entries (72.2%), INSTI entries (63.7%), protease inhibitor entries (27.1%), and other antiretroviral-class entries (6.4%). These non-mutually exclusive categories describe report-level co-listing and do not establish concurrent treatment or treatment sequence.
For the negative control outcome, the CIs included 1 in all three contrasts: the aRORs were 1.16 (95% CI, 0.67–2.02) for CAB/RPV versus regimen-plus, 1.02 (95% CI, 0.67–1.56) for regimen-plus versus regimen-only, and 1.22 (95% CI, 0.83–1.78) for CAB/RPV versus regimen-only (Supplementary Figure S1). Sex-stratified estimates were imprecise and did not support sex-specific interpretation (Supplementary Figure S2). Age-stratified estimates were also imprecise and did not support age-stratum-specific interpretation (Supplementary Figure S3). Quarterly CAB/RPV report counts and background FAERS reporting volume varied during the study period; these data were used only to describe the reporting context and not as exposure denominators (Supplementary Figure S4).
3.4. Reporting-Context Sensitivity Analyses
The complete-case restriction retained 15,133 of 29,075 reports (52.1%). Retention differed substantially across the report strata: 3966 of 10,082 CAB/RPV reports (39.3%), 3210 of 4434 regimen-plus reports (72.4%), and 7957 of 14,559 regimen-only reports (54.7%) were retained. For CAB/RPV versus regimen-plus, the 3-point and expanded MACE-related estimates moved toward 1, and their CIs included 1: the aRORs were 0.82 (95% CI, 0.51–1.33) and 0.69 (95% CI, 0.43–1.08), respectively. In the internal regimen-plus versus regimen-only contrast, the corresponding estimates were 0.97 (95% CI, 0.66–1.44) and 0.90 (95% CI, 0.63–1.30). Across the five CAB/RPV versus regimen-plus analyses, maximum post-IPTW SMDs were 0.398–0.433, minimum group-specific ESS values were 15.7–17.6%, and maximum weights were 38.6–40.6 (Supplementary Table S7).
The HCP-only analysis was restricted to reports submitted by physicians, pharmacists, or other healthcare professionals. Before application of outcome-specific eligibility restrictions, this population comprised 7935 CAB/RPV reports and 699 regimen-plus reports. All five CAB/RPV versus regimen-plus estimates were below 1; representative estimates were 0.12 (95% CI, 0.09–0.18) for 3-point MACE-related reporting, 0.10 (95% CI, 0.07–0.15) for expanded MACE-related reporting, and 0.02 (95% CI, 0.01–0.03) for dyslipidemia-related reporting. Measured age and sex balance was acceptable across the five analyses, with maximum post-IPTW SMDs of 0.035–0.039, minimum group-specific ESS values of 96.9–97.4%, and maximum weights of 1.3–1.4 (Supplementary Table S8).
The US-only analysis included 23,213 reports: 8506 CAB/RPV reports, 3916 regimen-plus reports, and 10,791 regimen-only reports. For CAB/RPV versus regimen-plus, the 3-point and expanded MACE-related point estimates were 1.27 (95% CI, 0.64–2.50) and 1.09 (95% CI, 0.59–2.01), respectively; both CIs included 1. These analyses showed maximum post-IPTW SMDs of 0.608–0.633, minimum group-specific ESS values of 6.8–7.6%, and maximum weights of 96.4–105.5. In the internal regimen-plus versus regimen-only contrast, the 3-point and expanded MACE-related estimates were 0.52 (95% CI, 0.34–0.81) and 0.55 (95% CI, 0.38–0.80), placing the point estimates on the opposite side of 1 from the original analysis (Supplementary Table S9).
Table 2 compares selected CAB/RPV versus regimen-plus estimates and weighting diagnostics across the original, complete-case, HCP-only, and US-only populations. Full outcome-specific estimates and diagnostic results are provided in Supplementary Tables S7–S10, and the corresponding PS distributions are shown in Supplementary Figure S5. Among these reporting-context analyses, acceptable measured post-IPTW balance with largely preserved ESS was observed only in the HCP-only population. The complete-case and US-only restrictions did not resolve the limited overlap observed in the original comparison.
Table 2.
Reporting-context sensitivity of selected CAB/RPV versus regimen-plus estimates and weighting diagnostics.
3.5. Comparator Reconstruction Including Tenofovir Disoproxil Fumarate
The post-review tenofovir disoproxil fumarate (TDF)-inclusive reconstruction comprised 30,589 reports: 10,082 CAB/RPV reports, 6404 regimen-plus reports, and 14,103 regimen-only reports. The TDF-inclusive definition was reapplied to all eligible reports rather than appended only to the original oral comparator cohorts. Consequently, 1034 existing regimen-only reports were reclassified as regimen-plus, while 578 newly eligible TDF regimen-only reports and 936 newly eligible TDF regimen-plus reports were added. Thus, the regimen-only count decreased despite the inclusion of new TDF-containing reports: 14,559 − 1034 + 578 = 14,103. The reconstruction and reclassification counts are provided in Supplementary Table S11 and illustrated in Supplementary Figure S6.
Table 3 presents the full formal paired comparison between the reconstructed no-TDF and TDF-inclusive definitions. In Panel A, for regimen-plus versus regimen-only, statistically supported upward disproportionality remained for both MACE definitions, dyslipidemia, and hypertension. The diabetes estimate changed from 0.825 (95% CI, 0.623–1.092) to 1.680 (95% CI, 1.364–2.070), changing both direction and statistical support. In Panel B, for CAB/RPV versus regimen-plus, the dyslipidemia estimate was essentially unchanged at 0.049 (95% CI, 0.035–0.068) and 0.049 (95% CI, 0.035–0.069). The 3-point and expanded MACE-related estimates moved toward 1, from 0.238 (95% CI, 0.196–0.289) to 0.379 (95% CI, 0.307–0.469) and from 0.199 (95% CI, 0.164–0.240) to 0.326 (95% CI, 0.265–0.400), respectively. In Panel C, for CAB/RPV versus regimen-only, all five estimates remained below 1 under both reconstructed definitions.
Table 3.
Formal paired comparison of reconstructed no-TDF and TDF-inclusive report-level comparator definitions.
For CAB/RPV versus regimen-plus, measured weighting diagnostics improved after TDF inclusion. Maximum post-IPTW SMDs changed from 0.318–0.331 in the reconstructed no-TDF analyses to 0.096–0.101 in the TDF-inclusive analyses. Minimum group-specific ESS values changed from 25.4–27.1% to 58.1–59.3%, and maximum weights changed from 8.3–8.9 to 3.2–3.3. The TDF-inclusive hypertension analysis had a maximum post-IPTW SMD of 0.101, and sex was therefore additionally included in the weighted outcome model. Full paired estimates across all three contrasts and five outcomes, together with CAB/RPV versus regimen-plus weighting diagnostics, are provided in Supplementary Table S12.
4. Discussion
The principal finding was the sensitivity of cardiometabolic disproportionality estimates and weighting diagnostics to report-level comparator construction and reporting context, rather than a stable drug-specific comparative safety pattern. The original analyses showed different reporting patterns across the three contrasts, whereas the post-review analyses demonstrated changes in direction, precision, statistical support, and interpretability when demographic completeness, reporter source, geography, or the oral comparator definition was altered. Acceptable measured balance was not achieved for the original, complete-case, or US-only CAB/RPV versus regimen-plus analyses, precluding a stable clinical comparative-safety interpretation. Regimen-plus and regimen-only should therefore be understood as report-level ART-listing strata, not verified treatment regimens or measures of clinical complexity. These results reinforce comparator selection, therapeutic-context restriction, and diagnostic assessment as core design features of disproportionality analyses, with CAB/RPV serving as a case study rather than the basis for a drug-specific safety conclusion [6,7,10,11,23,28,29,30]. No case-level adjudication or formal signal-classification rule was applied; accordingly, the findings represent hypothesis-generating reporting patterns rather than confirmed adverse reactions or established drug-specific safety signals [31].
The reporting-context analyses did not identify a single restriction that resolved the heterogeneity across report strata. For CAB/RPV versus regimen-plus, complete-case restriction moved the MACE estimates toward 1, but differential retention and poorer weighting diagnostics indicated additional selection rather than resolution of missing-data bias. HCP-only restriction improved measured balance and largely preserved ESS, while estimates remained below 1; nevertheless, it neither validated diagnoses nor eliminated differences in clinical history or reporting behavior. Under the US-only restriction, MACE point estimates changed direction in key contrasts, but severe residual imbalance, extreme weights, and pronounced ESS depletion precluded a US-specific clinical interpretation. CAB/RPV is positioned primarily as a maintenance or switch option for virologically suppressed adults [8,9,13,14,15,16,17], and cardiometabolic profiles may differ across contemporary ART settings [18,19,20,21,22]. However, FAERS does not identify treatment phase or baseline clinical status. Missingness, treatment-selection processes, reporter behavior, geography, and data-standardization limitations may therefore have acted jointly rather than through a single identifiable mechanism [32,33,34,35].
The formal paired reconstruction further demonstrated outcome- and contrast-specific sensitivity to comparator composition. Including eligible TDF-containing oral regimens left the CAB/RPV versus regimen-plus dyslipidemia estimate essentially unchanged but altered several other estimates, including the direction and statistical support of the internal regimen-plus versus regimen-only diabetes contrast. The TDF-inclusive reconstruction also improved measured covariate balance, reduced ESS loss, and reduced extreme weights for CAB/RPV versus regimen-plus. These improvements applied only to the measured report-level covariates and did not establish clinical exchangeability or comparative safety. Both the reconstructed no-TDF and TDF-inclusive groups remained report-level proxies; additional antiretroviral entries could reflect prior therapy, switching, overlapping or duplicate documentation, possible concomitant use, or reporting practice rather than a verified treatment sequence. The magnitude of the resulting aRORs should therefore not be interpreted as the magnitude of clinical risk. Accordingly, the TDF analysis strengthened the methodological inference of comparator-definition sensitivity rather than a pharmacologic lipid or comparative safety conclusion [6,7,12,28,29,30].
Several limitations constrain interpretation. First, inadequate PS overlap and residual imbalance persisted in the original, complete-case, and US-only CAB/RPV versus regimen-plus analyses; outcome-model covariate adjustment cannot create common support where report strata do not overlap [28,29,32,34]. Even where measured balance improved in the HCP-only and TDF-inclusive analyses, the PS models were limited to age, sex, and reporter type and could not establish clinical exchangeability. Baseline cardiometabolic risk, body mass index, smoking, HIV duration and virologic status, treatment history and duration, laboratory measures, statin use, and other co-medications were unavailable. The added analyses assessed specific sources of sensitivity but did not eliminate residual confounding. The negative control outcome was a limited bias diagnostic and neither excluded residual confounding nor validated the analytical framework [24]; differential treatment selection or channeling remains only one possible, unmeasured explanation [18,19,20,21,22,36]. Second, report-level drug listings cannot establish treatment sequence, duration, adherence, or the timing of co-exposure [12,30,37]. Unknown age or sex categories do not recover the underlying values, whereas complete-case restriction introduces differential selection. MedDRA-based outcome definitions and outcome-specific exclusions may misclassify reports and cannot establish incident events; technical coding and mapping checks did not constitute clinical case or causality adjudication. Third, FAERS lacks verified exposure denominators and longitudinal follow-up and is affected by under-reporting, stimulated or selective reporting, differential reporter behavior, duplicate or follow-up submissions, and data-standardization limitations [28,29,31,32,33,34,35]. The analysis therefore cannot estimate incidence or establish causal comparative effects. Restriction to study-defined reporting markets and evaluation during an early post-marketing period, despite the applied post-approval lag, further limits generalizability. Finally, no public protocol was registered, so the temporal prespecification of analytical decisions cannot be independently verified; the newly conducted analyses are identified as post-review sensitivity or diagnostic analyses. The exploratory sex- and age-stratified estimates were imprecise and do not support subgroup-specific clinical inference.
These findings have methodological rather than direct therapeutic implications. Disproportionality analyses of multidrug therapies should transparently report the exact comparator definition, handling of co-listed drugs and missing data, reporter and geographic composition, outcome-specific eligibility, PS overlap, pre- and post-weighting SMDs, weight summaries and extreme weights, ESS, and any reclassification caused by alternative cohort definitions. Such transparency is consistent with current guidance for conducting and reporting disproportionality analyses using individual case safety reports [2,28,31]. Replication in other spontaneous-reporting systems could assess whether the observed comparator sensitivity is specific to FAERS, whereas clinical evaluation requires denominator-based longitudinal data from claims, electronic health records, registries, or HIV cohorts, ideally using active-comparator cohort or target-trial emulation approaches capable of distinguishing treatment initiation, switching, and maintenance and measuring baseline risk, treatment duration, co-medications, and subsequent outcomes [10,22,23,29,30,36]. Overall, comparator definition and reporting context materially influenced cardiometabolic disproportionality patterns and weighting diagnostics in FAERS, while TDF inclusion left the CAB/RPV versus regimen-plus dyslipidemia estimate essentially unchanged but altered other proxy-comparator findings. These report-level findings do not estimate incidence, clinical risk, causal effects, comparative safety, or a protective effect of CAB/RPV.
Supplementary Materials
The following supporting information can be downloaded at: https://www.mdpi.com/article/10.3390/pharma5030030/s1: Online Resource 1: Completed READUS-PV checklists with section-level mapping; Online Resource 2: Supplementary Methods; Table S1: MedDRA-based outcome definitions and term lists used in the analysis; Table S2: Countries and regions included in the study-defined reporting-market set; Table S3: Submitted original standardized mean differences before and after inverse probability of treatment weighting; Table S4: original non-IPTW covariate-adjusted logistic regression analyses for 3-point MACE-related reporting; Table S5: Geographic composition of the original report strata; Table S6: Report-level co-listed antiretroviral entry classes in the regimen-plus stratum; Table S7: Complete-case analyses across the three report-level contrasts and five cardiometabolic outcomes; Table S8: HCP-only analyses of CAB/RPV versus regimen-plus across five cardiometabolic outcomes; Table S9: US-only analyses across the three report-level contrasts and five cardiometabolic outcomes; Table S10: Integrated propensity score and weighting diagnostics for CAB/RPV versus regimen-plus across reporting-context analyses; Table S11: Reconstruction and reclassification of the TDF-inclusive report-level cohorts; Table S12: Full formal paired comparison of reconstructed no-TDF and TDF-inclusive definitions; Figure S1: Negative control outcome analysis for minor fall-related soft-tissue injury reporting; Figure S2: Sex-stratified analysis of adjusted reporting odds ratios for 3-point MACE-related reporting; Figure S3: Age-stratified analysis of adjusted reporting odds ratios for 3-point MACE-related reporting; Figure S4: Quarterly CAB/RPV report counts and background FAERS reporting volume in the study-defined reporting-market set, 2022 Q1–2025 Q2; Figure S5: Propensity score distributions for CAB/RPV versus regimen-plus in the 3-point MACE-related reporting analyses; Figure S6: Reconstruction and reclassification of the TDF-inclusive report-level cohorts.
Author Contributions
Conceptualization, S.H.; methodology, S.H.; formal analysis, S.H. and M.K.; validation, M.K.; writing—original draft preparation, S.H.; writing—review and editing, S.H., C.N., Y.M., T.K., M.T., S.I., T.T., H.K. and M.K. All authors have read and agreed to the published version of the manuscript.
Funding
This research received no external funding. No funder or sponsor had any role in the study design, data collection, analysis, interpretation, manuscript preparation, or the decision to submit the manuscript for publication.
Institutional Review Board Statement
Ethical review and approval were not required because this study used de-identified, publicly available FAERS data and did not involve human participant recruitment, intervention, or access to identifiable private information.
Informed Consent Statement
Not applicable because this study used de-identified, publicly available FAERS data.
Data Availability Statement
The FAERS quarterly data files used in this study are publicly available from the United States Food and Drug Administration. Definitions of exposures, outcomes, covariates, data processing specifications, and diagnostic outputs are provided in the Supplementary Materials. Analytical datasets generated from the publicly available FAERS data are available from the corresponding authors upon reasonable request. Analyses were conducted using EZR version 1.68, R version 4.3.1, and R Commander version 2.9-1. The analysis settings, model outputs, and EZR/R Commander command logs archived by the authors are available from the corresponding authors upon reasonable request.
Acknowledgments
No professional medical writing support was received. During the preparation of this manuscript, the authors used ChatGPT (GPT-5.5, OpenAI) for language editing and manuscript organization. The tool was not used for data extraction, data processing, statistical analysis, result generation, or reference verification. The authors reviewed and edited the output and take full responsibility for the content of this publication.
Conflicts of Interest
The authors declare no conflicts of interest.
References
- Raschi, E.; Poluzzi, E.; De Ponti, F. Spotlight commentary: The value of spontaneous reporting systems to detect (the lack of) clinically relevant drug-drug interactions in clinical practice. Br. J. Clin. Pharmacol. 2023, 89, 2365–2368. [Google Scholar] [CrossRef] [Scilit]
- Fusaroli, M.; Salvo, F.; Begaud, B.; AlShammari, T.M.; Bate, A.; Battini, V.; Brueckner, A.; Candore, G.; Carnovale, C.; Crisafulli, S.; et al. The reporting of a disproportionality analysis for drug safety signal detection using individual case safety reports in pharmacovigilance (READUS-PV): Development and statement. Drug Saf. 2024, 47, 575–584. [Google Scholar] [CrossRef] [Scilit] [PubMed]
- U.S. Food and Drug Administration. FDA Adverse Event Reporting System (FAERS) Public Dashboard. Available online: https://www.fda.gov/drugs/questions-and-answers-fdas-adverse-event-reporting-system-faers/fda-adverse-event-reporting-system-faers-public-dashboard (accessed on 13 January 2026).
- Rothman, K.J.; Lanes, S.; Sacks, S.T. The reporting odds ratio and its advantages over the proportional reporting ratio. Pharmacoepidemiol. Drug Saf. 2004, 13, 519–523. [Google Scholar] [CrossRef] [Scilit] [PubMed]
- Hazell, L.; Shakir, S.A.W. Under-reporting of adverse drug reactions: A systematic review. Drug Saf. 2006, 29, 385–396. [Google Scholar] [CrossRef] [Scilit] [PubMed]
- Gravel, C.A.; Douros, A. Considerations on the use of different comparators in pharmacovigilance: A methodological review. Br. J. Clin. Pharmacol. 2023, 89, 2671–2676. [Google Scholar] [CrossRef] [Scilit] [PubMed]
- Gravel, C.A.; Bai, W.; Douros, A. Comparators in pharmacovigilance: A quasi-quantification bias analysis. Drug Saf. 2024, 47, 809–819. [Google Scholar] [CrossRef] [Scilit] [PubMed]
- Panel on Antiretroviral Guidelines for Adults and Adolescents. Guidelines for the Use of Antiretroviral Agents in Adults and Adolescents with HIV. 2025. Available online: https://clinicalinfo.hiv.gov/sites/default/files/guidelines/archive/adult-adolescent-arv-2025-09-25.pdf?utm_source=chatgpt.com (accessed on 18 December 2025).
- European AIDS Clinical Society. EACS Guidelines, Version 13.0. 2025. Available online: https://eacs.sanfordguide.com/ (accessed on 18 December 2025).
- Alkabbani, W.; Gamble, J.-M. Active-comparator restricted disproportionality analysis for pharmacovigilance signal detection studies of chronic disease medications: An example using sodium/glucose cotransporter 2 inhibitors. Br. J. Clin. Pharmacol. 2023, 89, 431–439. [Google Scholar] [CrossRef] [Scilit] [PubMed]
- Grundmark, B.; Holmberg, L.; Garmo, H.; Zethelius, B. Reducing the noise in signal detection of adverse drug reactions by standardizing the background: A pilot study on analyses of proportional reporting ratios-by-therapeutic area. Eur. J. Clin. Pharmacol. 2014, 70, 627–635. [Google Scholar] [CrossRef] [Scilit] [PubMed]
- Avillach, P.; Salvo, F.; Thiessard, F.; Miremont-Salamé, G.; Fourrier-Reglat, A.; Haramburu, F.; Bégaud, B.; Moore, N.; Pariente, A.; l’Association des Centres Régionaux de Pharmacovigilance. Pilot evaluation of an automated method to decrease false-positive signals induced by co-prescriptions in spontaneous reporting databases. Pharmacoepidemiol. Drug Saf. 2014, 23, 186–194. [Google Scholar] [CrossRef] [Scilit] [PubMed]
- Swindells, S.; Andrade-Villanueva, J.F.; Richmond, G.J.; Rizzardini, G.; Baumgarten, A.; Masiá, M.; Latiff, G.; Pokrovsky, V.; Bredeek, F.; Smith, G.; et al. Long-acting cabotegravir and rilpivirine for maintenance of HIV-1 suppression. N. Engl. J. Med. 2020, 382, 1112–1123. [Google Scholar] [CrossRef] [Scilit] [PubMed]
- Orkin, C.; Arasteh, K.; Górgolas Hernández-Mora, M.; Pokrovsky, V.; Overton, E.T.; Girard, P.M.; Oka, S.; Walmsley, S.; Bettacchi, C.; Brinson, C.; et al. Long-acting cabotegravir and rilpivirine after oral induction for HIV-1 infection. N. Engl. J. Med. 2020, 382, 1124–1135. [Google Scholar] [CrossRef] [Scilit] [PubMed]
- Jaeger, H.; Overton, E.T.; Richmond, G.; Rizzardini, G.; Andrade-Villanueva, J.F.; Mngqibisa, R.; Hermida, A.O.; Thalme, A.; Belonosova, E.; Ajana, F.; et al. Long-acting cabotegravir and rilpivirine dosed every 2 months in adults with HIV-1 infection (ATLAS-2M), 96-week results: A randomised, multicentre, open-label, phase 3b, non-inferiority study. Lancet HIV 2021, 8, e679–e689. [Google Scholar] [CrossRef] [Scilit] [PubMed]
- Overton, E.T.; Richmond, G.; Rizzardini, G.; Thalme, A.; Girard, P.-M.; Wong, A.; Porteiro, N.; Swindells, S.; Reynes, J.; Noe, S.; et al. Long-acting cabotegravir and rilpivirine dosed every 2 months in adults with human immunodeficiency virus type 1 infection: 152-week results from ATLAS-2M, a randomized, open-label, phase 3b, noninferiority study. Clin. Infect. Dis. 2023, 76, 1646–1654. [Google Scholar] [CrossRef] [Scilit] [PubMed]
- Thoueille, P.; Saldanha, S.A.; Schaller, F.; Choong, E.; Munting, A.; Cavassini, M.; Braun, D.; Günthard, H.F.; Kusejko, K.; Surial, B.; et al. Real-world trough concentrations and effectiveness of long-acting cabotegravir and rilpivirine: A multicenter prospective observational study in Switzerland. Lancet Reg. Health Eur. 2023, 36, 100793. [Google Scholar] [CrossRef] [Scilit] [PubMed]
- Grinspoon, S.K.; Fitch, K.V.; Zanni, M.V.; Fichtenbaum, C.J.; Umbleja, T.; Aberg, J.A.; Overton, E.T.; Malvestutto, C.D.; Bloomfield, G.S.; Currier, J.S.; et al. Pitavastatin to prevent cardiovascular disease in HIV infection. N. Engl. J. Med. 2023, 389, 687–699. [Google Scholar] [CrossRef] [Scilit] [PubMed]
- Tan, D.H.S.; Antinori, A.; Eu, B.M.; Puerto, M.J.G.; Kinder, C.; Sweet, D.; Van Dam, C.N.; Sutton, K.M.; Sutherland-Phillips, D.; Berni, A.M.; et al. Weight and metabolic changes with long-acting cabotegravir and rilpivirine compared with bictegravir/emtricitabine/tenofovir alafenamide in virally suppressed adults (SOLAR): Results through week 48. J. Acquir. Immune Defic. Syndr. 2025, 98, 401–409. [Google Scholar] [CrossRef] [Scilit] [PubMed]
- Valenzuela-Rodriguez, G.; Diaz-Arocutipa, C.; Collins, J.A.; Hernandez, A.V. Weight and metabolic outcomes in naïve HIV patients treated with integrase inhibitor-based antiretroviral therapy: A systematic review and meta-analysis. J. Clin. Med. 2023, 12, 3644. [Google Scholar] [CrossRef] [Scilit] [PubMed]
- Neesgaard, B.; Greenberg, L.; Miró, J.M.; Grabmeier-Pfistershammer, K.; Wandeler, G.; Smith, C.; De Wit, S.; Wit, F.; Pelchen-Matthews, A.; Mussini, C.; et al. Associations between integrase strand-transfer inhibitors and cardiovascular disease in people living with HIV: A multicenter prospective study from the RESPOND cohort consortium. Lancet HIV 2022, 9, e474–e485. [Google Scholar] [CrossRef] [Scilit] [PubMed]
- Rein, S.M.; Lodi, S.; Logan, R.W.; Touloumi, G.; Antoniadou, A.; Wittkop, L.; Bonnet, F.; van Sighem, A.; van der Valk, M.; Reiss, P.; et al. Integrase strand-transfer inhibitor use and cardiovascular events in adults with HIV: An emulation of target trials in the HIV-CAUSAL Collaboration and the Antiretroviral Therapy Cohort Collaboration. Lancet HIV 2023, 10, e723–e732. [Google Scholar] [CrossRef] [Scilit] [PubMed]
- Lawlor, D.A.; Tilling, K.; Davey Smith, G. Triangulation in aetiological epidemiology. Int. J. Epidemiol. 2016, 45, 1866–1886. [Google Scholar] [CrossRef] [Scilit] [PubMed]
- Levintow, S.N.; Nielson, C.M.; Hernandez, R.K.; Breskin, A.; Pritchard, D.; Lash, T.L.; Rothman, K.J.; Gilbertson, D.; Muntner, P.; Critchlow, C.; et al. Pragmatic considerations for negative control outcome studies to guide non-randomized comparative analyses: A narrative review. Pharmacoepidemiol. Drug Saf. 2023, 32, 599–606. [Google Scholar] [CrossRef] [Scilit] [PubMed]
- Rosenbaum, P.R.; Rubin, D.B. The central role of the propensity score in observational studies for causal effects. Biometrika 1983, 70, 41–55. [Google Scholar] [CrossRef]
- Kostouraki, A.; Hajage, D.; Rachet, B.; Williamson, E.J.; Chauvet, G.; Belot, A.; Leyrat, C. On variance estimation of the inverse probability-of-treatment weighting estimator: A tutorial for different types of propensity score weights. Stat. Med. 2024, 43, 2672–2694. [Google Scholar] [CrossRef] [Scilit] [PubMed]
- Kanda, Y. Investigation of the freely available easy-to-use software “EZR” for medical statistics. Bone Marrow Transplant. 2013, 48, 452–458. [Google Scholar] [CrossRef] [Scilit] [PubMed]
- Cutroneo, P.M.; Sartori, D.; Tuccori, M.; Crisafulli, S.; Battini, V.; Carnovale, C.; Rafaniello, C.; Capuano, A.; Poluzzi, E.; Moretti, U.; et al. Conducting and interpreting disproportionality analyses derived from spontaneous reporting systems. Front. Drug Saf. Regul. 2024, 3, 1323057. [Google Scholar] [CrossRef] [Scilit] [PubMed]
- Scosyrev, E.; Behr, S.; Jain, D.; Ponnuru, A.; Michel, C. Disproportionality analysis and causal inference in drug safety. Pharm. Med. 2025, 39, 97–107. [Google Scholar] [CrossRef] [Scilit] [PubMed]
- Fusaroli, M.; Mitchell, J.; Rudolph, A.; Rocca, E.; Fusaroli, R. Causal inference tools for pharmacovigilance: Using causal graphs to identify and address biases in disproportionality analysis. Drug Saf. 2026, 49, 449–469. [Google Scholar] [CrossRef] [Scilit] [PubMed]
- Fusaroli, M.; Salvo, F.; Begaud, B.; AlShammari, T.M.; Bate, A.; Battini, V.; Brueckner, A.; Candore, G.; Carnovale, C.; Crisafulli, S.; et al. The reporting of a disproportionality analysis for drug safety signal detection using individual case safety reports in pharmacovigilance (READUS-PV): Explanation and elaboration. Drug Saf. 2024, 47, 585–599. [Google Scholar] [CrossRef] [Scilit] [PubMed]
- Giunchi, V.; Fusaroli, M.; Hauben, M.; Raschi, E.; Poluzzi, E. Challenges and opportunities in accessing and analysing FAERS data: A call towards a collaborative approach. Drug Saf. 2023, 46, 921–926. [Google Scholar] [CrossRef] [Scilit] [PubMed]
- Parry, R.E.; Pera, V.; Verhamme, K.M.C.; de Wilde, M.; van Mulligen, E.M.; Kors, J.A. Aioli: Standardising drugs in the FDA Adverse Event Reporting System (FAERS) to RxNorm and Anatomical Therapeutic Chemical (ATC) codes. Pharmacoepidemiol. Drug Saf. 2025, 34, e70216. [Google Scholar] [CrossRef] [Scilit] [PubMed]
- Fusaroli, M.; Sartori, D.; van Puijenbroek, E.P.; Norén, G.N. Charting and sidestepping the pitfalls of disproportionality analysis. Drug Saf. Erratum in Drug Saf. 2025, 48, 1663–1664. https://doi.org/10.1007/s40264-025-01624-8. 2026, 49, 147–162. [Google Scholar] [CrossRef] [Scilit] [PubMed]
- Bernardeau, C.; Revol, B.; Salvo, F.; Fusaroli, M.; Raschi, E.; Cracowski, J.-L.; Roustit, M.; Khouri, C. Are causal statements reported in pharmacovigilance disproportionality analyses using individual case safety reports exaggerated in related citations? A meta-epidemiological study. Drug Saf. 2025, 48, 679–688. [Google Scholar] [CrossRef] [Scilit] [PubMed]
- Malvestutto, C.D.; Watanabe, M.G.; Smith, E.D.; Ribaudo, H.J.; McCallum, S.; Fitch, K.V.; Currier, J.S.; Diggs, M.R.; Chu, S.M.; Lu, M.T.; et al. Effects of antiretrovirals on major adverse cardiovascular events in the REPRIEVE trial: A longitudinal cohort analysis. Lancet HIV 2025, 12, e496–e505. [Google Scholar] [CrossRef] [Scilit] [PubMed]
- Battini, V.; Cocco, M.; Barbieri, M.A.; Powell, G.; Carnovale, C.; Clementi, E.; Bate, A.; Sessa, M. Timing matters: A machine learning method for the prioritization of drug-drug interactions through signal detection in the FDA Adverse Event Reporting System and their relationship with time of co-exposure. Drug Saf. 2024, 47, 895–907. [Google Scholar] [CrossRef] [Scilit] [PubMed]

Disclaimer/Publisher’s Note: The statements, opinions and data contained in all publications are solely those of the individual author(s) and contributor(s) and not of MDPI and/or the editor(s). MDPI and/or the editor(s) disclaim responsibility for any injury to people or property resulting from any ideas, methods, instructions or products referred to in the content. |
© 2026 by the authors. Licensee MDPI, Basel, Switzerland. This article is an open access article distributed under the terms and conditions of the Creative Commons Attribution (CC BY) license.