


Abstract
This study evaluates the offshore wind resource along the Mauritanian Atlantic coast, focusing on ten offshore zones and hub heights up to 100 m. The primary objective is to characterize the spatial variability of the wind resource and provide a preliminary assessment of offshore energy potential. Wind speed data derived from ERA5 were analyzed using Weibull distribution parameters, wind power density, and turbine-based energy production estimates. To support the preliminary identification of suitable offshore wind sites, the study also considers bathymetric conditions, marine spatial constraints, preliminary geotechnical aspects, and uncertainty analysis. The results reveal a systematic increase in wind speed with height and a pronounced north–south gradient along the coast. Zone 1 (Nouadhibou) exhibits an annual mean wind power density of 740.84 W/m2, with a monthly maximum of 1237.27 W/m2 observed in June, confirming the exceptional wind conditions in the northern offshore zones. The bathymetric analysis indicates that the northern and central sectors are generally more suitable for fixed-bottom foundations, whereas deeper offshore areas may require floating wind technologies. Although these findings provide a robust preliminary assessment of the offshore wind potential, further geophysical and geotechnical investigations, together with environmental and techno-economic assessments, are required before confirming the suitability of the identified sites. Overall, this work provides a first technical framework for the preliminary identification and comparison of promising offshore wind zones along the Mauritanian Atlantic coast.
1. Introduction
Offshore wind energy has emerged as an important component of the transition toward low-carbon energy systems, owing to its high power density, abundant resource availability, and increasing contribution to national and international decarbonization strategies. The International Energy Agency (IEA) projects substantial growth in global installed offshore wind capacity, particularly in high-potential regions beyond the traditional European and Asian markets [1]. Offshore wind resources generally benefit from stronger, more regular, and less turbulent winds than onshore sites, providing favorable conditions for large-scale electricity generation [2,3]. Global renewable energy capacity is expected to increase significantly by 2030, reflecting the growing role of renewable technologies in meeting increasing energy demand and reducing dependence on fossil fuels [4,5,6]. Wind power capacity in Africa reached 8.65 GW in 2023 [7], while global offshore wind capacity is expected to increase from approximately 83 GW in 2024 to 119 GW in 2025 [8,9]. China currently accounts for a major share of global offshore wind capacity [9], while African countries have also announced ambitious renewable energy targets, including substantial development of wind energy [10]. In this context, a reliable characterization of offshore wind resources is important for identifying promising areas and assessing their potential for future development.
Recent research has increasingly focused on offshore wind resource assessment using reanalysis datasets, statistical models, geographical information systems (GIS), forecasting techniques, and turbine-based energy estimation. For example, ref. [11] assessed offshore wind potential in the Red Sea using GIS and ERA5 data, distinguishing between fixed and floating foundations, while highlighting the limitations associated with limited offshore measurements and detailed geotechnical information. Wind forecasting studies have also demonstrated the potential of ensemble learning methods, such as XGBoost and Random Forest, for improving predictions from SCADA data [12]. Other studies have addressed the selection of floating wind platforms using multi-criteria approaches, such as the Analytical Hierarchy Process, considering wind resources, water depth, distance to the coast, sea state, and shipping traffic [13]. China has been identified as a region with very high offshore wind potential, particularly along its southern and eastern coasts, although economic, environmental, and ecological constraints remain important considerations for practical development [14]. Similarly, ERA5-based assessments have been used to identify favorable offshore areas and to compare wind characteristics with those of existing wind farms [15]. For wind-speed characterization, statistical distributions are widely used to describe the temporal and spatial variability of wind regimes. Among them, the two-parameter Weibull distribution remains one of the most commonly applied models [16,17,18], while Gamma and log-normal distributions provide useful alternatives for evaluating the quality of statistical fitting and reducing potential estimation biases [19,20]. The Weibull distribution is defined by the shape parameter (κ) and scale parameter (c), which together provide a probabilistic representation of wind-speed variability [21,22,23]. The study indicates that the Weibull distribution provides a reliable estimate of offshore wind speed and power density, supporting its accuracy for ocean areas [24]. This model also minimizes estimation errors based on measured data, making it a robust tool for offshore wind farm planning [25]. Furthermore, it effectively estimates energy potential in challenging marine environments, supporting its use for offshore turbine sizing [26]. Overall, it is considered one of the most reliable statistical models for offshore wind regime characterization [27]. Assessing wind resources is a key step in identifying suitable sites for wind energy development, with the Weibull distribution being widely used to characterize wind conditions and estimate energy potential [28]. These approaches have also been applied in African coastal regions, where studies along the Atlantic and Indian coasts have reported significant wind resources [29,30,31]. For example, offshore sites in Morocco have shown power densities exceeding 420 W/m2 at 100 m [32], while studies in Benin have reported favorable wind speeds at different heights [33]. Other African studies have applied neural-network and Weibull-based approaches to characterize wind regimes in Senegal [34] and Chad [35], confirming the usefulness of statistical methods for describing regional wind variability [36]. Despite the rapid advancement of analytical and statistical tools, a significant gap persists in the literature concerning offshore wind resource assessment in emerging regions, especially in West Africa [32,37,38]. Existing studies often focus on wind speed characterization without distinguishing theoretical potential from estimates constrained by engineering and physical limitations [38,39]. This distinction is critical to prevent overinterpretation of results as indicators of practical applicability [40,41,42]. Moreover, relatively few studies provide a multi-zone assessment that simultaneously compares wind-speed distributions, temporal variability, wind power density, and turbine-based energy production using a consistent methodology. This limitation is particularly relevant to Mauritania, which has an approximately 700 km Atlantic coastline and considerable wind resources, with wind speeds exceeding 7 m/s in several coastal areas [43]. Its wind conditions have been compared favorably with those of countries such as Spain [44], while the offshore environment offers the advantages of stronger and more stable winds [45]. Mauritania has already developed several onshore wind projects, including the Boulenouar wind farm (101 MW), the Nouakchott wind farm (30 MW), and the SNIM wind farm (4.4 MW) [46]. However, offshore wind development remains largely unexplored, and a systematic assessment covering the spatial and seasonal variability of offshore wind resources, statistical distribution fitting, turbine-based energy estimation, and preliminary marine constraints is still lacking. There is therefore a need for a consistent comparison of representative offshore zones along the Mauritanian Atlantic coast, while maintaining a clear distinction between theoretical energy potential and practical offshore feasibility.
To address this gap, the main objective of this study is to assess offshore wind resources along the Mauritanian Atlantic coast using five years of hourly ERA5 reanalysis data (2020–2024) at 100 m height. The study aims to characterize the spatial and seasonal variability of wind speed, estimate the gross theoretical and preliminary offshore wind energy potential across the coastal and offshore areas, and examine site-specific performance using representative offshore wind turbine models. The analysis evaluates the Weibull, Gamma, and log-normal distributions, estimates wind power density and gross theoretical energy potential across ten designated offshore zones, and considers three representative offshore wind turbine models: Siemens Gamesa SG 8.0-167, Vestas V164-10.0 MW, and GE Haliade 150-6 MW. The analysis also considers bathymetric conditions, marine spatial constraints, preliminary geotechnical considerations, and uncertainty, while recognizing that detailed local ocean dynamics and seabed characteristics are not explicitly represented in the ERA5-based assessment [47]. Previous studies have shown that ERA5 can provide reliable offshore wind characterization, and that combining it with measurements can be particularly useful in regions with limited observational data [45,48]. The comparison of the ten zones highlights differences in wind conditions and identifies areas with more favorable wind regimes and higher preliminary energy potential, providing a basis for prioritizing locations for further investigation. The production estimates presented in this study provide an initial assessment of the energy potential of the wind resources across the ten investigated zones. The analysis also considers, at a preliminary level, certain production losses and spatial constraints based on the available data and GIS layers. This approach helps highlight the differences between the zones and identify those with the most favorable conditions. Overall, the results provide a useful basis for further assessing Mauritania’s offshore wind potential, with particular attention to bathymetric and marine conditions, geotechnical aspects, techno-economic considerations, environmental constraints, and grid integration [49]. Several studies have also reviewed the development of floating wind technology, highlighting its potential, technological challenges, and dynamic interactions compared with onshore and fixed-bottom offshore wind turbines [50]. Recent FOWT modeling advances include Jia and Gao’s (2026) unified state-space benchmark model, which integrates key subsystems and platform–nacelle interactions and was validated against OpenFAST in time and frequency domains [51]. The results are intended to support further, more detailed assessments of offshore wind development along the Mauritanian Atlantic coast. The structure of this article is planned as follows: Section 2 describes the methodology adopted, including wind turbine selection and data analysis. Section 3 presents the simulation results and their interpretation, highlighting site and turbine performance. Finally, Section 4 offers a conclusion that summarizes the main findings of the study and makes recommendations for the development of offshore wind projects in Mauritania.
2. Materials and Methods
2.1. Description of Selected Data
This study is based on wind data from the ERA5 reanalysis provided by the European Centre for Medium-Range Weather Forecasts (ECMWF), one of the most comprehensive and reliable global climate datasets. ERA5 provides hourly data at a spatial resolution of 0.25° × 0.25°, enabling an accurate representation of regional wind patterns. It is widely used in the scientific literature to assess offshore wind energy potential due to its long-term consistency, flexibility, and reliability, especially in marine environments [52].
For the present study, wind data for a five-year period from January 2020 to December 2024 were used to analyze wind speeds at different heights (10 m, 50 m, 80 m, and 100 m). The vertical wind profile was calculated using a power-law approach with a wind shear exponent (α) [53] of approximately 0.1 [54], which is typical for offshore conditions. This strategy provides a reliable representation of wind speed distribution to estimate the theoretical exploitable energy potential in the studied areas, denotes the wind speed measured or available at the reference height , whereas corresponds to the wind speed extrapolated to the target height .
The adopted offshore wind shear coefficient (α = 0.10) represents a simplifying assumption commonly used in preliminary offshore wind resource assessments. A reasonable variation in this coefficient would mainly affect the absolute values of the wind speed extrapolated to hub height and, consequently, the estimated Annual Energy Production (AEP). However, it is expected to have only a limited influence on the relative ranking of the ten offshore zones, as all sites were evaluated using the same methodology and assumptions. Therefore, the results should be interpreted primarily as a comparative assessment of the offshore wind potential rather than as definitive estimates of energy production.
Although in situ offshore buoy measurements along the Mauritanian coast are currently limited or not publicly accessible for long-term validation, several recent studies have shown that ERA5 provides reliable offshore wind speed estimates with acceptable bias when compared to buoy and satellite observations. Therefore, the wind resource indicators presented in this study are considered credible for a preliminary screening of offshore wind potential.
To explicitly quantify the temporal variability of the wind regime, additional statistical indicators were computed, including the standard deviation (σ), coefficient of variation (CV), and percentiles (P10, P50, P90) of wind speed and wind power density. These metrics help characterize the spread of values around the mean and assess the stability of the wind regime at both seasonal and interannual scales.
Deviation:
Coefficient of variation:
The coefficient of variation (CV) serves as a dimensionless measure of the relative stability of the wind regime; lower values indicate a more consistent wind pattern, which is particularly advantageous offshore.
Several complementary geospatial datasets were used to support the preliminary assessment of the offshore sites. Bathymetric data were obtained from the GEBCO database. Administrative boundaries were derived from the Natural Earth–Admin 0–Countries dataset. Marine protected areas were identified using the Protected Marine Areas Navigator dataset [55,56]. Exclusive Economic Zone (EEZ) [57] boundaries were obtained from the Marine Regions dataset. All spatial analyses—including bathymetric mapping, the delineation of the ten offshore zones, buffer generation, and the assessment of marine spatial constraints [58]—were carried out in QGIS using the WGS 84/UTM Zone 28N coordinate reference system (EPSG:32628) [59].
2.2. Weibull Distribution
The Weibull distribution was applied in this maritime study to study wind speeds, due to its ability to accurately show changes in wind at all temporal and spatial scales. The Weibull distribution is widely used in the field of wind energy to assess the potential of energy resources and determine the appropriate size of wind turbines, as it can analyze both low and high wind speeds with great accuracy. The Weibull distribution is a probability density function that describes the probability of exceeding a given wind speed, as given by Equation (4). Several methods in the literature represent the wind distribution using Weibull distribution parameters [60,61]. This distribution is described by the following form [62,63]:
Cumulative Distribution Function (CDF):
There are several methods for evaluating the Weibull distribution coefficients [53,61], and the method observed in this study is the Maximum Likelihood Method (MLM). The scale factor c (expressed in m/s) is related to the average wind speed through the shape factor k, which is calculated according to Equations (6) and (7):
Here, the following applies:
- wi represents the measured wind speed
- n is the total number of samples
- k is the shape parameter
A high c value indicates high wind potential [53]. Wind Power Density (WPD) is represented by Equation (8) in W/m2, in which ρ is the air density and is assumed to be 1.225 kg/m3:
Speed is described by the following Equation (9):
By replacing the speed with its value for the Weibull distribution, the following can be established:
Gamma function is defined by the following Equation (11) [64]:
2.3. Gamma Distribution
The Gamma distribution is represented by Equation (12) with parameters α (shape), β (scale), and λ (location):
2.4. Log-Normal Distribution
The log-normal distribution is represented by the following equation, where the parameters γ (location), μ (shape), and σ (scale), defined on the interval x > γ, describe the behavior of a random variable whose logarithm, once centered by the location parameter, follows a normal distribution with the mean (μ) and standard deviation (σ).
Wind power is calculated by the following Equation (14) with ρ (area density), (swept area) and V (wind speed) [53,65].
The mean wind power density (amount of energy available in the wind per unit area) is calculated as follows:
The energy output () is modelled by the following Equation (16), assuming a non-leap year (1 year = 8760 h). is the rated power, and the capacity factor [66]
The capacity factor is modelled by the following Equation (17), with being the turbine starting speed, the turbine stopping speed, the average turbine speed, and k and c the Weibull parameters [67]:
Increased avoidance of CO2 emissions from the energy produced by the wind turbines is calculated with the following Equation (18) [68]:
2.5. Description of the Studied Sites
Mauritania has an Atlantic coastline extending for approximately 700 km, from Nouadhibou in the north to N’Dagou in the south. Mauritania possesses one of the longest and least-exploited coastlines in West Africa, representing a significant opportunity for marine-based resource development. The coastal zone is characterized by strong and persistent winds, reaching speeds of up to 24 m/s and averaging approximately 9 m/s, indicating a high and relatively stable wind energy potential throughout the year. This coastal region also hosts a wide diversity of ecosystems, notably the wetlands of the Banc d’Arguin National Park, which is listed as a UNESCO World Heritage Site. This long shoreline plays a major strategic role in the Mauritanian economy through several activities, including maritime fishing, port infrastructure, and the energy sector. Furthermore, the Mauritanian coast offers particularly favorable conditions for the development of offshore infrastructure, especially for wind energy exploitation. In light of the increasing national demand for energy and the Mauritanian government’s shift towards renewable energy, this area represents an ideal location for the deployment of large-scale onshore and offshore wind farms. Such projects could significantly contribute a key driver to achieving energy independence and supporting sustainable development in the country.
It is clear from the four maps that as altitude increases, wind speed gradually increases. At 10 m (Figure 1), wind speeds generally vary between 5 and 7 m/s, with a slight increase along the Atlantic coast. At 50 m (Figure 2), we observe a noticeable increase in wind strength in coastal areas, ranging between 7 and 9 m/s. At 80 m (Figure 3), the wind speed increases and spreads more widely, averaging about 10.3 m/s, with the highest wind speeds observed along the Mauritanian coast. Finally, at an altitude of 100 m (Figure 4), higher wind speeds are observed, averaging about 11 m/s, indicating particularly strong wind activity along the coast. The ERA5 (2020–2024) analysis shows that the average wind speed increases by 17.46% from 10 m to 50 m, 4.81% from 50 m to 80 m, and only 2.26% from 80 m to 100 m. The overall increase between 10 m and 100 m is 25.89%. From these observations, it is clear that there is a relationship between sea-level height and increases in wind speed in the studied areas.
Figure 1.
Average wind speed at 10 m.
Figure 2.
Average wind speed at 50 m.
Figure 3.
Average wind speed at 80 m.
Figure 4.
Average wind speed at 100 m.
2.6. Characteristics of the Selected Wind Turbines
To assess the suitability and evaluate each offshore zone, and to examine variation and determine capacity factors under different operating conditions, three modern wind turbines from three well-known international companies were selected for a detailed technical comparison of their performance at the studied sites. These models are widely used in offshore wind energy projects due to their high capacity and advanced engineering design. Their technical specifications are presented in Table 1.
Table 1.
Characteristics of the selected turbines.
The first turbine is the Siemens Gamesa SG 8.0-167, with a rated capacity of 8 MW, a rotor swept area of 21,900 m2, and a hub height of 92 m [57]. It is known for its high suitability and reliability in marine environments and its ability to achieve high productivity due to its optimized blade design and aerodynamics, which enhance its capacity to capture energy at medium and high wind speeds. The large diameter of the rotor is also a key factor in increasing the amount of energy extracted from the wind. The second turbine is the Vestas V164-10.0 MW, one of the most powerful commercially available turbines, with a rated capacity of 10 MW, a swept area of 21,124 m2, and a hub height of 105 m [69]. Its great height allows it to reach strong and stable wind layers above the sea surface. The turbine also features high performance, an advanced aerodynamic design, and a robust structure, providing excellent performance in offshore environments and under changing wind conditions. The third turbine is the GE Haliade 150-6 MW, with a rated capacity of 6 MW, a swept area of 17,860 m2, and a rotor diameter of 150 m [70]. Although its capacity is lower than that of the previous two models, it is designed to achieve high efficiency, especially in areas known for moderate wind speeds.
The three turbines belong to the category of horizontal-axis wind turbines (HAWTs) with front-facing wind orientation and three blades, representing the most efficient standard design for offshore wind energy due to their dynamic stability, low noise levels, and high power coefficient.
A detailed comparison of the performance of these three models across different offshore zones provides an overall assessment of the wind potential in the context of Mauritania’s offshore climate, as well as the capacity factor and total energy production at different hub heights. Moreover, this multi-model evaluation allows for the identification of the turbine best suited to each region, thereby assisting in the optimization of wind farm design and enhancing the feasibility of offshore energy projects along the Mauritanian coast.
In this study, the Mauritanian maritime coastline along the Atlantic Ocean was divided into ten zones to facilitate a detailed assessment of local atmospheric wind characteristics. This division enables the identification of zone characteristics and differences in wind speed and direction, as well as the geographical and maritime (depth) features concentrated in each region.
In this context, the regions were distributed from Nouadhibou in the north to N’Dagou in the south, so that the data analysis covers the entire Mauritanian coast (Table 2). presents the ten zones studied with their precise geographical coordinates, enabling their locations to be clearly and accurately identified and prompting a systematic comparison of these regions to assess offshore wind potential.
Table 2.
Zones selected.
This study focuses on the atmospheric characterization of wind resources over the selected offshore zones. Bathymetric constraints were not included in the zoning process, as the main objective is to identify the theoretical offshore wind energy potential using a consistent resource assessment methodology independently of site-specific foundation limitations. Water depth is recognized as a critical factor in selecting suitable technology (fixed-bottom versus floating structures) and will be addressed in future studies dedicated to technical feasibility.
Wave, current, and tidal conditions influence dynamic loads, structural fatigue, and accessibility for operations and maintenance (O&M). These factors were not incorporated into the current model, which was specifically developed for offshore wind resource assessment and preliminary site screening rather than for detailed structural or engineering design. Annual energy production and capacity factors were estimated by integrating the turbine nominal power curve weighted by the Weibull statistical distribution of wind speeds. These estimates correspond to gross theoretical energy potential, without explicitly accounting for offshore-specific operational losses, such as wake effects, turbine downtime, internal electrical losses, or accessibility constraints.
According to international technical references (IEA Wind, NREL, IRENA) [71,72], combined losses from wake effects, unavailability, internal electrical inefficiencies, and offshore operational constraints typically range from 10 to 20% of gross production, depending on park layout and marine conditions. Consequently, the values reported in this study should be interpreted as theoretical gross estimates.
2.7. Scope and Limitations of the Study
This study provides a comprehensive characterization of the offshore wind resource along the Mauritanian Atlantic coast using atmospheric, marine, and geospatial datasets. The methodology is based on ERA5 reanalysis data, Weibull statistical modelling, wind power density estimation, theoretical energy production, bathymetric analysis, oceanographic conditions, spatial constraints, and uncertainty assessment.
The main objective is to identify the most promising offshore areas and provide a preliminary estimate of their theoretical wind energy potential. Accordingly, the study adopts a preliminary multi-criteria assessment framework and should therefore be regarded as an initial resource assessment rather than a comprehensive technical or economic feasibility study.
Detailed analyses of foundation design, seabed geotechnical conditions, electrical infrastructure, grid integration, environmental impacts, economic performance, and operational losses are beyond the scope of this study. Consequently, the reported energy production and capacity factor values should be interpreted as theoretical indicators based on the available datasets. A complete evaluation of offshore wind development would require site-specific investigations, detailed engineering analyses, and techno-economic assessments. The main sources of uncertainty in this study are related to the ERA5 reanalysis data, the fitting of the wind speed statistical distributions (Weibull, Gamma, and log-normal), the extrapolation of wind speed to turbine hub height, and the simplified assumptions adopted for energy production estimation, particularly the overall loss factors. These uncertainties may affect the absolute energy production values but do not alter the relative ranking of the investigated offshore zones, since the same methodology and assumptions were consistently applied to all sites.
3. Results and Discussion
3.1. Synthetic Comparative Analysis of the Zones
The offshore wind potential results were consolidated into a central table encompassing climatic, statistical, and energy indicators for all ten studied zones. This organization enables a clear and objective ranking of the sites, ensuring comparability across standardized metrics. The multi-criteria analysis reveals a pronounced spatial gradient in wind potential, gradually decreasing from Zone 1 to Zone 10. Zones 1 to 3 stand out with high mean wind speeds (9.28–9.71 m/s), significant maximum speeds (up to 23.63 m/s), elevated wind power density (650–740 W/m2), and favorable Weibull parameters (k ≥ 3.3), reflecting an intense and relatively stable wind regime. The gross capacity factor reaches 0.3744 in Zone 1, and the theoretical annual energy production (AEP) peaks at 95,384 MWh/year, positioning these zones as priority sites for offshore development. Zones 4 to 7 exhibit intermediate potential, with gradually lower mean speeds and power density (Vmoy 8.50–9.06 m/s; WPD 512–606 W/m2), yet remain competitive in terms of energy production and capacity factors. Finally, Zones 8 to 10, characterized by lower mean wind speeds (7.72–8.33 m/s), reduced power densities, and capacity factors below 0.27, show limited energy potential. To account for typical offshore operational losses, two simplified loss scenarios of 10% and 20% were applied to the gross AEP. These scenarios represent the combined effects of wake losses, turbine availability, electrical losses, and operation and maintenance activities.
The statistical evaluation of wind regimes reveals a clear spatial structuring of offshore wind potential across the studied zones. Annual mean wind speeds (Vmoy) gradually decrease from 9.71 m/s in Zone 1 to 7.72 m/s in Zone 10, reflecting a significant spatial gradient. This roughly 20% decrease between the extremes is energetically critical due to the cubic relationship between wind power and wind speed. The standard deviation (σ) remains relatively uniform across all zones (3.00–3.25 m/s), indicating comparable absolute dispersion of wind speeds. However, the coefficient of variation (CV) rises progressively from 0.335 to 0.389, highlighting a shift in the relative behavior of the wind. This trend indicates a gradual decline in relative wind stability toward the southern zones. Specifically, lower CV values (Zones 1 to 3) show that fluctuations around the mean are proportionally limited, corresponding to a more stable and consistent wind regime. Conversely, higher CV values in Zones 8 to 10 suggest that variability constitutes a larger proportion of the mean speed, pointing to a more irregular and potentially intermittent wind regime from an energy perspective. As shown in Table 3, the net AEP decreases under both loss scenarios, while the relative ranking of the investigated offshore zones remains unchanged. This indicates that the identification of the most promising offshore sites is robust despite representative operational losses. Therefore, the main conclusions regarding the spatial distribution of the offshore wind potential are not affected by the simplified net AEP assumptions adopted in this study.
Table 3.
Comparative analysis of the zones.
Analysis of percentiles supports this interpretation:
- The median (P50) closely follows the decreasing trend of Vmoy, confirming the coherence of the distributions.
- P90 values drop from 13.71 m/s to 11.59 m/s, indicating a gradual reduction in dominant high-wind events.
- P10 values also decline noticeably (5.17 to 3.67 m/s), reflecting a higher frequency of low-wind conditions in the less favorable zones.
The combination of moderate CV, high upper percentiles, and a relatively balanced P10–P90 range in Zones 1 to 4 points to a wind regime that is both intense and relatively stable, conducive to more consistent energy production. In contrast, Zones 8 to 10 show a compression of upper percentiles alongside increased relative variability, indicating reduced wind stability and more fluctuating theoretical output. Overall, the joint evaluation of Vmoy, σ, CV, and percentiles indicates that wind stability gradually decreases from north to south, in parallel with the decline in mean intensity.
3.2. Seasonal Variability and Wind Stability
A detailed examination of the seasonal data highlights notable variations in wind speeds (Table 4). The most favorable zones (Zones 1 to 3) exhibit stable seasonal patterns, with moderate standard deviations (≈3 m/s) and Weibull shape parameters (k) above 3, indicating a concentrated and consistent distribution of wind speeds. These features are particularly important in offshore contexts, where wind stability affects both energy performance and the annual mean output. In less favorable areas (Zones 8 to 10), standard deviations remain moderate, but mean wind speeds decrease and k falls below 3, reflecting higher relative variability and reduced energy potential. Incorporating these measures of dispersion and stability directly addresses critiques regarding the lack of temporal variability quantification and provides a solid foundation for site assessment.
Table 4.
Wind characteristics.
3.3. Comparative Analysis of the Different Types of Wind Distribution
The comparative assessment of seasonal wind-speed distributions is presented in Table 5 and consistently highlights the superior performance of the Weibull distribution across all studied zones. This conclusion is supported by three converging performance indicators: systematically lower RMSE and MAE values, along with notably higher coefficients of determination (R2). Across all zones and seasons, the Weibull distribution typically achieves R2 values between 0.88 and 0.99, with particularly high performance during Spring and Winter, where several zones exceed 0.98. Mean squared errors remain low (often below 0.01), reflecting an excellent fit for the observed wind frequency data. This inter-seasonal stability further confirms the structural suitability of the Weibull model for the offshore wind regime under study. The Gamma distribution occupies an intermediate position. While its performance is generally lower than Weibull, it shows relatively satisfactory fits during the Summer months, particularly in Zones 5 to 9, where R2 frequently ranges from 0.93 to 0.96. This suggests that under more homogeneous wind conditions, typically in Summer, the Gamma distribution can serve as an acceptable statistical alternative, although it is less robust overall. In contrast, the log-normal distribution exhibits the weakest performance across all indicators. R2 values generally range between 0.56 and 0.83, depending on the season, with RMSE values significantly higher than those obtained with the Weibull model. This limited performance reflects a reduced ability to accurately reproduce the distribution tails and high wind-speed frequencies, which are critical for energy estimation. From a spatial perspective, Zones 1 to 3 show slightly higher seasonal variability during Summer, with a relative decrease in R2 for all distributions, indicating greater dispersion in the wind regime. Conversely, Zones 6 to 10 demonstrate particularly strong fits, especially in Winter and Autumn, suggesting a more stable statistical structure of the wind in these areas.
Table 5.
Evaluation of Weibull, Log-Normal, and Gamma Fits Using RMSE, MAE, and R2 Metrics.
To determine the most appropriate probability density function (PDF) for the offshore areas under study, and to analyze the wind speeds there and their distribution, an approach was adopted toward a rigorous analysis that compares a number of common statistical models for wind speed analysis. It constitutes an essential step in the overall methodology, providing a reliable statistical representation of the wind regime and enabling a more accurate estimation of the energy potential of the selected offshore zones. In this context, three probability distributions widely used in wind assessment were used: the Weibull distribution, log-normal distribution, and Gamma distribution. These distributions are among the most accurate models in the scientific literature for evaluating stochastic weather processes that exhibit large spatial and temporal variability. By relying on time series of wind speeds in different marine areas off the Mauritanian coast (ocean), the coefficients of each distribution were systematically evaluated with reference to actual wind data. To assess the quality of the statistical modeling, the sum of absolute errors between the measured and resulting values for each distribution was calculated. This is one of the most important indicators for demonstrating a model’s ability to describe and analyze the true distribution of the data, especially at the edges of the distribution, which is particularly important when calculating available wind energy.
The results presented in Table 6 show that the Weibull distribution is more accurate and suitable across all studied zones than the other distributions. This distribution showed the lowest sum of absolute errors among the models, demonstrating its high efficiency in evaluating and analyzing the natural variability of wind speeds, especially in marine environments characterized by regular, stable wind patterns around the clock, compared to land areas. This behavior is consistent with the findings of many scientific studies that show that the Weibull distribution is one of the most widely used and reliable distributions for analyzing wind data due to its flexibility and ability to adapt to different climatic conditions.
Table 6.
Different types of wind distribution.
The adoption of the Weibull distribution in this study is consistent with the recommendations of IEC 61400-02 [67], which recommends the use of this distribution in analyzing wind data and assessing energy potential. This consistency strengthens the credibility of the methodology, ensuring that the results obtained are consistent with the best international practices in the field of wind energy. Based on all the above-mentioned analytical elements, the Weibull distribution was adopted as a reference and base distribution for analyzing and evaluating wind power in offshore areas off the Mauritanian coast.
3.4. Frequency Histogram
A quantitative goodness-of-fit assessment was conducted for the Weibull, log-normal, and Gamma distributions across all seasons and the ten offshore zones using three statistical performance indicators: root mean square error (RMSE), mean absolute error (MAE), and the coefficient of determination (R2). Across all zones and seasons, the Weibull distribution consistently exhibits the lowest RMSE and MAE values, along with the highest R2 coefficients. RMSE values for the Weibull model generally range between 0.0032 and 0.0121, MAE values between 0.0028 and 0.0092, and R2 values typically exceed 0.95 in most cases, reaching values above 0.99 in several Winter and Summer conditions (e.g., Zones 5–7). These results indicate an excellent agreement between modeled and empirical wind speed distributions. In contrast, the log-normal distribution systematically presents higher RMSE values (approximately 0.0165–0.0326), higher MAE, and significantly lower R2 coefficients, frequently below 0.80 and in some cases near 0.60 (e.g., Winter in Zone 1 and Summer in Zone 1). These deviations are particularly pronounced at distribution peaks and upper tails, reducing the reliability for offshore wind resource characterization. The Gamma distribution provides intermediate performance. Its RMSE values (approximately 0.0085–0.0262) and R2 coefficients (generally between 0.80 and 0.95) demonstrate a reasonably good fit, particularly during Summer seasons, where R2 often exceeds 0.93 (e.g., Zones 6–8). However, the Gamma model still exhibits slightly larger deviations than the Weibull distribution, especially at higher wind speeds, which are critical for accurate wind power density and Annual Energy Production (AEP) estimation. Seasonally, the best statistical performance is frequently observed during Summer and Winter, where R2 values for the Weibull model often exceed 0.98–0.99 in several zones, indicating strong stability and regularity of the wind regime during these periods. Spring and Autumn show slightly higher dispersion but still maintain strong Weibull performance. Although Spring and Autumn exhibit slightly greater variability, the Weibull distribution continues to provide the best overall fit. Considering its consistently lower RMSE and MAE values, together with its higher R2 values, the Weibull distribution provides the most accurate representation of the seasonal wind speed distributions across the Mauritanian offshore zones. It was therefore selected as the reference model for subsequent wind power density and offshore energy production assessments.
Seasonal wind speed distributions for Zone 1 are presented in Figure 5, comparing the Weibull, log-normal, and Gamma models. The results highlight seasonal variations in their fitting performance. The Weibull distribution provides the best overall fit, particularly during Winter (DJF) and Spring (MAM), where it accurately captures both the peak and tail of the distribution. In Autumn (SON), the Gamma distribution performs similarly, while in Summer (JJA), the log-normal distribution better represents higher wind speeds. Overall, the Weibull distribution remains the most reliable model, whereas the log-normal distribution is better suited to seasons characterized by greater asymmetry and higher wind-speed extremes.
Figure 5.
Frequency histograms of the seasonal wind distributions for Zone 1.
Figure 6 presents the seasonal wind speed distributions for Zone 2 using the Weibull, log-normal, and Gamma models. Similar patterns to those observed in Zone 1 are found, although the seasonal differences are more pronounced. The Weibull distribution provides the best fit during Winter (DJF) and Spring (MAM), accurately representing both the peak and overall distribution. In Summer (JJA), the log-normal model better captures higher wind speeds, reflecting the greater variability of the season. During Autumn (SON), the Weibull and Gamma distributions perform similarly, with a slight advantage for the Weibull model. Overall, the Weibull distribution remains the most reliable for Zone 2, while the log-normal distribution is more suitable for Summer conditions.
Figure 6.
Frequency histograms of the seasonal wind distributions for Zone 2.
Figure 7 illustrates the seasonal wind speed distributions for Zone 3. The results confirm the consistent performance of the Weibull model, which closely matches the observed distributions during Winter (DJF) and Spring (MAM). In Summer (JJA), the stronger asymmetry of the wind regime makes the log-normal distribution more suitable for representing higher wind speeds. During Autumn (SON), the Weibull and Gamma models produce comparable results, although the Weibull model remains slightly more accurate. Overall, the Weibull distribution provides the most stable representation across all seasons, while the log-normal model offers a better description of Summer wind conditions.
Figure 7.
Frequency histograms of the seasonal wind distributions for Zone 3.
Figure 8 illustrates the seasonal wind speed distributions for Zone 4 using the Weibull, log-normal, and Gamma models. Overall, the Weibull model shows the closest agreement with the observed data, particularly in Winter (DJF) and Spring (MAM), where it accurately reproduces both the peak and the overall distribution. During Summer (JJA), the log-normal model captures the higher wind-speed range better, reflecting the greater seasonal variability. In Autumn (SON), the Weibull and Gamma models provide very similar results, although the Weibull model remains slightly closer to the measured distribution. Taken together, these findings indicate that the Weibull distribution is the most appropriate choice for describing the wind regime in Zone 4, while the log-normal model performs better under Summer conditions.
Figure 8.
Frequency histograms of the seasonal wind distributions for Zone 4.
Figure 9 presents the seasonal wind speed distributions for Zone 5 based on the Weibull, log-normal, and Gamma models. The Weibull model provides the closest overall agreement with the observed data, particularly during Winter (DJF) and Spring (MAM), where it accurately captures the main characteristics of the distributions. In Summer (JJA), the increase in higher wind speeds makes the log-normal model more suitable for describing the upper tail. During Autumn (SON), both the Weibull and Gamma models perform similarly, although the Weibull model remains slightly more consistent with the observations. Overall, the Weibull distribution best represents the annual wind regime in Zone 5, while the log-normal model offers a better fit during Summer.
Figure 9.
Frequency histograms of the seasonal wind distributions for Zone 5.
Figure 10 compares the seasonal wind speed distributions for Zone 6 using the Weibull, log-normal, and Gamma models. The Weibull model shows the best overall agreement with the observed data, particularly in Winter (DJF) and Spring (MAM), where it accurately reproduces the main features of the distributions. As wind speeds become more skewed in Summer (JJA), the log-normal model better represents the upper tail. In Autumn (SON), the Weibull and Gamma models perform similarly, with a slight advantage for the Weibull model. Overall, the Weibull distribution provides the most consistent description of the wind regime in Zone 6, whereas the log-normal model is better suited to Summer conditions because of the greater variability in wind speeds.
Figure 10.
Frequency histograms of the seasonal wind distributions for Zone 6.
Figure 11 presents the seasonal wind speed distributions for Zone 7 using the Weibull, log-normal, and Gamma models. The Weibull model closely follows the observed distributions during Winter (DJF) and Spring (MAM), accurately capturing both the peak and the overall pattern. In Summer (JJA), the greater asymmetry of the wind regime favors the log-normal model, which better represents the higher wind-speed range. During Autumn (SON), the Weibull and Gamma models yield comparable results, with a slight advantage for the Weibull model. Overall, the Weibull distribution provides the most suitable representation of the annual wind regime in Zone 7, whereas the log-normal model is better adapted to the more variable Summer conditions.
Figure 11.
Frequency histograms of the seasonal wind distributions for Zone 7.
Figure 12 illustrates the seasonal wind speed distributions for Zone 8 based on the Weibull, log-normal, and Gamma models. The Weibull model provides the closest match to the observed data during Winter (DJF) and Spring (MAM), accurately reproducing both the peak and the overall distribution. In Summer (JJA), the increased skewness toward higher wind speeds makes the log-normal model more effective in representing the upper tail. During Autumn (SON), the Weibull and Gamma models show similar performance, although the Weibull model remains slightly more consistent with the observations. Overall, the Weibull distribution offers the most appropriate description of the annual wind regime in Zone 8, while the log-normal model better captures the greater variability observed during Summer.
Figure 12.
Frequency histograms of the seasonal wind distributions for Zone 8.
Figure 13 presents the seasonal wind speed distributions for Zone 9 using the Weibull, log-normal, and Gamma models. The Weibull model consistently provides the closest agreement with the observed data, particularly during Winter (DJF) and Spring (MAM), where it accurately reproduces the main characteristics of the distributions. In Summer (JJA), the stronger skewness toward higher wind speeds makes the log-normal model more suitable for describing the upper tail. During Autumn (SON), the Weibull and Gamma models perform similarly, although the Weibull model shows a slightly better agreement with the observations. These results confirm the Weibull distribution as the most suitable model for describing the annual wind regime in Zone 9, while the log-normal model better reflects the increased Summer variability.
Figure 13.
Frequency histograms of the seasonal wind distributions for Zone 9.
Figure 14 presents the seasonal wind speed distributions for Zone 10. As in the other study areas, the Weibull model provides the closest overall agreement with the observed data, especially during Winter (DJF) and Spring (MAM), where it accurately captures both the peak and the general shape of the distributions. In Summer (JJA), the greater skewness toward higher wind speeds favors the log-normal model, which better describes the upper tail. During Autumn (SON), the Weibull and Gamma models show comparable performance, with a slight advantage for the Weibull model. Overall, the Weibull distribution offers the most appropriate representation of the annual wind regime in Zone 10, whereas the log-normal model is better suited to the more variable Summer conditions.
Figure 14.
Frequency histograms of the seasonal wind distributions for Zone 10.
3.5. Wind Rose
The seasonal wind roses shown in Figure 15, Figure 16, Figure 17 and Figure 18 summarize the offshore wind regime along the Mauritanian Atlantic coast for the 2020–2024 period using five years of ERA5 data. They illustrate both the frequency of wind occurrence by direction and the corresponding wind speed classes, providing a clear overview of the seasonal variability of the wind resource.
Figure 15.
Winter (DJF) wind rose (2020–2024).
Figure 16.
Spring (MAM) wind rose (2020–2024).
Figure 17.
Summer (JJA) wind rose (2020–2024).
Figure 18.
Autumn (SON) wind rose (2020–2024).
Across all seasons, the wind regime is dominated by north–northeast (N–NE) winds, with only limited contributions from other directions. This persistent pattern reflects the influence of the northeastern trade winds and indicates a highly stable offshore atmospheric circulation.
Seasonal differences mainly affect wind intensity rather than direction. Winter (DJF) is characterized by frequent winds between 8 and 14 m s−1, with regular events exceeding 14 m s−1, confirming a highly energetic season. Spring (MAM) exhibits the strongest directional concentration and the highest wind persistence, with most wind speeds ranging from 8 to 16 m s−1, making it the most stable season. During Summer (JJA), the prevailing direction remains unchanged, although wind speeds decrease slightly and are mainly distributed between 6 and 12 m s−1. In Autumn (SON), stronger winds return, with conditions similar to Winter and a renewed dominance of the 8–14 m s−1 range. Overall, the seasonal wind roses reveal an exceptionally stable offshore wind regime, where the dominant wind direction remains nearly constant throughout the year. This directional consistency, combined with the prevalence of moderate-to-high wind speeds, highlights the excellent offshore wind resource along the Mauritanian Atlantic coast and supports the wind speed and wind power density results presented in the previous sections. The predominance of northerly winds throughout the four seasons highlights a persistent directional characteristic of the Mauritanian Atlantic coast. This pattern is consistent with the regional atmospheric circulation over the coastal zone and contributes to the relatively favorable wind conditions identified in the northern and central offshore areas. The persistent northerly component is also relevant for offshore wind development because it indicates a relatively stable prevailing wind direction, although detailed turbine layout and wake-loss assessments would be required in future studies.
3.6. Monthly and Seasonal Analysis of Wind Power Density
A detailed examination of monthly wind power density (Table 7) highlights significant seasonal variations and reveals the dynamics of offshore wind potential across all studied zones. Zones 1 to 3 stand out with consistently high values throughout the year, peaking in June (1237.27 W/m2 for Zone 1, 1219.55 W/m2 for Zone 2, and 1123.08 W/m2 for Zone 3), reflecting particularly favorable wind regimes during Spring and early Summer. These elevated power density levels demonstrate the strength and consistency of the wind in these areas, underscoring their strategic potential for offshore wind farm development.
Table 7.
Power density available in each zone.
For the intermediate zones (4 to 7), the seasonal pattern remains similar but with more moderate values (1020–678 W/m2), indicating slightly lower wind speeds and reduced power density. Nevertheless, these zones still offer notable potential during peak months, supporting their suitability for secondary or complementary energy installations.
Zones 8 to 10, characterized by lower power densities (574–318 W/m2), exhibit greater monthly variability. Although their potential is limited compared to the most exposed zones, the months of May and June still show appreciable power density levels, suggesting that these sites can contribute to energy production through the deployment of appropriate turbine technologies and optimized turbine sizing.
3.7. Energy Performance of Turbines
The energy yield simulations were carried out using three offshore turbine models: SG 8.0-167, V164-10.0 MW, and GE Haliade 150-6 MW (Table 8). Across all selected technologies, the ranking of the zones remains consistent with the previously estimated wind resource potential. Zones 1 to 3 systematically exhibit the highest capacity factors and annual energy production (AEP), whereas Zones 8 to 10 show comparatively lower performance levels. This internal consistency supports the relevance of the resource–turbine coupling approach and strengthens the physical credibility of the estimates. It should be emphasized that the reported AEP and capacity factor values correspond to gross theoretical outputs. The calculations do not incorporate offshore-specific losses, such as wake interactions, technical downtime, electrical transmission losses, or maintenance-related constraints. Therefore, these figures reflect a maximum technical potential and should not be interpreted as net commercially deliverable energy production.
Table 8.
Annual energy production for each zone.
To place our results in the context of regional assessments of offshore wind potential, we compared our estimates with recent African studies focusing on atmospheric wind analysis. In an investigation along the Atlantic coast of Morocco, mean wind speeds at 100 m derived from ERA5 data adjusted with IFREMER measurements ranged from 8.5 m/s to 10.2 m/s depending on the site, with power densities exceeding 400–420 W/m2. Weibull distribution fitting yielded high goodness-of-fit coefficients over multi-decadal periods (2010–2020) [32]. In comparison, our Mauritanian results based on ERA5 (2020–2024) show slightly higher mean wind speeds in some northern zones (up to ≈9.7 m/s) and proportionally consistent power densities, despite the shorter study period. Methodological differences—including the analysis period, reference height (100 m versus other heights tested), and data origin (ERA5 reanalysis versus locally adjusted measurements)—partly explain the observed discrepancies. In another study focusing on the Gulf of Guinea (Nigeria), mean wind speeds at 100 m were reported between 7.8 and 9.2 m/s across sites, with associated power densities and statistical fitting based on Weibull and Rayleigh distributions applied to coastal station data and reanalysis spanning 10–15 years [73]. Statistical parameters, such as the Weibull shape and scale factors, varied slightly depending on methodology, highlighting the importance of contextualizing comparisons according to data sources, heights, and study periods. These comparisons emphasize clear methodological differences: our Mauritanian estimates are based on a recent, shorter period (2020–2024) with uniform 100 m wind resolution, whereas other studies often combine longer periods, locally adjusted ERA5 data, and multiple statistical model calibrations. This affects not only the mean wind speeds and power densities obtained but also the shape and scale parameters used in wind distributions. It is also important to note that our results represent raw, theoretical estimates that do not account for offshore-specific losses (wake effects, turbine downtime, electrical losses) or engineering constraints. Therefore, they should be interpreted as comparable orders of magnitude rather than direct equivalents of evaluations incorporating physical and feasibility limitations. These aspects can be summarized in a comparative table documenting mean wind speeds, power densities, statistical parameters, study periods, and data sources for each zone relative to the cited African studies.
The differences observed in offshore wind potential along the Mauritanian coastline can be mainly explained by the influence of regional atmospheric circulation, coastal characteristics, and ocean–atmosphere interactions. The northern offshore areas show higher wind speeds and wind power densities, which lead to higher annual energy production and capacity factors compared with the southern areas. These trends are in agreement with previous studies conducted along the northwest African Atlantic coast, although some variations may result from differences in the data sources, reference periods, and assessment approaches. Overall, these results provide a better understanding of the physical factors influencing the spatial distribution of offshore wind resources and support the identification of the most promising areas for future development.
- Bathymetric Characterization of the Mauritanian Atlantic Coast
To assess the influence of offshore distance on the suitability of potential wind farm locations, 10 km, 20 km, and 50 km buffer zones were generated along the Mauritanian Atlantic coast (Figure 19). These buffers highlight a gradual increase in water depth with increasing distance from the shoreline. Areas located within the 10 km buffer are predominantly situated on the inner continental shelf, where water depths generally remain below 50 m, making them well suited for fixed-bottom foundation technologies. Between the 20 km and 50 km buffers, water depth progressively increases as the seabed transitions toward the outer continental shelf, locally exceeding 100 m near the continental slope. This bathymetric variation has a direct influence on foundation selection, with shallower waters generally favoring fixed-bottom structures, such as monopile, jacket, or gravity-based foundations, while deeper areas may require floating foundation technologies. Consequently, the combined analysis of bathymetry and offshore buffer zones provides a valuable framework for the preliminary screening of the ten offshore sites (Figure 20) by identifying locations that offer a suitable balance between water depth, accessibility, and technical feasibility for future offshore wind development.
Figure 19.
Bathymetric Characterization of the Mauritanian Atlantic Coast.
Figure 20.
Zone Bathymetric Characterization of the Mauritanian Atlantic Coast.
- Yellow/orange: coastal zone located around the mainland, representing the nearshore maritime area close to the coastline
In general, shallow-water areas are considered more suitable for fixed-bottom offshore wind technologies, whereas deeper waters may become more favorable for floating solutions. However, this distinction should not be interpreted as being governed by a single universal depth threshold. The selection of the most appropriate technology also depends on several factors, including seabed geotechnical conditions, foundation type, technology maturity, installation constraints, and project economics. Therefore, the bathymetric analysis presented in this study should be regarded as a preliminary indicator of technical feasibility rather than a standalone criterion for selecting the most suitable offshore wind technology.
- Marine Spatial Constraints
Marine spatial constraints represent a key consideration in the selection of suitable sites for offshore wind development (Figure 21). In addition to wind resource availability and bathymetric conditions, site selection must account for other marine uses—including marine protected areas, shipping routes, fishing grounds, submarine cables, pipelines, and environmentally sensitive areas—to minimize user conflicts and reduce environmental impacts. In particular, the Banc d’Arguin National Park represents a protected marine area that must be considered in the spatial planning process. Buffer zones of 10, 20, and 50 km from the coastline were considered to support the identification of suitable offshore wind development areas (Figure 22). The International Marine Spatial Planning [74] guidelines recommend that these constraints be incorporated from the earliest stages of site selection to promote sustainable offshore wind development while ensuring balanced coexistence with other maritime activities [75]. Along the Mauritanian Atlantic coast, the assessment of these spatial constraints complements the evaluation of wind resources and bathymetric conditions by helping identify areas that are more suitable for future offshore wind projects. However, this preliminary assessment should be refined using the most recent national spatial and environmental datasets before any final site selection or project implementation [76].
Figure 21.
Marine Spatial Constraints.
Figure 22.
Buffer zones at 10 km, 20 km, and 50 km.
Along the Mauritanian Atlantic coast, the main marine spatial constraints include the Banc d’Arguin National Park, major fishing grounds, commercial shipping routes, and the port infrastructures of Nouadhibou and Nouakchott. These constraints should be considered from the earliest stages of offshore site selection to minimize conflicts among maritime activities, protect marine ecosystems, and support the sustainable development of offshore wind energy [77].
- Geotechnical Considerations
Geotechnical conditions play a fundamental role in the design and long-term performance of offshore wind turbine foundations. As no site-specific geotechnical investigations (e.g., boreholes, CPT/CPTu tests, or sediment core sampling) were available for the present study, the assessment was based on bathymetric information, seabed morphology, and the existing geological knowledge of the Mauritanian continental margin to provide a preliminary evaluation of geotechnical constraints. The study by [78] indicates that this continental margin is predominantly composed of marine sedimentary deposits whose mechanical properties vary according to sedimentation processes and past submarine mass movements, potentially affecting foundation stability. Recent international guidelines further emphasize that reliable foundation design requires an integrated geophysical and geotechnical site investigation to characterize subsurface conditions, assess soil bearing capacity, evaluate scour potential and settlement, and determine soil behavior under cyclic loading before selecting the most appropriate foundation type, whether fixed-bottom or floating [79,80]. Therefore, although the ten offshore zones identified along the Mauritanian Atlantic coast exhibit favorable wind resources and bathymetric conditions, their technical suitability should be confirmed through comprehensive geotechnical site investigations in accordance with international best practices for offshore wind development.
- Integration of the Ten Offshore Zones into the SOMELEC Power Grid
The integration of the ten offshore zones identified along the Mauritanian Atlantic coast should be evaluated in conjunction with the capacity of the national power grid to accommodate additional renewable generation. The proximity of existing electrical infrastructure, particularly high-voltage substations and major demand centers, is a key factor, as it directly influences submarine cable length, transmission losses, grid connection costs, and overall system reliability. Offshore zones located near Nouadhibou, Boulenouar, and Nouakchott offer clear advantages due to the presence of existing transmission infrastructure and their proximity to the main SOMELEC transmission network, making them attractive candidates for the initial phases of offshore wind development [81].
Integrating large-scale offshore wind into Mauritania’s relatively small power system requires careful attention to grid stability. As renewable penetration increases, maintaining frequency and voltage stability, ensuring adequate operating reserves, and providing ancillary services become increasingly important. Depending on the level of offshore wind deployment, technologies such as battery energy storage systems (BESSs), reactive power compensation (STATCOM or SVC), and advanced power electronic converters may be needed to support secure system operation. Therefore, a phased integration strategy, rather than connecting all ten offshore zones simultaneously, would provide greater operational flexibility and reduce the technical challenges associated with large-scale renewable energy integration [82]. Considering the ongoing expansion of Mauritania’s electricity network and its strategy to increase the share of renewable energy, offshore zones located nearest to existing transmission infrastructure should be prioritized during the initial development phase. More distant sites can be integrated gradually as the transmission network expands, electricity demand grows, and new high-voltage infrastructure is deployed. This phased approach would optimize investment costs while enhancing the long-term reliability of offshore wind integration into the Mauritanian power system [82] Although the high capacity factors highlight the excellent offshore wind resource, their practical exploitation will also depend on the availability of grid infrastructure, transmission capacity, and local electricity demand. In northern Mauritania, where grid integration may be constrained, alternative applications, such as offshore renewable hydrogen production, could provide an attractive pathway for valorizing the available wind resource while supporting future energy development.
Although this study mainly focuses on assessing offshore wind resources and identifying suitable areas for development, it also represents a first step toward more advanced studies on technology selection and dynamic performance. In particular, offshore areas with greater water depths may require floating wind turbine technology rather than fixed-bottom foundations. In this context, reference models such as [83], together with coupled dynamic analysis approaches for floating offshore wind turbines [84], provide valuable frameworks for evaluating structural response, control system performance, and grid integration. These approaches will be considered in future work to complement the present resource assessment and support the selection of the most suitable offshore wind technologies for the environmental conditions of the Mauritanian coastline. For the deeper offshore areas identified in this study, floating technologies may represent a suitable alternative to fixed-bottom foundations. However, detailed dynamic and hydrodynamic modeling of floating wind turbines remains beyond the scope of this preliminary resource assessment and requires further site-specific investigation.
4. Conclusions
Evaluating the parameters of the Weibull distribution plays an important role in quantifying a site’s wind energy potential. This study is based on five years (2020–2024) of hourly ERA5 data at 100 m. The analysis of ten offshore zones along the Atlantic coast of Mauritania reveals a pronounced north–south gradient in wind resource potential. Annual mean wind speeds decrease from 9.71 m/s in Zone 1 to 7.72 m/s in Zone 10, accompanied by a decline in wind power density from 740 W/m2 to 410 W/m2 and in estimated annual energy production from 95,384 MWh to 33,784 MWh. Variability remains moderate (CV = 33–39%), with lower dispersion and more persistent winds in the northern zones, as confirmed by the percentile analysis (P10–P90). Seasonally, Spring records the highest wind speeds (up to 10.74 m/s), whereas Summer conditions weaken in the southern sector. Among the tested statistical models, the Weibull distribution consistently provides the best fit, yielding lower RMSE and MAE and higher R2 values than the log-normal and Gamma functions. Energy simulations for three offshore turbines indicate a consistent ranking across zones, with the SG 8.0-167 reaching 74.75 GWh and a capacity factor of 52.8% in Zone 1, compared to 27.68 GWh and 35.3% in Zone 10. Overall, these results confirm that the northern offshore zones offer the most favorable conditions for large-scale offshore wind development, while the southern zones remain technically viable despite their lower energy potential. Beyond the assessment of wind resources, this study integrates bathymetric conditions, marine spatial constraints, geotechnical considerations, and uncertainty analysis to establish a multi-criteria framework for the preliminary screening of offshore wind sites. The results indicate that the northern and central sectors are generally characterized by water depths suitable for fixed-bottom foundations, whereas deeper areas may require floating foundation technologies. The inclusion of marine protected areas, shipping routes, and fishing grounds further identifies the main spatial constraints that could influence future offshore wind development. Although the present work provides a solid preliminary assessment of the technical suitability of the ten offshore zones, detailed geophysical and geotechnical investigations, together with techno-economic and environmental studies, will be necessary to support future project design and implementation.
Author Contributions
M.A.: Writing—Original Version, Validation, Resources, Project Management, Methodology, Software, Data Processing. B.H.: Writing—Review and Editing. F.A.: Supervision, Writing—Review and Editing. M.M.A.: Writing—Review and Editing. M.O.: Conceptualization. M.L.F.: Supervision, Validation. All authors have read and agreed to the published version of the manuscript.
Funding
This research received no external funding.
Institutional Review Board Statement
Not applicable.
Informed Consent Statement
Not applicable.
Data Availability Statement
Data are based on ERA5 satellite data with hourly resolution, with a height of 100 m, from ECMWF (European Centre for Medium-Range Weather Forecasts) (accessed 17 July 2025), Protected Marine Areas Navigator (accessed 1 July 2025; https://www.arcgis.com/apps/mapviewer/index.html?webmap=922362ebbd8448ecb44335d29997aeb6; https://services9.arcgis.com/lm7wE8a9YA9rKfzy/arcgis/rest/services/Navigator_AlSites_010925_attributes/FeatureServer), Marineregions: intersect of EEZs and IHO areas (accessed 1 July 2025; https://www.marineregions.org/downloads.php?), GEBCO (accessed 1 July 2025; https://www.gebco.net/data-products/gridded-bathymetry-data), and Natural Earth–Admin 0–Countries (accessed 1 July 2025; https://www.naturalearthdata.com/downloads/10m-cultural-vectors/).
Conflicts of Interest
The authors affirm that they have no conflicts of interest to report.
References
- IEA. Wind. Available online: https://www.iea.org/energy-system/renewables/wind (accessed on 1 March 2026).
- IEA. Offshore Wind Outlook 2019–Analysis. Available online: https://www.iea.org/reports/offshore-wind-outlook-2019 (accessed on 25 November 2025).
- Tatli, M.; Moraïs, S.; Tovar-Herrera, O.E.; Bomble, Y.J.; Bayer, E.A.; Medalia, O.; Mizrahi, I. Nanoscale resolution of microbial fiber degradation in action. eLife 2022, 11, e76523. [Google Scholar] [CrossRef] [Scilit]
- Haidi, T.; Cheddadi, B.; Mariami, F.E.; Idrissi, Z.E.; Tarrak, A. Wind energy development in Morocco: Evolution and impacts. Int. J. Electr. Comput. Eng. 2021, 11, 2811–2819. [Google Scholar] [CrossRef] [Scilit]
- Zhou, S.; Yang, P. Risk management in distributed wind energy implementing Analytic Hierarchy Process. Renew. Energy 2020, 150, 616–623. [Google Scholar] [CrossRef] [Scilit]
- IEA. Summary–Renewables 2024–Analysis. Available online: https://www.iea.org/reports/renewables-2024/executive-summary (accessed on 15 July 2025).
- Boadu, S.; Otoo, E. A comprehensive review on wind energy in Africa: Challenges, benefits and recommendations. Renew. Sustain. Energy Rev. 2024, 191, 114035. [Google Scholar] [CrossRef] [Scilit]
- Rystad Energy. Global Offshore Wind Poised for Landmark 19GW of Additions in 2025. Available online: https://www.rystadenergy.com/news/global-offshore-wind-landmark-19gw (accessed on 2 March 2026).
- The GWEC Team. Offshore Wind Installed Capacity Reaches 83 GW as New Report Finds 2024 a Record Year for Construction and Auctions. Available online: https://www.gwec.net/gwec-news/offshore-wind-installed-capacity-reaches-83-gw-as-new-report-finds-2024-a-record-year-for-construction-and-auctions (accessed on 15 July 2025).
- Keho, Y. What drives energy consumption in developing countries? The experience of selected African countries. Energy Policy 2016, 91, 233–246. [Google Scholar] [CrossRef] [Scilit]
- Rehman, S.; Zayed, M.E.; Syed, A.H.; Ghazy, M.; Irshad, K.; Al-Shaikhi, A.; Mohandes, M.A.; Alhems, L.M. Assessment of offshore wind power potential in Saudi Arabia’s Red Sea: Insights into fixed-bottom and floating offshore technologies. Results Eng. 2026, 29, 108626. [Google Scholar] [CrossRef] [Scilit]
- Soomro, S.A.; Mirjat, N.H.; Uqaili, M.A.; Arshad, N.; Khatri, S.A. Wind Speed prediction using sparse SCADA data of an offshore wind farm of Pakistan using different machine learning techniques. Results Eng. 2026, 29, 109144. [Google Scholar] [CrossRef] [Scilit]
- Alkhalidi, A.; Kaylani, H.; Alawawdeh, N. Technology Assessment of offshore wind turbines: Floating platforms–Validated by case study. Results Eng. 2023, 17, 100831. [Google Scholar] [CrossRef] [Scilit]
- Deng, X.; Xu, W.; Xu, Y.; Shao, Y.; Wu, X.; Yuan, W.; Qin, Z. Offshore wind power in China: A potential solution to electricity transformation and carbon neutrality. Fundam. Res. 2024, 4, 1206–1215. [Google Scholar] [CrossRef] [Scilit]
- El Kihel, B.; El Kadri Elyamani, N.E. Planning for offshore wind: An integrated smart approach combining NREL classification and TOPSIS. Results Eng. 2025, 27, 105833. [Google Scholar] [CrossRef] [Scilit]
- Khan, M.G.M.; Ahmed, M.R. Bayesian method for estimating Weibull parameters for wind resource assessment in a tropical region: A comparison between two-parameter and three-parameter Weibull distributions. Wind Energy Sci. 2023, 8, 1277–1298. [Google Scholar] [CrossRef] [Scilit]
- Lencastre, P.; Yazidi, A.; Lind, P.G. Modeling Wind-Speed Statistics beyond the Weibull Distribution. Energies 2024, 17, 2621. [Google Scholar] [CrossRef] [Scilit]
- Wang, W.; Gao, Y.; Ikegaya, N. Approximating wind speed probability distributions around a building by mixture weibull distribution with the methods of moments and L-moments. J. Wind Eng. Ind. Aerodyn. 2025, 257, 106001. [Google Scholar] [CrossRef] [Scilit]
- Yılmaz, A.; Kara, M. Statistical Analysis of Wind Speed Data with Different Distributions: Bitlis, Türkiye. Türk Doğa Fen. Derg. 2024, 13, 5–10. [Google Scholar] [CrossRef] [Scilit]
- Pobočíková, I.; Sedliačková, Z.; Michalková, M. Application of Four Probability Distributions for Wind Speed Modeling. Procedia Eng. 2017, 192, 713–718. [Google Scholar] [CrossRef] [Scilit]
- Ahmed, S.; Omer, H. A Statistical Analysis of wind Power Density Based on the Weibull and Ralyeigh Models of Penjwen Region/Sulaimani-Iraq. Jordan J. Mech. Ind. Eng. JJMIE 2012, 6, 135–140. [Google Scholar]
- An In-Depth Review of the Weibull Model with a Focus on Various Parameterizations. Available online: https://www.mdpi.com/2227-7390/12/1/56 (accessed on 25 November 2025).
- Kang, S.; Khanjari, A.; You, S.; Lee, J.-H. Comparison of different statistical methods used to estimate Weibull parameters for wind speed contribution in nearby an offshore site, Republic of Korea. Energy Rep. 2021, 7, 7358–7373. [Google Scholar] [CrossRef] [Scilit]
- Venu, H.; Subramani, L.; Raju, V.D. Emission reduction in a DI diesel engine using exhaust gas recirculation (EGR) of palm biodiesel blended with TiO2 nano additives. Renew. Energy 2019, 140, 245–263. [Google Scholar] [CrossRef] [Scilit]
- Schneider, W.D.H.; Fontana, R.C.; Baudel, H.M.; de Siqueira, F.G.; Rencoret, J.; Gutiérrez, A.; de Eugenio, L.I.; Prieto, A.; Martínez, M.J.; Martínez, Á.T.; et al. Lignin degradation and detoxification of eucalyptus wastes by on-site manufacturing fungal enzymes to enhance second-generation ethanol yield. Appl. Energy 2020, 262, 114493. [Google Scholar] [CrossRef] [Scilit]
- Hui, J.; Yuan, J. Chattering-free higher order sliding mode controller with a high-gain observer for the load following of a pressurized water reactor. Energy 2021, 223, 120066. [Google Scholar] [CrossRef] [Scilit]
- Zhang, Y.; Jiang, Y.; Rui, W.; Thompson, R.G. Analyzing truck fleets’ acceptance of alternative fuel freight vehicles in China. Renew. Energy 2019, 134, 1148–1155. [Google Scholar] [CrossRef] [Scilit]
- Goit, J.P. Wind Resource Assessment over Extremely Diverse Terrain. Wind 2025, 5, 32. [Google Scholar] [CrossRef] [Scilit]
- Umoh, K.; Hasan, A.; Kenjegaliev, A.; Al-Qattan, A. Assessment of the locational potential of floating offshore wind energy in South Africa. Sustain. Energy Res. 2024, 11, 12. [Google Scholar] [CrossRef] [Scilit]
- Ohunakin, O.S.; Matthew, O.J.; Adaramola, M.S.; Atiba, O.E.; Adelekan, D.S.; Aluko, O.O.; Henry, E.U.; Ezekiel, V.U. Techno-economic assessment of offshore wind energy potential at selected sites in the Gulf of Guinea. Energy Convers. Manag. 2023, 288, 117110. [Google Scholar] [CrossRef] [Scilit]
- Bahaj, A.S.; Mahdy, M. Quantifying Africa’s offshore wind energy potential using Multi-Criteria Decision Assessment. Sustain. Energy Technol. Assess. 2026, 86, 104749. [Google Scholar] [CrossRef] [Scilit]
- Zekeik, Y.; OrtizBevia, M.J.; Alvarez-Garcia, F.J.; Haddi, A.; El Mourabit, Y.; RuizdeElvira, A. Long-Term Assessment of Morocco’s Offshore Wind Energy Potential Using ERA5 and IFREMER Wind Data. J. Mar. Sci. Eng. 2024, 12, 460. [Google Scholar] [CrossRef] [Scilit]
- Gnandji, M.R.; Fifatin, F.-X.; Dubas, F.; Espanet, C.; Vianou, A. Etude du Potentiel Energétique Eolien Offshore du Bénin. In Proceedings of the Colloque International Francophone Portant sur l’Energétique et la Mécanique (CIFEM), Cotonou, Benin, 23–25 April 2018. [Google Scholar]
- Thiaw, L.; Sow, G.; Fall, S.S.; Kasse, M.; Sylla, E.; Thioye, S. A neural network based approach for wind resource and wind generators production assessment. Appl. Energy 2010, 87, 1744–1748. [Google Scholar] [CrossRef] [Scilit]
- Didane, D.H.; Rosly, N.; Zulkafli, M.F.; Shamsudin, S.S. Evaluation of Wind Energy Potential as a Power Generation Source in Chad. Int. J. Rotating Mach. 2017, 2017, 3121875. [Google Scholar] [CrossRef] [Scilit]
- Alsamamra, H.R.; Salah, S.; Shoqeir, J.A.H.; Manasra, A.J. A comparative study of five numerical methods for the estimation of Weibull parameters for wind energy evaluation at Eastern Jerusalem, Palestine. Energy Rep. 2022, 8, 4801–4810. [Google Scholar] [CrossRef] [Scilit]
- Elsner, P. Continental-scale assessment of the African offshore wind energy potential: Spatial analysis of an under-appreciated renewable energy resource. Renew. Sustain. Energy Rev. 2019, 104, 394–407. [Google Scholar] [CrossRef] [Scilit]
- Gunnell, Y.; Mietton, M.; Touré, A.A.; Fujiki, K. Potential for wind farming in West Africa from an analysis of daily peak wind speeds and a review of low-level jet dynamics. Renew. Sustain. Energy Rev. 2023, 188, 113836. [Google Scholar] [CrossRef] [Scilit]
- El Kinani, K.; Meunier, S.; Vido, L.; Le Ballois, S. Interdisciplinary analysis of wind energy-A focus on France. Sustain. Energy Technol. Assess. 2023, 55, 102944. [Google Scholar] [CrossRef] [Scilit]
- Pelser, T.; Weinand, J.M.; Kuckertz, P.; McKenna, R.; Linssen, J.; Stolten, D. Reviewing accuracy & reproducibility of large-scale wind resource assessments. Adv. Appl. Energy 2024, 13, 100158. [Google Scholar] [CrossRef] [Scilit]
- Ma, Y.; Xu, J.; Wu, Y.; Li, M.Z.; Stanley, R.; Law, B.; Skinner, M. Wind dataset assessment and energy estimation for potential future offshore wind farm development areas on the Scotian Shelf. Wind Energy Sci. 2025, 10, 2965–2999. [Google Scholar] [CrossRef] [Scilit]
- Kerschbaum, A.; Trentmann, L.; Hanel, A.; Fendt, S.; Spliethoff, H. Methods for analysing renewable energy potentials in energy system modelling: A review. Renew. Sustain. Energy Rev. 2025, 215, 115559. [Google Scholar] [CrossRef] [Scilit]
- Abderahmane, M.M.; Taha, M.Q.; Khezami, N.; Gleigume, B.; Kader, M.A.; Heiba, B.E. Wind Energy Potential and Economic Feasibility in Mauritania: A Multi-Site Evaluation of Three Wind Turbines. Eng. Technol. Appl. Sci. Res. 2025, 15, 23117–23124. [Google Scholar] [CrossRef] [Scilit]
- Martinez, A.; Iglesias, G. Techno-economic assessment of potential zones for offshore wind energy: A methodology. Sci. Total Environ. 2024, 909, 168585. [Google Scholar] [CrossRef] [Scilit]
- Musial, W.; Spitsen, P.; Duffy, P.; Beiter, P.; Shields, M.; Hernando, D.M.; Hammond, R.; Marquis, M.; King, J. Offshore Wind Market Report: 2023 Edition; NREL/TP—5000-87232; U.S. Department of Energy (DOE): Washington, DC, USA, 2023. [CrossRef] [Scilit]
- A Simulation Model for Providing Analysis of Wind Farms Frequency and Voltage Regulation Services in an Electrical Power System. Available online: https://www.mdpi.com/1996-1073/14/8/2250 (accessed on 18 July 2025).
- Gualtieri, G. Analysing the uncertainties of reanalysis data used for wind resource assessment: A critical review. Renew. Sustain. Energy Rev. 2022, 167, 112741. [Google Scholar] [CrossRef] [Scilit]
- Ahmad, S.; Abdullah, M.; Kanwal, A.; Tahir, Z.U.R.; Bin Saeed, U.; Manzoor, F.; Atif, M.; Abbas, S. Offshore wind resource assessment using reanalysis data. Wind Eng. 2022, 46, 1173–1186. [Google Scholar] [CrossRef] [Scilit]
- Tahir, Z.U.R.; Abdullah, M.; Ahmad, S.; Kanwal, A.; Farhan, M.; Bin Saeed, U.; Ali, T.; Amin, I. An approach to assess offshore wind power potential using bathymetry and near-hub-height reanalysis data. Ocean Eng. 2023, 280, 114458. [Google Scholar] [CrossRef] [Scilit]
- Koondhar, M.A.; Albasha, L.; Mahmoud, S.A.; Amin, L.G.; Mahariq, I. Comparative analysis of onshore, offshore, and floating wind turbines for renewable energy systems: A review. Ocean Eng. 2026, 343, 123243. [Google Scholar] [CrossRef] [Scilit]
- Jia, S.; Gao, Z.-W. Benchmark model and dynamic analysis for floating offshore wind turbines. Control Eng. Pract. 2026, 174, 107062. [Google Scholar] [CrossRef] [Scilit]
- ERA5 Hourly Data on Single Levels from 1940 to Present. Available online: https://cds.climate.copernicus.eu/datasets/reanalysis-era5-single-levels?tab=download (accessed on 17 July 2025).
- Bilal, B.; Adjallah, K.H.; Yetilmezsoy, K.; Bahramian, M.; Kıyan, E. Determination of wind potential characteristics and techno-economic feasibility analysis of wind turbines for Northwest Africa. Energy 2021, 218, 119558. Available online: https://ideas.repec.org//a/eee/energy/v218y2021ics0360544220326657.html (accessed on 16 July 2025). [CrossRef] [Scilit]
- Fırtın, E.; Güler, Ö.; Akdağ, S.A. Investigation of wind shear coefficients and their effect on electrical energy generation. Appl. Energy 2011, 88, 4097–4105. [Google Scholar] [CrossRef] [Scilit]
- ProtectedSeas Navigator. Available online: https://www.arcgis.com/apps/mapviewer/index.html?webmap=922362ebbd8448ecb44335d29997aeb6 (accessed on 1 July 2026).
- Navigator_AllSites_010925_Attributes (FeatureServer). Available online: https://services9.arcgis.com/lm7wE8a9YA9rKfzy/arcgis/rest/services/Navigator_AllSites_010925_attributes/FeatureServer (accessed on 1 July 2026).
- Marine Regions. Available online: https://www.marineregions.org/downloads.php? (accessed on 1 July 2026).
- Gridded Bathymetry Data | GEBCO. Available online: https://www.gebco.net/data-products/gridded-bathymetry-data (accessed on 1 July 2026).
- Natural Earth. 1:10m Cultural Vectors–Free Vector and Raster Map Data at 1:10 m, 1:50 m, and 1:110 m Scales. Available online: https://www.naturalearthdata.com/downloads/10m-cultural-vectors/ (accessed on 1 July 2026).
- Charabi, Y.; Abdul-Wahab, S. Wind turbine performance analysis for energy cost minimization. Renew. Wind Water Sol. 2020, 7, 5. [Google Scholar] [CrossRef] [Scilit]
- Elahi, Z.; Gull, W.; Uddin, Z. Weibull Distribution Parameter Estimation Using Spreadsheets. Spreadsheets Educ. 2023, 1, 1–12. [Google Scholar] [CrossRef]
- Akpinar, S.; Akpinar, E.K. Estimation of wind energy potential using finite mixture distribution models. Energy Convers. Manag. 2009, 50, 877–884. [Google Scholar] [CrossRef] [Scilit]
- Soler-Bientz, R. Preliminary results from a network of stations for wind resource assessment at North of Yucatan Peninsula. Energy 2011, 36, 538–548. [Google Scholar] [CrossRef] [Scilit]
- Ohunakin, O.S.; Adaramola, M.S.; Oyewola, O.M. Wind energy evaluation for electricity generation using WECS in seven selected locations in Nigeria. Appl. Energy 2011, 88, 3197–3206. [Google Scholar] [CrossRef] [Scilit]
- Eskin, N.; Artar, H.; Tolun, S. Wind energy potential of Gökçeada Island in Turkey. Renew. Sustain. Energy Rev. 2008, 12, 839–851. [Google Scholar] [CrossRef] [Scilit]
- Bououbeid, E.; Yahya, A.; Samb, M.; Rehman, S.; Mahmoud, A.; Menezo, C. Modelling approach and predictive assessment of wind energy potential in the Nouakchott region, Mauritania. Model Earth Syst. Environ. 2023, 10, 969–981. [Google Scholar] [CrossRef] [Scilit]
- Li, J.; Yu, B. Onshore and offshore wind energy potential assessment near Lake Erie shoreline: A spatial and temporal analysis. Energy 2018, 147, 1092–1107. [Google Scholar] [CrossRef] [Scilit]
- Rezaei, M.; Naghdi-Khozani, N.; Jafari, N. Wind energy utilization for hydrogen production in an underdeveloped country: An economic investigation. Renew. Energy 2020, 147, 1044–1057. [Google Scholar] [CrossRef] [Scilit]
- MHI Vestas Launches the First 10 MW Wind Turbine in History. Available online: https://www.vestas.com/en/media/mwow-press-releases/2018/mhi-vestas-launches-the-first-10-mw-wind-turbine-in-history (accessed on 17 July 2025).
- Kazemi Amiri, A.M.; Tartt, K.; McDonald, A. Identifying path ahead for tackling future challenges in direct-drive permanent magnet wind turbine generator’s electro-mechanical design and manufacturing. Forsch. Ingenieurwesen 2025, 89, 52. [Google Scholar] [CrossRef] [Scilit]
- IEA Wind Task 26 Cost of Energy Offshore Wind Work Package: International Comparative Analysis. Available online: https://docs.nlr.gov/docs/fy19osti/71558.pdf (accessed on 1 March 2026).
- Stehly, T.; Duffy, P. 2021 Cost of Wind Energy Review; Technical Report; National Laboratory of the Rockies: Golden, CO, USA, 2022. [CrossRef] [Scilit]
- Mamman, R.; Adedipe, O.; Lawal, S.; Olugboji, O.; Nwachukwu, V. Analysis of offshore wind energy potential for power generation in three selected locations in Nigeria. Afr. J. Sci. Technol. Innov. Dev. 2021, 14, 774–789. [Google Scholar] [CrossRef] [Scilit]
- MSPglobal: International Guide on Marine/Maritime Spatial Planning|The European Maritime Spatial Planning Platform. Available online: https://maritime-spatial-planning.ec.europa.eu/practices/mspglobal-international-guide-marinemaritime-spatial-planning-0 (accessed on 1 July 2026).
- Marine Spatial Planning|Intergovernmental Oceanographic Commission. Available online: https://www.ioc.unesco.org/en/marine-spatial-planning (accessed on 1 July 2026).
- Offshore wind: Diagnostic Toolkit for Reducing Regulatory Barriers to Solar, Wind and Pumped Hydro Storage in the European Union|OECD. Available online: https://www.oecd.org/en/publications/diagnostic-toolkit-for-reducing-regulatory-barriers-to-solar-wind-and-pumped-hydro-storage-in-the-european-union_15f4aed4-en/full-report/offshore-wind_03b7590c.html (accessed on 1 July 2026).
- GIS offshore Wind Site Prospection-Screening Assessments in DNV. Available online: https://www.dnv.com/article/gis-offshore-wind-site-prospection-screening-assessments-in-dnv-252117/ (accessed on 1 July 2026).
- Förster, A.; Ellis, R.G.; Henrich, R.; Krastel, S.; Kopf, A.J. Geotechnical characterization and strain analyses of sediment in the Mauritania Slide Complex, NW-Africa. Mar. Pet. Geol. 2010, 27, 1175–1189. [Google Scholar] [CrossRef] [Scilit]
- Cerfontaine, B.; White, D.; Kwa, K.; Gourvenec, S.; Knappett, J.; Brown, M. Anchor geotechnics for floating offshore wind: Current technologies and future innovations. Ocean Eng. 2023, 279, 114327. [Google Scholar] [CrossRef] [Scilit]
- de Wit, S.; Siermann, J.F. Geotechnical site characterisation challenges for floating offshore wind–A developer’s perspective. In Proceedings of the 5th International Symposium on Frontiers in Offshore Geotechnics (ISFOG2025), Nantes, France, 9–13 June 2025. [Google Scholar]
- Mauritania-Energy. Available online: https://www.trade.gov/country-commercial-guides/mauritania-energy (accessed on 1 July 2026).
- Climatescope 2022|Mauritania. Available online: https://2022.global-climatescope.org/markets/mr/ (accessed on 1 July 2026).
- Gaertner, E.; Sethuraman, L.; Anderson, B.; Barter, G.; Abbas, N.; Bortolotti, P.; Scott, G.; Feil, R.; Shields, M.; Rinker, J. IEA Wind TCP Task 37: Definition of the IEA 15-Megawatt Offshore Reference Wind Turbine; NREL/TP--5000-75698; National Renewable Energy Laboratory (NREL): Golden, CO, USA, 2020.
- Liu, S.; Chuang, Z.; Qu, Y.; Li, X.; Li, C.; He, Z. Dynamic Performance Evaluation of an Integrated 15 MW Floating Offshore Wind Turbine Under Typhoon and ECD Conditions. Front. Energy Res. 2022, 10, 874438. [Google Scholar] [CrossRef] [Scilit]
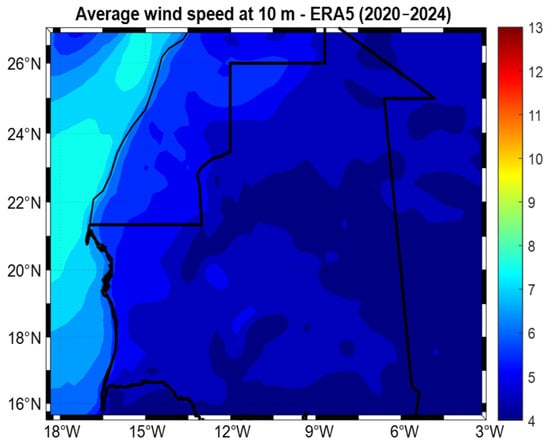
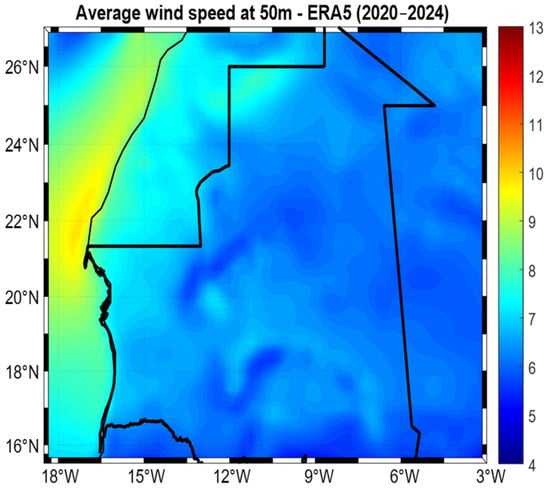
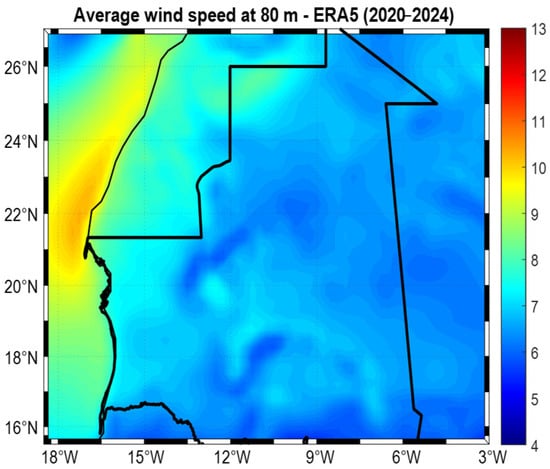
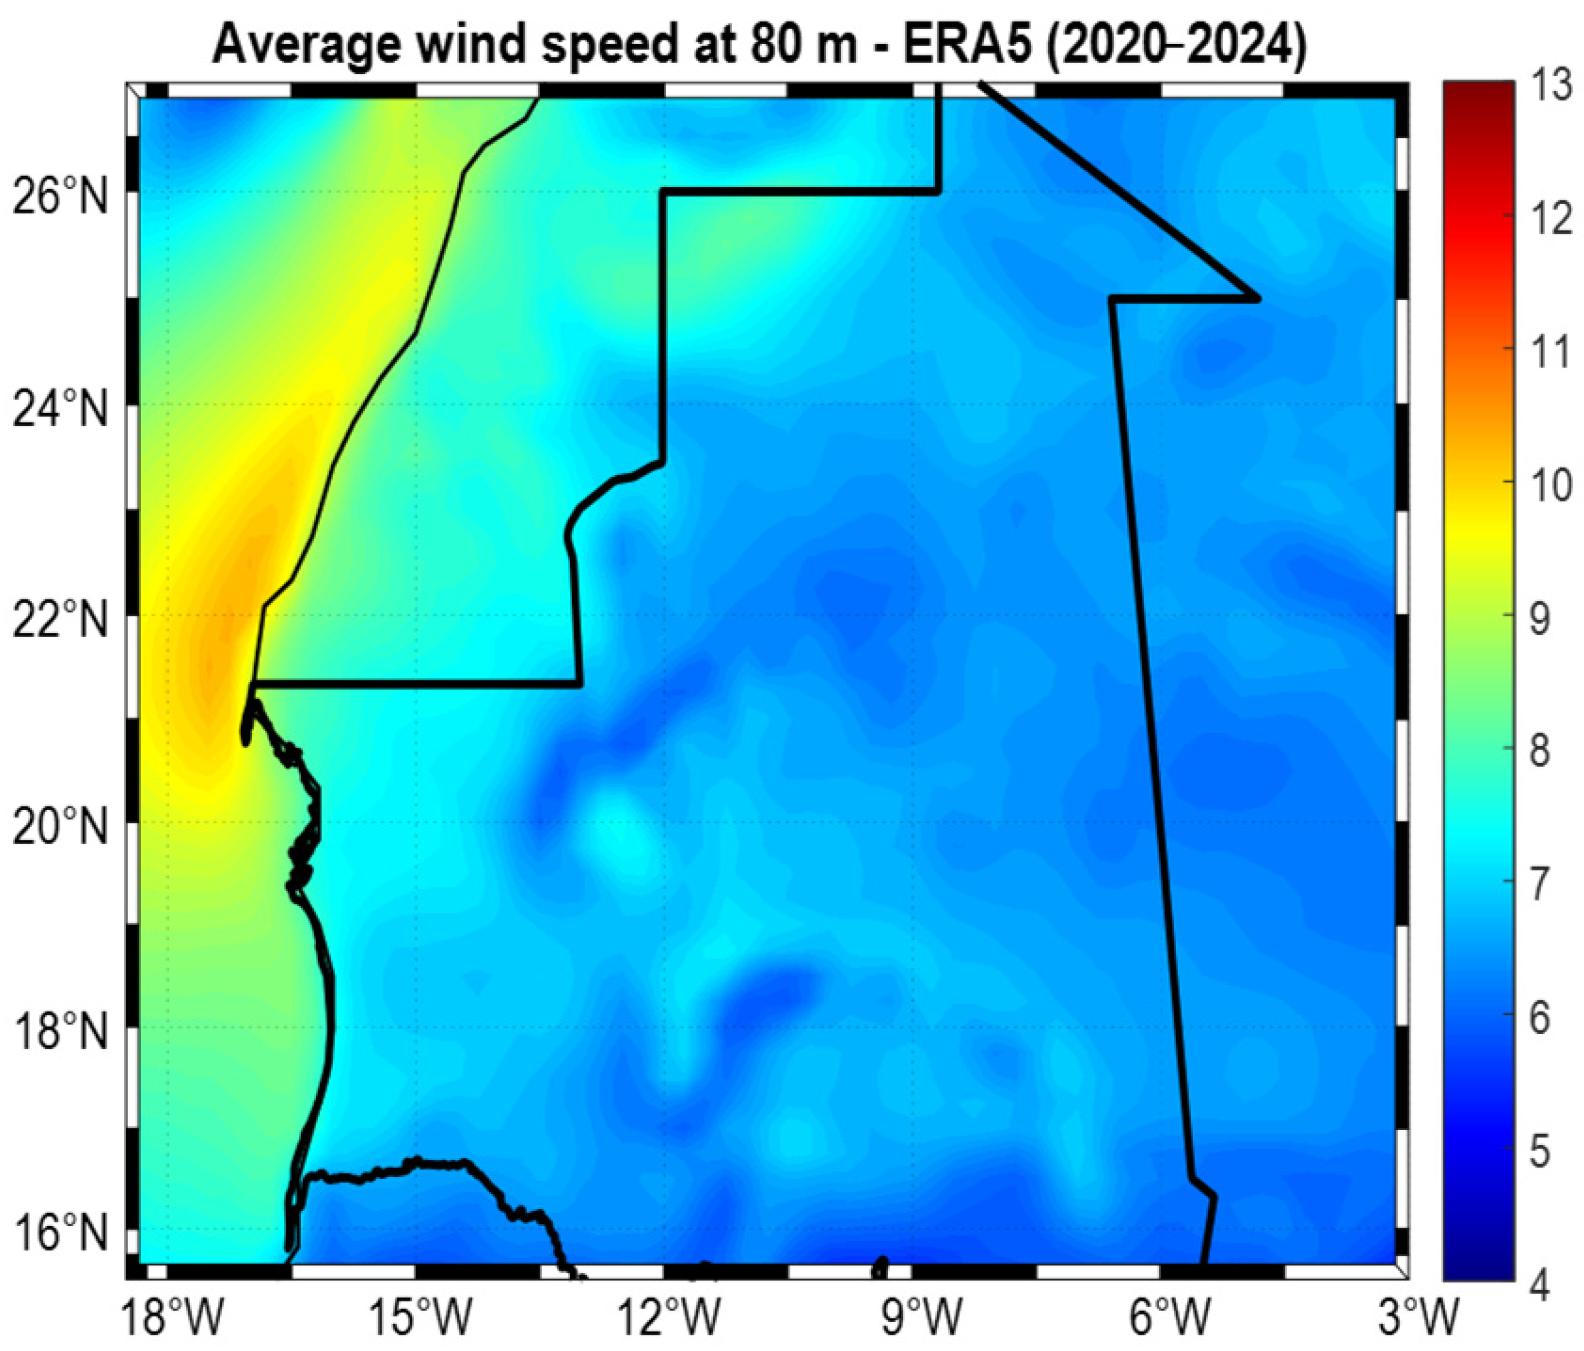
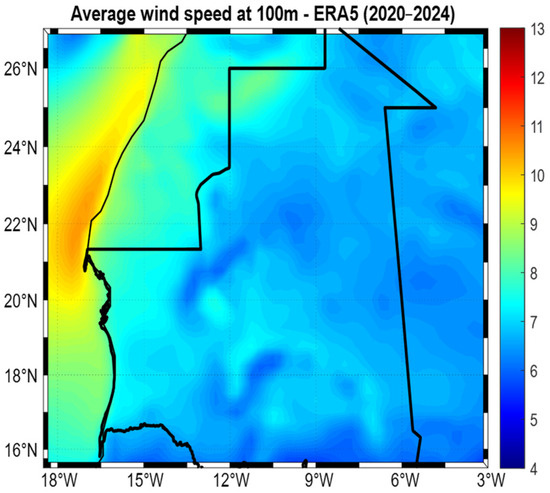
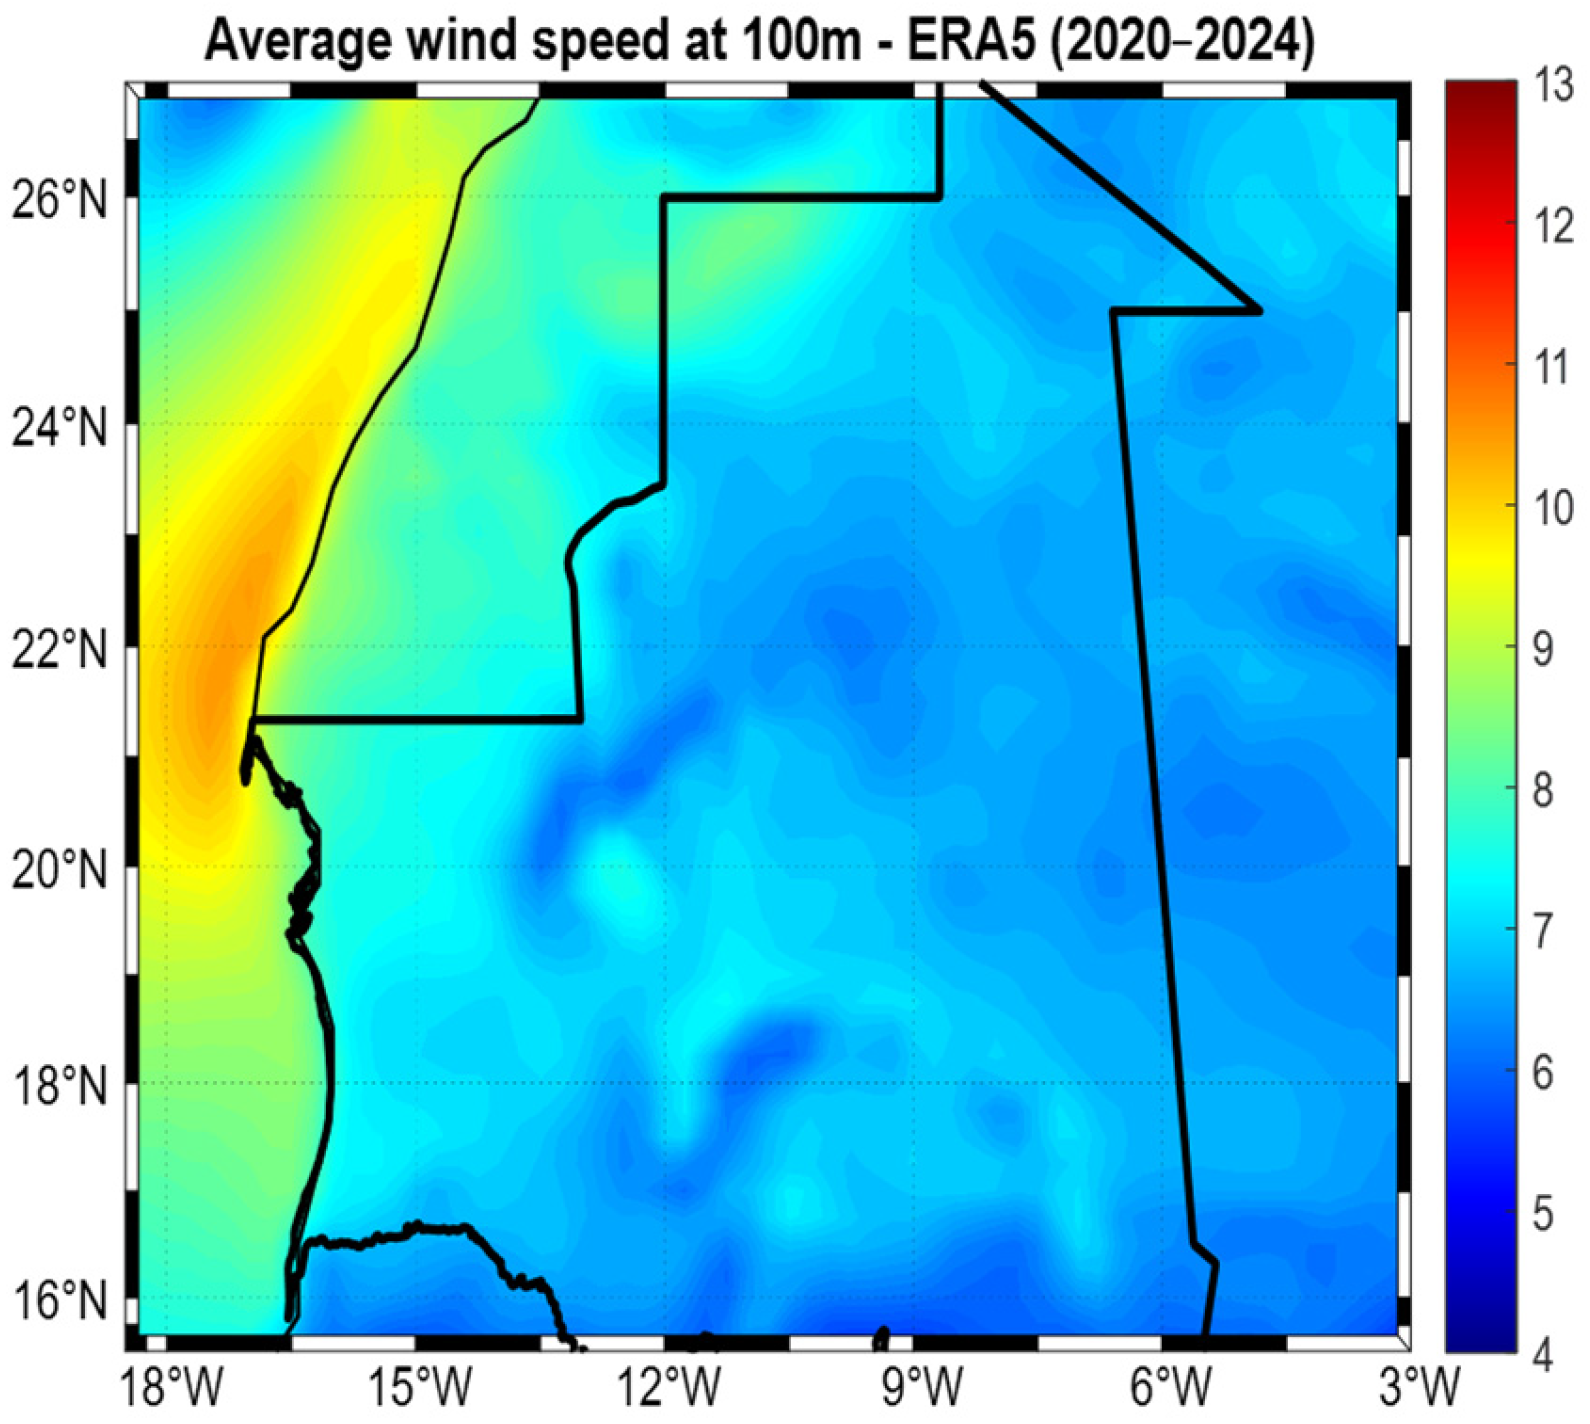
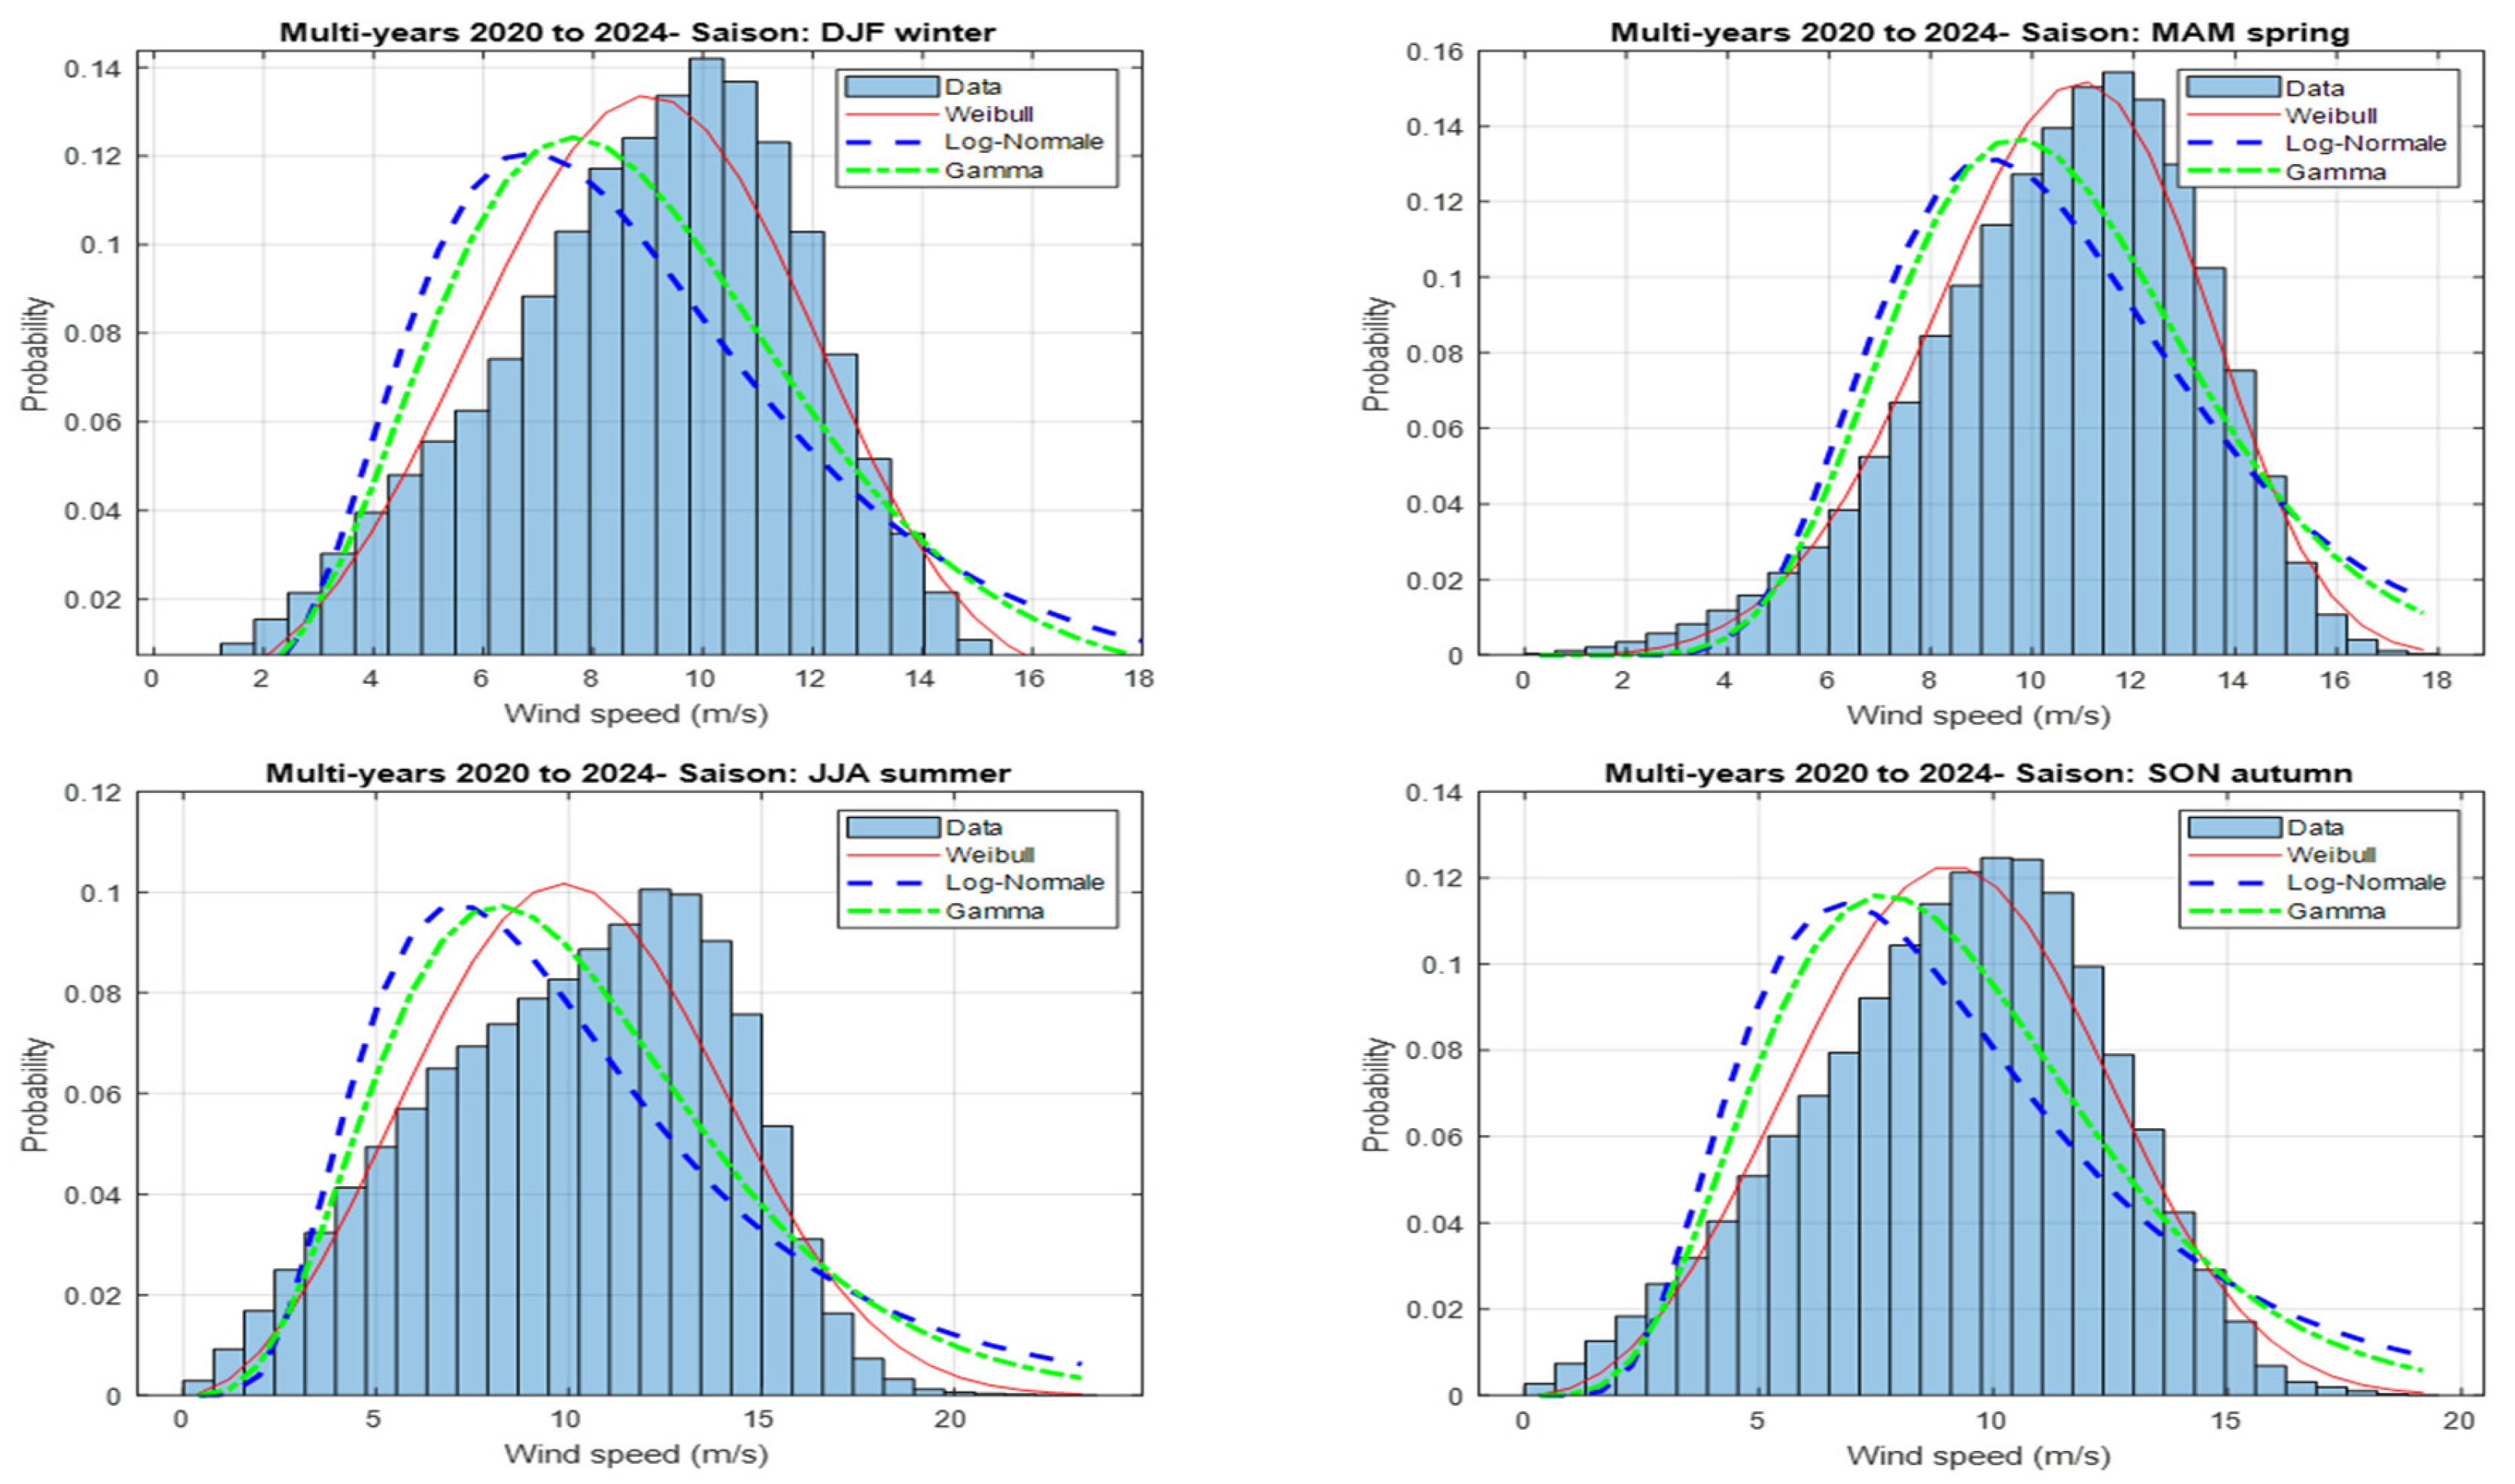
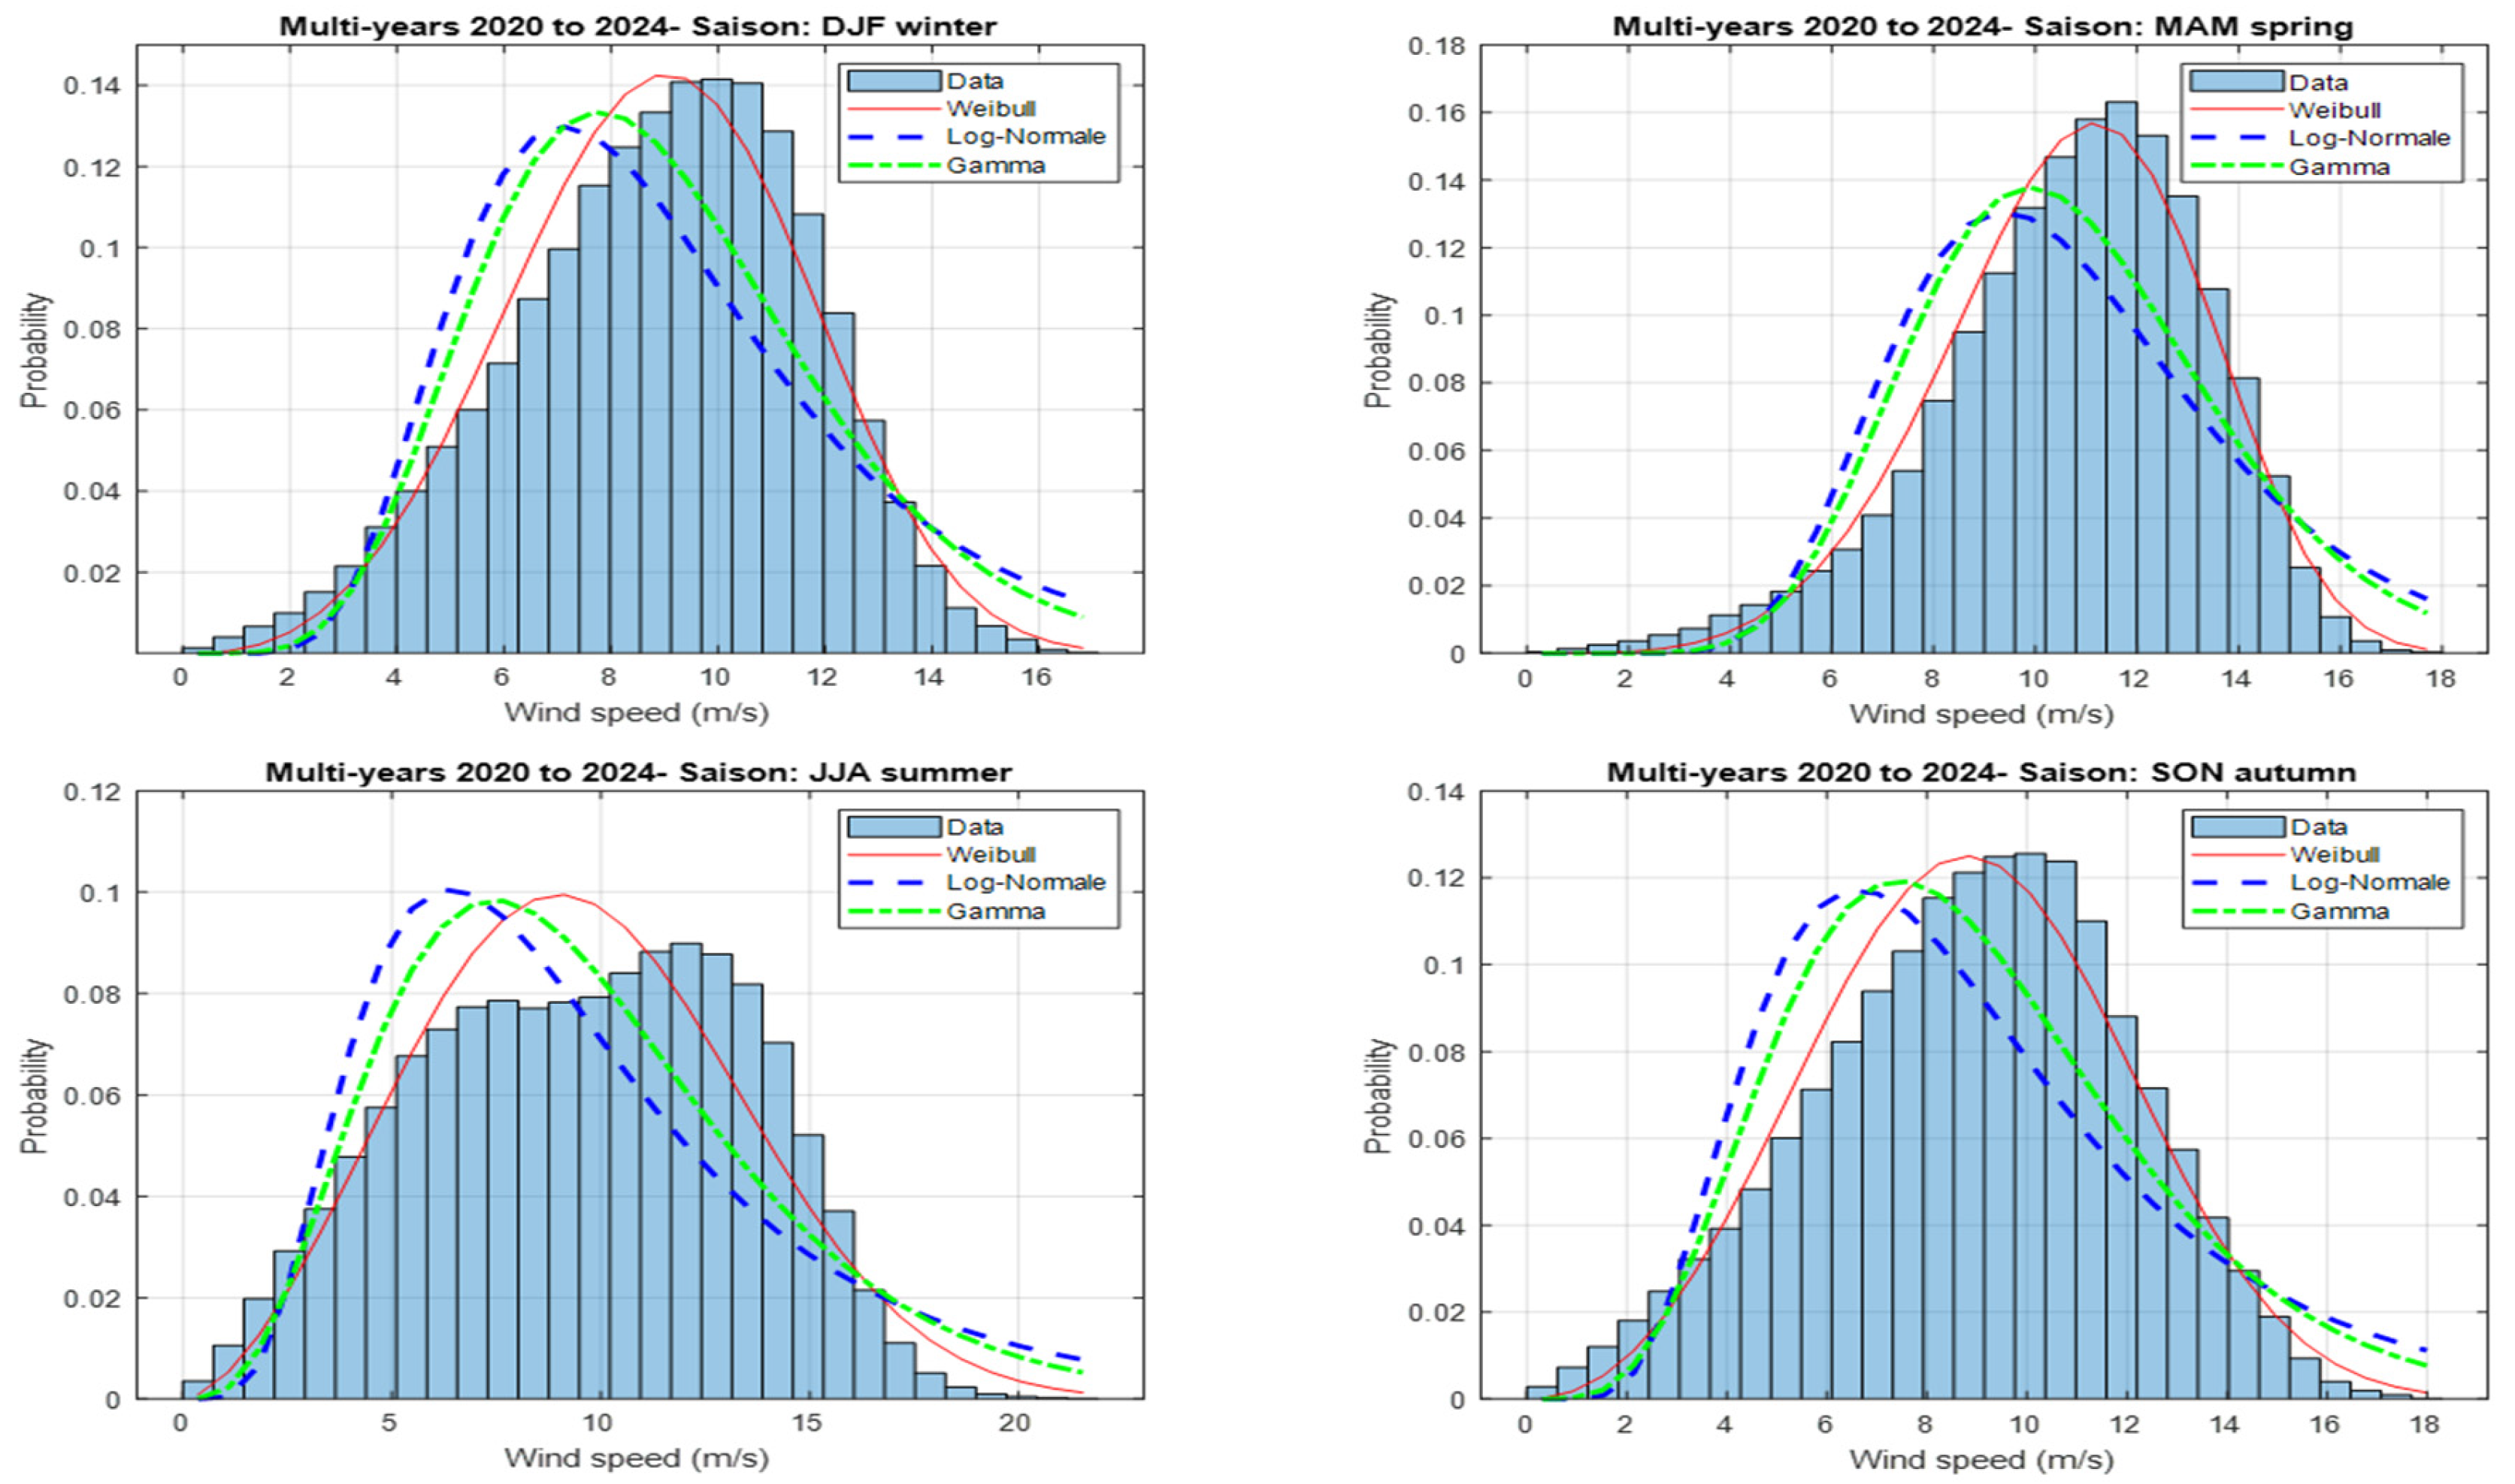
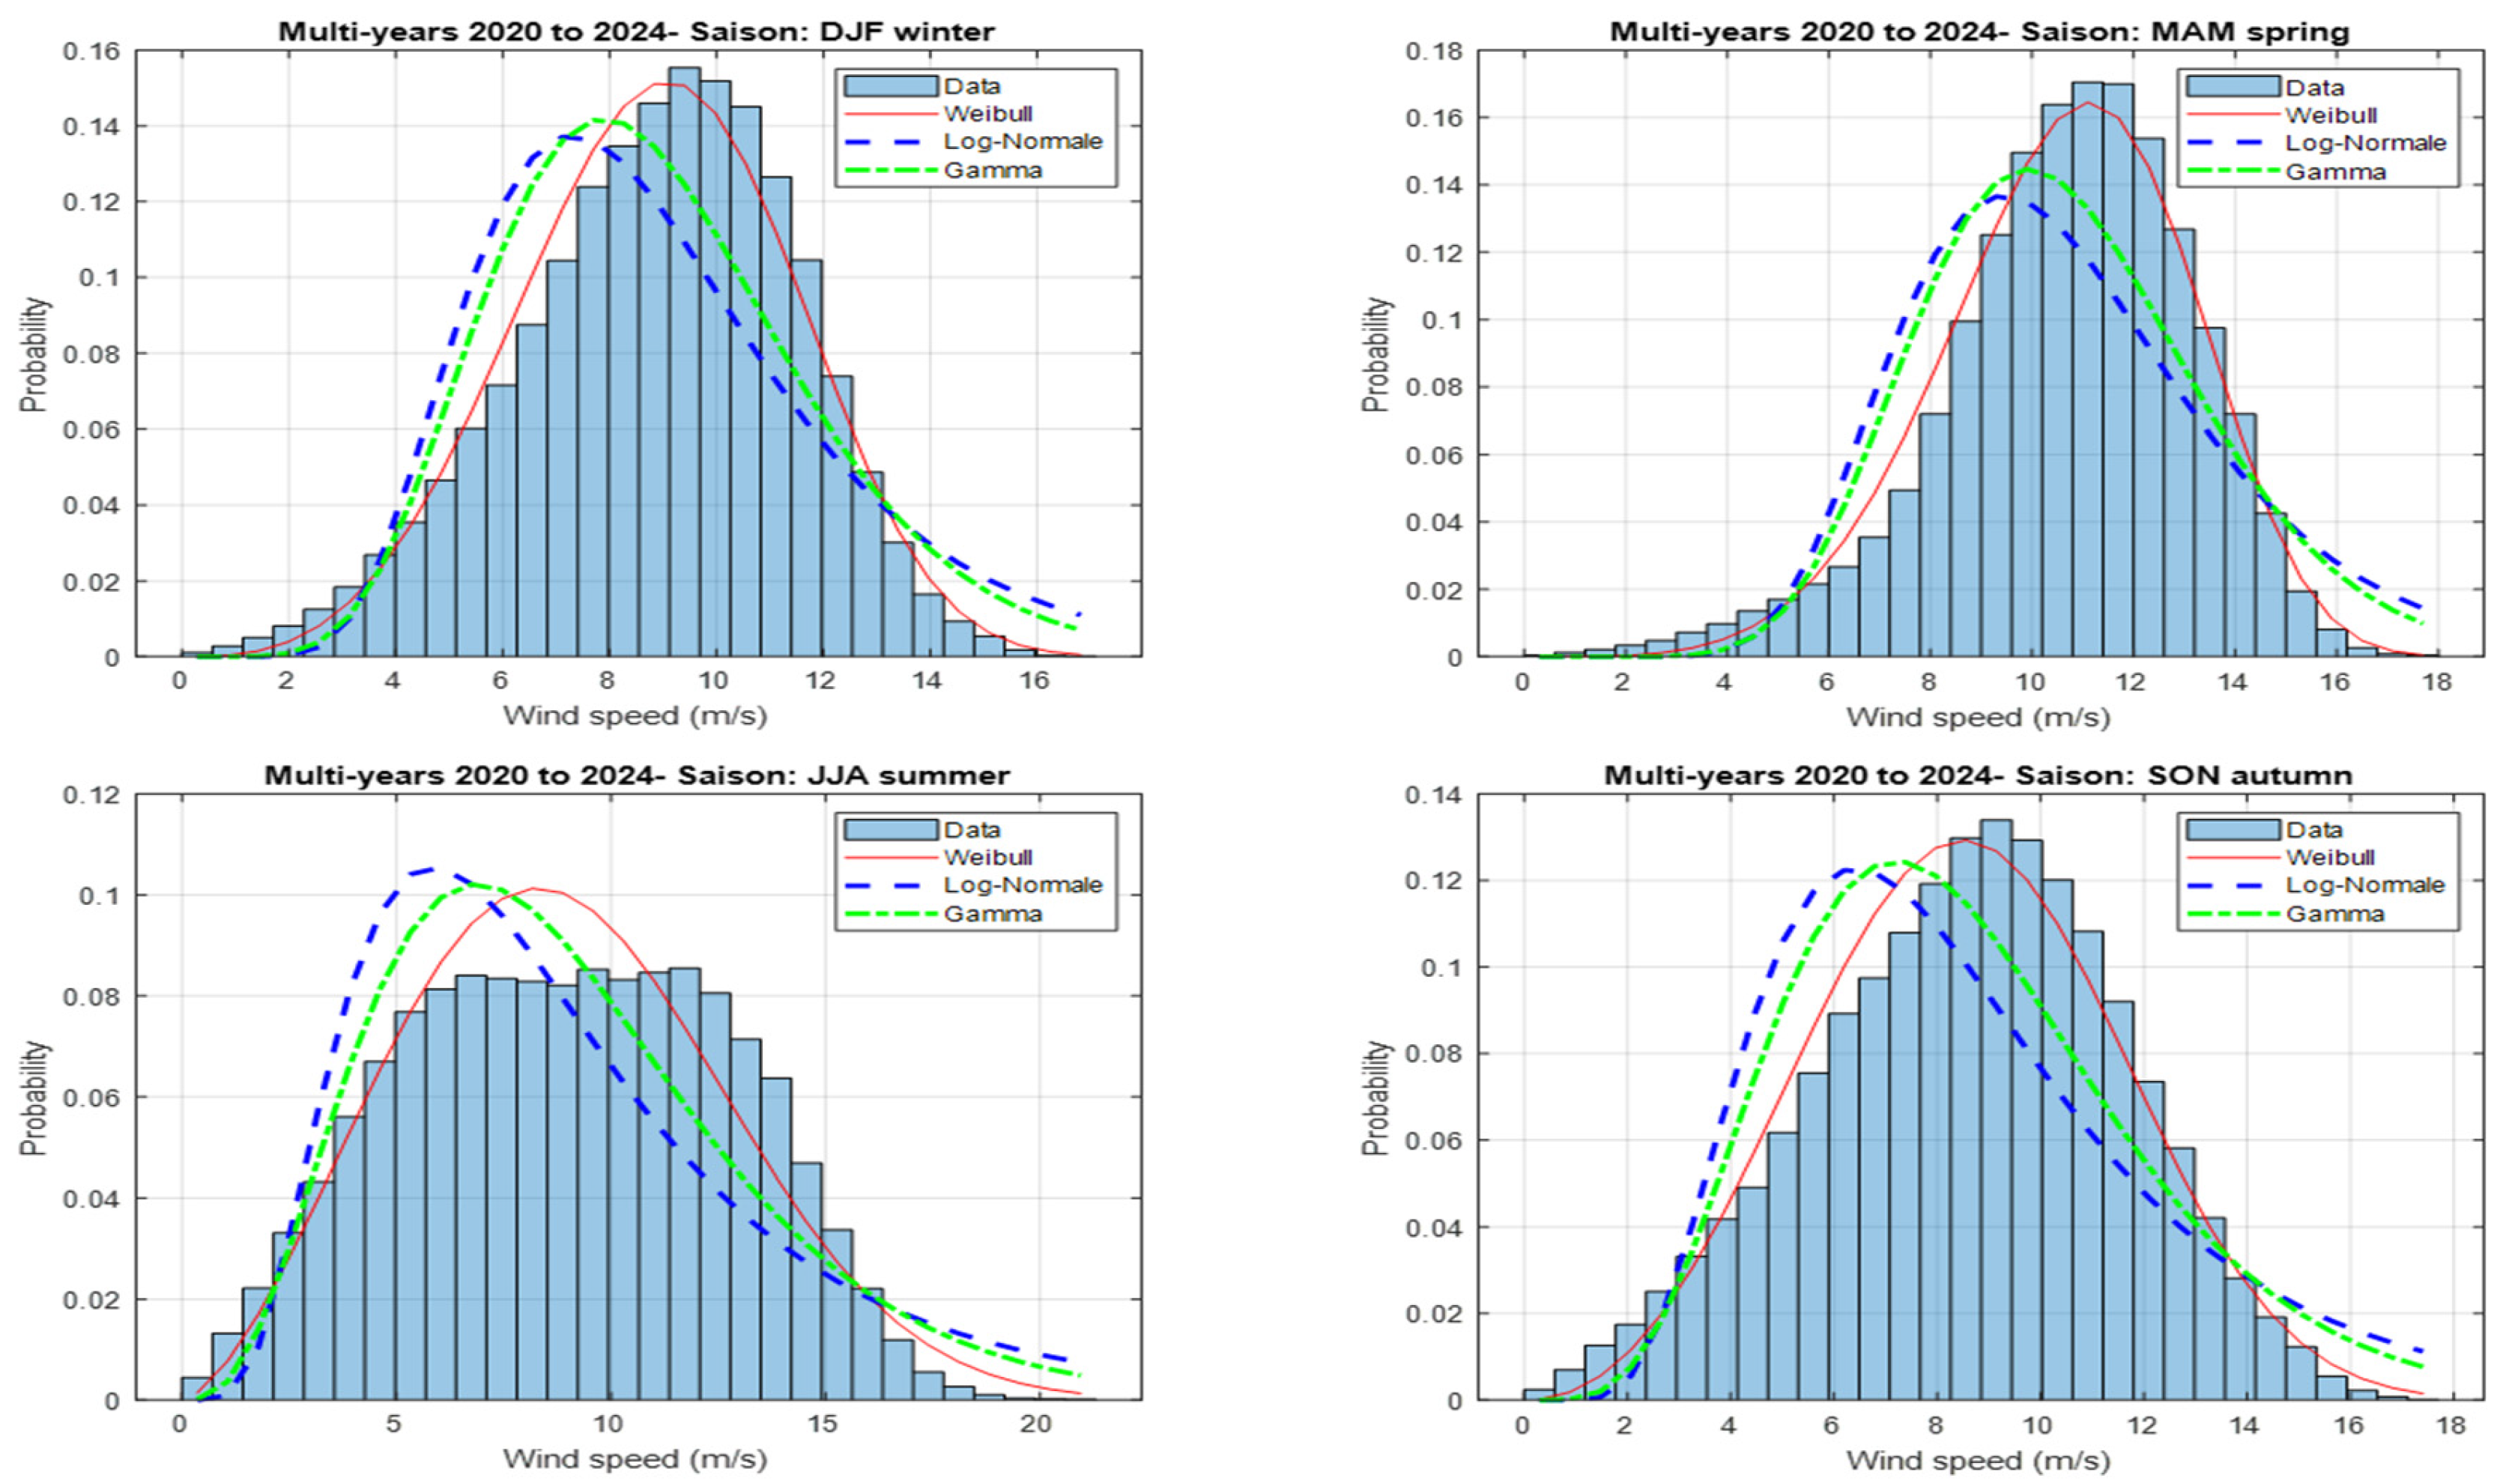
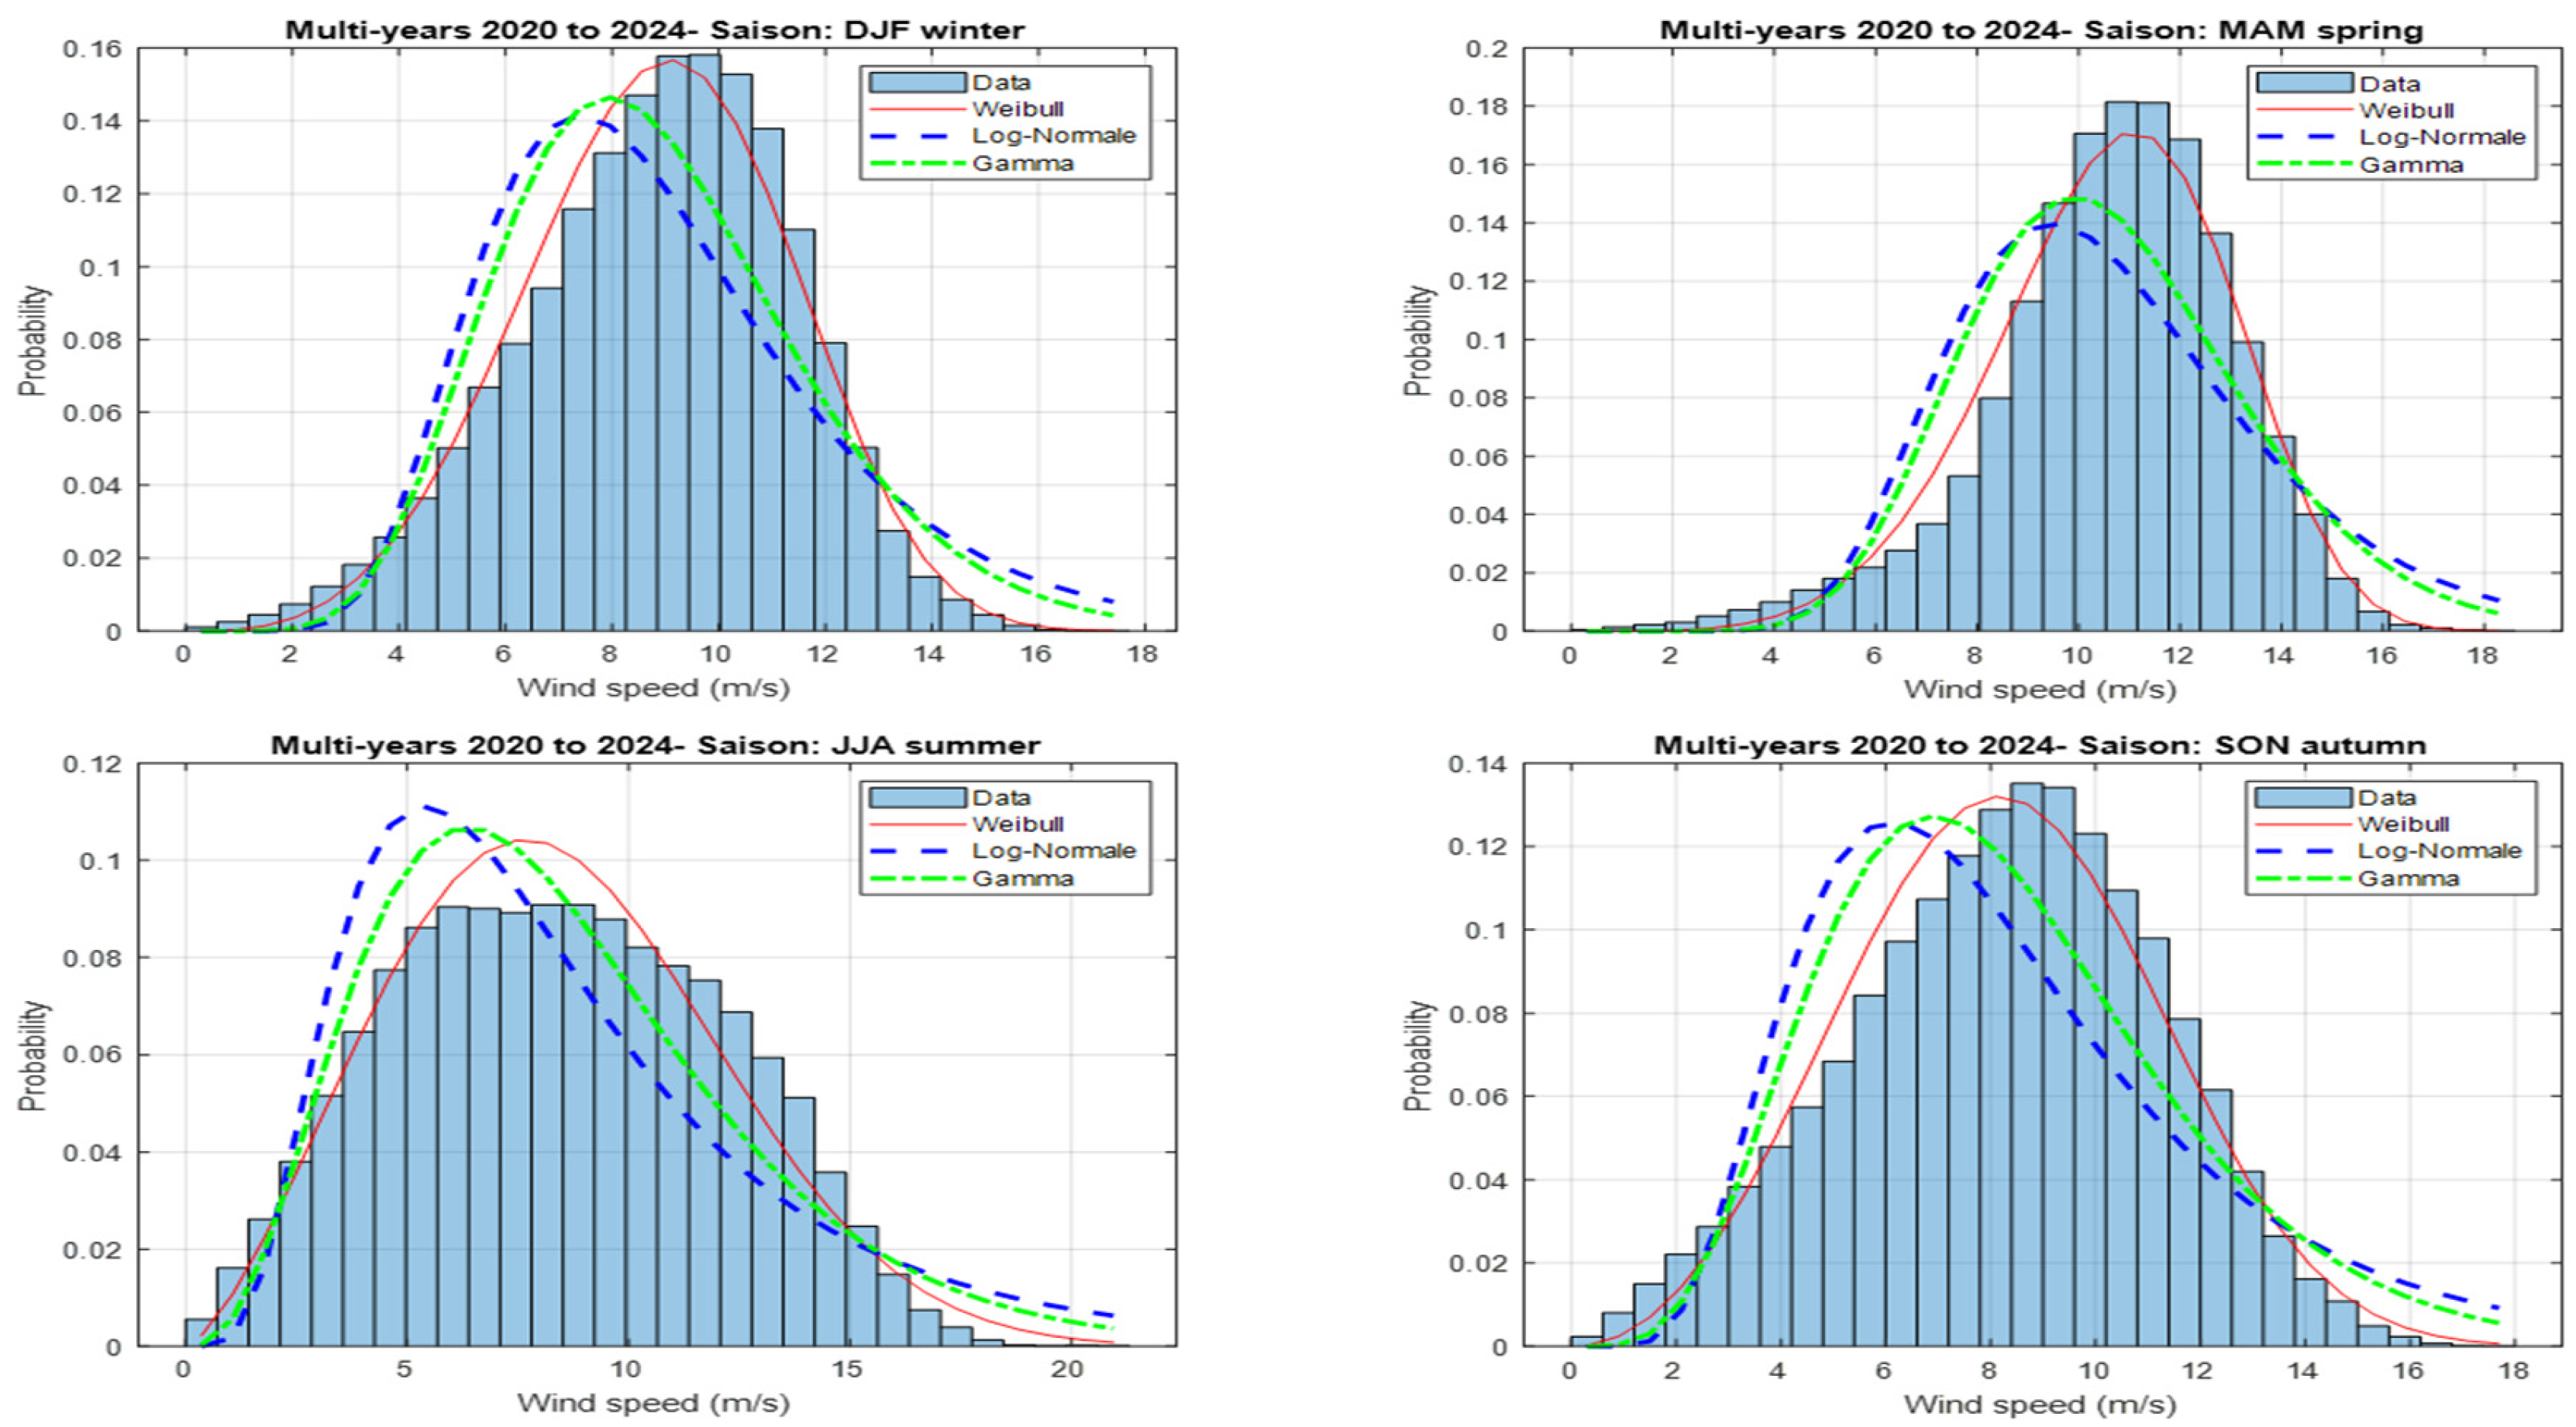
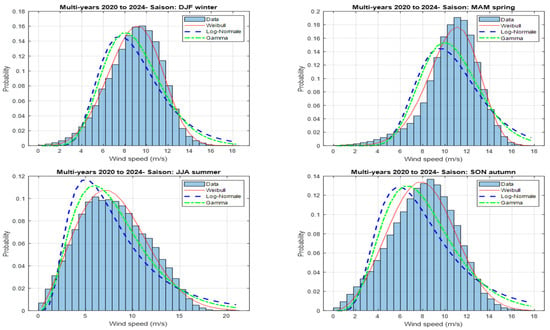
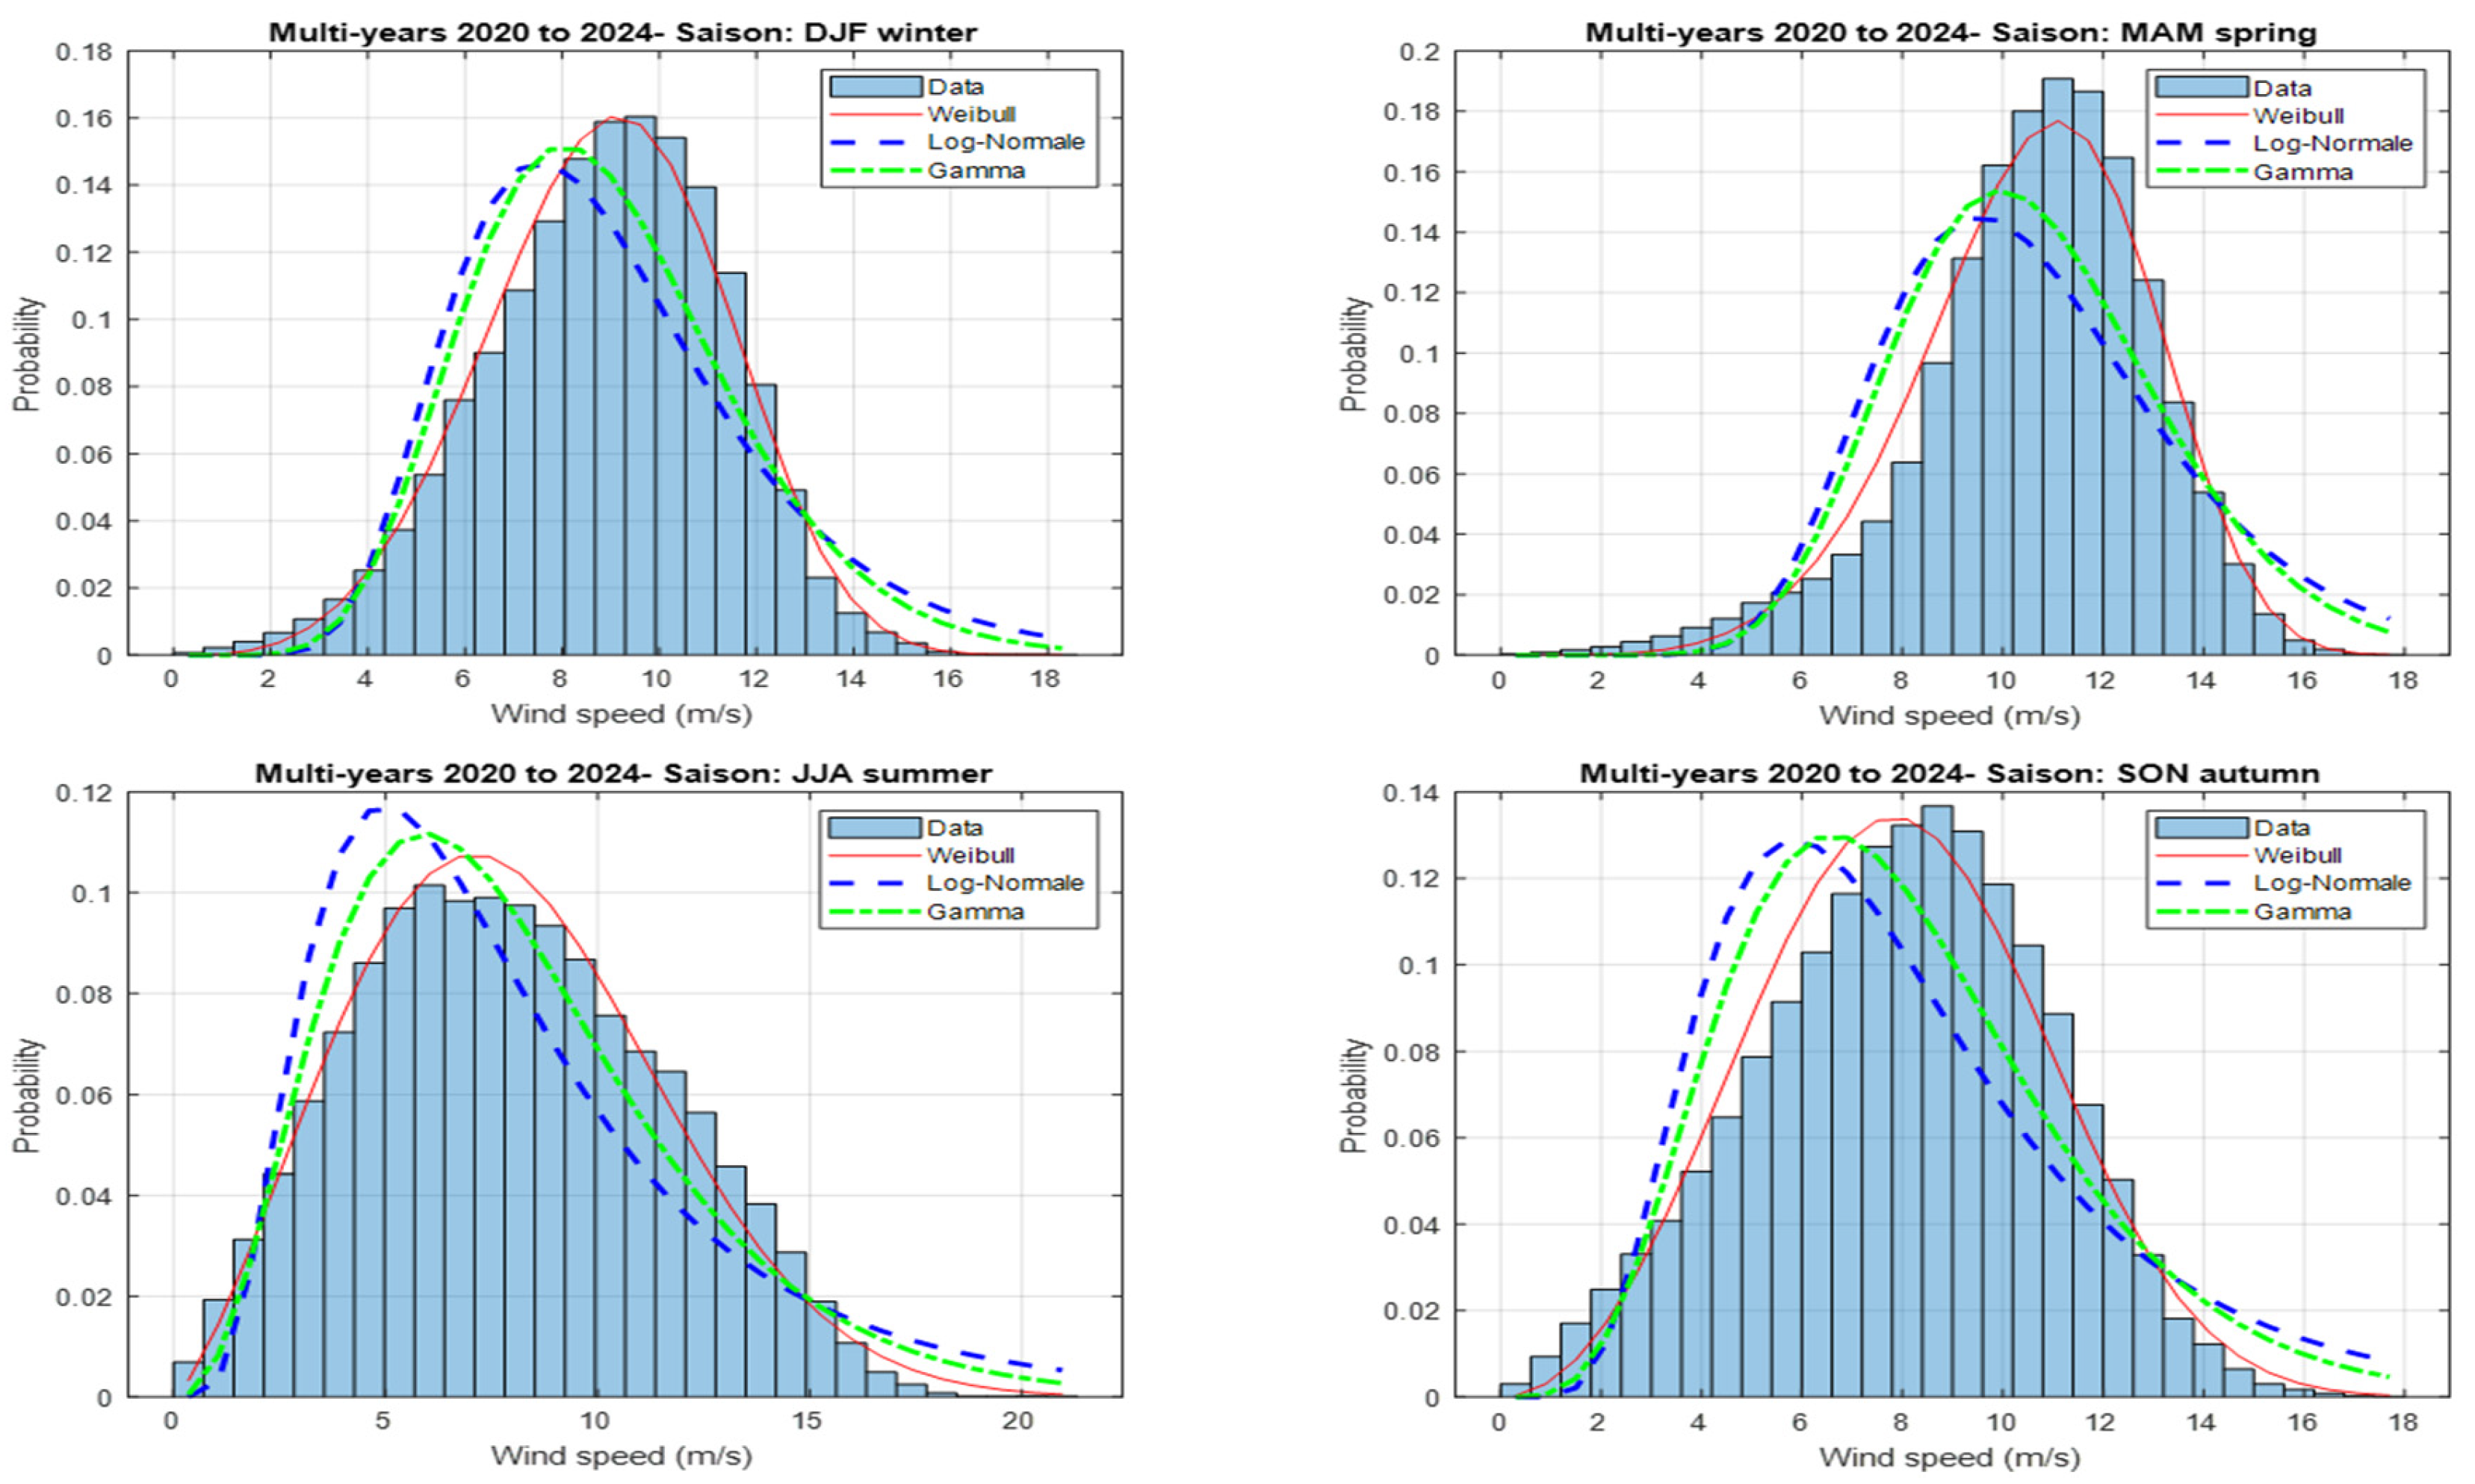
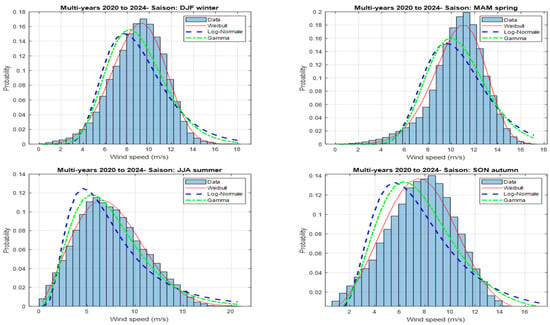
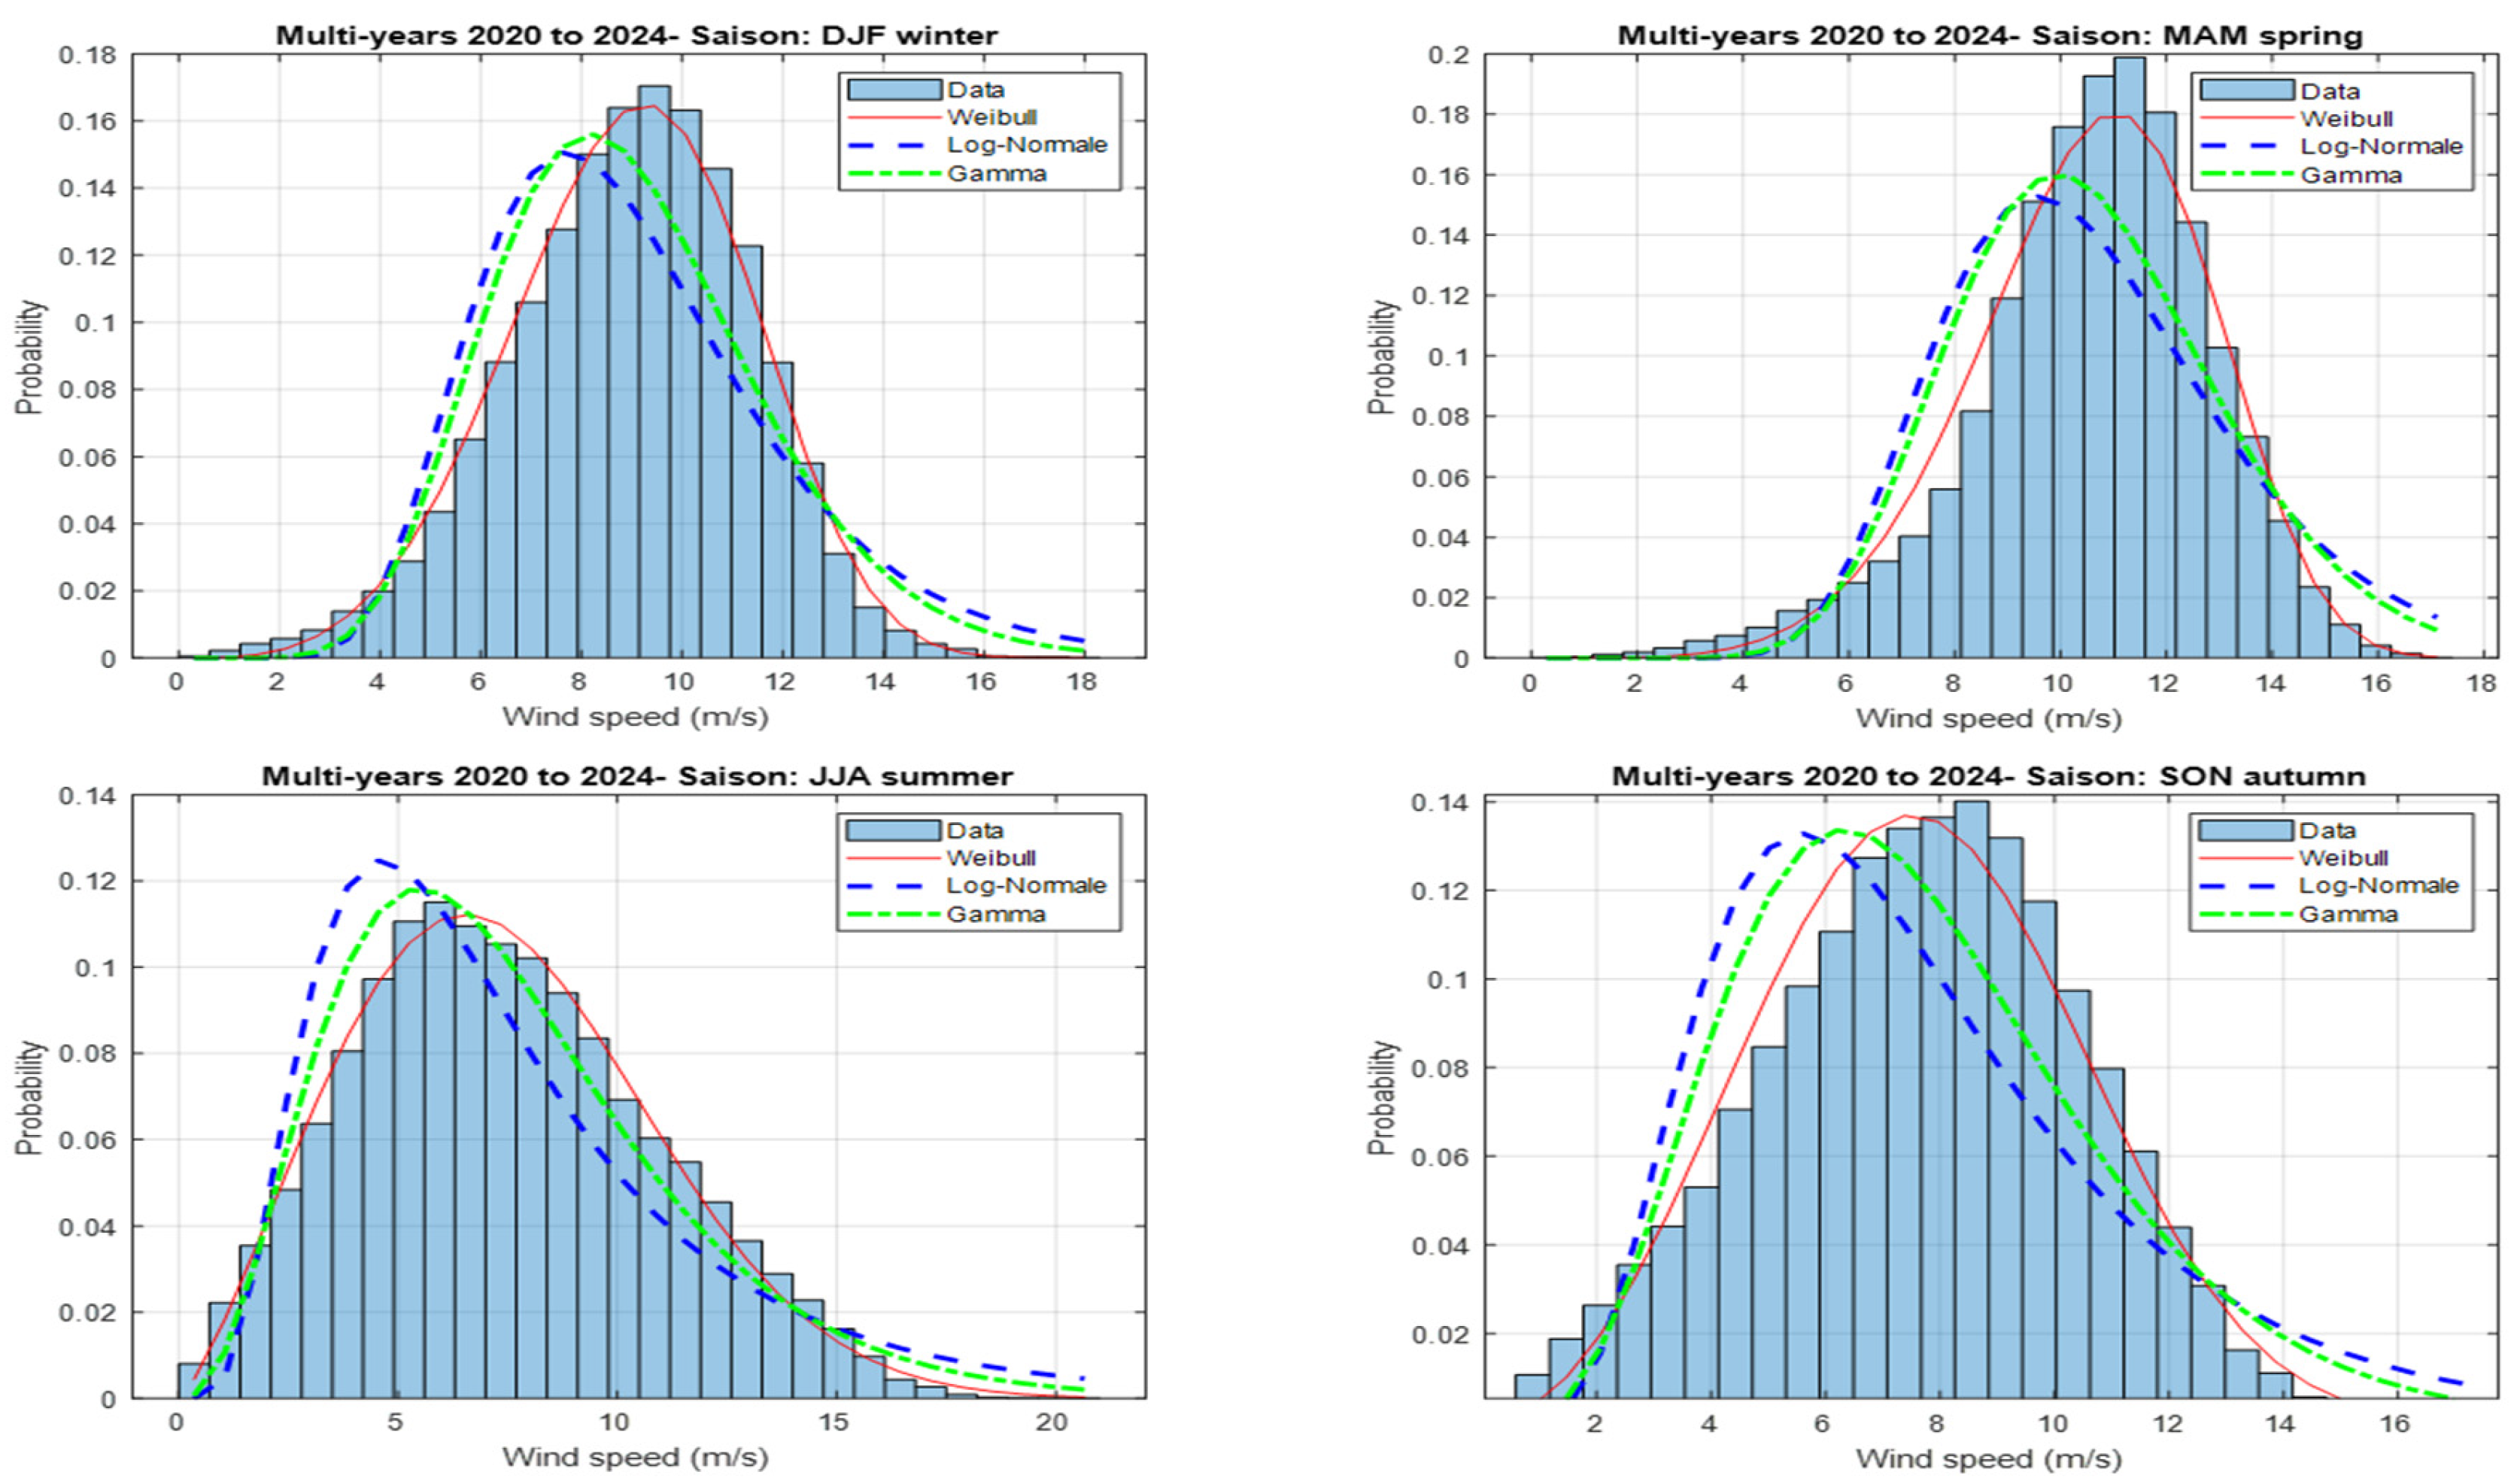
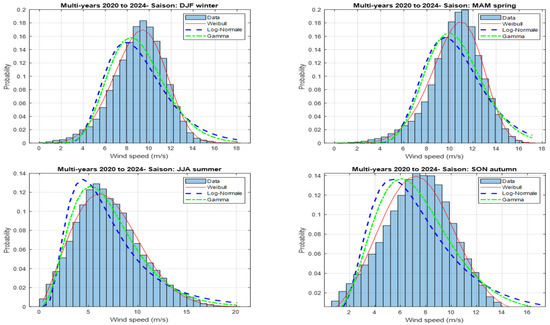
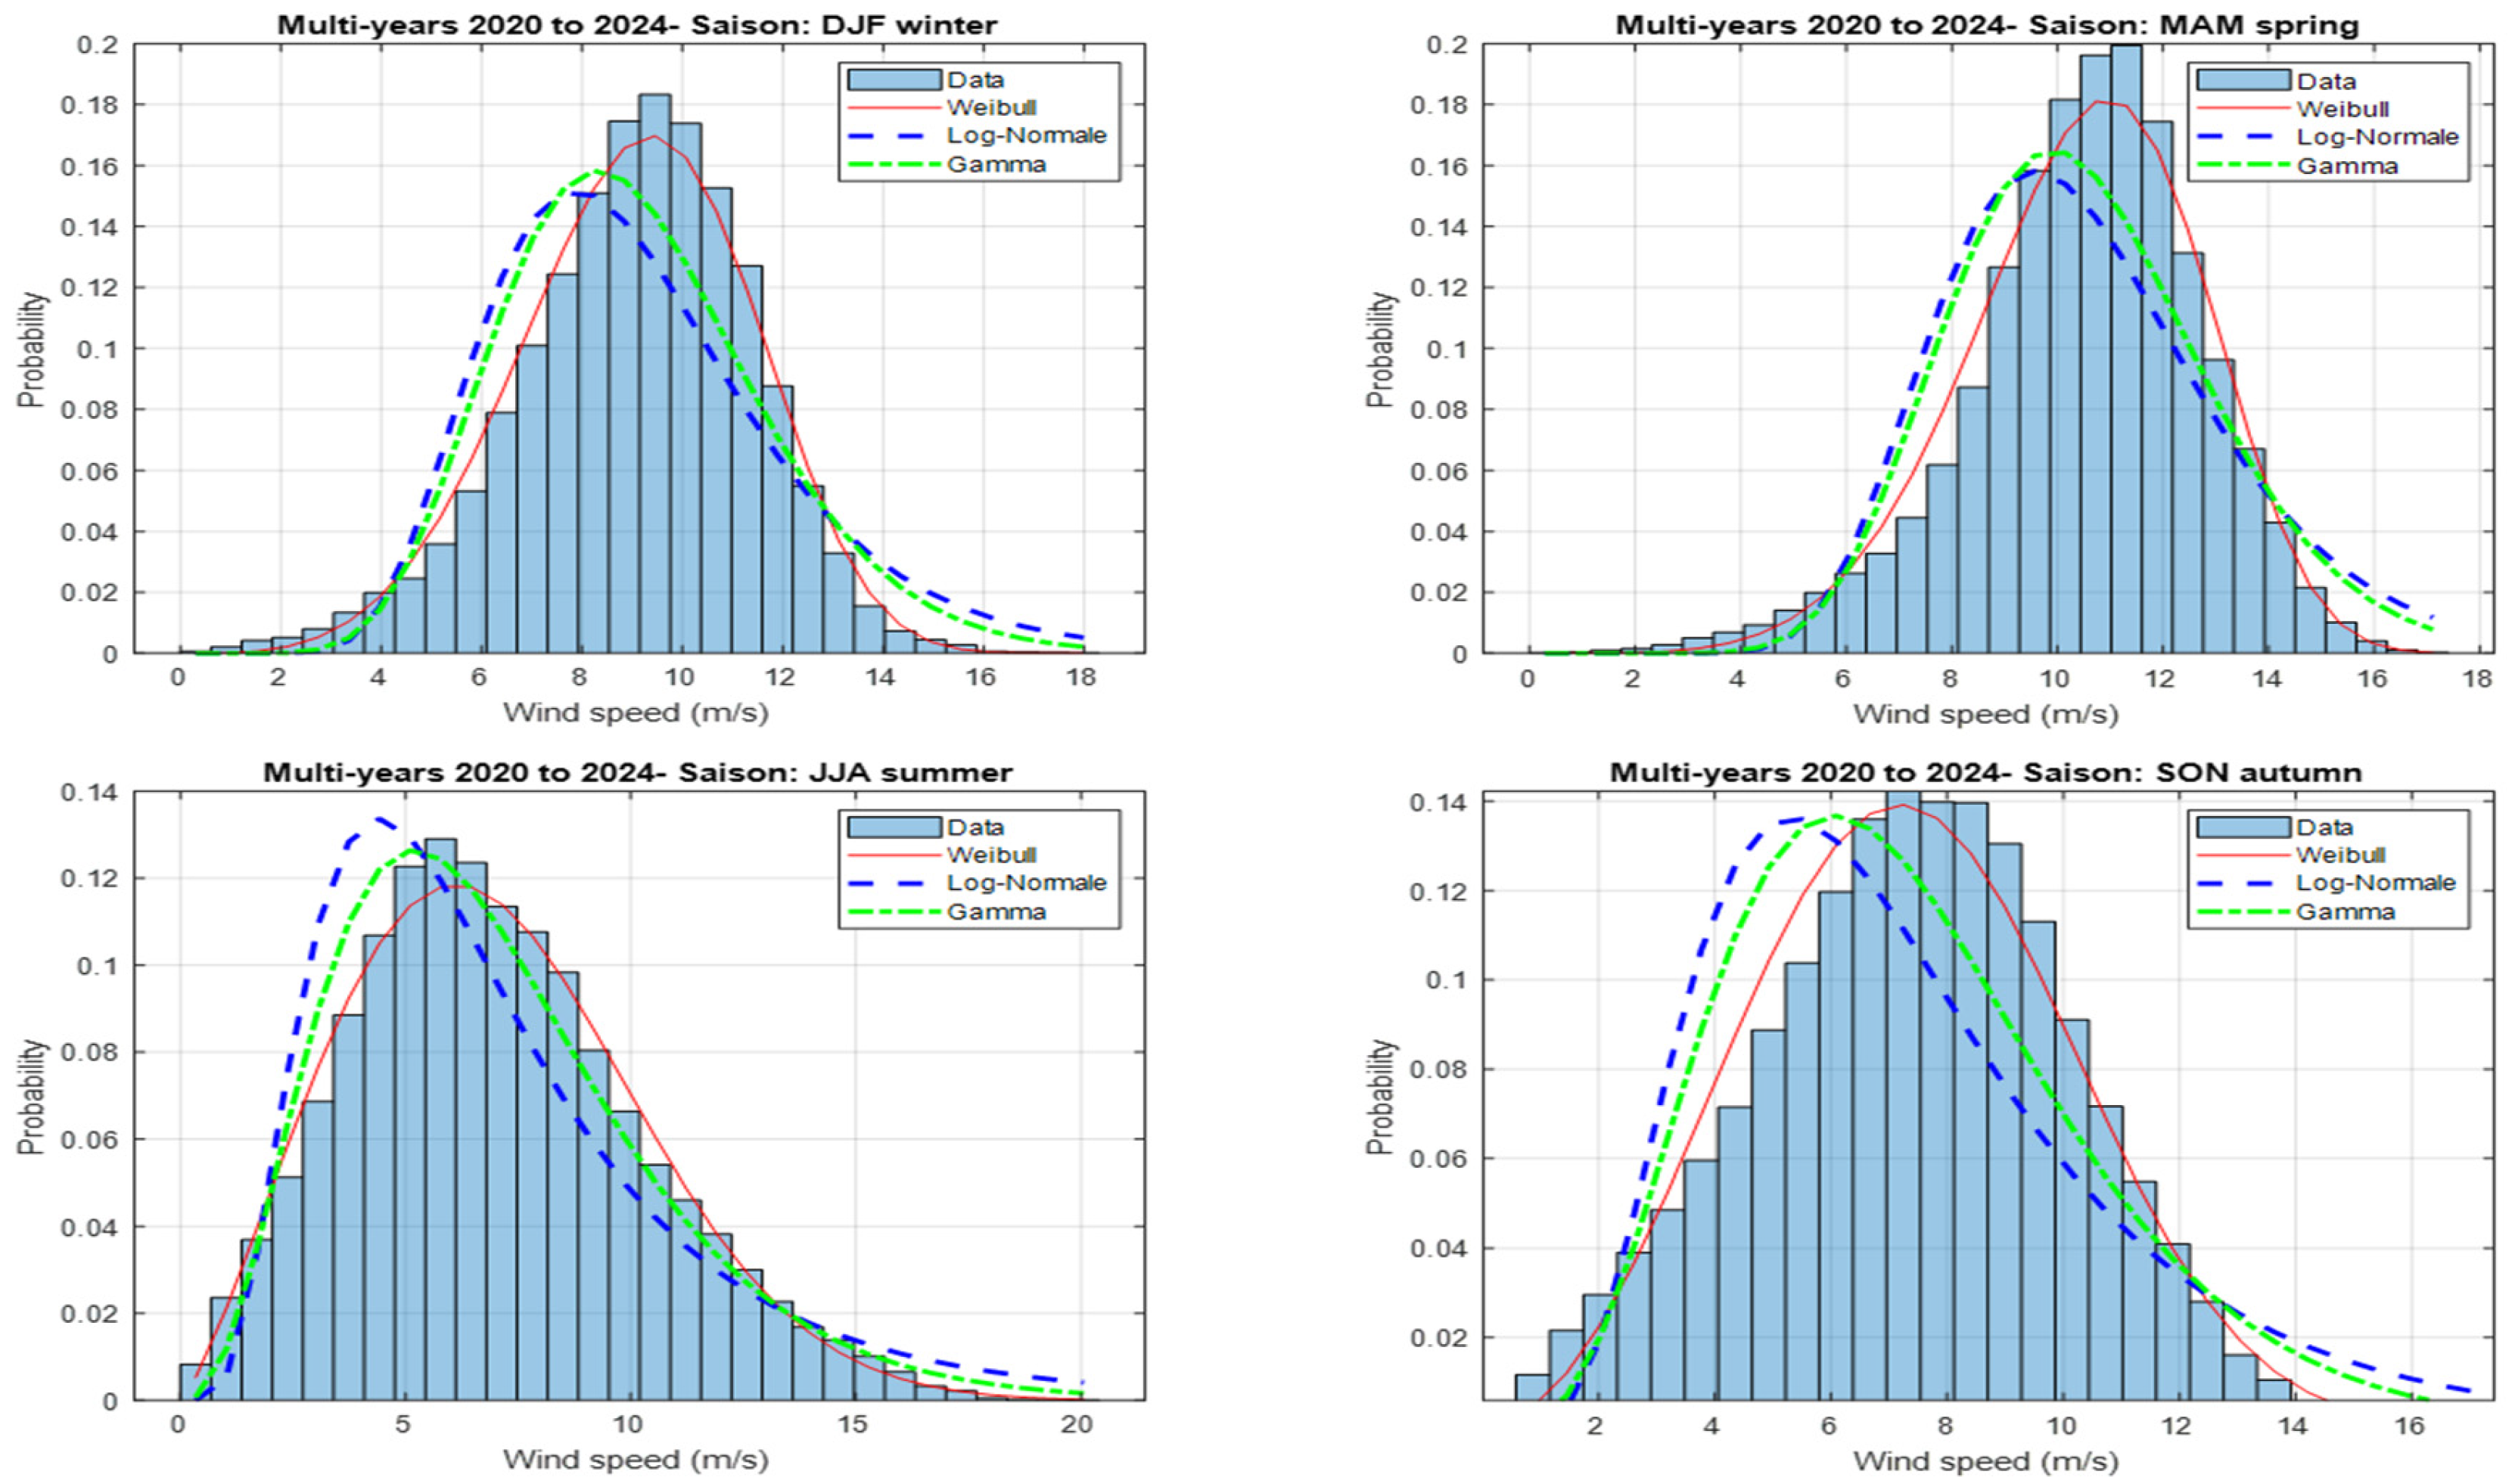
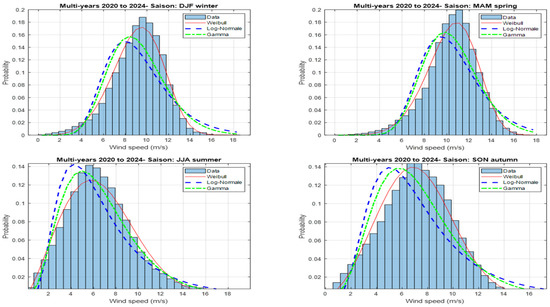
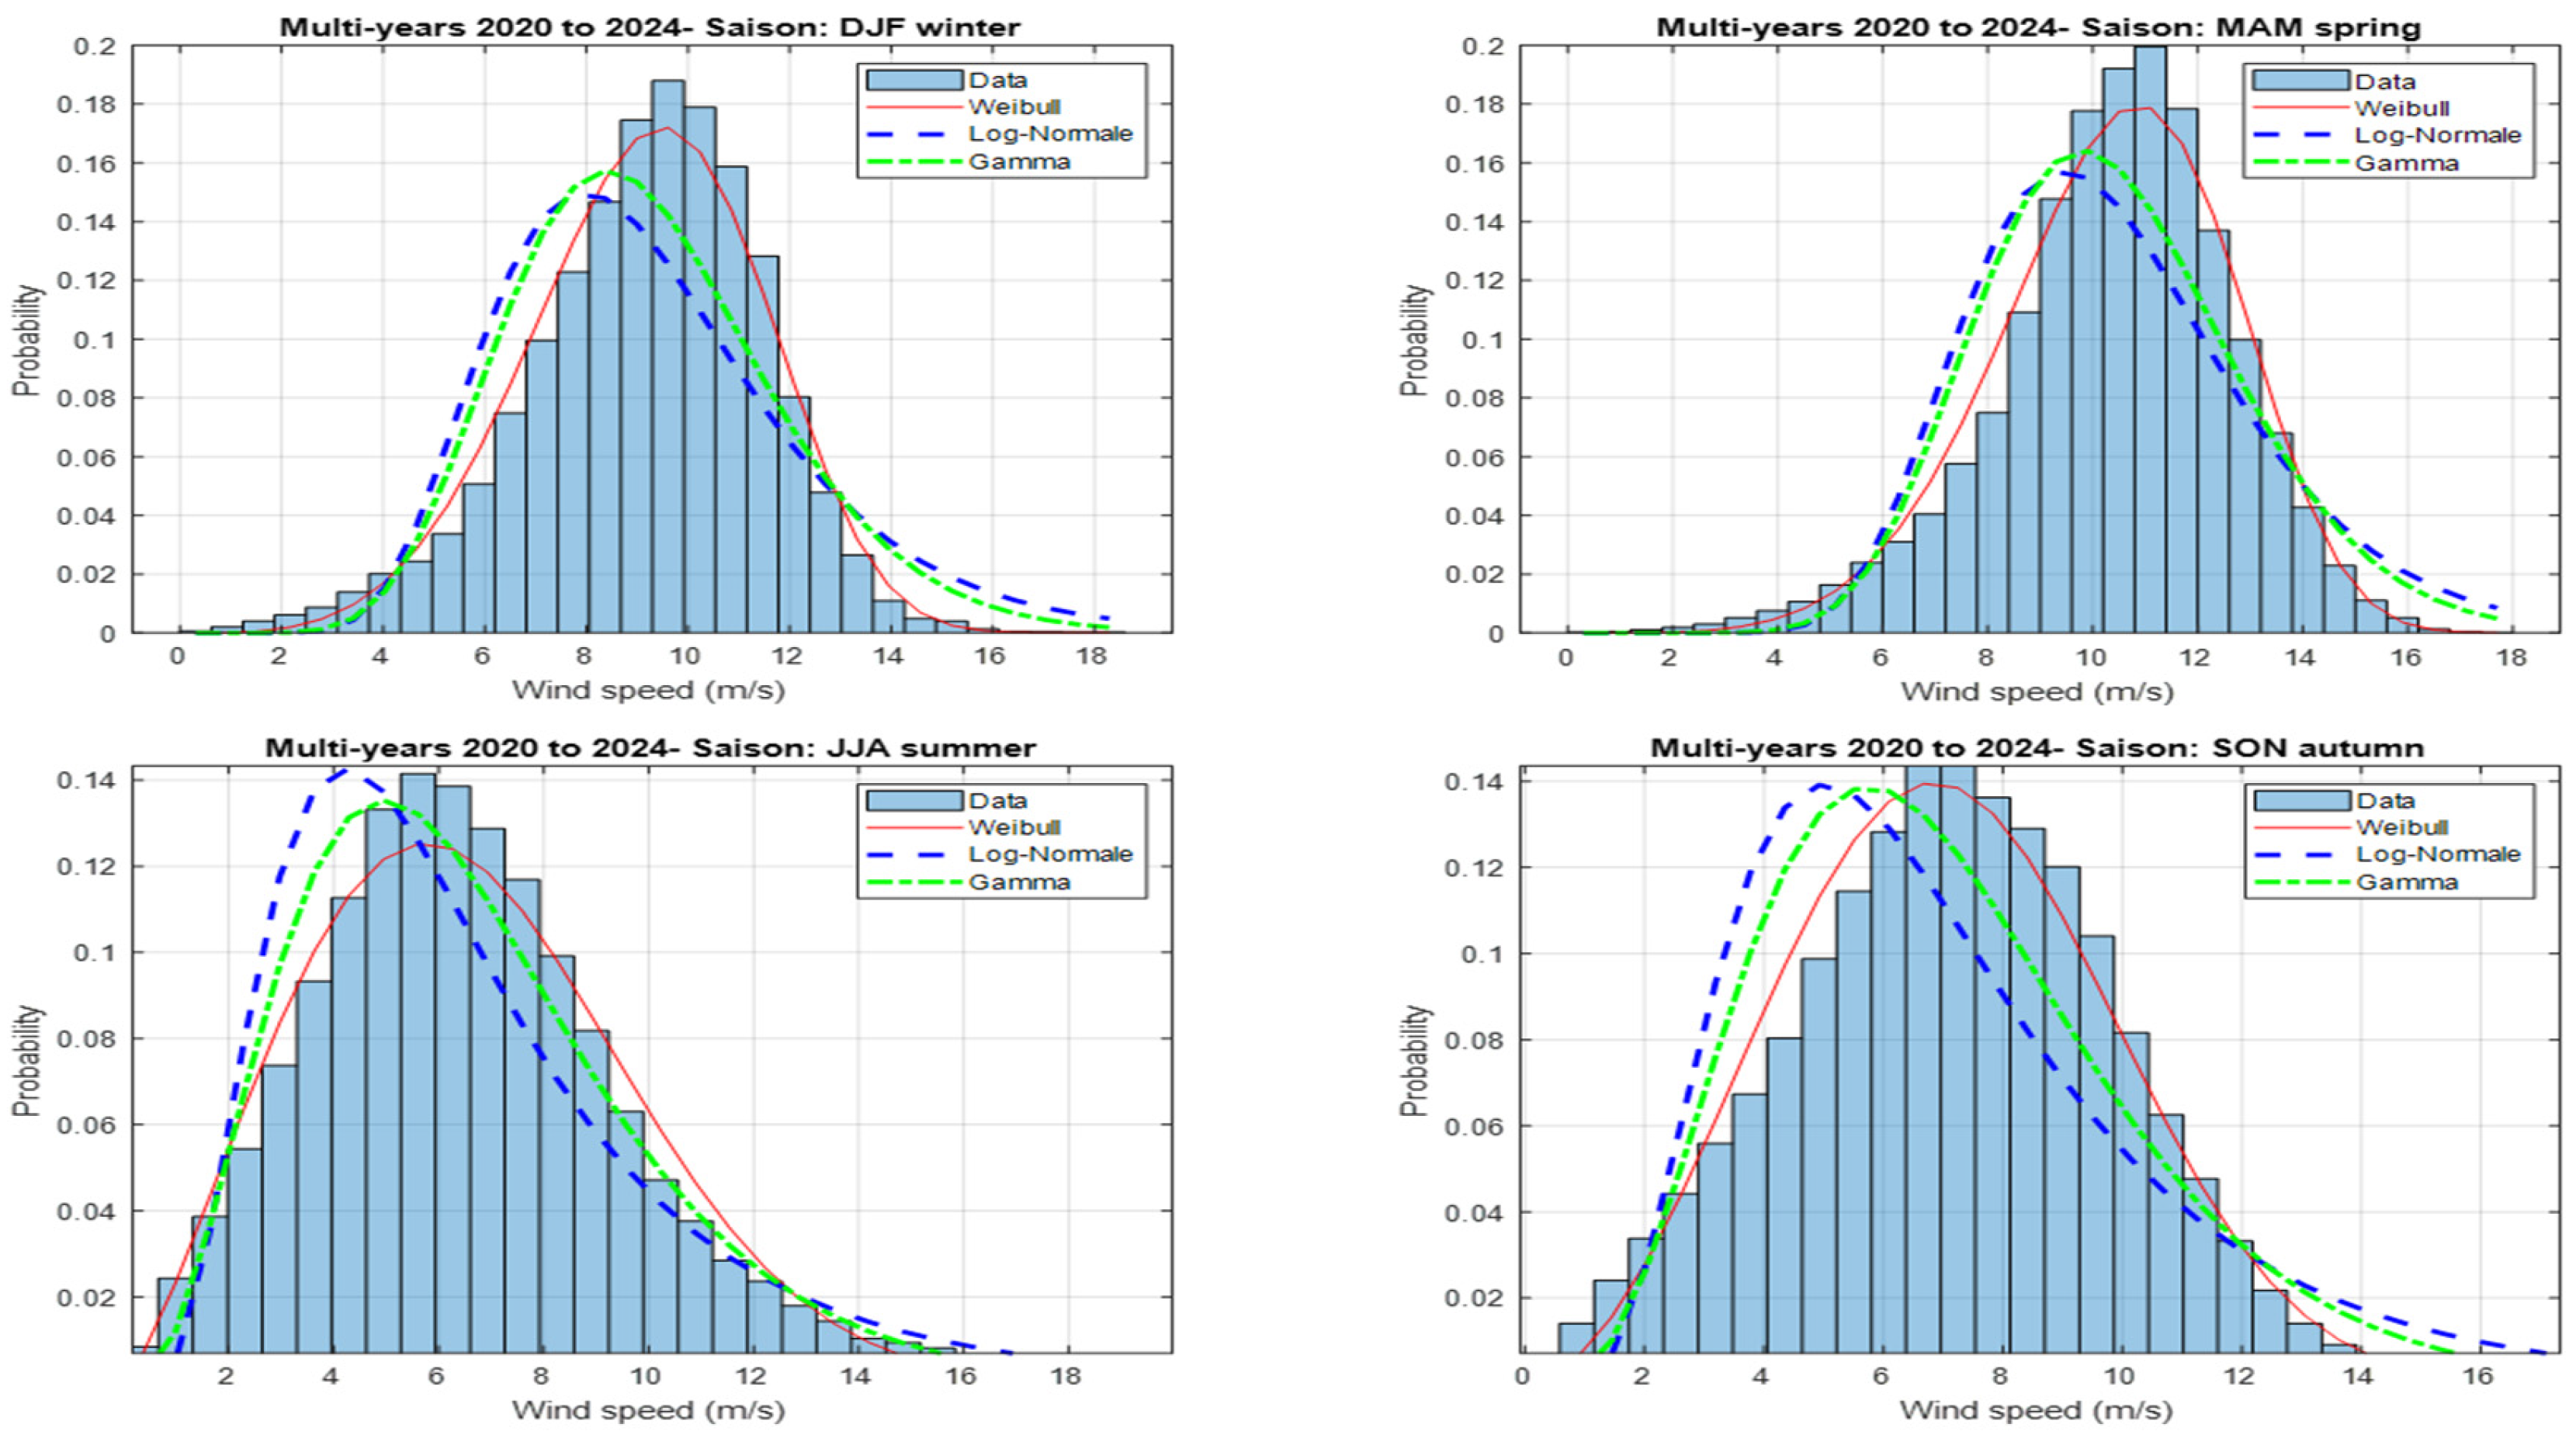
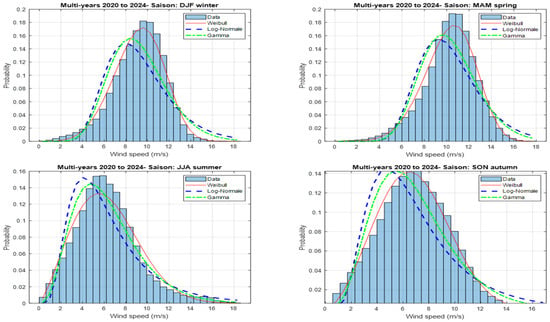
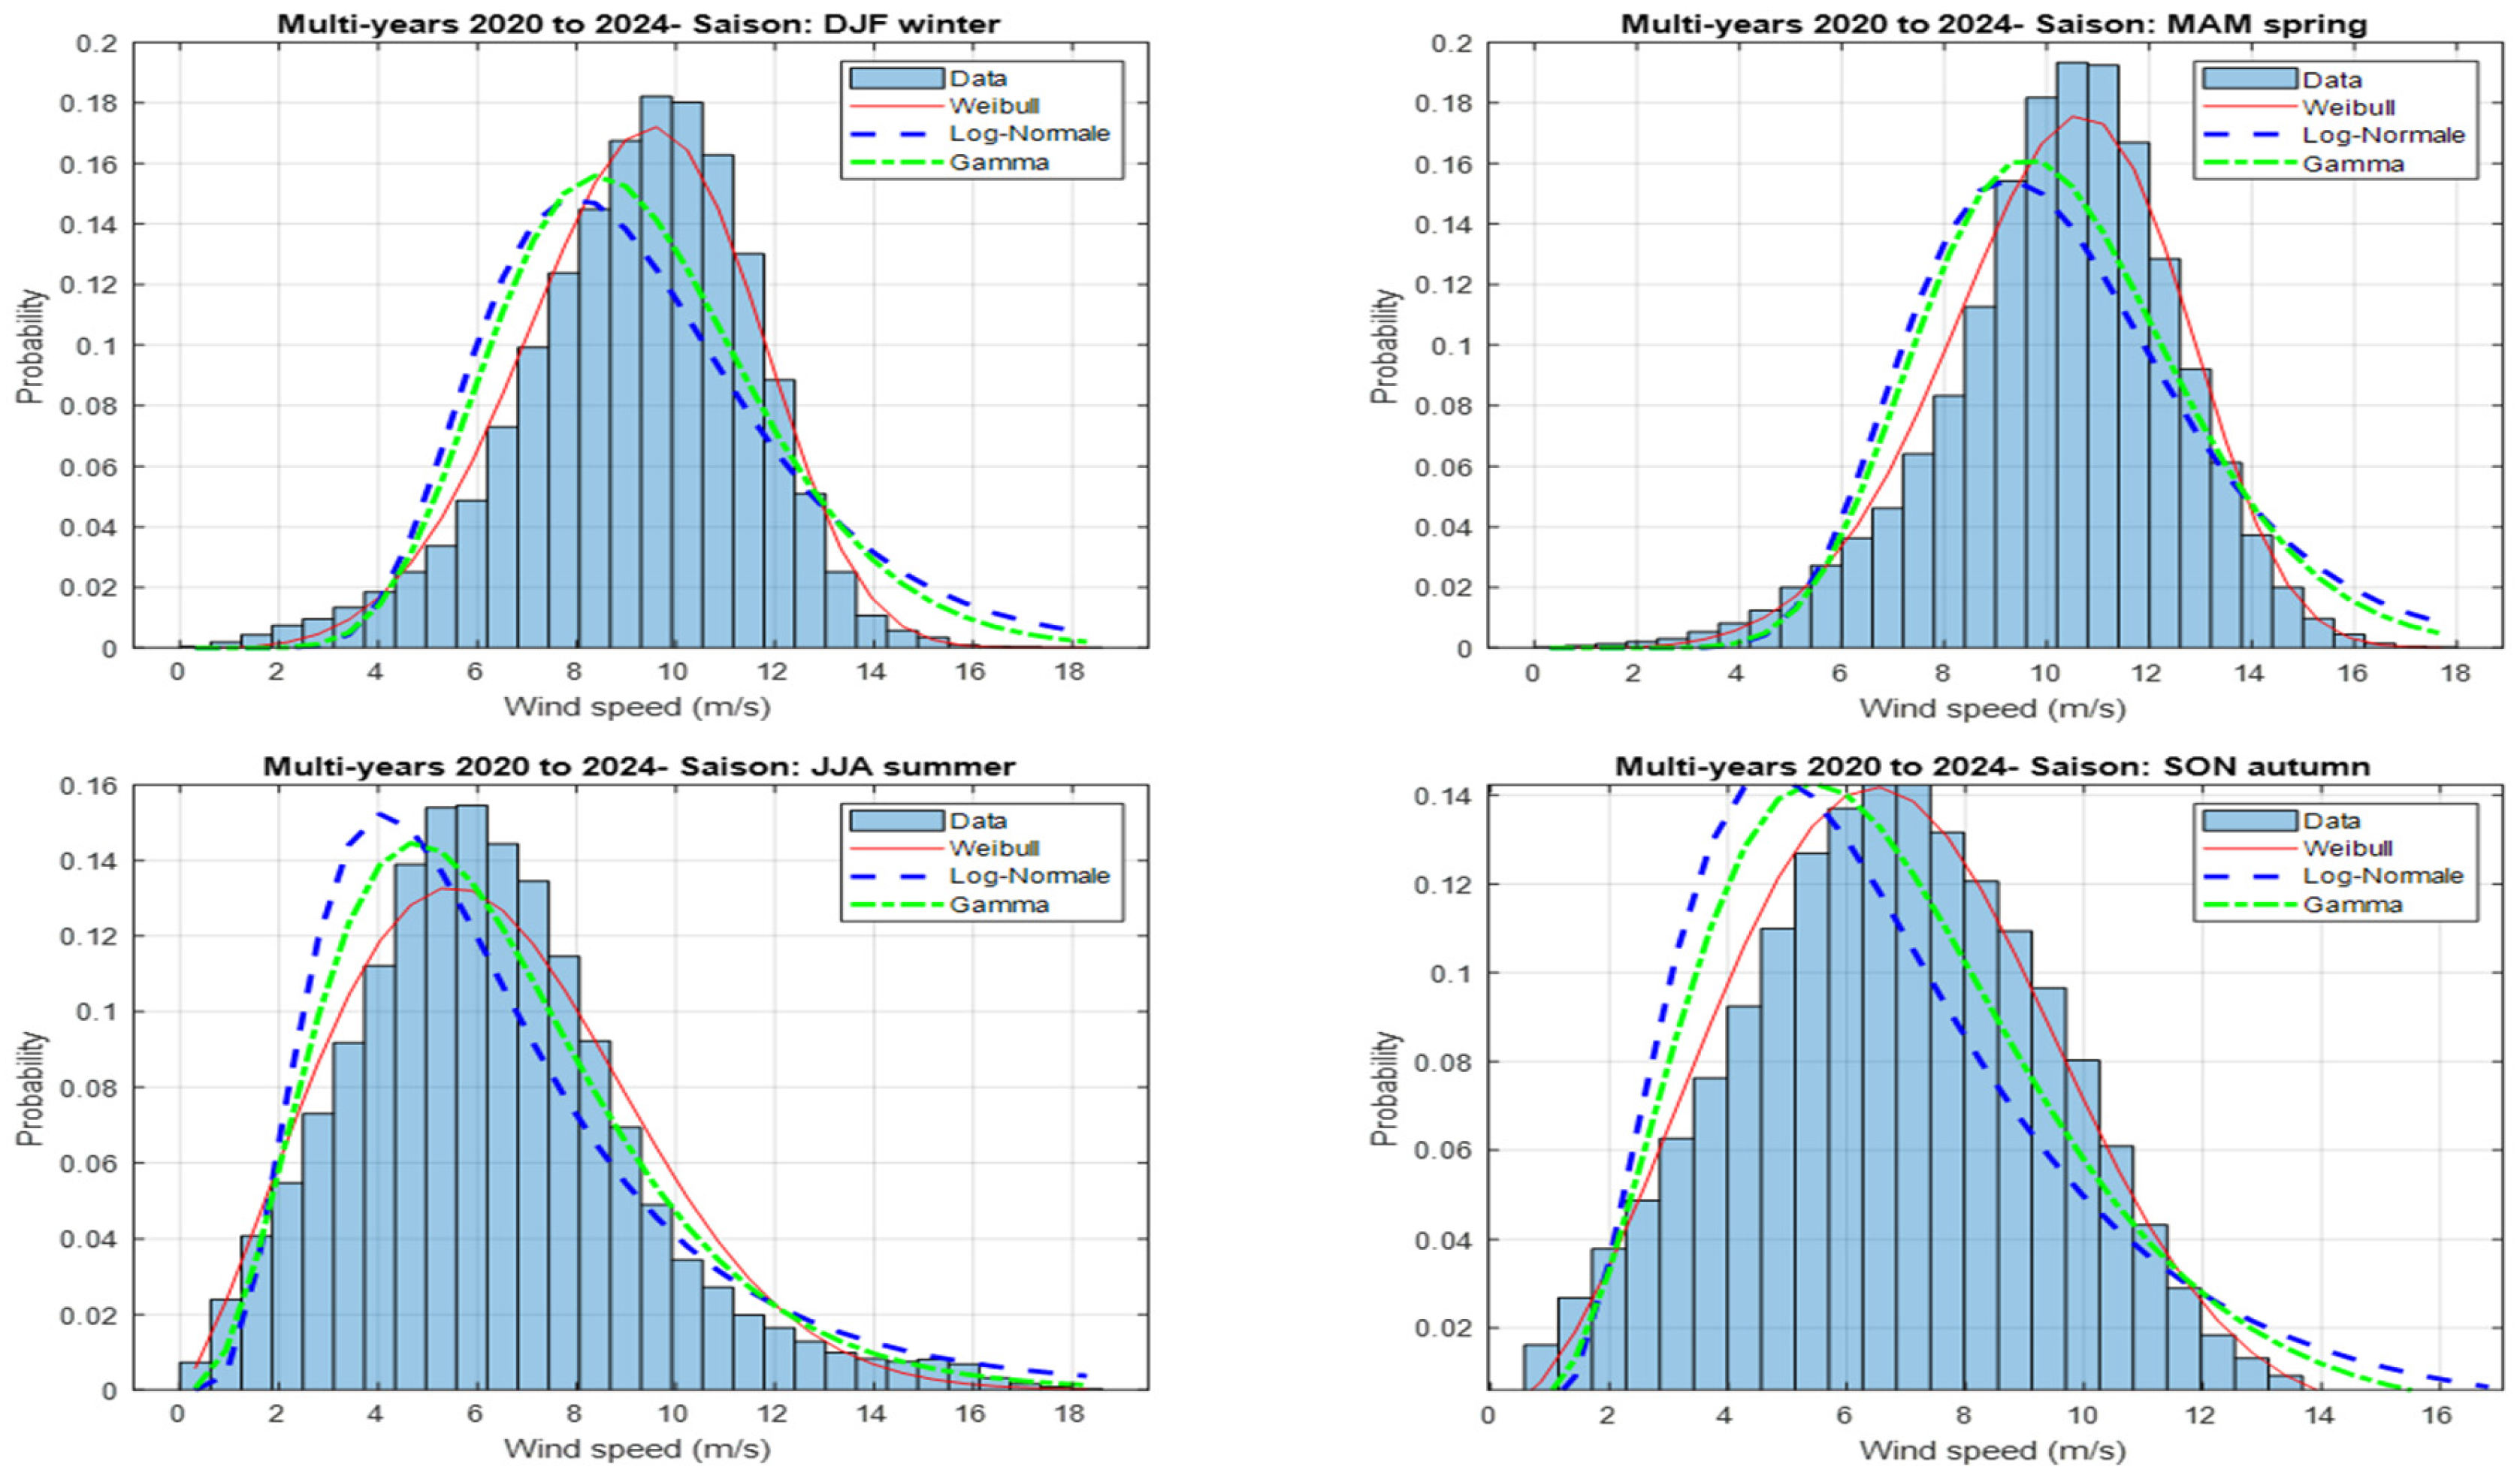
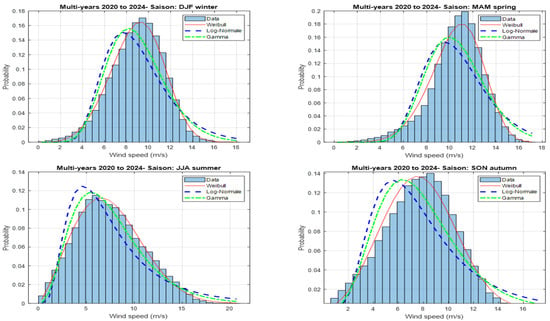
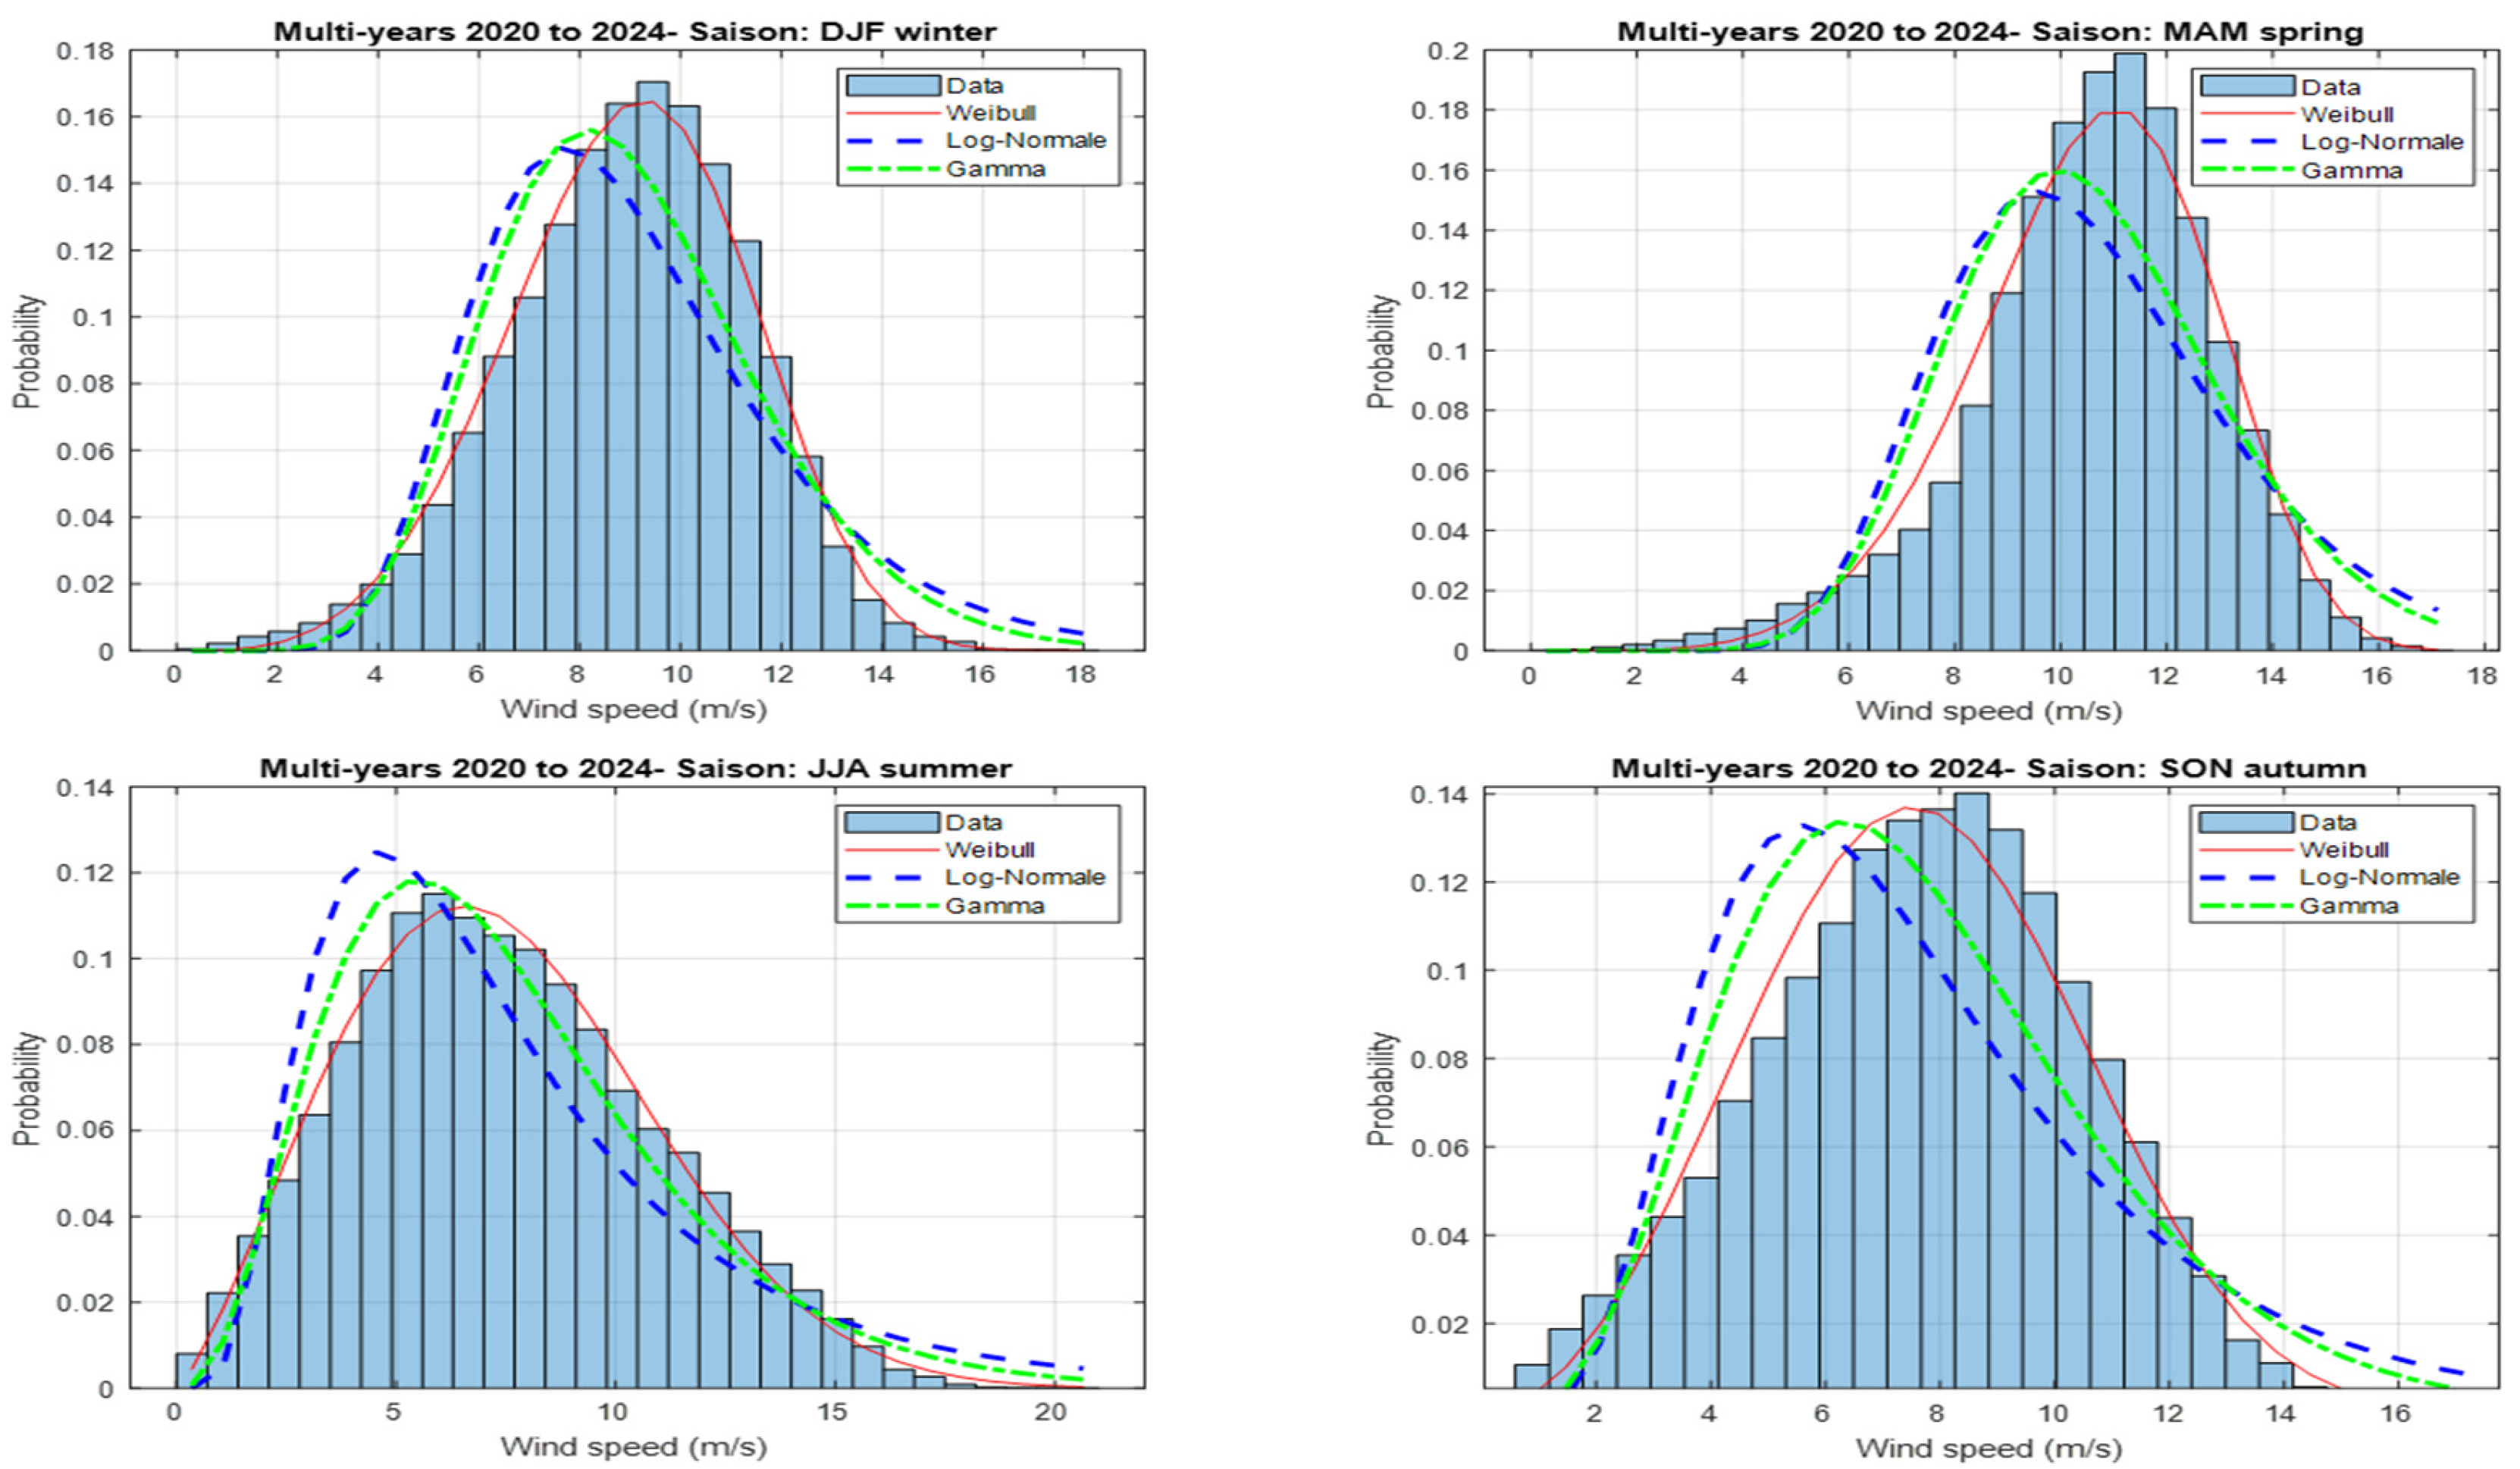
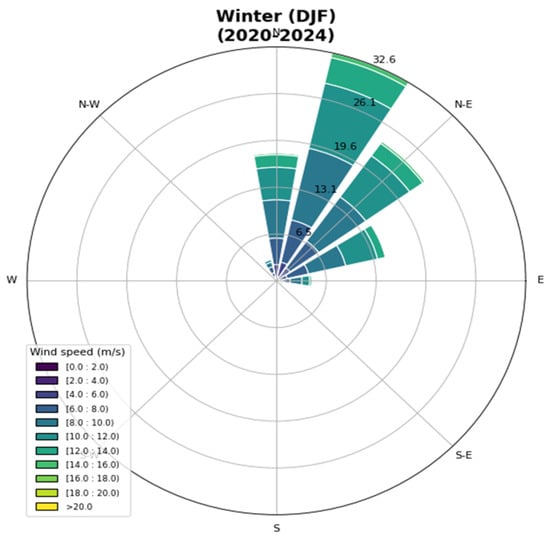
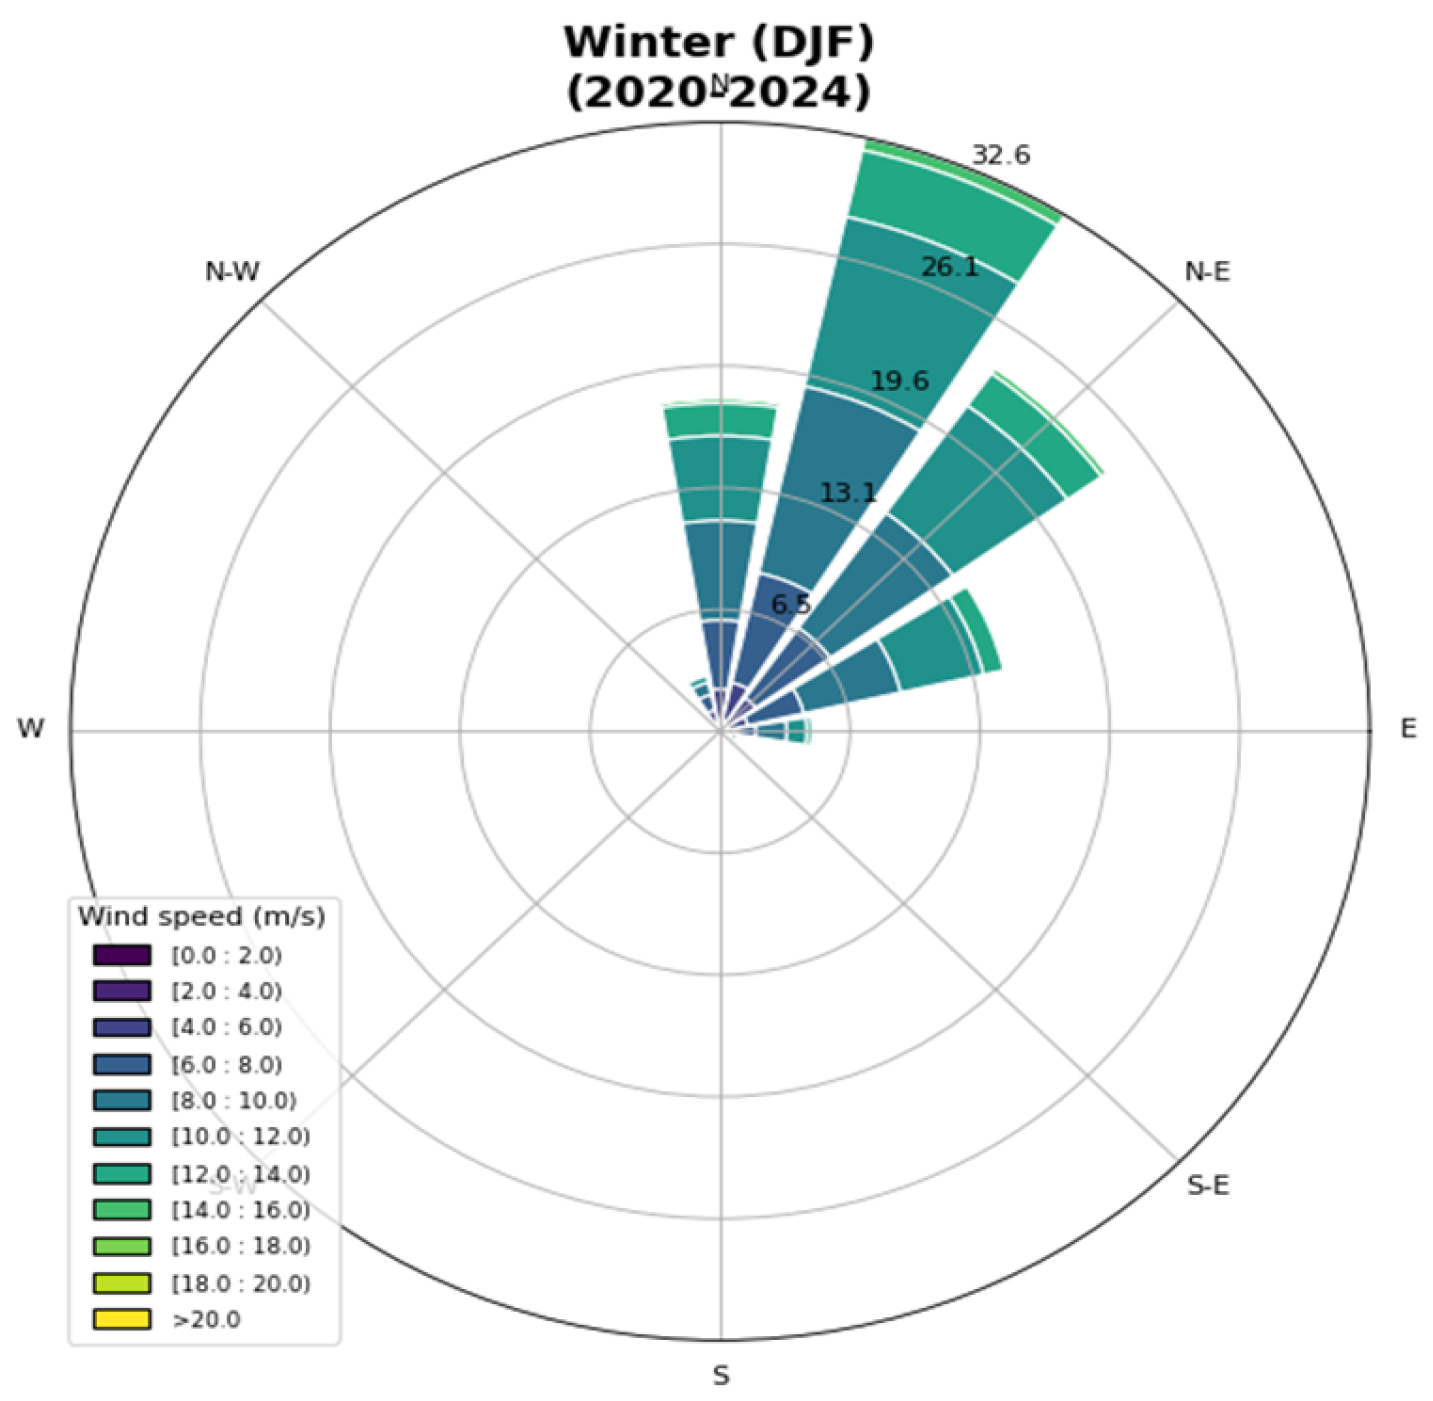
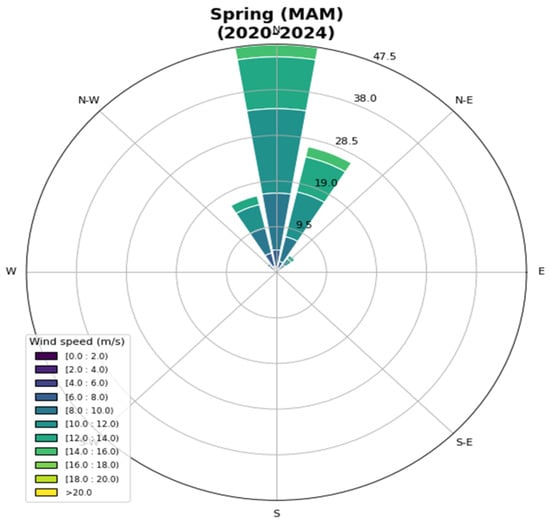
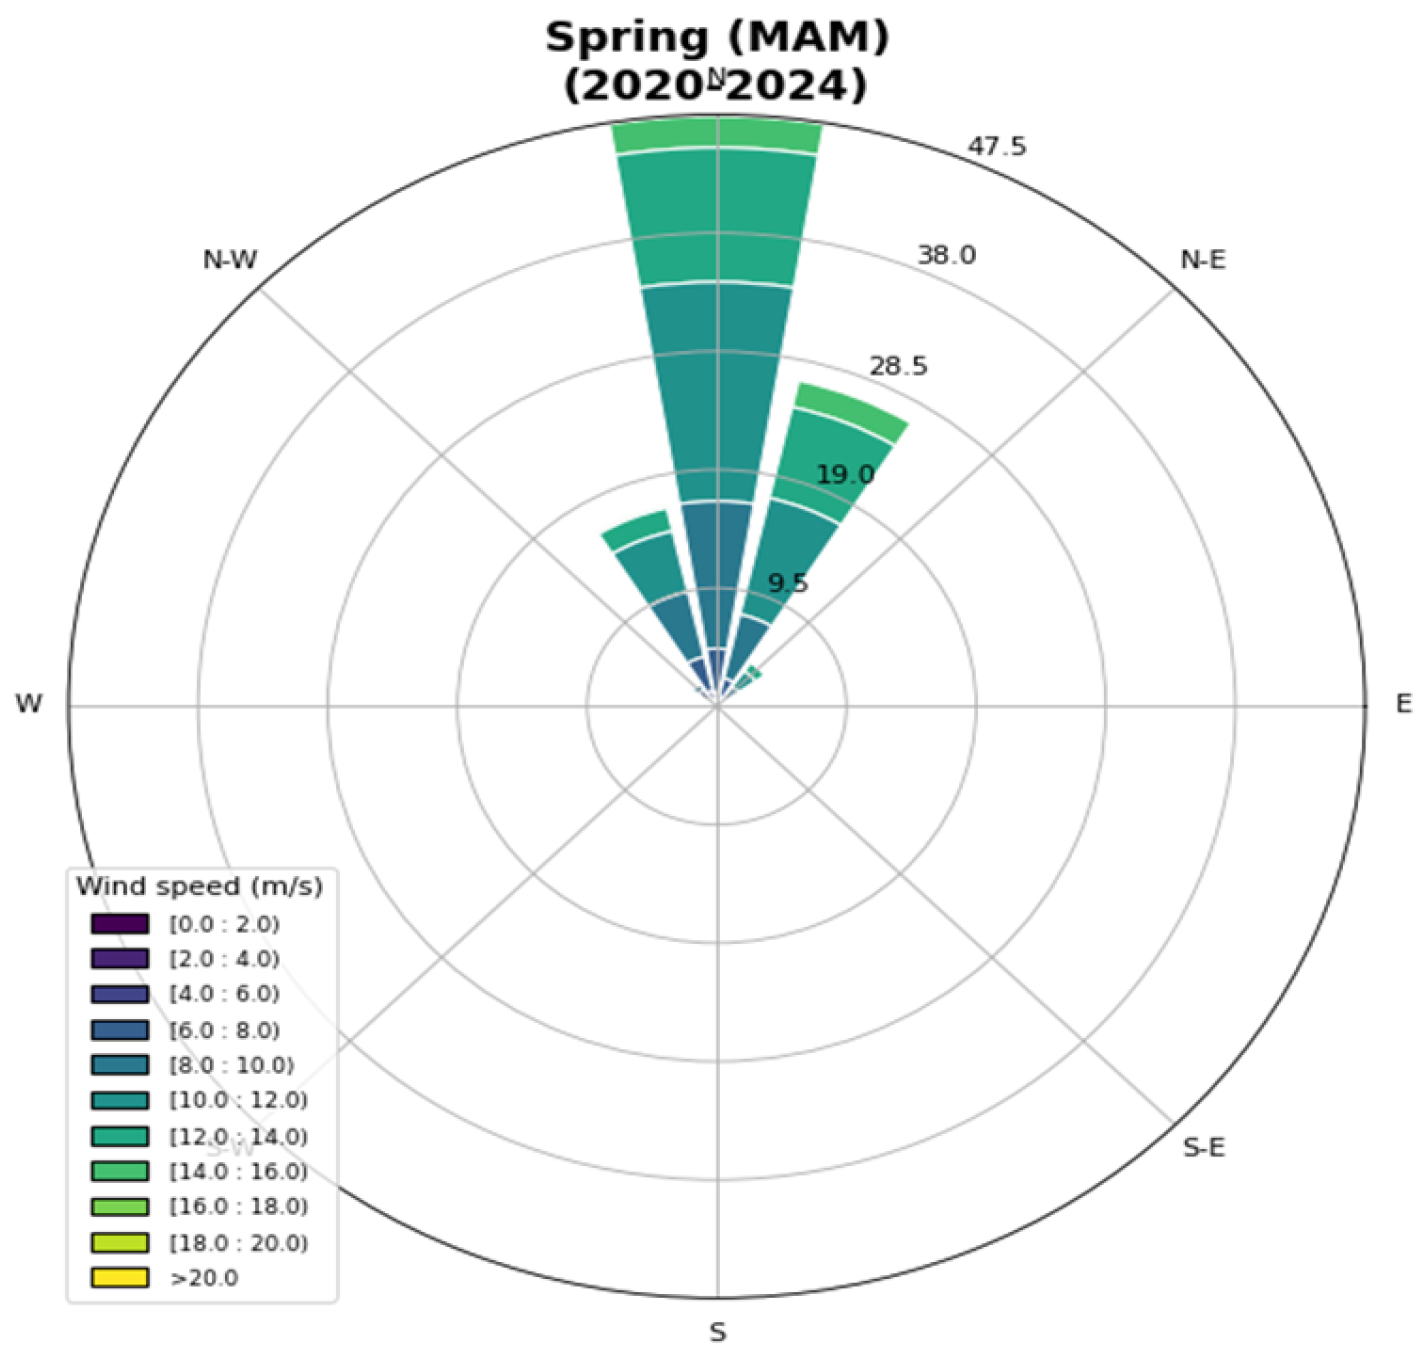
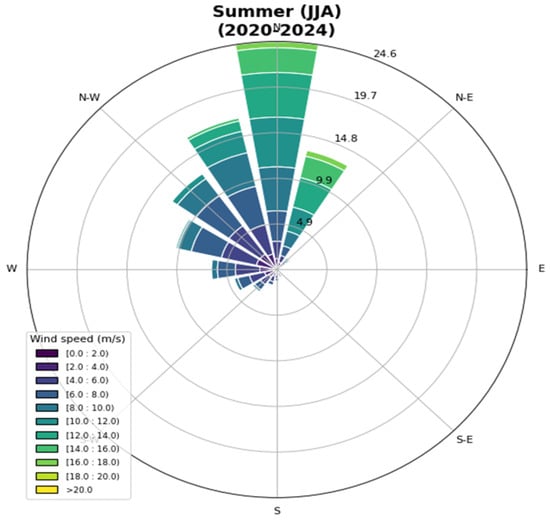
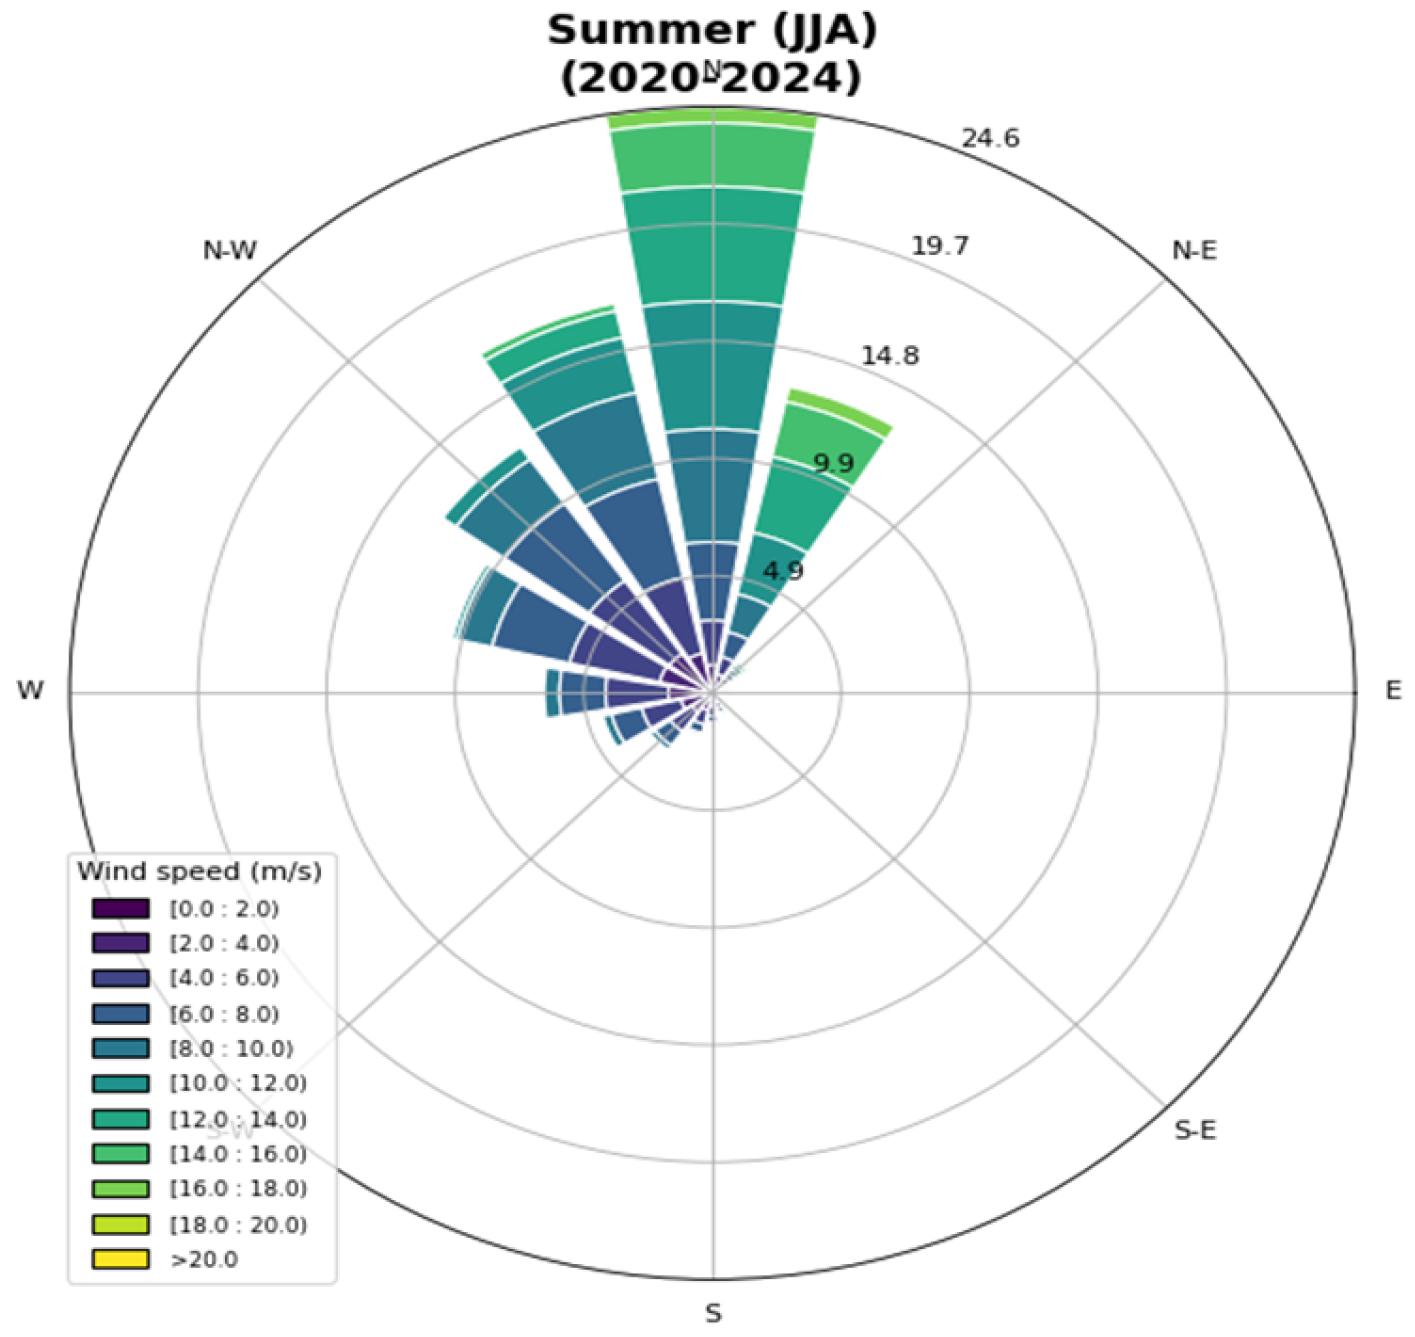
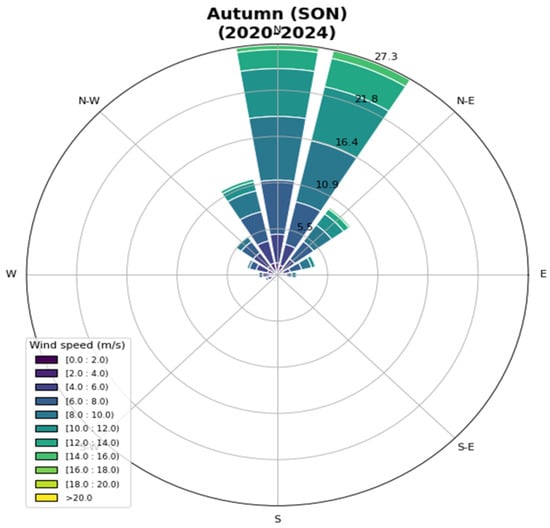
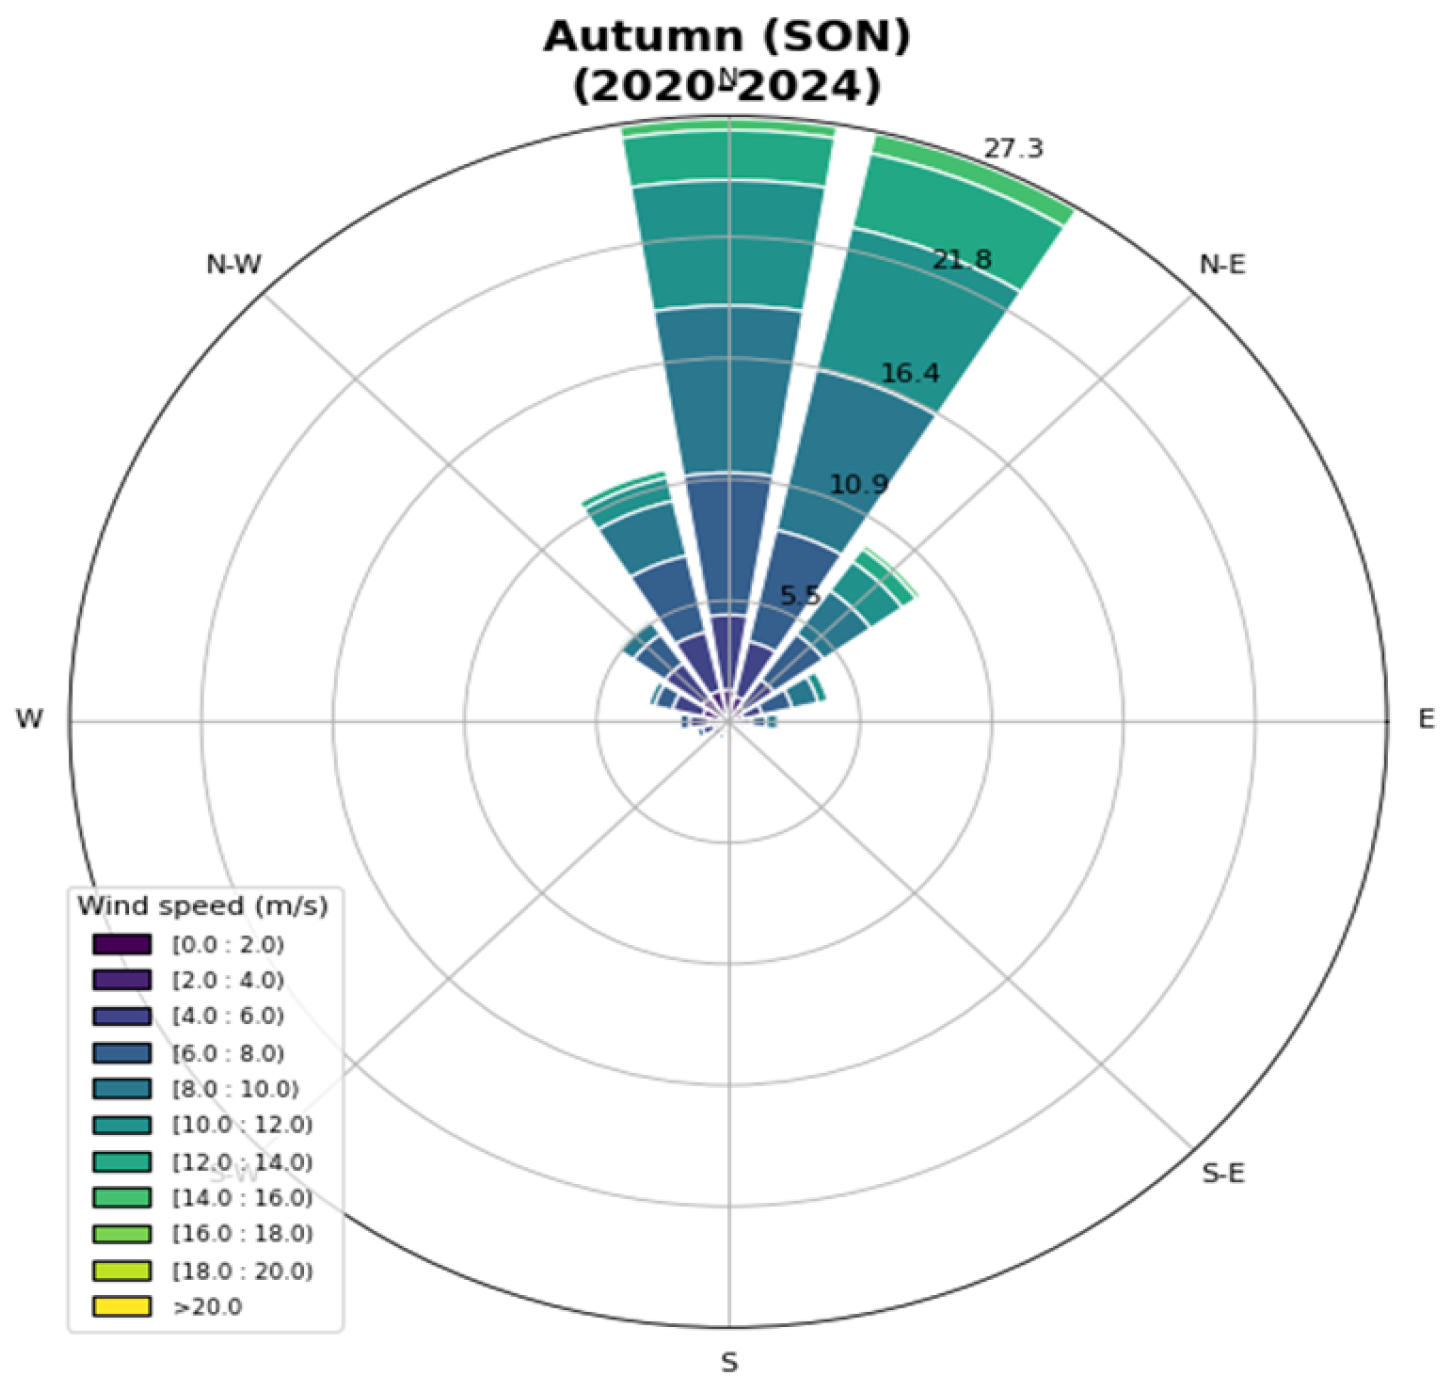
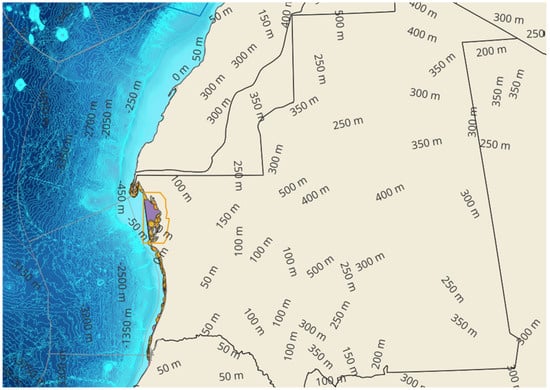
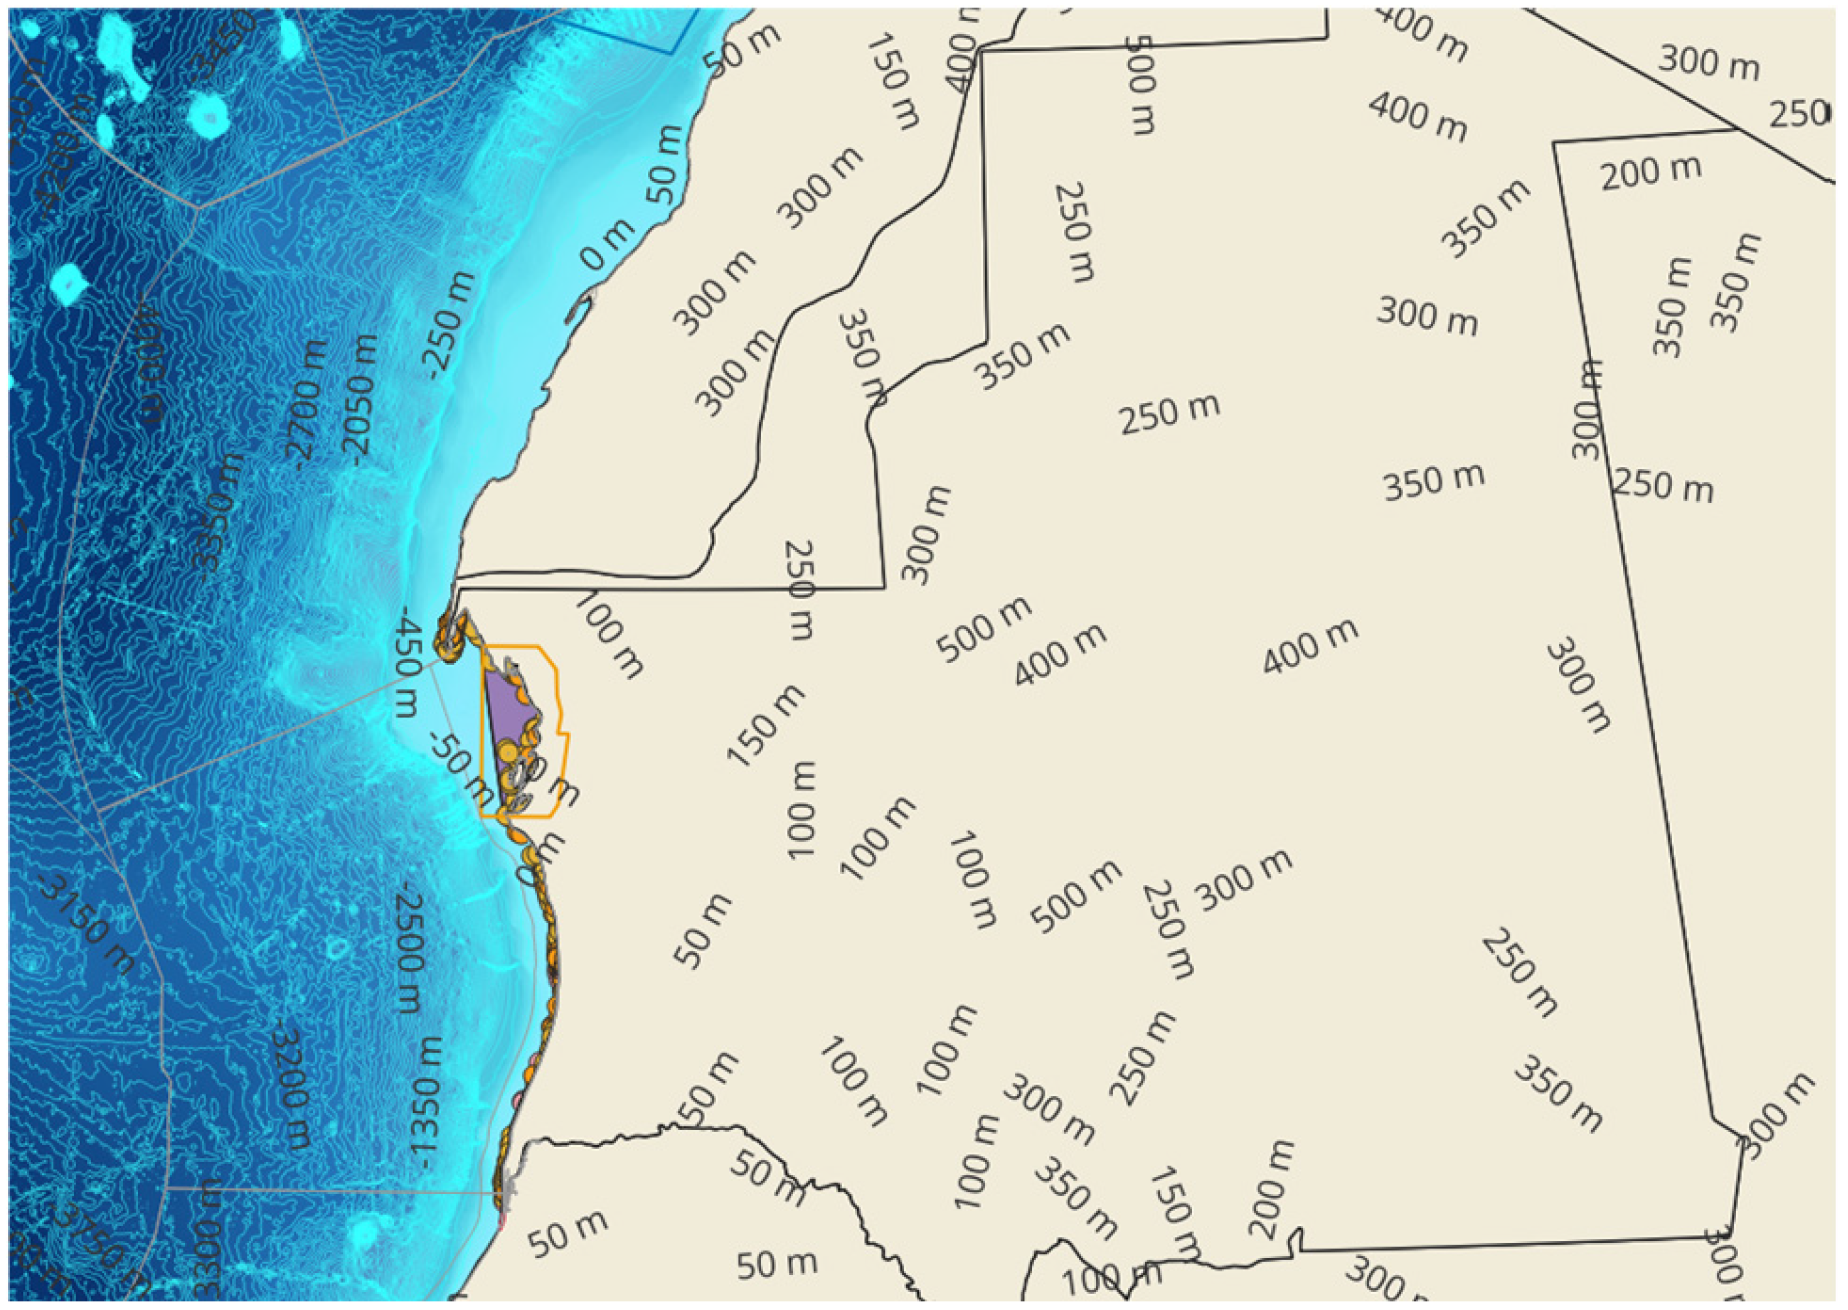
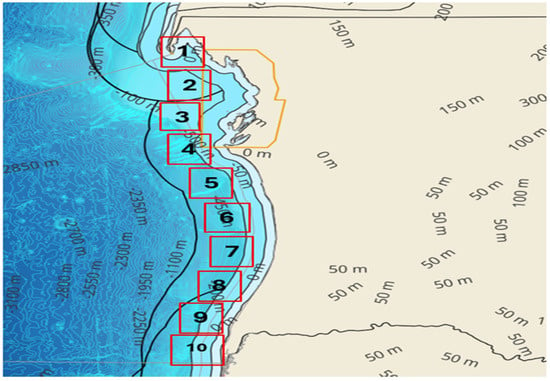
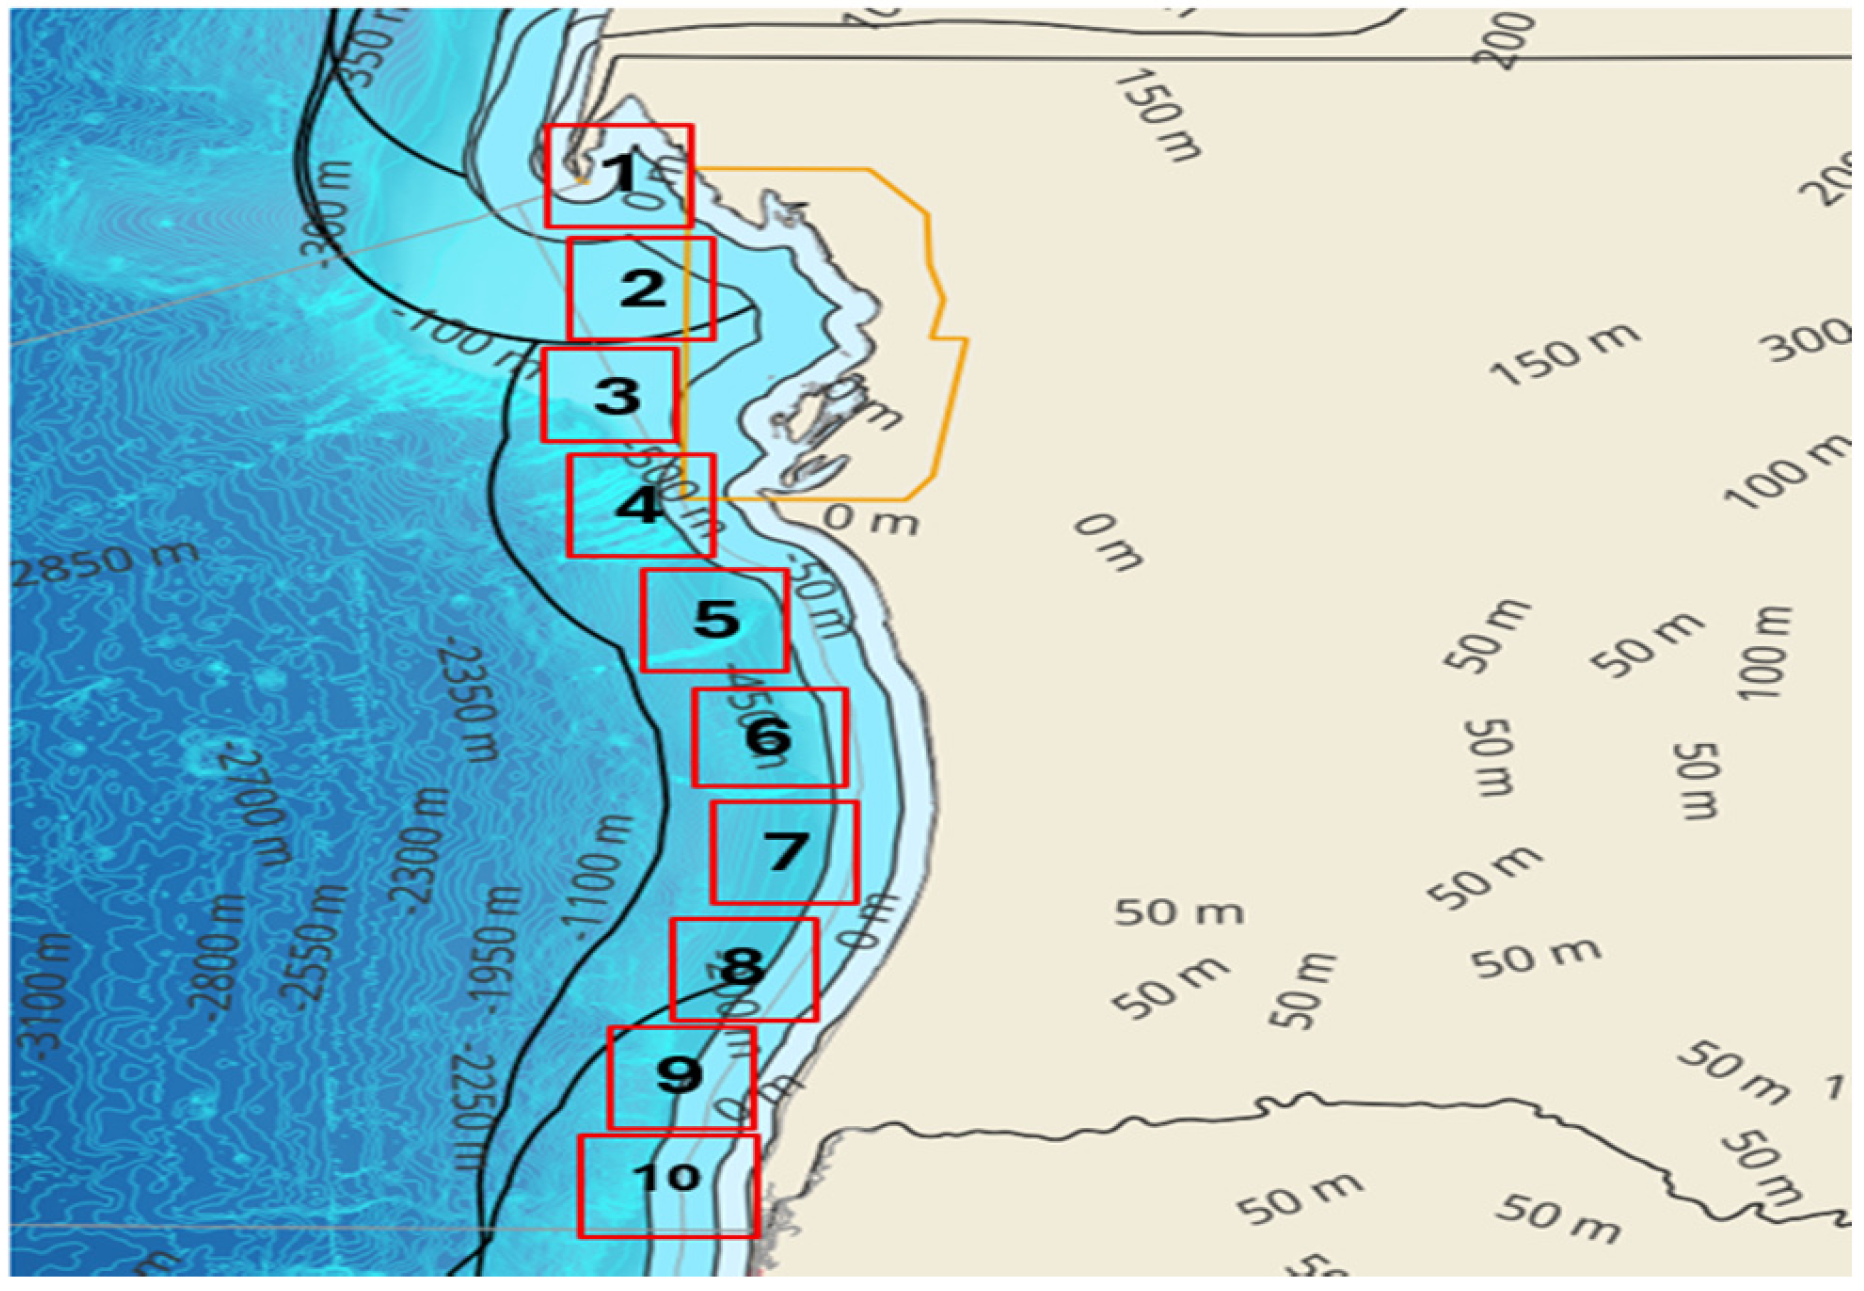
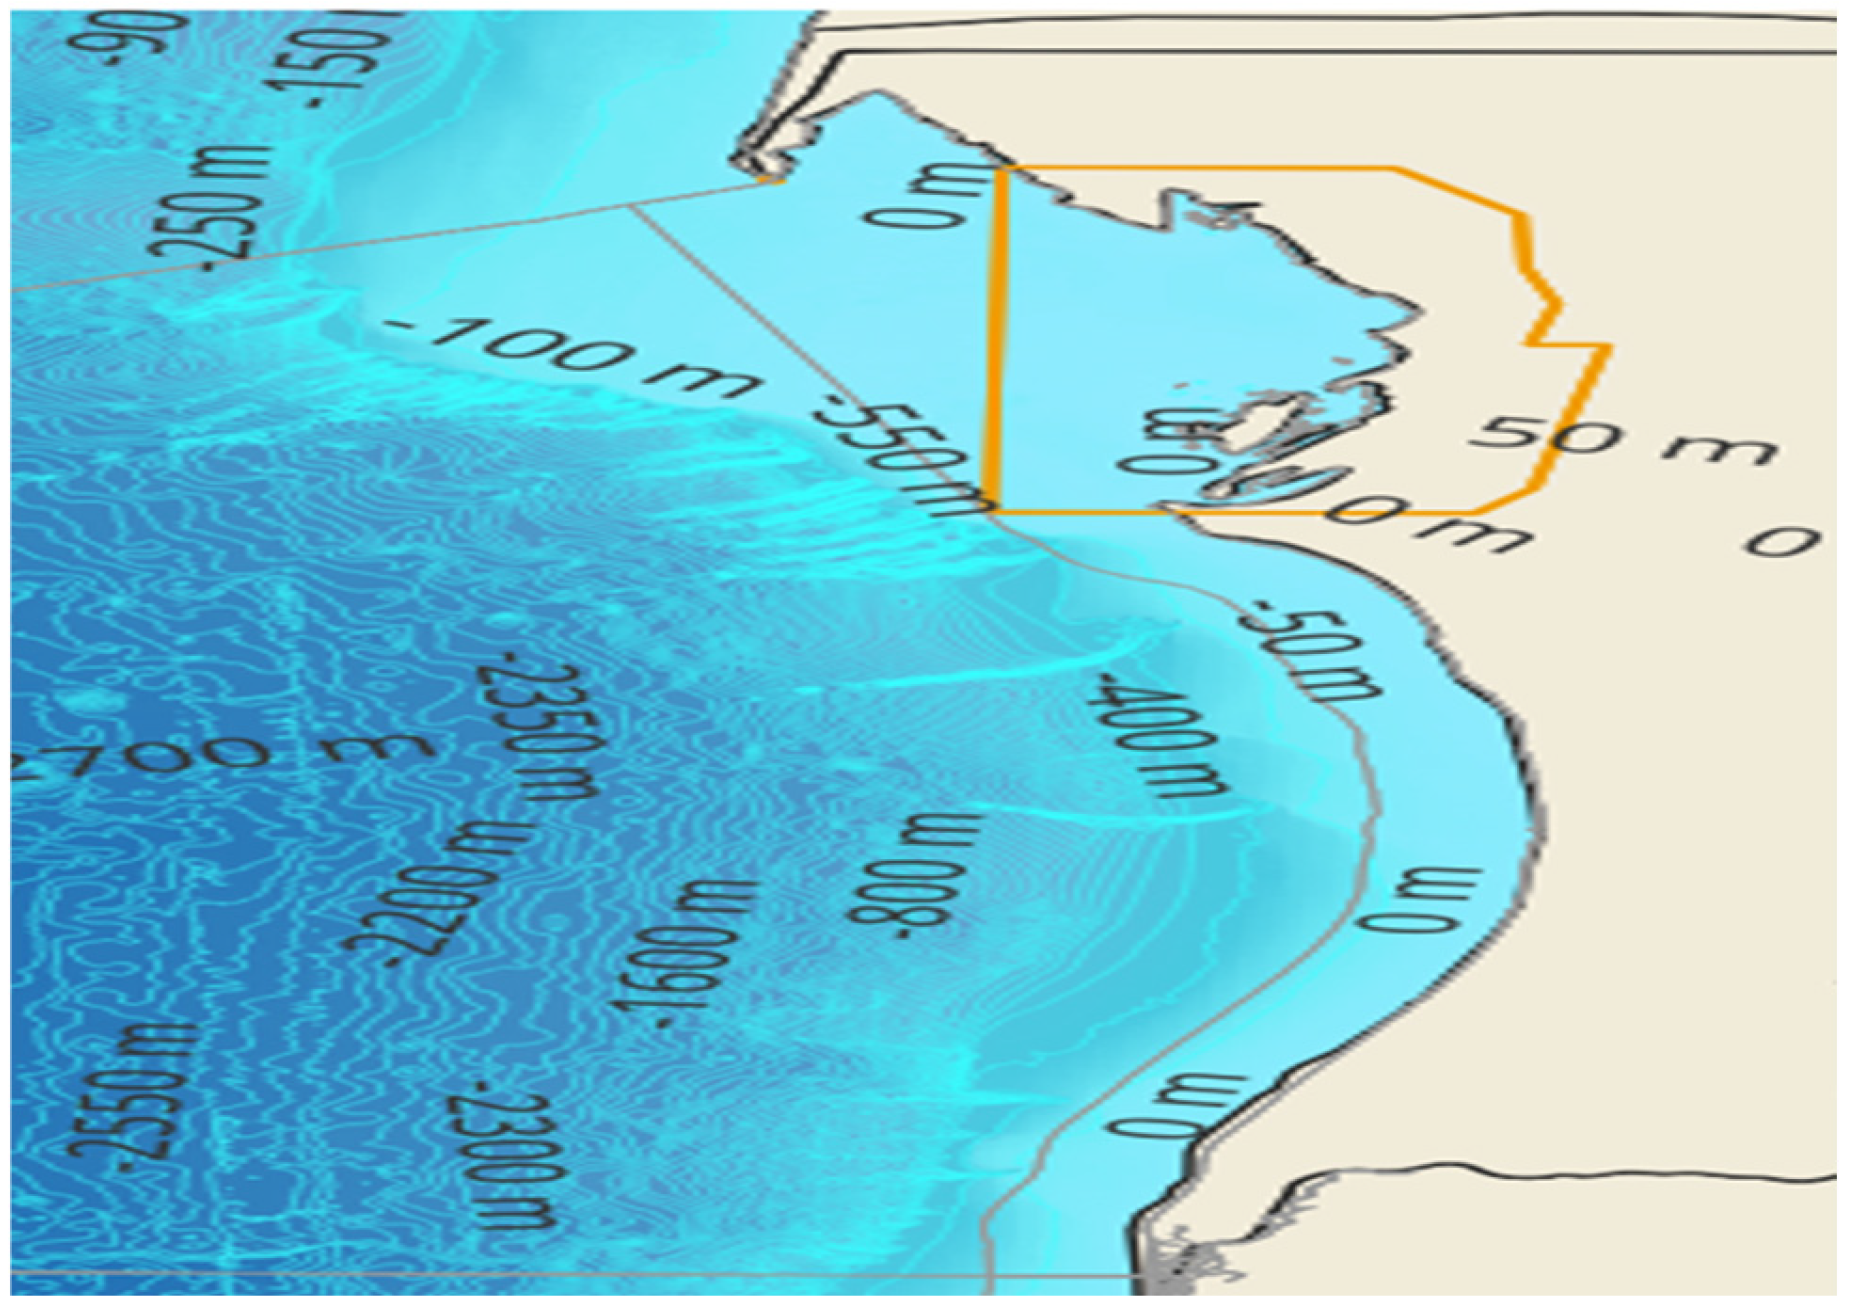
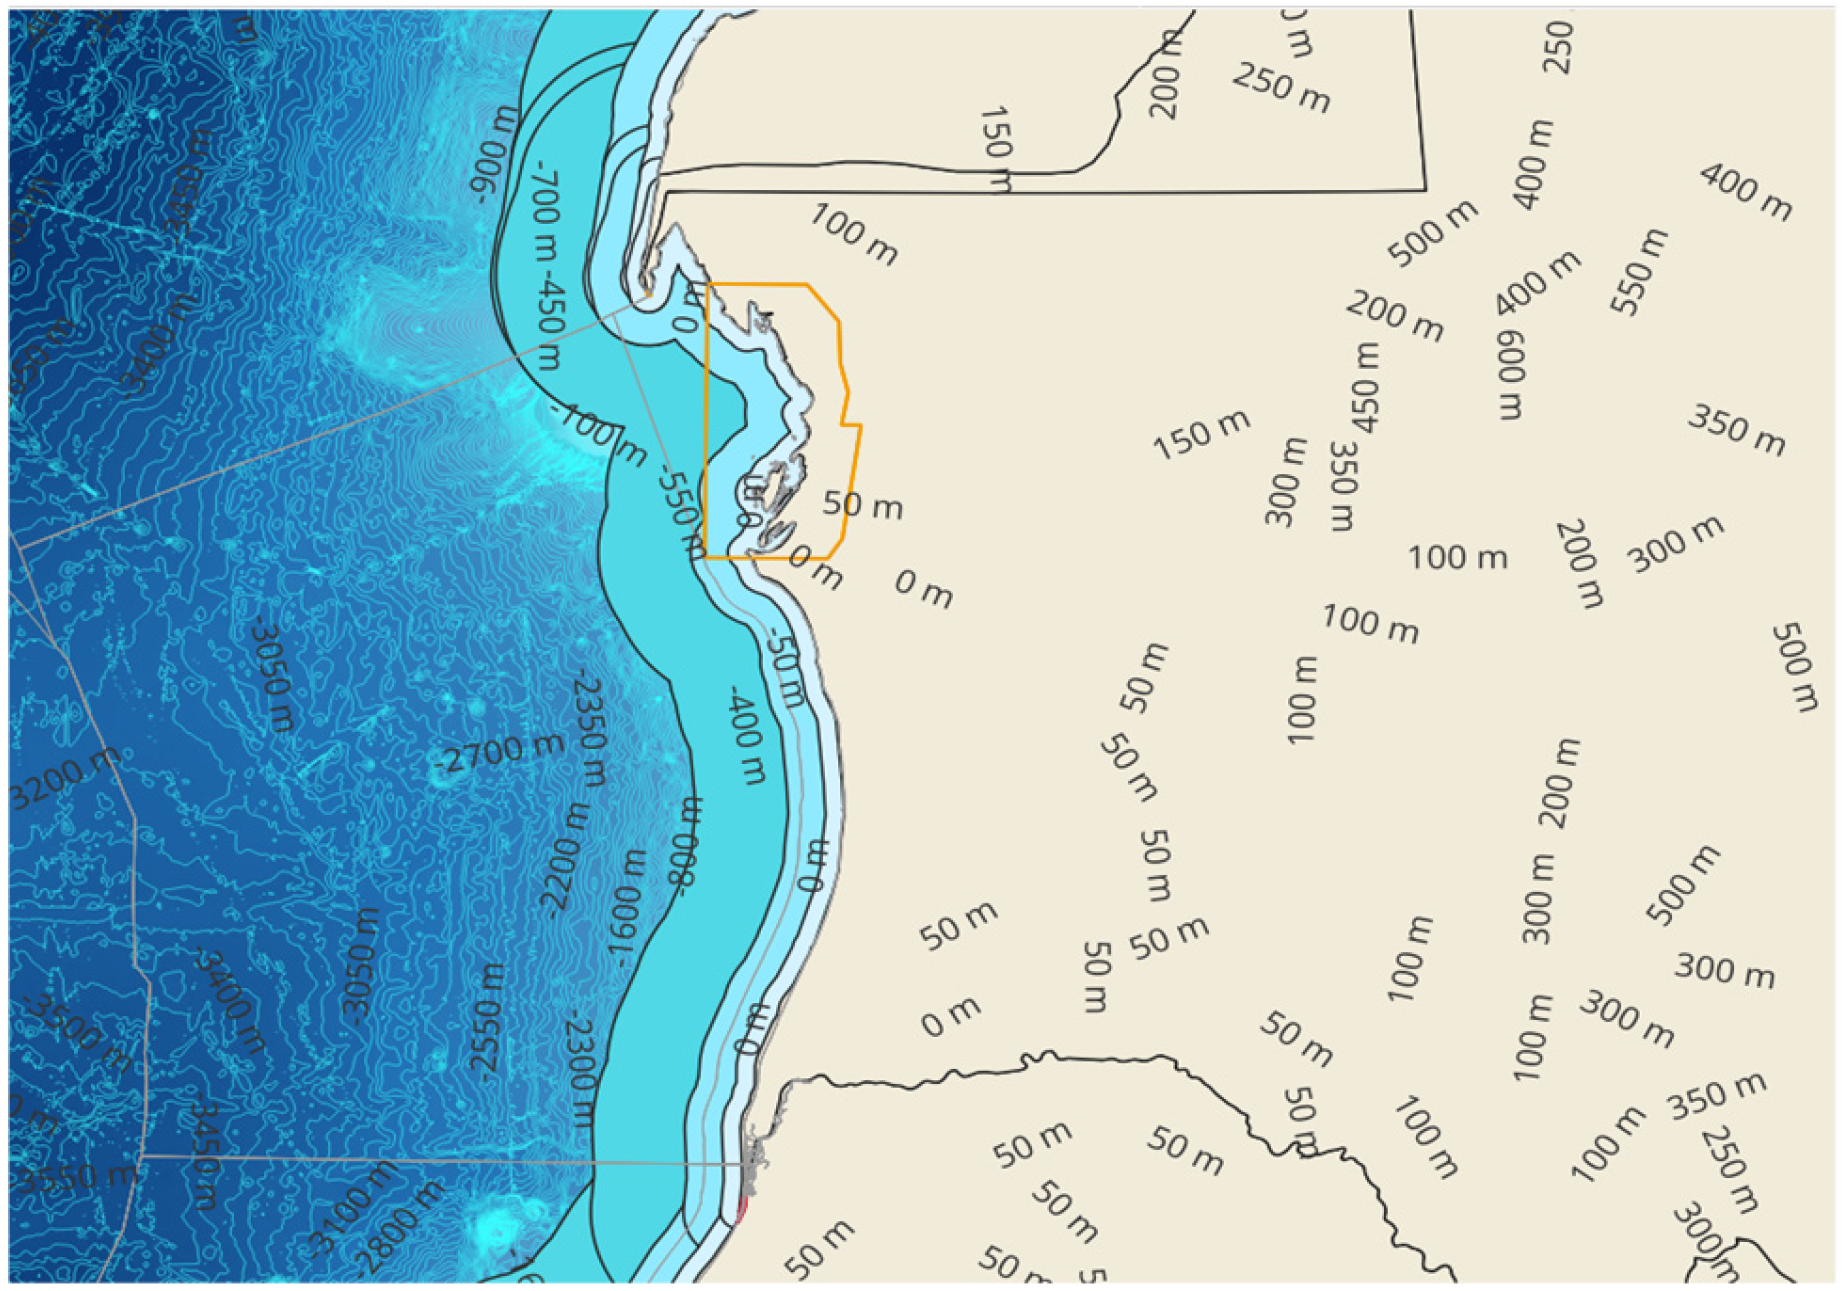

Disclaimer/Publisher’s Note: The statements, opinions and data contained in all publications are solely those of the individual author(s) and contributor(s) and not of MDPI and/or the editor(s). MDPI and/or the editor(s) disclaim responsibility for any injury to people or property resulting from any ideas, methods, instructions or products referred to in the content. |
© 2026 by the authors. Licensee MDPI, Basel, Switzerland. This article is an open access article distributed under the terms and conditions of the Creative Commons Attribution (CC BY) license.