


Abstract
Depressive symptoms, alcohol use, and body mass index (BMI) frequently co-occur, yet their longitudinal associations from adolescence into adulthood remain unclear. This study examined their prospective associations by distinguishing between-person differences from within-person changes and testing variations by gender and race. Data came from four waves of the National Longitudinal Study of Adolescent to Adult Health (Add Health). The analytic sample comprised 5734 participants (51.4% female; 56.7% non-Hispanic white) followed from ages 11–19 to ages 24–32. Multigroup cross-lagged panel models (CLPMs) and random intercept cross-lagged panel models (RI-CLPMs) assessed associations across four gender–racial groups: white males, white females, non-white males, and non-white females. All three variables demonstrated significant stability over time. Higher adolescent depressive-symptom levels were associated with higher subsequent alcohol-use scores at both the between-person and within-person levels. Higher BMI in young adulthood was associated with higher subsequent depressive-symptom levels at the between-person level. At the within-person level, higher-than-usual depressive-symptom levels were associated with lower subsequent BMI only among white females during adolescence. Within-person associations between alcohol use and BMI also varied developmentally: higher-than-usual alcohol-use scores were associated with higher subsequent BMI earlier in development, whereas negative associations emerged in both directions in adulthood. Several associations differed across gender–racial groups. Overall, the findings demonstrate complex, developmentally specific associations among depressive symptoms, alcohol-use frequency, and BMI, underscoring the importance of distinguishing between-person from within-person processes and considering gender, race, and developmental stage.
1. Introduction
Depressive symptoms, alcohol use, and elevated body mass index (BMI) are significant public health concerns in the United States (McCarty et al., 2009). Reports indicate a consistent increase in depressive symptoms beginning at younger ages (Lee et al., 2023). Adolescent depressive symptoms are associated with an increased likelihood of later substance-use disorders and other mental health conditions that may persist into adulthood (Mojtabai et al., 2016). Frequent drinking, heavy episodic drinking, and alcohol intoxication are associated with a substantial public health burden (Sudhinaraset et al., 2016). Alcohol use is a broad construct encompassing conceptually distinct dimensions, including drinking frequency, quantity, patterns of use, and alcohol-related consequences, which may have different health implications. The present study specifically focuses on the frequency of alcohol-use behaviors, operationalized as a composite of the past-year frequency of drinking, heavy episodic drinking, and alcohol intoxication. Elevated BMI also represents a major public health concern. Approximately 41.9% of U.S. adults have obesity, and more than 34% of U.S. adolescents are overweight or obese, including 19.7% who have obesity (Trust for America’s Health, 2022). These high prevalence rates represent a substantial public health burden. Overweight and obesity are associated with an increased risk of chronic conditions, including type 2 diabetes, cardiovascular disease, and hypertension (Trust for America’s Health, 2022). Substantial research indicates potential co-occurrence among depressive symptoms, alcohol use, and elevated BMI or obesity-related outcomes (e.g., Blaine, 2008; Colder et al., 2019; French et al., 2010), although most studies have considered only two of these variables at a time. Equally importantly, most studies have focused solely on either adolescence or adulthood, without considering the transitional period between these two developmental stages. The transition from adolescence to adulthood is marked by heightened vulnerability to depressive symptoms (Mojtabai et al., 2016; Yu, 2026; Yu & Zhang, 2025), as well as developmental and contextual changes related to alcohol access, alcohol use, and weight-related outcomes (Gordon-Larsen et al., 2004). Therefore, examining these three variables across the transition from adolescence to adulthood may provide a more comprehensive understanding of their developmental interplay.
Employing a nationally representative longitudinal U.S. dataset, the present study extends the literature by examining prospective associations among depressive symptoms, alcohol use, and BMI, as well as potential differences by gender and race. We apply both cross-lagged panel models (CLPMs) and random intercept cross-lagged panel models (RI-CLPMs). While CLPMs estimate overall prospective associations without fully separating stable between-person differences from within-person fluctuations, RI-CLPMs distinguish between these two processes (Hamaker et al., 2015). Together, these models provide a more comprehensive understanding of the longitudinal associations among the three variables.
1.1. Associations Between Depressive Symptoms and Alcohol Use
Given the heterogeneity of depression-related conditions and symptom presentations, the present study focuses specifically on self-reported depressive symptoms assessed dimensionally, rather than on major depressive episodes, recurrent depression, or clinically diagnosed depressive disorders. Longitudinal research suggests that depressive symptoms and alcohol involvement may be prospectively associated in both directions, particularly during adolescence (e.g., Colder et al., 2019; Groenman et al., 2017; Hussong et al., 2017). However, the direction and magnitude of these associations vary across developmental periods, gender, and the alcohol-related outcome examined. Marmorstein (2009) found reciprocal positive associations between depressive symptoms and alcohol-related problems from early adolescence through early adulthood, although these associations differed by age and gender. In their review, Pedrelli et al. (2016) similarly concluded that findings depended on developmental period and whether alcohol involvement was assessed as consumption, heavy drinking, alcohol-related problems, or alcohol-use disorder. More recently, Wang et al. (2026) found that depression predicted subsequent alcohol-use problems during specific periods between ages 14 and 23, whereas associations between depression and alcohol consumption followed a different pattern that changed across development. Collectively, these findings suggest that depressive symptoms and alcohol involvement are longitudinally related across adolescence and young adulthood but do not support a uniform positive bidirectional association.
An unresolved methodological question is whether these longitudinal associations operate at the between-person level, the within-person level, or both. Previous studies spanning adolescence and adulthood have generally examined individual differences in levels or developmental trajectories or have used analytical approaches that do not fully separate stable between-person differences from within-person fluctuations. Studies explicitly examining within-person associations have also tended to focus on a single developmental period, with few covering the transition from adolescence to adulthood (e.g., McCabe et al., 2023). Consequently, it remains unclear whether individuals report greater alcohol use following periods of higher-than-usual depressive symptoms, whether periods of higher-than-usual alcohol use are followed by higher-than-usual depressive symptoms, or whether the observed longitudinal associations primarily reflect stable differences between individuals. The present study addresses this gap by distinguishing stable between-person differences from dynamic within-person associations between depressive symptoms and alcohol use across the transition from adolescence to adulthood.
1.2. Associations Between Depressive Symptoms and BMI
Extensive evidence supports positive bidirectional relations between depressive symptoms and BMI or obesity-related outcomes, encompassing both biological and psychological factors (Blaine, 2008; Faith et al., 2011; Milaneschi et al., 2019; Yu, in press). Higher body mass index (BMI) is often associated with higher levels of depressive symptoms, although the associations may vary across BMI categories (Ali et al., 2013). For instance, a U-shaped pattern is frequently observed, where both underweight and severe obesity have been associated with higher levels of depressive symptoms (De Wit et al., 2010). Factors such as gender, age, and ethnicity influence these relations (Faith et al., 2011). However, some research suggests a reverse association from depressive symptoms to BMI, particularly among female adolescents with higher levels of depressive symptoms, who may be more likely to experience weight loss rather than weight gain (Felton et al., 2010; Stunkard et al., 2003). Importantly, current research has rarely distinguished between-person differences from within-person changes or examined these associations across the transition from adolescence to adulthood (Hamaker et al., 2015; Mannan et al., 2016a, 2016b). Further investigation is necessary to comprehensively understand this issue, considering gender as a potential moderator, given the high incidence and persistence of depressive symptoms (Needham, 2007; Yu & Zhang, 2025) and obesity in females during this transitional period (Gordon-Larsen et al., 2004).
1.3. Associations Between Alcohol Use and BMI
Clinical and experimental research suggests that alcohol intake may contribute to weight gain through its caloric content and effects on appetite and metabolism (e.g., Block, 2004; Croezen et al., 2009; Yeomans, 2010). While some longitudinal studies have shown positive associations between alcohol intake and BMI or obesity-related outcomes (e.g., French et al., 2010), others have reported inconsistent results across different sample groups (Sayon-Orea et al., 2011; Traversy & Chaput, 2015). For example, some studies have identified gender-specific patterns, suggesting that alcohol use is associated with higher BMI among men but lower BMI among women, potentially because of differences in drinking patterns and beverage choices (McCabe et al., 2023; McCarty et al., 2009). However, these studies were limited by their focus on participants with higher BMI, which may limit the generalizability of the findings. Therefore, further research with a more representative sample, covering longer developmental periods, is needed to draw broader generalizations.
Less is known about whether BMI is prospectively associated with the frequency of alcohol-use behaviors. Nonetheless, some studies suggest that individuals with higher BMI or obesity may experience weight-related bias, stigma, and discrimination, which could be associated with more frequent alcohol-use behaviors for some individuals (Puhl & Heuer, 2010). In other words, weight-related social stressors may be associated with more frequent alcohol-use behaviors over time. In addition to the lack of research, previous research also overlooked differences within individuals. Given the existing gaps, our investigation will encompass exploring potential bidirectional associations between BMI and alcohol use at both between- and within-person levels, while also examining the relation between these variables over the transitional period from adolescence to adulthood.
1.4. The Moderating Role of Gender and Race
The present research explores the potential moderating role of gender in the associations among alcohol use, BMI, and depressive symptoms. Previous studies suggest that gender may influence these relations, with some associations emerging only in one gender or differing between males and females (e.g., Danzo et al., 2017; De Wit et al., 2010; French et al., 2010; Needham, 2007). For example, the associations between depressive symptoms and binge drinking and between body weight and depressive symptoms may be stronger among females than among males (McCarty et al., 2009). Gender thus appears to play a moderating role in the links between alcohol use, BMI, and depressive symptoms, but further research is needed to clarify the exact nature and direction of this moderation. This study aims to contribute evidence to address existing gaps and inconsistencies.
The complex interplay of sociocultural, residential, and educational factors suggests that the relations between depressive symptoms, alcohol use, and BMI may manifest differently across diverse racial groups (e.g., Ali et al., 2013; Hicken et al., 2013; Pacek et al., 2012). Cultural aesthetic preferences, for example, can shape the impact of BMI on emotional well-being, yielding varied effects on depressive symptoms among women from different racial backgrounds, thereby unveiling racial disparities in this context (Ali et al., 2013; Hicken et al., 2013). Similarly, discrepancies in alcohol consumption patterns and the physiological metabolism of alcohol among different racial groups indicate potential variations in drinking behaviors and weight outcomes (Pacek et al., 2012; Palzes et al., 2024). Furthermore, prior research has consistently demonstrated that white college students exhibit the highest rates of alcohol consumption (Ranker & Lipson, 2022). Supporting this finding, another study indicated that compared to their white peers, black college students tend to consume alcohol less frequently and in smaller quantities (Ayala Guzman et al., 2024). Considering such racial differences, it is imperative to investigate these relations while accounting for race as a crucial factor. However, current research lacks an examination of the nuances in the relations between alcohol use, BMI, and depressive symptoms across racial groups. Hence, the pursuit of such an inquiry into the racial disparities within these associations is essential.
1.5. The Present Study
Existing research suggests co-occurrence among depressive symptoms, alcohol use, and BMI, yet longitudinal studies jointly examining their bidirectional associations while distinguishing between-person differences from within-person changes remain limited. Studies based on clinical or experimental samples (e.g., Yeomans, 2010) and studies focusing on unidirectional associations (e.g., French et al., 2010) have not fully clarified these bidirectional dynamics. Findings from research focusing solely on adolescents or adults have also been inconsistent, limiting our understanding of the dynamic interplay among these variables across the transition from adolescence to adulthood. Further complicating this issue is the scarcity of research on dynamic intrapersonal processes, leaving it unclear whether observed associations reflect stable individual differences, fluctuations within individuals, or both (Hamaker et al., 2015). Therefore, our study aims to investigate the prospective bidirectional associations among depressive symptoms, alcohol use, and BMI from adolescence to adulthood at the between- and within-person levels using a nationally representative U.S. sample. We also examine whether these associations differ across four gender–racial groups—white males, white females, non-white males, and non-white females—to provide a more nuanced understanding of their patterns of co-occurrence.
We hypothesize the following:
Hypothesis 1.
There are positive bidirectional relations between depressive symptoms and alcohol use over time, both at the between-person and within-person levels.
Hypothesis 2.
There are positive bidirectional relations between depressive symptoms and BMI over time, both at the between-person and within-person levels.
Hypothesis 3.
There are positive bidirectional relations between alcohol use and BMI over time, both at the between-person and within-person levels.
Given the limited and inconsistent evidence regarding gender and racial differences, we examine whether these associations vary across the four gender–racial groups without proposing specific directional hypotheses.
2. Method
2.1. Research Paradigm and Design
This study followed a quantitative, hypothesis-testing research paradigm and used an observational, secondary-data longitudinal panel design. The design was prospective in that depressive symptoms, alcohol use, and BMI were examined across multiple waves from adolescence into adulthood. Because the study used existing survey data without manipulation or random assignment, the analyses were intended to estimate longitudinal associations rather than causal effects. Gender–racial differences were examined through a multigroup modeling strategy, as described in the analytic plan.
2.2. Participants
The present study used four-wave public-use data from the National Longitudinal Study of Adolescent to Adult Health (Add Health; Harris et al., 2009; https://addhealth.cpc.unc.edu/; accessed on 19 March 2026), a nationally representative study of U.S. adolescents in grades 7–12 at Wave 1 (W1; 1994–1995; ages 11–19). Three additional waves of data were collected in 1996 (W2; ages 12–20), 2001–2002 (W3; ages 18–26), and 2008 (W4; ages 24–32). The initial sample size was 6504, including multiple children nested within the same family, which violated the independence assumption (Yu & Zhang, 2025). Therefore, only one child from each household was included, resulting in a final analytic sample of 5734 participants (51.4% female, n = 2945). The racial breakdown was as follows: 3254 non-Hispanic white participants (56.7%), 1307 African American participants (22.8%), 283 Hispanic participants (4.9%), 35 American Indian participants (0.6%), 178 Asian participants (3.1%), and 677 participants identified as other race/ethnicity (11.8%). At baseline, 853 students attended Grade 7 (14.9%), 880 attended Grade 8 (15.3%), 969 attended Grade 9 (16.9%), 1017 attended Grade 10 (17.7%), 984 attended Grade 11 (17.2%), and 880 attended Grade 12 (15.3%). Median household income in 1994 was $45,000 (SD = 48,862), and 86.9% and 89.7% of parents had completed high school or more. Race and gender were categorized into four groups for the multigroup analyses: white male, white female, non-white male, and non-white female.
2.3. Ethical Considerations
The original Add Health study was approved by the Institutional Review Board at the University of North Carolina at Chapel Hill, and informed consent was obtained during the original data collection (including parental permission for minors where applicable). The present study obtained access to the public-use dataset through the official Add Health data distribution process and conducted all analyses in accordance with the applicable data-use agreement. To safeguard participant confidentiality, analyses were conducted using de-identified public-use data only; no direct identifiers were available to the authors, no attempts were made to identify individual participants, and all findings are reported in aggregate form. Because the present study involved secondary analysis of de-identified public-use data, no additional ethical approval or informed consent was required.
2.4. Measures
2.4.1. Depressive Symptoms
At each wave, participants responded to nine items from the Center for Epidemiologic Studies Depressive Symptoms Scale (CES-D; Radloff, 1977), such as “You felt depressed.” Responses ranged from 0 (never or rarely) to 3 (most of the time or all of the time). Positively worded items were reverse-coded so that higher scores indicated greater depressive symptoms. To maintain consistency across the four waves, the nine items administered at every wave were averaged. Scores were treated dimensionally and were not used to determine diagnostic status. Cronbach’s alpha values ranged from 0.73 to 0.84 across groups and waves.
2.4.2. Alcohol Use
Alcohol use was assessed at each wave using three items capturing the past-year frequency of drinking, heavy episodic drinking, and alcohol intoxication. Participants reported: “During the past 12 months, on how many days did you drink alcohol?”; “Over the past 12 months, on how many days did you drink five or more drinks in a row?”; and “Over the past 12 months, on how many days have you gotten drunk or very, very high on alcohol?” Responses ranged from 1 (never) to 7 (every day or almost every day) and were averaged to create an alcohol-use frequency score, with higher scores indicating more frequent engagement in the assessed alcohol-use behaviors. The items were combined to index the overall frequency of engagement in these behaviors rather than distinct dimensions of alcohol consumption or alcohol-related harm. The measure did not assess typical drinking quantity, total alcohol volume, alcohol-related consequences, or diagnostic criteria for alcohol use disorder. Cronbach’s alpha values ranged from 0.81 to 0.90 across groups and waves.
2.4.3. BMI
Participants self-reported their height and weight. BMI was calculated as: weight in pounds/height in inches squared × 703. For better interpretability in longitudinal data, raw BMI was used (Berkey & Colditz, 2007; Cole et al., 2005).
2.5. Analytic Plan
Consistent with the longitudinal multigroup design, we first calculated descriptive statistics and bivariate correlations for the study variables. A multigroup CLPM was then performed, followed by a multigroup RI-CLPM, to test whether the longitudinal interrelations among depressive symptoms, alcohol use, and BMI differed across gender–racial groups. Missing data ranged from 0.3% for W1 depressive symptoms to 68.1% for W2 alcohol use, with an average missingness rate of 29.7% across study variables. Missing data were addressed using multiple imputations. The imputation model included the variables used in the substantive analyses, including depressive symptoms, alcohol use, and BMI across W1 through W4, gender–racial group membership, family socioeconomic indicators, and baseline grade level. Family socioeconomic status (SES) was represented by household income and parental education. Baseline grade level was included because it reflected participants’ developmental stage at W1 and was relevant to longitudinal participation patterns. The inclusion of repeated measures of the focal study variables, demographic grouping information, and family socioeconomic indicators was intended to preserve the longitudinal and between-group associations examined in the CLPM and RI-CLPM. We generated 50 imputed datasets, consistent with methodological guidance suggesting that larger numbers of imputations may be needed to obtain stable standard errors and replicable inferences when missingness is moderate to high (von Hippel, 2020; White et al., 2011). The same analytic models were estimated in each imputed dataset, and parameter estimates were pooled across imputations. The multiple-imputation procedure assumed that data were missing at random, such that the probability of missingness could be accounted for by the observed variables included in the imputation model (Enders, 2010; Rubin, 1987). As a model-specification robustness check, we estimated alternative CLPM and RI-CLPM that included a latent family SES factor indicated by household income and parental education. We also compared models with and without lag-2 autoregressive paths. We tested unconstrained models in which all structural paths were freely estimated across the four groups and then constrained models in which equality constraints were placed on all paths across groups for both the CLPM and the RI–CLPM. A chi-square difference test between these two nested models was employed to evaluate group differences. A significant chi-square difference test suggested at least one constrained path was unequal across groups; in such cases, we investigated which specific parameters differed by freeing individual paths across groups one at a time until the chi-square difference test between the unconstrained and partially constrained models was no longer significant. We conducted an additional sensitivity analysis to examine whether the results were robust to missing-data patterns by comparing participants with complete data and participants with missing data. All analyses used AMOS. Model fit was evaluated using the chi-square test, the comparative fit index (CFI > 0.95), standardized root mean square residual (SRMR < 0.05), and the root mean square error of approximation (RMSEA < 0.06) (Hu & Bentler, 1999). Effect sizes for standardized cross-lagged paths were regarded as small (0.03), medium (0.07), and large (0.12) (Orth et al., 2024).
3. Results
Table 1 presents descriptive statistics and bivariate correlations separately for white and non-white groups. Depressive symptoms, alcohol use, and BMI were generally positively correlated across measurement waves within each construct, with the strongest longitudinal stability observed for BMI and moderate stability observed for depressive symptoms. Concurrent correlations between depressive symptoms and alcohol use were generally small and positive, whereas correlations involving BMI were mostly small or nonsignificant.
Table 1.
Descriptive statistics and bivariate correlations for the study variables.
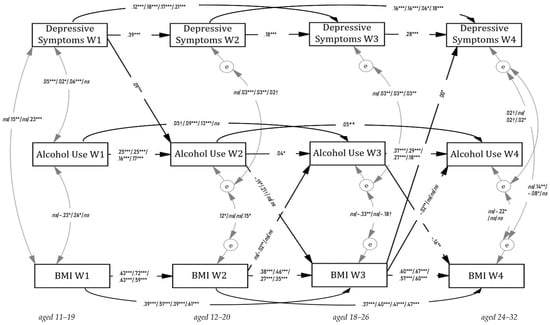
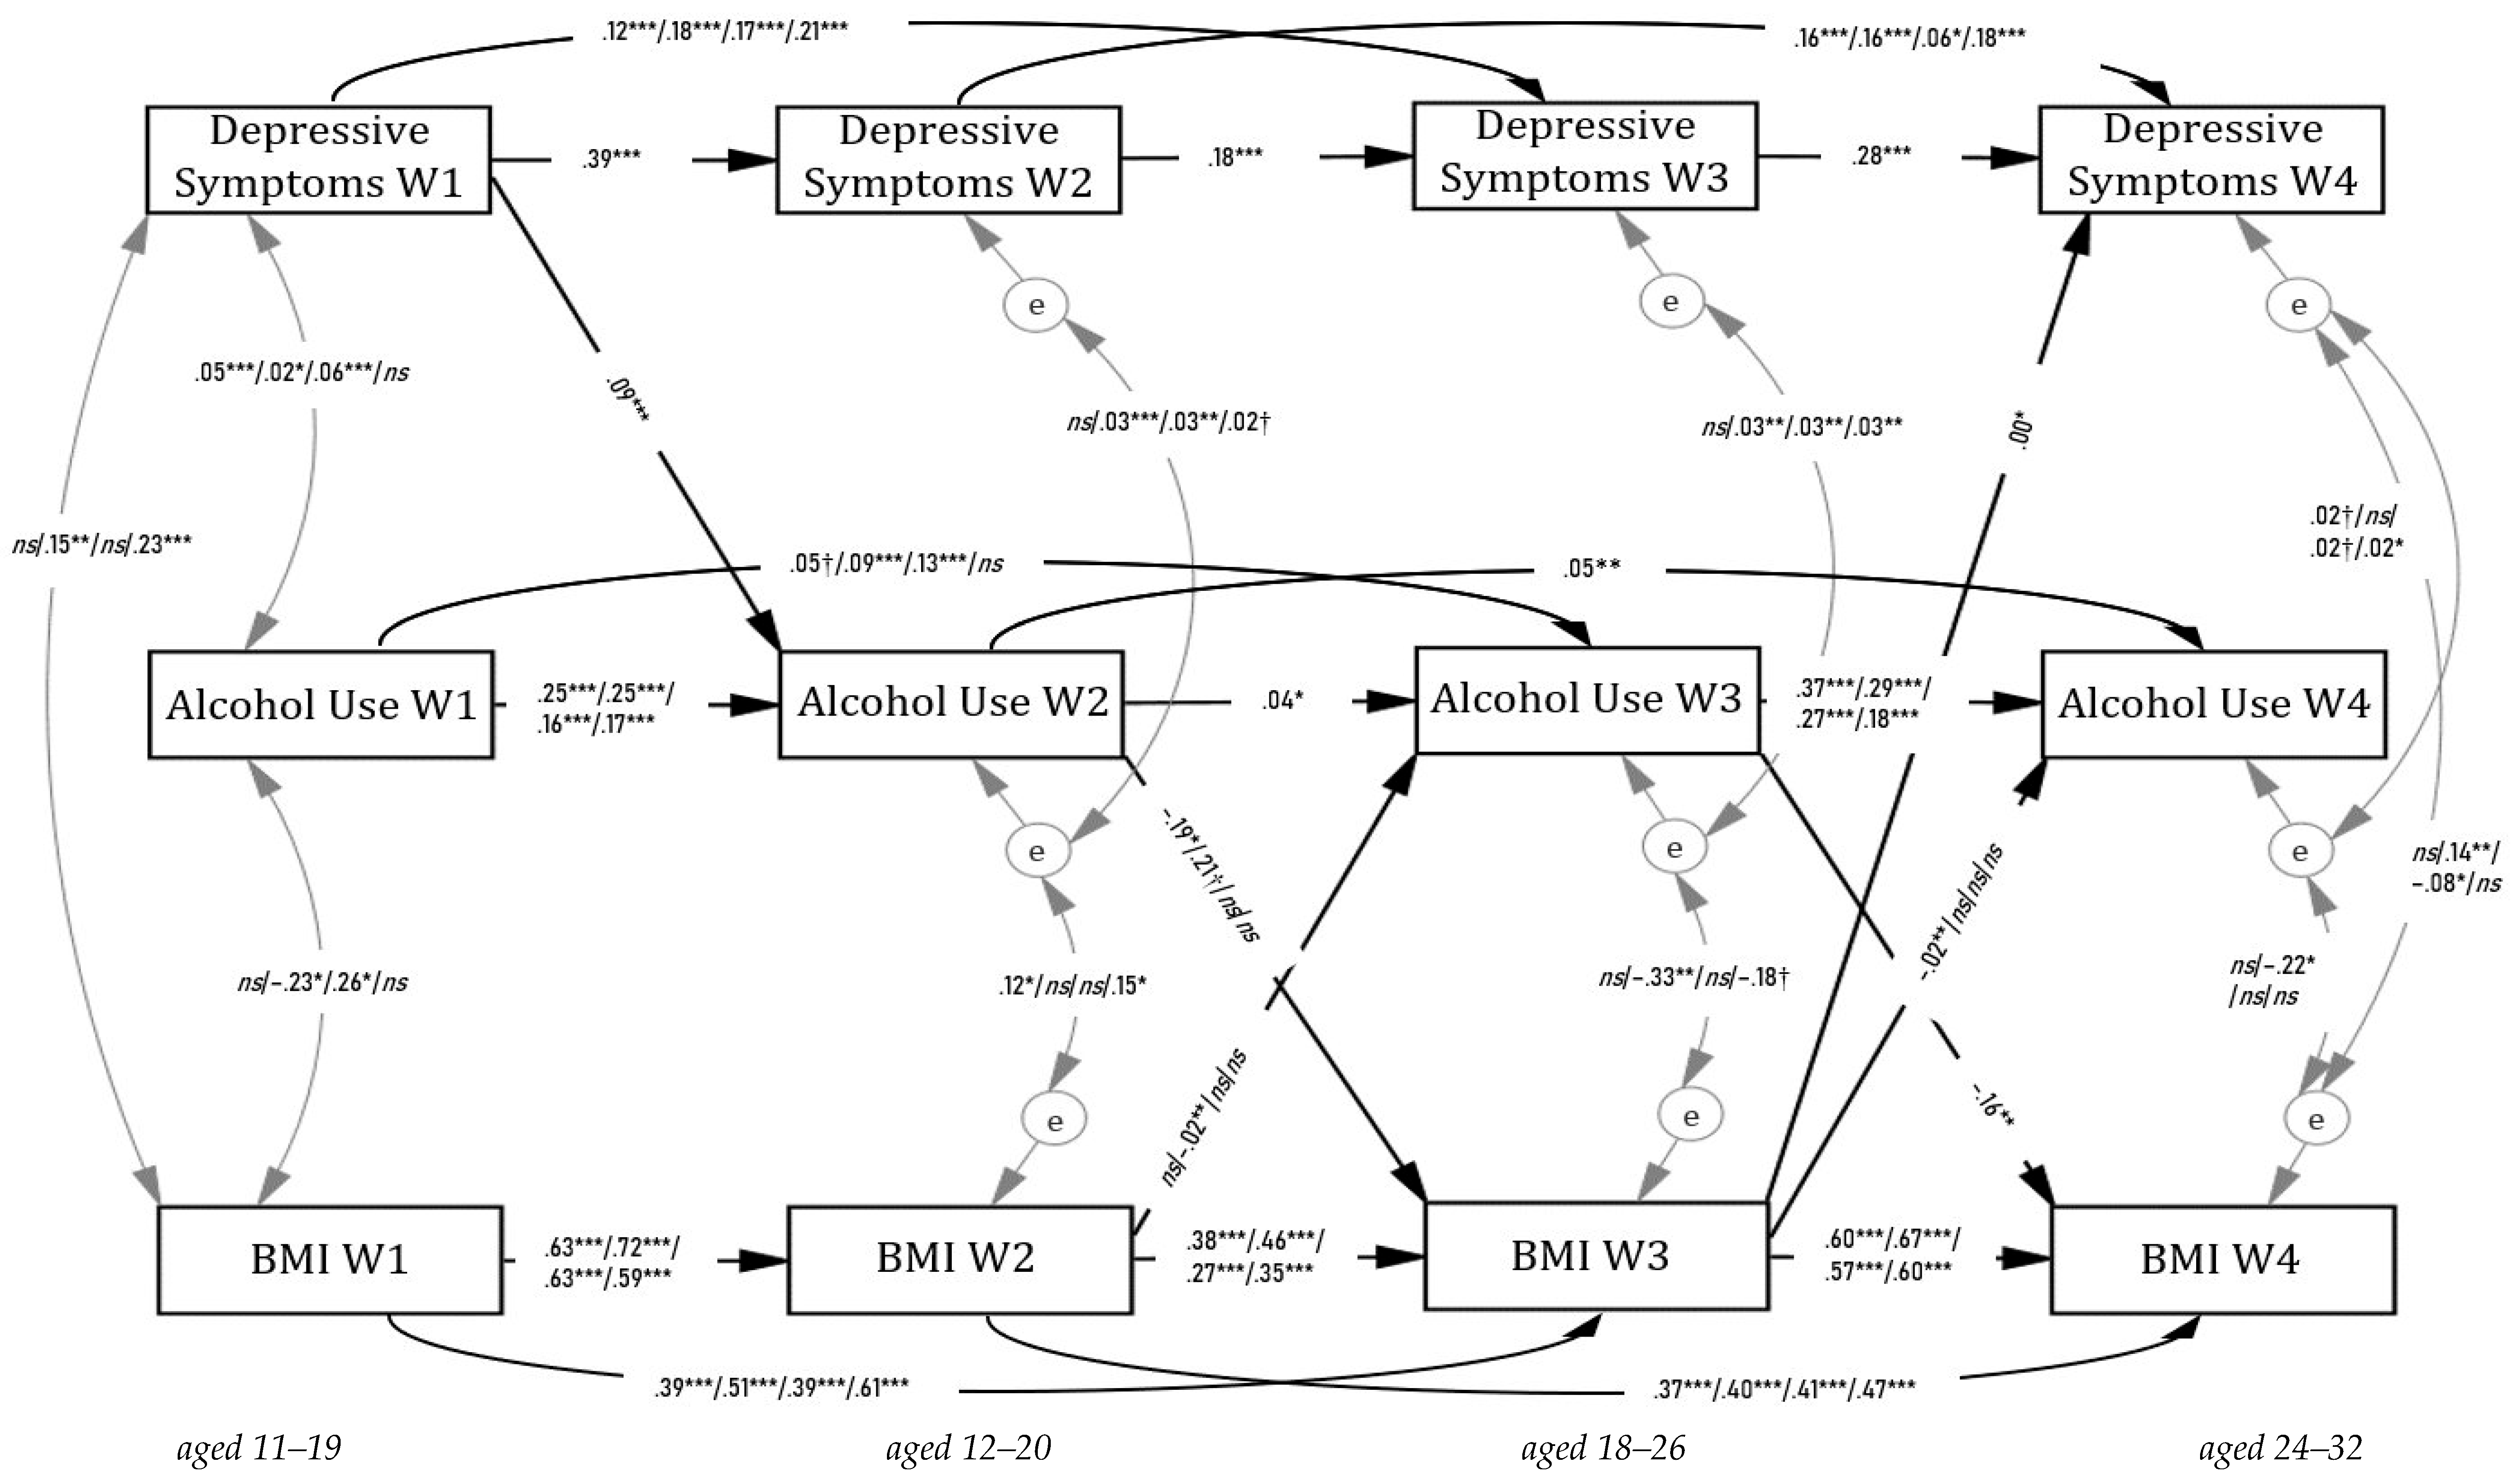
As part of the model-specification robustness checks, we first tested a CLPM in which the baseline study variables were regressed on a latent family SES factor indicated by household income and parental education. Given that the model fit was worse than that of a CLPM without the SES covariate, subsequent CLPM analyses were conducted without the SES latent variable. For the primary multigroup CLPM, both the unconstrained model, χ2(84) = 491.89, p < 0.001; CFI = 0.974; SRMR = 0.023; RMSEA = 0.029, 90% CI = 0.027, 0.032, and the fully constrained model, χ2(183) = 836.85, p < 0.001; CFI = 0.958; SRMR = 0.034; RMSEA = 0.025, 90% CI = 0.023, 0.027, demonstrated adequate model fit. However, the chi-square difference test comparing the unconstrained and constrained models was significant, Δχ2(99) = 344.96, p < 0.001, suggesting that at least some structural paths differed across gender–racial groups. Accordingly, we identified group-varying paths by removing equality constraints one at a time. The final partially constrained CLPM fit the data well, χ2(141) = 557.98, p < 0.001; CFI = 0.973; SRMR = 0.027; RMSEA = 0.023, 90% CI = 0.021, 0.025, and did not differ significantly from the unconstrained model, Δχ2(57) = 66.09, ns (see Figure 1).
Figure 1.
Cross-lagged panel model of depressive symptoms, alcohol use, and BMI. Note. Estimates are unstandardized (white male/white female/non-white male/non-white female). Nonsignificant paths and covariances are not shown for parsimony. † p < 0.10. * p < 0.05. ** p < 0.01. *** p < 0.001.
All lag-1 autoregressive paths were significant, although they varied across groups except for depressive symptoms (β = 0.03 to 0.76, SE = 0.01 to 0.04, ps < 0.05 to 0.001). Similarly, significant lag-2 autoregressive effects were found for all the variables (β = 0.04 to 0.40, SE = 0.02 to 0.04, ps < 0.05 to 0.001) except for alcohol use from W1 to W3 among white males and non-white females. Overall, the CLPM results suggested significant rank-order stability in depressive symptoms, alcohol use, and BMI from adolescence to adulthood, with some evidence that these stability patterns differed across gender–racial groups.
Cross-lagged effects in the CLPM showed that higher depressive-symptom scores at W1 were positively associated with higher alcohol-use scores at W2 across all groups, with small-to-medium effect sizes (β = 0.04 to 0.06, SE = 0.02, p < 0.001). Alcohol use and BMI showed negative bidirectional associations from W2 to W4 (β = −0.02 to −0.10, SE = 0.01 to 0.08, ps < 0.05 to 0.001), although these patterns were not fully consistent across gender–racial groups. These significant cross-lagged associations were small to medium in magnitude. Higher BMI at W3 was associated with higher depressive-symptom scores at W4 across groups, although the effect sizes were small (β = 0.02 to 0.03, SE = 0.00, p < 0.05). Overall, all significant cross-lagged paths in the CLPM model showed small to medium effect sizes.
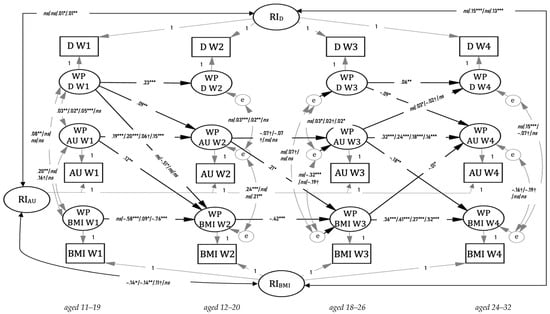
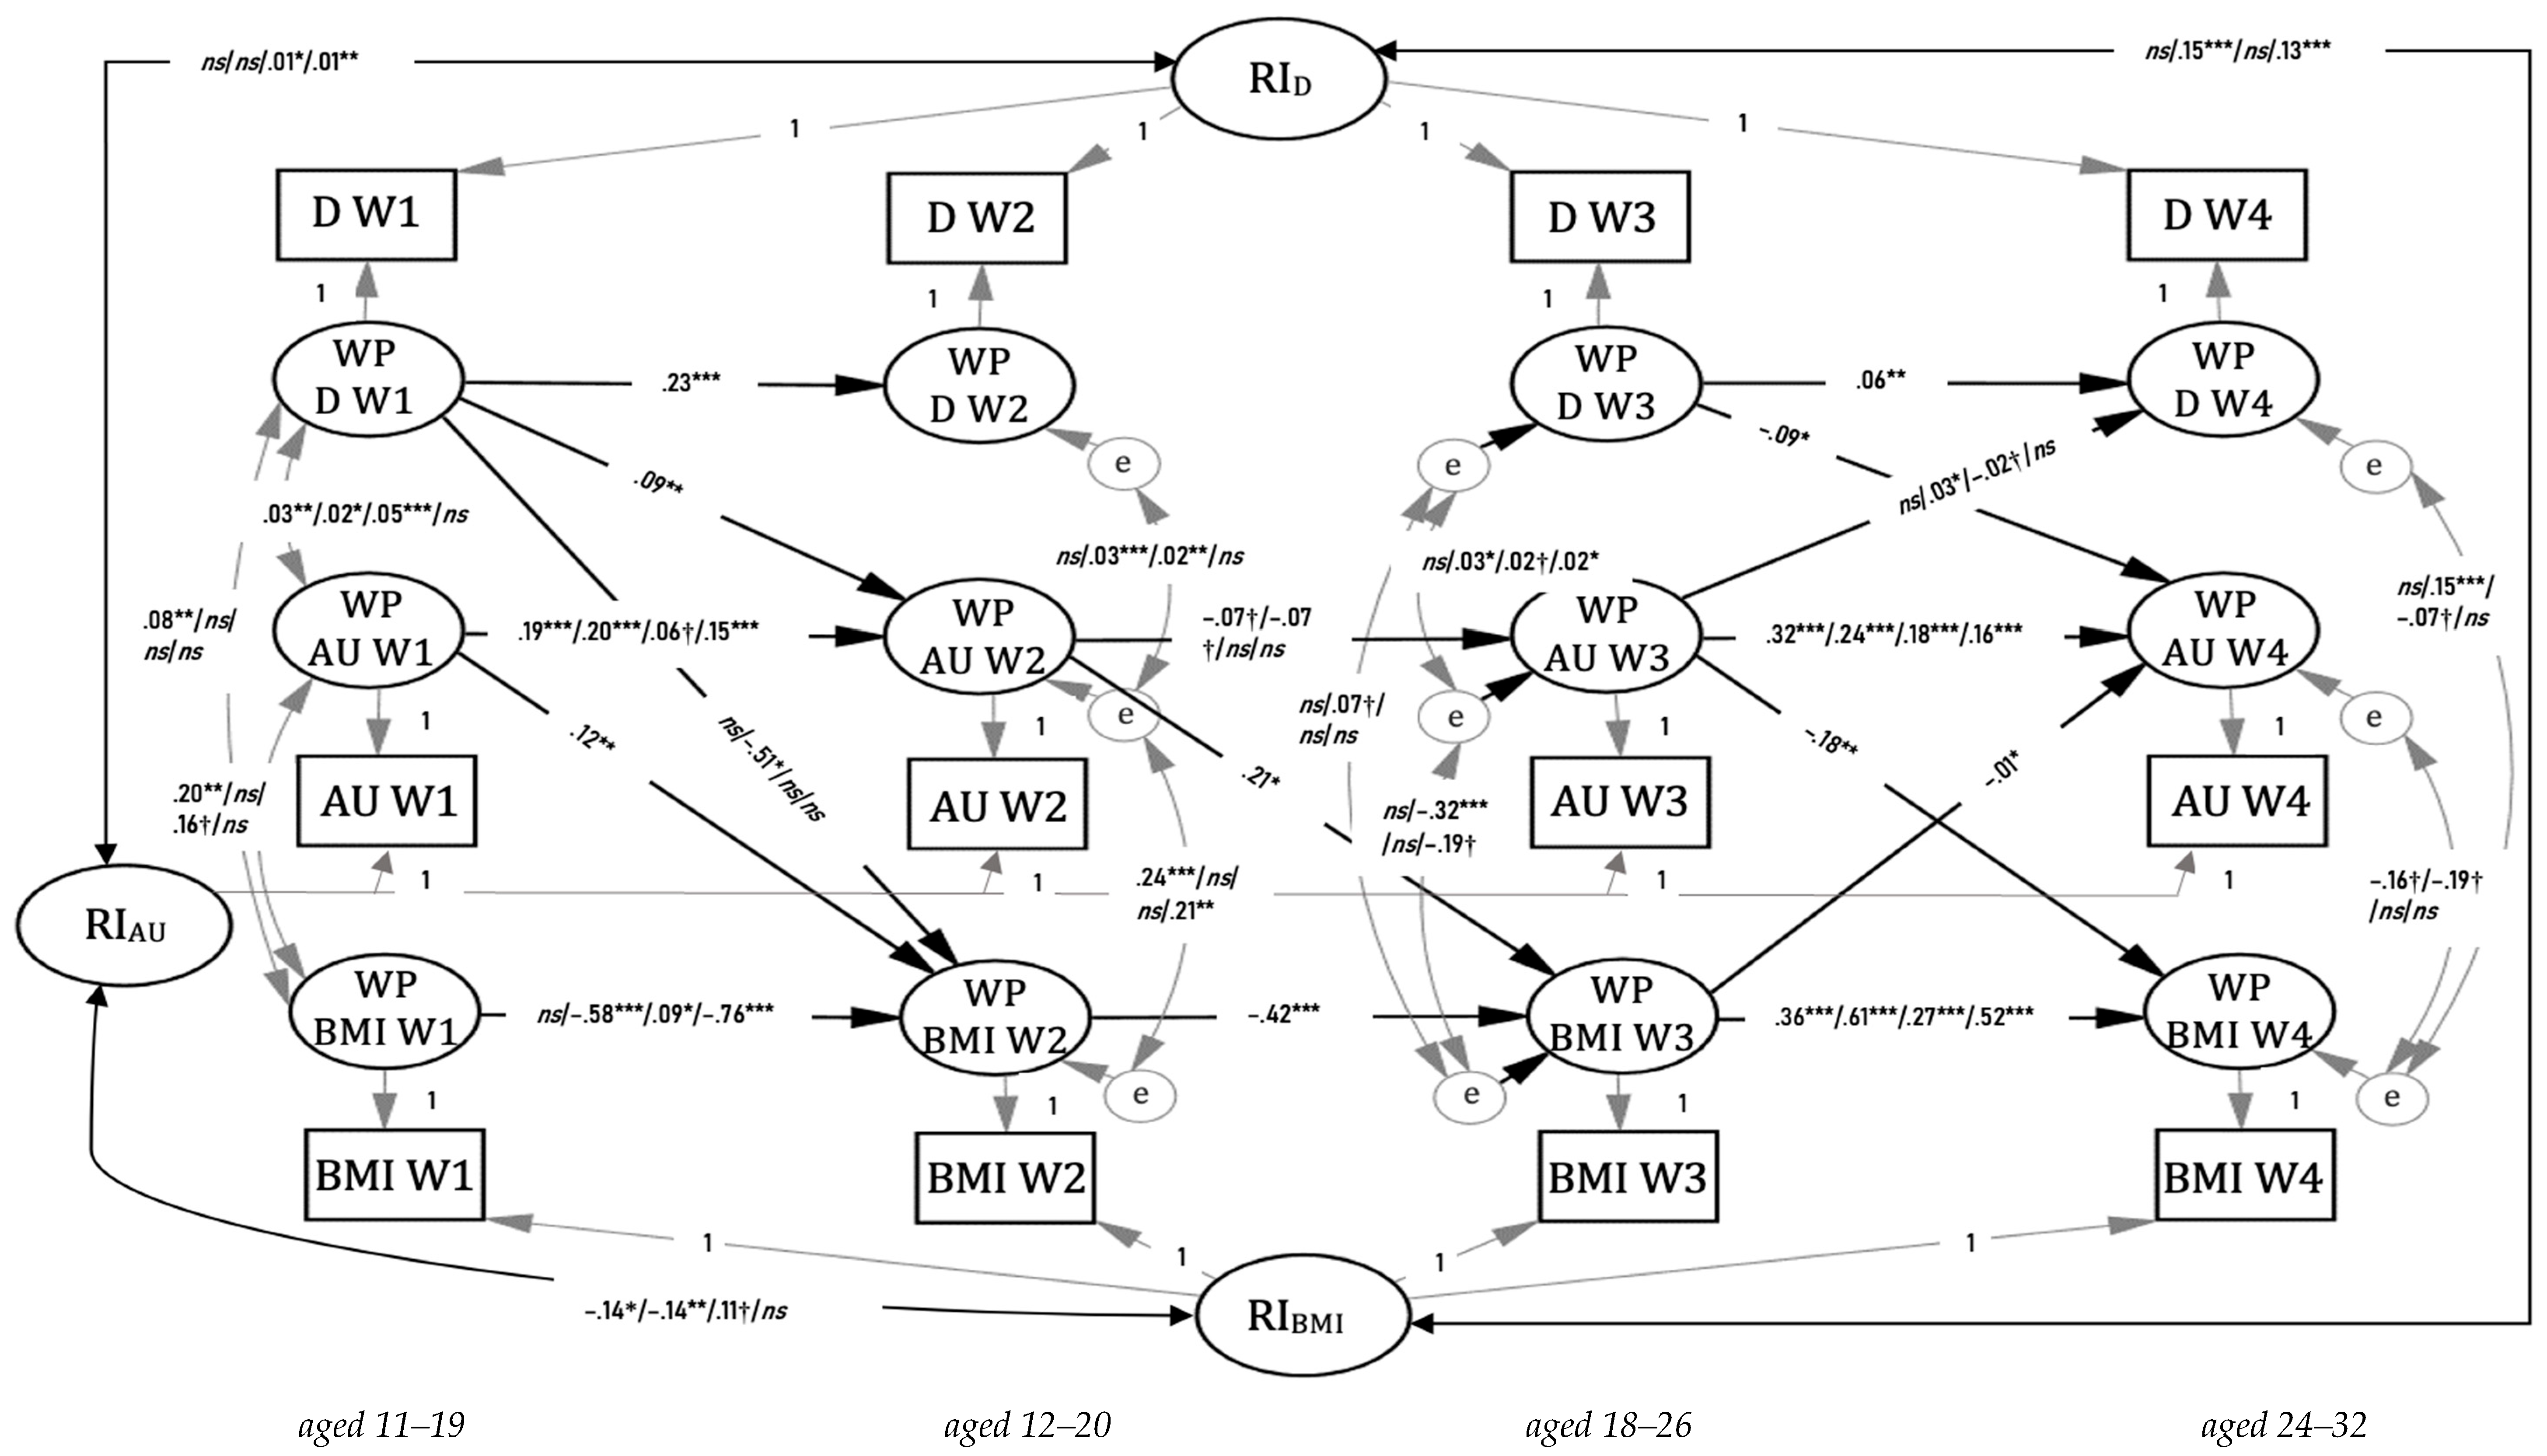
We next evaluated alternative RI-CLPM specifications with and without the family SES covariate and with alternative autoregressive structures. The RI-CLPM without the SES covariate and without lag-2 autoregressive paths provided better fit and was therefore retained as the primary RI-CLPM. In this model, cross-lagged and stability paths were freely estimated across groups. The unconstrained RI-CLPM fit the data well, χ2(84) = 258.65, p < 0.001; CFI = 0.989; SRMR = 0.019; RMSEA = 0.019, 90% CI = 0.016, 0.022. Because the fully constrained model showed significantly worse fit: χ2(165) = 506.15, p < 0.001; CFI = 0.978; SRMR = 0.025; RMSEA = 0.019, 90% CI = 0.017, 0.021, Δχ2(81) = 247.49, p < 0.001, we retained the partially constrained RI-CLPM: χ2(144) = 322.401, p < 0.001; CFI = 0.988; SRMR = 0.023; RMSEA = 0.015, 90% CI = 0.013, 0.017, Δχ2(60) = 63.75, ns (see Figure 2).
Figure 2.
Random intercept cross-lagged panel model of depressive symptoms (D), alcohol use (AU), and BMI. Note. RI = random intercept; WP = within-person. Estimates are unstandardized (white male/white female/non-white male/non-white female). Nonsignificant paths and covariances are not shown for parsimony. † p < 0.10. * p < 0.05. ** p < 0.01. *** p < 0.001.
In the RI-CLPM, the within-person autoregressive paths for depressive symptoms were significant from W1 to W2 (β = 0.25 to 0.27, SE = 0.02, p < 0.001) and from W3 to W4 (β = −0.06, SE = 0.02, p < 0.01), indicating within-person carry-over effects where those who reported higher-than-their-average levels of depressive symptoms at one occasion tended to report greater-than-their-average levels of depressive symptoms at a subsequent occasion. The within-person autoregressive paths from W1 alcohol use to W2 alcohol use (β = 0.07 to 0.22, SE = 0.03, ps < 0.001) and from W3 alcohol use to W4 alcohol use (β = 0.16 to 0.31, SE = 0.03 to 0.04, ps < 0.001) were also significant and positive, although the paths varied across the gender–racial groups. Likewise, autoregressive effects of BMI varied across subgroups over time. Specifically, females, regardless of race, who had elevated BMI at W1 tended to report lower-than-usual BMI at W2 relative to their own average BMI. In contrast, the opposite pattern was observed among non-white males. Deviations from person-specific means in BMI at W2 and W3 were negatively (β = −0.12 to −0.34, SE = 0.06, p < 0.001) and positively (β = 0.20 to 0.46, SE = 0.03 to 0.05, ps < 0.001) associated with deviations from the same construct at the subsequent timepoints, respectively.
For within-person cross-lagged association, depressive symptoms at W1 were positively associated with alcohol use at W2 (β = 0.04 to 0.05, SE = 0.03, p < 0.01), whereas depressive symptoms at W2 were negatively associated with alcohol use at W4 (β = −0.03 to −0.04, SE = 0.04, p < 0.05). These effects ranged from small to medium in magnitude. This pattern suggests that when youth reported higher-than-usual depressive-symptom levels at W1, they subsequently reported higher-than-usual alcohol-use scores at W2. However, the opposite pattern emerged from W3 to W4. The positive within-person cross-lagged association from W3 alcohol-use scores to W4 depressive-symptom levels was found only among white females with a small effect size (β = 0.06, SE = 0.01, p < 0.05), suggesting that white females who reported higher-than-usual alcohol-use scores at W3 subsequently reported higher-than-usual depressive-symptom levels at W4. The within-person cross-lagged path from W1 depressive-symptom levels to W2 BMI was negative and significant only among white females (β = −0.19, SE = 0.23, p < 0.05). No within-person cross-lagged paths from BMI to depressive symptoms were significant at any measurement occasion. Alcohol use at W1 and W2 was positively associated with BMI at W2 (β = 0.05 to 0.10, SE = 0.05, p < 0.01) and W3 (β = 0.04 to 0.07, SE = 0.10, p < 0.05), respectively. The negative bidirectional cross-lagged associations between alcohol use and BMI were observed from W3 to W4 (β = −0.02 to −0.05, SE = 0.06 or 0.00, p < 0.01 or 0.05). Except for the large effect size between W1 depressive symptoms and W2 BMI among white females, all other effect sizes were either small or small-to-medium in magnitude.
At the between-person level, the random intercepts for depressive symptoms and alcohol use were positively correlated among non-white participants (β = 0.19 or 0.42, SE = 0.01, ps < 0.05 or 0.01). By contrast, the random intercepts for alcohol use and BMI were negatively correlated only among white participants (β = −0.14, SE = 0.06 or 0.05, ps < 0.05 or 0.01). In addition, the random intercepts for depressive symptoms and BMI were positively correlated among female participants (β = 0.17 or 0.13, SE = 0.03 or 0.04, ps < 0.001).
To assess whether the findings were robust to missing-data patterns, we conducted a sensitivity analysis comparing participants with complete data and participants with one or more missing values. Participants with complete data tended to show stronger cross-time stability in the CLPM and stronger within-person autoregressive effects in the RI-CLPM than participants with missing data. In the CLPM, the cross-lagged path from W3 depressive-symptom scores to W4 BMI was nonsignificant in the primary analysis but became positive and significant in the sensitivity analysis, although the effect size was small (β = 0.02, SE = 0.13, p < 0.05). No other substantive differences were found in the alternative CLPM. In the RI-CLPM, the within-person cross-lagged path from W3 depressive-symptom levels to W4 alcohol-use scores was negative and significant in the primary analysis but was not significant in the sensitivity analysis. All other associations remained similar to those observed in the primary analysis. Overall, the sensitivity analyses suggested that the substantive conclusions were generally robust to missing-data patterns, although complete-data participants showed somewhat stronger autoregressive stability and a small number of paths differed in statistical significance.
4. Discussion
The present study examined the bidirectional associations among the frequency of the assessed alcohol-use behaviors, BMI, and depressive symptoms while distinguishing between-person differences from within-person changes from adolescence into adulthood; overall, the observed associations did not demonstrate a consistent bidirectional pattern but varied by developmental period, level of analysis, gender, and race. This investigation utilized four waves of data from a nationally representative sample spanning adolescence to adulthood. Data were collected from grades 7–12 (W1) through ages 24–32 (W4), allowing for analyses of changes in all three variables across significant developmental periods. This study extends existing knowledge by providing new insights into the longitudinal associations between depressive symptoms, alcohol use, and BMI. Gender and race further contributed to a nuanced understanding of these associations, as some cross-lagged relations were more pronounced among white males at the between-person level and among white females at the within-person level than among other groups. Overall, the present findings offer valuable insights and underscore the importance of tailored interventions that consider developmental stage, between-person and within-person processes, gender, and race, thereby extending previous research.
Hypothesis 1 received partial support. During adolescence, higher depressive-symptom levels were associated with higher subsequent alcohol-use scores at both the between-person and within-person levels. This association may be consistent with coping-related explanations of alcohol use (e.g., Hussong et al., 2017), although drinking motives were not measured and this explanation could not be tested directly. In the reverse direction, higher-than-usual W3 alcohol-use scores were associated with higher-than-usual W4 depressive-symptom levels, but only among white females (Colder et al., 2019; Groenman et al., 2017; Hussong et al., 2017). Contrary to Hypothesis 1, young adults who reported higher-than-usual depressive-symptom levels at W3 tended to report lower-than-usual alcohol-use scores at W4. The mechanisms underlying this unexpected association remain unclear and warrant further investigation.
Hypothesis 2 received limited support. In the CLPM, higher BMI at W3 was associated with higher depressive-symptom levels at W4 across all gender–racial groups, consistent with previous research (Faith et al., 2011; Milaneschi et al., 2019). However, no significant within-person associations from BMI to subsequent depressive symptoms were found. Moreover, among white females, higher-than-usual depressive-symptom levels at W1 were associated with lower-than-usual BMI at W2, contrary to the hypothesized positive association. This finding may be consistent with previous research suggesting that some adolescent girls with elevated depressive symptoms experience appetite loss or engage in restrictive eating (Blaine, 2008; Felton et al., 2010; Stunkard et al., 2003). However, appetite and eating behaviors were not measured in the present study, precluding direct examination of this potential explanation. Overall, the associations between depressive symptoms and BMI varied by developmental period, level of analysis, and gender–racial group rather than demonstrating a consistent positive bidirectional pattern.
Hypothesis 3 received partial support. From adolescence through young adulthood, higher-than-usual alcohol-use scores were associated with higher subsequent BMI. One possible explanation is that more frequent drinking, particularly heavy episodic drinking, may contribute additional caloric intake (French et al., 2010). However, because neither total alcohol volume nor caloric intake was measured, this explanation could not be tested directly. The direction of the associations changed in adulthood: higher-than-usual alcohol-use scores were associated with lower subsequent BMI, and higher-than-usual BMI was associated with lower subsequent alcohol-use scores. A similar pattern emerged at the between-person level: individuals reporting higher alcohol-use scores than others tended to have lower subsequent BMI, and those with higher BMI than others tended to report lower subsequent alcohol-use scores. These findings are consistent with prior research reporting heterogeneous associations between alcohol use and BMI (e.g., Sayon-Orea et al., 2011) and suggest that these associations may vary according to developmental stage, drinking patterns, and individual characteristics. Some of these associations were more pronounced among white participants, particularly white males (Pacek et al., 2012). Racial differences appear to play a crucial role in the bidirectional interplay between alcohol use and BMI in between-person differences (Pacek et al., 2012), whereas no such racial differences seem to matter in within-person processes. Given the limited research in this area, further scholarly efforts should be devoted to uncovering the reciprocal dynamics between alcohol use and BMI.
Across gender–racial groups, alcohol-use scores and BMI showed greater variation in rank-order and within-person stability over time than depressive-symptom levels. Specifically, both rank-order and within-person stability in alcohol-use scores were greater among white participants than among non-white participants (Pacek et al., 2012; Palzes et al., 2024; Ranker & Lipson, 2022). Females showed greater BMI stability than males at both interpersonal and intrapersonal levels, reflecting their heightened sensitivity to weight (e.g., Gordon-Larsen et al., 2004). These novel findings have the potential to enlighten future researchers and prompt them to re-examine this complex issue, taking into account gender, race, developmental stages, and fluctuations within and between individuals.
4.1. Limitations and Future Directions
Some limitations should be acknowledged. First, due to limited representation in non-white categories, the analyses were conducted using only two broad racial groups: white and non-white. Thus, future research should incorporate detailed racial categories to analyze and comprehend nuanced differences in this area. Second, while the current study involved four data waves, the intervals between W2 and W3 and between W3 and W4 were approximately six years each, which might contribute to small-to-medium effect sizes in most cross-lagged relations. Future research would greatly benefit from increasing the frequency of data collection, enabling a more in-depth exploration of the dynamics among the study variables. Third, given the disparities in optimal BMI across gender, age, and race, the application of standard BMI guidelines for weight assessment in this study was not straightforward. Future research would benefit from utilizing gender-, age-, and race-specific BMI guidelines for more precise evaluation across populations. The exploration of alternative indicators of body composition and adiposity, accounting for these variations, could enhance the precision of weight assessment. Finally, depressive symptoms and alcohol use were assessed using dimensional self-report measures. The depressive symptom measure was not used to determine whether participants met diagnostic criteria for a depressive disorder. The alcohol-use measure was operationalized as a composite of the past-year frequency of drinking, heavy episodic drinking, and alcohol intoxication. The measure did not assess typical drinking quantity, total alcohol volume, alcohol-related consequences, or diagnostic criteria for alcohol-use disorder. Accordingly, the findings should be interpreted as reflecting depressive symptom levels and the frequency of the assessed alcohol-use behaviors, rather than depressive disorders, total alcohol consumption, alcohol-related impairment, or alcohol-use disorder. Future research could examine drinking frequency, typical drinking quantity, patterns of use, and alcohol-related consequences separately to determine whether these dimensions have different longitudinal associations with depressive symptoms and BMI.
4.2. Implications
Some practical implications should be noted. First, the findings suggest that adolescents who report higher depressive-symptom levels than others or relative to their own usual levels may be more likely to report higher subsequent alcohol-use scores. Thus, it is important for practitioners, caregivers, and families to support adolescents in developing healthier coping strategies, such as physical activity, social support, or mental health services. Second, adolescents and young adults who report higher-than-usual alcohol-use scores may also be more likely to show subsequent increases in BMI, suggesting that health practitioners may consider the frequency and pattern of alcohol-use behaviors as part of broader physical-health assessments during this developmental period (Block, 2004; Croezen et al., 2009; Yeomans, 2010). Third, given that higher BMI at W3 was associated with higher subsequent depressive-symptom levels in the CLPM, practitioners may benefit from attending to depressive symptoms among adults across the BMI distribution while avoiding stigmatizing assumptions about body weight. Finally, based on the current findings that white participants tended to exhibit greater stability in alcohol-use scores than other racial groups and that females display greater stability in BMI than males, prevention and intervention efforts may benefit from considering developmental stage, gender, and race.
4.3. Conclusions
By analyzing a nationally representative longitudinal sample and distinguishing between-person differences from within-person changes, this study provides a nuanced understanding of the prospective associations among depressive symptoms, BMI, and the frequency of the assessed alcohol-use behaviors from adolescence into adulthood. Interestingly, no consistent bidirectional associations emerged over time; rather, the observed associations varied by race, developmental stage, and gender. Nevertheless, the findings suggest that adolescents with higher depressive-symptom levels than their peers, adults with higher BMI than their peers, and individuals who reported more frequent engagement than usual in the assessed alcohol-use behaviors from adolescence through young adulthood may be at heightened risk for subsequent physical or psychological difficulties. With its novel findings, this study serves as a crucial starting point, highlighting numerous avenues for future research on these important yet underexplored issues.
Author Contributions
Conceptualization, J.J.Y.; methodology, X.M. and J.J.Y.; software, J.J.Y.; validation, X.M. and J.J.Y.; formal analysis, J.J.Y.; investigation, X.M. and J.J.Y.; resources, X.M. and J.J.Y.; data curation, X.M. and J.J.Y.; writing—original draft preparation, X.M. and J.J.Y.; writing—review and editing, J.J.Y.; visualization, X.M. and J.J.Y.; supervision, J.J.Y. All authors have read and agreed to the published version of the manuscript.
Funding
This research received no external funding.
Institutional Review Board Statement
Ethical review and approval were waived for this study because it involved secondary analysis of de-identified public-use data from the National Longitudinal Study of Adolescent to Adult Health (Add Health). The dataset contained no direct participant identifiers; no attempts were made to identify individual participants; and all findings are reported in aggregate form. The original Add Health study was approved by the Institutional Review Board at the University of North Carolina at Chapel Hill.
Informed Consent Statement
Informed consent was obtained from all subjects involved in the original Add Health study, including parental permission for minors where applicable. No additional informed consent was required for the present secondary analysis of de-identified public-use data.
Data Availability Statement
Publicly available datasets were analyzed in this study. The data are available from the National Longitudinal Study of Adolescent to Adult Health (Add Health) through its official public-use data distribution channels, subject to the applicable terms of use, accessed on 19 March 2026.
Conflicts of Interest
The authors declare no conflict of interest.
References
- Ali, M. M., Rizzo, J. A., & Heiland, F. W. (2013). Big and beautiful? Evidence of racial differences in the perceived attractiveness of obese females. Journal of Adolescence, 36, 539–549. [Google Scholar] [CrossRef] [Scilit] [PubMed]
- Ayala Guzman, R., Bolts, O. L., Shipley, J. L., Strowger, M., Prince, M. A., & Braitman, A. L. (2024). A cross-sectional examination of race, gender, and intersectionality on protective behavioral strategies and alcohol outcomes among Black and White college students. Experimental and Clinical Psychopharmacology. Advance online publication. [Google Scholar] [CrossRef] [Scilit] [PubMed]
- Berkey, C. S., & Colditz, G. A. (2007). Adiposity in adolescents: Change in actual BMI works better than change in BMI z score for longitudinal studies. Annals of Epidemiology, 17, 44–50. [Google Scholar] [CrossRef] [Scilit] [PubMed]
- Blaine, B. (2008). Does depression cause obesity? A meta–analysis of longitudinal studies of depression and weight control. Journal of Health Psychology, 13, 1190–1197. [Google Scholar] [CrossRef] [Scilit] [PubMed]
- Block, G. (2004). Foods contributing to energy intake in the US: Data from NHANES III and NHANES 1999–2000. Journal of Food Composition and Analysis, 17, 439–447. [Google Scholar] [CrossRef] [Scilit]
- Colder, C. R., Lee, Y. H., Frndak, S., Read, J. P., & Wieczorek, W. F. (2019). Internalizing symptoms and cannabis and alcohol use: Between– and within–person risk pathways with coping motives. Journal of Consulting and Clinical Psychology, 87, 629–644. [Google Scholar] [CrossRef] [Scilit] [PubMed]
- Cole, T. J., Faith, M. S., Pietrobelli, A., & Heo, M. (2005). What is the best measure of adiposity change in growing children: BMI, BMI %, BMI z-score or BMI centile? European Journal of Clinical Nutrition, 59, 419–425. [Google Scholar] [CrossRef] [Scilit] [PubMed]
- Croezen, S., Visscher, T. L. S., ter Bogt, N. C. W., Veling, M. L., & Haveman-Nies, A. (2009). Skipping breakfast, alcohol consumption and physical inactivity as risk factors for overweight and obesity in adolescents: Results of the E–MOVO project. European Journal of Clinical Nutrition, 63, 405–412. [Google Scholar] [CrossRef] [Scilit] [PubMed]
- Danzo, S., Connell, A. M., & Stormshak, E. A. (2017). Associations between alcohol–use and depression symptoms in adolescence: Examining gender differences and pathways over time. Journal of Adolescence, 56, 64–74. [Google Scholar] [CrossRef] [Scilit] [PubMed]
- De Wit, L., Luppino, F., van Straten, A., Penninx, B., Zitman, F., & Cuijpers, P. (2010). Depression and obesity: A meta–analysis of community–based studies. Psychiatry Research, 178, 230–235. [Google Scholar] [CrossRef] [Scilit] [PubMed]
- Enders, C. K. (2010). Applied missing data analysis. The Guilford Press. [Google Scholar]
- Faith, M. S., Butryn, M., Wadden, T. A., Fabricatore, A., Nguyen, A. M., & Heymsfield, S. B. (2011). Evidence for prospective associations among depression and obesity in population–based studies. Obesity Reviews, 12, e438–e453. [Google Scholar] [CrossRef] [Scilit] [PubMed]
- Felton, J., Cole, D. A., Tilghman-Osborne, C., & Maxwell, M. A. (2010). The relation of weight change to depressive symptoms in adolescence. Development and Psychopathology, 22, 205–216. [Google Scholar] [CrossRef] [Scilit] [PubMed][Green Version]
- French, M. T., Norton, E. C., Fang, H. A. I., & Maclean, J. C. (2010). Alcohol consumption and body weight. Health Economics, 19, 814–832. [Google Scholar] [CrossRef] [Scilit] [PubMed]
- Gordon-Larsen, P., Adair, L. S., Nelson, M. C., & Popkin, B. M. (2004). Five–year obesity incidence in the transition period between adolescence and adulthood: The national longitudinal study of adolescent health. The American Journal of Clinical Nutrition, 80, 569–575. [Google Scholar] [CrossRef] [Scilit] [PubMed]
- Groenman, A. P., Janssen, T. W. P., & Oosterlaan, J. (2017). Childhood psychiatric disorders as risk factor for subsequent substance abuse: A meta–analysis. Journal of the American Academy of Child and Adolescent Psychiatry, 56, 556–569. [Google Scholar] [CrossRef] [Scilit] [PubMed]
- Hamaker, E. L., Kuiper, R. M., & Grasman, R. P. P. P. (2015). A critique of the cross–lagged panel model. Psychological Methods, 20, 102–116. [Google Scholar] [CrossRef] [Scilit] [PubMed]
- Harris, K. M., Halpern, E., Whitsel, J., Hussey, J., Tabor, J., Entzel, P., & Udry, J. R. (2009). The national longitudinal study of adolescent to adult health: Research design. Available online: https://addhealth.cpc.unc.edu/documentation/study-design/ (accessed on 19 March 2026).
- Hicken, M. T., Lee, H., Mezuk, B., Kershaw, K. N., Rafferty, J., & Jackson, J. S. (2013). Racial and ethnic differences in the association between obesity and depression in women. Journal of Women’s Health, 22, 445–452. [Google Scholar] [CrossRef] [Scilit] [PubMed]
- Hu, L., & Bentler, P. M. (1999). Cutoff criteria for fit indices in covariance structure analysis: Conventional criteria versus new alternatives. Structural Equation Modeling, 6, 1–55. [Google Scholar] [CrossRef] [Scilit]
- Hussong, A. M., Ennett, S. T., Cox, M. J., & Haroon, M. (2017). A systematic review of the unique prospective association of negative affect symptoms and adolescent substance use controlling for externalizing symptoms. Psychology of Addictive Behaviors, 31, 137–147. [Google Scholar] [CrossRef] [Scilit] [PubMed]
- Lee, B., Wang, Y., Carlson, S. A., Greenlund, K. J., Lu, H., Liu, Y., Croft, J. B., Eke, P. I., Town, M., & Thomas, C. W. (2023). National, state–level, and county–level prevalence estimates of adults aged ≥18 years self–reporting a lifetime diagnosis of depression—United States, 2022. MMWR. Morbidity and Mortality Weekly Report, 72, 644–650. [Google Scholar] [CrossRef] [Scilit] [PubMed]
- Mannan, M., Mamun, A., Doi, S., & Clavarino, A. (2016a). Is there a bi–directional relationship between depression and obesity among adult men and women? Systematic review and bias–adjusted meta–analysis. Asian Journal of Psychiatry, 21, 51–66. [Google Scholar] [CrossRef] [Scilit] [PubMed]
- Mannan, M., Mamun, A., Doi, S., & Clavarino, A. (2016b). Prospective associations between depression and obesity for adolescent males and females—A systematic review and meta–analysis of longitudinal studies. PLoS ONE, 11, e0157240. [Google Scholar] [CrossRef] [Scilit] [PubMed]
- Marmorstein, N. R. (2009). Longitudinal associations between alcohol problems and depressive symptoms: Early adolescence through early adulthood. Alcoholism, Clinical and Experimental Research, 33(1), 49–59. [Google Scholar] [CrossRef] [Scilit] [PubMed]
- McCabe, C. J., Brumback, T., Brown, S. A., & Meruelo, A. D. (2023). Assessing cross–lagged associations between depression, anxiety, and binge drinking in the National Consortium on Alcohol and Neurodevelopment in Adolescence (NCANDA) study. Drug and Alcohol Dependence, 243, 109761. [Google Scholar] [CrossRef] [Scilit] [PubMed]
- McCarty, C. A., Kosterman, R., Mason, W. A., McCauley, E., Hawkins, J. D., Herrenkohl, T. I., & Lengua, L. J. (2009). Longitudinal associations among depression, obesity and alcohol use disorders in young adulthood. General Hospital Psychiatry, 31, 442–450. [Google Scholar] [CrossRef] [Scilit] [PubMed]
- Milaneschi, Y., Simmons, W. K., van Rossum, E. F., & Penninx, B. W. (2019). Depression and obesity: Evidence of shared biological mechanisms. Molecular Psychiatry, 24, 18–33. [Google Scholar] [CrossRef] [Scilit] [PubMed]
- Mojtabai, R., Olfson, M., & Han, B. (2016). National trends in the prevalence and treatment of depression in adolescents and young adults. Pediatrics, 138, e20161878. [Google Scholar] [CrossRef] [Scilit] [PubMed]
- Needham, B. L. (2007). Gender differences in trajectories of depressive symptomatology and substance use during the transition from adolescence to young adulthood. Social Science and Medicine, 65, 1166–1179. [Google Scholar] [CrossRef] [Scilit] [PubMed]
- Orth, U., Meier, L. L., Bühler, J. L., Dapp, L. C., Krauss, S., Messerli, D., & Robins, R. W. (2024). Effect size guidelines for cross-lagged effects. Psychological Methods, 29, 421–433. [Google Scholar] [CrossRef] [Scilit] [PubMed]
- Pacek, L. R., Malcolm, R. J., & Martins, S. S. (2012). Race/ethnicity differences between alcohol, marijuana, and co–occurring alcohol and marijuana use disorders and their association with public health and social problems using a national sample. The American Journal on Addictions, 21, 435–444. [Google Scholar] [CrossRef] [Scilit] [PubMed]
- Palzes, V. A., Chi, F. W., Weisner, C., Kline-Simon, A. H., Satre, D. D., & Sterling, S. (2024). Racial and ethnic disparities in receipt of specialty treatment across risk profiles of adults with heavy alcohol use. Alcohol: Clinical and Experimental Research, 48(9), 1764–1771. [Google Scholar] [CrossRef] [Scilit] [PubMed]
- Pedrelli, P., Shapero, B., Archibald, A., & Dale, C. (2016). Alcohol use and depression during adolescence and young adulthood: A summary and interpretation of mixed findings. Current Addiction Reports, 3, 91–97. [Google Scholar] [CrossRef] [Scilit] [PubMed]
- Puhl, R. M., & Heuer, C. A. (2010). Obesity stigma: Important considerations for public health. American Journal of Public Health, 100, 1019–1028. [Google Scholar] [CrossRef] [Scilit] [PubMed]
- Radloff, L. S. (1977). The CES–D scale: A self–report depression scale for research in the general population. Applied Psychological Measurement, 1, 385–401. [Google Scholar] [CrossRef] [Scilit]
- Ranker, L. R., & Lipson, S. K. (2022). Prevalence of heavy episodic drinking and alcohol use disorder diagnosis among US college students: Results from the national healthy minds study. Addictive Behaviors, 135, 107452. [Google Scholar] [CrossRef] [Scilit] [PubMed]
- Rubin, D. B. (1987). Multiple imputation for nonresponse in surveys. Wiley. [Google Scholar]
- Sayon-Orea, C., Martinez-Gonzalez, M. A., & Bes-Rastrollo, M. (2011). Alcohol consumption and body weight: A systematic review. Nutrition Reviews, 69, 419–431. [Google Scholar] [CrossRef] [Scilit] [PubMed]
- Stunkard, A. J., Faith, M. S., & Allison, K. C. (2003). Depression and obesity. Biological Psychiatry, 54, 330–337. [Google Scholar] [CrossRef] [Scilit] [PubMed]
- Sudhinaraset, M., Wigglesworth, C., & Takeuchi, D. T. (2016). Social and cultural contexts of alcohol use: Influences in a social–ecological framework. Alcohol Research: Current Reviews, 38, 35–45. [Google Scholar] [PubMed]
- Traversy, G., & Chaput, J. P. (2015). Alcohol consumption and obesity: An update. Current Obesity Reports, 4, 122–130. [Google Scholar] [CrossRef] [Scilit] [PubMed]
- Trust for America’s Health. (2022). State of obesity 2022: Better policy for a healthier America. Available online: https://www.tfah.org/report-details/state-of-obesity-2022/ (accessed on 6 April 2026).
- von Hippel, P. T. (2020). How many imputations do you need? A two-stage calculation using a quadratic rule. Sociological Methods and Research, 49, 699–718. [Google Scholar] [CrossRef] [Scilit] [PubMed]
- Wang, X., Xiang, S., Kang, J., Zhai, R., Zheng, C., Banaschewski, T., Bokde, A. L. W., Brühl, R., Desrivières, S., Flor, H., Garavan, H., Gowland, P., Grigis, A., Heinz, A., Martinot, J. L., Martinot, M. P., Artiges, E., Nees, F., Orfanos, D. P., … Feng, J. (2026). The causal interplay between depression and alcohol use from adolescence to young adulthood: A Mendelian randomization study. Psychological Medicine, 56, e28. [Google Scholar] [CrossRef] [Scilit] [PubMed]
- White, I. R., Royston, P., & Wood, A. M. (2011). Multiple imputation using chained equations: Issues and guidance for practice. Statistics in Medicine, 30, 377–399. [Google Scholar] [CrossRef] [Scilit] [PubMed]
- Yeomans, M. R. (2010). Alcohol, appetite and energy balance: Is alcohol intake a risk factor for obesity? Physiology and Behavior, 100, 82–89. [Google Scholar] [CrossRef] [Scilit] [PubMed]
- Yu, J. J. (2026). Problematic smartphone use and disengagement in first-year college students: A daily diary study of between- and within-person differences. Addictive Behaviors, 176, 108625. [Google Scholar] [CrossRef] [Scilit] [PubMed]
- Yu, J. J. (in press). Longitudinal interplay among body mass index, sleep duration, and phone dependency in adolescents: Data from six waves of two nationally representative cohorts. Psychology and Health. [CrossRef] [Scilit] [PubMed]
- Yu, J. J., & Zhang, Z. (2025). Long-term impact of adverse childhood experiences and perceived social support on depression trajectories. Journal of Affective Disorders, 369, 255–264. [Google Scholar] [CrossRef] [Scilit] [PubMed]

Disclaimer/Publisher’s Note: The statements, opinions and data contained in all publications are solely those of the individual author(s) and contributor(s) and not of MDPI and/or the editor(s). MDPI and/or the editor(s) disclaim responsibility for any injury to people or property resulting from any ideas, methods, instructions or products referred to in the content. |
© 2026 by the authors. Licensee MDPI, Basel, Switzerland. This article is an open access article distributed under the terms and conditions of the Creative Commons Attribution (CC BY) license.