


Abstract
The article is a literature study supplemented with self-collected data on fish density, age and growth of smolt (Osmerus eperlanus) in Lake Mjøsa over the last 40–50 years. Smolt is an important prey fish for piscivorus brown trout, and the development of the trout population is described by catch reports. The smelt population in Lake Mjøsa declined in the period 1980 to 1990 but increased sharply in 2018 and 2023. Recruitment to the smelt population is positively correlated with air temperature in May and July. Increased smelt population is a possible reason why the large trout population also appears to have increased, while smelt has shown reduced individual growth in recent years. The trout population does not appear to have a decisive effect on the smelt population but may have contributed to increased mortality in smelt in the material from 2006 to 2022 as compared to 1980. The effect of trout stocking, made for the last time in 2021, is uncertain, but future catch reporting will provide a better answer to this.
1. Introduction
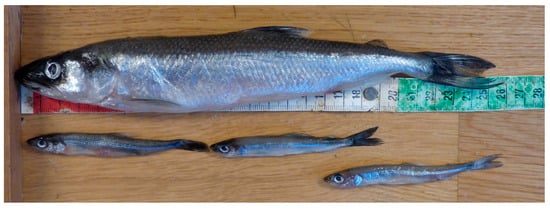
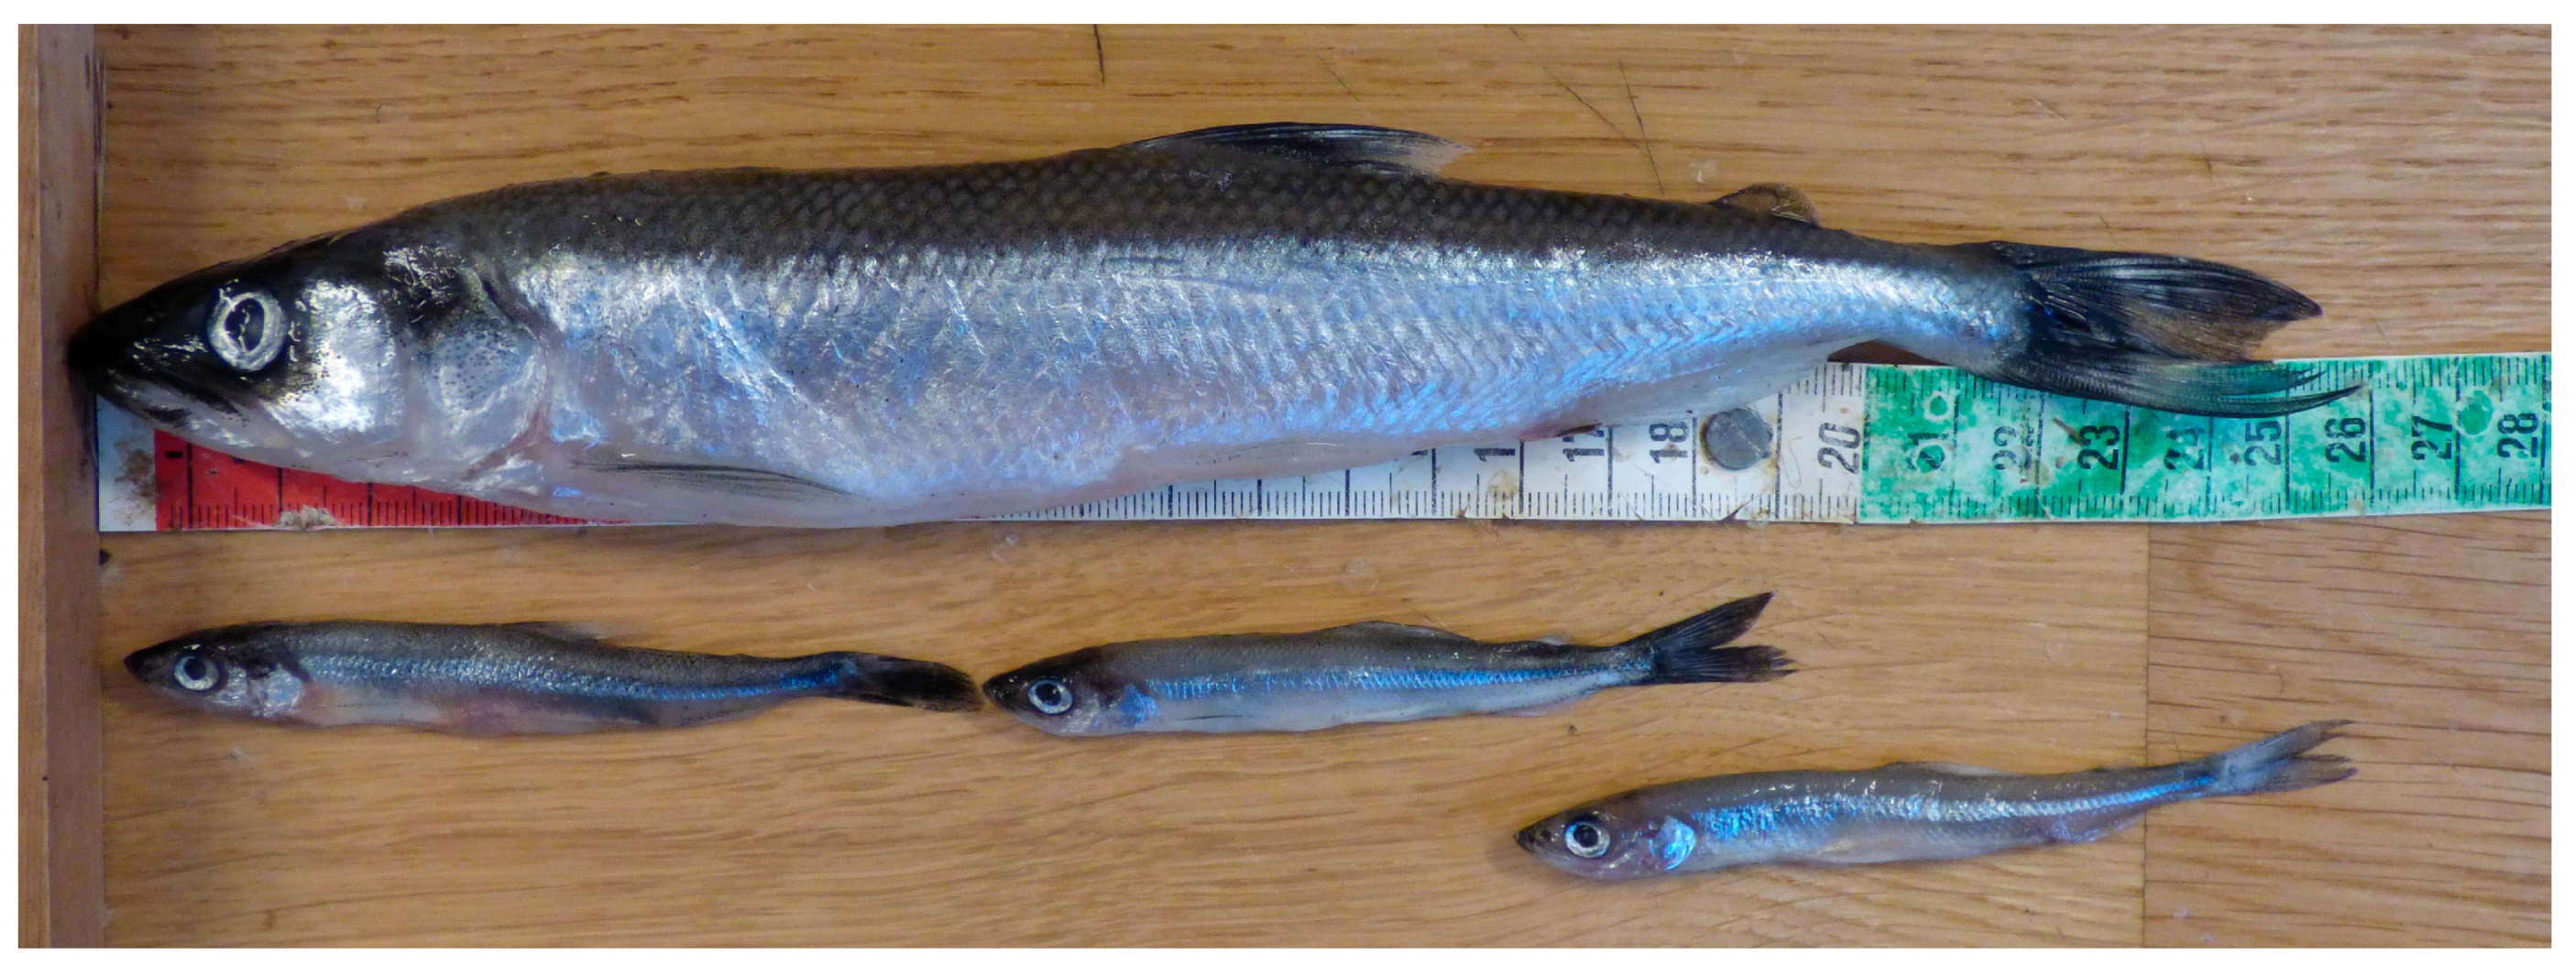
Smelt (Osmerus eperlanus) (Figure 1) is a bony fish in the family Osmeridae, order Osmeriformes. The species’ natural distribution in Norway is limited to areas below the upper marine limit in waterways from the Swedish border in the east to Agder County, southernmost Norway in the west. It lives in freshwater and brackish water [1] and can be anadromous [2]. Smelt populations are dominated by individuals less than 15 cm and smelt is an important prey fish for piscivorous brown trout (Salmo trutta) and perch (Perca fluviatilis). Smelt is versatile in its choice of food from juvenile to adult. It can eat algae, though zooplankton is most important [3,4]. It is also piscivore and eats its own fry [4,5,6]. It has been released (now illegally) into several waters to promote large grown brown trout [7,8,9]. In some populations, such as in Lake Mjøsa, the smelt shows two different life history strategies. In addition to the “normal” smelt, there is a more piscivorous large morph (up to 30 cm) [5,8].
Figure 1.
Large grown (upper) and “normal” (lower) smelt (Osmerus eperlanus).
Smelt is an important predator on zooplankton competing with vendace (Coregonus albula) and whitefish (Coregonus lavaretus) [3] and can affect the occurrence of algae-eating zooplankton in groups such as Daphnia spp. and Bosmina spp. [10]. Plankton-eating fish species are ecologically important as predators in open water, and they are correspondingly important in a monitoring context. The pelagic fish populations in Mjøsa are now monitored with annual echo sounder recordings, as one of several fortunate outcomes of the EU Water Directive.
The growth of animal populations is determined by recruitment and mortality, and recruitment to fish populations is affected by environmental conditions that may vary from year to year and can be seen in varying year-class strength. Year-class strength has been found to be positively correlated with summer temperatures in several lake-spawning fish species [11,12,13,14,15,16]. Year-class strength of smelt in the Swedish lakes Väneren and Vettern is positively correlated with air temperature in April [17]. In populations of the closely related rainbow smelt (Osmerus mordax) in Lake Erie and Lake Ontario in North America, year-class strength is negatively correlated with the abundance of one-year-old conspecifics feeding on larvae and fry [18,19]. Keller, Molenaar [20] found in a Dutch lake that high temperatures in May, i.e., during the incubation period of the smelt eggs, led to the eggs hatching before there was sufficient planktonic nutrition available for the larvae. This is because the development of plankton is controlled more by light than by temperature, and this “mismatch” caused reproduction to fail in years with high May temperatures.
This article describes development trends in the smelt population in Lake Mjøsa in part regarding this species’ role as prey fish for the large-growing Mjøsa brown trout. It is based on previously reported studies, and on newer material collected at the smelt spawning grounds in the Furnesfjorden, a part of Lake Mjøsa. Assessments of the development of the brown trout population are made based on catch reports from the fishery. Recruitment and year-class strength of smelt are analyzed in relation to air temperatures in the spring and summer months, in relation to year-class strength of 1+ (expressing predation risk) and 3+ (expressing population fecundity) smelt, and in relation to water level development in Mjøsa, which normally increases through the latter half of May and in early June when smelt spawning and hatching occur. Water temperature is believed to be most important for the development of aquatic ectothermic animals, and it is positively correlated to air temperature [16], which is used here as a predictor in linear models for relative year-class strength as there exist long measurement series from several measuring stations, including at Kise by Furnesfjorden.
2. Materials and Methods
2.1. Study Area
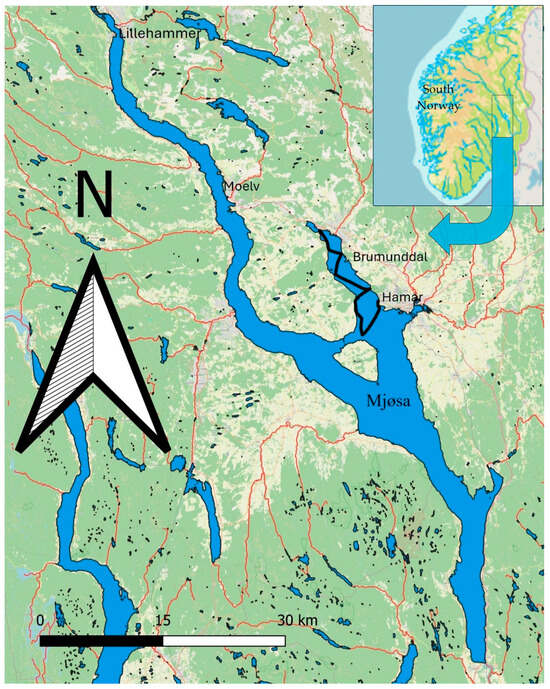
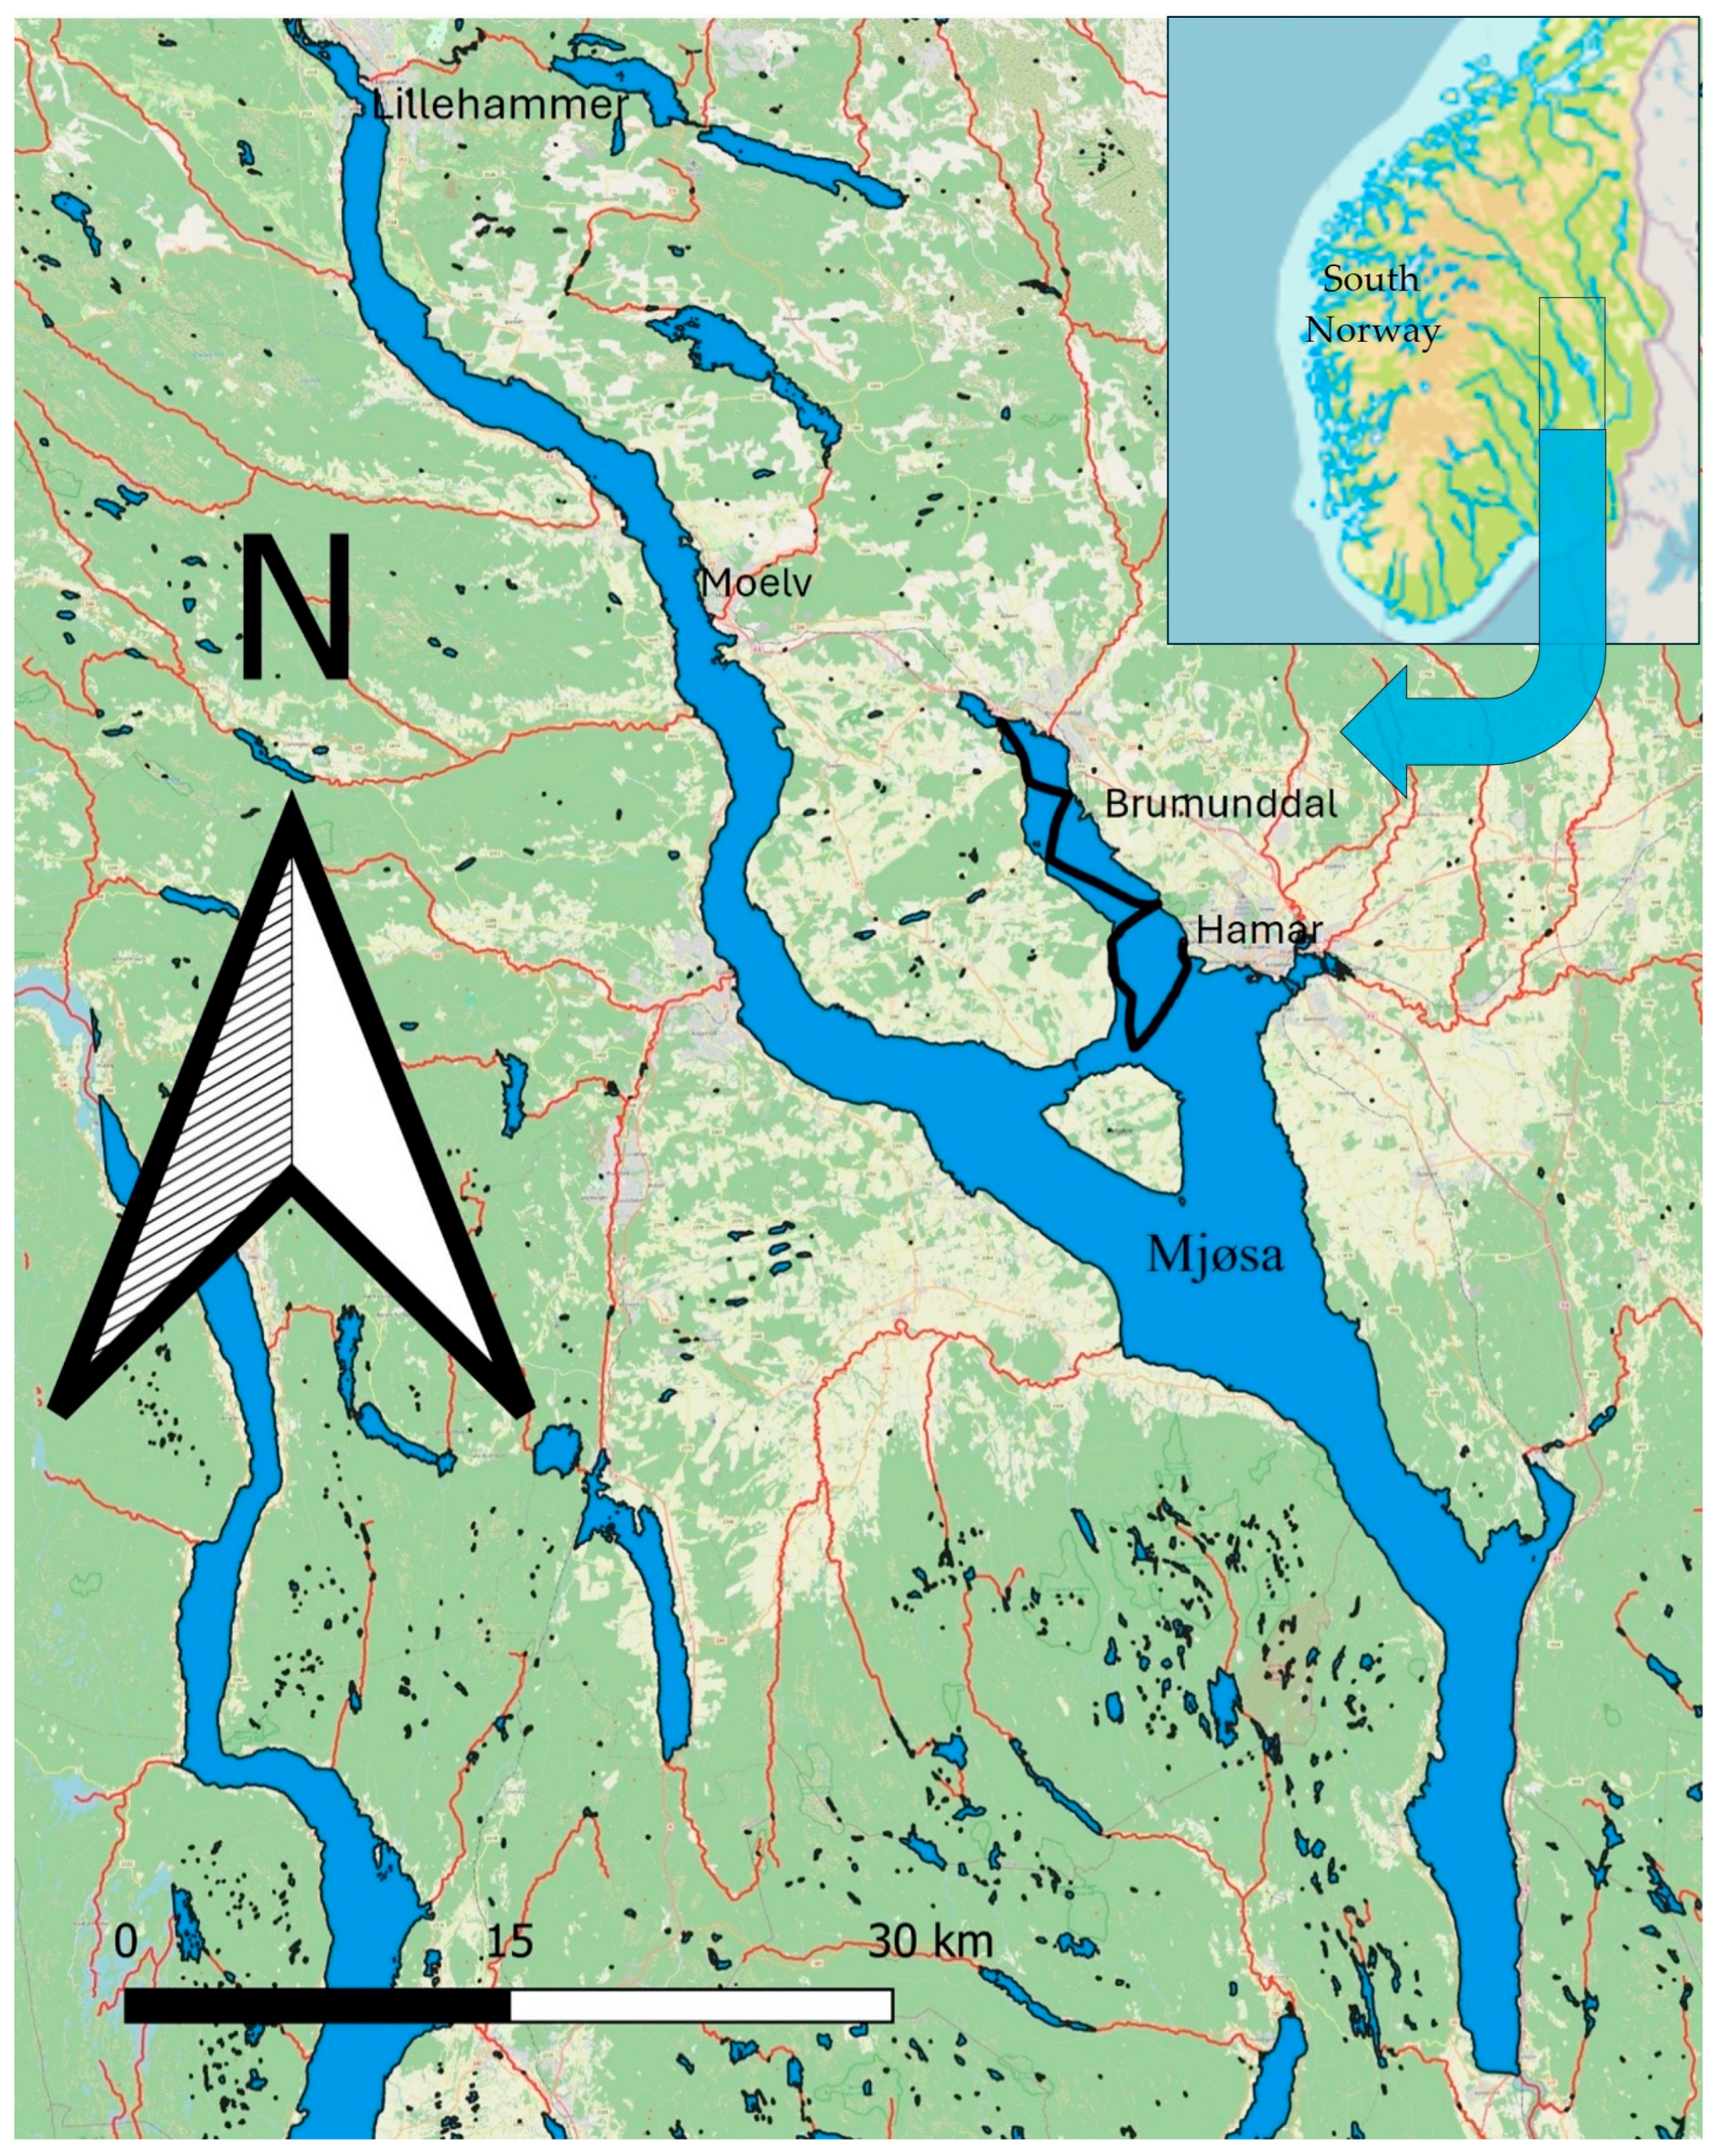
Mjøsa (Figure 2) is the largest lake in Norway with a surface area of 365 km2. The lake has been regulated since 1858 and since 1961 it has been regulated by 3.6 m (119.3–122.9 m a.s.l.) with a dam in Svanfossen 22 km down the outlet river Vorma. The greatest measured depth is 453 m. The water quality in Mjøsa has varied over the last 60–70 years. In the 1970s, there were relatively high concentrations of plant nutrients, phosphorus and nitrogen, and there were problems with algae and blue-green bacterial growth. Phosphorus was given the greatest attention since it is normally the minimum factor for production in freshwater [21]. The concentration of total phosphorus (TP) was often higher than 9 μg/L, which is the upper limit for the class “Good water quality” in the Water Framework [22]. Concentrations from 9 to 16 μg/L are classified as “Moderate”, a condition that should trigger improvement measures. Phosphorus purification of wastewater and widespread controls and measures in the lake’s catchment area as part of the Mjøsa Action have resulted in significant improvements [23]. However, phosphorus levels have shown a worrying increase after periods of rain and flooding, and in recent decades there have been blooms of algae and blue-green bacteria in summers of long periods of sunshine [24].
Figure 2.
Map of Lake Mjøsa with transects for echo sounding between Brumunddal and Hamar in Furnesfjorden in May 2024.
There are 20 naturally occurring fish species in Mjøsa [25] and smelt, vendace and whitefish have dominated the pelagic zone [26,27]. Two perch species, perch and ruffe (Gymnocephalus cernua), six cyprinids (Cyprinoformes) and pike (Esox lucius) dominate the littoral and benthic zones, in addition to the bottom-dwelling cod fish, the burbot (Lota lota). The vendace fishery in Mjøsa and the tributary Lågen has been of economic importance [28] but has declined sharply in the last 20–30 years [29,30], partly due to reduced stocks. For anglers, the large grown brown trout is a favorite, but perch and pike are also targeted. Gillnet catches per effort of brown trout seem to have increased in the last 20–30 years, whereas trolling and angling catches per effort fluctuate [31,32].
Findings of organic toxins in brown trout [33] put an end to commercial exploitation of trout catches for a period, and gillnet fishing declined. In the years 1973–1990, an average of approximately 17,000 two-year old fish of the Hunder falls population were released annually by the power company Glommen and Laagen Brukseierforening, later Hafslund. The number increased to an average of 23,000 fish annually from 1991 by producing and releasing fish of several local strains (such as the rivers Brumunda and Lena). This, in combination with catch-and-release practices among anglers, may have contributed to an increased trout population. Most brown trout are, however, naturally recruited from tributary rivers of which the main inlet River Lågen/Hunder falls is clearly the largest [34]. The brown trout eat smelt from the size of 20–25 cm, and this doubles their annual length increment. They gradually switch to larger prey such as vendace and whitefish [35]. Smelt is caught with dipnets from boats or along the shore, previously also with push seines during its spawning season to be used as bait for trout and perch fishing. This fishery is unlikely to have any impact on the smelt population.
2.2. Methods
Density and biomass of smelt estimated by means of echo sounding are taken from Lindem and Sandlund [36], Sandlund, Næsje [27], Gjelland, Eikland [37] and Eikland, Gjelland [38], and from two own recordings with a single beam SIMRAD EK15 echosounder (Kongsberg Maritime, Kongsberg, Norway). [39] (with 9° beam angle) in Furnesfjorden on 20 May 2021 and 15 May 2024. SIMRAD EK15 has been shown to give well comparable results with the older type SIMRAD EY M (SIMRAD, Horten, Norway) [40], which was used in the surveys in 1980 and 1990–1991 [27]. The use of SIMRAD EK15 is described in detail by Linløkken, Næstad [40] and Linløkken [41]. The SIMRAD (Kongsberg Maritime, Kongsberg, Norway) EK60 and EK80 devices used from 2018 [41,42] have been compared with each other but unfortunately, never with the old SIMRAD EY M.
Echo strength (TS, dB) is transformed to fish length (L, cm) by the formula: TS (dB) = 20 · log (L, cm) − 68 [36], and further to weight/biomass (W, g) by known or assumed ratio between fish length and weight: W = a · Lb, where a and b are parameters in the regression: log W = b · log L + log a. This ratio varies between species, populations and sex (mature), and can, when species composition is known, be used to calculate weight/biomass of species. Mean weights of species from trawl catches can also be used. It is regrettable that not all echo sounding surveys are reported with density (N/ha) distributed by species. Often only biomass by species is presented, calculated by different methods, all of which introduce new variance in the estimate, and make it difficult to compare studies.
Smelt were collected with dipnets in May 2006, 2007, 2008, 2014, 2015, 2016, 2018, 2019 and 2022 along the shores at spawning grounds on the east side of Furnesfjorden, a part of Lake Mjøsa, between Hamar and Brumunddal (Figure 2). Spawning takes place during the darkest time of day, according to Sandlund, Klyve [5], most intensely around 02:00 (CET, not summertime). When sampling at the spawning ground with a dipnet, the catchability of large grown smelt is low and the inclusion of these is not representative. In 2018 and 2022, extra effort was made to catch large smelt by selectively going after them with the dip net. In May 2008, Nordic sample nets (12 mesh sizes from 5 to 46 mm) [42] were used. In previous studies, seines and nets were also used for collection [5,25].
The length of smelt was measured (L, mm), from the tip of the snout to the end of the tail fin when naturally extended (natural length), and weighed (W, 0.1 g). Age was determined by analysis of saccule otoliths being read twice under a stereo microscope (10 × 40 magnification) before being burned, cracked and read again in cross-section. Experience has shown that it can be easy to overlook zones from the third and especially from the fourth and later winter zones (i.e., in sexually mature fish) in unburned otoliths. Age and growth from earlier periods are taken from Huitfeldt-Kaas [25] and Sandlund, Klyve [5], and compared with analyses of material from 2006 to 2022. Growth is presented as mean lengths Lt (empirical growth) and as instantaneous growth rates (Gt) at age t: Gt = ln (Wt+1/Wt) where Wt is weight at age t, which is calculated with length Lt and the relationship Wt = a · Ltb. Fish lengths from the 2006–2022 material were tested for variation between years with a linear model [43] with ln (Age) as continuous, and growth year (catch year–1) as categorical predictor.
Annual survival (S), mortality A = 1 − S and instantaneous mortality Z = −ln S (S = e−Z) are based on catch curves and calculated using a method described by Chapman and Robson [44] and Robson and Chapman [45]. When catch curves (age distribution in the catch) are used, it is important that all age groups included have approximately the same catchability. This is often not the case for the youngest age group because small fish are less catchable, especially with gill nets. Smelt caught on the spawning grounds are assumed, with few exceptions, to be sexually mature, i.e., males and females aged 2+ and older, in some years only 3+ and older [8]. The age group 2+ may be underrepresented because not all are sexually mature. One-year old smelt were not caught on the spawning grounds.
Chapman and Robson [44] provide a chi-square test to check whether the youngest age group is fully recruited. In material with few fully recruited age groups and in addition, varying year-class strength, the method will be inapplicable.
Year-class strength in the samples from 1979 and 1980 is calculated by the ratio between observed number of fish (NO,t) of age group t in a sample and the expected number of fish (NE,t) of the same age group. Constant recruitment and mortality are assumed, and the expected number is calculated by: NE,t = S · Nt−1 for each age group. The ratio NO,t/NE,t giving an expression for relative strength for age group t [16].
For the 2006–2022 material the relative year-class frequency in each sample (year) and the averages thereof were considered indicators of relative year-class strength (YCS) during the years 2000–2020. A linear model was used to test the relationship between YCS and four continuous predictors: (1) mean air temperature (alternately in the months of May, June, July and August) (temp), (2) year-class strength of 1+ smelt (predation risk to larvae) (ln (YCS.1+)) (ln to normalize data) and (3) year-class strength of 3+ smelt (ln (YCS.3+), expressing population fecundity/reproductive potential), as most of a cohort normally is mature at age 3+. (4) Water level change in Lake Mjøsa from 15 May to 7 June in the years 1969 to 2020 (∆h, m). Forward stepwise regression was used:
YCS = b1 · temp + b2 · ln (YCS.1+) + b3 · ln (YCS.3+) + b2 · (∆h)
∆h averaged 1.14 m and varied from −0.63 to 3.14 m in the years 1969 to 2020.
2.3. Population Dynamics and Production
As an alternative method to calculate mean weight (W) and biomass (B) and, to calculate production (P), life history tables [46,47] were constructed by calculating the number of fish (Nt) in age groups t ≥ 1+ as follows: Nt = S · Nt−1. Biomass (Bt) is given by the number of fish (Nt) in age group t multiplied by the mean weight Wt in the age group: Bt = Nt · Wt. Mortality is assumed to be constant throughout the year (a simplification), while growth is limited to an assumed period of four months, from the first of June to the first of October. The table is divided into periods with and without growth. Annual Z is (as logarithm) additive and gives, divided by 12, instantaneous mortality per month. Instantaneous mortality during the growth period is 4 · Z/12 = Z/3, and instantaneous mortality during the period without growth is 8 · Z/12 = 2 · Z/3. The material from 2006 to 2022 was stored in a freezer (−20 °C) before sampling, and this can lead to drying and weight loss [48]. The length-weight relationship is therefore compared with older data from material that was sampled in a fresh state, from Sandlund, Klyve [5]: W = 0.0032 · L3.160.
Annual production in an age group t is given by the mean biomass (BM) in the growing season multiplied by Gt. Mean density (NM) is calculated as follows: NM = N0 · e−M/2, where N0 is the population at the start of the growing season (May) and M = instantaneous mortality during the growing season (M/2 for half a season). Mean biomass (BM) is calculated as: BM = NM · W0 · eG/2, and the production Pt = BM · Gt. The values are summed over the age groups and by iterating the number of recruits (N01) (i.e., number of 1-year-olds at the start of the season), it can be chosen so the sum of the mean density (NM) or biomass (BM) corresponds to a chosen quantity, such as fish density or biomass estimated by means of echo sounding.
Data for trout fishing are taken from Qvenild and Nashoug [49], from catch reports from fishermen who obtained fishing licenses (Brumunddal and Omegn Sportsfiskerforening) for Brumunda in 2007–2009, and from catch reports to the State Administrator in County Oppland/Innlandet [31,32]. Data on brown trout stockings were attained from Hafslund Power company.
3. Results and Discussion
3.1. Biomass and Species Composition in the Open Water Bodies
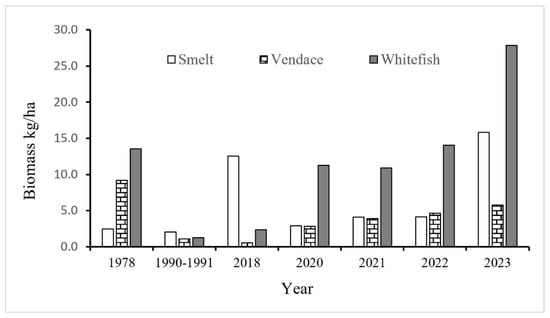
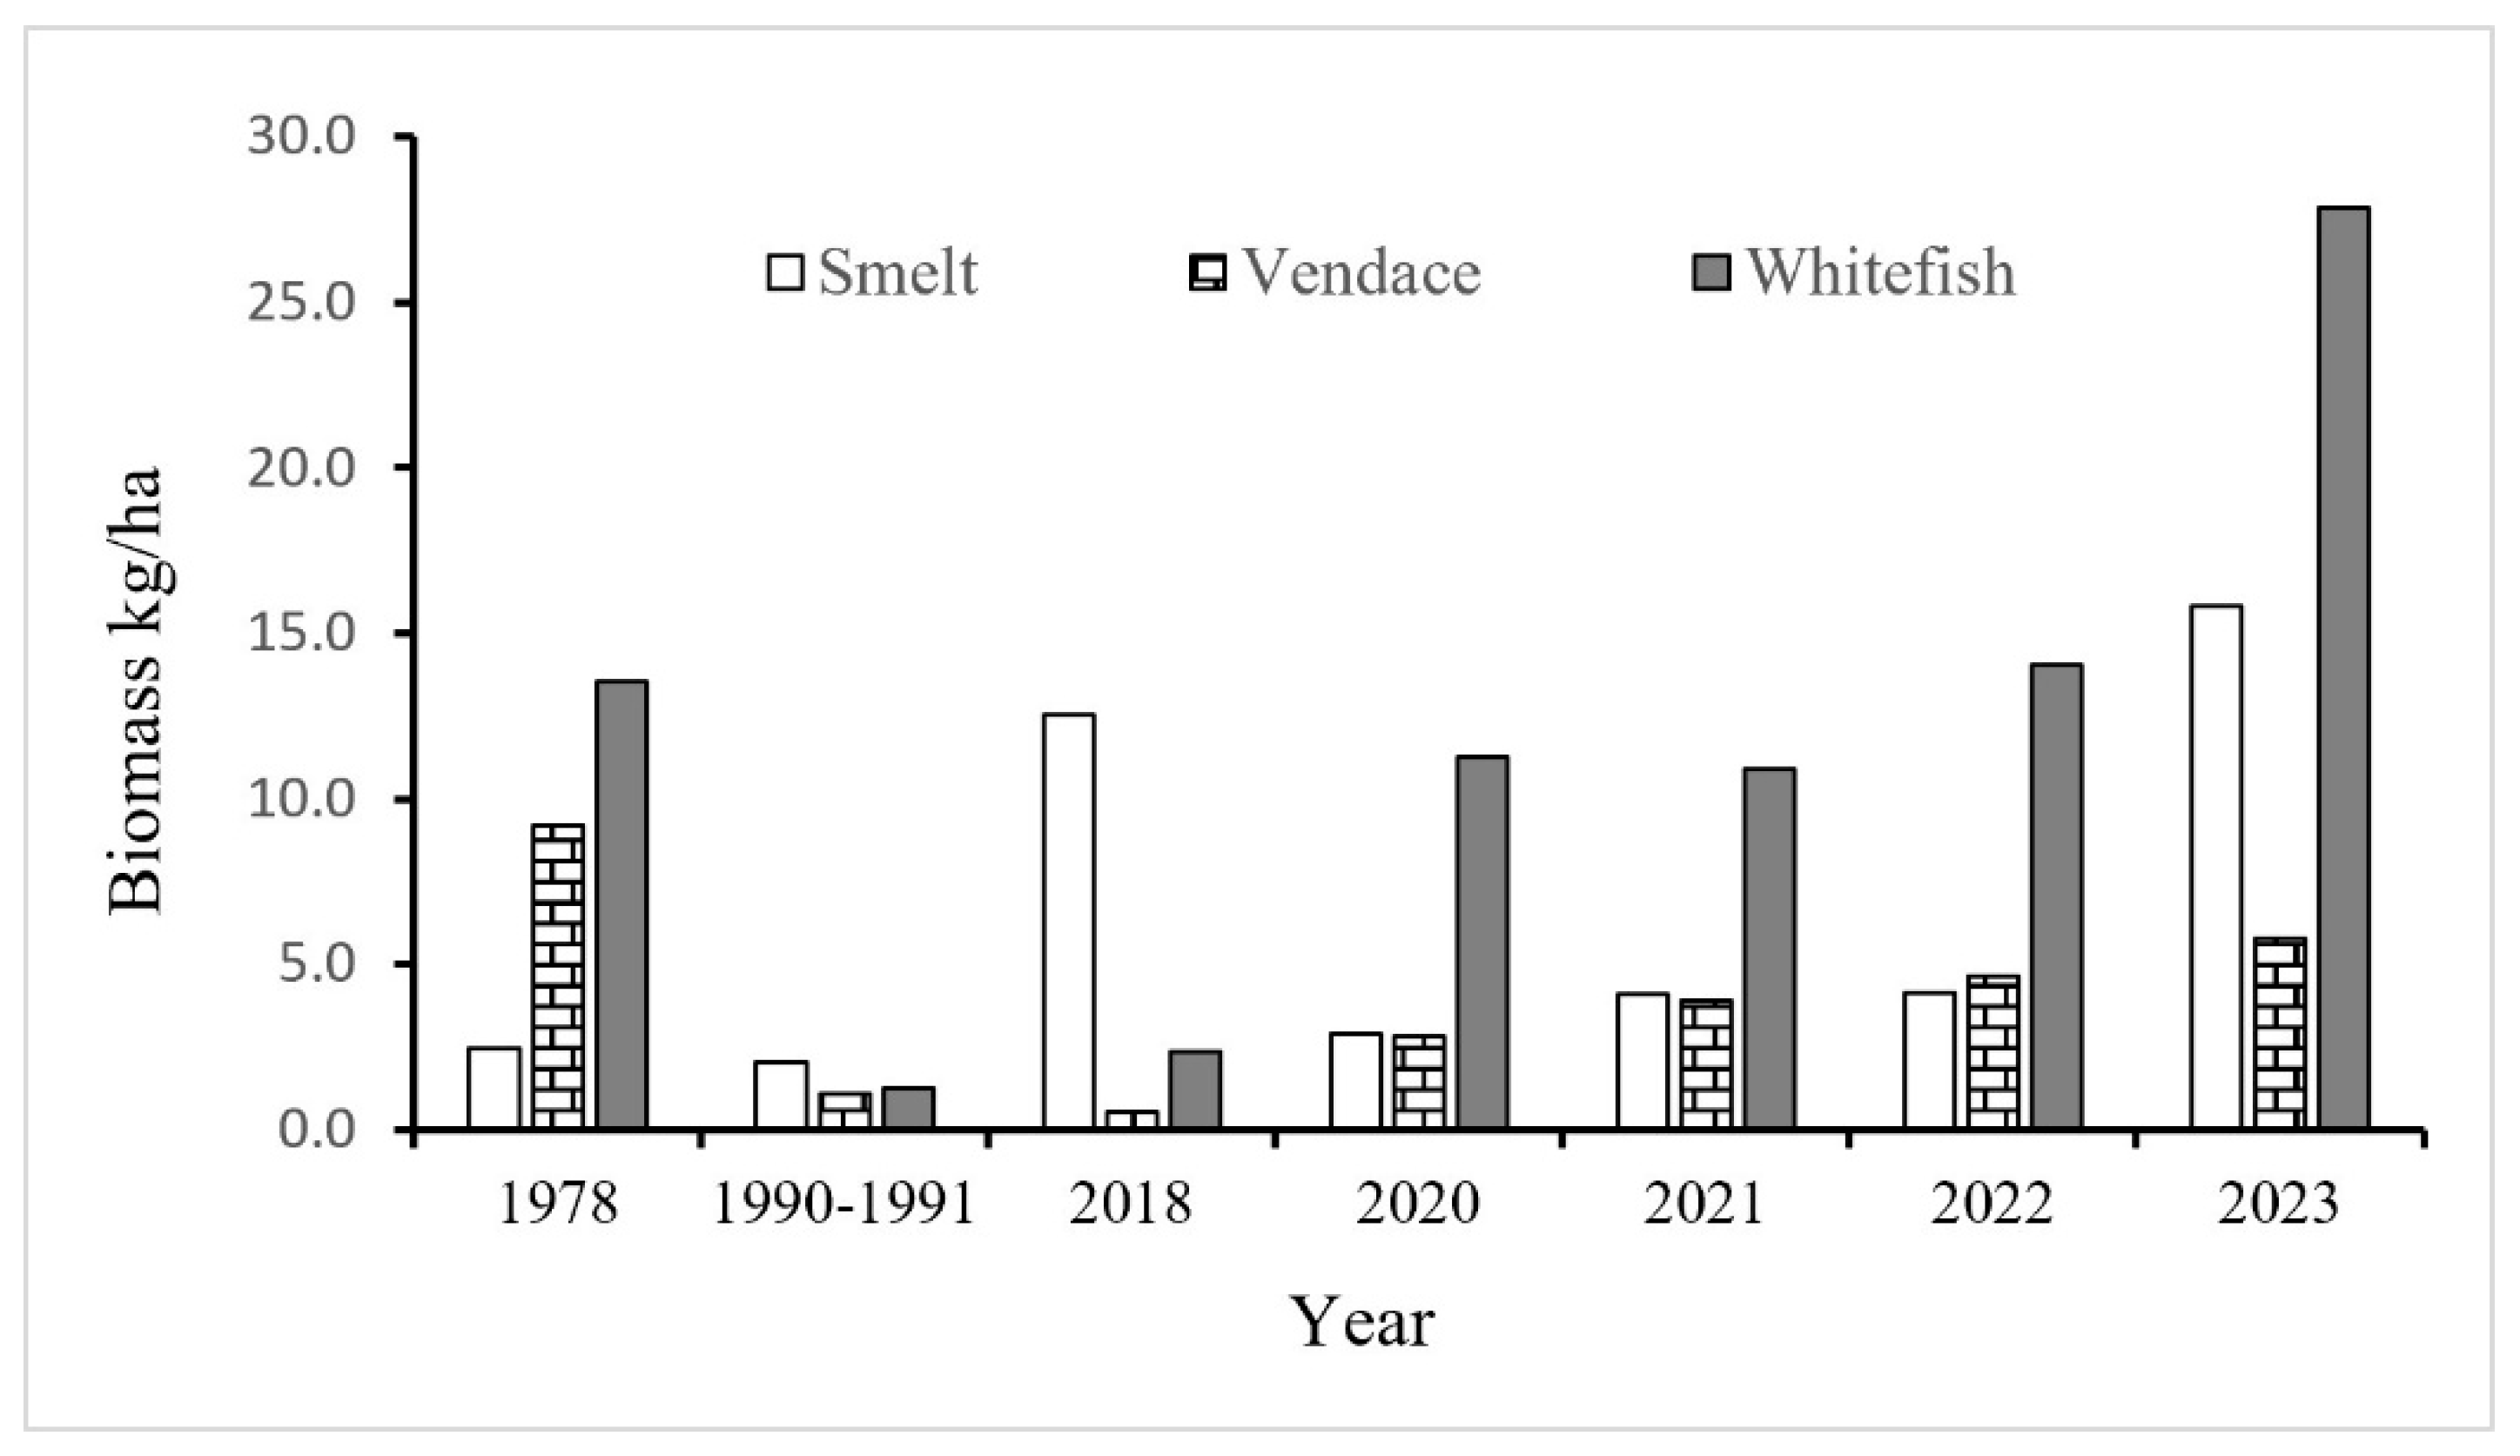
Echo recordings in 1978–1980 and 1990─1991 showed a sharp reduction in pelagic biomass, from 25.2 to 4.4 kg/ha during the intervening decade (Figure 3). The reduction was most pronounced for whitefish with 91% and vendace with 88%, as compared to only a 17% reduction for smelt. This was followed by a fivefold increase in the smelt population from 1990 to 1991 to 2018. This increase may have been a result of reduced competition from vendace and whitefish.
Figure 3.
Estimated pelagic biomass in different years in Lake Mjøsa.
The smelt population declined between 2018 and 2020, but has since increased, and in 2023, 15.8 kg smelt/ha was estimated, the highest estimate ever for smelt. The stock of vendace has been low since 1990 but increased to nearly 6 kg/ha in 2023, the highest estimate since 1980. From 2020 to 2023, the whitefish stock increased and was then estimated at just under 28 kg whitefish/ha, the highest estimate ever made for whitefish.
The biomass reduction from 1980 to 1990 was explained by the fact that productivity in Lake Mjøsa decreased due to the implemented cleaning measures [27]. It is more difficult to explain the large increase occurring after 2018 [38]. The total phosphorus concentration in the upper water layer of Mjøsa varied in 2023 between 2.5 and 7.8 μg/L, with an average of 5 μg/L, a condition characterized as good [50]. Increasing temperatures over several decades may have contributed to increased biomass by increasing recruitment in several fish species. One effect of higher temperatures is a prolonged growing season, commonly resulting in larger fry with higher survival in the first winter [11,13].
Biomass calculations from 1978 to 1980 and 1990–1991 were based on assuming a mean weight of WM = 10 g for smelt [27]. In the later studies, biomass is calculated from echo strength, but it is unclear how the transformation was done. Mean lengths of normal smelt (≥1+) in trawl catches from 2023 varied between habitats from 9.0 to 9.7 cm, with Foulton’s condition factor K = 100 · W/L3 ranging from 0.49 to 0.52 [51], which gives WM = 3.6–4.7 g (less than half of 10).
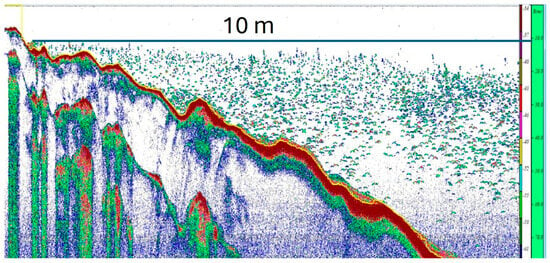
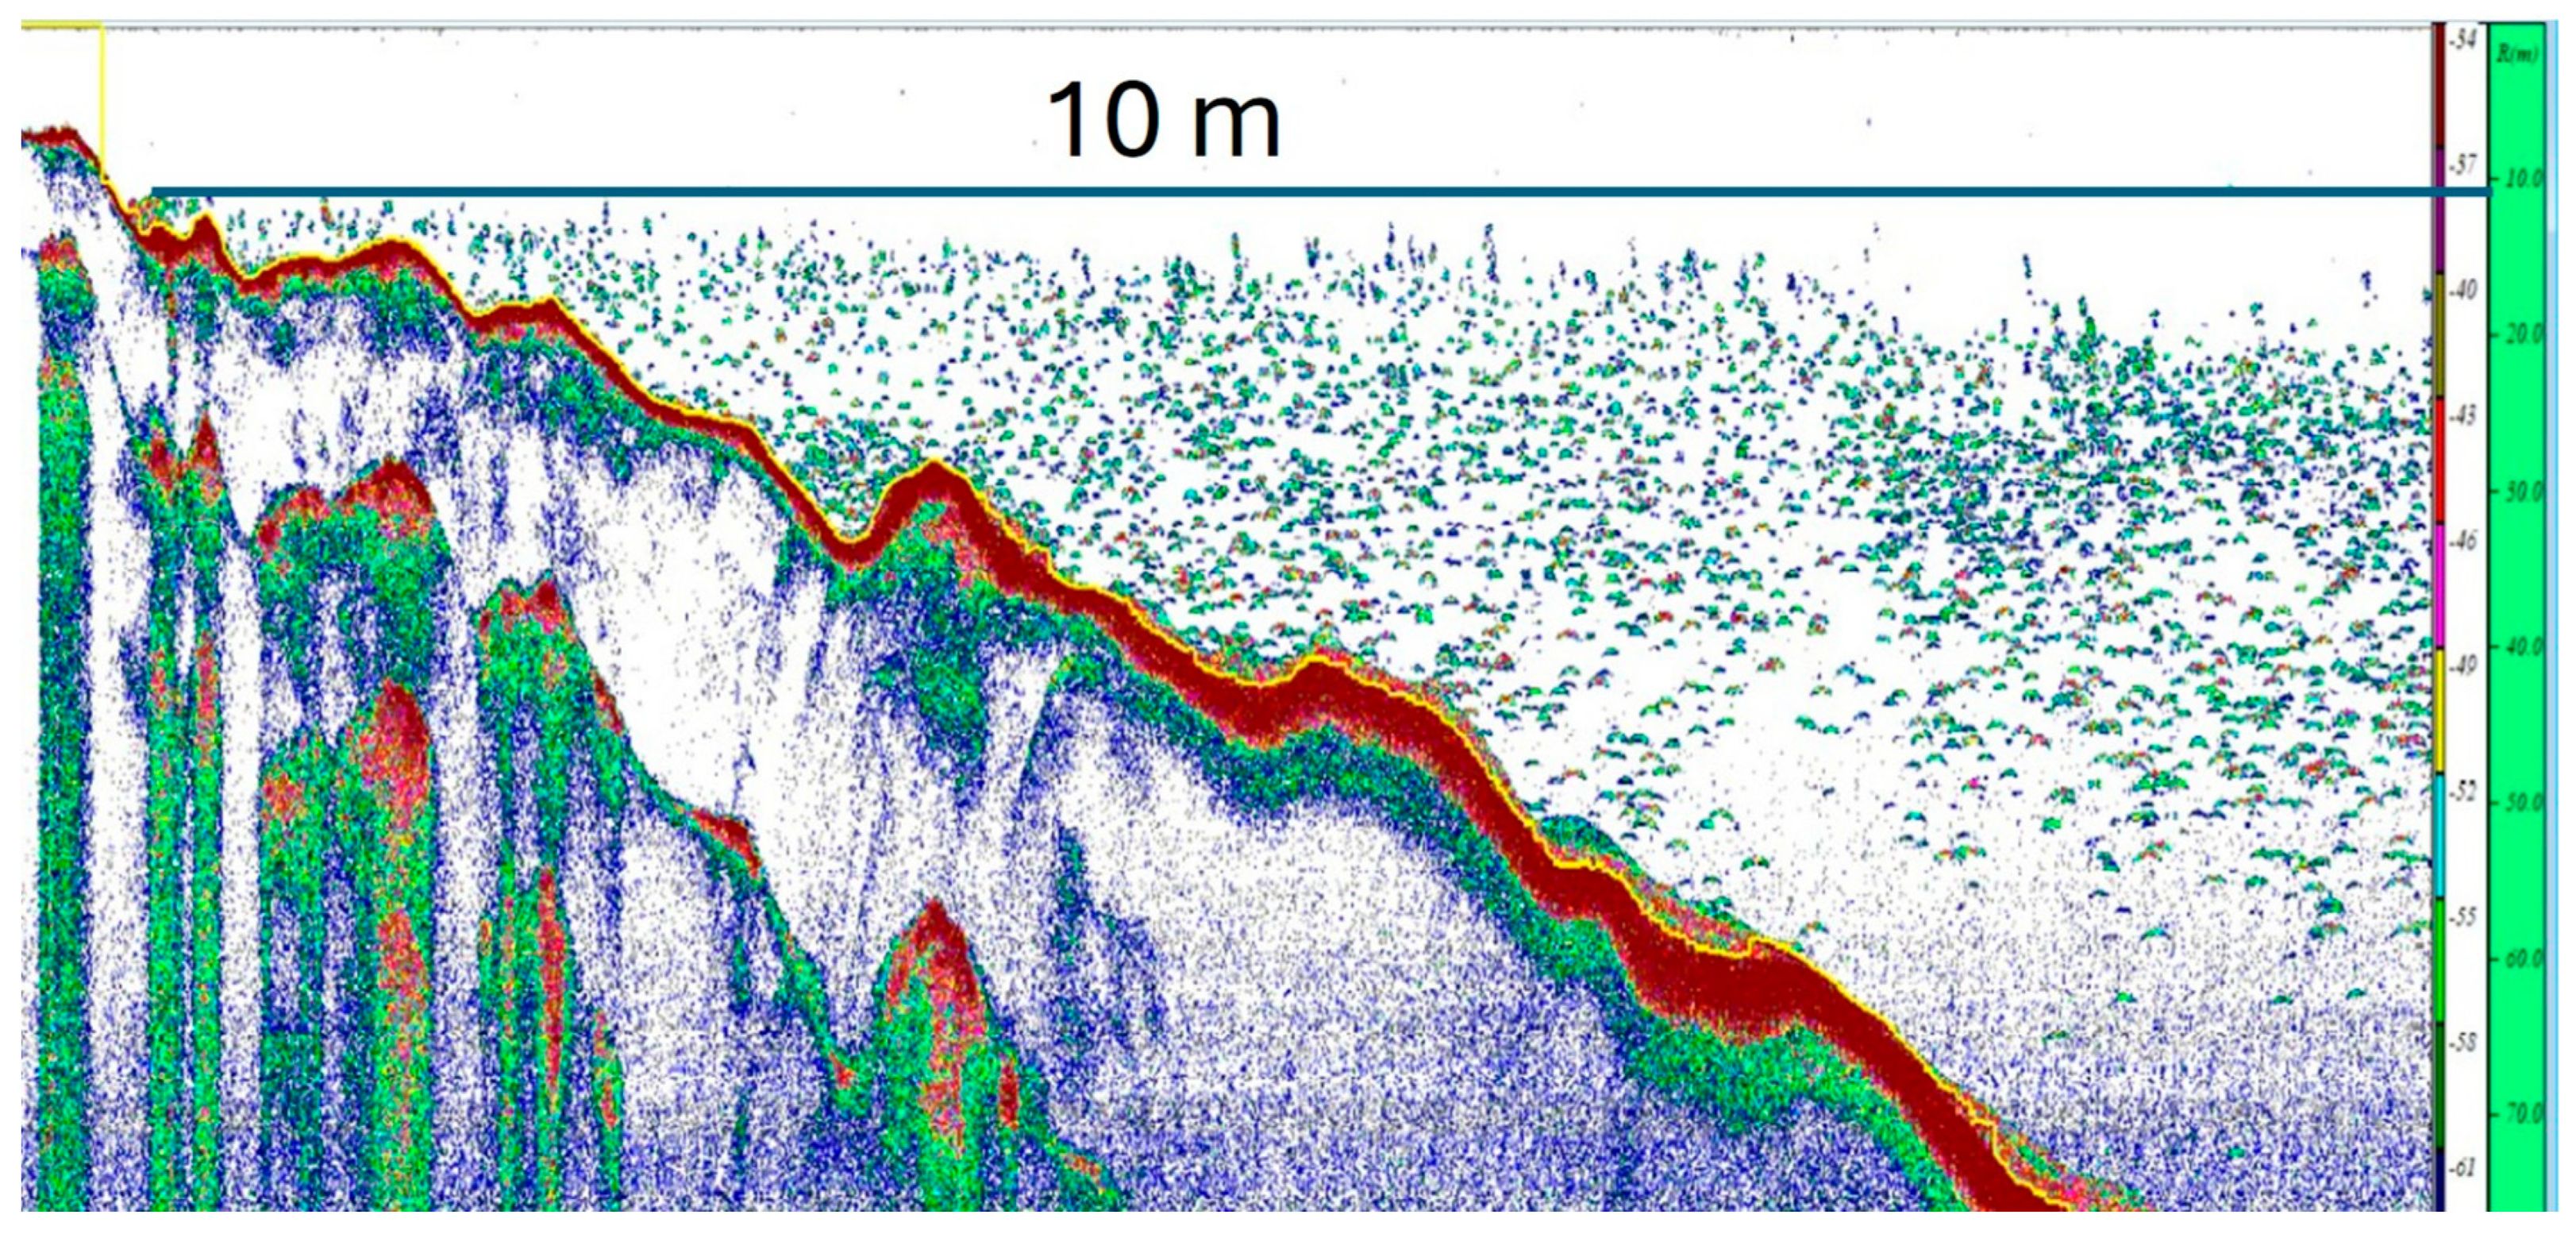
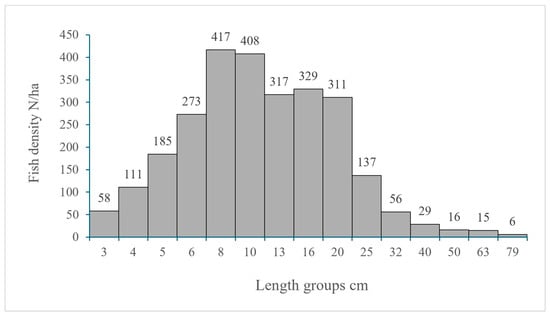
On 20 May 2021, registrations in Furnesfjorden showed a mean density of 2666 fish per ha in size approx. 5–50 cm (TS = [−54 to −33 dB>) (Table 1). The fish were distributed at 15–60 m depth in the pelagic zone (Figure 4), and the fish density was calculated in this cone segment. There were 1599 fish/ha in the length group approx. 5–13 cm (TS = [−54 to −46 dB]), which are essentially normal smelt at age ≥ 1+, with elements (<0.1% by number) of one-year-old vendace, whereas whitefish is not pelagic at this length [52]. Those appear as a peak between approximately 7 and 13 cm in the length distribution based on echo strength (Figure 5). The mean weight in this length group was calculated to be 3.9 g by transforming echo strength frequency to weight.
Table 1.
Estimated density and biomass in Furnesfjorden in May 2021 and 2024. Biomass is estimated by means of a model corresponding to ST 1A and ST 1B.
Figure 4.
Echogram from Furnesfjorden on 20 May 2021.
Figure 5.
Length distribution of fish recorded by means of echo sounding in Furnesfjorden in May 2021.
The fish density in Furnesfjorden in 2021 was higher than that calculated for the whole of Lake Mjøsa in 1978–1980, but it was lower than what was calculated for the whole lake in 2023 [38]. This corresponded to density differences between Furnesfjorden and the whole lake reported in 1990 [27]. The density calculations from Furnesfjorden on 15 May 2024 gave 1110 fish/ha of smelt size. This was a significant (non-overlapping C.I.) density reduction of 30% from May 2021.
3.2. Length Distribution in the Dipnet Catches
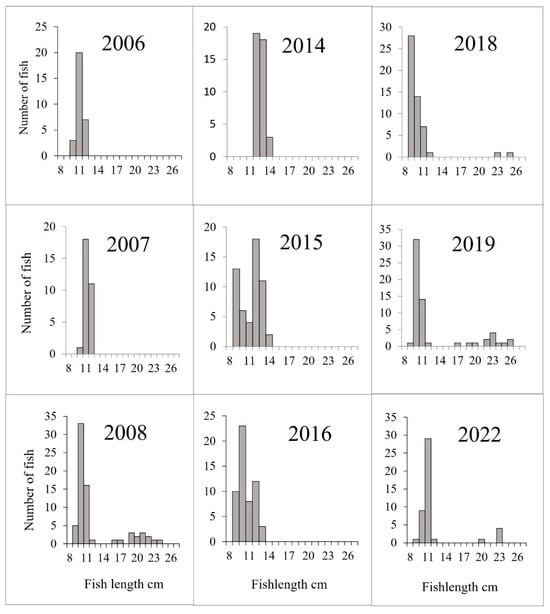
The length distributions (Figure 6) of smelt varied widely between years, and consisted of three to six cm groups, from 8 to 14 cm. The mean length of sexually mature smelt in the dipnet catches from 2006 to 2022 varied from 9.8 to 12.0 cm, and the average weight varied from 2.9 to 7.3 g. The length-weight ratio from Sandlund et al. (1980b) gives 4.3 and 8.3 g for the same fish lengths (still lower than 10 g even though this is only ≥2+ smelt, not 1+) [5]. Low mean weights in own catches are assumed to be due to the material being frozen before sampling, and the ratio W = 0.0032 · L3.16 [5] is therefore used further in biomass and production calculations.
Figure 6.
Length distribution in smelt catches from spawning grounds in Furnesfjorden in different years.
3.3. Age and Growth
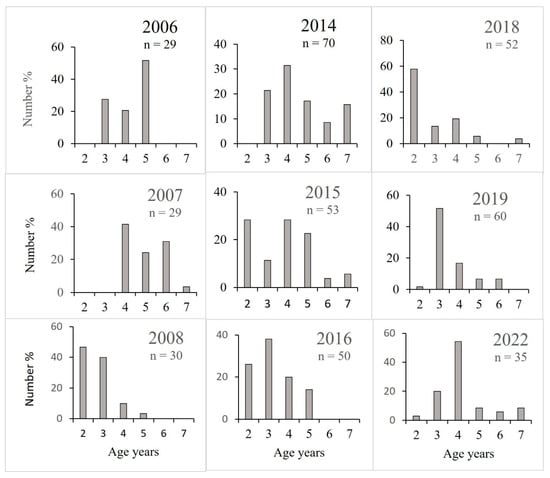
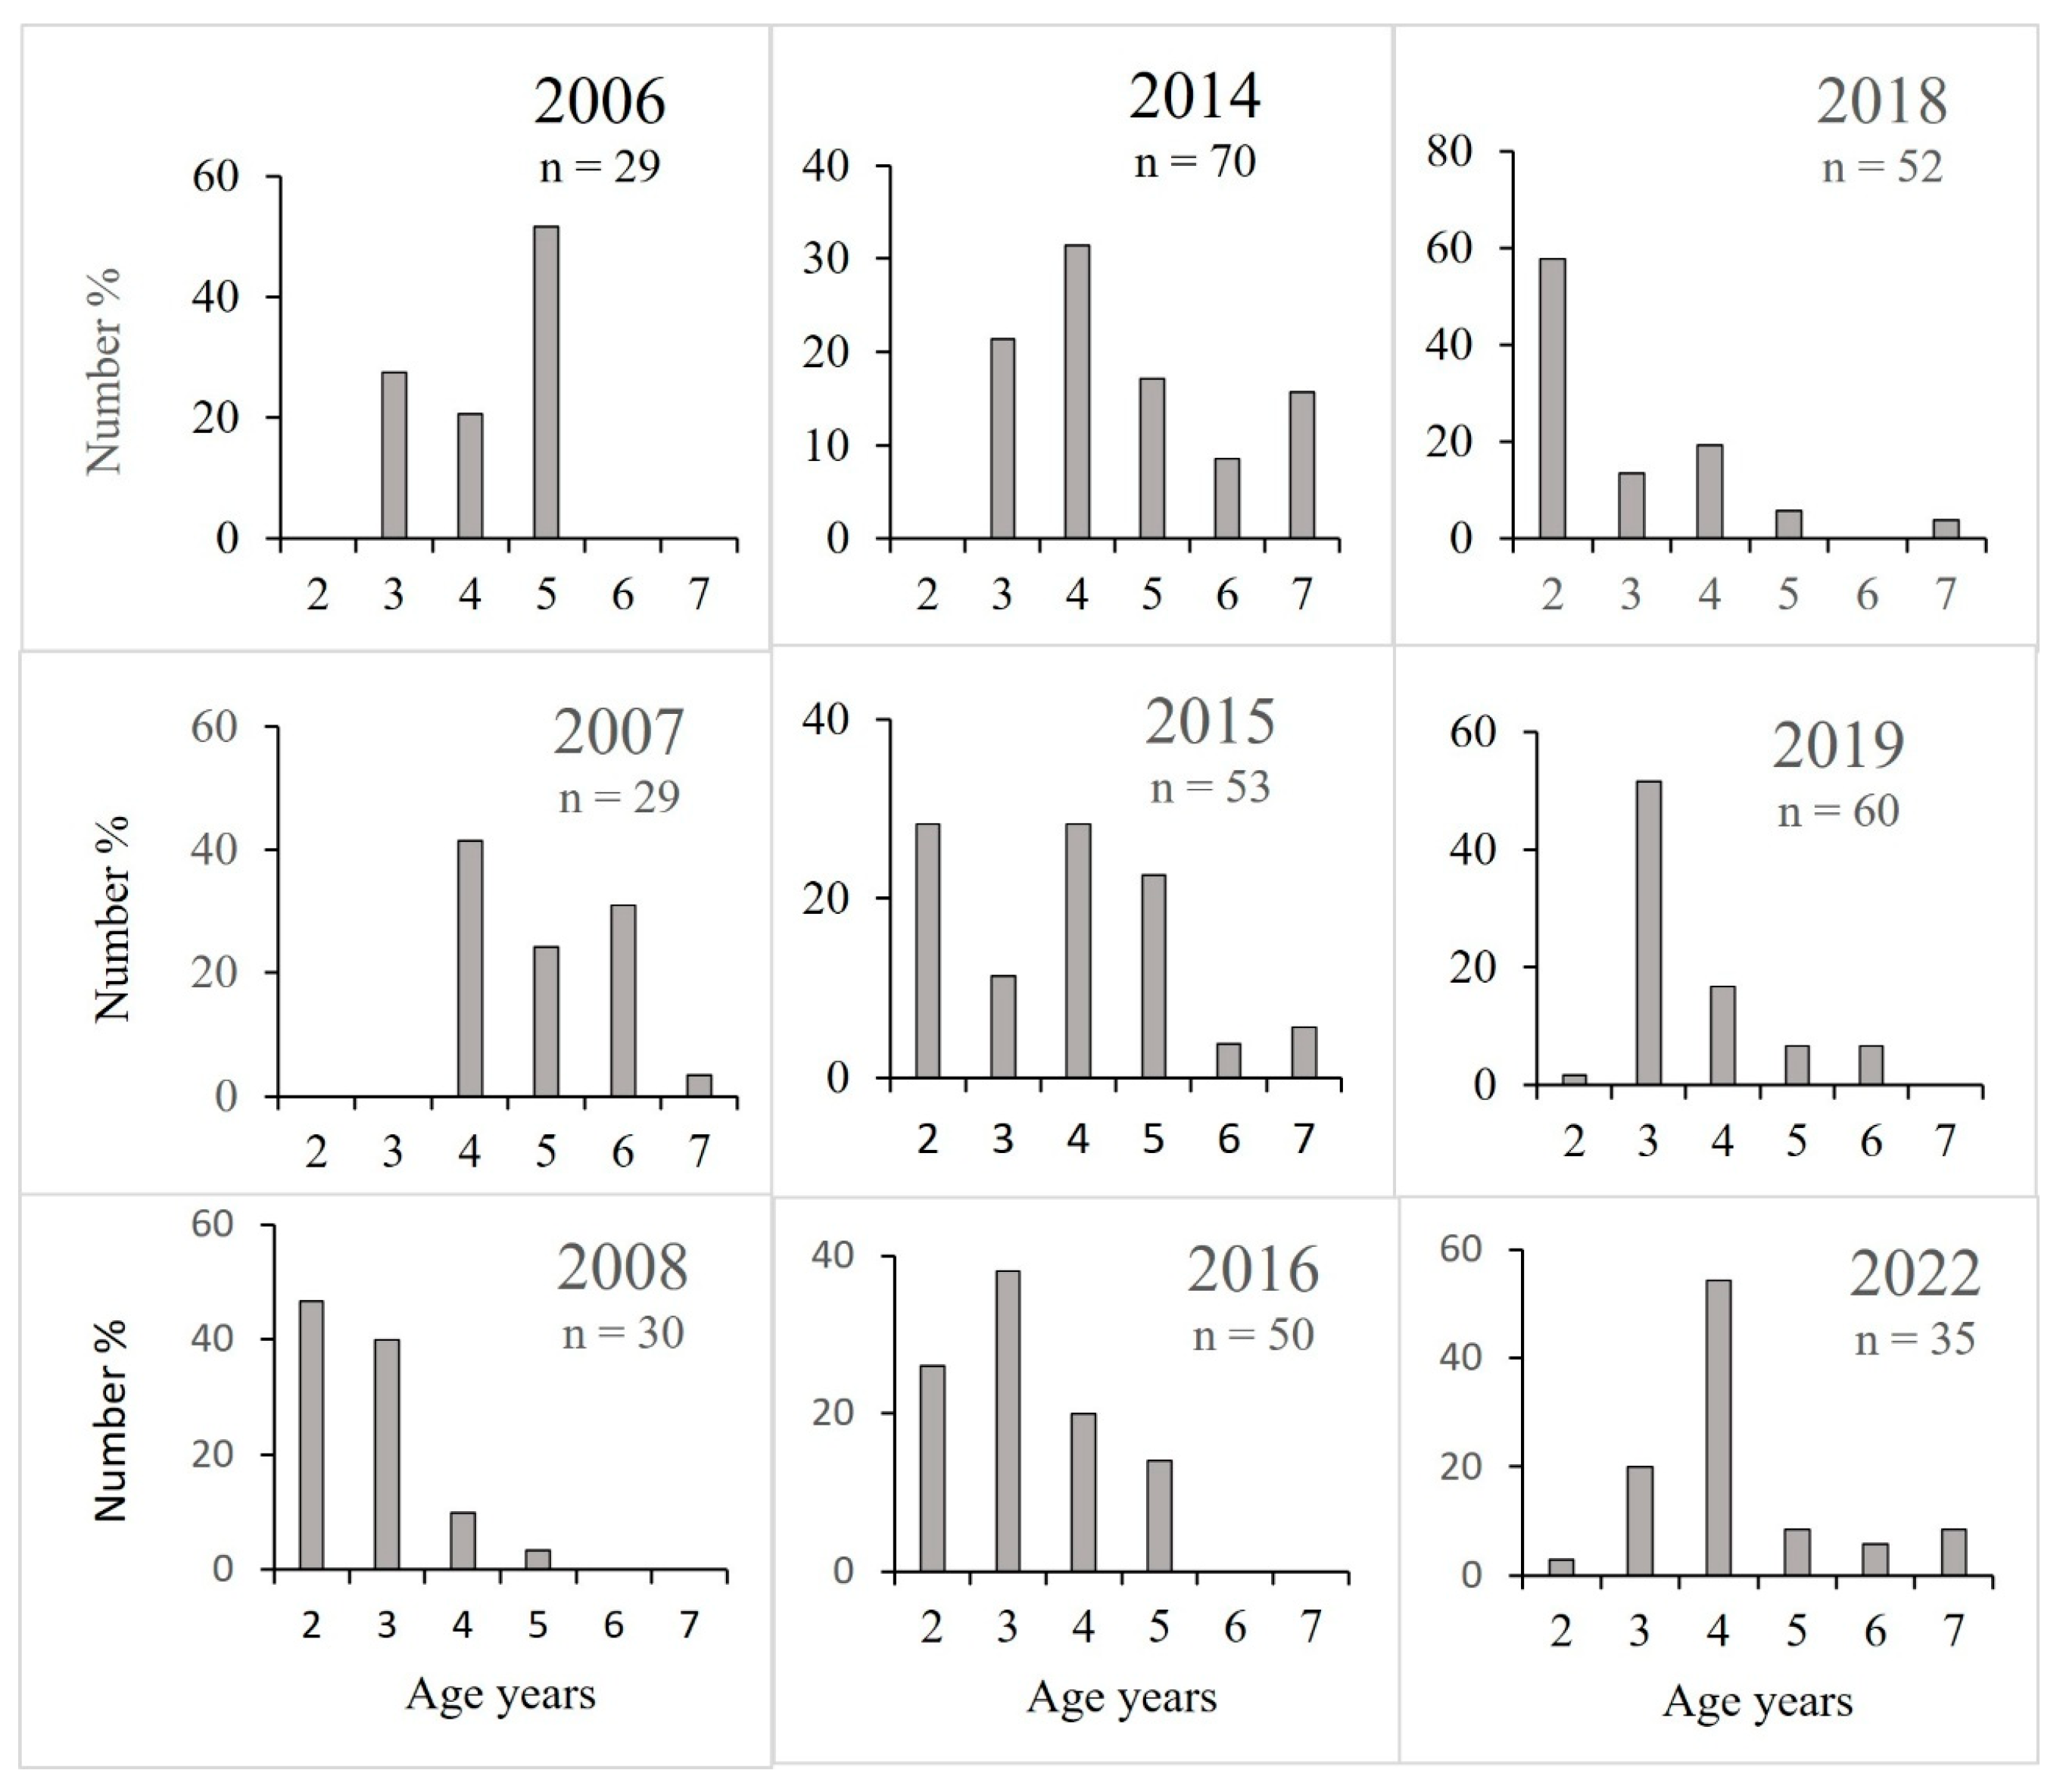
In the period 2006–2022, smelt of age group 2+ and 3+ accounted for an average of 42% of the catches, but this varied widely, from 0 to 79% (Figure 7). In some years, there were no 2+ smelt in the catches, reflected in the length distributions from 2006, 2007 and 2014. A large proportion of 2+ indicates a strong year class, and conversely, an absence of 2+ in the catches indicates a weak year class, although it may also be due to a year of later sexual maturation.
Figure 7.
Age distribution in smelt catches from spawning grounds in Furnesfjorden in different years.
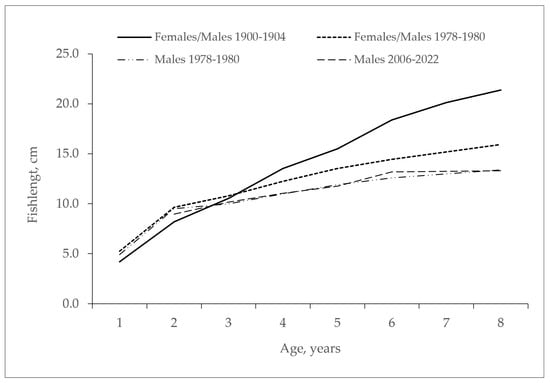
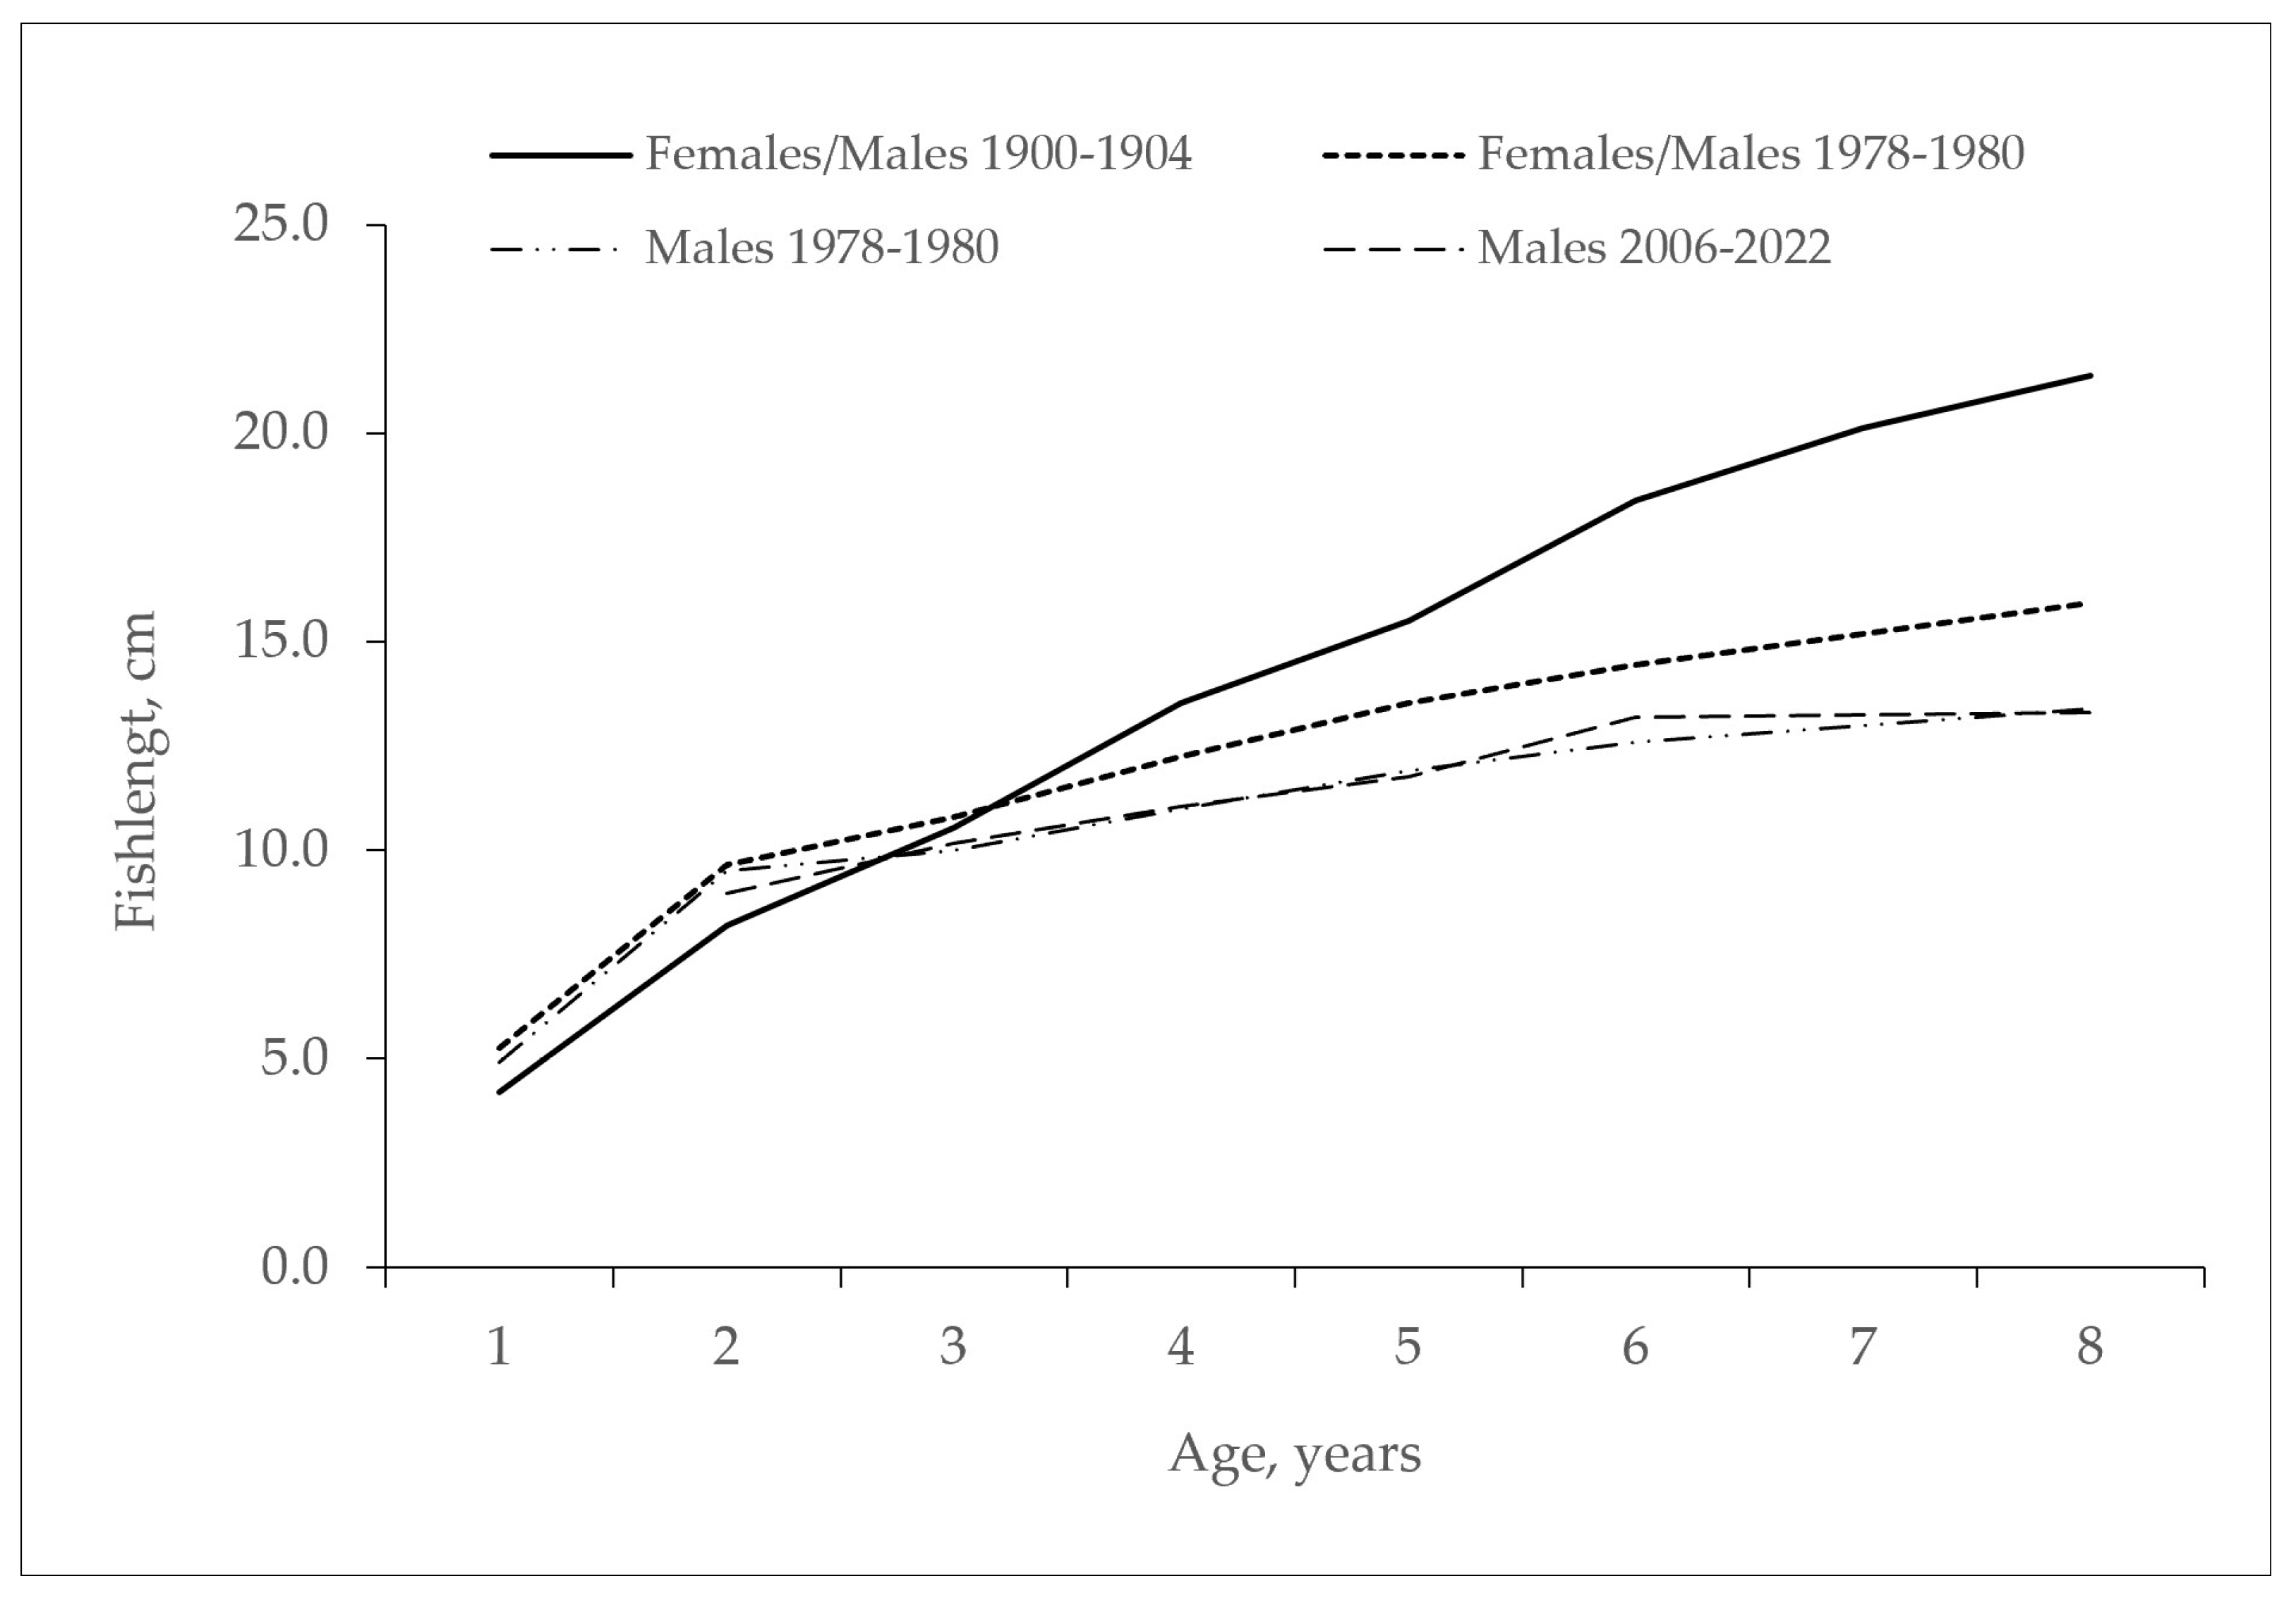
Mean length at age of smelt decreased from 1917 to 1980 (Figure 8), suggesting that growth was faster in 1917. Age determination in the oldest material is based on scales. It can be difficult to distinguish winter zones in scales from old fish, so the age may be underestimated. Females grow faster than males, and most large-grown smelt are females. Since large smelt are assumed to be underrepresented in most dipnet catches, growth curves for males from 1979 to 1980 are compared with the material from 2006 to 2022 (Figure 8). The curves appeared quite similar, stagnating just above 13 cm. Most smelt older than 8+ of both sexes were large grown (over 20 cm). A linear model for normal smelt length with age as a continuous predictor and growth year as a categorical predictor showed that growth was faster in 2013 and 2014 than in 2005–2007, while growth was slower in 2017, 2018 and 2021 (Table 2). Slower growth in recent years may be due to increased density of both smelt, vendace and whitefish.
Figure 8.
Mean lengths of normal smelt females and males combined from 1900 to 1904 and 1978─1980, and mean lengths of males from 1978 to 1980 and 2006─2022.
Table 2.
Linear model of normal smelt length (<15 cm), with predictors Ln (Age) and catch year as predictors (R2 = 0.77, d.f. = 375, p < 0.001). Boldfaced p means significant.
3.4. Survival and Year-Class Strength
Annual survival was calculated to be S = 0.68 (95% C.I. = ±0.03) in the samples from 1980, while in the samples from 2007 to 2022 it varied from 0.38 to 0.65, in part with large 95% C.I. (Table 3), and was on average 0.48 (95% C.I. = ±0.08) which is significantly lower than the rate from 1980 (non-overlapping C.I.). The sample from 2006 was omitted from the calculations because it consisted of too few age groups.
Table 3.
Annual survival (S) and instantaneous mortality (Z) estimated for smelt caught in different years.
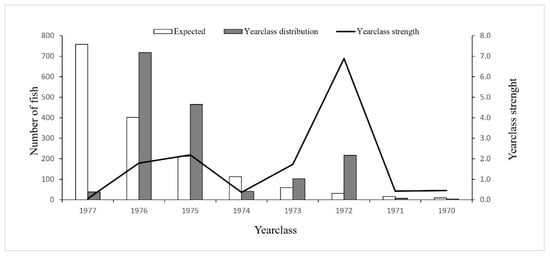
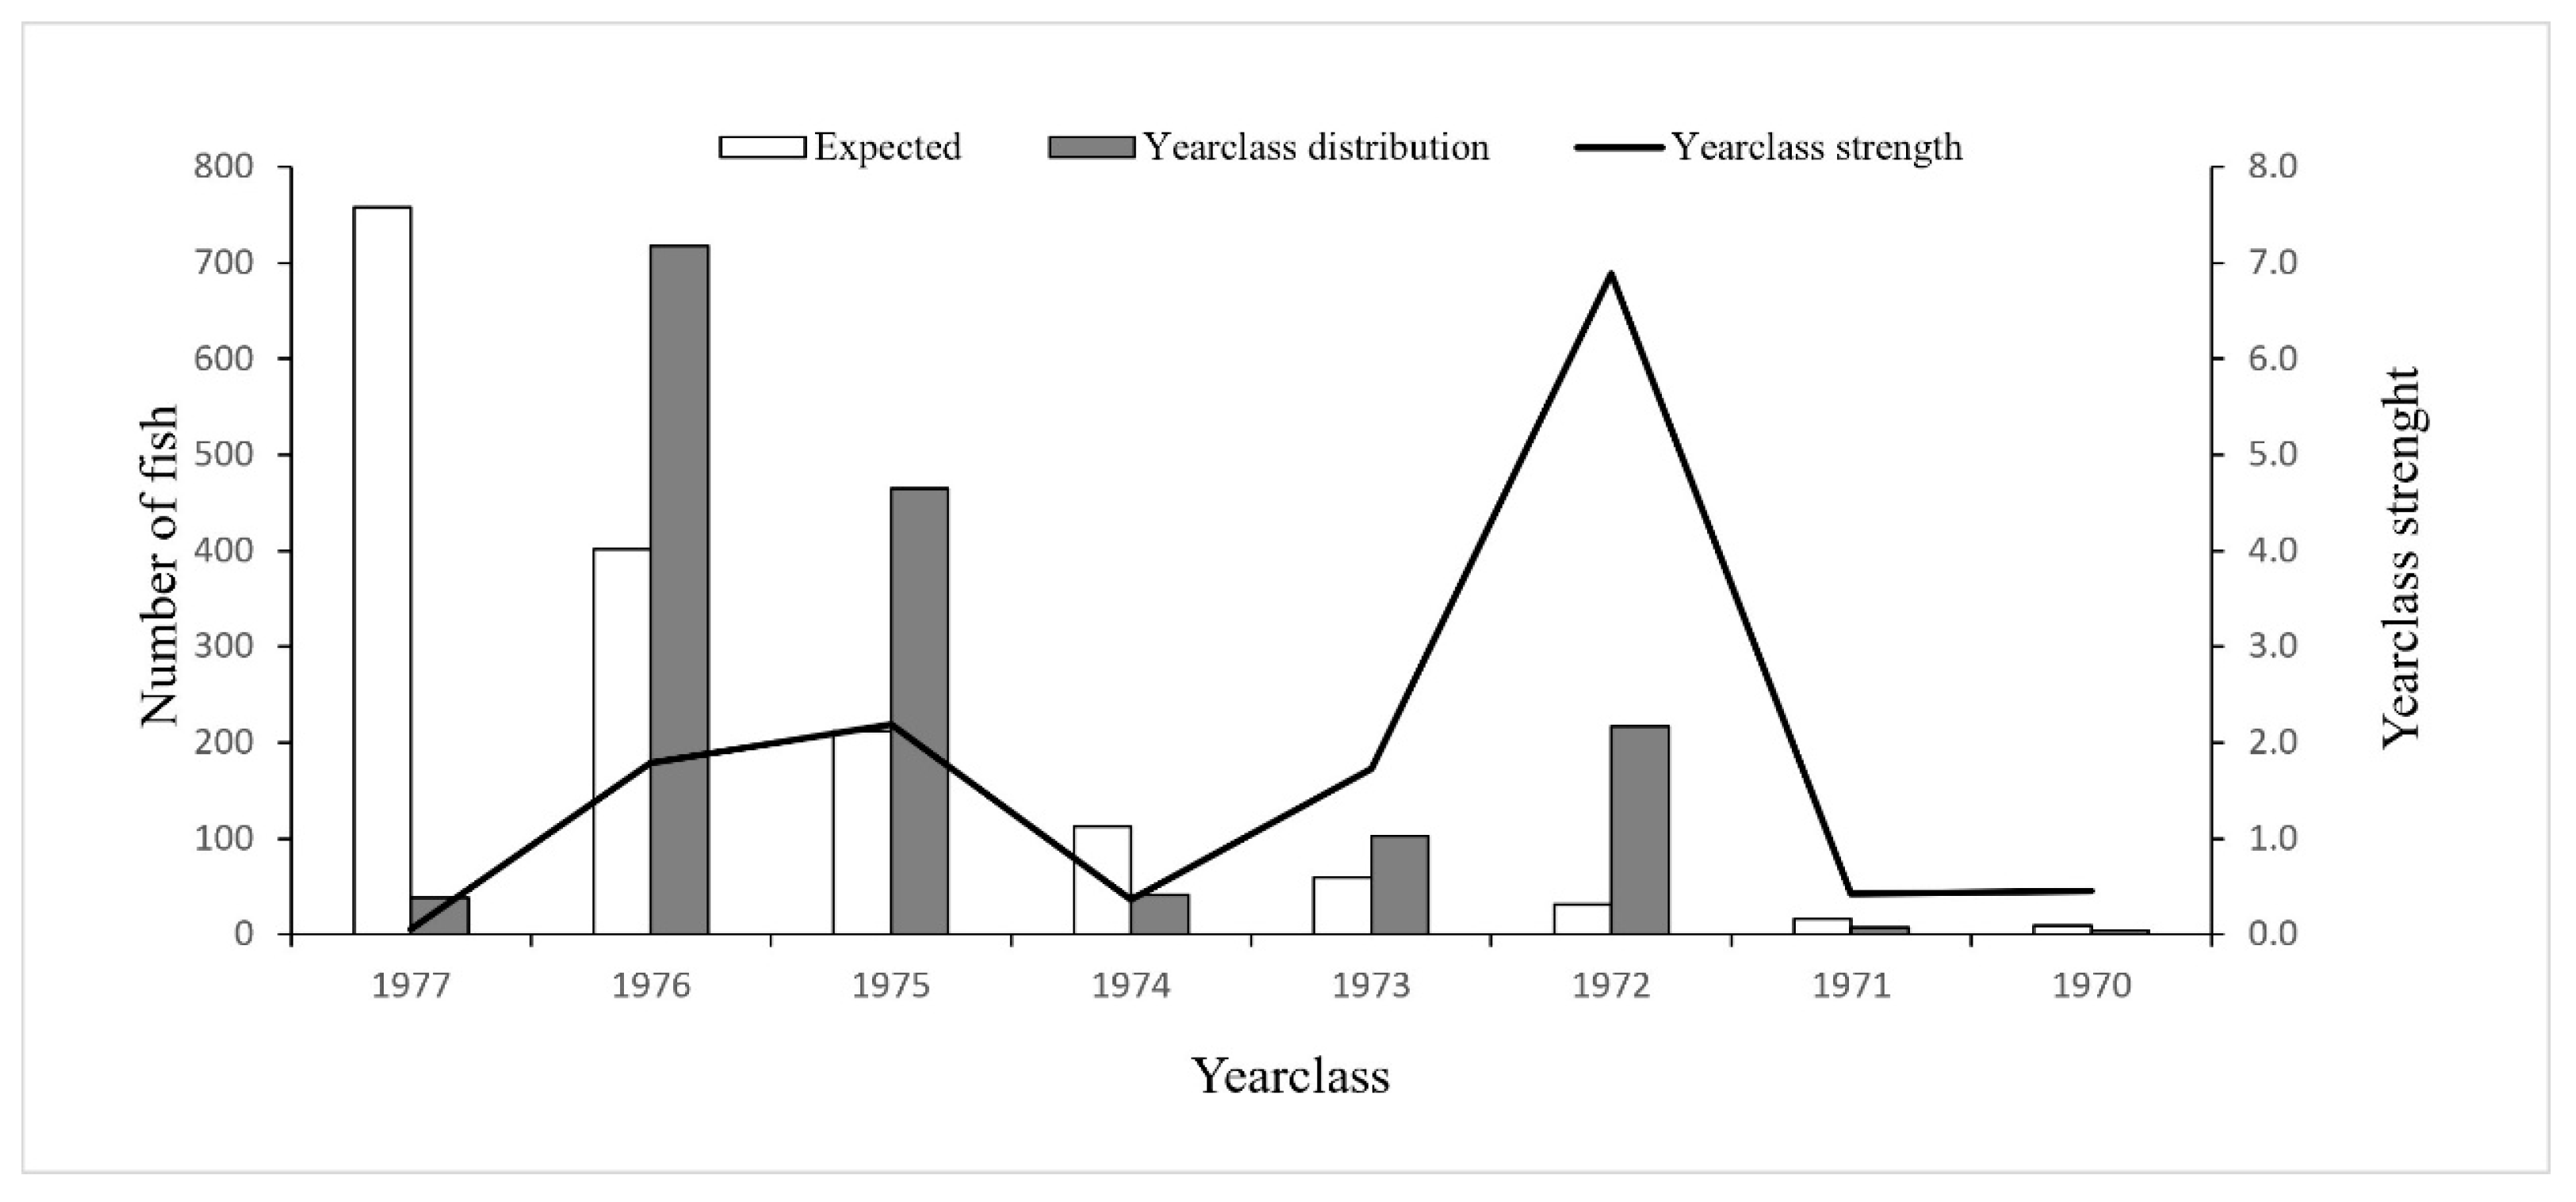
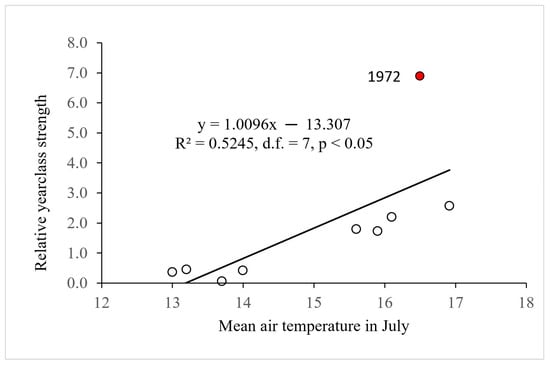
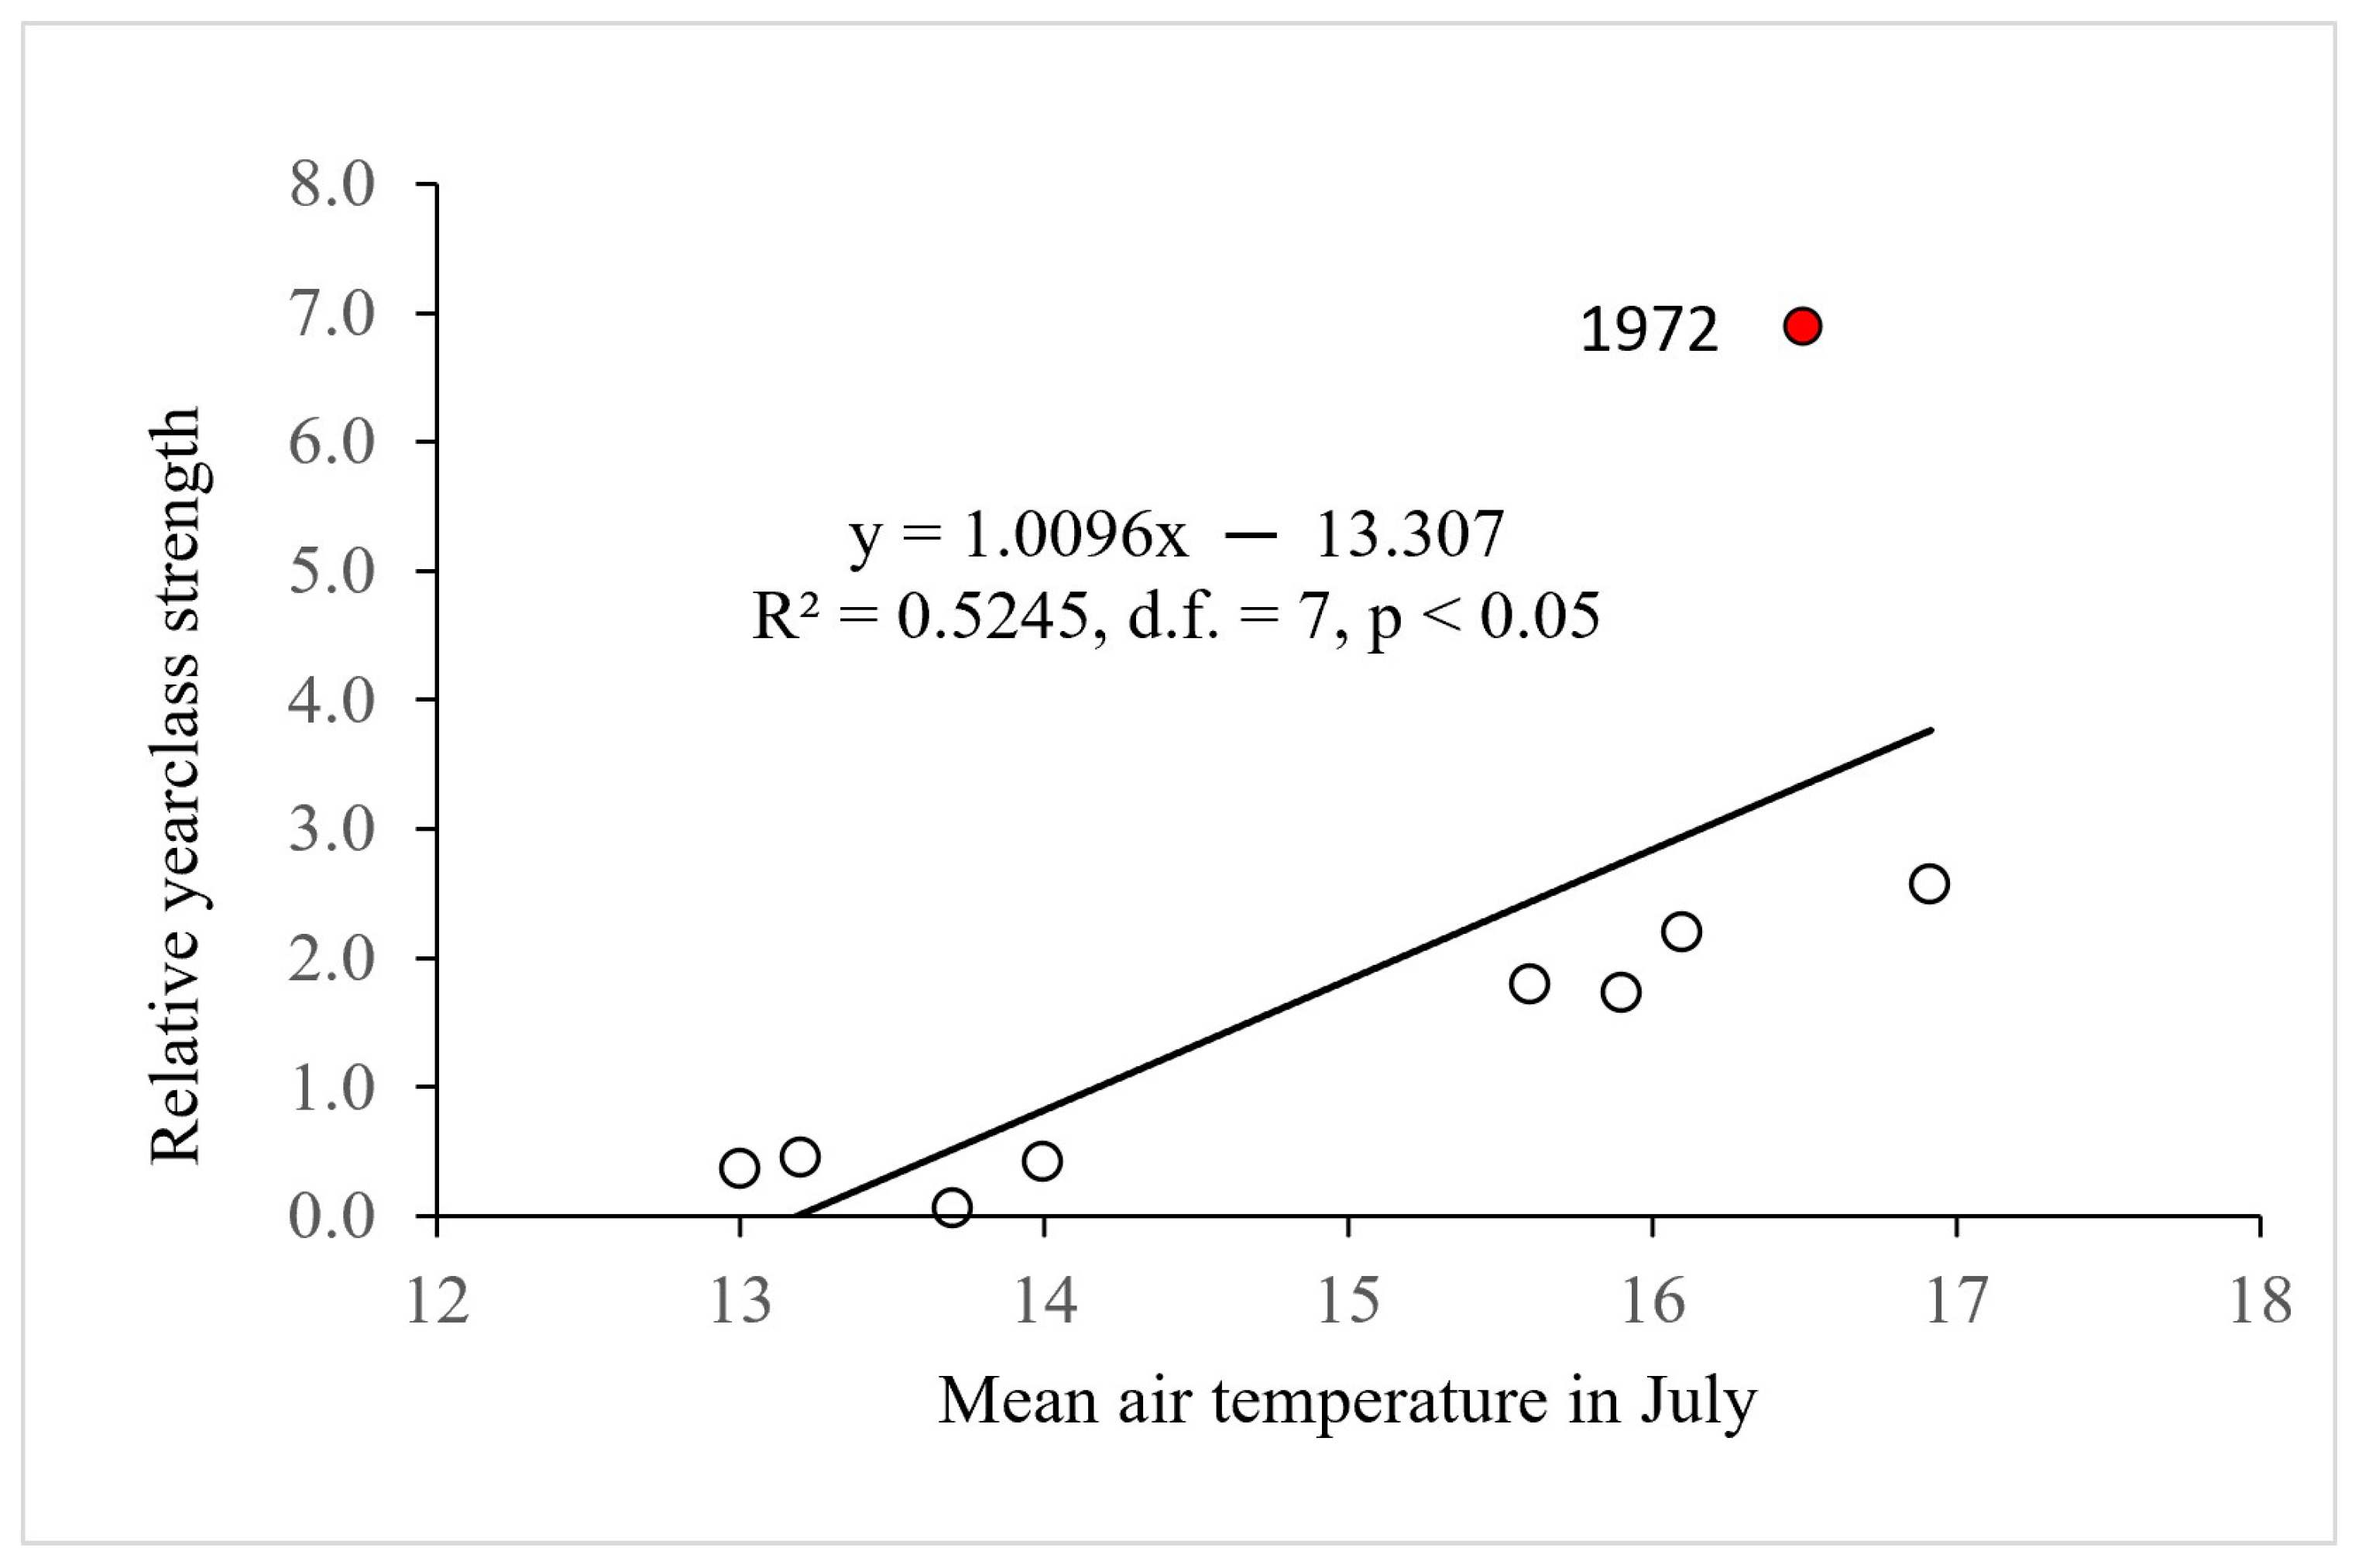
Sandlund, Klyve [5] pointed out that strong year-classes seemed to appear after two years of weak year-classes, and that the two subsequent strong year-classes of 1975 and 1976 were exceptions. Calculated relative year-class strength in the 1980 material (Figure 9 and Figure 10) was positively correlated to mean air temperature in July. The year-class strength in the 1979 sample was also positively affected by the July temperature, but not significantly, due to the exceptionally strong 1972 year-class. There was no significant correlation with temperature in April, May, June or August. Weak year-classes from 1970 and 1971 may have resulted in higher survival of smelt larvae and a stronger year-class in 1972 than the temperature model suggests, but it may also be due to factors for which we have no measure, like predation from other fish species and birds. The size of the spawning population (population fecundity) in an actual year may also potentially affect year-class strength. There was a weak non-significant negative correlation between year-class strength and the increase in water level in the period 15 May to 7 June (r = −0.20, d.f. = 5, p > 0.05).
Figure 9.
Observed year-class distribution, estimated expected year-class distribution and relative year-class strength in smelt samples from 1980.
Figure 10.
Relative year-class strength in smelt samples from 1980 plotted on July air temperature.
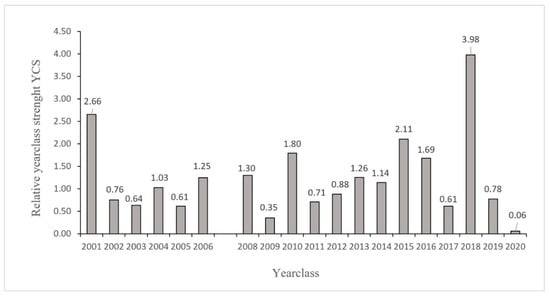
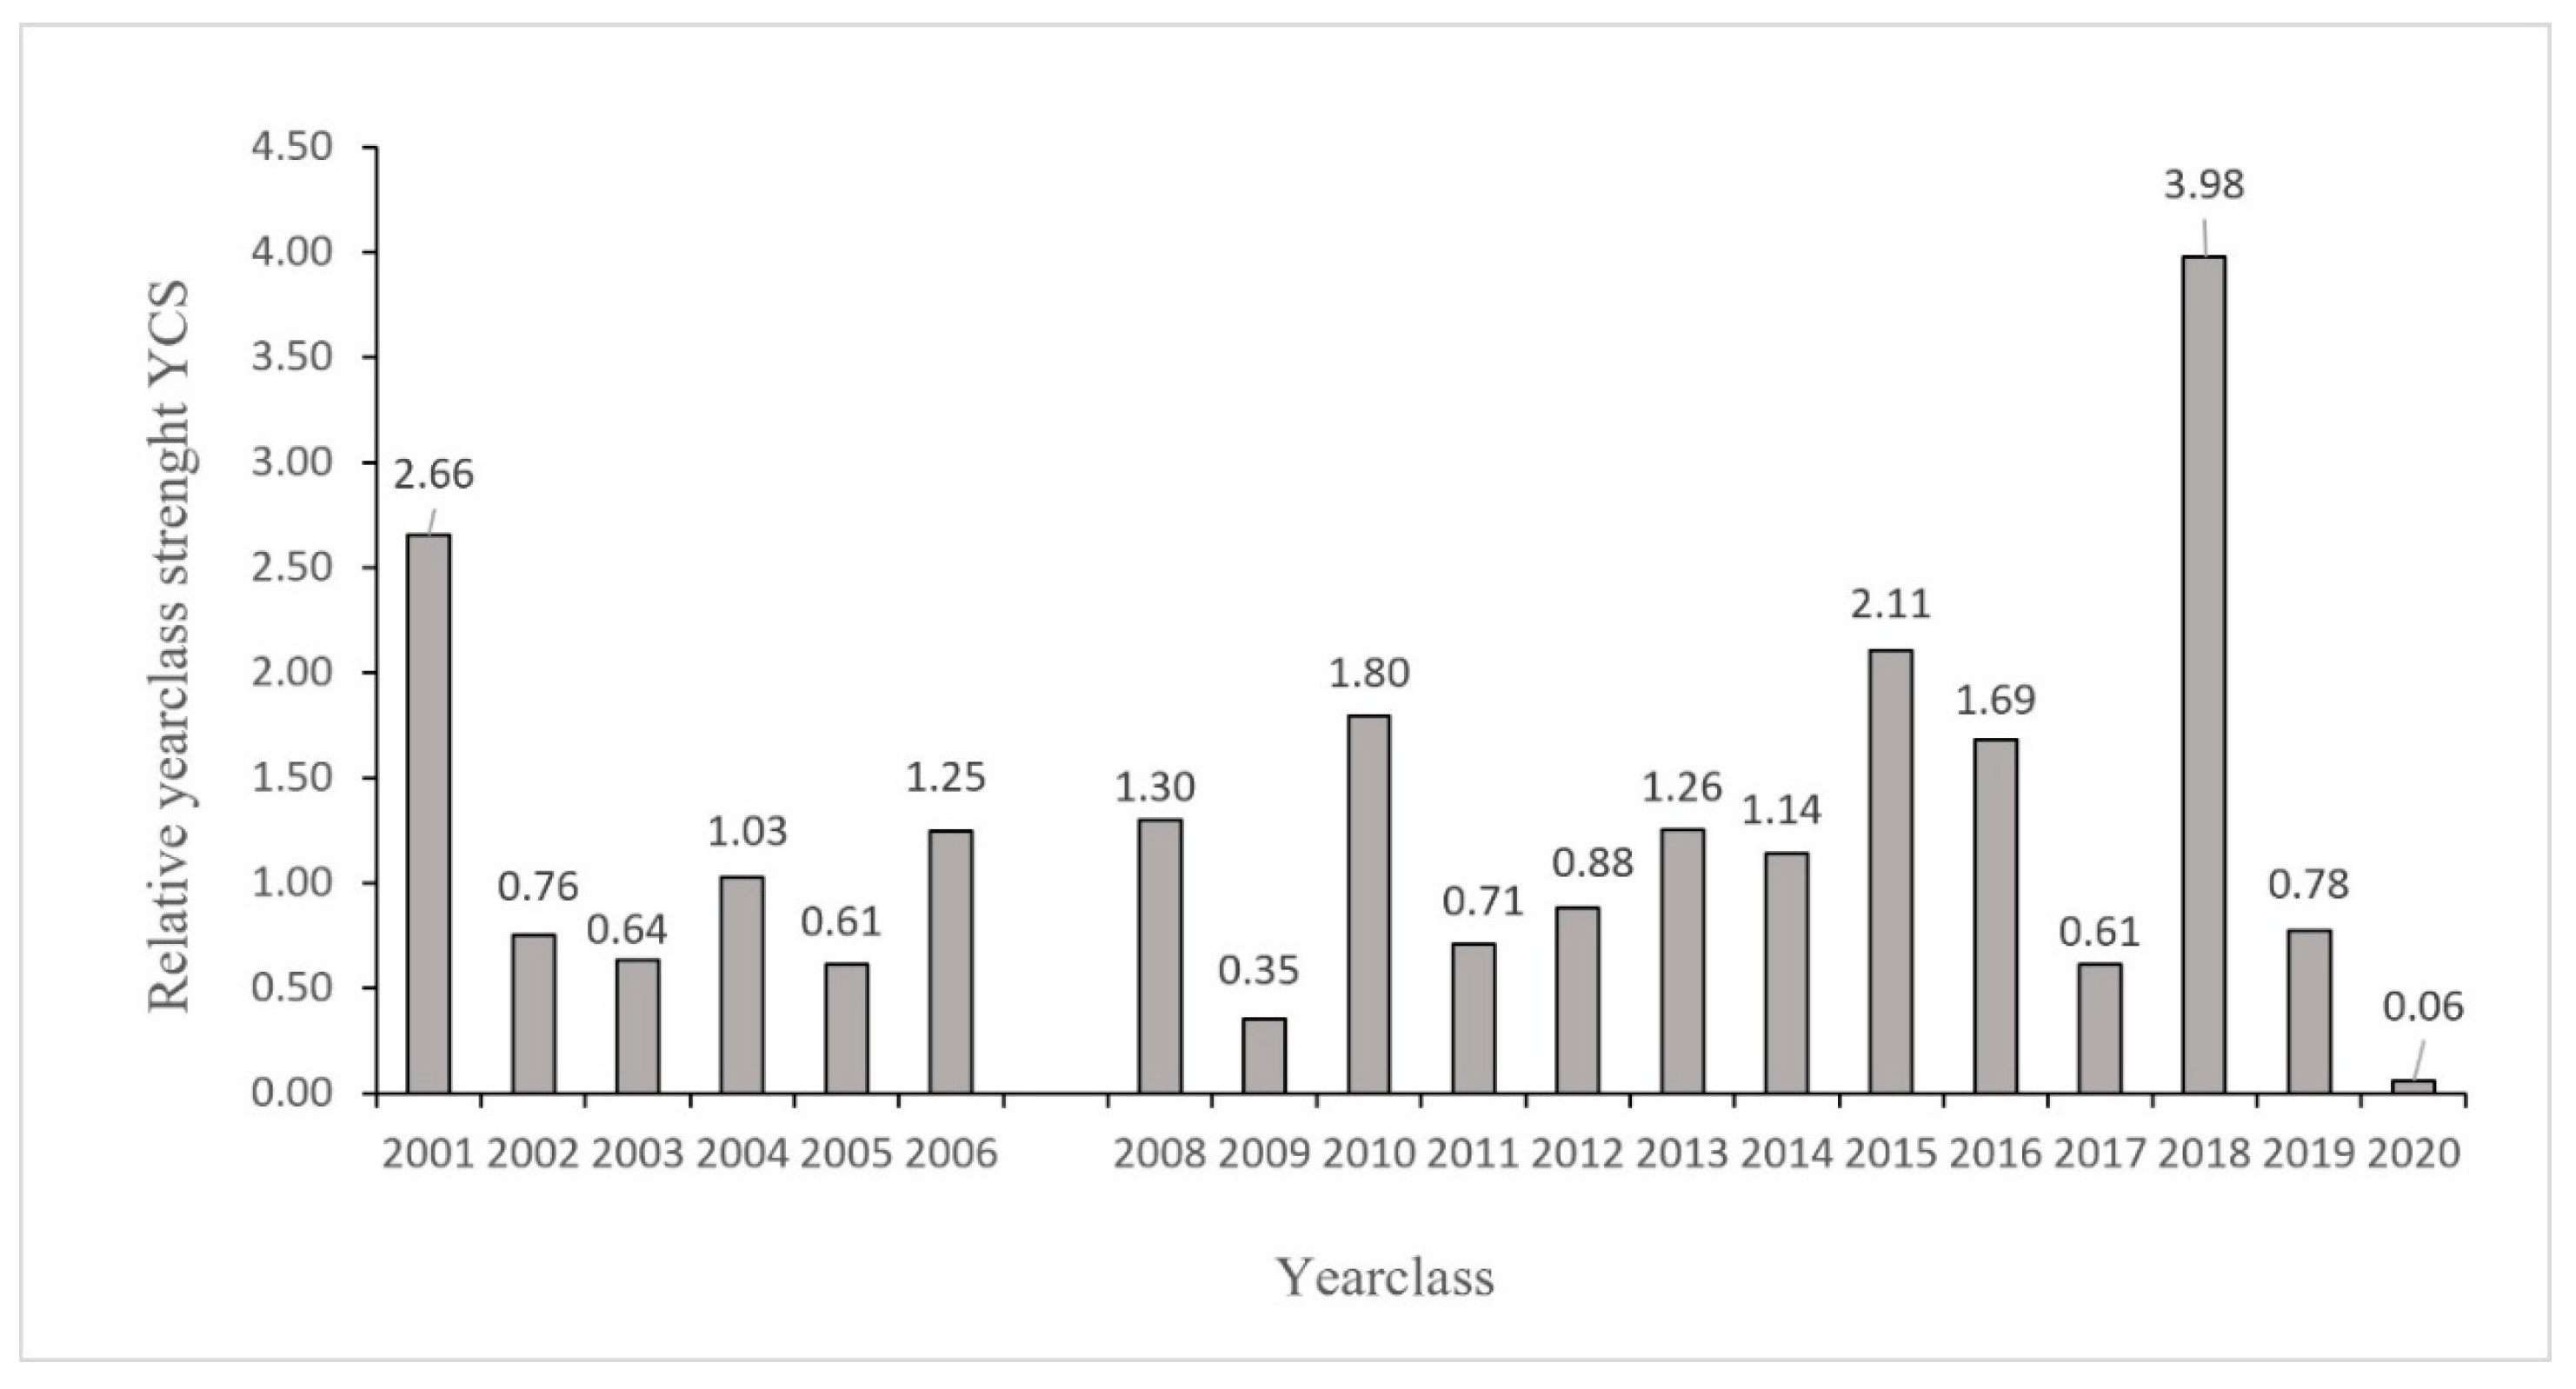
In the material sampled in 2006 to 2022, the year-classes from 2001 and 2018 stand out as strong, while the variation in the years between them was more moderate, with exceptions of 2010, 2015 and 2016 (Figure 11). A significant positive correlation was found between year-class strength and air temperature in May (r2 = 0.35, d.f. = 17, p < 0.05) and July (r2 = 0.26, d.f. = 17, p < 0.05), but not June (r2 = 0.16, d.f. = 17, p >0.05) or August (r2 = 0.06, d.f. = 17, p > 0.05). In the multiple regression, July temperature was the only one with significant effect. There was a negative non-significant effect of Ln(YCS.1+) (Table 4). The effects of Ln(YCS.3+) and ∆h (not included in the final model) were even less. The overall coefficient of explanation for the model R2 = 0.42, i.e., an explanation coefficient of 42%, is less than that of July temperature alone (52%) explained in the 1980 samples. July temperature alone explained 34% of variation in the 2006–2022 material.
Figure 11.
Estimated relative strength of year-classes 2001 to 2020 (no data achieved for the 2007 year-class).
Table 4.
Linear model of relative year-class strength (2001–2020) of smelt with two predictors (R2 = 0.421 (d.f. = 15, p < 0.01).
A weakness of the method is low/no catchability for 2+ smelt at the spawning site in years with late sexual maturation. The absence of 2+ smelt in the 2007 material suggests that this was a year of late maturation as 3+ smelt were represented in the 2008 catches.
3.5. Population Dynamics, Biomass and Production
By means of a life history table (Table 5, left part) with annual survival S = 0.68 and growth curve from 1980, biomass B = 2.44 kg/ha is estimated from the same year [27] by selecting N01 = 157 recruits of 1-year smelt at the start of the season, and the model then gives NM = 411 smelt/ha (Table S2A), P = 1.06 kg smelt/ha, the ratio between production and biomass P/B = 0.43 and average weight W = 5.9 g.
Table 5.
Life history tables for smelt based on data from Sandlund, Klyve [5], Sandlund, Næsje [27] (left part) and from data sampled after 2006 in addition to Eikland, Gjelland [38] (right part) with estimation of biomass (B) and production (P) i the age groups 1–7 (N′ og B′, density and biomass at the start and end of season).
Using an average weight WM = 10 g (which was assumed in the report), NM is calculated. = 2.44/0.01 = 244 smelt/ha for the period 1978–1980. This is achieved by starting the model with N01 = 91 recruits (Table S2B). The model then gives B = 1.49 kg/ha, P = 0.60 kg/ha, P/B = 0.41 and average weight W = 6.1 g (Table 5, left part). The modeled NM is 39% lower than the reported estimate, due to the change in WM from 10 to 6.1 g.
The model for 2023 (Table 5, right part) with S = 0.48 and growth curve from 2006 to 2022 material, with inserted N01 = 2847 recruits, gives NM = 4816, BM = 15.8 kg/ha as reported (Table S3A), and P = 9.97 kg/ha. This density is higher than the total pelagic fish density that was reported (N = 4770 fish/ha) [38] and must be too high. By assuming WM = 5.0 g (slightly higher than in the trawl catches) we get NM = 15.8/0.005 = 3160 fish/ha, which is obtained in the model by starting with N01 = 1868 (Table 5, right part, ST 3B). Then NM = 3160 and BM = 10.4 kg/ha, which is 34% lower than the reported estimate, though it is still more than 6× the estimate of 1980, and P = 6.5 kg/ha is a 10-doubling of production.
Using data from Furnesfjorden 2021 and 2024 (N0, since it was registered at the start of the season), the model (Table S1A,B), BM = 4.5 kg/ha and 3.2 kg/ha, P = 2.95 kg/ha and 2.05 kg/ha, respectively. The model gives an average weight W = 3.2 g, which is low, as echo strength transformed to length and further to weight gave W = 3.9 g. If survival for adult fish S (which varied between years) is underestimated, the model comes up with a downward biased WM.
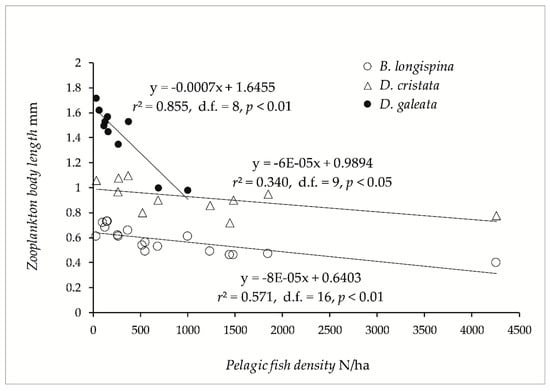
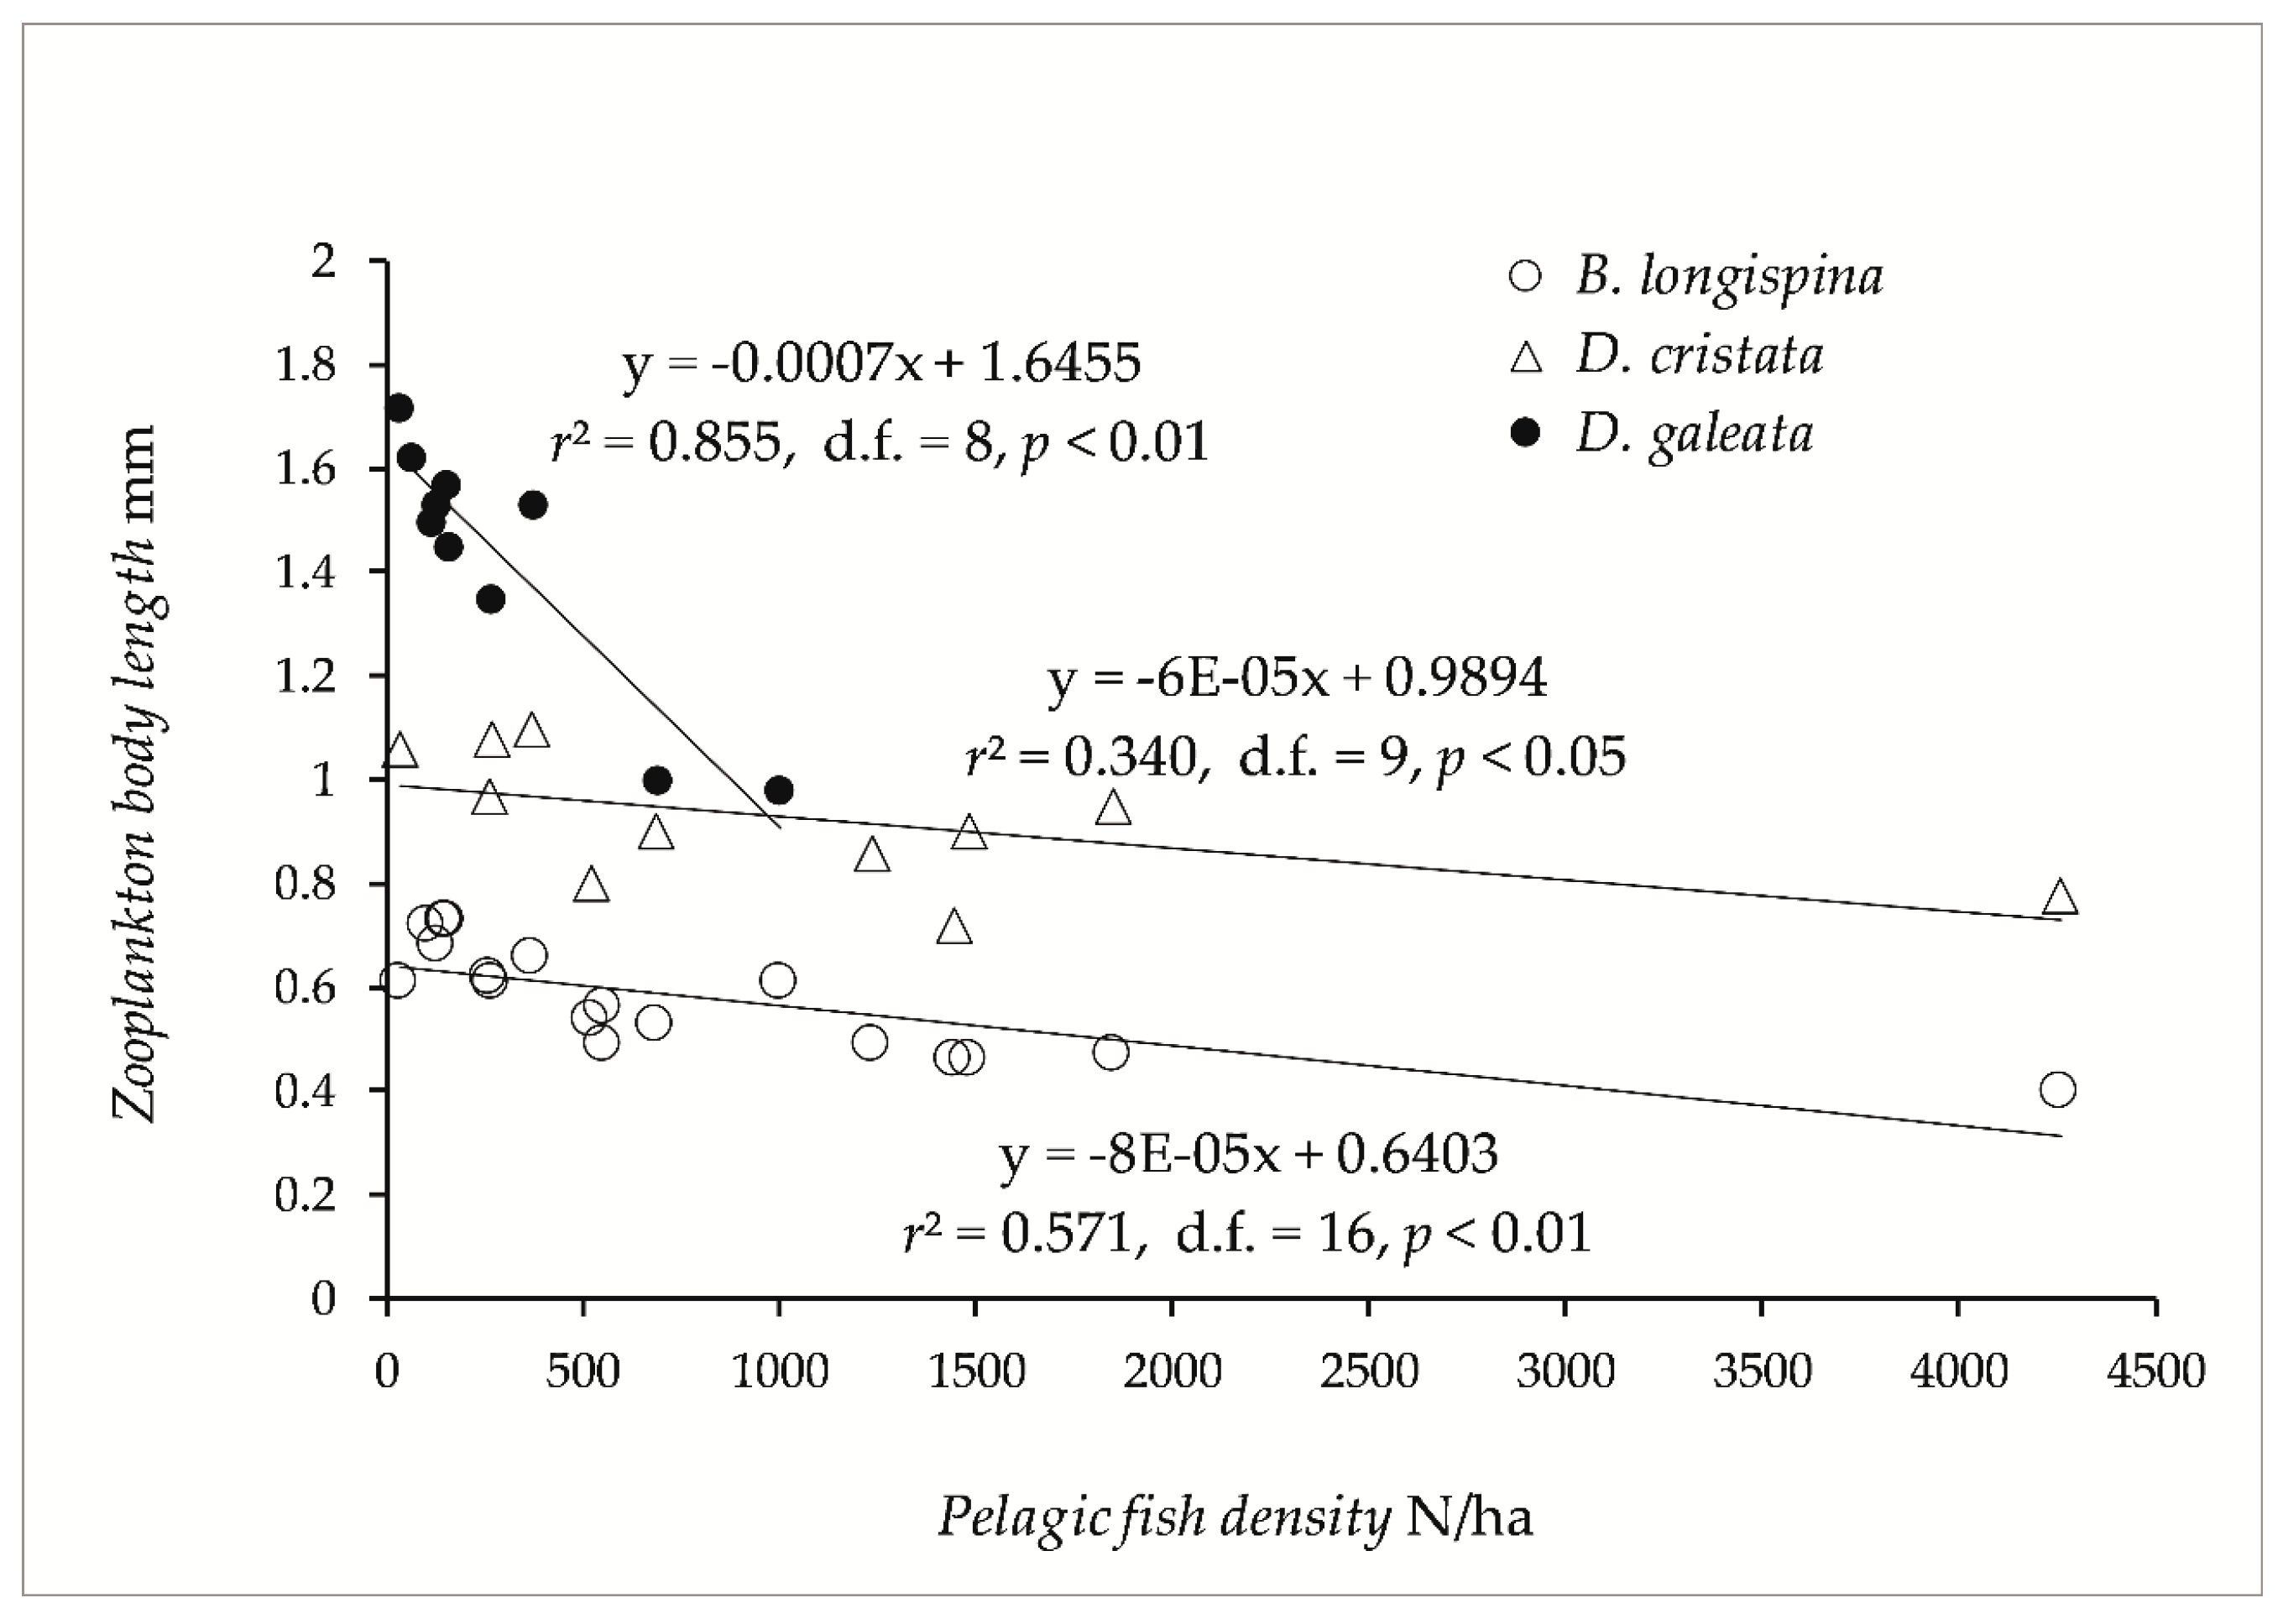
As mentioned, the smelt population growth may be due to reduced abundance of the food competitors, vendace and whitefish in the decade before 1990. Or did the smelt and whitefish decrease because the smelt population increased? In 2023, however, the sum of the three pelagic species had increased to over 4000 fish/ha. These are high numbers for those species, in a Nordic lake considered oligotrophic [41]. Such densities can potentially lead to predation effects on the zooplankton community by changing species and size composition (Figure 12), which in turn can result in problems with algae and cyanobacteria growth [53,54].
Figure 12.
Mean length of three species of Cladocera plotted on pelagic fish density in the 17 studied lakes (after Linløkken [41]).
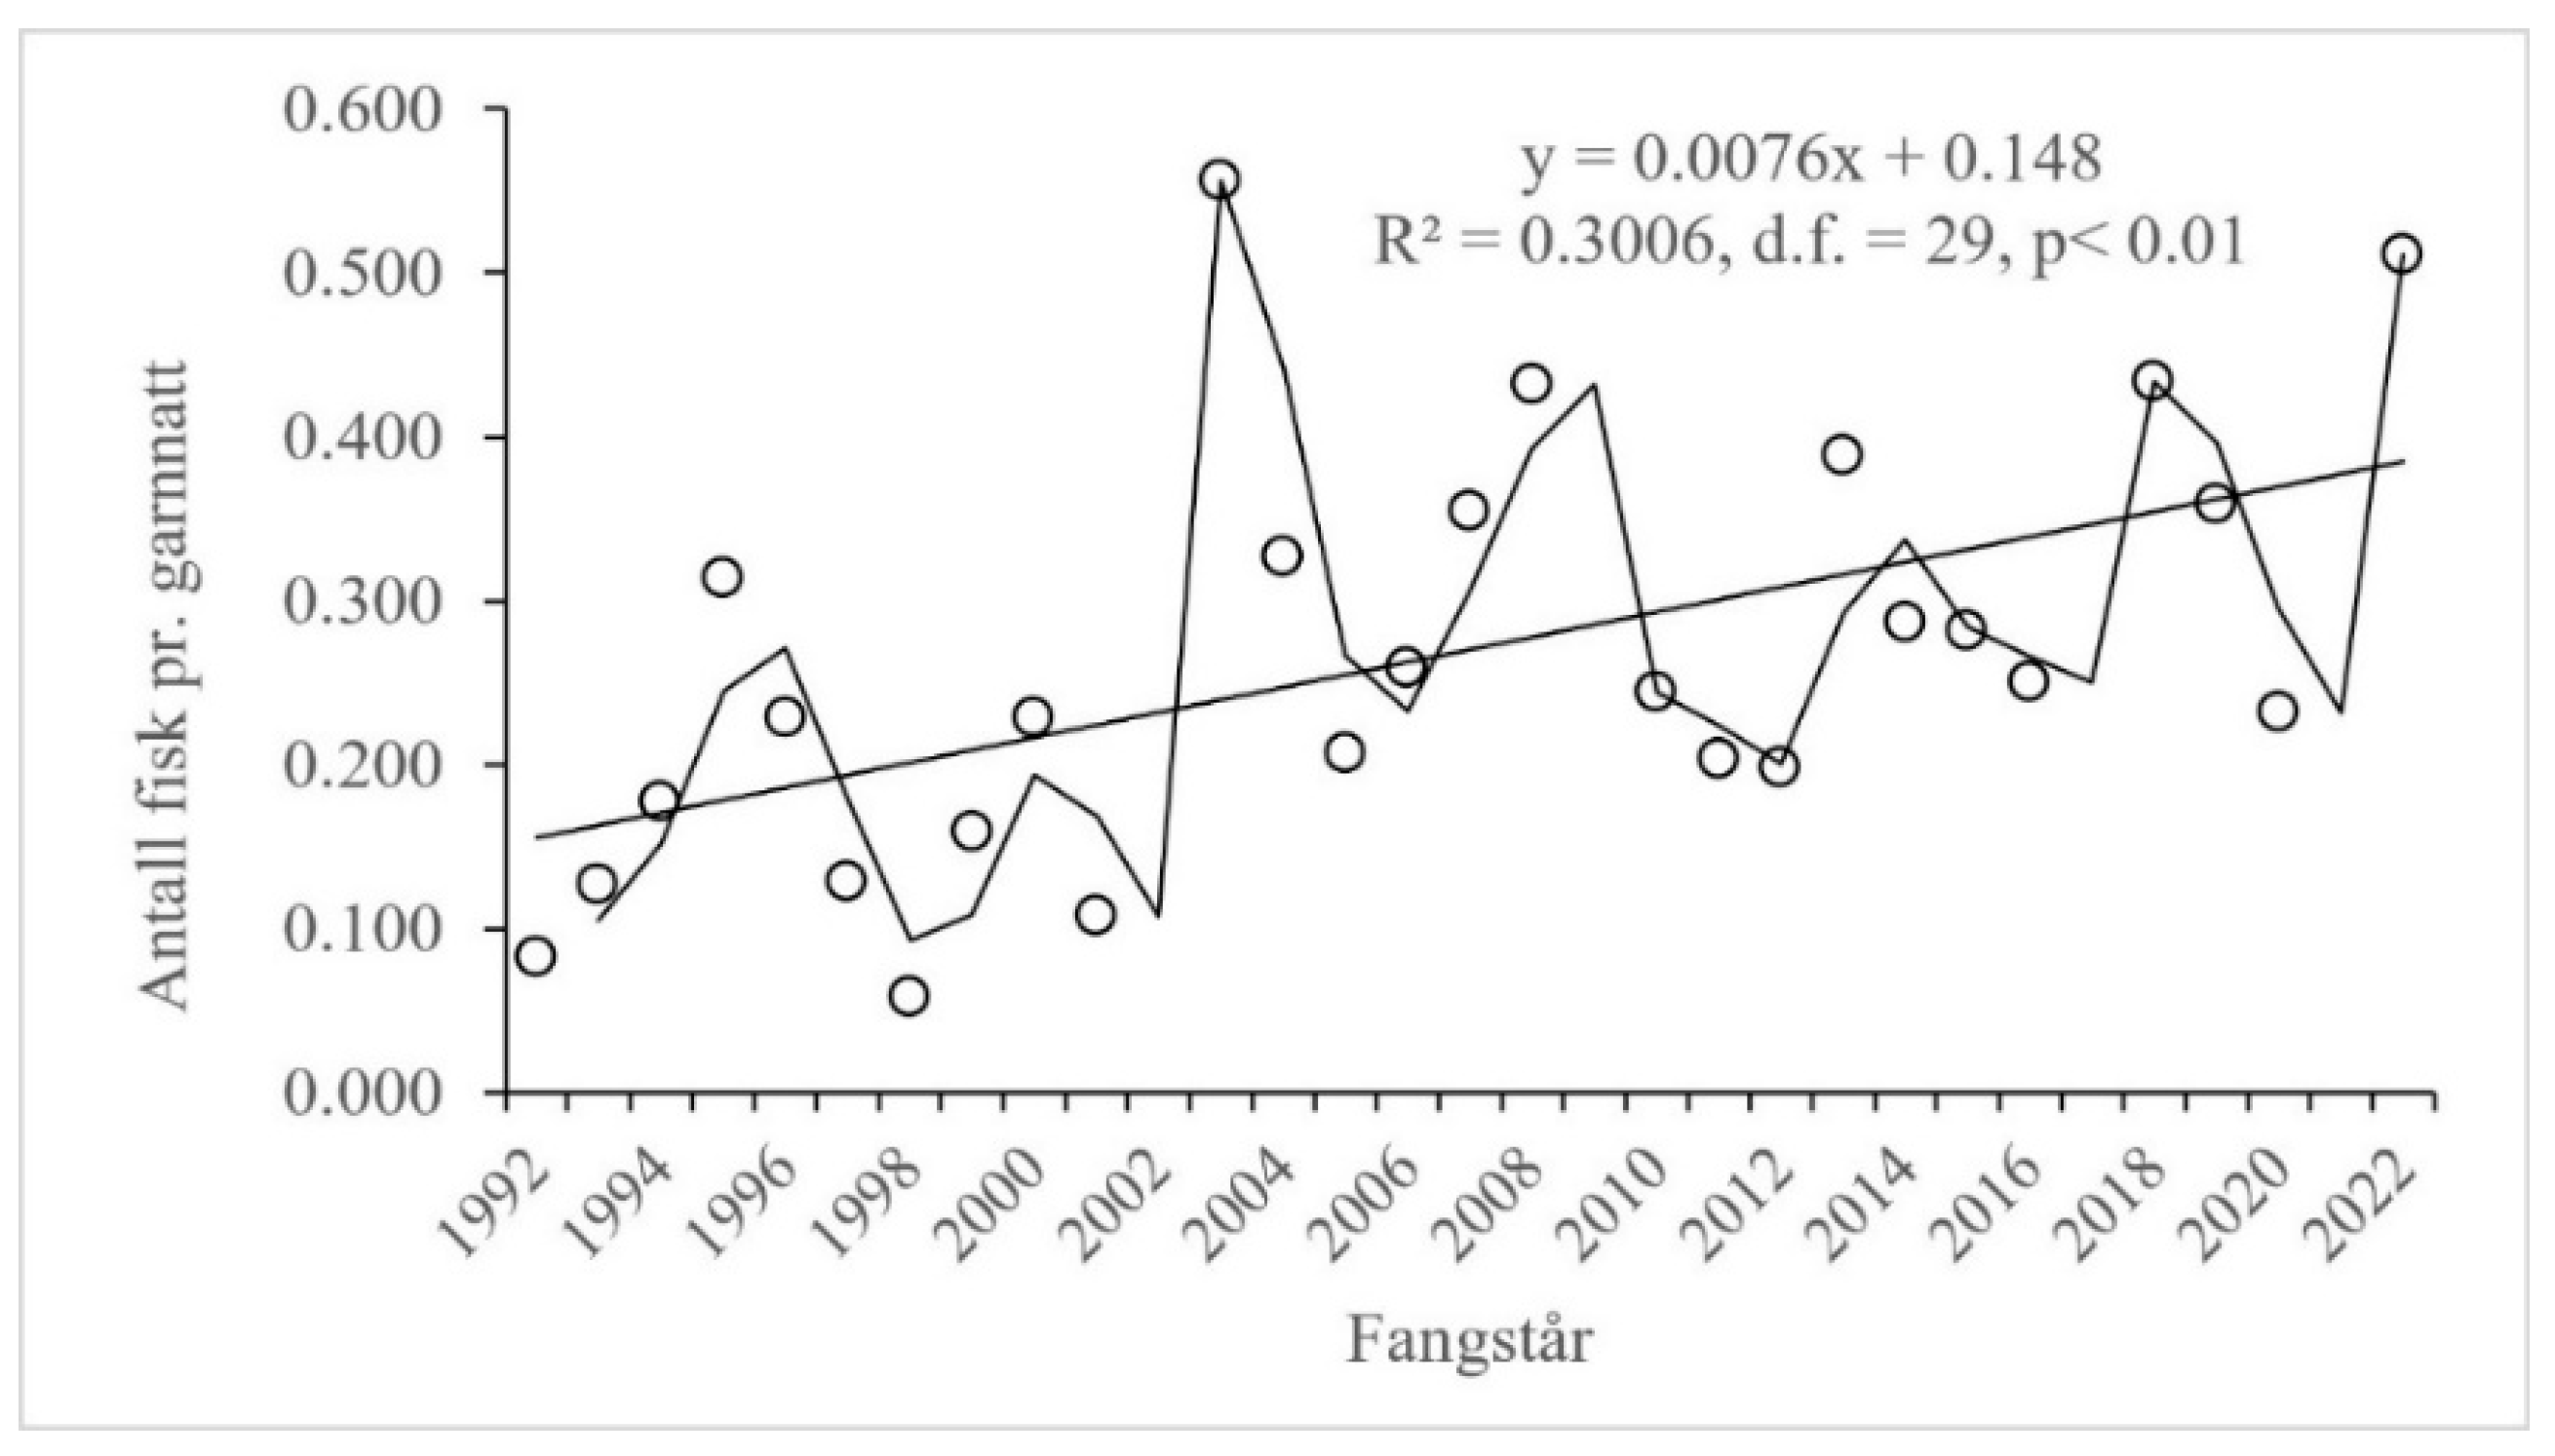
3.6. Brown Trout Population Indicators
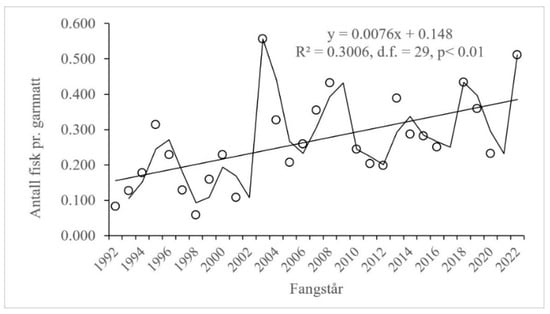
Catch per effort with gill nets in the period 1992 to 2022 shows a significant increase during the period (Figure 13), indicating an increasing brown trout population. Catch per effort in trolling does not show a clear trend, but there was a clear difference between results from 1987 and those from after 1992 (Table 6). In 1985, 491 daily and seasonal permits were sold for Brumunda [49]. In 2007, 2008 and 2009, the number of permits increased to 710, 629 and 815 permits respectively (one-day permits accounted for 53–62%). This means a significant increase in the number of fishermen in the river.
Figure 13.
Catch per net effort (fish/net night) reported by net fishermen, after Statsforvalteren [31].
Table 6.
Mean number of hours used to land a brown trout by rod and reel fishing in Brumunda and Lake Mjøsa and mean fish weight in different time periods, after Qvenild and Nashoug [49] and Norum and Thorkildsen [32].
In 1985, river fishermen spent an average of 5.1 h to catch a trout (Table 6), while in 2007, 2008 and 2009 they spent 2.7, 3.5 and 3.2 h per fish, in other words a little more than half the time they spent in 1985, at the same time as the number of fishermen increased. This indicates an increased population of brown trout. The mean weight of reported catches from Brumunda was 0.56 kg in 1985, and it increased to 1.7, 1.6 and 1.6 kg in 2007, 2008 and 2009 respectively, i.e., a tripling of the average weight of trout caught in Brumunda. The mean weight increased also in the trout catches from Lake Mjøsa.
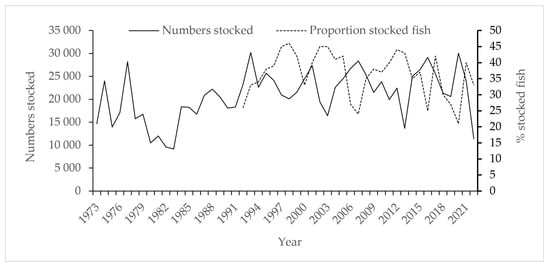
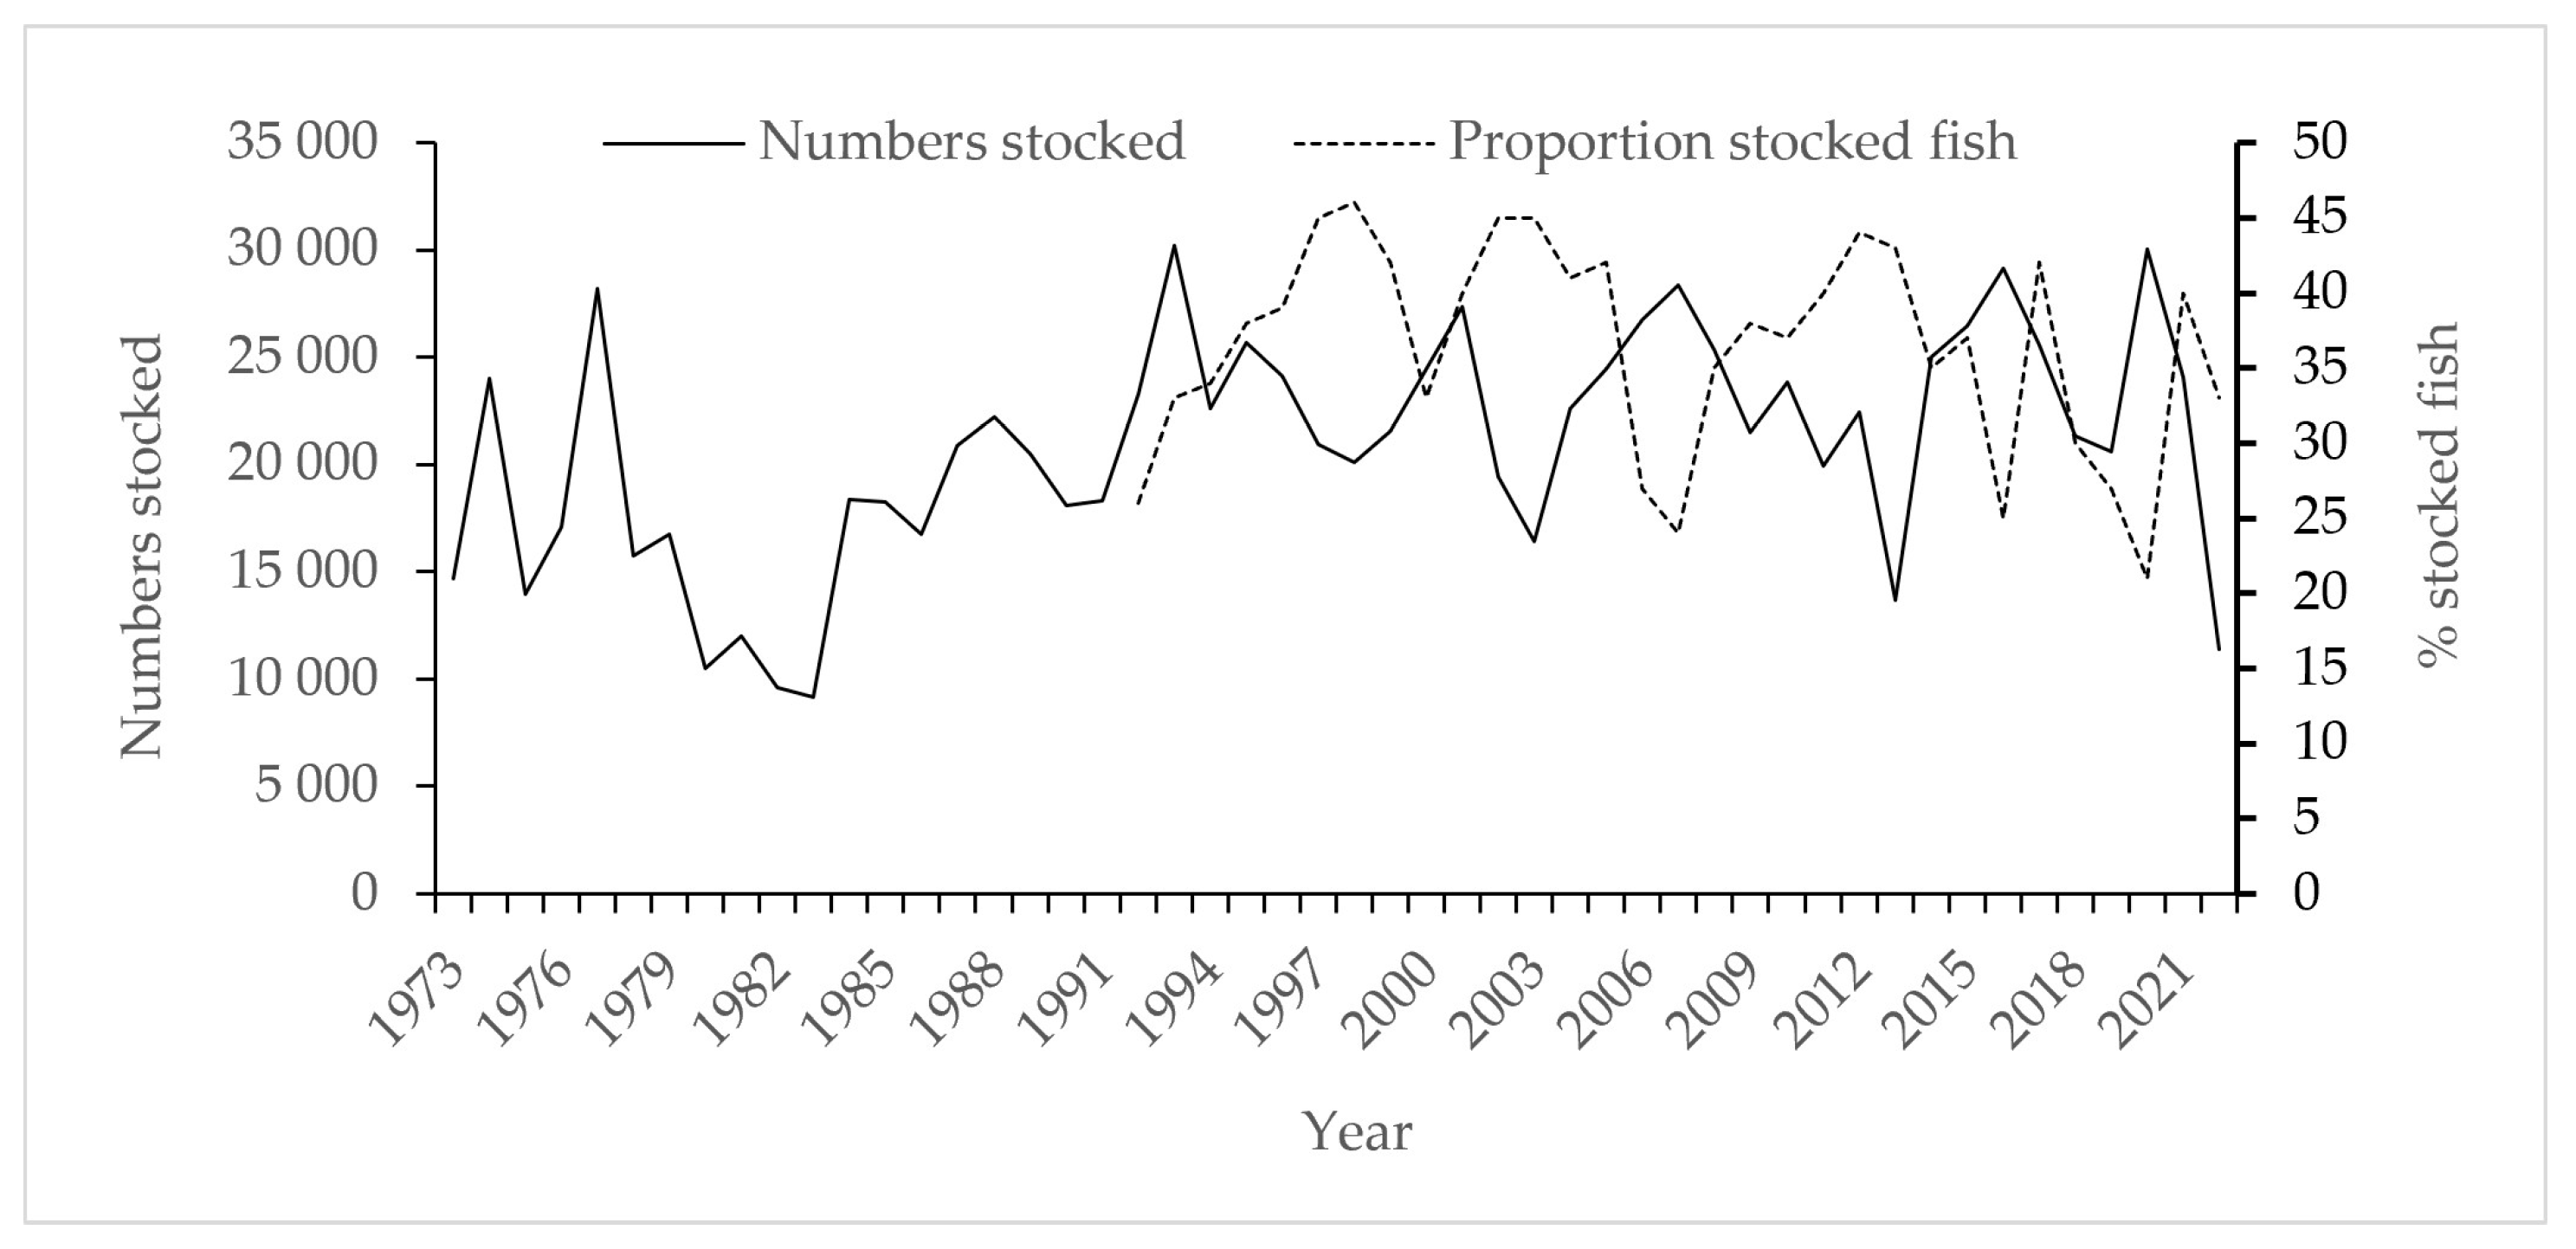
The increased number of stocked fish after 1990 may have caused an increased brown trout stock, but from 1990 to 2021 the stocking was rather constant (Figure 14). There were tendencies to increased proportion of stocked fish three to five years after peaks in stocking.
Figure 14.
Number of brown trout stocked in Lake Mjøsa from 1973 to 2021, and proportion of stocked fish recorded in the Hunder fishway trap.
4. Conclusions
The smelt abundance in Lake Mjøsa declined in the period 1980 to 1990, but the abundance of its competitors, vendace and whitefish, declined more. This reduction is explained by the fact that the supply of nutrients was reduced after the Mjøsa cleaning action. A sharp increase in the smelt population until 2018, while the populations of vendace and whitefish remained low, may be due to reduced competition, and an increased smelt population may have favored the predatory trout. The trout population does not appear to have a decisive effect on the smelt population but may have contributed to the mortality of smelt being higher in the material from 2006 to 2022 than from 1980. The effect of the brown trout stocking until 2022 is uncertain, but future catch reporting will provide a better answer to this.
Recruitment to the smelt population is positively correlated to May and July air temperatures, and increased summer temperatures may have contributed to increased densities of both smelt and other species. In the most recent biomass calculations, all three main pelagic species have increased, and predation by these on the zooplankton community may be accompanied by increased algal growth. Slower growth of smelt in the years 2018–2021 may have been due to increased density and competition. It can be asked whether natural recruitment of trout is enough to keep down a steadily increasing population of pelagic fish. There was a weak (not significant) negative effect of the occurrence of 1+ smelt (predators of eggs and larvae).
Supplementary Materials
The following supporting information can be downloaded at https://www.mdpi.com/article/10.3390/hydrobiology5040040/s1, Table S1. (A) Furnesfjorden 2021, (B) Furnesfjorden 2024; Table S2. (A) Mjøsa 1980, (B) Mjøsa 1980 adjusted; Table S3. (A) Mjøsa 2023, (B) Mjøsa 2023 adjusted, and raw data of 2006–2022. Available at: https://zenodo.org/records/21699551 access on 1 February 2026.
Funding
This research received no external funding; it was all on the institution Inland Norway University of Applied Sciences and the researchers spear time.
Institutional Review Board Statement
Sampling for this study (registered in national science archive NVA-ID: ID: 2772210) was in part conducted before our present institution, Inland Norway University of Applied Sciences, and its Research Ethics Committee, were founded, and the Norwegian Act on Experiments on Animals includes only animals kept alive, for some purpose, after catching. The gill net sampling, nevertheless, was conducted in accordance with Norwegian law for salmon and inland fishery, in agreement with, and partly in cooperation with, the fishing rights holders.
Informed Consent Statement
Not applicable.
Data Availability Statement
Data available on request.
Acknowledgments
I would like to express my sincere thanks to aquarium manager and curator Kjetil Rukan at the Norwegian Forest Museum, who has collected crayfish material from spawning grounds in Furnesfjorden, and to senior engineer Frode Næstad, at the University of the Inlands, Campus Evenstad, for important contributions during the echo sounder recording. Thanks, are also extended to power producer Hafslund for access to statistics on water levels and fish stocking in Mjøsa.
Conflicts of Interest
The author declares no conflict of interest.
References
- Artsdatabanken. Krøkle Osmerus eperlanus (Linnaeus, 1758). 2026. Available online: https://artsdatabanken.no/arter/takson/26159 (accessed on 11 January 2026).
- Sendek, D.; Bogdanov, D. European smelt Osmerus eperlanus in the eastern Gulf of Finland, Baltic Sea: Stock status and fishery. J. Fish Biol. 2019, 94, 1001–1010. [Google Scholar] [CrossRef] [Scilit]
- Sandlund, O.; Næsje, T.; Kjellberg, G. The size selection of Bosmina longispina and Daphnia galeata by co-occuring cisco (Coregonus albula), whitefish (C. lavaretus) and smelt (Osmerus eperlanus). Arch. Fur Hydrobiol. 1987, 110, 357–363. [Google Scholar] [CrossRef] [Scilit]
- Næsje, T.F.; Jonsson, B.; Klyve, L.; Sandlund, O.T. Food and growth of age-0 smelts, Osmerus eperlanus, in a Norwegian fjord lake. J. Fish Biol. 1987, 30, 119–126. [Google Scholar] [CrossRef] [Scilit]
- Sandlund, O.T.; Klyve, L.; Hagen, H.; Næsje, T.F. Krøkla i Mjøsa. Alderssammensetning, vekst og ernæring; DVFMjøsundersøkelsen Rapport 2; Direktoratet for vilt og Ferskvannsfisk: Trondheim, Norway, 1980; p. 70.
- Sandlund, O.T.; Stang, Y.G.; Kjellberg, G.; Næsje, T.F.; Hambo, M.U. European smelt (Osmerus eperlanus) eats all; eaten by all: Is it a key species in lakes? SIL Proc. 1922-2010 2005, 29, 432–436. [Google Scholar] [CrossRef] [Scilit]
- Museth, J.; Johnsen, S.I.; Eloranta, A.; Sandlund, O.T.; Linløkken, A.; Bærum, K.M.; Dokk, J.G. Fiskesamfunnet i Storsjøen i 2016. Effekter av reguleringsinngrep, fiske og introdusert krøkle; Norwegian Institute of Nature Research: Lillehammer, Norway, 2017; p. 43.
- Sandlund, O.T.; Grøndahl, F.A.; Kjellberg, G.; Næsje, T.F. Variabel livshistorie hos krøkle (Osmerus eperlanus) i Mjøsa og Randsfjorden. VANN 2017, 1, 81–92. [Google Scholar]
- Hagenlund, M.; Østbye, K.; Langdal, K.; Hassve, M.; Pettersen, R.A.; Anderson, E.; Gregersen, F.; Præbel, K. Fauna crime: Elucidating the potential source and introduction history of European smelt (Osmerus eperlanus L.) into Lake Storsjøen, Norway. Conserv. Genet. 2015, 16, 1085–1098. [Google Scholar] [CrossRef] [Scilit]
- Næsje, T.F.; Jonsson, B.; Sandlund, O.T.; Kjellberg, G. Habitat switch and niche overlap in coregonid fishes—Effects of zooplankton abundance. Can. J. Fish. Aquat. Sci. 1991, 48, 2307–2315. [Google Scholar] [CrossRef] [Scilit]
- Cavoy, V.; Guillard, J.; Barouillet, C.; Anneville, O.; Sharaf, N.; Gillet, C.; Goulon, C. Early-life temperature drives recruitment success in Eurasian perch (Perca fluviatilis) populations. bioRxiv 2025, 2025.2011.2004.686284. [Google Scholar] [CrossRef] [Scilit]
- Linløkken, A.N.; Sandlund, O.T. Recruitment of sympatric vendace (Coregonus albula) and whitefish (C. lavaretus) is affected by different environmental factors. Ecol. Freshw. Fish 2015, 25, 652–663. [Google Scholar] [CrossRef] [Scilit]
- Karås, P. Recruitment of perch (Perca fluviatilis L.) from Baltic coastal waters. Arch. Für Hydrobiol. 1996, 138, 99–121. [Google Scholar] [CrossRef] [Scilit]
- Böhling, P.; Hudd, R.; Lehtonen, H.; Karås, P.; Neuman, E.; Thoresson, G. Variations in year-class strength of different perch (Perca fluviatilis) populations in the Baltic Sea with special reference to temperature and pollution. Can. J. Fish. Aquat. Sci. 1991, 48, 1181–1187. [Google Scholar] [CrossRef] [Scilit]
- Auvinen, H. Factors affecting the year-class strength of vendace (Coregonus albula (L.)) in Lake Pyhajarvi (Karelia, SE Finland). Finn. Fish. Res. 1988, 9, 235–243. [Google Scholar]
- Linløkken, A.N. Temperature Effects on Recruitment and Individual Growth of Two Antagonistic Fish Species, Perch Perca fluviatilis and Roach Rutilus rutilus, from a Climate Change Perspective. Fishes 2023, 8, 295. [Google Scholar] [CrossRef] [Scilit]
- Sandström, A.; Ragnarsson Stabo, H.; Axenrot, T.; Bergstrand, E. Has climate variability driven the trends and dynamics in recruitment of pelagic fish species in Swedish Lakes Vänern and Vättern in recent decades? Aquat. Ecosyst. Health Manag. 2014, 17, 349–356. [Google Scholar] [CrossRef] [Scilit]
- Lantry, B.; Stewart, D. Population dynamics of rainbow smelt (Osmerus mordax) in Lakes Ontario and Erie: A modeling analysis of cannibalism effects. Can. J. Fish. Aquat. Sci. 2000, 57, 1594–1606. [Google Scholar] [CrossRef] [Scilit]
- Henderson, B.A.; Nepszy, S.J. Factors Affecting Recruitment and Mortality Rates of Rainbow Smelt (Osmerus Mordax) in Lake Erie, 1963–1985. J. Gt. Lakes Res. 1989, 15, 357–366. [Google Scholar] [CrossRef] [Scilit]
- Keller, M.; Molenaar, P.; de Leeuw, J.; Mooij, W.; Rijnsdorp, A.; van de Wolfshaar, K. Temperature effects on egg and larval development rate in European smelt, Osmerus eperlanus, experiments and a 50 year hindcast. J. Fish Biol. 2020, 96, 1422–1433. [Google Scholar] [CrossRef] [Scilit]
- Ruttner, F. Fundamentals of Limnology, 3rd ed.; University of Toronto Press: Toronto, ON, Canada, 2018. [Google Scholar]
- Miljødirektoratet. Vanndirektivet 2018. Klassifisering av miljøtilstand i vann. Veileder 02:2018; Miljødirektoratet: Trondheim, Norway, 2018; p. 227.
- Stuen, J.H. Mjøsa—Den gang—Og nå. Våre suksessfaktorer. Vann 2010, 1, 83–86. [Google Scholar]
- Thrane, J.E.; Økelsrud, A.; Skjelbred, B.; Kemp, J.L.; Aaslan, E. Tiltaksorientert overvåking i vannområde Mjøsa—Årsrapport for 2024; Norsk Institutt for Vannforskning: Oslo, Norway, 2025; p. 43. [Google Scholar]
- Huitfeldt-Kaas, H. Mjøsens Fisker og Fiskerier; Det Kgl. norske videnskabers selskabs skrifter; Det Kgl. Norske Videnskabers Selskab: Oslo, Norway, 1917; p. 257. [Google Scholar]
- Sandlund, O.T.; Hagen, H.; Klyve, L.; Næsje, T.F. Prøvegarnfiske i Mjøsa 1978–1979; DVF Mjøsundersøkelsen; Norwegian Directorate of Nature Management: Trondheim, Norway, 1980; p. 48.
- Sandlund, O.T.; Næsje, T.F.; Lindem, T. Ekkoloddregistrering av pelagisk fiskebestand i Mjøsa 1990–1991; Oppdragsmelding 138; Norwegian Institute of Nature Research: Trondheim, Norway, 1992; p. 16.
- Rugsveen, M. Lågåsildfisket i Fåberg—Endring i form og bruk 1850–1980; Norsk Skogbruksmuseum: Elverum, Norway, 1985. [Google Scholar]
- Jøranli, H. Lagesildfiske i Mjøsa og Lågen 1996–2000 og andre Notater om Lagesildfiske i dette Tidsrommet; Mjøsa Fiskeforvaltning: Gjøvik, Norway, 2000; p. 29. [Google Scholar]
- Linløkken, A.; Rukan, K. Har lågåsilda i Mjøsa forsvunnet—Sporløst? VANN 2020, 1, 87–93. [Google Scholar]
- Statsforvalteren, I. Fangstregistreringer i Mjøsa; Reguleringer og fisk i Innlandet; Statsforvalteren i Innlandet: Lilehammer, Norway, 2025; p. 20.
- Norum, I.C.J.; Thorkildsen, T.B. Dreggefiske etter ørret i Mjøsa; Reguleringer og fisk i Innlandet; Statsforvalteren i Innlandet: Lilehammer, Norway, 2024; p. 15.
- Klif. Miljøgifter i Fisk og zooplankton i Mjøsa, 2011; Norske Institutt for Vannforskning og Norsk Institutt for Luftundersøkelser: Oslo, Norway, 2012; p. 83. [Google Scholar]
- Kraabøl, M.; Museth, J.; Johnsen, S.O. Fangsthistorikk og bestandsvurderinger av Mjøsørret med hovedvekt på kultivering av Hunderørret; Rapport; Norsk Institutt for Naturforskning: Trondheim, Norway, 2009; p. 47. [Google Scholar]
- Aass, P.; Nielsen, P.S.; Brabrand, Å. Effects of river regulation on the structure of a fast-growing brown trout (Salmo trutta L.) population. Regul. Rivers Res. Manag. 1989, 3, 255–266. [Google Scholar] [CrossRef] [Scilit]
- Lindem, T.; Sandlund, O.T. Ekkoloddregistreringer av pelagiske fiskebestander i innsjøer. Fauna 1984, 37, 105–111. [Google Scholar]
- Gjelland, K.; Eikland, K.A.; Brabrand, Å.; Kristoffersen, R.; Svenning, M.-A.; Eloranta, A.; Pettersen, O.; Saksgård, R.; Solberg, I.; Sandlund, O. Overvåking av fisk i store innsjøer—FIST 2018; Norwegian Institute of Nature Research: Tromsø, Norway, 2020.
- Eikland, K.A.; Gjelland, K.Ø.; Lie, E.F.; Solberg, I.; Næstad, F. Fiskeundersøkelser i store Innsjøer i ØKOSTOR-Programmet 2023; Norsk Institutt for Naturforskning (NINA), Norsk Institutt for Vannforskning (NIVA) og Akvaplan-niva: Oslo, Norway, 2024; p. 74. [Google Scholar]
- Kongsberg Maritime AS. SIMRAD EK15. Reference Manual; Kongsberg Maritime AS: Kongsberg, Norway, 2014; p. 309. [Google Scholar]
- Linløkken, A.N.; Næstad, F.; Langdal, K.; Østbye, K. Comparing Fish Density and Echo Strength Distribution Recorded by Two Generations of Single Beam Echo Sounders. Appl. Sci. 2019, 9, 2041. [Google Scholar] [CrossRef] [Scilit]
- Linløkken, A.N. Effects of Lake Productivity on Density and Size Structure of Pelagic Fish Estimated by Means of Echosounding in 17 Lakes in Southeast Norway. Sensors 2021, 21, 3391. [Google Scholar] [CrossRef] [Scilit]
- Appelberg, M.; Berger, H.M.; Hesthagen, T.; Kleiven, E.; Kurkilahti, M.; Raitaniemi, J.; Rask, M. Development and intercalibration of methods in Nordic freshwater fish monitoring. Water Air Soil Pollut. 1995, 85, 401–406. [Google Scholar] [CrossRef] [Scilit]
- Crawley, M.J. The R Book; Wiley: Chichester, UK, 2007. [Google Scholar]
- Chapman, D.W.; Robson, D.S. The analysis of a catch curve. Biometrics 1960, 16, 354–368. [Google Scholar] [CrossRef] [Scilit]
- Robson, D.S.; Chapman, D.G. Catch Curves and Mortality Rates. Trans. Am. Fish. Soc. 1961, 90, 181–189. [Google Scholar] [CrossRef] [Scilit]
- Ricker, W.E. Computation and Interpretation of Biological Statistics of Fish Populations. Bull. Fish. Res. Board Can. Bull. 1975, 191, 382. [Google Scholar]
- Linløkken, A.N. Introduction to Freshwater Fish Ecology and Management: A Presentation of Applied Methods; Cambridge Scholars Publishing: Cambridge, UK, 2024. [Google Scholar]
- Al-Jeddawi, W.; Dawson, P. The Effect of Frozen Storage on the Quality of Atlantic Salmon. J. Food Sci. Nutr. Res. 2022, 05, 552–569. [Google Scholar] [CrossRef] [Scilit]
- Qvenild, T.; Nashoug, O. Ørretfisket i Mjøsa; Fylkesmannens Miljøvernavdeling: Hamar, Norway, 1987.
- Haande, S.; Schartau, A.K.; Dahl-Hansen, G.; Dahl-Hansen, I.; Demars, B.; Dokk, J.G.; Eikland, K.A.; Gjelland, K.Ø.; Håvardstun, J.; Jensen, T.C.; et al. ØKOSTOR 2023 Basisovervåking av store Innsjøer; M 2842 Miljødirektoratet: Trondheim, Norway, 2024; p. 190. [Google Scholar]
- Arnesen, E.; Hammer, M. Sammenligning av krøkle (Osmerus eperlanus) innad i Mjøsa og med Storsjøen; Fakultet for anvendt økologi, landbruksfag og bioteknologi; Universitetet i Innlandet: Elverum, Norway, 2025. [Google Scholar]
- Sandlund, O.; Næsje, T.; Klyve, L.; Lindem, T. The vertical distribution of fish species in Lake Mjøsa, Norway, as shown by gill net catches and echo sounder. Rep. Inst. Freshw. Res. Drottningholm 1985, 62, 136–149. [Google Scholar]
- Cornett, R.J.; Rigler, F.H. The areal hypolimnetic oxygen deficit: An empirical test of the model1. Limnol. Oceanogr. 1980, 25, 672–679. [Google Scholar] [CrossRef] [Scilit]
- Sanni, S.; Wærvågen, S.B. Oligotrophication as a result of planktivorous fish removal with rotenone in the small, eutrophic lake Mosvatn, Norway. Hydrobiologia 1990, 200, 263–274. [Google Scholar] [CrossRef] [Scilit]

Disclaimer/Publisher’s Note: The statements, opinions and data contained in all publications are solely those of the individual author(s) and contributor(s) and not of MDPI and/or the editor(s). MDPI and/or the editor(s) disclaim responsibility for any injury to people or property resulting from any ideas, methods, instructions or products referred to in the content. |
© 2026 by the author. Licensee MDPI, Basel, Switzerland. This article is an open access article distributed under the terms and conditions of the Creative Commons Attribution (CC BY) license.