


Abstract
In this study, we determine the refractive index (n), extinction coefficient (k), absorption coefficient (α) and optical band gap (Eg) of thin films based on the commercially available azo polymer (poly [1-[4-(3-carboxy-4-hydroxyphenylazo) benzene-sulfonamido]-1,2-ethanediyl, sodium salt]), usually denoted as PAZO, doped with InP/ZnS quantum dots (QDs) at concentrations of 1 wt.%, 2 wt.%, and 10 wt.%. It was found that the absorption of the composite materials studied is driven by direct allowed electronic transitions, with the band gap energies tunable from 2.92 eV to 3.00 eV depending on the dopant concentration. Furthermore, the results suggest that resonance energy transfer (RET) between the InP/ZnS quantum dots and the azo polymer may occur, actively modulating the optical properties of the composite materials in the 385–750 nm spectral region, where the PAZO absorption spectrum and the emission spectrum of the QDs overlap. The theoretical calculation carried out demonstrate that the energy transfer is more efficient at 600 nm, than at 420 nm, where the two observed peaks in the emission spectrum of the dopant are positioned. We believe that the result obtained may be of interest to researchers working on improving the photoresponse of azo polymers through incorporation of quantum dots, particularly given that most studies in this field focus on cadmium-containing nanocrystals, whereas InP/ZnS quantum dots represent a more environmentally friendly alternative.
1. Introduction
Quantum dots are semiconductor nanocrystals composed of elements of the II-VI, III-V or IV-VI groups, such as CdS, ZnSe and InP, with sizes ranging from 2 nm to 10 nm and a core–shell structure. They exhibit properties not found in bulk semiconductor materials and demonstrate excellent photostability and non-bleaching properties even after exposure to light for a prolonged time. Some of their applications are summarized in [1]. Quantum dots are also used for optical data storage applications to induce chemical or physical changes in the nanoparticles through laser irradiation and as electron donors to enhance the sensitivity of photoswitchable molecules [2,3,4]. According to their band alignments, InP/ZnS QDs are type-I core–shell QDs and contain shell materials with a wider band gap than that of the core, which can improve the quantum yield (QY) remarkably [5]. These tiny particles find applications in various fields, such as biomedicine research and patient care, as a non-toxic alternative to Cd-based quantum dots, focusing on non-invasive imaging, preventive oncology [6], and optics, because of their peculiar optical properties. Research on II-VI and IV-VI semiconductor quantum dots (QDs) is quite widespread, while the exploration of the vast compositional space of MCQDs is still in its infancy. Significant progress has been achieved in ternary and multinary I–III–VI quantum dots, enabling precise control over band structure and optical properties. Systems such as AgInS2 with ZnS shells exhibit tunable absorption and emission, along with enhanced quantum yields due to band alignment effects [7,8]. Environmentally friendly multinary structures, e.g., Ag–In–Zn–S, have also been developed, offering near-infrared emission and suitable band offsets. More complex core–multishell architectures further improve band engineering and significantly enhance photoluminescence through optimized band alignment and surface passivation [9,10].
Recently, water-dispersible InP-based core–shell QDs have been studied to develop efficient, Cd-free QDs suitable for water dispersion and long-term stability with high quantum yield retention [11]. While water-compatible QDs with hydrophilic ligands (e.g., mercaptopropionic acid) can be used for biological applications, these systems often require ligand exchange that may lead to surface trap states and reduced quantum yield. Studies of water-dispersed InP/ZnSe/ZnS QDs highlight the need for careful surface passivation to retain quantum yield after ligand modification, illustrating the trade-offs inherent in water compatibility. Our work focuses on oleylamine-stabilized InP/ZnS quantum dots in toluene. These hydrophobic, organically dispersed QDs are deliberately chosen because they exhibit high quantum yields and robust optical emission in organic media [12]. The research on ligand-engineered QDs illustrates how the polymer matrix and ligand shells jointly define optical responses and emission shifts due to dielectric effects [13]. In addition, the optical properties of quantum dots are influenced by their size, composition, structure, morphology, synthesis conditions, and exposure temperature [14,15,16,17]. The emission wavelength of quantum dots is primarily determined by their size through variations in bandgap energy levels [1]. Smaller quantum dots possess larger band gaps and emit light at shorter wavelengths, typically in the blue region of the visible spectrum, whereas larger quantum dots emit at longer wavelengths in the red region. The presence of a core–shell structure enhances photoluminescence efficiency by passivating surface defects [18]. QDs also find applications as temperature sensors [19].
Alternative surface ligands such as thioglycolic acid (TGA), glutathione (GSH), and cysteine enable aqueous stabilization and biofunctionalization. Biocompatible ligands such as GSH are widely used to render QDs water-soluble and suitable for bioimaging applications, providing improved colloidal stability and functional surface chemistry [20,21,22,23].
Azo polymers doped with quantum dots represent an important new class of composite materials. Photorefractive polymers were used for the fabrication of optical devices through simple and cost-effective preparation methods [24,25]. The addition QDs to polymeric materials improves their effectiveness and is associated with significant changes in their structure [26], which leads to corresponding changes in their optical properties. The roles of polymer matrices, quenching, and energy transfer in QD films are well documented in the literature. For example, polymer surface coatings have been shown to significantly affect QD optical stability and integration into functional films, and fluorescence resonance energy transfer mechanisms between QDs and acceptors have been widely explored for both aqueous and solid environments [27].
Hybrid materials based on azopolymers doped with InP/ZnS quantum dots show promising characteristics for various sensor applications [28], owing to the combination of photosensitivity and isomerization of azo groups (trans–cis) [29,30], tunable photoluminescence of InP/ZnS QDs and optical nonlinearity and anisotropy. Their main sensor applications are optical sensors for UV and visible light, fluorescent sensors for pressure and temperature, chemical and biosensors, sensors with photoinduced memory, and sensors for electric and magnetic fields.
The ability of the azobenzene molecule to undergo series of trans–cis–trans isomerization upon irradiation with light, which affect local chemical, physical and mechanical properties of the host material [31] and also leads to birefringence and surface pattern formation, and the tunable electronic and optical properties of the semiconductor nanocrystals make them suitable for wide range of optical applications. However, there are only a few research works reported in the literature on the development of such composite materials as media for optical record of information, and in all of them Cd-containing quantum dots have been used as a dopant to enhance the sensitivity of the photo-chromophore.
Stern–Volmer analysis is a widely used approach for evaluating fluorescence quenching and has been successfully applied to describe Förster-type energy transfer processes [32,33]. It was previously thought that steady-state Stern–Volmer analysis alone may not unambiguously distinguish between different quenching mechanisms, particularly in complex or confined systems such as micelles [34,35].
The literature on photonic properties of supramolecular systems provides robust evidence that resonance energy transfer (RET) mechanisms are accurately described by analyzing photoluminescence (PL) quenching in the donor and simultaneous PL build-up in the acceptor [36]. In systems combining QDs and tetrapyrrolic dye molecules (such as porphyrins), this technique is crucial for validating complex formation and quantifying energy transfer efficiency [37,38,39,40,41].
Time-resolved techniques such as time-correlated singlephoton counting (TCSPC), which directly probe fluorescence lifetimes, are often employed to confirm RET. This combined approach has been demonstrated in quantum dot-based donor–acceptor systems, including quantum dot–porphyrin assemblies and related hybrid nanostructures [42,43].
PAZO is one of the most extensively studied azobenzene-containing polymers for applications in polarization holography and photonics [17]. Its commercial availability facilitates reproducible sample preparation and enables direct comparison with previously reported studies. Numerous research groups have focused on enhancing the photoinduced birefringence of PAZO thin films through the incorporation of nanoparticles with various compositions, sizes, and shapes. In addition, its solubility in water and methanol allows for the easy preparation of nanocomposite materials using suspensions of nanoparticles.
In our previous work [25], we demonstrated that doping PAZO with InP/ZnS quantum dots, up to a certain concentration, increases the maximum induced birefringence at pump laser wavelengths of 355 and 444 nm compared with the undoped PAZO polymer film. However, the optical constants of the prepared composite films, which provide essential information about their interaction with light, were not determined. Addressing this gap was the primary motivation for the present study.
2. Materials and Methods
For transmission and reflection spectra measurements, we prepared thin film composite materials based on the azopolymer (poly [1-[4-(3-carboxy-4-hydroxyphenylazo) benzenesulfonamido]-1,2-ethanediyl, sodium salt]), abbreviated as PAZO, doped with InP/ZnS quantum dots by spin coating on quartz substrates [25]. InP/ZnS QDs are stabilized with oleylamine ligands (C18H37N) in toluene (C6H5CH3). All chemical reagents were purchased from Sigma-Aldrich (St. Louis, MO, USA) and used as received.
The films’ thicknesses were determined for each sample using a “Talystep” profilometer, Taylor Hobson, San Diego, CA, USA.
Spectrophotometric measurements of transmission () and reflection () were used to investigate the optical properties of all film samples. The transmission and reflection spectra were studied using a Cary 5E UV-Vis-NIR spectrophotometer, developed and manufactured by Varian, Inc., Melbourne, Australia, with attachments for measuring transmission and reflection spectra under normal incidence of light in the spectral range from 190 to 3300 nm with a scanning step of 2 nm. All measurements were performed at room temperature.
The TEM study was performed using Transmission electron microscope JEOL JEM 2100 (JEOL Ltd., Tokyo, Japan) at accelerating voltage 200 kV. A drop of the QDs colloidal solution was fixed on standard Cu grid covered with amorphous carbon membrane and dried at ambient conditions. The layers were initially dipped into toluene to remove them from the quartz substrate and then transferred onto standard mesh copper grids with amorphous carbon support.
3. Results
We prepared thin film composite materials based on the azopolymer PAZO, doped with three different concentrations (1 wt.%, 2 wt.% and 10 wt.%) of InP/ZnS quantum dots with size of 7.5 nm through spin coating on quartz substrates for 30 s at 1500 rpm. The preparation of the composite films has been described in detail in our previous work [25].
The measured sample thicknesses are about 100 nm with an accuracy of ±5 nm.
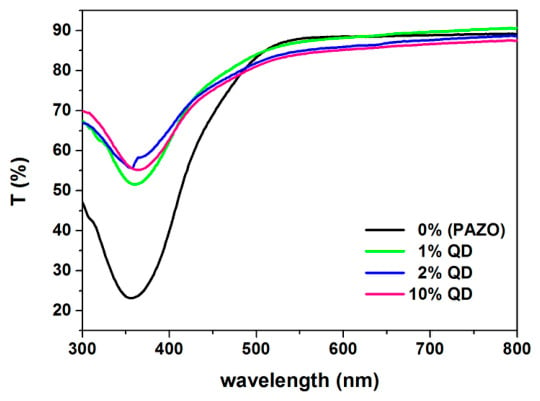
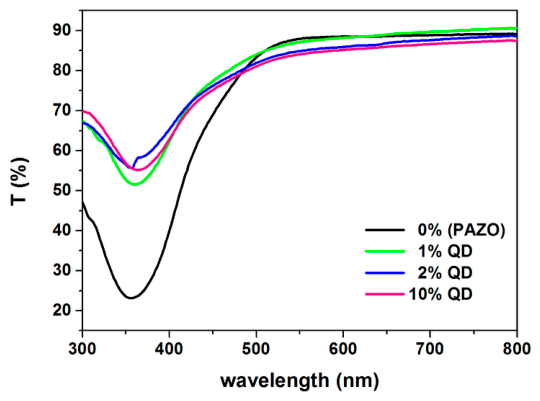
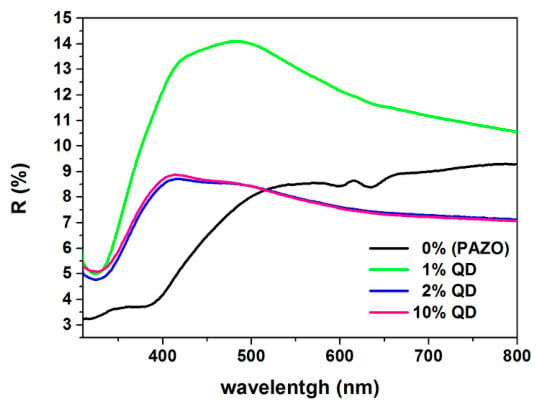
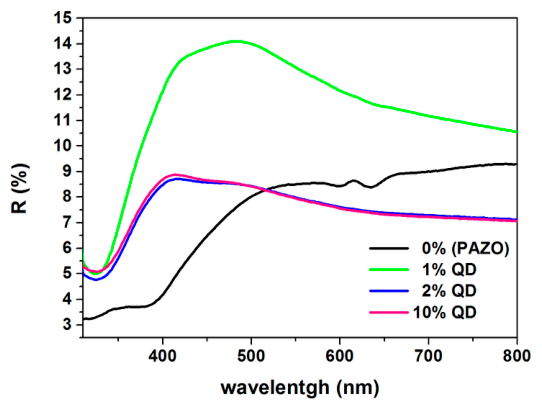
The transmission and reflection spectra were obtained in the spectral range 300–800 nm. The wavelength () was determined with an accuracy of ±2 nm. The transmission and reflection spectra are shown in Figure 1 and Figure 2, respectively.
Figure 1.
Transmission (T) spectra of pure PAZO film and those doped with 1 wt.%, 2 wt.% and 10 wt.% InP/ZnS quantum dots.
Figure 2.
Reflectance (R) spectra of pure PAZO film and those doped with 1 wt.%, 2 wt.% and 10 wt.% InP/ZnS quantum dots.
The refractive index () was determined using the values of the transmission and reflection coefficients from the transmission and reflection spectra using the method described by [44] and the formula
where
The extinction coefficient () values for all studied thin layers were calculated using the following formula [44]:
where is the absorption coefficient:
where is thicknesses of the thin films.
The optical band gap of the thin films was determined using the Tauc procedure [45].
The , and values were calculated (indirect measurements), and their errors were determined according to the methodology for this type of measurement. The Eg values and errors were calculated using the MINUIT program [46].
4. Discussion
The optical properties of each nanocomposite hybrid layer were investigated and compared with those of the pure PAZO polymer film.
From the obtained transmission spectra by UV-Vis-NIR spectroscopy (Figure 1), it was found that they are transparent in the visible and near IR region, which makes them a suitable medium for optical recording of information in them. Table 1 shows the transmittance values at the beginning and end of the region in which the spectra were obtained. For all the films prepared, the maximum transmission (87.6–90.6%) is observed after 500 nm, with its value being highest for the doped films with 1 wt.% quantum dots (Table 1).
Table 1.
Transmission and reflection coefficients values of the studied thin layers.
From the reflection spectra (Figure 2) in the transmission range of the thin layers (360–800 nm) it is seen that the reflection coefficient is from 7.0 to 14.1%, with the highest value for a layer with 1 wt.% quantum dots. Table 1 shows the values of the reflection coefficient at a wavelength of 480 nm, at which is the maximum value of R (for a composite layer with 1 wt.% quantum dots), and at 800 nm, the end of the transmission region (360–800 nm), which are taken from the reflectance spectrum from the normal dispersion region.
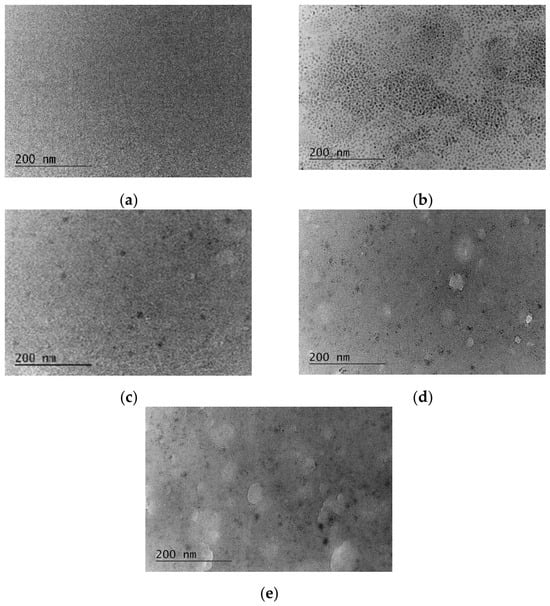
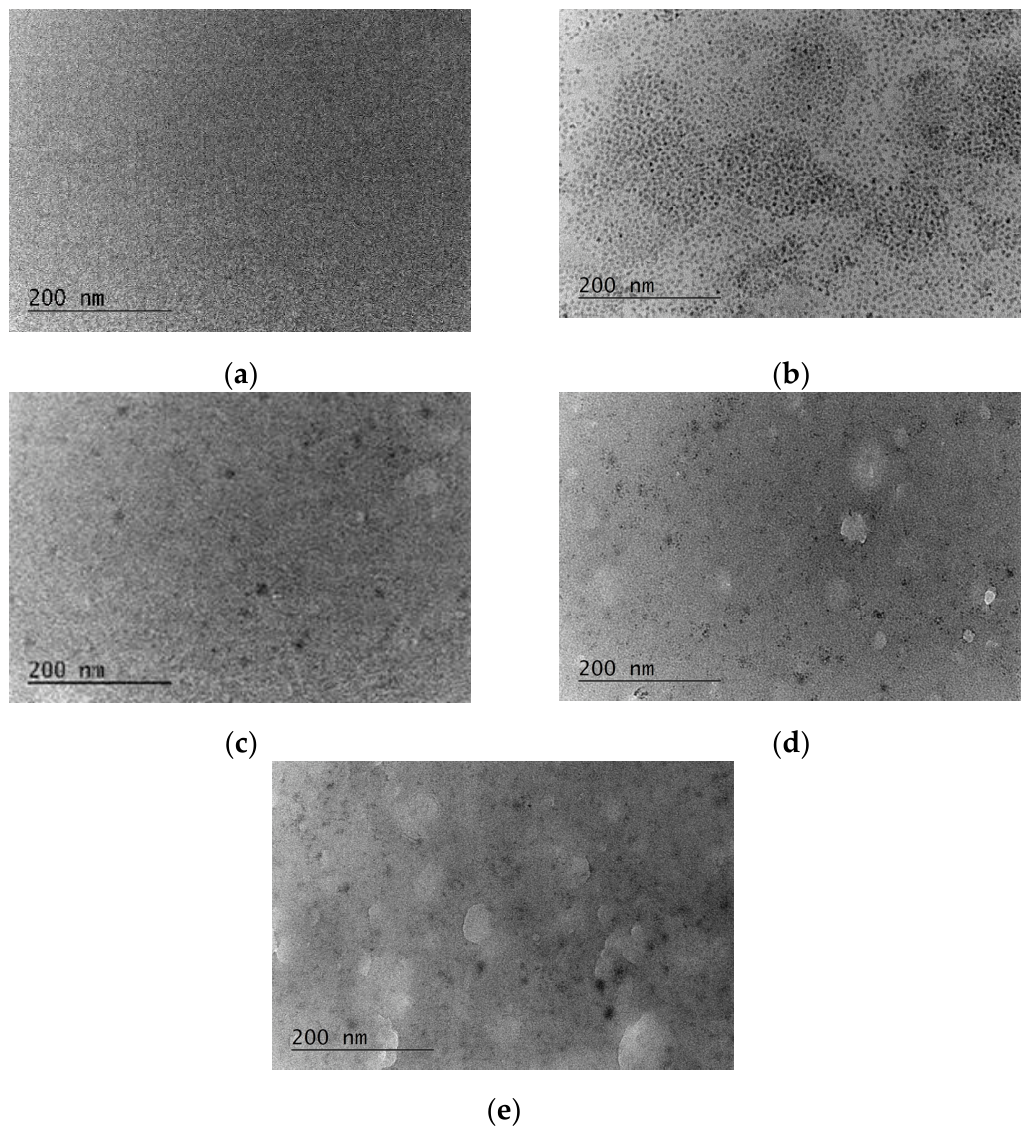
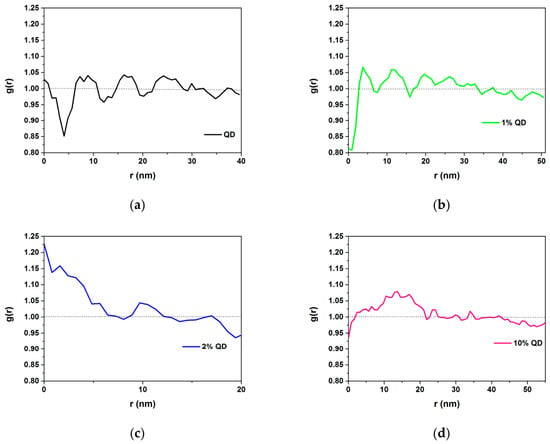
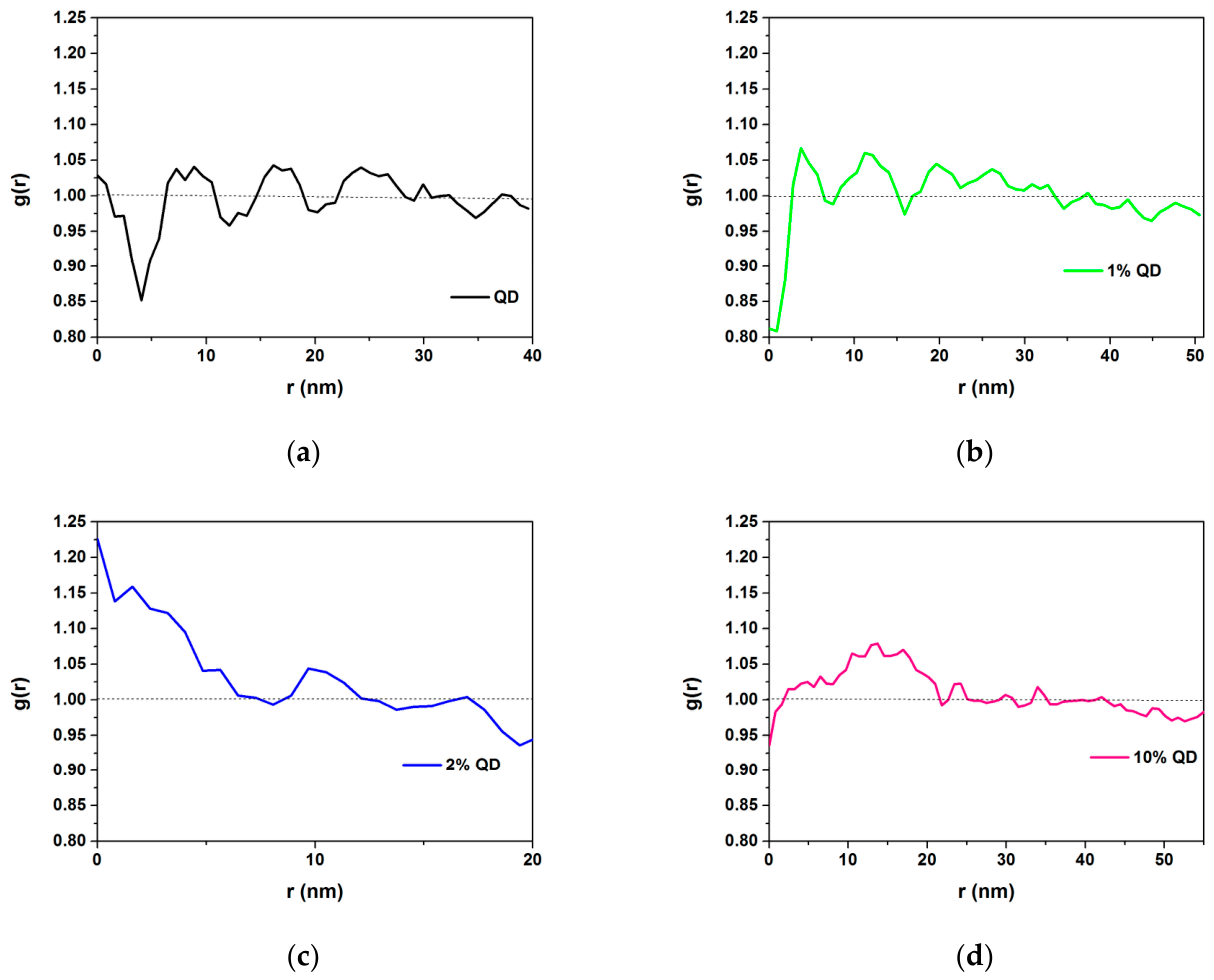
The maximum values of the reflectance coefficient of the composite layers are in the range 360–550 nm: the peak (14.1%) for a layer with 1 wt. % quantum dots is broad and centered at 480 nm; for a layer with 2 wt. % quantum dots (8.7%), it is at 416 nm; and for a layer with 10 wt.% quantum dots (8.8%), it is at 414 nm. With increasing quantum dot concentration, a shift in the maximum to shorter wavelengths (blue shift) is observed. InP/ZnS quantum dots have a higher refractive index (from about 1.8 to over 2.5) than the azopolymer PAZO (n = 1.5–1.7), and when they are incorporated into the polymer matrix, the effective refractive index of the layer changes, which can lead to a change in the dispersion curve of the refractive index of the layer and the reflection maximum shifting to shorter wavelengths. The layer with 1 wt. % quantum dots has the highest reflection intensity, followed by the layers with 10 and 2 wt. % quantum dots, respectively, which is related to the difference between the refractive indices of the layer and air, which is the largest for the layer with 1 wt.% quantum dots. The almost complete overlap of the curves of 2 and 10 wt.% quantum dots indicates that a threshold state has been reached. At higher concentrations (2 wt.% and above), the QDs begin to aggregate, which is observed in the TEM images (Figure 3) from TEM we conducted and is established through a radial distribution function (RDF) (Figure 4). In the thin layers with 1 wt.% quantum dots, formation of local periodic structures with cluster sizes around 15 nm is observed. In the layers with 2 wt.% quantum dots, the particles are in direct contact, and an aggregation process begins. Clusters with sizes of 13-18 nm are observed. In the layers with 10 wt.% quantum dots, larger clusters are formed, with the size of 13–18 nm remaining a constant parameter for the aggregates.
Figure 3.
TEM images of (a) the undoped PAZO polymer film, (b) pure quantum dots, and films doped with (c) 1 wt.%, (d) 2 wt.%, and (e) 10 wt.% InP/ZnS quantum dots.
Figure 4.
Radial distribution function (RDF) of (a) the pure quantum dots and films doped with (b) 1 wt.%, (c) 2 wt.% and (d) 10 wt.% InP/ZnS quantum dots.
After 2 wt. %, the newly added quantum dots add to the already existing aggregates without significantly changing the total optical density of the layer surface, which is the reason for the overlap of the curves of 2 and 10 wt. % quantum dots.
At 480 nm, a jump in the reflectance coefficient is observed from 7.5% for the pure PAZO layer to 14.1% for the composite layer with 1 wt. % quantum dots. It can be assumed that such a high peak is due to the accumulation of fluorescence in the reflection detector. In our opinion, the high peak is not due to this for two reasons: first, the spectrophotometer used is configured to filter the emission, and second, the difference of 50 nm between the peak in the reflection spectrum at 480 nm and the peak at 430 nm in the fluorescence emission spectrum of the composite layer with 1 wt.% quantum dots ([25], our publication, Figure 3a) is large enough to say that this is not light emission, but a structural optical effect. In the fluorescence emission spectrum, one more peak of the composite layer with 1 wt.% quantum dots is observed at 644 nm with higher intensity. Compared with the pure PAZO layer and the composite layers with 2 and 10 wt.% quantum dots, the composite layer with 1 wt.% quantum dots has the lowest fluorescence intensity.
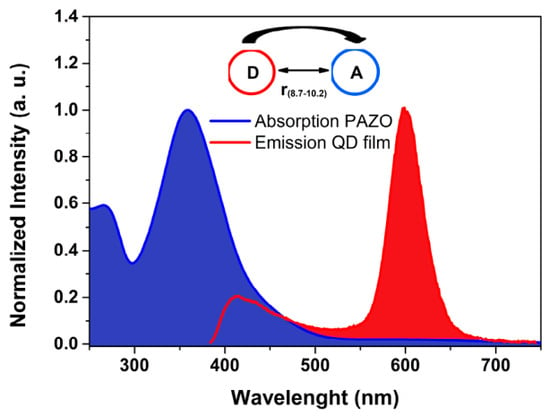
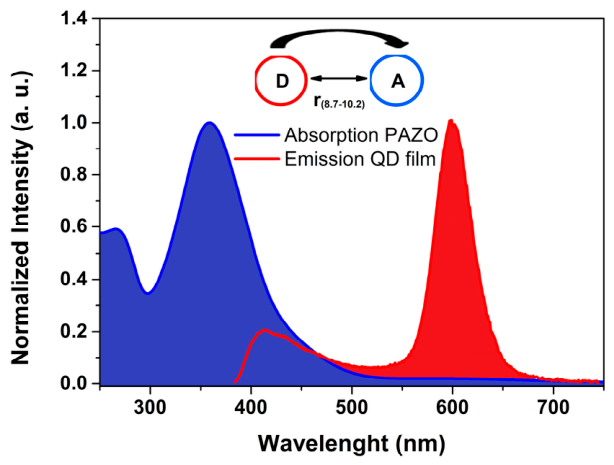
In the 550–800 nm region of the reflection spectrum, the curves of the layers with 2 and 10 wt. % QDs fall below that of the pure PAZO polymer. This can be explained by the so-called supramolecular interaction. When the concentration of QDs increases, they approach each other and the azo groups in the polymer. The energy, instead of being emitted as light (high reflection), is transmitted in a non-radiative way from the QDs to the polymer—resonance energy transfer (RET). Non-radiative energy transfer can occur if the emission spectrum of the donor overlaps with the absorption spectrum of the acceptor [47]. In our case, an overlap of the emission spectrum of the QDs ([25], our publication, Figure 3b) with the absorption spectrum of the PAZO polymer ([25], our publication, Figure 2) is observed in the region 385–750 nm with a crossover point at 465 nm (Figure 5).
Figure 5.
Criteria for RET to occur.
A clear isosbestic point at 395 nm is observed in the absorption spectra for the pure PAZO polymer film and the composite layers ([25], our publication, Figure 2), which proves the formation of a stable interaction in the ground state. The systematic crossing of the emission spectra of the layers ([25], our publication, Figure 3a) at the isosbestic point at 640 nm emphasizes the controlled nature of the energy exchange.
The second condition for RET to occur is that the donor and acceptor molecules are in close proximity (1–10 nm), because the interaction strength (for point dipoles) decreases as 1/r6, where r is the center-to-center distance between the donor and the acceptor [48]. We determined r (Table 2) using the following formula [47]:
where is the efficiency of energy transfer and R0 is the Förster radius (distance at which the transfer efficiency is 50%). The efficiency of energy transfer is determined using the following formula [47]:
where I0 and I are, respectively, the intensity in the absence and presence of a quencher (at λ = 600 nm, at which QDs have maximum emission) (from our publication [25]) (Table 2).
Table 2.
Efficiency of energy transfer, Förster radius, center-to-center distance values and spectral overlap integral at λ = 600 nm.
The Förster radius is determined using the following formula [47]:
where is the orientation factor, n is the refractive index of the medium containing the donor and acceptor, is the photoluminescence quantum yield of the donor in the absence of acceptor and J is the spectral overlap integral (Table 2).
An orientation factor value of 0.67 was used, which corresponds to randomly oriented molecules. The values of the refractive index n at a wavelength of 600 nm for layers with 1, 2 and 10 wt. % QDs are, respectively, 1.681, 1.517, and 1.517. The photoluminescence quantum yield of the donor in the absence of acceptor according to the specification of the purchased quantum dots is 0.4.
The spectral overlap integral J is calculated using the following formula [47]:
where is normalized emission spectrum of QDs (donor), and is molar extinction coefficient of PAZO (acceptor):
where is extinction coefficient, M is the molar mass of the acceptor, MPAZO = 357.31 g/mol, ρ is density of acceptor, and = 1.3 g/cm3.
Since in the emission spectrum of quantum dots (QDs), in addition to the peak at 600 nm, another peak at 420 nm is observed, which falls in the overlap region, we determined the energy transfer efficiency, Förster radius, and the values of the center-to-center distance and for it in the manner described above (Table 3).
Table 3.
Efficiency of energy transfer, Förster radius, center-to-center distance values and spectral overlap integral at = 420 nm.
When comparing the results obtained at 600 and 420 nm, it is seen that
- -
- At 1 wt.% QDs, RET is active in both zones but is four times more efficient at 600 nm.
- -
- At 2 wt.% QDs, RET at 600 nm is enhanced, while at 420 nm it almost disappears.
- -
- At 10 wt.% QDs, a complete divergence is observed: classical RET at 600 nm versus emission enhancement at 420 nm.
At a concentration of 10 wt.% QDs, a negative efficiency (–3.9) is observed only at 420 nm. This deviation is due to aggregation of nanoparticles, which leads to selective light scattering. Since scattering is significantly more intense at shorter wavelengths, the aggregates redirect a larger flux of photons to the detector, leading to a measurement of a fictitious emission gain. At the same time, at 600 nm the RET process remains dominant due to the larger overlap integral and the weaker influence of scattering in the long wavelength region.
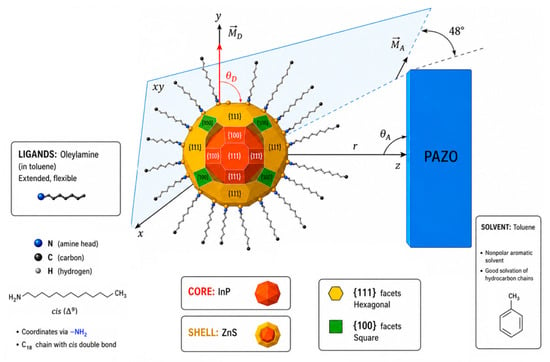
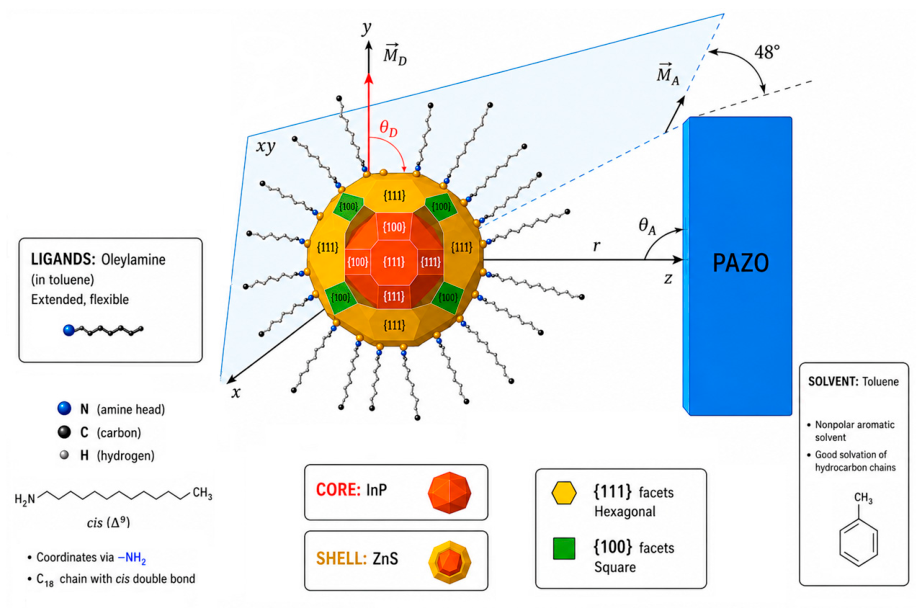
In determining the Förster radius, we used the orientation factor value = 0.67 [47]. To verify the validity of the orientation factor value used, we created a geometric model (Figure 6) based on the morphology of InP/ZnS quantum dots and the chemical structure of the azopolymer PAZO.
Figure 6.
Mechanistic model of the orientation of dipole moments, geometric justification for = 0.67.
Although QDs are often considered spherical on a macroscopic scale, they possess a specific faceted morphology consisting of polar and equatorial planes such as {100} and {111}, which determine the spatial distribution of surface ligands and the binding site of the acceptor [49]. Electronic transitions in the crystal core of InP generate transient di-pole moments along the three crystallographic axes. Due to the high symmetry of the faceted nanocrystal, the total emission dipole can be considered isotropic within the volume of the dot. The PAZO molecule is long and thin, and the dipole moment is “linear” and coincides with the axis of the molecule, with the direction of the vector being from one end of the azobenzene group to the other. The dipole moment of the acceptor is located tangentially to the active facet of the QD, where the binding occurs. Using the following formula [47]:
where is the angle between the donor and acceptor transition moments, and and are the angles between them and the distance vector r, respectively, we defined a coordinate system in which the z-axis coincides with the distance vector r.
Assuming that the donor transition moments and the tangentially located acceptor are located in planes perpendicular to r, we defined an orientation .
In this geometry, according to Equation (10), the orientation factor depends mainly on the mutual rotation of the dipoles in the plane. Since in an ensemble of QD-PAZO complexes, the molecules can occupy different rotational positions relative to the QD facets, we chose ° as a statistically representative value, which leads to = 0.67, confirming the consistency of our model with the theoretical assumptions of energy transfer in colloidal systems [50,51,52].
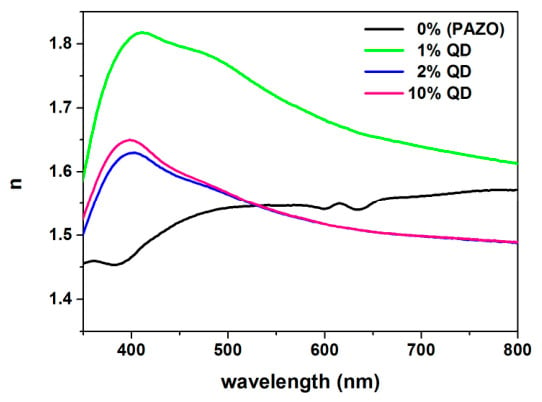
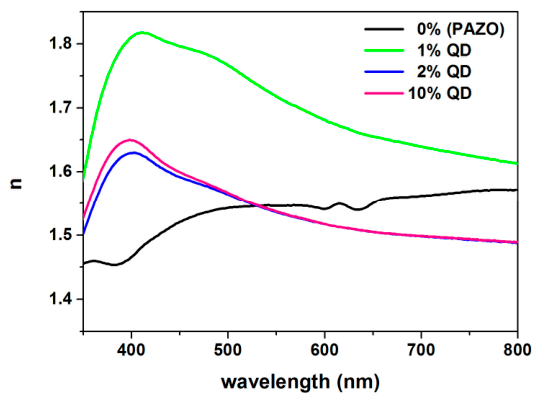
The spectral dependences of the refractive index for all compositions are presented in Figure 7. Around 400 nm, the maximum values of the refractive index of the composite films are observed (Table 4) with a subsequent decline. According to the Kramers–Kronig relations, where there is strong absorption ([25], our publication, Figure 2), the refractive index will change the most. In the transmission region (360–800 nm), the refractive index of the undoped PAZO film remains almost constant. For the doped thin films, the refractive index decreases after 400 nm—normal dispersion, related to electronic transitions in QDs. In the studied range (360–800 nm), the highest values of the refractive index are shown by the thin films with 1 wt.% InP/ZnS quantum dots. When adding 1 wt. % QDs to the polymer matrix, they are distributed evenly and in practice make the material optically denser. A higher concentration of QDs leads to a lower refractive index due to their aggregation and the formation of zones with different densities, which disrupts the homogeneity of the layer. In addition, the incorporation of many nanoparticles probably interferes with the arrangement of the polymer chains of PAZO, creating microscopic voids in the material, which reduces its general density.
Figure 7.
Spectral dependences of the refractive index of pure PAZO film and those doped with 1 wt.%, 2 wt.% and 10 wt.% InP/ZnS quantum dots.
Table 4.
Refractive index and extinction coefficient values of the studied thin layers.
The values of the refractive index at 400 and 800 nm (region of normal dispersion) are presented in Table 4. The thin film doped with 1 wt.% quantum dots has the highest refractive index and the highest optical density.
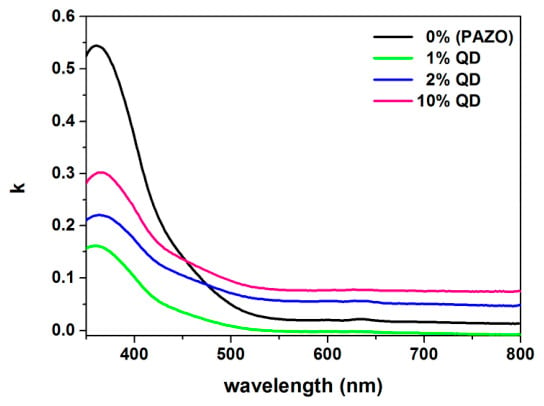
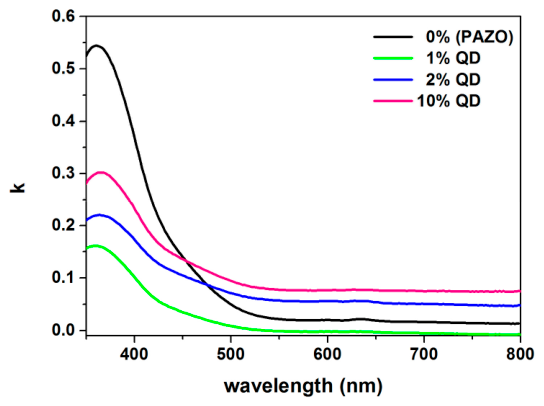
In Figure 8 we can observe the spectral dependences of the extinction coefficient of the pure PAZO film and those doped with 1 wt.%, 2 wt.% and 10 wt.% InP/ZnS quantum dots.
Figure 8.
Spectral dependences of the extinction coefficient of the pure PAZO film and those doped with 1 wt.%, 2 wt.% and 10 wt.% InP/ZnS quantum dots.
In the transmission region the extinction coefficient decreases with increasing wavelength, both for the pure PAZO film and for the doped films, decreasing rapidly at the small wavelengths, and then remains practically constant. In the studied range (360–800 nm), the smallest values of the extinction coefficient are shown by the thin films with 1 wt.% InP/ZnS quantum dots.
The values of the extinction coefficient at 538 and 790 nm are presented in Table 4. The thin film doped with 1 wt.% quantum dots has the smallest extinction coefficient (k = −0.008).
The maximum values of the extinction coefficient of the pure PAZO layer and the composite layers are in the near ultraviolet region around 360 nm, which fully corresponds to the peaks in their absorption spectra ([25], our publication, Figure 2). The peak for the pure PAZO layer is the most intense. The azopolymer PAZO absorbs most strongly in the UV region, since the azobenzene groups have strongly delocalized electrons and at 360 nm an electronic transition π→π* and photoisomerization of the azobenzene groups from the stable trans-form to the metastable cis-form occurs [53]. When adding quantum dots, the relative volume fraction of the polymer decreases; therefore, the peak corresponding to 1 wt.% QDs decreases, but then, comparing 1 wt.%, 2 wt.% and 10 wt.% QDs, it is seen that it starts to grow again. After 2 wt.%, the QDs start to aggregate and scatter light, and in our opinion, one of the reasons for the increase in the measured extinction coefficient is that it includes pure absorption and losses from scattering (QDs absorb most strongly around 300 nm). In the visible region, the extinction coefficient of the pure PAZO polymer approaches zero, which means that the polymer is transparent in this range, which is also visible from the transmission (Figure 1) and absorption spectra ([25], our publication, Figure 2). In this region, the layers with 2 wt.% and 10 wt.% quantum dots have residual own absorption, which is also visible from their absorption spectra ([25], our publication, Figure 2).
The energy balance between the quenching of the donor luminescence and the enhancement of the acceptor luminescence was calculated (Table 5).
Table 5.
Energy balance.
We use the multiple acceptors formula [47] to calculate the effective number of PAZO molecules , that surround one quantum dot:
For layers with 1 wt.% QDs at = 0.77, r = 8.7 nm, and R0 = 10.6 nm, n = 1.02. Here, the model matches almost perfectly with a single acceptor (n ≈ 1). For layers with 2 wt.% QDs at η = 0.80, r = 9.1 nm, and R0 = 11.4 nm, n = 1.03 and stable distribution is observed, close to the ideal model. For layers with 10 wt.% QDs at η = 0.68, r = 10.2 nm, and R0 = 11.2 nm, n = 1.21. Here, the value of increases. This shows that at 10 wt.%, the aggregation changes the local geometry.
For a thin layer doped with 1 wt.% quantum dots in the region from 538 to 800 nm, the extinction coefficient has negative values.
We know that
where I0 is the intensity of the incident light and I is the intensity of the transmitted light.
This means that in this region the intensity of the incident light on the substance is less than the intensity of the transmitted light.
In our opinion the negative values of the extinction coefficient are not related to true optical gain, but to interference effects in a thin layer, d = 95 nm, on quartz and more precisely interference maxima in the reflection.
According to Fresnel’s formula:
at a wavelength of 538 nm (at which the negative values of the extinction coefficient begin), for air–film reflection Raf = 7.14%, refractive index of air is 1, and of film is 1.729; for quartz–film Rqf = 0.32%, refractive index of quartz is 1.544, i.e., without interference, we expect 7.46%, and the measurement is 13.32%. By analogy, at a wavelength of 790 nm (at which we have the largest transmission), for air–film reflection Raf = 5.53%, the refractive index of film is 1.615; for quartz–film reflection, Rqf = 0.05%, i.e., without interference, we expect 5.58%, and the measurement is 10.61%.
In the thin layers doped with 2 and 10% quantum dots, no interference effects are observed, since with increasing concentration the quantum dots begin to aggregate and form clusters [25], and diffuse scattering occurs, which leads to a violation of phase coherence. In addition, with increasing concentration of the quantum dots, absorption increases.
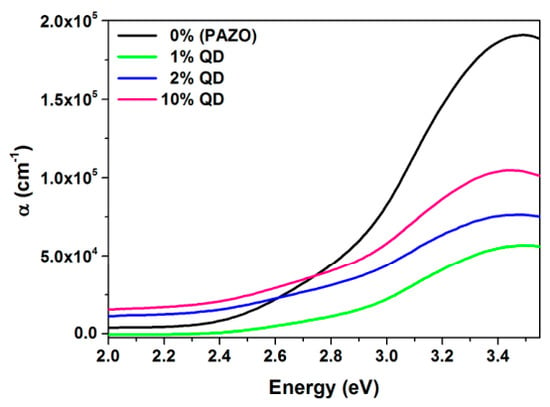
Another indicator that determines the optical properties of a material is the absorption coefficient.
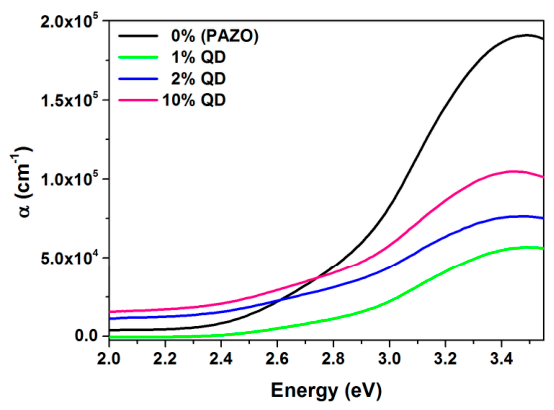
The absorption coefficient (α) values were calculated with the values of the transmission (T) and reflection (R) coefficients from the obtained transmission and reflection spectra and the values of the thickness of the thin layers (d) and using Formula (4), derived from [44]. The values of the absorption coefficient of the thin layers change by several orders of magnitude up to 105 cm−1.
The pure PAZO film has the highest absorption coefficient, and the film doped with 1 wt.% QDs has the lowest.
The spectral dependences (620–350 nm) of the absorption coefficient of the thin layers are presented in Figure 9. The spectra are in the energy range 2.0–3.5 eV.
Figure 9.
Spectral dependences in the energy range 2.0–3.5 eV of the absorption coefficient of thin layers of pure PAZO film and those doped with 1 wt.%, 2 wt.% and 10 wt.% InP/ZnS quantum dots.
From the spectra, it can be seen that the end of the optical absorption of the layers (short-wavelength limit of optical transmission) occurs at an energy level of about 3.45 eV, which corresponds to a wavelength of 360 nm.
The expression for the absorption coefficient α according to [54] has the following form:
where ν is the frequency of the light wave, B is a constant, h is Planck’s constant, Eopt is the so-called optical band gap, and r is an exponent characterizing the mechanism of electron transition from the valence band to the conduction band. There are four possibilities for the exponent r:
- -
- For direct transitions: r = 1/2, r = 3/2;
- -
- For indirect transitions: r = 2, r = 3.
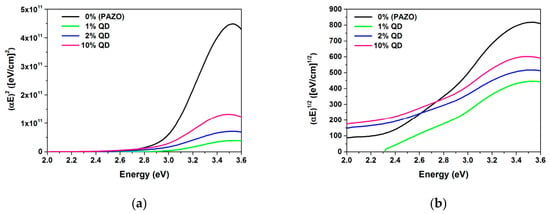
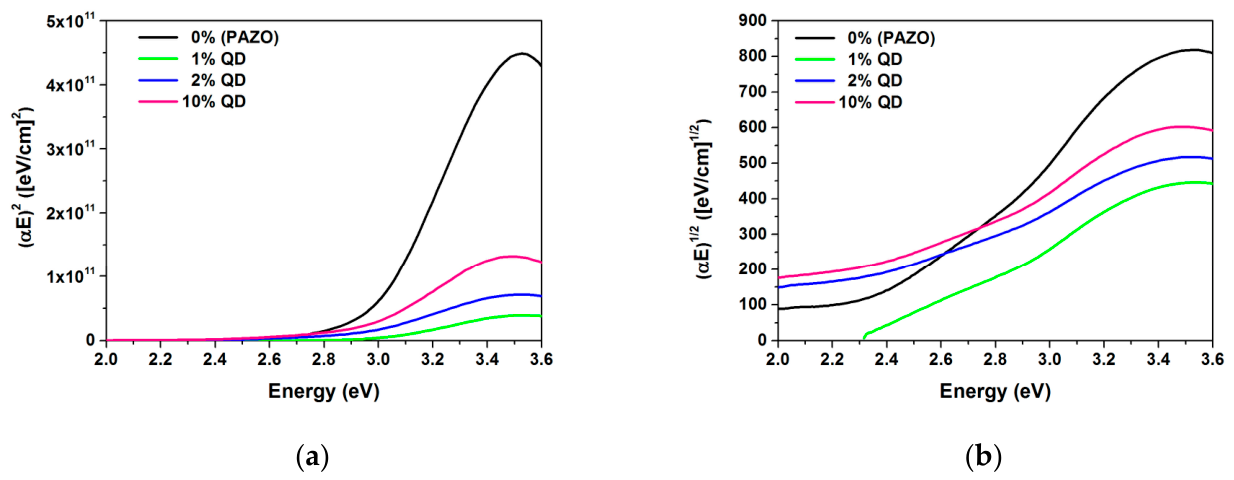
To see what type of electron transitions occur in the thin layers, we determined the power exponent r. For this purpose, we constructed the dependences (αE)2(E) (Figure 10a) and (αE)1/2(E) (Figure 10b). In the graph (αE)2(E), the linear region above the absorption threshold is more clearly expressed for all compositions; therefore, we take the value 1/2 for r, i.e., the transitions of electrons from the valence to the conduction band are direct.
Figure 10.
Determining the type of electron transitions in the thin layers: (a) r = 1/2 and (b) r = 2.
This result is expected, since azopolymers often exhibit direct transition characteristics in their main absorption band (350–380 nm) [55]. InP and ZnS are also direct band gap semiconductors. The InP core has a small band gap of 1.34 eV–1.35 eV at room temperature and the ZnS shell has a larger band gap 3.60–3.70 eV at room temperature.
In the absorption spectrum of the azopolymer PAZO, two main peaks are observed, which correspond to specific electronic transitions in the azobenzene group of the polymer [53]:
- -
- An intense peak (symmetry allowed) around 360 nm, which corresponds to the transition of an electron from the bonding π-orbital (HOMO) to the antibonding π*-orbital (LUMO). In this transition, trans–cis isomerization occurs.
- -
- A weaker peak or “shoulder” (symmetry forbidden) at around 450 nm, which corresponds to the transition of an electron from the lone electron pair of the nitrogen atoms in the azo group at the n level (higher in energy than the bonding orbital) to the antibonding orbital. In this transition, constant cycling between the two states—trans and cis.
In our opinion, when the composite layers are irradiated with light, the InP/ZnS quantum dots absorb energy (the InP core has a small band gap of 1.34 eV–1.35 eV at room temperature) and an electron transition occurs from the valence to the conduction band of InP. This electron is enclosed by the ZnS shell. When the electron returns to the ground state, energy is emitted, which is transmitted to the azobenzene group of the polymer—resonance energy transfer (RET). At the same time, an electron from the azo group of the polymer makes a transition to the antibonding orbital. Since in our case, an overlap of the emission spectrum of the QDs with the absorption spectrum of the PAZO polymer is observed in the region 385–750 nm, we believe that the QDs help primarily to activate transition in the PAZO, which is in the visible region.
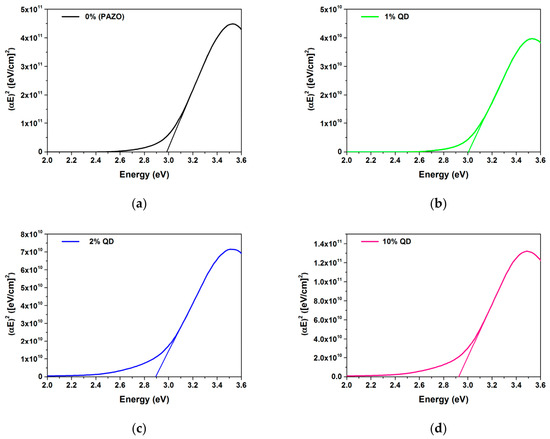
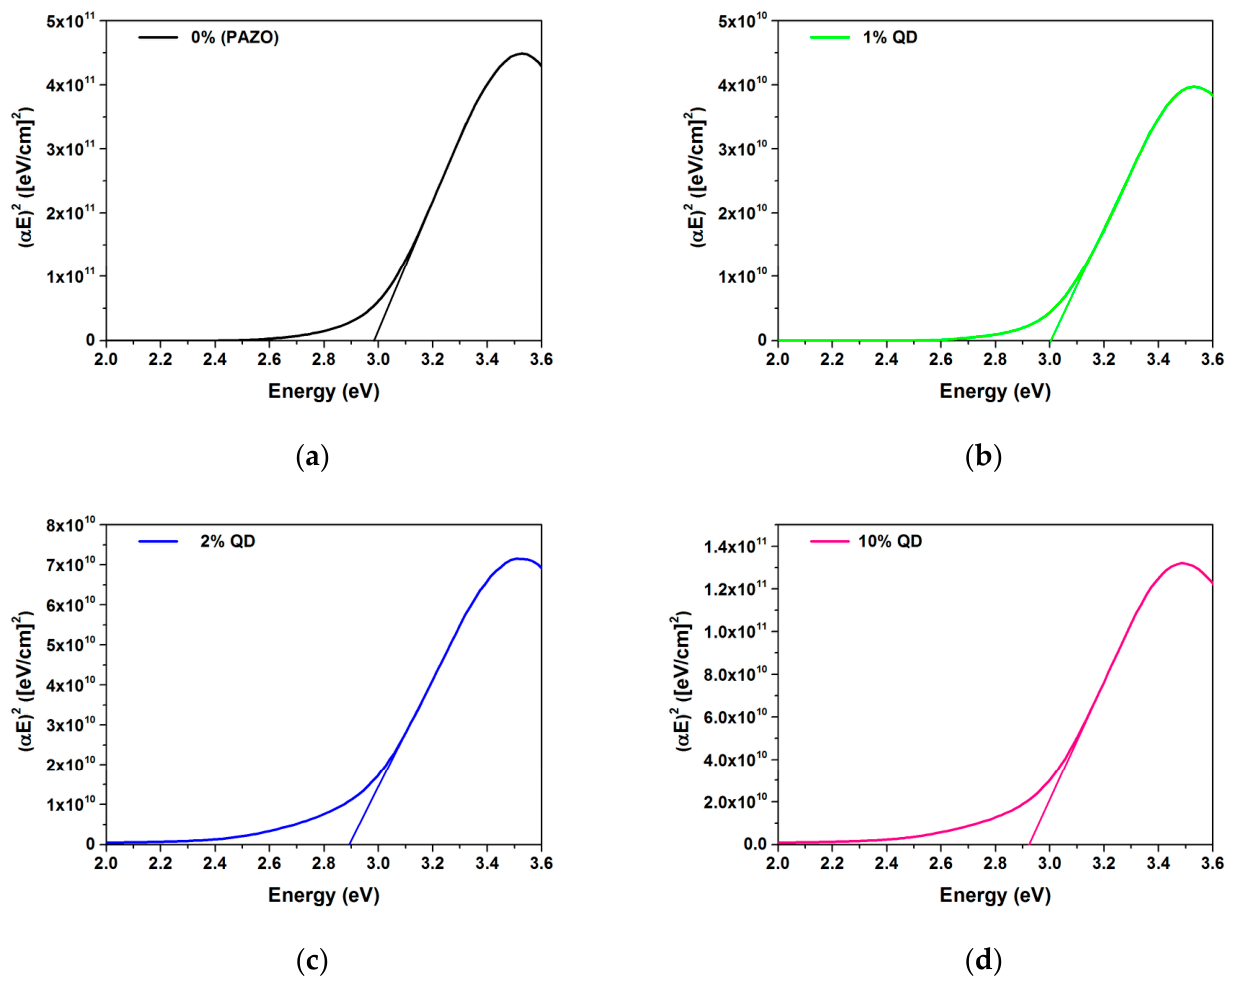
The optical band gap of the thin films was determined using the Tauc procedure [45] by extrapolating the linear region of the dependence (αE)2 = f(E), when α = 0 for all samples. The results are presented in Figure 11 and Table 6.
Figure 11.
Determining optical band gap of (a) the undoped PAZO polymer film, and films doped with (b) 1 wt.%, (c) 2 wt.% and (d) 10 wt.% InP/ZnS quantum dots.
Table 6.
Optical band gap of the thin layers.
The incorporation of 1 wt.% quantum dots leads to quantum confinement effects, due to which a slight increase in the band gap (blue shift) is observed. By incorporation of 2 wt.% quantum dots, a decrease in the band gap value from 3 to 2.89 eV (red shift) is observed, which can be associated with the beginning of the quantum dot agglomeration process [25]. This decrease in the band gap value indicates maximum electronic interaction and efficient energy transfer. Since the pure PAZO polymer is transparent in the visible region, it cannot be activated by visible light. Any change in the properties of the composite films at these wavelengths will be due to QDs. At 10 wt.% quantum dots, the value of Eg is 2.92 eV. This indicates that the high concentration leads to greater agglomeration of the quantum dots and the system reaches saturation, leading to stabilization of the structure.
As a result of the described effects, it can be said that the dependence of Eg on the concentration of QDs includes three regimes:
- -
- Quantum confinement regime: 0–1%;
- -
- Regime of maximum electronic interaction and effective energy transfer: 1–2%;
- -
- Regime of aggregation and structural saturation: 2–10%.
The addition of InP/ZnS quantum dots to PAZO affects its photosensitivity and its ability to change its refractive index under the influence of light. This is discussed in our publication [25].
In the present work, we can predict to some extent the behavior of PAZO doped with the considered quantum dots during optical recording of information, based on the values of Eg. At 1 wt.% quantum dots, Eg is higher than that of PAZO, i.e., higher-intensity irradiation will be required to start the recording process, but since in this case scattering is minimal, the recording is expected to be of higher resolution. According to the Local Field Theory [56], a lower concentration of the QDs leads to a more homogeneous dielectric medium with minimal scattering. The Local Field Theory justifies the connection between the microscopic structure (the quantum dots) and the macroscopic optical response. At 2 wt.% quantum dots, Eg has the lowest value, which suggests the fastest process, which can be attributed to the resonance energy transfer (RET) between quantum dots and azo-chromophores, which enhances the efficiency of photoinduced processes in the matrix [47]. At 10 wt.% quantum dots, Eg is not critically different, but the large quantity of particles with a size of 7.5 nm will interfere with the process of trans–cis isomerization of the azomolecules in PAZO and the optical recording. This effect can be explained by the Free Volume Theory [57]. Since the trans–cis isomerization of the azo molecules in PAZO requires a specific critical space for the rotation of the chromophores, the high particle density physically limits the available free volume in the polymer matrix. In support of this, the maximum birefringence achieved for this concentration is lower than that of the pure polymer [25]. In the composite layers we studied, InP/ZnS quantum dots, especially with 2% wt.%, will increase recording stability.
5. Conclusions
In this work, the transmission and reflection spectra of PAZO polymer thin films doped with InP/ZnS quantum dots at concentrations of 1, 2, and 10 wt.% were obtained. Basic optical constants such as refractive index (n), extinction coefficient (k), absorption coefficient (α) and optical band gap (Eg) were determined, and the influence of the dopant concentration was discussed. All films exhibit high transparency in the visible region (T = 87.6–90.6% above 500 nm), with the 1 wt.% QD nanocomposite demonstrating the highest optical density (n = 1.818 at 480 nm) and peak reflectance (14.1% at 480 nm) and the lowest extinction coefficient (k = −0.008).
Quantitative analysis of resonance energy transfer (RET) confirms strong donor–acceptor coupling between the InP/ZnS QDs and the PAZO chromophores (crossover at 465 nm), reaching energy transfer efficiencies of η = 0.77 (R0 = 10.6 nm) for 1 wt.% and η = 0.80 (R0 = 11.4 nm) for 2 wt.% QDs.
However, the inherent limitations of using oil-soluble oleylamine-capped QDs emerge at concentrations ≥2 wt.%. TEM and radial distribution function (RDF) analyses reveal nanoparticle aggregation into 13–18 nm clusters.
The high concentration leads to greater agglomeration of the quantum dots and the system reaches saturation, leading to stabilization of the structure (Eg = 2.92 eV at 10 wt.%).
Based on these physical mechanisms, three distinct performance regimes are established:
- -
- 0–1 wt.% QD (quantum confinement): Characterized by minimal scattering, increased band gap (Eg = 3.00 eV) and more homogeneous dielectric medium according to the Local Field Theory.
- -
- 1–2 wt.% QD (maximum electronic interaction and effective energy transfer): Characterized by lowest band gap (Eg = 2.89 eV), which suggests the fastest process. This may be attributed to the resonance energy transfer (RET) between quantum dots and azo-chromophores, which enhances the efficiency of photoinduced processes in the matrix and optimal RET efficiency (η = 0.80).
- -
- 2–10 wt.% QD (aggregation and structural saturation): The large quantity of particles will interfere with the process of trans–cis isomerization of the azo molecules in PAZO and the optical recording. This effect can be explained by the Free Volume Theory.
In summary, doping the PAZO polymer with InP/ZnS quantum dots at low concentration may lead to improved optical response of the composite materials compared to the pure azo polymer, especially in the visible region of the spectrum as a result of resonance energy transfer (RET).
Author Contributions
Conceptualization, A.S.; methodology, A.S., D.D. and V.L.; validation, Y.T. and V.L.; investigation, Y.T., V.L., A.S. and D.D.; writing—original draft preparation, V.I.; writing—review and editing, Y.T. All authors have read and agreed to the published version of the manuscript.
Funding
This study was funded by the European Union program “Research, Innovation and Digitalisation for Smart Transformation” 2021–2027, project BG16RFPR002-1.009-0003, “ABC-BIO-CAR.”
Institutional Review Board Statement
Not applicable.
Informed Consent Statement
Not applicable.
Data Availability Statement
All data generated or analyzed during this study are included in the published article.
Conflicts of Interest
The authors declare no conflicts of interest.
References
- Gu, M.; Zhang, Q.; Lamon, S. Nanomaterials for optical data storage. Nat. Rev. Mater. 2016, 1, 16070. [Google Scholar] [CrossRef] [Scilit]
- Wang, C.; Niu, R.; Zhou, Z.; Wu, W.; Chai, Z.; Song, Y.; Kong, D. Nonlinear optical properties of InP/ZnS core–shell quantum dots. Nanotechnology 2020, 31, 135001. [Google Scholar] [CrossRef] [Scilit]
- Li, X.; Chon, J.W.M.; Evans, R.A.; Gu, M. Two-photon energy transfer enhanced three–dimensional optical memory in quantum–dot and azo–dye doped polymers. Appl. Phys. Lett. 2008, 92, 063309. [Google Scholar] [CrossRef] [Scilit]
- Greben, M.; Vorontsov, D.; Khoroshyy, P.; Gulka, M.; Valenta, J. Concentration-Dependent Photophysics of InP/ZnS Quantum Dots: Surface Still Matters Despite Thick Shells. Nanoscale 2025, 17, 27438. [Google Scholar] [CrossRef] [Scilit]
- Kim, S.; Park, J.; Kim, T.; Jang, E.; Jun, S.; Jang, H.; Kim, B.; Kim, S.-W. Reverse Type-I ZnSe/InP/ZnS core/shell/shell nanocrystals: Cadmium-free quantum dots for visible luminescence. Small 2011, 7, 70–73. [Google Scholar] [CrossRef] [Scilit]
- Sarkar, S.; Srivastava, T.P.; Sahoo, O.S.; Shankar, A.; Rai, A.; Pethusamy, K.; Dhar, R.; Karmakar, S. Applications of quantum dots in preventive oncology. Asian Pac. J. Cancer Prev. 2024, 25, 747–756. [Google Scholar] [CrossRef] [Scilit]
- Saha, A.; Konstantatos, G. Ag2ZnSnS4–ZnS Core–Shell Colloidal Quantum Dots: A Near-Infrared Luminescent Material Based on Environmentally Friendly Elements. J. Mater. Chem. C 2021, 9, 5682–5688. [Google Scholar] [CrossRef] [Scilit]
- Gromova, Y.; Sokolova, A.; Kurshanov, D.; Korsakov, I.; Osipova, V.; Cherevkov, S.; Dubavik, A.; Maslov, V.; Perova, T.; Gun’ko, Y.; et al. Investigation of AgInS2/ZnS Quantum Dots by Magnetic Circular Dichroism Spectroscopy. Materials 2019, 12, 3616. [Google Scholar] [CrossRef] [Scilit]
- Jeong, S.; Ko, M.; Nam, S.; Oh, J.H.; Park, S.M.; Do, Y.R.; Song, J.K. Enhancement Mechanism of Quantum Yield in Core/Shell/Shell Quantum Dots of ZnS–AgIn5S8/ZnIn2S4/ZnS. Nanoscale Adv. 2024, 6, 925–933. [Google Scholar] [CrossRef] [Scilit]
- Stroyuk, O.; Raievska, O.; Zahn, D.R.T.; Brabec, C.J. Accelerated Discovery of Multinary Chalcogenide Quantum Dots: Combining Aqueous Chemistry with High-Throughput Experimentation and Machine Learning. Nano Futures 2025, 9, 042505. [Google Scholar] [CrossRef] [Scilit]
- Yim, H.; Shim, B.; Kim, H.; Park, S.; Park, C.; Kim, W.B. Enhanced Quantum Yield and Long-Term Stability of Eco-Friendly Water-Dispersed InP/ZnSe/ZnS Quantum Dots via Photochemical Surface Passivation. J. Phys. Chem. Lett. 2025, 16, 6008–6014. [Google Scholar] [CrossRef] [Scilit]
- Park, S.A.; Jung, W.H.; Yoo, J.-Y.; Lee, C.W.; Kim, J.S.; Kim, J.-G.; Chin, B.D. Electrical Resonant Effects of Ligands on the Luminescent Properties of InP/ZnSeS/ZnS Quantum Dots and Devices Configured Therefrom. Org. Electron. 2020, 87, 105955. [Google Scholar] [CrossRef] [Scilit]
- Jemelka, J.; Loghina, L.; Frumarova, B.; Rodriguez-Pereira, J.; Slang, S.; Houdek, J.; Kurka, M.; Jambor, R.; Vlcek, M. Ligand-Engineered ZnS Quantum Dots Synthesized from Substituted Thioureas: Scalable Production, Polymer Grafting, and Emissive Film Fabrication. Nanoscale Adv. 2026, 8, 1598–1610. [Google Scholar] [CrossRef] [Scilit]
- Loskutova, A.; Seitkali, A.; Aliyev, D.; Bukasov, R. Quantum dot-based luminescent sensors: Review from analytical perspective. Int. J. Mol. Sci. 2025, 26, 6674. [Google Scholar] [CrossRef] [Scilit]
- Águila-López, J.; Sánchez-Rivera, M.; Arias-Cerón, J.S.; Secundino-Sánchez, O.; Sánchez-Ramírez, J.F.; Díaz-Reyes, J. Enhanced photoluminescence of InP@ZnS quantum dots induced by increasing the indium myristate-to-tris(trimethylsilyl)phosphine molecular precursors ratio. J. Mater. Sci. Mater. Electron. 2024, 35, 222. [Google Scholar] [CrossRef] [Scilit]
- Mahato, B.; Das, P.K.; Bhardwaj, A. InP/ZnS quantum dots for high-sensitivity temperature sensors. ACS Omega 2024, 9, 41651–41661. [Google Scholar] [CrossRef] [Scilit]
- Nazarova, D.; Nedelchev, L.; Berberova-Buhova, N.; Mateev, G. Nanocomposite Photoanisotropic Materials for Applications in Polarization Holography and Photonics. Nanomaterials 2023, 13, 2946. [Google Scholar] [CrossRef] [Scilit]
- Sagdeev, D.O.; Galyametdinov, Y.G. Quantum dots–polymer films as reversible luminescent wide-range temperature sensors. Methods Appl. Fluoresc. 2025, 13, 025003. [Google Scholar] [CrossRef] [Scilit]
- Day, D.; Gu, M.; Smallridge, A. Use of two-photon excitation for erasable–rewritable three-dimensional bit optical data storage in a photorefractive polymer. Opt. Lett. 1999, 24, 948–950. [Google Scholar] [CrossRef] [Scilit]
- Syammohan, V.; Ramya, M.; Peter, A.M.; Anjana, A.S.; Chakrapani, P.S.B.; Madanan, K. Glutathione-Capped CuInS2/ZnS Quantum Dots for the Determination of Pb2+ in Drinking Water and Multicolor Cellular Imaging. ACS Appl. Nano Mater. 2025, 8, 10116–10128. [Google Scholar] [CrossRef] [Scilit]
- Zhang, W.; Lee, H.-R. Synthesis and Optical Property of Water-Soluble ZnS:Cu Quantum Dots by Use of Thioglycolic Acid. Appl. Opt. 2010, 49, 2566–2570. [Google Scholar] [CrossRef] [Scilit]
- Peng, Y.; Song, X.; Deng, T.; Zhang, J.; Deng, D. Water Transfer of Oil-Soluble ZnAgInSe/ZnS Quantum Dots by DHLA-PEG-Suc-cRGD Ligands for Tumor Targeted Bio-Imaging. J. Nanosci. Nanotechnol. 2019, 19, 1934–1941. [Google Scholar] [CrossRef] [Scilit]
- Duan, J.; Zhang, Q.; Du, J.; Liu, X.; Wu, S.; Liao, S. ZnS QDs Stabilized Concurrently with Glutathione and L-cysteine for Highly Sensitive Determining Adriamycin Based on the Fluorescence Enhancement Mechanism. J. Fluoresc. 2024, 34, 2523–2531. [Google Scholar] [CrossRef] [Scilit] [PubMed]
- Day, D.; Gu, M.; Smallridge, A. Rewritable 3D bit optical data storage in a PMMA-based photorefractive polymer. Adv. Mater. 2001, 13, 1005–1007. [Google Scholar] [CrossRef] [Scilit]
- Stoilova, A.; Dimov, D.; Trifonova, Y.; Mateev, G.; Lilova, V.; Nazarova, D.; Nedelchev, L. Effect of InP/ZnS quantum dots aggregation on the kinetics of birefringence recorded in thin azopolymer composite films. Phys. Scr. 2024, 99, 095988. [Google Scholar] [CrossRef] [Scilit]
- Ahirwar, R.C.; Mehra, S.; Reddy, S.M.; Alshamsi, H.A.; Kadhem, A.A.; Karmankar, S.B.; Sharma, A.; Poushali. Progression of quantum dots confined polymeric systems for sensorics. Polymers 2023, 15, 405. [Google Scholar] [CrossRef] [Scilit]
- Babu, A.K.; Maruga Raja, M.K.M.; Zehravi, M.; Mohammad, B.D.; Anees, M.I.; Prasad, C.; Yahya, B.A.; Sultana, R.; Sharma, R.; Singh, J.; et al. An Overview of Polymer Surface Coated Synthetic Quantum Dots as Therapeutics and Sensors Applications. Prog. Biophys. Mol. Biol. 2023, 184, 1–12. [Google Scholar] [CrossRef] [Scilit]
- Merino, E.; Ribagorda, M. Control over molecular motion using the cis–trans photoisomerization of the azo group. Beilstein J. Org. Chem. 2012, 8, 1071–1090. [Google Scholar] [CrossRef] [Scilit]
- Blanche, P.-A.; Lemaire, P.C.; Maertens, C.; Dubois, P.; Jerome, R. Photoinduced birefringence and diffraction efficiency in azo dye doped or grafted polymers: Theory versus experiment of the temperature influence. J. Opt. Soc. Am. B 2000, 17, 729–735. [Google Scholar] [CrossRef] [Scilit]
- Mauro, S.; Netti, P.A. Photonic applications of azobenzene molecules embedded in amorphous polymer. Riv. Nuovo Cim. 2020, 43, 599–629. [Google Scholar] [CrossRef] [Scilit]
- Lilov, E.; Lilova, V.; Nedev, S. Optical band gap dependence on the oxalic acid concentration of antimony anodic oxide films. Bulg. Chem. Commun. 2016, 48, 17–20. [Google Scholar]
- Buboltz, J.T.; Bwalya, C.; Reyes, S.; Kamburov, D. Stern–Volmer Modeling of Steady-State Förster Energy Transfer Between Dilute, Freely Diffusing Membrane-Bound Fluorophores. J. Chem. Phys. 2007, 127, 215101. [Google Scholar] [CrossRef] [Scilit]
- Motz, R.N.; Sun, A.C.; Lehnherr, D.; Ruccolo, S. High-Throughput Determination of Stern–Volmer Quenching Constants for Common Photocatalysts and Quenchers. ACS Org. Inorg. Au 2023, 3, 266–273. [Google Scholar] [CrossRef] [Scilit]
- Kohlmann, T.; Goez, M. Combined Static and Dynamic Intramicellar Fluorescence Quenching: Effects on Stationary and Time-Resolved Stern–Volmer Experiments. Phys. Chem. Chem. Phys. 2019, 19, 10075–10085. [Google Scholar] [CrossRef] [Scilit]
- Zangi, R. Quenching Single-Fluorophore Systems and the Emergence of Nonlinear Stern–Volmer Plots. ACS Omega 2026, 11, 12713–12724. [Google Scholar] [CrossRef] [Scilit]
- Würthner, F.; Hariharan, M. Control of photoluminescence properties by tailored supramolecular matrices. Trends Chem. 2025, 7, 208–224. [Google Scholar] [CrossRef] [Scilit]
- Zenkevich, E.; Cichos, F.; Shulga, A.; Petrov, E.P.; Blaudeck, T.; von Borczyskowski, C. Nanoassemblies designed from semiconductor quantum dots and molecular arrays. J. Phys. Chem. B 2005, 109, 8679–8692. [Google Scholar] [CrossRef] [Scilit]
- Blaudeck, T.; Zenkevich, E.I.; Cichos, F.; von Borczyskowski, C. Probing wave functions at semiconductor quantum-dot surfaces by non-FRET photoluminescence quenching. J. Phys. Chem. C 2008, 112, 20251–20257. [Google Scholar] [CrossRef] [Scilit]
- Zenkevich, É.I.; Blaudeck, T.; Heidernätsch, M.; Cichos, F.; von Borczyskowski, C. Effects of electron tunneling and nonresonance quenching of photoluminescence in semiconducting CdSe/ZnS AND CdSe nanocrystals by porphyrin molecules in joint complexes. Theor. Exp. Chem. 2009, 45, 23–34. [Google Scholar] [CrossRef] [Scilit]
- Stupak, A.P.; Blaudeck, T.; Zenkevich, E.I.; Krause, S.; von Borczyskowski, C. The nature of non-FRET photoluminescence quenching in nanoassemblies from semiconductor quantum dots and dye molecules. Phys. Chem. Chem. Phys. 2018, 20, 18579–18600. [Google Scholar] [CrossRef] [Scilit]
- Kurashvili, M.; Llusar, J.; Stickel, L.S.; Würthner, T.; Ederle, D.; Infante, I.; Feldmann, J.; Akkerman, Q.A. Efficient energy transfer from quantum dots to closely-bound dye molecules without spectral overlap. Angew. Chem. Int. Ed. 2025, 64, e202420658. [Google Scholar] [CrossRef] [Scilit]
- Lemon, C.M.; Karnas, E.; Han, X.; Bruns, O.T.; Kempa, T.J.; Fukumura, D.; Bawendi, M.G.; Jain, R.K.; Duda, D.G.; Nocera, D.G. Micelle-Encapsulated Quantum Dot–Porphyrin Assemblies as In Vivo Two-Photon Oxygen Sensors. J. Am. Chem. Soc. 2015, 137, 9832–9842. [Google Scholar] [CrossRef] [Scilit]
- Mandal, S.; Garcia Iglesias, M.; Ince, M.; Torres, T.; Tkachenko, N.V. Photoinduced Energy Transfer in Quantum Dot–Phthalocyanine Hybrids. ACS Omega 2018, 3, 10048–10057. [Google Scholar] [CrossRef] [Scilit]
- Dressel, M.; Grüner, G. Electrodynamics of Solids: Optical Properties of Electrons in Matter; Cambridge University Press: Cambridge, UK, 2003. [Google Scholar]
- Tauc, J. Optical properties of solids. In Optical Properties of Solids; Abeles, F., Ed.; North-Holland: Amsterdam, The Netherlands, 1970. [Google Scholar]
- James, F.; Roos, M. Minuit—A system for function minimization and analysis of the parameter errors and correlations. Comput. Phys. Commun. 1975, 10, 343–367. [Google Scholar] [CrossRef] [Scilit]
- Valeur, B. Molecular Fluorescence Principles and Applications; Wiley-VCH Verlag GmbH: Weinheim, Germany, 2001. [Google Scholar]
- Tonet, M. Fluorescence Quenching & the Stern-Volmer Plot; Spectral School, University of St Andrews: St Andrews, UK, 2024. [Google Scholar]
- Llusar, J.; Fossé, I.; Hens, Z.; Houtepen, A.; Infante, I. Surface Reconstructions in II–VI Quantum Dots. ACS Nano 2024, 18, 1563–1572. [Google Scholar] [CrossRef] [Scilit]
- Rempel, J.; Trout, B.; Bawendi, M.; Jensen, K. Properties of the CdSe(0001), (0001), and (1120) single crystal surfaces: relaxation, reconstruction, and adatom and admolecule adsorption. J. Phys. Chem. B 2005, 109, 19320–19328. [Google Scholar] [CrossRef] [Scilit]
- Rempel, J.; Trout, B.; Bawendi, M.; Jensen, K. Density functional theory study of ligand binding on CdSe (0001), (0001), and (1120) single crystal relaxed and reconstructed surfaces: implications for nanocrystalline growth. J. Phys. Chem. B 2006, 110, 18007–18016. [Google Scholar] [CrossRef] [Scilit]
- von Borczyskowski, C.; Zenkevich, E. (Eds.) Self-Assembled Organic-Inorganic Nanostructures Optics and Dynamics, 1st ed.; Pan Stanford Publishing Pte. Ltd.: New York, NY, USA, 2016. [Google Scholar] [CrossRef] [Scilit]
- Purkait, M.; Sinha, M.; Mondal, P.; Singh, R. Photoresponsive Membranes. Interface Sci. Technol. 2018, 25, 115–144. [Google Scholar] [CrossRef] [Scilit]
- Mott, N.; Davis, E. Electronic Processes in Non-Crystalline Materials; Mir Publishers: Moscow, Russia, 1982. [Google Scholar]
- Minkov, D.; Nedelchev, L.; Angelov, G.; Marquez, E.; Blagoeva, B.; Mateev, G.; Nazarova, D. Hybrid dispersion model characterization of PAZO Azopolymer thin films over the entire transmittance spectrum measured in the UV/VIS/NIR spectral region. Materials 2022, 15, 8617. [Google Scholar] [CrossRef] [Scilit]
- Aspnes, D. Local-field effects and effective-medium theory: A microscopic perspective. Am. J. Phys. 1982, 50, 704–709. [Google Scholar] [CrossRef] [Scilit]
- Eisenbach, D. Relation between photochromism of chromophores and free volume theory in bulk polymers. Berichte Bunsenges. Phys. Chem. 1980, 84, 680–690. [Google Scholar] [CrossRef] [Scilit]

Disclaimer/Publisher’s Note: The statements, opinions and data contained in all publications are solely those of the individual author(s) and contributor(s) and not of MDPI and/or the editor(s). MDPI and/or the editor(s) disclaim responsibility for any injury to people or property resulting from any ideas, methods, instructions or products referred to in the content. |
© 2026 by the authors. Licensee MDPI, Basel, Switzerland. This article is an open access article distributed under the terms and conditions of the Creative Commons Attribution (CC BY) license.