


Abstract
Learning Commons (LC) support student activities. This exploratory case study examined the LC on the second floor of Learning Square at Meiji University through video observation on one weekday. Movement trajectories, user activities, and dwell time were recorded under natural use conditions. Visibility zones were generated from spatial interfaces and examined together with seating configuration and observed movement trajectories. A total of 1903 passage events and 109 seating episodes were recorded. The floor supported seated use and movement between classrooms and vertical circulation elements. The Large-Group Table Seats and Table Seats had higher direct visibility from spatial interfaces and were located near areas with repeated overlap of movement trajectories. Conversation was more common in these two areas. The Counter Seats had lower direct visibility from spatial interfaces and a different spatial relationship to the observed movement trajectories, while computer and smartphone use accounted for most seating episodes. Among the complete seating episodes, the Counter Seats area had the highest mean dwell time. It also had the highest observed seat occupancy rate over the full observation period. However, Kaplan–Meier and RMST analyses showed no clear evidence of dwell time differences among the three seating areas. The findings describe one observed weekday and do not establish independent or causal effects of the spatial conditions.
1. Introduction
In recent years, changes in educational environments have increased the importance of learning spaces on university campuses. Learning Commons (LC) are positioned as facilities and resources that support the diverse learning activities of contemporary university students, ranging from conventional, relatively static study to active learning involving group discussion [1]. In university libraries, learning environments such as LC spaces and group study rooms have also been developed to facilitate more flexible communication among students, in addition to individual self-study spaces [2,3]. An observational study of academic libraries at multiple universities found that academic activities constituted the primary use. However, conversation, eating, and resting also occurred [4]. The study also found that approximately 40% of respondents conducted more than half of their out-of-class learning in libraries [4]. These findings indicate the growing importance of spatial planning that supports students’ autonomous learning and communication.
As their role expands, LC spaces on university campuses function as places for learning and as everyday spaces used for multiple purposes. In actual use, LC spaces support self-study, group study, and consultation related to academic work and student life [3]. In university library spaces, diverse activities, including conversation, eating, resting, and sleeping, have also been observed [4]. Furthermore, studies of public spaces have positioned waiting as one type of dwelling behavior [5]. Therefore, understanding the spatial characteristics of LC spaces is important for supporting the diverse activities that occur in these spaces.
Previous studies have examined learning-space use and seat selection in relation to spatial characteristics. Natsume et al. investigated six LC spaces at four universities and examined visibility, territoriality, spatial characteristics, and seat selection [6]. They also used simulation experiments to examine seat selection under different learning-environment conditions [6]. Simulation studies are useful for examining seat selection under controlled conditions. However, naturally occurring activities, dwell time, and circulation in an LC need to be examined through observation of actual use. Zhang et al. found that spatial configuration and visual accessibility were related to students’ space preferences in informal learning spaces [7]. Psathiti and Sailer also showed that seat preference should be considered together with furniture and other spatial characteristics [8]. These studies suggest that visibility is one of several spatial characteristics relevant to seating use.
Architectural wayfinding studies provide another basis for considering visibility. Watanabe and Mori examined first-time visitors moving from an entrance to a destination and analyzed the spatial information available during movement [9]. They found that users adjusted their wayfinding methods according to the spatial information encountered along the route [9]. Their subsequent study further examined the role of information provided by the spatial configuration itself during wayfinding [10]. These studies suggest that visual information is relevant when users approach, enter, and move through architectural space. In an LC connected to surrounding circulation through multiple entrances and openings, the direct visibility of seating areas from spatial interfaces may therefore form part of the spatial information available to users. In this study, direct visibility from spatial interfaces is used as an exploratory description of the visual condition of each seating area.
Circulation is also relevant to the spatial setting of an LC. Natapov et al. examined building circulation together with spatial configuration and visual accessibility and discussed their relationship with route understanding in architectural space [11]. In educational environments, circulation spaces may also support activities other than movement. Wu et al. used a mixed-methods approach to examine informal learning spaces that leveraged circulation areas and discussed how these spaces supported both social and informal learning activities [12]. These studies provide a basis for considering observed movement together with the spatial conditions of seating areas.
Based on these studies, the present study distinguishes between spatial conditions and actual use. Seating configuration describes the physical arrangement of seats. Direct visibility from spatial interfaces describes how directly each seating area can be seen from the surrounding circulation space. Observed movement trajectories describe the relationship between seating areas and actual movement on the floor. These three aspects are treated as spatial conditions. User activities describe what users do in the space, while dwell time describes the temporal characteristics of use. Together, they describe actual use. These dimensions are examined together because they occur simultaneously in the LC. They are not treated as independent causal variables.
Wang et al. noted that spatial characteristics and actual user behavior have often been examined separately in previous studies and emphasized the need to consider them together [13]. However, limited attention has been paid to examining seating configuration, visibility, observed movement, activities, and dwell time together in an LC under actual use. Therefore, this study records naturally occurring movement trajectories, user activities, and dwell time through continuous video observation on one weekday. Visibility zones are generated from spatial interfaces and examined together with seating configuration and observed movement trajectories. Through this exploratory analysis, the study compares the three seating areas in terms of seating configuration, direct visibility from spatial interfaces, their spatial relationship to observed movement trajectories, user activities, and dwell time under natural use.
2. Study Site
This study focuses on the Learning Commons (LC) on the second floor of Learning Square (LS) at Meiji University Izumi Campus. On the official website of Meiji University, Izumi Campus is described as a campus where first- and second-year students study [14]. Therefore, it provides an environment used by students in the early stages of university life.
For first-year students, forming interpersonal relationships on campus is an important element related to adaptation to university life. Previous research has also indicated that friendships, including relationships related to academic activities, may be formed within approximately two months after enrollment [15]. These findings indicate that LS on Izumi Campus can be positioned as an everyday campus space where students develop their learning environment and engage in communication with others, waiting, and resting.
The LS was also designed to promote diverse user activities and includes different seat types, entrances and exits, and vertical circulation elements. Visibility also varies by location. In particular, some areas of the LS have lower direct visibility from spatial interfaces because of walls, columns, and other fixed spatial elements, as described in Section 3.4. These differences in visibility were examined together with seating configuration, observed movement trajectories, user activities, and dwell time.
On the second floor, multiple types of LC areas are arranged, including the Counter Seats area, Large-Group Table Seats area, and Table Seats area. The number of seats is relatively large, and the patterns of use are diverse. This study therefore examines the second floor and compares the three seating areas in terms of seating configuration, visibility, observed movement trajectories, user activities, and dwell time.
Overview of Spatial Configuration
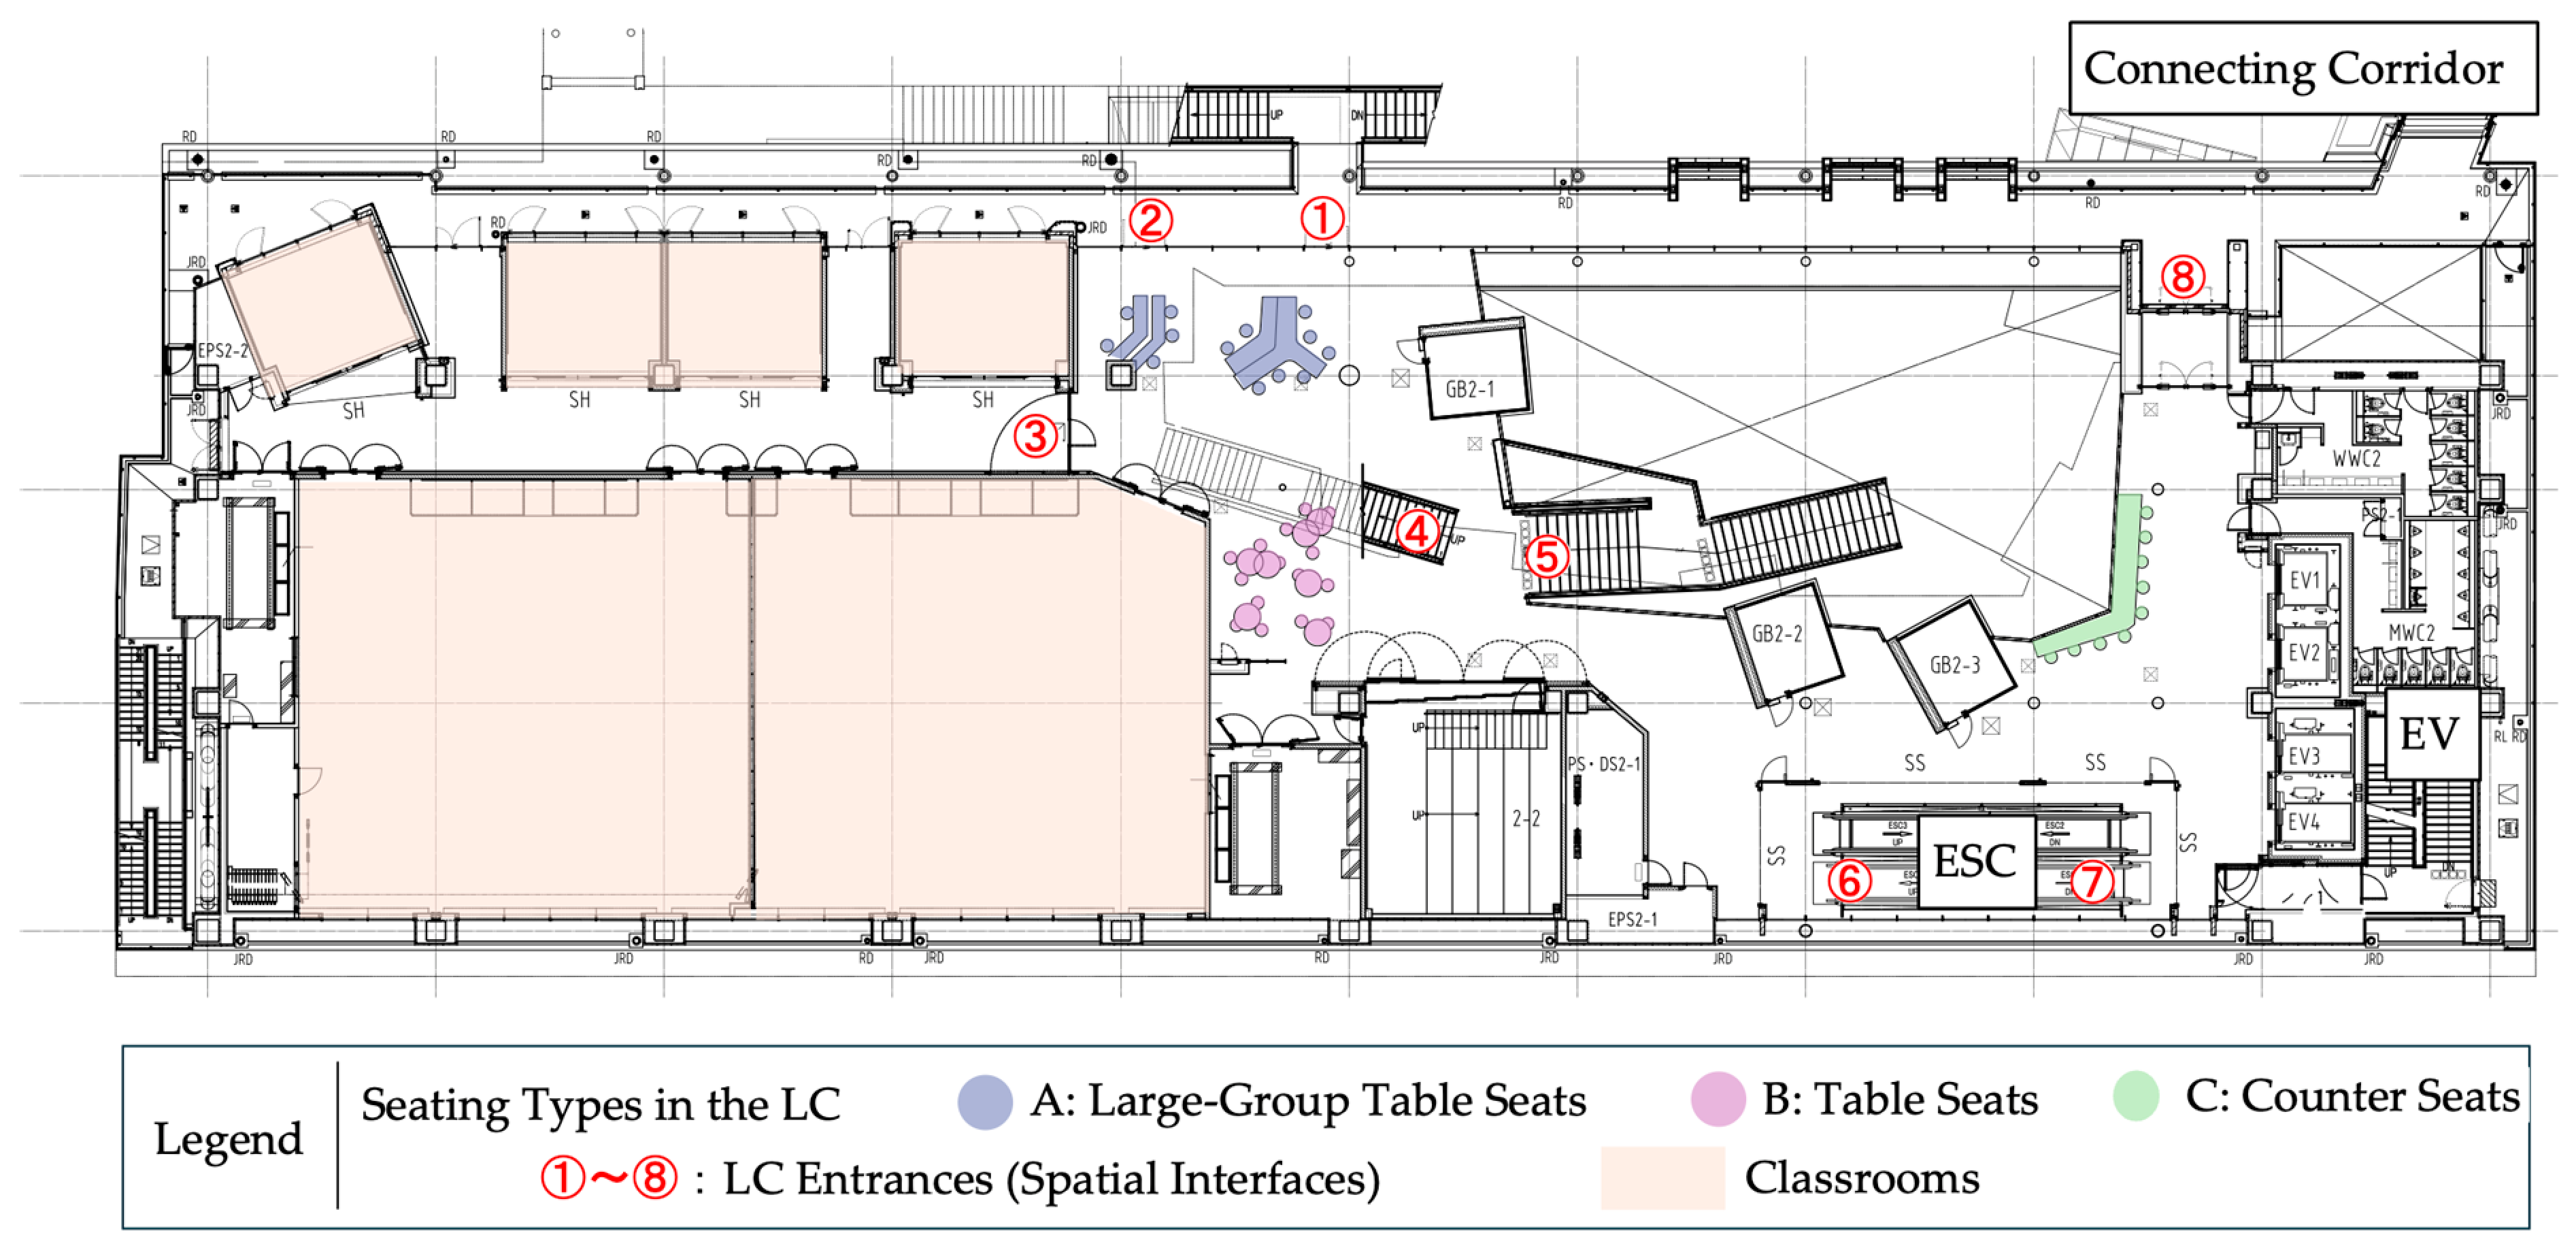
The LC on the second floor of LS has eight entrances and exits. These include two on the terrace side, one on the classroom side, two connected to the indoor stairs, two connected to the escalators, and one near the external connecting corridor. In addition, six classrooms are located on this floor, forming a spatial configuration in which movement between classrooms is likely to occur frequently.
As shown in Figure 1, three types of LC areas are arranged in the interior space.
Figure 1.
Seating types and entrances/exits in the Learning Commons. Source: Adapted from a floor plan provided by Meiji University, reproduced with permission.
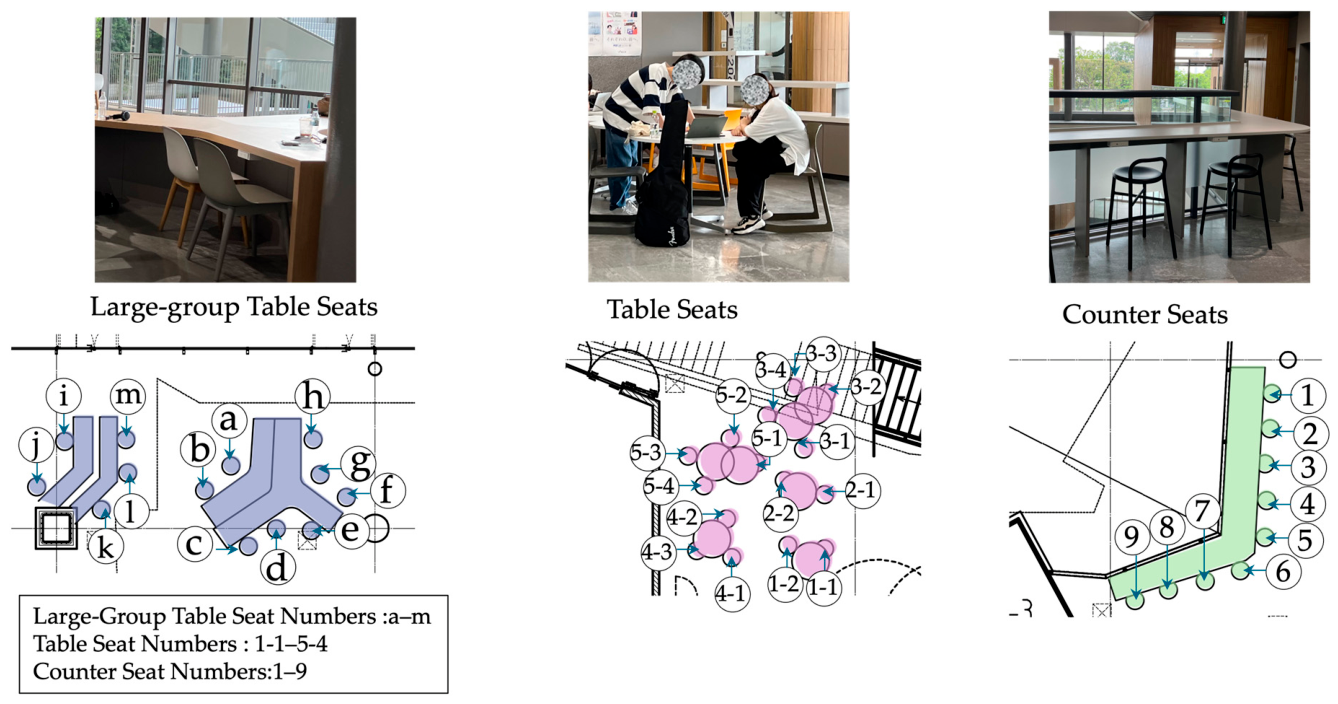
Large-Group Table Seats area contains 13 seats arranged at two tables for five and eight users, respectively. This area is organized around large tables and is intended for use by multiple users. It is located close to classrooms and circulation routes.
Table Seats area contains 15 seats arranged at five tables. This area is also located close to classrooms and circulation routes.
Counters Seats area, contains nine seats and has a different spatial relationship to the circulation routes (Figure 2).
Figure 2.
Seat numbering and photographs of each LC area. Source: Base floor plans adapted from a floor plan provided by Meiji University, reproduced with permission.
These three areas differ in their positional relationships and seating configurations. Therefore, they were established as spatial categories for organizing user activities and dwell time.
3. Survey Method
3.1. Video Observation and Data Collection
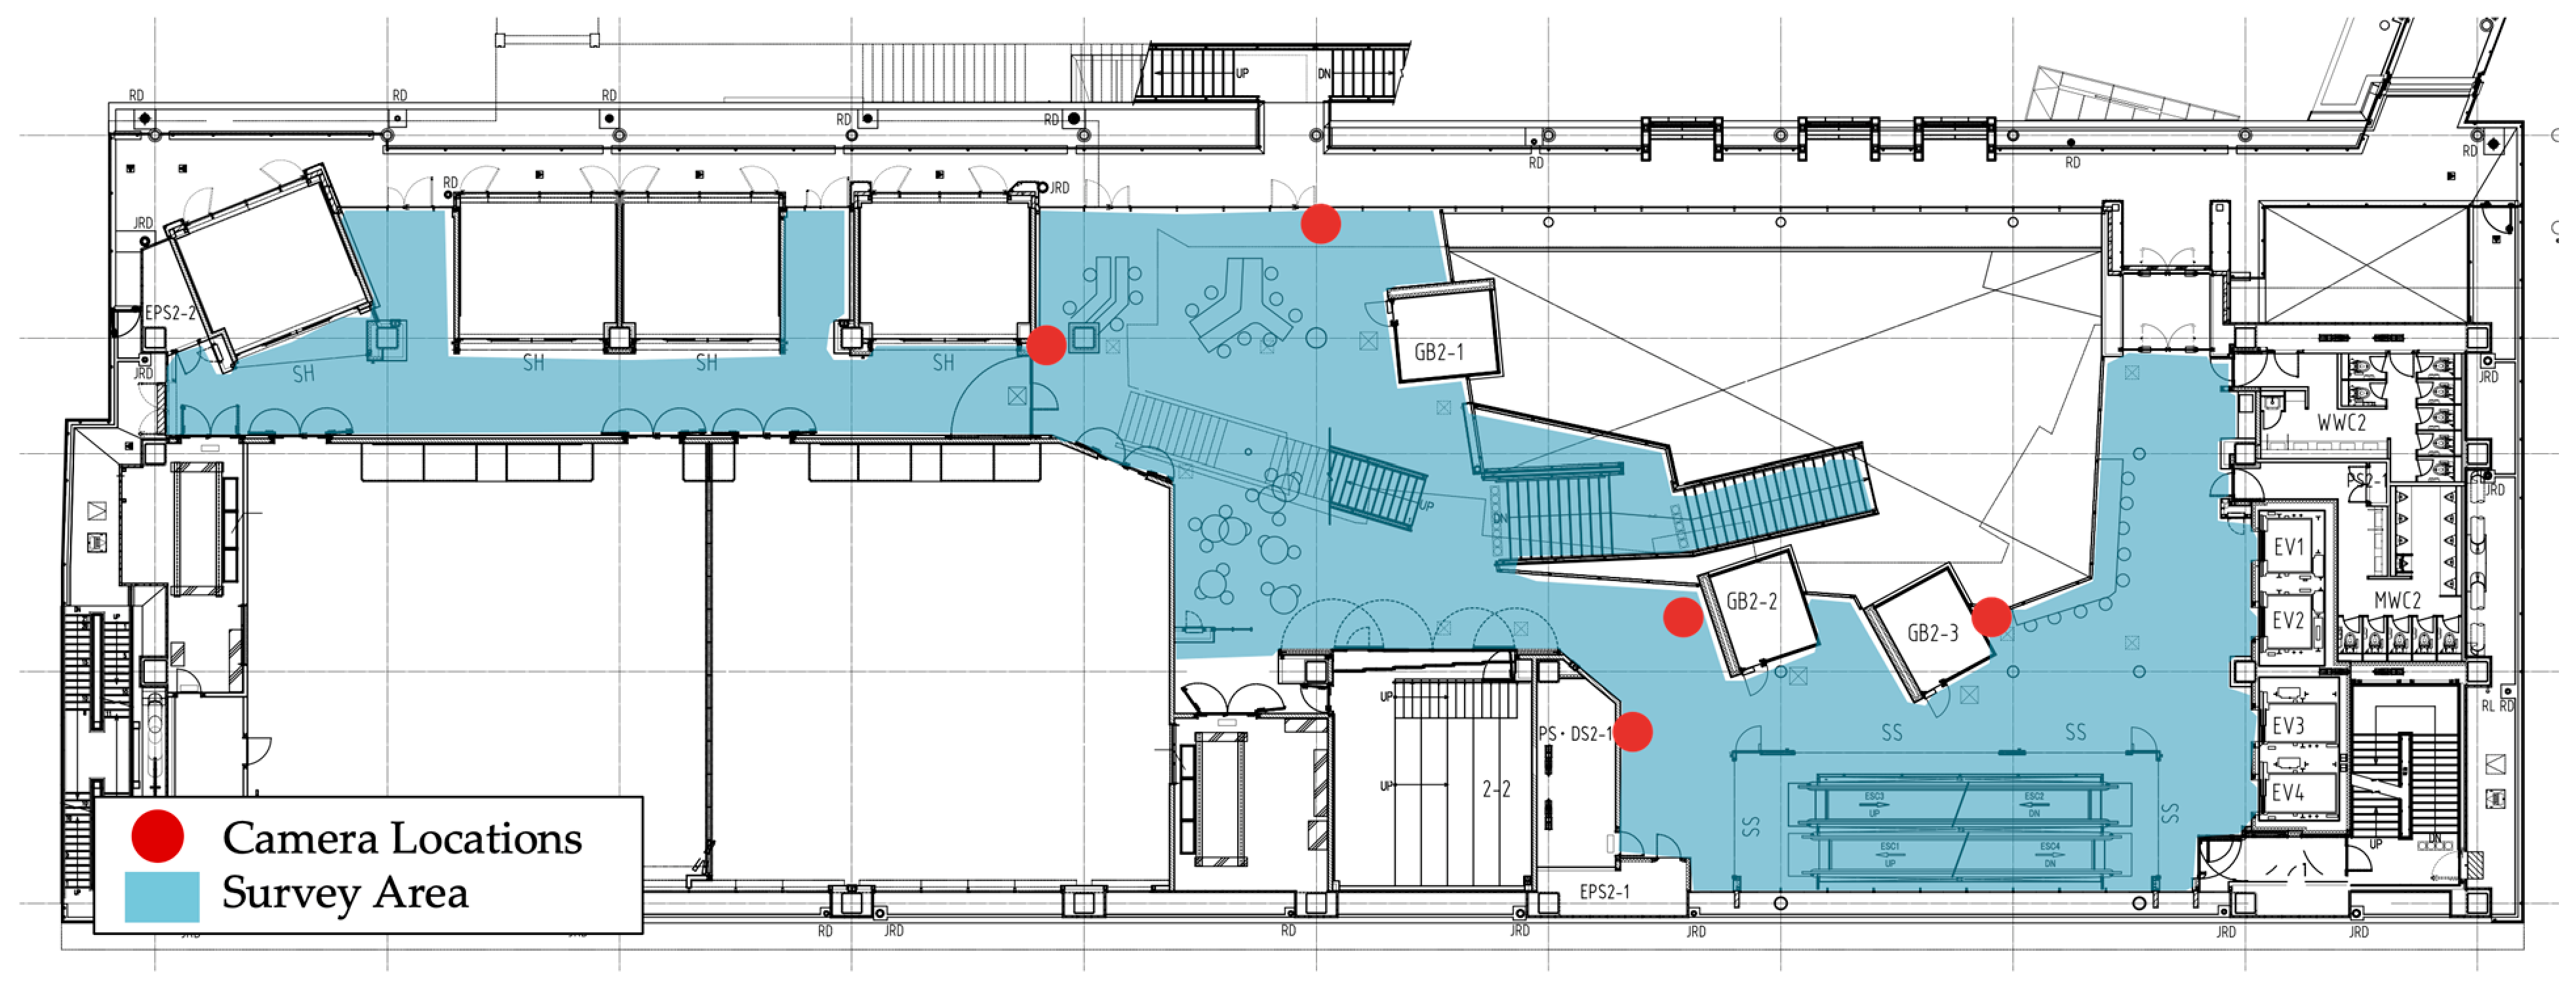
Five video cameras were installed on the second floor of LS to record user activities and dwell time. The cameras covered the vertical circulation elements, the areas around the LC, and the LC seating areas and adjacent circulation spaces (Figure 3).
Figure 3.
Survey area and camera locations. Source: Adapted from a floor plan provided by Meiji University, reproduced with permission.
The survey was conducted from 9:00 to 17:10 on Tuesday 27 June 2023. User movement trajectories, activities, and dwell time were extracted from the recorded video data. User activities were coded from directly observable behavior in the video recordings. The activity classification procedure is described in Section 3.2.
In the present study, one day of continuous observation was used to obtain detailed records of naturally occurring use. The limitation of the one-day observation is discussed in Section 6.
The survey and video recording were conducted under the procedures applicable at Meiji University at the time of the survey. Notices were displayed in Learning Square during the survey, informing users that the survey was being conducted, that cameras were installed in the common space, and that individuals could not be identified from the recorded footage. Meiji University subsequently provided written confirmation that, under the university regulations applicable on 27 June 2023, this survey did not require research ethics review.
The video data were used only to extract movement trajectories, activities, and dwell time. No direct identifiers were collected, and the raw video data were stored on an encrypted external SSD accessible only to the researcher. Potential indirect identifiers, including clothing, companions, timing, and movement trajectories, are not publicly disclosed. The raw video data will be retained and deleted in accordance with the applicable data management requirements of Meiji University.
3.2. Activity Classification Method
User activities were classified from directly observable behavior in the video recordings. The predefined categories were computer use, smartphone use, book or notebook use, conversation, eating, resting, and waiting (Table 1).
Table 1.
Classification of user activities and observable indicators.
When more than one activity occurred during a seating episode, the activity occupying the largest proportion of the total observed dwell time was recorded as the dominant activity. Activity transitions within an episode were not analyzed separately.
Waiting was defined as a state in which no clear computer use, smartphone use, book or notebook use, conversation, eating, or resting was observed and the behavior could not be assigned to another predefined category.
The original coding was conducted in 2023 by one researcher without a separate formal coder training procedure. To assess intra-rater agreement, the same researcher re-coded all 109 seating episodes approximately three years later, using the same activity categories and dominant-activity rule and without consulting the original episode-level classifications. The two coding rounds agreed for 103 of the 109 episodes, giving an agreement rate of 94.5% and a Cohen’s κ of 0.920. The six discrepant episodes were then checked against the original observational records, and the final classifications were updated according to the predefined criteria. Because the original video recordings were stored under restricted access to protect participant privacy and were not shared with additional coders, independent verification by a second coder and assessment of inter-rater agreement were not conducted.
3.3. Statistical Analysis and Data Use
A total of 109 seating episodes were identified during the observation period. Because the observation was conducted from 9:00 to 17:10, some seating episodes were not fully observed. Two episodes had already started before 9:00, so their actual starting times were unknown. Another 22 episodes continued beyond 17:10 and were treated as right-censored observations.
For secondary descriptive analyses requiring complete dwell times, the 85 seating episodes with both observed start and end times were included. These complete episodes were used to calculate the mean, median, standard deviation, first quartile (Q1), third quartile (Q3), interquartile range (IQR), minimum, and maximum dwell time. These statistics were used to describe the observed dwell time characteristics of the three seating areas.
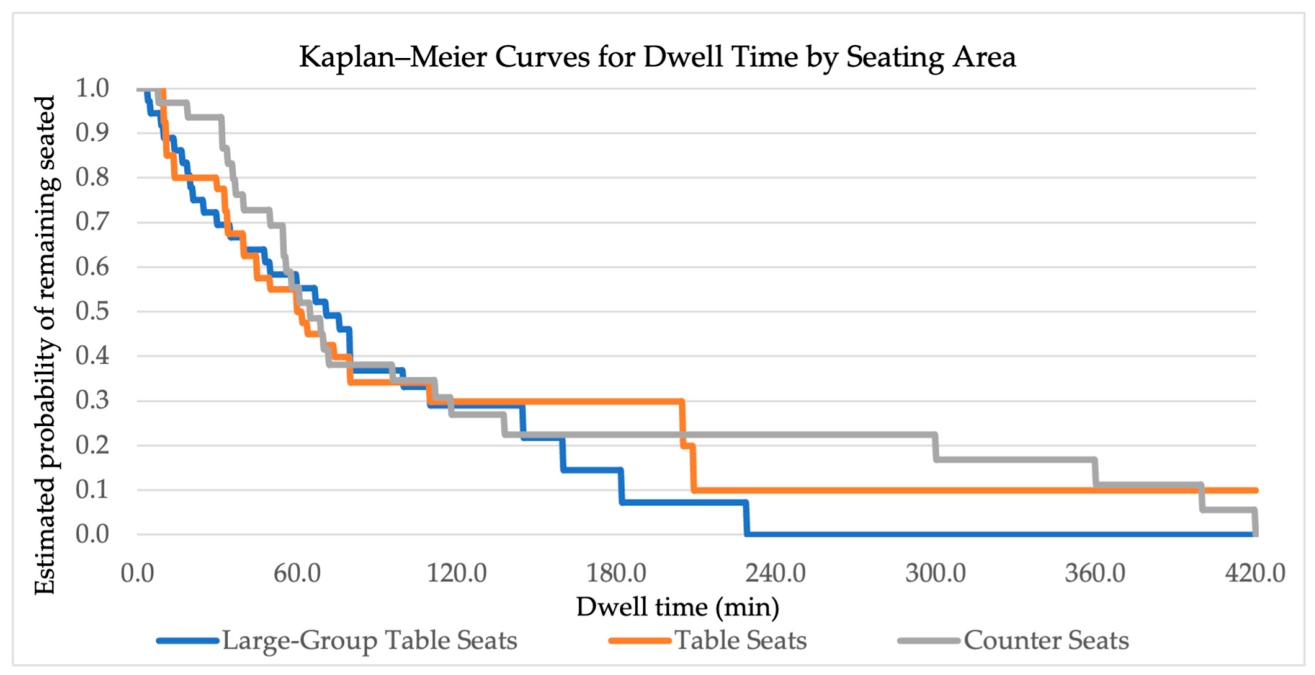
For the Kaplan–Meier analysis [16], the two episodes with unknown starting times were excluded. The remaining 107 episodes, consisting of 85 complete episodes and 22 right-censored episodes, were included. Kaplan–Meier analysis was used as the primary method for examining dwell time distributions because it retains right-censored observations. Median dwell times and 95% confidence intervals were estimated for the Large-Group Table Seats, Table Seats, and Counter Seats. Differences among the three dwell time distributions were examined using the log-rank test [16]. Numbers at risk were reported below the Kaplan–Meier curves. Statistical significance was set at p < 0.05.
Restricted mean survival time (RMST) was calculated as an effect size measure [17]. The primary restriction time was set at 120 min. Within the context of this study, a two-hour period provides a readily interpretable time horizon. All three seating areas also had observations at risk at this time point. Pairwise RMST differences with 95% confidence intervals were calculated among the three seating areas. Sensitivity analyses were also conducted at 90, 150, and 180 min to examine the stability of the results across different restriction times.
Previous studies have used occupancy rates to assess the use of seating areas in academic libraries [18]. In this study, the observed seat occupancy rate for each seating area was calculated from the occupied seat minutes recorded during the observation period to indicate the proportion of available seat time that was occupied. All occupied seat minutes recorded from 9:00 to 17:10 were included, regardless of whether the corresponding seating episode was complete or censored. The observed seat occupancy rate was calculated as follows:
where 490 min represents the total observation duration from 9:00 to 17:10.
3.4. Visibility Zone Analysis
To examine visibility in the target space, this study analyzed direct visibility from the spatial interfaces toward the interior of the LC. Spatial interfaces included entrances and openings. The analysis focused on visibility during approach and entry under static viewing conditions.
Eight spatial interfaces were identified. For each spatial interface, the viewpoint was set at its midpoint. The viewing direction was set toward the interior of the LC. A reference eye height of approximately 1.5 m was adopted [19]. A horizontal viewing field of 180° was used as the baseline condition [20]. It extended 90° to the left and right of the viewing direction.
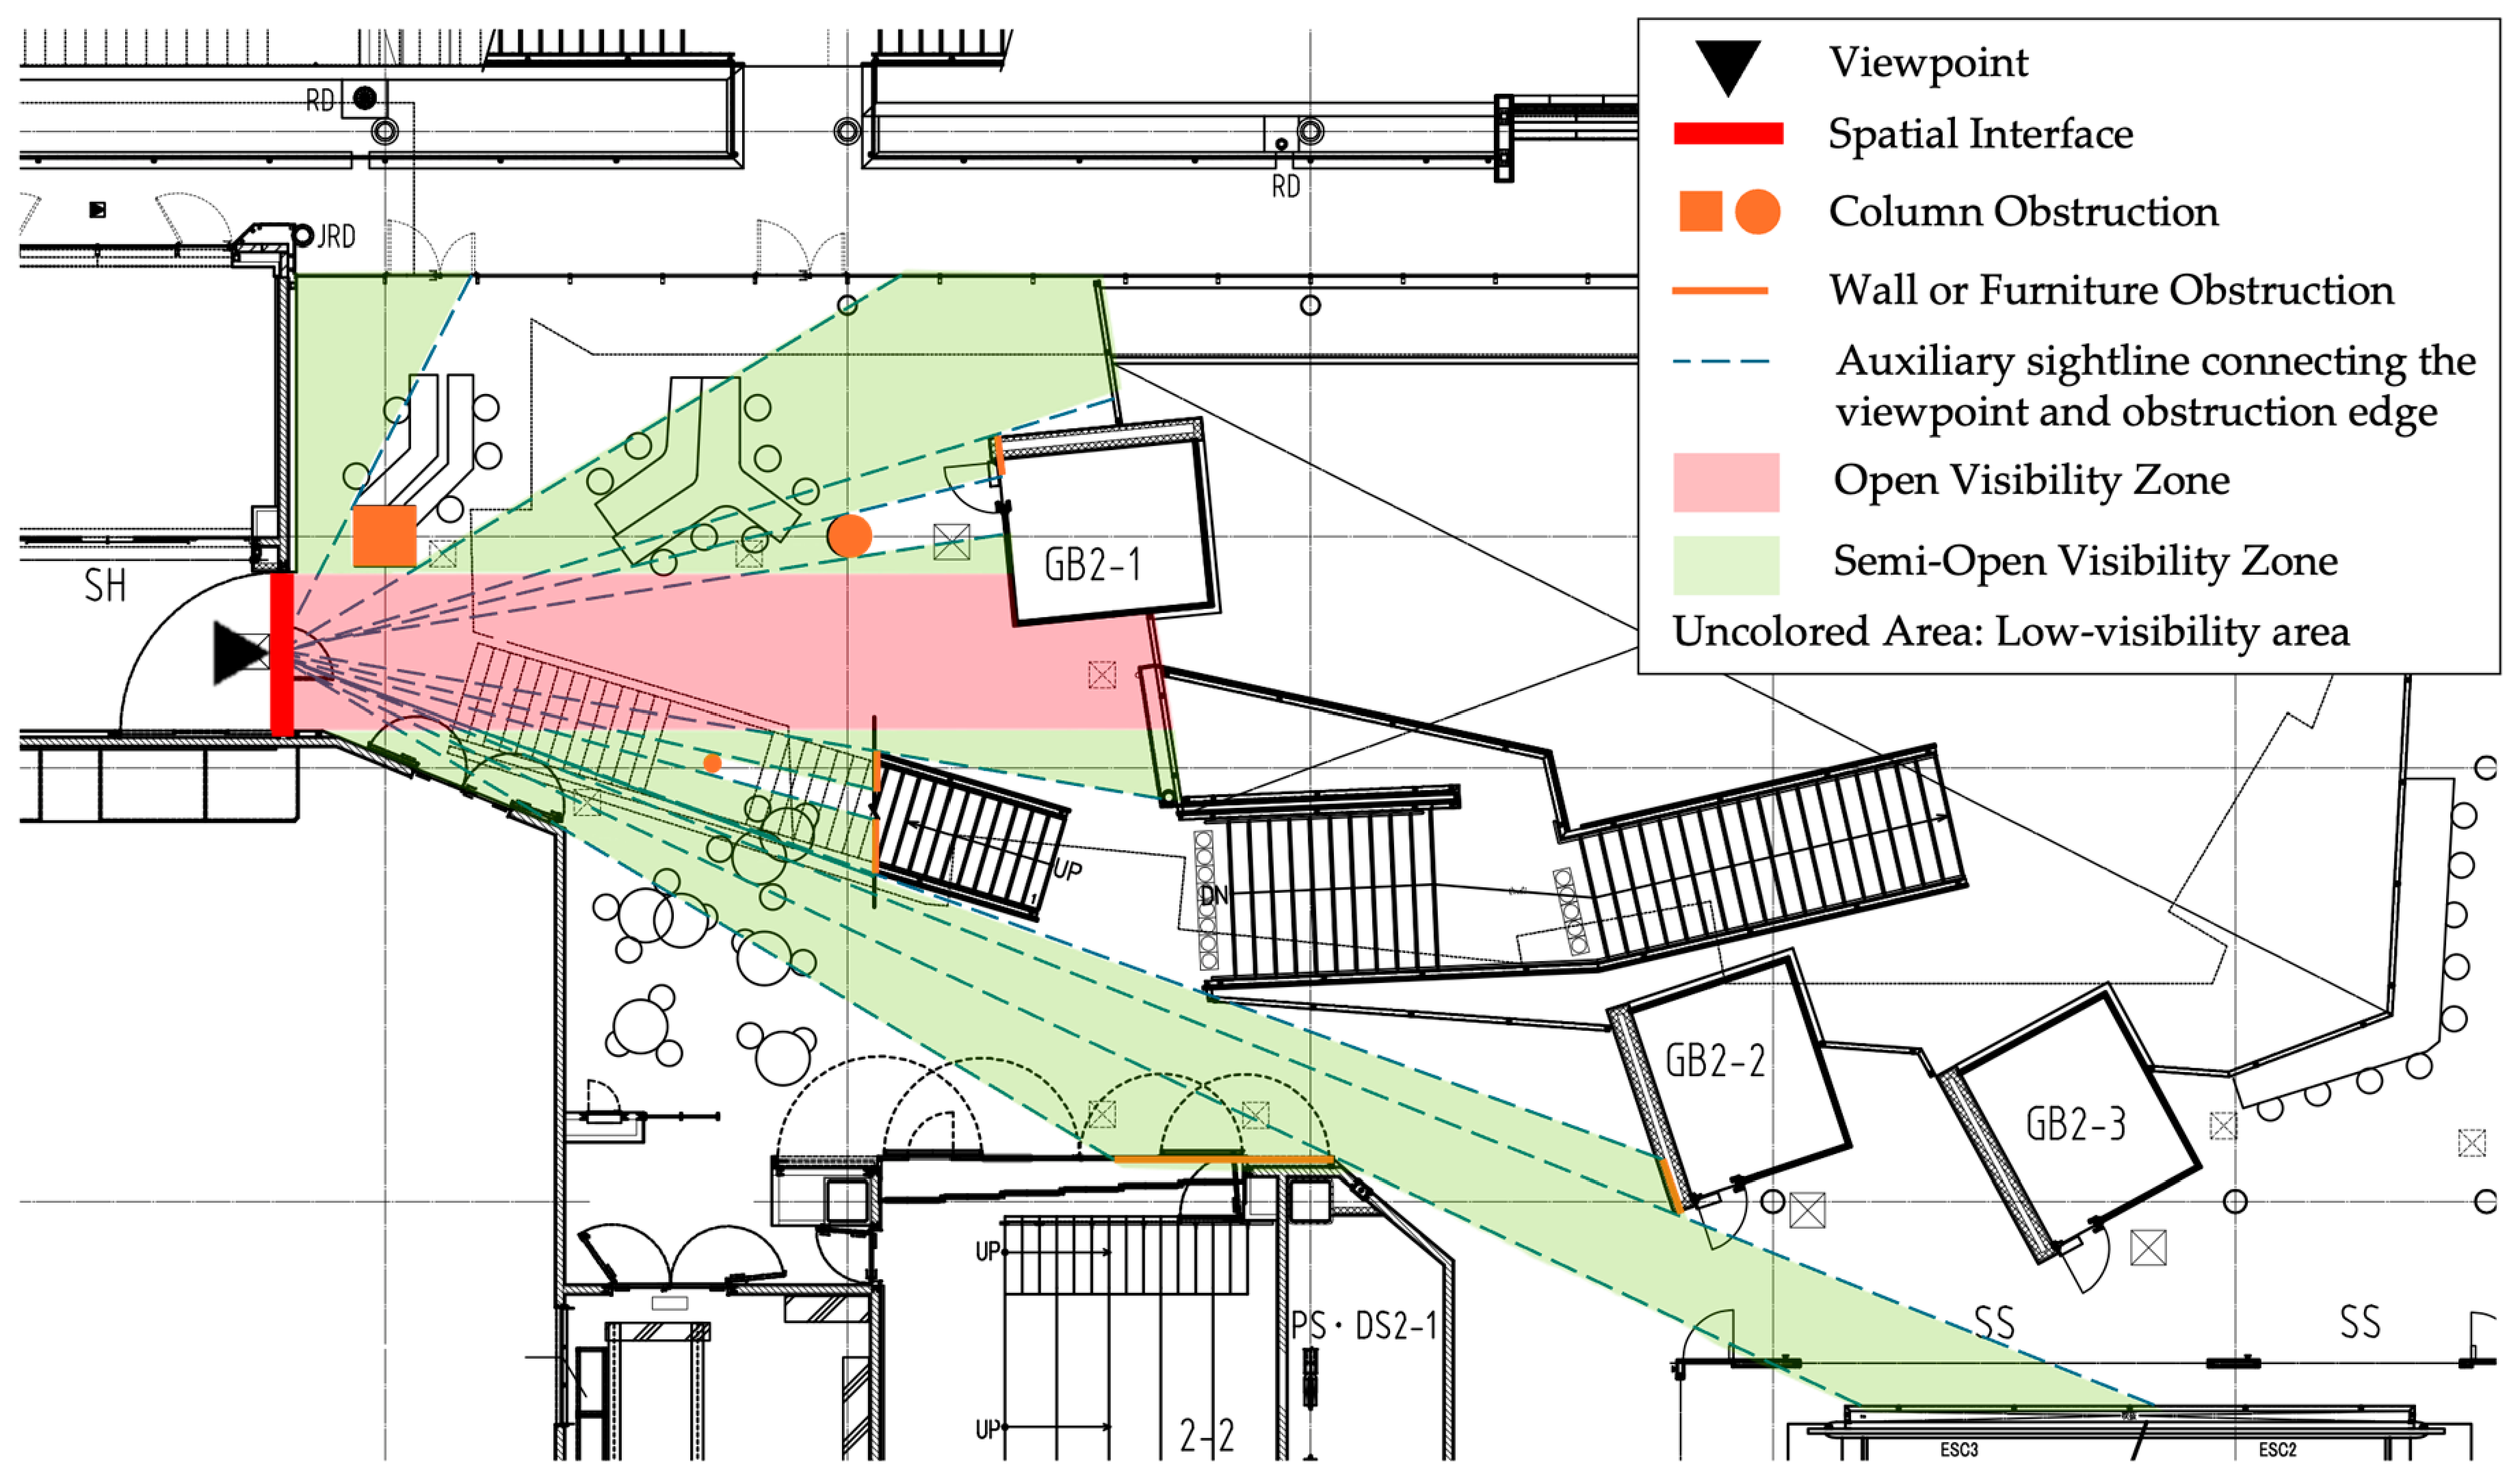
All visibility lines were drawn on the architectural floor plan. Walls, columns, and fixed elements above the reference eye height were treated as visual obstructions when they blocked the line of sight. For each spatial interface, the Open Visibility Zone was drawn first. Two lines perpendicular to the spatial interface were extended inward from its two endpoints. The area between these lines formed the directly visible band toward the LC interior. Unobstructed parts extended to the farthest visible wall surface. Where a column or another fixed obstruction blocked part of the view, that part ended at the obstruction. Auxiliary lines were also drawn from the viewpoint to the edges of visual obstructions. These lines were used to identify the remaining visible area within the horizontal viewing field. Figure 4 illustrates the drawing procedure using spatial interface ③ as an example.
Figure 4.
Process of generating visibility zones using spatial interface ③ as an example. Source: Adapted from a floor plan provided by Meiji University, reproduced with permission.
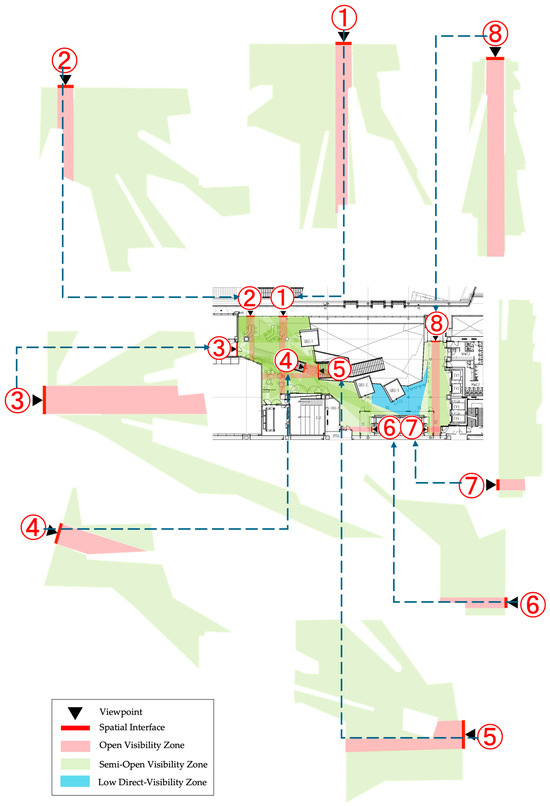
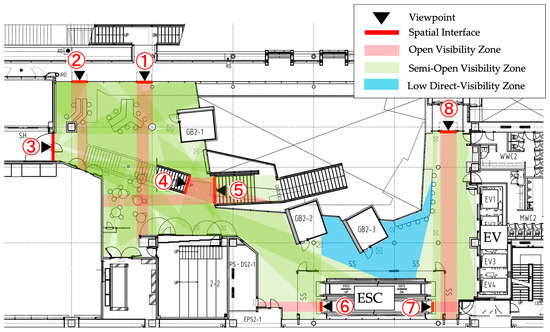
The Open Visibility Zones and Semi-Open Visibility Zones generated from all eight spatial interfaces were then overlaid. Areas that remained uncovered were classified as Low Direct-Visibility Zones. Figure 5 shows the resulting visibility zones.
Figure 5.
Visibility zones generated separately from the eight spatial interfaces.
Based on this procedure, three visibility zones were defined:
Open Visibility Zone: the directly visible band extending inward from a spatial interface. Its lateral boundaries were defined by perpendicular lines from the two endpoints of the spatial interface. Its depth was limited by the farthest visible wall surface or by fixed visual obstructions.
Semi-Open Visibility Zone: the remaining unobstructed area within the adopted horizontal viewing field outside the Open Visibility Zone.
Low Direct-Visibility Zone: the area remaining outside the Open Visibility Zones and Semi-Open Visibility Zones after the results from all eight spatial interfaces were overlaid.
Each seat was assigned to one of the three visibility zones on the composite visibility map. When a seat crossed more than one zone, it was assigned to the zone covering more than 50% of its plan-area footprint. The number of spatial interfaces from which each seat was directly visible was also counted. The results were summarized for each seating area.
Previous research has shown that visual field characteristics can vary with viewing and background conditions [21]. A sensitivity analysis was conducted to examine the robustness of the visibility results. The baseline condition used the midpoint of each spatial interface and a 180° horizontal viewing field. Alternative viewpoint positions were set at the 25% and 75% positions along each spatial interface. The 180° viewing field was retained for these conditions. For viewing-angle sensitivity, the midpoint viewpoint was retained, and the horizontal viewing field was changed to 150° and 120°. The 120° condition was selected with reference to previous research reporting an approximately 120° horizontal binocular visual field [22]. A horizontal viewing field of approximately 150° has also been used in previous visual-space research [23]. The same geometric drawing and classification procedure was applied under all conditions. All 37 seats were reclassified and compared with the baseline results.
The present method is a categorical visibility analysis based on spatial interfaces. It describes direct visibility toward the LC from specific approach and entry points. Visibility Graph Analysis (VGA), by comparison, represents mutual visibility relationships among locations within a spatial configuration [24]. In this study, the visibility measures refer to geometric direct visibility from predefined spatial interfaces.
3.5. Movement Trajectory Extraction and Visualization
Movement trajectories were manually extracted from the video recordings of the five cameras. The camera views partially overlapped. Users moving between adjacent camera views were followed based on continuity in position, movement direction, and timing. Each continuous movement through the observed area was recorded as one movement trajectory and traced onto the floor plan. Automated tracking and sensor-based positioning were not used. Each movement trajectory represented one passage event. If a person passed through the observed area again later, the later passage was recorded as a separate trajectory. This definition was consistent with the passage events reported in Section 4.1.1.
The trajectory diagram provided a descriptive view of movement across the floor plan. It was used to examine the spatial relationships among observed movement paths, seating areas, and visibility zones. Repeated overlap of manually traced trajectories was shown in the diagram. Movement concentration was not treated as a quantitative measure. No numerical route-density threshold was applied. Quantitative passage counts for the main vertical circulation points were reported separately in Section 4.1.1. No assessment of tracing accuracy was conducted. Independent retracing was not performed.
4. Results
4.1. User Count Results
4.1.1. Passage Events
Passage events at the entrances, exits, and vertical circulation elements were obtained from the video recordings of the five cameras installed on the second floor of LS. A passage event was defined as one observed passage through a target circulation point. When the same person passed through more than once, each passage was recorded separately. Passage events were counted separately from seating episodes.
A total of 1903 passage events were recorded from 9:00 to 17:10 on 27 June 2023. Because the time periods in Table 2 have different durations, the counts were also converted to passages per hour. The standardized passage rates differed across the observation period. Higher rates were recorded during the class breaks from 10:40 to 10:50, 15:10 to 15:20, and 17:00 to 17:10 than during the class periods.
Table 2.
Passage events by observation period on the second floor.
The second floor of LS includes classrooms and vertical circulation elements. The passage data therefore reflect movements related to classroom access as well as movement through the floor. These results show that circulation was an important part of the use of the second floor.
4.1.2. Seating Episodes
For the LC seating areas, one continuous period of seat use observed in the video footage was counted as one seating episode. A total of 36 seating episodes were recorded in the Large-Group Table Seats area, 40 in the Table Seats area, and 33 in the Counter Seats area. In total, 109 seating episodes were recorded across the three seating areas.
These seating episodes were counted separately from the 1903 passage events presented in Section 4.1.1. The passage data and seating episode data describe two forms of use observed on the second floor: circulation through the floor and seated use within the LC areas. The 109 seating episodes were used in the following analyses of seating areas, visibility zones, user activities, and dwell time.
4.2. Results of User Activity Analysis
Among the 109 seating episodes, computer use was recorded in 45 episodes, smartphone use in 34 episodes, and conversation in 21 episodes. Book or notebook use was recorded in 4 episodes, eating in 2 episodes and waiting in 3 episodes. No seating episodes were classified as resting.
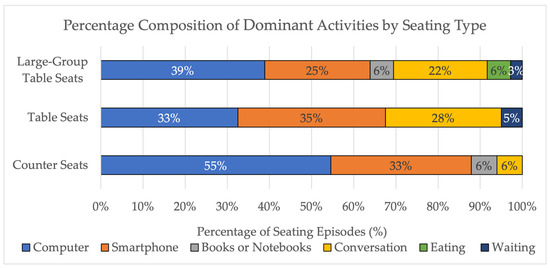
As shown in Table 3 and Figure 6, the three seating areas showed descriptive differences in activity composition. In the Counter Seats area, computer use accounted for 54.5% of the seating episodes, smartphone use for 33.3%, and conversation for 6.1%. In the Table Seats area, smartphone use accounted for 35.0%, computer use for 32.5%, and conversation for 27.5%. In the Large-Group Table Seats area, computer use accounted for 38.9%, smartphone use for 25.0%, and conversation for 22.2%. Eating was observed only in the Large-Group Table Seats area, accounting for 5.6%.
Table 3.
Number of seating episodes by seating area and dominant activity.
Figure 6.
Percentage composition of dominant activities by seating area.
Computer and smartphone use were common in all three seating areas. Conversation accounted for a higher proportion of seating episodes in the Large-Group Table Seats and Table Seats areas than in the Counter Seats area.
4.3. Results of Dwell Time Analysis
A total of 109 seating episodes were recorded during the observation period. Of these, 85 episodes had both observed start and end times. Another 22 episodes continued beyond the end of observation at 17:10 and were treated as right-censored observations. Two episodes had already begun before the start of observation at 9:00, so their starting times were unknown. The primary dwell time analysis therefore used the Kaplan–Meier method and included 107 episodes with known starting times.
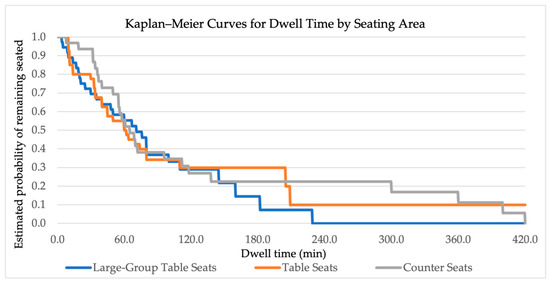
Figure 7 shows the Kaplan–Meier curves for the three seating areas, and Table 4 presents the corresponding numbers at risk. The numbers at risk are shown below the curves. The estimated median dwell time was 71 min for the Large-Group Table Seats area (95% CI: 35–100), 61 min for the Table Seats area (95% CI: 40–80), and 65 min for the Counter Seats area (95% CI: 50–112). The log-rank test showed no statistically significant difference in the dwell time distributions among the three seating areas (χ2 (2) = 0.844, p = 0.656).
Figure 7.
Kaplan–Meier curves of dwell time by seating area.
Table 4.
Numbers at risk.
Restricted mean survival time (RMST) was also calculated using a primary restriction time of 120 min. The RMST was 68.48 min for the Large-Group Table Seats area, 66.85 min for the Table Seats area, and 73.87 min for the Counter Seats area. The difference between the Large-Group Table Seats and Table Seats was 1.63 min (95% CI: −17.62 to 20.88). The difference between the Counter Seats and Large-Group Table Seats was 5.39 min (95% CI: −14.01 to 24.79). The difference between the Counter Seats and Table Seats was 7.02 min (95% CI: −11.63 to 25.67). All three confidence intervals included zero. Sensitivity analyses were also conducted using restriction times of 90, 150, and 180 min. All pairwise 95% confidence intervals again included zero.
Table 5 presents the recorded durations of all 109 seating episodes by seat. In Table 5, # indicates episodes that had already begun before the start of observation at 9:00. An asterisk * indicates episodes that continued beyond the end of observation at 17:10. These episodes were retained in Table 5 to show all recorded seating episodes. Episodes without complete dwell time were not included in the secondary descriptive statistics in Table 6.
Table 5.
Recorded seating episode durations (min) by seating area and seat.
Table 6.
Descriptive statistics of dwell time and observed seat occupancy rate by seating area.
For secondary descriptive analysis, the 85 complete seating episodes were summarized in Table 6. The mean dwell time was 107.42 min in the Counter Seats area, 63.82 min in the Large-Group Table Seats area, and 63.32 min in the Table Seats area. The median dwell times were 59.50 min, 49.00 min, and 45.00 min, respectively. The complete dwell times in the Counter Seats area also showed greater variation than those in the other two areas. The observed seat occupancy rate was 74.15% in the Counter Seats area, 43.13% in the Table Seats area, and 39.62% in the Large-Group Table Seats area.
The secondary descriptive statistics showed numerical differences in complete dwell time and observed seat occupancy rate among the three seating areas. However, the primary Kaplan–Meier analysis did not show a statistically significant difference in the overall dwell time distributions. The RMST comparisons also showed no clear evidence of differences among the three seating areas.
For these censored episodes, the values shown represent only the duration observed within the survey period and do not represent the complete dwell time.
4.4. Results of Dwell Time Distribution by User Activity
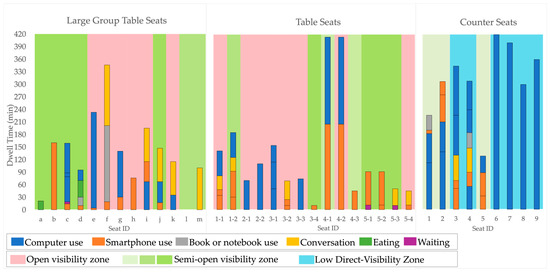
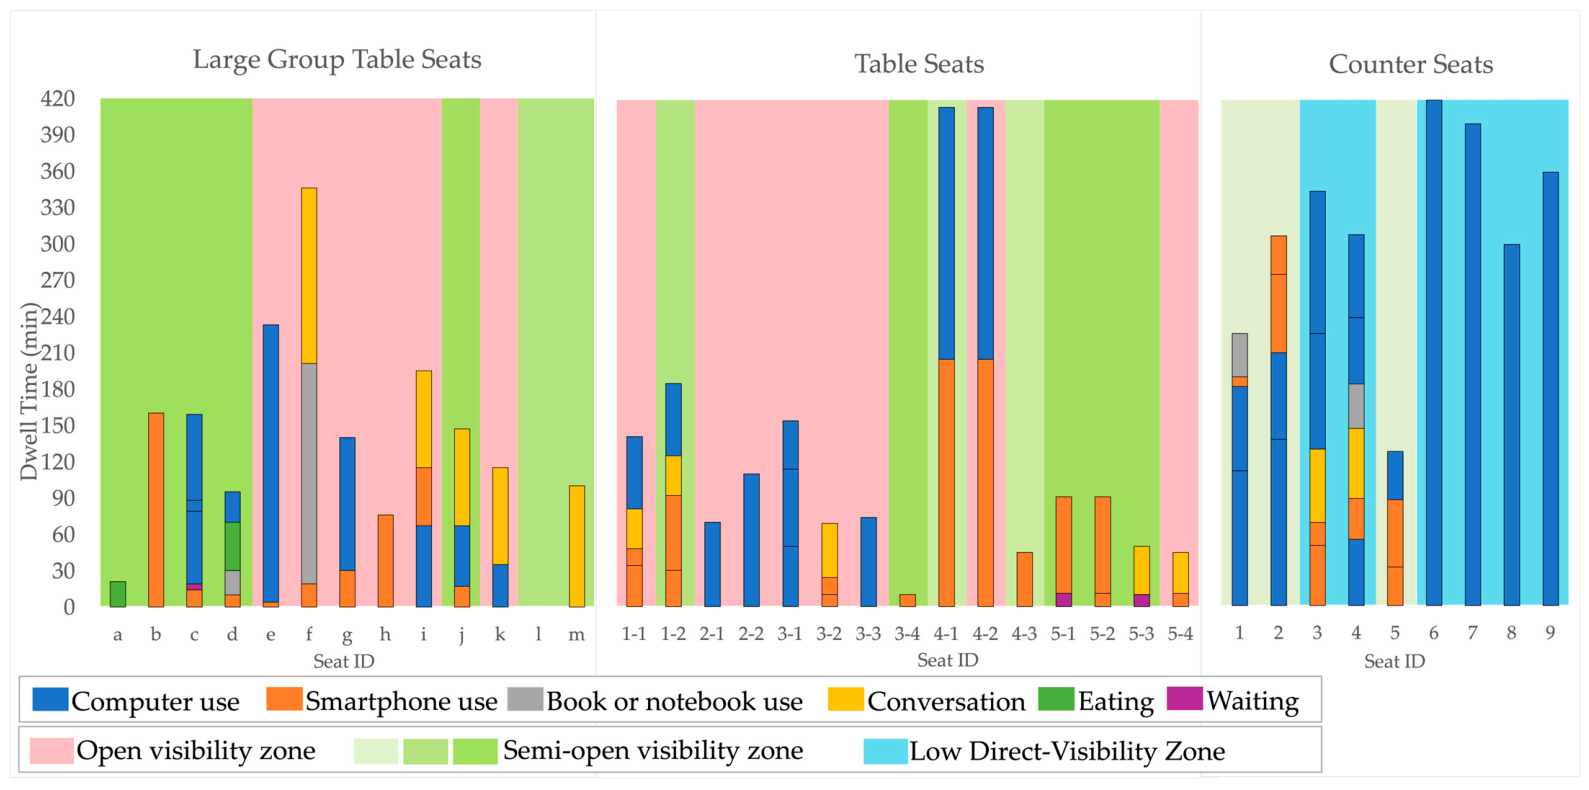
This section examines dwell time in relation to user activity. The analysis included the 85 seating episodes for which both the start and end times were observed. Figure 8 shows the dwell time and dominant activity of these complete seating episodes by seat.
Figure 8.
Dwell time and activity of complete seating episodes by seat, with the visibility zone assigned to each seat.
Computer use and smartphone use were observed across a wide range of dwell times. Several relatively long seating episodes were also recorded for these activities. In the Table Seats area, individual seating episodes exceeding 200 min were observed. In the Counter Seats area, several computer-use episodes lasted from 300 to 420 min.
Conversation was observed mainly in the Large-Group Table Seats area and the Table Seats area, with dwell times varying across episodes. In contrast, several long-duration computer-use episodes were observed in the Counter Seats area. Eating was recorded in two complete seating episodes, and waiting was recorded in three.
The observed dwell times varied across activity categories. Computer use and smartphone use included both short and long seating episodes, while fewer long-duration episodes were observed for conversation and eating. The background colors in Figure 8 indicate the visibility zone assigned to each seat. These spatial conditions are discussed later together with the other characteristics of the seating areas.
4.5. Visibility Characteristics, Activities, and Dwell Time
Table 7 summarizes the visibility characteristics of the three seating areas, and Figure 9 shows the spatial distribution of the visibility zones. The Large-Group Table Seats and Table Seats were located entirely within Open Visibility Zones and Semi-Open Visibility Zones. In the Counter Seats, 6 of the 9 seats (66.7%) were classified as Low Direct-Visibility Zone. The mean number of spatial interfaces from which a seat was directly visible was 3.31 for the Large-Group Table Seats, 3.13 for the Table Seats, and 0.44 for the Counter Seats. The Counter Seats had the lowest mean value. Figure 8 shows the dwell time and dominant activity of the complete seating episodes by seat, together with the visibility zone assigned to each seat. As shown in Section 4.2, Section 4.3 and Section 4.4, conversation was more frequently observed in the Large-Group Table Seats and Table Seats, while computer use and smartphone use accounted for most seating episodes in the Counter Seats. In the secondary descriptive analysis, the Counter Seats had the highest mean dwell time among the three seating areas. These activity and dwell time patterns were observed in seating areas that also differed in visibility conditions.
Table 7.
Visibility zone distribution and direct visibility from spatial interfaces by seating area.
Figure 9.
Visibility zone diagram. Source: Adapted from a floor plan provided by Meiji University, reproduced with permission.
Under the 25% and 75% viewpoint conditions, 94.6% and 89.2% of seats retained the same visibility zone classification as the baseline. Under the 120° and 150° viewing-angle conditions, the corresponding values were 97.3% and 94.6%.
4.6. Movement Trajectories and Circulation
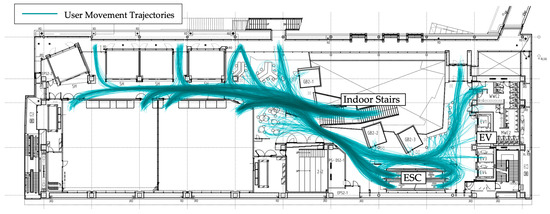
Figure 10 shows the movement trajectories recorded during the observation period. Movement trajectories were observed around the indoor stairs, EV, ESC, and the paths connecting these vertical circulation elements with classrooms and entrances. Repeated overlap of movement trajectories was observed around the indoor stairs and ESC.
Figure 10.
Daily movement trajectory diagram. Source: Adapted from a floor plan provided by Meiji University, reproduced with permission.
The Large-Group Table Seats and Table Seats were located close to areas with repeated overlap of movement trajectories, while the Counter Seats had a different spatial relationship to these areas. Quantitative passage counts for the main vertical circulation points are reported separately in Section 4.1.1 and Table 2.
The movement trajectory diagram was used as a descriptive visualization of observed movement paths on the second floor. Formal route-density and seat-to-route distance analyses were not conducted.
5. Discussion
The three seating areas showed different activity patterns and spatial conditions. The Large-Group Table Seats and Table Seats were characterized by shared-table seating, higher direct visibility from spatial interfaces, and locations near areas with repeated overlap of movement trajectories. The Counter Seats had lower direct visibility from spatial interfaces and a different spatial relationship to these areas.
Seating configuration provides one basis for interpreting the observed activity differences. Kusukawa et al. reported that users of academic libraries with Learning Commons selected different learning spaces according to their activities and the surrounding atmosphere, and that individual learning and group activities were distributed differently within the same academic library [25]. İmamoğlu and Gürel also showed that seating arrangements and boundaries between seats were related to users’ seating preferences in an academic library [26]. In the present study, conversation was more common in the Large-Group Table Seats and Table Seats, where users shared tables, while computer use and smartphone use were more common in the Counter Seats. These findings suggest that the different seating configurations of the three areas should be considered when interpreting their activity patterns.
The secondary descriptive statistics showed numerical differences in dwell time among the three seating areas. Among the complete seating episodes, the Counter Seats had the highest mean dwell time. However, the primary Kaplan–Meier analysis and RMST comparisons did not show clear evidence of differences among the three seating areas. The Counter Seats also had lower direct visibility from spatial interfaces. Computer use and smartphone use accounted for most seating episodes in this area. The Counter Seats also had a different spatial relationship to areas with repeated overlap of movement trajectories. These characteristics appeared together within the same seating area. The present analysis cannot determine the independent relationship between each spatial condition and dwell time.
Visibility analysis provides information that cannot be obtained from seating configuration alone. All seats in the Large-Group Table Seats and Table Seats were classified as either Open Visibility Zone or Semi-Open Visibility Zone, whereas six of the nine Counter Seats were classified as Low Direct-Visibility Zone. The mean number of spatial interfaces from which a seat was directly visible was 3.31 for the Large-Group Table Seats, 3.13 for the Table Seats, and 0.44 for the Counter Seats. These results show that the seating areas differed in the degree to which the seats could be directly seen from the surrounding spatial interfaces. Here, visibility refers specifically to direct geometric visibility from spatial interfaces, while privacy and perceived exposure involve users’ subjective experience. Most seats retained the same visibility zone classification under the alternative viewpoint and viewing angle conditions. In the present case, lower direct visibility from spatial interfaces and a high proportion of computer use and smartphone use were observed in the same seating area.
Movement trajectories provide a descriptive view of the spatial position of the three seating areas on the second floor. Repeated overlap of movement trajectories was observed around the indoor stairs, elevator, and escalator. Overlap was also observed along the paths connecting these vertical circulation elements with the surrounding spaces. The Large-Group Table Seats and Table Seats were located near these areas, whereas the Counter Seats had a different spatial relationship to them. Both staying and passing through were observed on the second floor. Users stayed in the LC for activities including computer use, smartphone use, and conversation. Passing through was also observed between classrooms and the vertical circulation elements. Wu et al. showed that circulation spaces in educational environments can also support social and informal learning activities [12].
Overall, the three seating areas differed in seating configuration, direct visibility from spatial interfaces, and their relationship to the observed movement trajectories. The Large-Group Table Seats and Table Seats had shared-table seating and higher direct visibility from spatial interfaces. They were also located near areas with repeated overlap of movement trajectories. The Counter Seats had a different seating configuration and lower direct visibility from spatial interfaces. They also had a different spatial relationship to these areas. These spatial differences were observed together with different activity patterns. The secondary descriptive statistics also showed numerical differences in dwell time. These three spatial conditions did not vary independently across the seating areas. Because these conditions varied together within the case study, the present analysis does not establish their independent effects or causal relationships. The results describe how the three seating areas were used during the single observed weekday.
From a spatial planning perspective, the present case illustrates the value of considering seating configuration, direct visibility from spatial interfaces, and observed movement trajectories together when describing seating use. This may be particularly relevant in an LC where staying and passing through occur on the same floor. However, the broader planning relevance of these observations should be examined across additional LC settings and observation periods. DeFrain and Hong evaluated how the actual use of a Learning Commons corresponded with its intended purpose using surveys, behavior mapping, and focus group data [27]. In the present study, these spatial conditions were examined alongside activity and dwell time during a single observed weekday. The limitations of the present study and directions for further research are discussed in the following section.
6. Limitations and Future Research
This study has several limitations. First, the investigation was conducted in a single LC at Meiji University and was based on continuous observation on one weekday. Movement, seating use, activity, occupancy, and dwell time may vary with the day of the week, course schedule, weather, examination periods, campus events, and other date-specific conditions. The findings should therefore be understood within the scope of this one-day case study. Future research should extend the observation period and include additional LC spaces with different layouts and seating configurations. Future observations across multiple days and academic periods could assess whether the observed spatial and use patterns remain consistent under different conditions.
Second, activity classification was conducted by one researcher. The same researcher later re-coded all 109 seating episodes to assess intra-rater agreement, with an agreement rate of 94.5% and a Cohen’s κ of 0.920. No second researcher independently coded the episodes, and inter-rater agreement was therefore not assessed. Access to the original video recordings was restricted to the researcher to protect participant privacy and for data management, so the recordings could not be shared with another coder. Each seating episode was assigned a dominant activity, defined as the activity that occupied the largest proportion of its observed dwell time. This approach does not capture changes or transitions among activities within an episode. Individuals were not identified across separate seating episodes. Therefore, it was not possible to determine whether the same user contributed more than one episode, and independence among all seating episodes cannot be assumed. Observations from members of the same group may also have been correlated. The complete-case descriptive statistics excluded censored observations and were therefore treated as secondary. The higher mean dwell time of the Counter Seats was influenced by several long episodes and should be interpreted with caution. The primary Kaplan–Meier and RMST analyses did not show clear evidence of differences among the three seating areas. Future studies should use multiple trained coders and assess inter-rater reliability. They should also consider methods that allow repeated users and group membership to be identified or accounted for.
The movement trajectory analysis also has methodological limitations. Movement trajectories were manually traced from the video recordings, and no formal assessment of tracing accuracy was conducted. Independent retracing was also not performed. Route density and the distance between individual seats and observed movement paths were not quantified. The trajectory diagram was therefore used only as a descriptive representation of observed movement paths. Future studies could use automated or sensor-based tracking methods to obtain more consistent trajectory data. These methods could support quantitative analyses of route density and seat-to-route distance.
Another limitation is that several spatial conditions varied together across the three seating areas. These conditions included seating configuration, seating capacity, orientation, openness, and direct visibility from spatial interfaces. Proximity to classrooms and circulation routes also differed among the seating areas. Access to power outlets and the suitability of each area for individual or group use were not systematically evaluated. The present study cannot determine the independent relationship of each spatial condition with activity or dwell time. It also cannot establish causal relationships. Future research should include more cases with comparable seating areas. More closely matched areas could be compared. This may help distinguish the relationships between these spatial conditions and observed use.
The visibility analysis also has limitations. It focused on direct geometric visibility from spatial interfaces. It did not account for viewing distance, seated eye position, or seat orientation. Furniture configuration and temporary obstruction by other users were also not included. Differences in passage volume among spatial interfaces were not considered. Direct visibility from spatial interfaces does not represent visual privacy or perceived exposure. The three visibility zones were operational geometric categories defined for this study rather than validated perceptual thresholds. The sensitivity analysis examined their classification stability under alternative viewpoint and viewing angle conditions, not their perceptual validity. Future research could combine the present analysis based on spatial interfaces with VGA or other isovist methods. This could provide a more detailed analysis of the visual field from each seat and mutual visibility within the LC. The geometry of the visibility zones could also be quantified through measures such as area, perimeter, shape ratio, and overlap. The spatial characteristics and quality of adjacent spaces were also not systematically evaluated. These factors could be included in future analyses across multiple cases.
Other spatial, environmental, and user-related factors were not measured. These included lighting, noise, materials, enclosure, cultural background, and individual personality. Future research could examine these factors across different campuses and cultural contexts.
7. Conclusions
This study examined the actual use of the Learning Commons on the second floor of Learning Square at Meiji University through continuous video observation on one weekday. Movement trajectories, user activities, and dwell time were recorded under natural use. Visibility zones were generated from the spatial interfaces and examined together with seating configuration and observed movement trajectories. The second floor supported both seated use within the LC and passing through between classrooms and vertical circulation elements.
The three seating areas showed different spatial and use characteristics. The Large-Group Table Seats and Table Seats had higher direct visibility from spatial interfaces and were located near areas with repeated overlap of movement trajectories. Conversation was more common in these two areas. The Counter Seats had lower direct visibility from spatial interfaces and a different spatial relationship to the observed movement trajectories. Computer use and smartphone use accounted for most seating episodes in this area. Among the complete seating episodes, the Counter Seats had the highest mean dwell time. They also had the highest observed seat occupancy rate. However, the primary Kaplan–Meier analysis and RMST comparisons did not show clear evidence of differences among the three seating areas. The three seating areas therefore differed in seating configuration, direct visibility from spatial interfaces, activity patterns, and their relationship to observed movement trajectories. Numerical differences in dwell time were observed in the secondary descriptive statistics.
From a spatial planning perspective, the present case shows that several spatial conditions varied together across the seating areas. These included seating configuration, direct visibility from spatial interfaces, and the relationship to observed movement trajectories. Considering these spatial conditions together may help to understand how LC seating areas are used in their specific spatial context. As an exploratory case study, these findings provide a basis for future comparisons across different LC settings and observation periods.
Author Contributions
Conceptualization, Y.F.; methodology, Y.F.; formal analysis, Y.F.; investigation, Y.F.; data curation, Y.F.; writing—original draft preparation, Y.F.; writing—review and editing, K.I.; visualization, Y.F.; supervision, K.I. All authors have read and agreed to the published version of the manuscript.
Funding
This research received no external funding.
Institutional Review Board Statement
No prospective ethics approval or exemption document was issued before the survey. Meiji University subsequently provided written confirmation that, under the university regulations applicable on 27 June 2023, this survey did not require research ethics review. This confirmation was issued retrospectively and does not constitute retroactive ethical approval. The study involved non-interventional fixed-point video observation in an operational campus learning space. No names, student ID numbers, ages, genders, affiliations, or audio data were collected. The video data were used only to extract movement trajectories, activities, and dwell time. No identifiable images or video footage are disclosed in this paper or in any public materials. The raw video data are stored on an encrypted external SSD accessible only to the researcher. Potential indirect identifiers, including clothing, companions, timing, and movement trajectories, are not publicly disclosed. The raw video data will be retained and deleted in accordance with the applicable data management requirements of Meiji University.
Informed Consent Statement
Individual written informed consent was not obtained. During the survey, notices were displayed in Learning Square informing users that video observation was being conducted in the common space and that individuals could not be identified from the recorded footage. The video data were used only for the purposes of this study, and no identifiable images or video footage are published in this paper or in other public materials.
Data Availability Statement
The analyzed data presented in this study are available from the corresponding author upon reasonable request. The original video footage is not publicly available due to privacy and ethical restrictions.
Acknowledgments
The authors would like to thank the Facilities Management Department of Meiji University and Matsuda Hirata Sekkei for their cooperation in the survey. The authors are also grateful to Yoshitaka Kajita of Tokai University for his valuable comments, to Wenqi Cheng for assistance with the survey and research process, and to Yuya Tomaru for his advice. During the preparation of this manuscript, the authors used ChatGPT (GPT-5, OpenAI) only for English language polishing and grammar checking. The authors have reviewed and edited the output and take full responsibility for the content of this publication.
Conflicts of Interest
The authors declare no conflict of interest.
Abbreviations
The following abbreviations are used in this manuscript:
| LC | Learning Commons |
| LS | Learning Square |
| EV | Elevator |
| ESC | Escalator |
| RMST | Restricted Mean Survival Time |
| VGA | Visibility Graph Analysis |
| CI | Confidence Interval |
| SD | Standard Deviation |
| Q1 | First Quartile |
| Q3 | Third Quartile |
| IQR | Interquartile Range |
References
- Yonezawa, M. Learning Commons that Facilitates the Users’ Learning. Curr. Aware. 2013, 317, 22–26. [Google Scholar]
- Yonezawa, M. From Information Commons to Learning Commons: Learning Support for the Net Generation in Academic Libraries. Curr. Aware. 2006, 289, 9–12. [Google Scholar]
- Han, J. The Condition and Subject of Learning Commons and Learning Support: Case Study of the Ochanomizu University Library. J. Coll. Univ. Libr. 2019, 113, 2046-1–2046-10. [Google Scholar] [CrossRef]
- May, F.; Swabey, A. Using and Experiencing the Academic Library: A Multisite Observational Study of Space and Place. Coll. Res. Libr. 2015, 76, 771–795. [Google Scholar] [CrossRef] [Scilit]
- Mitomo, N. Various Time-Spending Acts by Pedestrians in Flexible Squares: Diversity of Time-Spending Acts Observed in the Marunouchi-Nakadori Social Experiment. Des. Res. 2021, 82, 14–21. [Google Scholar] [CrossRef]
- Natsume, Y.; Morimoto, T.; Maeda, A. Placeness of Learning Commons from the Perspective of Learning Environment and Learning Style: A Case Study of Six Learning Commons at Four Universities. J. Nagoya Gakuin Univ. Soc. Sci. 2023, 60, 39–59. [Google Scholar] [CrossRef]
- Zhang, J.; Hu, X.; Zhao, J.; Liu, C.; Luther, M. Students’ perspectives on configuration design of universities’ informal learning spaces. In Engaging Architectural Science: Meeting the Challenges of Higher Density, Proceedings of the 52nd International Conference of the Architectural Science Association, Melbourne, Australia, 28 November–1 December 2018; Rajagopalan, P., Andamon, M.M., Eds.; Architectural Science Association and RMIT University: Melbourne, Australia, 2018; pp. 433–440. [Google Scholar]
- Psathiti, C.; Sailer, K. A prospect-refuge approach to seat preference: Environmental psychology and spatial layout. In Proceedings of the 11th International Space Syntax Symposium, Lisbon, Portugal, 3–7 July 2017; Instituto Superior Tecnico: Lisbon, Portugal, 2017; Paper 137; pp. 137.1–137.16. [Google Scholar]
- Watanabe, A.; Mori, K. Analysis of the coincidence of way-finding method and spatial information: A cognitive study on way-finding in architectural space No. 2. J. Archit. Plan. Environ. Eng. (Trans. AIJ) 1993, 454, 93–102. (In Japanese) [Google Scholar] [CrossRef] [Scilit]
- Watanabe, A.; Mori, K. Evaluation on “way-finding scene” in the informational space without maps and directional signs: A cognitive study on way-finding in architectural space, No. 3. J. Archit. Plan. (Trans. AIJ) 1995, 60, 121–130. (In Japanese) [Google Scholar] [CrossRef] [Scilit][Green Version]
- Natapov, A.; Kuliga, S.; Dalton, R.C.; Hölscher, C. Linking building-circulation typology and wayfinding: Design, spatial analysis, and anticipated wayfinding difficulty of circulation types. Archit. Sci. Rev. 2020, 63, 34–46. [Google Scholar] [CrossRef] [Scilit]
- Wu, X.; Kou, Z.; Oldfield, P.; Heath, T.; Borsi, K. Informal learning spaces in higher education: Student preferences and activities. Buildings 2021, 11, 252. [Google Scholar] [CrossRef] [Scilit]
- Wang, G.; Zhang, Y.; Wang, W. Evaluating the performance of informal learning spaces in higher education: An integrated methodological framework combining space syntax and post-occupancy evaluation. J. Asian Archit. Build. Eng. 2026, 1–20. [Google Scholar] [CrossRef] [Scilit]
- Meiji University. Introduction to Izumi Campus. (In Japanese). Available online: https://www.meiji.ac.jp/bungaku/tokusyoku/izumi.html (accessed on 9 July 2026).
- Nakayama, R.; Nakanishi, Y.; Nagahama, F.; Nakajima, M. Interpersonal motivation in a first year experience class influences freshmen’s university adjustment. Jpn. J. Psychol. 2015, 86, 170–176. (In Japanese) [Google Scholar] [CrossRef] [Scilit][Green Version]
- In, J.; Lee, D.K. Survival analysis: Part I—Analysis of time-to-event. Korean J. Anesthesiol. 2018, 71, 182–191. [Google Scholar] [CrossRef] [Scilit]
- Royston, P.; Parmar, M.K.B. Restricted Mean Survival Time: An Alternative to the Hazard Ratio for the Design and Analysis of Randomized Trials with a Time-to-Event Outcome. BMC Med. Res. Methodol. 2013, 13, 152. [Google Scholar] [CrossRef] [Scilit]
- Gou, Z.; Khoshbakht, M.; Mahdoudi, B. The impact of outdoor views on students’ seat preference in learning environments. Buildings 2018, 8, 96. [Google Scholar] [CrossRef] [Scilit]
- Zheng, H.; Wu, B.; Wei, H.; Yan, J.; Zhu, J. A quantitative method for evaluation of visual privacy in residential environments. Buildings 2021, 11, 272. [Google Scholar] [CrossRef] [Scilit]
- van Nes, A.; Yamu, C. Introduction to Space Syntax in Urban Studies; Springer International Publishing: Cham, Switzerland, 2021. [Google Scholar] [CrossRef] [Scilit]
- Jung, E.S.; Shin, Y.; Kee, D. Generation of Visual Fields for Ergonomic Design and Evaluation. Int. J. Ind. Ergon. 2000, 26, 445–456. [Google Scholar] [CrossRef] [Scilit]
- Cavaglià, M.; Speroni, A.; Blanco Cadena, J.D.; Mainini, A.G.; Poli, T. Exploring Built Environment Visual Interactions: A SoftBIM Data-Driven Approach for a Database About the Outdoor View. Buildings 2024, 14, 3340. [Google Scholar] [CrossRef] [Scilit]
- Burleigh, A.; Pepperell, R.; Ruta, N. Natural Perspective: Mapping Visual Space with Art and Science. Vision 2018, 2, 21. [Google Scholar] [CrossRef] [Scilit]
- Turner, A.; Doxa, M.; O’Sullivan, D.; Penn, A. From isovists to visibility graphs: A methodology for the analysis of architectural space. Environ. Plan. B Plan. Des. 2001, 28, 103–121. [Google Scholar] [CrossRef] [Scilit]
- Kusukawa, M.; Nakai, T.; Oyama, S. Hierarchical structure of the learning space according to user’s behaviors and the atmosphere around the chosen seat in academic libraries: A study on hierarchy of “the place” in the academic library with learning commons Part 1. J. Archit. Plan. (Trans. AIJ) 2017, 82, 341–351. (In Japanese) [Google Scholar] [CrossRef] [Scilit]
- İmamoğlu, Ç.; Gürel, M.Ö. “Good fences make good neighbors”: Territorial dividers increase user satisfaction and efficiency in library study spaces. J. Acad. Libr. 2016, 42, 65–73. [Google Scholar] [CrossRef] [Scilit]
- DeFrain, E.; Hong, M. Interiors, affect, and use: How does an academic library’s learning commons support students’ needs? Evid. Based Libr. Inf. Pract. 2020, 15, 42–68. [Google Scholar] [CrossRef] [Scilit]

Disclaimer/Publisher’s Note: The statements, opinions and data contained in all publications are solely those of the individual author(s) and contributor(s) and not of MDPI and/or the editor(s). MDPI and/or the editor(s) disclaim responsibility for any injury to people or property resulting from any ideas, methods, instructions or products referred to in the content. |
© 2026 by the authors. Licensee MDPI, Basel, Switzerland. This article is an open access article distributed under the terms and conditions of the Creative Commons Attribution (CC BY) license.