


Abstract
Environmental exposure to nanoplastics (NPLs) is an emerging concern for human health, yet their effects on lymphatic endothelium remain poorly understood. We investigated the effects induced by repeated exposure of the murine lymph node endothelial cells (SVEC4-10 cell line) to polystyrene NPLs (PS-NPLs) at 1.6, 16, and 160 μg/mL over 15 days. PS-NPLs have been characterized in terms of hydrodynamic diameter and polydispersity by dynamic light scattering. Cell viability remained unchanged, while repeated exposure induced a pronounced oxidative stress response, characterized by increased reactive oxygen species (ROS), protein and lipid oxidation, and depletion of reduced glutathione. Nitric oxide levels increased modestly (22.8–30.6%) at the highest concentration. Inflammatory responses were temporally regulated, with early increases in TNFα and IL-1β levels, followed by partial normalization, whereas IL-6 expression showed delayed elevation. Hsp27, Hsp60, Hsp70, and Hsp90 expressions displayed changes consistent with activation of cellular stress-response pathways. Overall, repeated PS-NPL exposure induced a dynamic oxidative stress response and temporally regulated inflammatory alterations, without a significant decrease in cell viability. The temporal modulation of these responses may reflect compensatory cellular processes during prolonged exposure, although the specific mechanisms underlying this response remain to be established.
1. Introduction
Plastic pollution has become a ubiquitous environmental and public health challenge, raising increasing concerns regarding its toxicological effects on living organisms. Plastic debris are progressively fragmenting into macroplastics (larger than 25 mm), mesoplastics (between 5 and 25 mm in diameter), microplastics (0.001–5 mm) and nanoplastics (1–1000 nm) [1], which are detectable in air, aquatic and terrestrial environments [2], food [3] and even human biological samples [4,5,6]. Reliable detection of nano-/microplastics (NPLs/MPs) in biological samples remains technically challenging because no single analytical method provides optimal sensitivity, polymer identification, and particle-size coverage. Consequently, complementary analytical approaches are often required to accurately characterize plastic particles in biological samples [7].
Among the most prevalent polymers detected in the environment are polyethylene, polystyrene (PS), polypropylene (PP), polyethylene terephthalate, polyvinyl chloride, polyvinyl alcohol, and polyamide, reflecting their widespread use in packaging, textiles, and consumer goods [8]. Among these polymers, PS is one of the most studied in the laboratory because of its well-defined physicochemical properties and commercial availability [9].
The main pathways of human exposure to plastic particles are inhalation, ingestion, and dermal contact [10]. After entering the organism, NPLs are predominantly internalized into cells through endocytic pathways, including phagocytosis, macropinocytosis, and clathrin- or caveolae-mediated endocytosis [11], although non-endocytic, passive uptake mechanisms were observed in alveolar epithelial cells [12].
Due to their smaller sizes and high surface area, NPLs have distinct physicochemical properties in comparison with larger particles, such as increased reactivity and ability to cross biological barriers, including the blood–brain barrier [6], placental barrier [13], and reproductive [14] ones. Once translocated across epithelial barriers, these particles may enter the interstitial fluid and be collected by lymphatic capillaries, facilitating their systemic distribution. Initial lymphatic vessels are characterized by discontinuous basement membranes and overlapping endothelial cells, which allow the entry of nanoscale plastic particles [15]. Plasma proteins can adsorb onto the surface of NPLs, forming a protein “corona” which can facilitate the translocation of these particles through cellular membranes and tissues, in a manner dependent on the composition of the protein corona [16]. Due to this fact, NPLs may reach and accumulate in lymph nodes via afferent lymphatic vessels, where they interact with endothelial cells, antigen-presenting cells, and lymphocytes, as also reported for lymphatic delivery of other nanoscale particles [17]. This unique anatomical and immunological environment makes the lymphatic system an important, but understudied, target for NPL toxicity.
Lymph node endothelial cells play a critical role in maintaining barrier function, regulating lymphocyte trafficking, and immune responses. Disruption of endothelial homeostasis can lead to altered permeability, impaired immune surveillance, and tissue damage [18]. One of the central mechanisms by which NPLs exert toxicity is the induction of oxidative stress. Elevated reactive oxygen species (ROS) production, lipid peroxidation, and depletion of antioxidant defense components, including reduced glutathione levels and antioxidant enzyme expression and activities, are indicators of cellular stress [19]. Persistent oxidative imbalance may compromise endothelial function and trigger downstream inflammatory or cytotoxic pathways [20].
While the toxic effects of MPs and NPLs on intestinal [21], hepatic [22], pulmonary [23], and brain [24] cells have been intensively investigated, their impact on lymph node endothelial cells is poorly known. To date, NPL toxicity has been investigated in epithelial and vascular endothelial models [25], with many in vitro studies relying on acute or relatively short-term exposure periods [26,27]. A recent work using a respiratory epithelial barrier-on-chip model further demonstrated oxidative and inflammatory responses following 3 days of continuous exposure to PP-NPLs [28]. Lymphatic endothelial cells lining the lymph node sinuses play important roles in the transport of lymph-borne antigens and regulation of leukocyte trafficking, positioning them at an important interface between lymphatic transport and immune regulation [29]. However, the consequences of repeated NPL exposure of lymphatic endothelial cells remain comparatively unexplored. Consequently, it is still unclear whether repeated exposure induces persistent oxidative and inflammatory responses or whether lymphatic endothelial cells develop adaptive mechanisms in response.
This study aimed to investigate the oxidative stress- and inflammation-related effects of polystyrene NPL (PS-NPL) exposure on murine lymph node endothelial cells. Cells were repeatedly exposed to PS-NPLs at concentrations selected based on the reported human exposure estimates and cell viability, intracellular ROS production, lipid peroxidation, antioxidant status, and inflammatory potential were evaluated. By focusing on a lymphatic endothelial model, our work addresses a critical knowledge gap and provides insights into how NPLs may impair immune-relevant tissues. Understanding these effects is important for assessing the potential risks posed by NPL exposure to the lymphatic system and, ultimately, to human health.
2. Materials and Methods
2.1. Characterization of Nanoplastic Particles
Polystyrene nanoplastics (PS-NPLs) (00876-15, Polybead® Microspheres, Polysciences Inc., Europe GmbH, Hirschberg a der Bergstrasse, Germany) were purchased as a suspension with particle sizes of 100 nm (0.10 μm) prepared in deionized water at a concentration of 2.5% (4.55 × 10¹³ particles/mL), and it was kept at 4 °C. These particles are colorless, non-functionalized, and very stable. Before cell culture treatment, they were sterilized by exposure to UVC light for 45 min.
PS-NPLs were further characterized by dynamic light scattering (DLS) to determine their hydrodynamic diameter and size distribution under different dispersion conditions, using a Zetasizer Nano ZS instrument (ZEN 3600, Malvern Instruments, Malvern, UK). Measurements were performed on particle suspensions prepared at concentrations of 16 and 160 μg/mL in deionized water and in phosphate-buffered saline (PBS). In addition, DLS analysis was conducted for PS-NPLs at 16 μg/mL dispersed in Dulbecco’s modified Eagle medium (DMEM) and in complete culture medium consisting of DMEM supplemented with 10% fetal bovine serum (FBS). The lowest experimental concentration (1.6 μg/mL) was not included in the DLS analysis because the lower particle concentration resulted in insufficient scattering intensity for reliable determination of hydrodynamic diameter and polydispersity. All samples were allowed to reach thermal equilibrium at the measurement temperature prior to analysis. Three measurements were acquired for each sample, and the results were analyzed using the built-in Zetasizer Software 7.12 (Malvern Instruments, Malvern, UK).
2.2. Cell Culture and PS-NPLs Repeated Treatment
The SVEC4-10 endothelial cells (ATCC CRL-2181, ATCC/LGC Standards GmbH, Wesel, Germany) were cultured in DMEM medium (31600-083, Gibco, Invitrogen, Waltham, MA, USA) supplemented with 3.5 g/L D-glucose, 1.5 g/L NaHCO3 (sodium hydrogen carbonate), 10 mg/L antibiotic–antimycotic mix solution (A5955, Merck, St. Louis, MO, USA) and 10% fetal bovine serum (10270-106, origin of South America, Gibco, Life Technologies, Carlsbad, CA, USA) in a humid atmosphere of 5% CO2 at 37 °C. Subcultivation was performed using 0.25% trypsin and 0.53 mM EDTA once the cells had achieved 80–90% confluence.
The repeated exposure protocol was performed at five time points: 1, 3, 7, 11, and 15 days after exposure, with the treatment being applied 24 h after seeding 4 × 10³ cells/cm2 in 75 cm2 cell culture flasks. The tested doses were 1.6 μg/mL, 16 μg/mL, and 160 μg/mL. The first two time points were initiated simultaneously. For subsequent intervals, cells from the previous condition were detached and reseeded, and the corresponding PS-NPL concentration was freshly added to the culture medium after each reseeding step. Thus, cells from the day 7, 11 and 15 endpoints underwent successive cycles of reseeding and re-exposure to the same nominal PS-NPL concentration. Untreated cells served as time-matched controls, according to the same experimental schedule.
2.3. Evaluation of Cell Viability
Cell viability was evaluated using the Live/Dead kit (Invitrogen, L3224, Life Technologies, Eugene, OR, USA) and the Trypan blue exclusion method. The Live/Dead test is based on calcein acetoxymethyl ester (AM), which stains viable cells with green fluorescence, and ethidium homodimer (EthD-1), which labels non-viable cells with red fluorescence. At each experimental time point, cells were harvested by trypsinization and resuspended in FACS buffer (PBS supplemented with 2% FBS). Cell suspensions were incubated with calcein AM and EthD-1 at final concentrations of 0.1 µM and 2 µM, respectively, for 15 min at room temperature, and analyzed using a Gallios flow cytometer (Beckman Coulter, Brea, CA, USA), detecting calcein AM (FL1) and EthD-1 (FL3). For each sample, 30,000 events were acquired. Flow cytometry data obtained were processed, analyzed, and graphically represented using Kaluza Analysis Software v2.1 (Beckman Coulter).
Cell viability was also estimated by a Trypan blue dye exclusion assay based on the principle that live cells with intact membranes can exclude this dye, whereas the membrane of dead cells is dye-permeable and these are stained in blue. For Trypan blue staining, the cells were harvested and resuspended in the complete medium. The suspension was mixed with a 0.4% Trypan blue solution at a 1:1 ratio. A total of 10 μL of the mixture was then loaded onto a hemocytometer and the unstained and stained cells were counted. For cell counting, a 10× objective of a Nikon Eclipse TS100 Phase Contrast Microscope (Nikon, Tokyo, Japan) was used. Cell viability was determined by calculating the percentage of unstained (viable) cells relative to the total cell population (both unstained viable cells and blue-stained non-viable cells), multiplied by 100.
2.4. Lactate Dehydrogenase (LDH) Assay
Cytotoxicity was evaluated by quantifying LDH activity released into the culture media of flask-seeded cells because of membrane damage. This assay was performed using the Cytotoxicity Detection Kit (LDH) (11644793001, Roche, Basel, Switzerland), according to manufacturer’s datasheet. At each experimental endpoint, the culture media was collected and centrifuged at 15,000× g and 4 °C for 20 min to remove residual PS-NPLs. Subsequently, a volume of 50 µL of supernatant was transferred into a 96-well plate and mixed with an equal volume of reaction mixture. After an incubation of 15 min in the dark, at room temperature, the absorbance was read at 490 nm using a FlexStation 3 Multi-Mode Microplate Reader (Molecular Devices, San Jose, CA, USA).
2.5. Measurement of Nitric Oxide (NO) Production
Nitric oxide (NO) level was indirectly quantified by determining nitrite accumulation, a stable end-product of NO metabolism, in the culture medium using the Griess assay [30]. For this test, SVEC4-10 cells were seeded as described above for the LDH assay. After each of the five time points, the culture medium was transferred in tubes and centrifuged at 15,000× g and 4 °C for 20 min to eliminate the residual PS-NPLs. Further, 80 µL of media from each condition was transferred to a 96-well plate and mixed with equivalent volumes of Griess reagent (1% sulfanilamide (S9251, Sigma-Aldrich, St. Louis, MO, USA), 0.1% N-(1-Naphthyl) ethylenediamine (222488, Sigma-Aldrich), and 6% phosphoric acid). In parallel, a standard curve was prepared from a 200 µM NaNO2 solution diluted in culture medium with concentrations ranging from 0 to 100 µM. The absorbances of the samples and the standard curve were read spectrophotometrically at a wavelength of 540 nm using a FlexStation 3 Multi-Mode Microplate Reader (Molecular Devices, San Jose, CA, USA).
2.6. Detection of the Reactive Oxygen Species (ROS)
Intracellular ROS production was quantified using 2′,7′-dichlorodihydrofluorescein diacetate (H2DCFDA, D6883, Sigma-Aldrich, St. Louis, MO, USA). At each experimental endpoint, the cells were collected and the suspension was centrifuged at 1500 rpm and 18–20 °C for 5 min and resuspended in 1 mL of culture media. Then, it was mixed with 25 µM H2DCFDA solution. After an incubation of 30 min, in the dark, at 37 °C, the cell suspensions were centrifuged, and the sediments were resuspended in FACS buffer and analyzed with a Gallios flow cytometer (Beckman Coulter). For each sample, 30,000 events were acquired. Fluorescence of H2DCFDA was detected in FL1 (FITC channel) and visualized as overlaid histograms of fluorescence intensity between control and treated samples. For quantitative comparisons, data were expressed as mean fluorescence intensity (MFI) values relative to controls. Flow cytometry data obtained were processed, analyzed, and graphically represented using Kaluza Analysis Software v2.1 (Beckman Coulter).
2.7. Preparation of the Cell Lysates and the Determination of Total Protein Concentration
For obtaining cell lysates, the cells were harvested and centrifuged at 1500 rpm for 5 min at 18–20 °C. The pellets were washed with PBS and resuspended in PBS. Each sample was mixed with an amount of protease inhibitor solution (P8340, Sigma-Aldrich, Darmstadt, Germany) equivalent to the volume of the sample and sonicated for 30 s, on ice, using a sonicator (UP50H, Hielscher Ultrasound Technology, Teltow, Germany) set to 80% amplitude, for one cycle. The supernatants obtained after a 10 min centrifugation at 3000 rpm and 4 °C represented the total protein extract and were stored at −80 °C for subsequent tests.
The total protein concentration was determined using the PierceTM BCA Protein Assay Kit (23227, Thermo Fisher Scientific, Waltham, MA, USA), according to the manufacturer’s instructions. Briefly, the working reagent was prepared by mixing the two reagents provided at a ratio of A:B = 50:1. Then, 25 μL of each sample, diluted 10-fold, or bovine serum albumin (BSA) standard was mixed with 200 μL of the working reagent in a 96-well plate. The plates were incubated for 30 min at 37 °C, after which the absorbance was measured at 562 nm using a FlexStation 3 Multi-Mode Microplate Reader (Molecular Devices, San Jose, CA, USA). Protein concentrations were calculated using a calibration curve generated with BSA ranging from 0 to 2000 μg/mL.
2.8. Determination of the Advanced Oxidation Protein Products (AOPP)
Advanced oxidation protein products (AOPPs) were determined using a chloramine T-based spectrophotometric assay. Briefly, 200 μL of each 40-fold diluted sample or standard solution were added to a 96-well microplate. Then, a volume of 10 μL of potassium iodide solution was added to each well, and the plate was gently agitated for 5 min at room temperature. Subsequently, 20 μL of glacial acetic acid was added to each well, followed by another agitation step of 30 s at room temperature. The absorbance was measured at 340 nm using a FlexStation 3 Multi-Mode Microplate Reader (Molecular Devices, San Jose, CA, USA). AOPP concentrations were determined by extrapolating the values of sample absorbance from a calibration curve of chloramine T (402869, Sigma-Aldrich, St. Louis, MO, USA). The calibration standard consisted of a 100 μM chloramine solution prepared in 1 mg/mL BSA in PBS, with a range of 0 to 100 μM. The obtained values of AOPP concentrations were normalized to the corresponding total protein concentration of each sample and subsequently expressed relative to the untreated control.
2.9. Determination of the Reduced Glutathione (GSH) Level
Each sample was deproteinized with an equal volume of 5% 5-sulfosalicylic acid (S2130, Sigma-Aldrich, St. Louis, MO, USA). After a centrifugation of 10 min at 10,000 rpm at 4 °C, each supernatant was transferred into a well of a 96-well plate and mixed with 5, 5′-dithiobis (2-nitrobenzoic acid) (DTNB; D8130, Sigma-Aldrich, St. Louis, MO, USA) in an assay buffer (100 mM potassium phosphate buffer and 1 mM EDTA, pH 7) for 10 min at room temperature. The reaction product absorbance was measured at 405 nm using a FlexStation 3 Multi-Mode Microplate Reader (Molecular Devices, San Jose, CA, USA). Concomitantly, a calibration curve was prepared using a 200 μM GSH solution (G6529, Sigma-Aldrich, St. Louis, MO, USA) in the range of 3.125–200 μM. The obtained values of GSH levels were normalized to the corresponding total protein concentration of each sample. For presentation of the relative changes, GSH levels were expressed as percentages relative to the corresponding untreated control at each time point, which was considered 100%.
2.10. Evaluation of the Malondialdehyde (MDA) Concentration
MDA is an oxidation product of polyunsaturated lipids and is considered a marker of oxidative stress in cells and tissues. The thiobarbituric acid (TBA) method for determining the level of MDA is based on the formation of a colored product in an acidic medium, which is a 1:2 adduct between MDA and TBA that can be detected fluorimetrically (λex = 520 nm and λem = 549 nm), as in a previously established protocol [31]. A volume of 20 μL of appropriately diluted sample was mixed with 70 μL of 0.1 N HCl in a black-bottom 96-well plate and incubated at room temperature for a period of 20 min. Afterwards, a volume of 80 μL of 0.025 M TBA solution was added to the reaction medium and the mixture was incubated for 65 min at 37 °C. In parallel, a calibration curve using a standard of 1 μM MDA solution in the range of 0–0.5 μM was performed, and the relative fluorescence units (RFUs) were recorded using a FlexStation 3 Multi-Mode Microplate Reader (Molecular Devices, San Jose, CA, USA). The obtained values of MDA levels were normalized to the corresponding total protein concentration of each sample. For presentation of the relative changes induced by PS-NPL exposure, MDA concentrations were expressed as percentages relative to the corresponding untreated control at each time point, which was considered 100%.
2.11. Western Blot Analysis
Using Western blot analysis, the relative protein expression levels of Hsp27/60/70/90 have been measured. The samples were denatured using β-mercaptoethanol at 95 °C for 5 min and run on 10% sodium dodecyl sulfate polyacrylamide gel electrophoresis (SDS-PAGE) gels in Tris-glycine buffer. An amount of 40 µg of protein was loaded on gels. Using a wet transfer system, the electrophoretic bands were transferred onto a polyvinylidene fluoride (PVDF) membrane (IPVH00010, Merck Millipore, Darmstadt, Germany). Blocking and immuno-detection were performed according to the manufacturer’s instructions, using the WesternBreeze Chromogenic Kit anti-mouse (WB7104, Invitrogen, Carlsbad, CA, USA), and anti-goat (WB7107, Invitrogen, Carlsbad, CA, USA). The membranes were incubated under constant agitation overnight with primary antibodies against Hsp27 (1:250; goat polyclonal; SC-1048), Hsp60 (1:250; goat monoclonal; SC-13115), Hsp70 (1:250; goat monoclonal; SC-24), and Hsp90 (1:250; mouse monoclonal; SC-69703) from Santa Cruz Biotechnology, Dallas, TX, USA, and β-actin (1:1000; mouse monoclonal; A2228, Merck, Darmstadt, Germany). The immunoblots were scanned using a ChemiDoc Imaging System (Bio-Rad Laboratories, Inc., Hercules, CA, USA) and protein expression was quantified using ImageLab software (version 5.2, Bio-Rad, Hercules, CA, USA). The data were normalized by using β-actin as a reference protein.
2.12. ELISA Determination of Pro-Inflammatory Cytokines
SVEC4-10 cells were seeded as described above. Following the experimental treatments, the culture medium was collected and clarified by centrifugation to remove debris. The concentrations of secreted pro-inflammatory cytokines (Interleukin-1β, Interleukin-6 and Tumor Necrosis Factor α) were determined using commercially available sandwich ELISA kits (Il-1β: RAB0273, Il-6: RAB0306, and TNFα: RAB0476; Sigma-Aldrich, St. Louis, MO, USA), according to the manufacturer’s instructions. Briefly, 100 μL of each standard or sample was added to wells and incubated for 2.5 h at 4 °C. The wells were then washed four times with 300 μL of wash solution per well, followed by the addition of 100 μL of the corresponding antibody. After incubation for 1 h at room temperature under gentle agitation, the wells were washed four times, and 100 μL of streptavidin solution was added to each well and incubated for 45 min at room temperature under gentle agitation. The wells were subsequently washed four times, followed by the addition of 100 μL of TMB substrate solution to each well and incubation for 30 min at room temperature. The reaction was stopped by adding 50 μL of stop solution per well, and absorbance was measured immediately at 450 nm using a FlexStation 3 Multi-Mode Microplate Reader (Molecular Devices, San Jose, CA, USA). Standard curves ranged from 0 to 1000 pg/mL for IL-6 and from 0 to 6000 pg/mL for IL-1β and TNFα. Cytokine concentrations were calculated from the respective standard curves and expressed as pg/mL. For presentation of the relative changes induced by PS-NPL exposure, cytokine levels were subsequently expressed as percentages relative to the corresponding untreated control at each time point, which was considered 100%. Absolute cytokine concentrations, together with the corresponding standard deviations and exact p-values, are provided in the Supplementary Material.
2.13. Statistical Analysis
The data obtained for each test corresponded to the mean of three independent experiments. A two-way ANOVA was used to assess the effects of concentration and exposure time, followed by Dunnet’s multiple-comparison test with the corresponding untreated control at each time point. For this, the software GraphPad Prism (version 8.0.2, GraphPad Software, La Jolla, CA, USA) was utilized. Data presented in the main text are expressed as mean ± standard deviation. Where applicable, data are presented as percentages relative to the corresponding untreated control. Statistical significance was expressed according to the p-value (* p < 0.05, ** p < 0.01, and *** p < 0.001) for the sample versus control. ROS data were expressed as mean fluorescence intensity (MFI). For viability, cytotoxicity, AOPP, GSH, MDA and ELISA assays, absolute values are additionally provided in the Supplementary Material, together with the corresponding SD and exact p-values.
3. Results
3.1. Physicochemical Behavior of the PS-NPLs in Different Dispersion Media
The hydrodynamic diameter and colloidal stability of PS-NPLs were evaluated by DLS under different dispersion media and concentrations. Overall, PS-NPLs exhibited hydrodynamic diameters close to the nominal size (100 nm), with only minor variations depending on the surrounding medium, while marked differences were observed in the polydispersity index (PDI), reflecting changes in colloidal homogeneity (Table 1).
Table 1.
Physicochemical characterization of PS-NPLs. Dynamic light scattering (DLS) analysis of PS-NPLs showing hydrodynamic diameter and polydispersity index (PDI) measured in different media: deionized water (16 and 160 µg/mL), PBS (16 and 160 µg/mL), DMEM (16 µg/mL), and DMEM supplemented with 10% fetal bovine serum (FBS, 16 µg/mL).
In deionized water, PS-NPLs showed a stable and highly monodisperse profile, with an average hydrodynamic diameter of approximately 106 nm. The PDI values were extremely low at both concentrations, indicating excellent dispersion stability and negligible aggregation under these conditions.
Similarly, in PBS, PS-NPLs maintained a comparable hydrodynamic size distribution, with average diameters of ~114.5 nm (16 μg/mL) and ~104 nm (160 μg/mL). The PDI remained low at a higher concentration (0.01) and slightly increased at 16 μg/mL (0.06 ± 0.01), suggesting a minor effect of ionic strength on dispersion homogeneity at lower particle loading, without evidence of significant aggregation.
When dispersed in cell culture medium (DMEM), PS-NPLs retained a stable hydrodynamic diameter (~107 nm at 16 μg/mL), with a low PDI value (0.04), indicating that the presence of organic components did not substantially affect the colloidal stability of the particles.
However, in complete culture medium (DMEM supplemented with 10% FBS), while the average hydrodynamic diameter remained close to the nominal value (~100 nm), the PDI increased markedly to 0.24. This increase may indicate a broader size distribution and reduced colloidal homogeneity of the NPL suspension under serum-containing conditions. The increased PDI may be associated with interactions between PS-NPLs and serum proteins, potentially resulting in the formation of a protein corona, and/or with the presence of a subpopulation of particle aggregates. Since DLS provides a population-based measurement of hydrodynamic size distribution, the increased PDI alone does not allow these possibilities to be distinguished.
3.2. Effects of PS-NPLs on Lymphatic Endothelial Cell Viability
Dot plot representations (Figure 1A) of the cell populations revealed that cell viability did not show any detectable differences in the proportion of calcein-AM-positive or ethidium homodimer-1-positive cells between PS-NPL-exposed and untreated cells at any of the tested time points.
Figure 1.
PS-NPLs effects on lymph node endothelial cells following repeated exposure. (A) Representative flow cytometry dot plots of Live/Dead staining showing cell viability across treatment conditions. (B) Quantification of cell viability assessed by Trypan blue exclusion assay. (C) Quantification of lactate dehydrogenase (LDH) release assay indicating membrane integrity. Data in (B,C) are presented as relative values (%) compared to control, expressed as mean ± standard deviation (SD). Statistical significance was determined using two-way ANOVA followed by Dunnett’s multiple comparisons test (* p < 0.05, ** p < 0.01, and PS-NPL treated sample vs. control) (n = 3).
The results were confirmed by Trypan blue exclusion, as across all treatment groups, no significant changes compared to controls were observed (Figure 1B and Figure S1), indicating that PS-NPL exposure did not compromise cell survival.
Quantification of LDH release in the cell culture supernatant indicated a more subtle effect at the population level. At 160 µg/mL, LDH release was significantly increased by 7.7% on day 1, 11% on day 7, 13.4% on day 11 and 10.9% on day 15. A significant increase of 7.8% was also observed at 1.6 µg/mL on day 11 (Figure 1C and Figure S2).
3.3. Evaluation of the Oxidative Stress
To further evaluate the redox response of SVEC4-10 cells under repeated PS-NPL exposure, ROS and NO production and the levels of GSH and MDA were quantified for all experimental conditions. Intracellular ROS exhibited an oscillatory pattern (Figure 2A,B), with an initial increase on day 1 at all doses, with the highest increase observed at 16 µg/mL. On day 3, MFI values were comparable to the control. A pronounced increase in ROS was observed at day 7, particularly at 16 µg/mL PS-NPLs, reflecting a rightward shift in fluorescence intensity observed in flow cytometry histograms, whereas the increase at 1.6 µg/mL and 160 µg/mL was less pronounced. At day 11, MFI values returned close to control levels. By day 15, ROS levels increased again at 1.6 µg/mL, while the other concentrations remained comparable to the control.
Figure 2.
Oxidative stress responses induced by different concentrations of PS-NPLs (0, 1.6, 16, and 160 µg/mL) for 1, 3, 7, 11, and 15 days in SVEC4-10 cells. (A,B) Reactive oxygen species (ROS) production. (A) Representative flow cytometry histograms showing the distribution of DCF fluorescence for each experimental condition. (B) Quantitative analysis of ROS levels based on mean fluorescence intensity (MFI) expressed as mean ± standard deviation (SD). Statistical significance was determined using two-way ANOVA followed by Dunnett’s multiple comparisons test. (C) Quantification of nitric oxide (NO) production expressed relative to control. (D) Quantification of advanced oxidation protein product (AOPP) level expressed relative to control. (E) Quantification of reduced glutathione (GSH) levels expressed relative to control. (F) Quantification of malondialdehyde (MDA) concentration expressed relative to control. Data are presented as relative values (%) compared to control, expressed as mean ± standard deviation (SD). Statistical significance was determined using two-way ANOVA followed by Dunnett’s multiple comparisons test (* p < 0.05, ** p < 0.01, *** p < 0.001, and PS-NPL treated sample vs. control) (n = 3).
The Griess test [32] showed a consistent elevation of NO levels (Figure 2C and Figure S3) by 22.8–30.6% at all tested time points at 160 µg/mL, while no significant changes were observed at the lower concentrations (1.6 and 16 µg/mL).
AOPP levels exhibited a dynamic variation to repeated PS-NPL exposure over time (Figure 2D and Figure S4). At day 1, AOPP levels were significantly increased by 22.3% and 15.4% at 1.6 and 160 µg/mL, respectively, with no significant changes at day 3. At day 7, AOPP levels were significantly reduced at all tested concentrations, by 19.2%, 35.1%, and 27.2% at 1.6, 16, and 160 µg/mL, respectively. At day 11, the lowest concentration induced a 17.8% increase, whereas AOPP levels decreased by 13.6% and 13.4% at 16 and 160 µg/mL, respectively. By day 15, no significant differences were observed.
GSH levels fluctuated over the exposure period (Figure 2E and Figure S5) inversely proportional with the MDA levels. Related to the control, no changes were observed on day 1 for all 3 doses, while on day 3, an increase of approx. 19% was detected in the cells exposed to 1.6 µg/mL, accompanied by decreases of approx. 56% and 32% at 16 and 160 µg/mL, respectively. On day 7, strong reductions were observed, with decreases of approx. 65% and 40% at 16 µg/mL and 160 µg/mL, respectively. A similar pattern was maintained on day 11, with decreases of approx. 52% at 16 µg/mL and 46% at 160 µg/mL. By day 15, GSH levels increased by about 90% at 1.6 µg/mL, while decreases of approx. 37% and 27% persisted in the cells exposed to 16 and 160 µg/mL PS-NPLs, respectively.
To assess the capacity of PS-NPLs to induce oxidative stress, the level of MDA was further analyzed (Figure 2F and Figure S6). On day 1, slight decreases were detected in the cells exposed at 1.6 µg/mL by approx. 14% and at 160 µg/mL by approx. 29% compared to the control. On day 3, significant increases in MDA concentrations after exposures at 16 µg/mL and 160 µg/mL by approx. 17% and 27%, respectively, were noticed. This type of trend continued up to day 7, with increases of approx. 25% at 16 µg/mL and 39% at 160 µg/mL. By day 11, MDA levels were elevated by approx. 12%, 11%, and 29% after repeated exposure to 1.6, 16, and 160 µg/mL PS-NPLs, respectively. At day 15, a slight increase of approx. 16% was observed only at 1.6 µg/mL, while no significant changes occurred at higher concentrations.
3.4. Assessment of the Changes in Protein Expression of Hsp Proteins
To investigate the stress response of SVEC4-10 cells under repeated PS-NPL exposure, the protein expressions of four major heat shock proteins (Hsp27, Hsp60, Hsp70 and Hsp90) were quantified by Western blot analysis (Figure 3).
Figure 3.
Heat shock protein expression in SVEC4-10 cells, following exposure to PS-NPLs (0, 1.6, 16, and 160 µg/mL) at indicated time points (1, 3, 7, 11, and 15 days). For each protein, Hsp27 (A), Hsp60 (B), Hsp70 (C), and Hsp90 (D), the right section shows representative Western blot bands, and the left section presents densitometric quantification of protein expression normalized to β-actin and expressed relative to the corresponding control. Data are presented as relative values (%) compared to control, expressed as mean ± standard deviation (SD). Statistical significance was determined using two-way ANOVA followed by Dunnett’s multiple comparisons test (* p < 0.05, ** p < 0.01, *** p < 0.001, and PS-NPL treated sample vs. control) (n = 3).
Hsp27 expression showed no significant changes during the early exposure period (days 1 and 3) (Figure S7A). On day 7, significant up-regulation of about 15%, 18%, and 20% in the cells exposed to 1.6 µg/mL, 16 µg/mL, and 160 µg/mL, respectively, were observed (Figure 3A). By day 11, Hsp27 expression decreased by 14% and 20% in the case of exposure to 1.6 µg/mL and 160 µg/mL, respectively, while no changes were detected in the cells exposed to 16 µg/mL (Figure S7B). At the final endpoint (day 15), significant reductions in Hsp27 expression were obvious, with down-regulation of about 26% and 15% in the samples exposed to 1.6 µg/mL and to 16 and 160 µg/mL, respectively, compared to untreated cells (Figure S7C).
The Hsp60 expression varied in a dose- and time-dependent manner. The exposure of cells to all three doses had no impact after the first day. But after the third day of treatment, a significant up-regulation of about 13.5% was registered in the cells exposed to the dose of 1.6 µg/mL compared to control (Figure S8A). On days 7 and 11, the expression of Hsp60 in the samples exposed to 1.6 µg/mL was like the control (Figure S8B), whereas after 15 days, a down-regulation by about 16% was noticed (Figure S8C). The exposure of SVEC cells to 16 µg/mL did not influence the expression of Hsp60 compared to control over the entire period of the experiment.
On the other hand, the cells’ treatment with a dose of 160 µg/mL generated an up-regulation of 48% after 3 days and a down-regulation to the control level after 7 days, followed by a decrease in the Hsp60 expression by 20% on day 11. Unexpectedly, after 15 days, an up-regulation of about 38% was registered (Figure 3B and Figure S8).
Hsp70 presented the most dynamic changes during 15 days of exposure (Figure 3C). On day 1, decreases in Hsp70 expressions were detected in the case of exposure to all three doses, with significant reductions of about 26% (1.6 µg/mL), 27% (16 µg/mL), and 22% (160 µg/mL) in comparison with the control. At all subsequent time points, the Hsp70 expression in SVEC cells exposed to the highest dose did not vary significantly compared to the control. By day 3, its expression levels increased significantly by approx. 22% and 25% at doses of 1.6 µg/mL and 16 µg/mL, respectively (Figure S9A). On day 7, Hsp70 expression in the cells exposed to 1.6 µg/mL returned to the control level, whereas that corresponding to 16 µg/mL stayed more or less at the same level (an up-regulation by 22%) as on the third day. On day 11, a down-regulation by 12% was observed in the cells exposed to 1.6 µg/mL, while the Hsp70 expressions corresponding to the other two doses remained at the control level (Figure S9B). At the end, on day 15, a strong up-regulation of approx. 47% in the case of the 1.6 µg/mL dose and no notable changes at the other higher doses were registered (Figure S9C).
No significant variation in the Hsp90 expression in SVEC cells exposed to all three doses was observed in the first 3 days of the experiment (Figure 3D and Figure S10A). On day 7, its expression corresponding to 1.6 μg/mL and 160 μg/mL doses increased significantly by about 28%, whereas that for 16 μg/mL increased at a lower level. After 11 days, for the first two doses, a significant down-regulation of the Hsp90 by about 22% occurred, while at the highest dose, its expression was close to the control level (Figure S10B). By day 15, Hsp90 levels showed a slight, non-significant decrease of 12% at 1.6 μg/mL and an up-regulation of about 35% corresponding to the 160 μg/mL dose (Figure S10C).
3.5. Assessment of Inflammatory Potential
The expression of pro-inflammatory cytokines showed distinct patterns dependent on time and dose, following PS-NPL exposure of the SVEC4-10 cells.
Analyzing Figure 4A, it is obvious that IL-1β levels increased in the first three days for the doses of 1.6 μg/mL and 160 μg/mL, by 44.3% and 53.1% for the first day and by 48.1% and 58.1% for the third day, respectively. After longer periods of time, the concentration of IL-1β decreased to the control level, except for the samples exposed to 160 μg/mL after 7 days and to 1.6 μg/mL after 15 days, which had diminished concentrations by 40.1% and by 26.2%, respectively (Figure S11A).
Figure 4.
Pro-inflammatory cytokine profile in SVEC4-10 cells, following exposure to PS-NPLs (0, 1.6, 16, and 160 µg/mL) at indicated time points (1, 3, 7, 11, and 15 days). (A) Interleukin-1β (IL-1β) levels. (B) Interleukin-6 (IL-6) levels. (C) Tumor necrosis factor-α (TNFα) levels. Data are presented as relative values (%) compared to control and expressed as mean ± standard deviation (SD). Statistical significance was determined using two-way ANOVA followed by Dunnett’s multiple comparisons test (* p < 0.05, ** p < 0.01, *** p < 0.001, and PS-NPL treated sample vs. control) (n = 3).
IL-6 exhibited a delayed response profile (Figure 4B). No significant changes were observed at early time points. On day 7, a moderate increase of about 37% was detected in the samples exposed to 160 μg/mL, while more pronounced elevations occurred on day 11 (130.3% at 16 μg/mL and 58.6% at 160 μg/mL) compared to the control. These increases persisted on day 15, reaching 24.6% and 28.2% at 16 μg/mL and 160 μg/mL, respectively (Figure S11B).
In contrast, the TNFα level showed (Figure 4C) insignificant variations in comparison to the control, except the increase of about 26% in the cells exposed for three days to 160 μg/mL (Figure S11C).
4. Discussion
4.1. Repeated PS-NPL Exposure Induces a Sublethal Stress Response While Preserving Endothelial Viability
Considering the widespread human exposure to PS-NPLs and their potential accumulation and transport through the lymphatic system, lymphatic endothelial cells represent a relevant cellular target for investigating their biological effects. Therefore, this study aimed to investigate the effects of repeated exposure to 100 nm PS-NPLs at 1.6, 16, and 160 µg/mL on SVEC4-10 murine lymphatic endothelial cells over a 15-day period.
The lowest dose tested in this study was selected based on recent human biomonitoring data reporting a mean quantifiable concentration of 1.6 µg/mL of plastic polymer components in human whole blood [4]. While this value represents the sum of quantifiable plastic polymers rather than PS-NPLs specifically, it provides a human-relevant reference point for the experimental exposure range. The higher concentrations (16 and 160 µg/mL) were included to investigate dose-dependent responses under elevated exposure scenarios, considering recent estimates indicating that human exposure to airborne plastic particles may be higher than previously estimated [33]. These concentrations should not be interpreted as direct estimates of the concentrations encountered by lymphatic endothelial cells in vivo, as currently available human biomonitoring and exposure data do not allow reliable estimation of NPL concentrations specifically within lymph or at the endothelial cellular interface. Therefore, the higher doses were used as exploratory concentrations to characterize cellular responses across a broader exposure range.
The DLS results demonstrated relatively stable hydrodynamic diameters across the tested dispersion media and concentrations. The increased PDI observed in the presence of complete culture medium, despite the relatively unchanged hydrodynamic diameter, indicates that the dispersion behavior of PS-NPLs differed under serum-containing conditions compared with protein-free media. This may reflect interactions between the NPL surface and serum proteins, potentially involving protein corona formation, and/or changes in particle associations or aggregation. The protein corona can modify the biological identity of NPLs by altering their effective surface properties and interactions with the cellular membrane. Corona formation may influence cellular uptake, intracellular trafficking, and the subsequent biological responses to PS-NPL exposure. Therefore, the cellular effects observed in the present study should be interpreted in the context of serum-containing exposure conditions, under which PS-NPLs are likely to interact with serum proteins before and during cell exposure. However, as the protein corona was not directly characterized in the present study, and no zeta potential measurements were performed, its specific composition and contribution to the observed effects cannot be determined. This represents a limitation of the present physicochemical characterization.
Repeated PS-NPL exposure did not significantly alter overall SVEC4-10 viability or LDH release across the tested concentrations and exposure periods, suggesting that repeated PS-NPL exposure did not induce detectable cytotoxicity under the experimental conditions used. Previous studies have reported greater cytotoxicity in HUVECs following exposure to lower or highly concentrated PS-NPLs suspensions, particularly when particles were amino-functionalized [34]. In contrast, murine myocardial and porcine coronary artery endothelial cells showed no significant viability changes after short-term exposure to 1 µm and 25 nm PS-NPLs, respectively [35,36]. Similarly, exposure of murine brain endothelial cells to 50, 100, and 1000 nm PS-NPLs resulted in only a slight viability reduction for the smallest particle exposure [37]. Together, these findings suggest that PS-NPL-induced cytotoxicity is strongly influenced by particle size, surface properties, concentration, exposure duration, and cell type.
4.2. Oxidative Stress Is the Central Response to Repeated PS-NPL Exposure
Excessive ROS production and oxidative stress are widely recognized as important mechanisms underlying NPL/MP toxicity [38,39]. The oxidative stress-related markers analyzed after SVEC4-10 exposure to PS-NPLs revealed a pronounced time- and concentration-dependent response. ROS production increased initially after exposure and was more pronounced around day 7 in cells treated with 16 and 160 µg/mL PS-NPL. This was accompanied by increased MDA levels and considerable GSH depletion at the intermediate and highest concentrations, indicating that ROS accumulation was associated with lipid peroxidation and perturbation of the non-enzymatic antioxidant defense as reflected by GSH depletion. An increased nitrite signal was observed only at the highest concentration, suggesting altered endothelial redox signaling and a possible contribution of reactive nitrogen species to the cellular stress response.
Lipid peroxidation is a recognized consequence of oxidative stress, with membrane lipids representing important targets of reactive species [40]. Both MDA and Hsp70 levels were reduced after 1 day of exposure to PS-NPLs, despite the concomitant increase in intracellular ROS. In the case of MDA, this result may reflect the fact that its measured cellular level represents the net balance between its formation through lipid peroxidation and its subsequent metabolism, detoxification, or removal. Once formed, MDA can be enzymatically metabolized, including through aldehyde dehydrogenase-dependent pathways [41]. Therefore, the early increase in ROS may not necessarily result in an immediate accumulation of terminal lipid peroxidation products if aldehyde-detoxifying mechanisms remain sufficiently active during the initial phase of exposure. Such an interpretation is also biologically plausible in endothelial cells: increased ALDH1A1 expression, together with other antioxidant and detoxification systems such as glutathione S-transferases and peroxiredoxins, has been associated with attenuation of lipid peroxidation in endothelial cells [42]. Thus, the reduced MDA level observed at day 1 should not necessarily be interpreted as evidence of reduced oxidative stress, but may instead indicate that ROS generation preceded detectable accumulation of lipid peroxidation end products or that their clearance initially compensated for their formation. Because aldehyde-metabolizing enzymes were not measured in the present study, however, this mechanism remains a plausible interpretation rather than a directly demonstrated response. In the case of Hsp70, regulation does not necessarily parallel the accumulation of lipid peroxidation products. A previous study reported a lack of correlation between free MDA/TBARS and cytosolic Hsp70 and proposed that Hsp70 induction may be more closely associated with the burden of oxidatively modified and unfolded proteins than with MDA levels per se [43]. Moreover, studies assessing Hsp70 and MDA simultaneously have shown that these markers may display distinct patterns during cellular stress, supporting their use as complementary rather than interchangeable indicators of cellular injury and stress responses [41,44]. Hsp70 may also contribute functionally to the regulation of oxidative damage, as experimental modulation of Hsp70 has been associated with corresponding changes in ROS and MDA levels [45]. Therefore, the lack of a parallel response between these markers may reflect the distinct temporal regulation of oxidative signaling, lipid peroxidation, and cellular stress responses. ROS can act not only as mediators of oxidative damage, but also as signaling molecules, and their increase does not necessarily result in immediate accumulation of lipid oxidation products [46]. Thus, the specific mechanisms underlying the concomitant reduction in MDA and Hsp70 observed at day 1 remain unclear and may involve the early and transient nature of the cellular response. The elevation of MDA between days 3 and 11, together with GSH depletion, indicates that oxidative stress was particularly pronounced during the intermediate phase of repeated exposure, when cellular antioxidant defenses failed to counteract ROS generation. At the same time, the increase in ROS at day 1 and again at day 15 at the lowest concentration suggests that the response was not simply proportional to dose or exposure duration. Instead, these data indicate a dynamic redox response involving an early oxidative burst, a pronounced mid-exposure stress phase, and later modulation of oxidative signaling. This temporal behavior is important when interpreting repeated-exposure studies, as measurements limited to individual initial or late time points may underestimate the complexity of the cellular response.
Protein oxidation, assessed by AOPP levels, further highlighted the dynamic nature of the oxidative response, although its temporal profile did not fully parallel the changes observed for ROS and lipid peroxidation [47,48]. AOPP levels increased on day 1 at 1.6 and 160 µg/mL, but were reduced at all tested concentrations by day 7 and remained decreased at 16 and 160 µg/mL on day 11. The lack of a parallel response between AOPP and the other oxidative stress markers suggests that protein oxidation was differentially regulated during repeated exposure [49]. This divergent pattern may reflect differences in the susceptibility and turnover of cellular macromolecules, as well as time-dependent mechanisms involved in the removal or repair of oxidative modified proteins [50,51].
The observed ROS responses are broadly consistent with previous studies in endothelial models. In bEnd.3 cells, exposure to 50 nm PS-NPLs increased ROS at 2.5 and 5 µg/mL, while GSH increased at lower concentrations and decreased at 5 µg/mL [37]. HUVECs exposed to 20 nm PS-NPLs showed increased ROS levels beginning with the lowest tested concentration [52], whereas EA.hy926 cells exposed to 80 nm PS-NPLs showed increased ROS concentrations only at the two highest concentrations of 50 and 100 µg/mL [53]. The differences between these studies and the present findings likely reflect differences in endothelial cell origin, particle size, exposure concentration, exposure duration, and intrinsic antioxidant capacity. These comparisons highlight the importance of considering both cellular characteristics and nanoparticle physicochemical properties when interpreting NPL-induced oxidative stress.
4.3. Heat Shock Proteins Reveal Activation of Protective Mechanisms
The temporal changes in Hsp27, Hsp60, Hsp70, and Hsp90 expressions provide further evidence of a dynamic cellular stress response. Rather than showing uniform and sustained induction, the four chaperones displayed distinct time- and concentration-dependent patterns, suggesting that different components of the proteostatic and cytoprotective network were engaged at different stages of repeated exposure.
Hsp27 is a small chaperone involved in cytoskeletal organization and protection against oxidative stress and apoptosis. Its expression is induced in response to oxidative and chemical stress and is considered part of a protective cellular response [54]. In this study, Hsp27 expression showed an increase around day 7 followed by decreased expression at later time points. This pattern may indicate an acute cytoprotective response that was subsequently attenuated as exposure continued and is consistent with previous observations of Hsp27 modulation under NPL-induced stress [55].
Hsp60 contributes to mitochondrial protein folding and maintenance of mitochondrial integrity [56]. Its protein expression increased from day 3 in cells exposed to both 1.6 and 160 µg/mL PS-NPs, with a more pronounced increase at the highest concentration. At 160 µg/mL, Hsp60 expression remained elevated at day 15, whereas no significant changes were detected at the intermediate concentration of 16 µg/mL. This response pattern may reflect differences in the intensity, persistence, and cellular perception of mitochondrial stress [57]. The early induction of Hsp60 at 1.6 µg/mL may represent a sensitive adaptive response to mild oxidative or proteotoxic stress, aimed at increasing mitochondrial protein-folding capacity and maintaining proteostasis [58,59]. The more pronounced response observed at 160 µg/mL may be consistent with a greater mitochondrial stress burden, potentially involving enhanced ROS generation, oxidative protein damage, and an increased requirement for chaperone-mediated protein refolding [60]. The persistence of Hsp60 up-regulation at day 15 at this concentration could further indicate persistent oxidative stress or incompletely resolved mitochondrial stress [58]. In contrast, the absence of a significant change at 16 µg/mL and significant decreases registered at day 11 for 160 µg/mL and at day 15 for 1.6 µg/mL suggests that Hsp60 regulation does not follow a simple linear concentration–response relationship and may involve concentration-specific activation thresholds, engagement of alternative mitochondrial quality-control pathways, or transient changes occurring outside the investigated time points [61].
Hsp70, a central regulator of proteostasis and protection against oxidative and proteotoxic damage [62], showed an initial decrease followed by recovery and later induction at the lowest concentration. Hsp70 expression decreased at all three PS-NPL concentrations after 1 day of exposure, despite the concomitant increase in ROS. One possible interpretation is that this early decrease reflects an initial disturbance in protein homeostasis followed by activation of compensatory chaperone mechanisms [63]. This might be a transient proteostatic response in which the constitutive Hsp70 pool is rapidly recruited to oxidatively damaged or misfolded proteins and protein quality-control pathways before de novo Hsp70 synthesis becomes sufficient to compensate for its increased utilization or turnover. A transient reduction in Hsp70 during the initial phase of cellular stress has also been reported in other experimental models and has been attributed to utilization of the available chaperone pool, exceeding its synthesis [64]. The subsequent increase in Hsp70 expression at days 3–7, particularly at 1.6 and 16 µg/mL, is compatible with delayed activation of a compensatory chaperone response aimed at restoring proteostasis. Time-dependent modulation of Hsp70/HSC70 has also been described following nanoparticle-induced oxidative stress, supporting the concept that the chaperone response depends strongly on exposure kinetics, cell type, and the nature of the stressor [65]. The higher Hsp70 expression observed at 1.6 µg/mL on day 15 further illustrates the non-monotonic nature of the chaperone response. This concentration-specific increase may reflect differences in the balance between stress induction and compensatory responses during prolonged exposure. Non-monotonic stress responses have been discussed in the context of hormesis, in which low-level stress may trigger adaptive cellular responses. However, the present study did not directly investigate the mechanisms underlying this response, and a hormetic mechanism cannot be established from the present findings.
Hsp90, which participates in protein folding and stabilization as well as stress, survival, and inflammatory signaling [66], also showed transient increases followed by later changes at higher concentrations, indicating continued modulation of stress-sensitive signaling pathways.
Taken together, these findings are more consistent with a coordinated and temporally regulated Hsp response than with persistent activation of a single stress pathway. This pattern may reflect engagement of cytoprotective mechanisms that allow cells to maintain viability despite continued exposure. However, because adaptive capacity was not directly tested, the present data should be considered consistent with an adaptive stress response rather than definitive evidence of cellular adaptation.
4.4. Temporal Activation of Inflammatory Pathways
The inflammatory profile showed a temporal pattern, characterized by an early increase in IL-1β, delayed IL-6 up-regulation, and comparatively limited involvement of TNFα. This pattern was consistent with the changes observed in oxidative stress markers, supporting the possibility that redox imbalance may contribute to inflammatory signaling during repeated PS-NPL exposure.
The rapid increase in IL-1β during days 1–3 is consistent with an initial inflammatory response to cellular stress. NPL-induced oxidative stress has been associated with activation of inflammasome-related pathways, including NLRP3, which can promote IL-1β maturation and release [67,68]. Thus, the early IL-1β response observed here may be compatible with inflammasome-associated signaling. However, NLRP3 activation was not directly assessed in the present study. The subsequent decline in IL-1β at later time points may indicate attenuation of the initial inflammatory signal or activation of regulatory mechanisms that limit sustained inflammation. A comparable early cytokine increase followed by partial normalization during prolonged MP exposure was reported by Wu et al. [69].
The delayed IL-6 response, particularly during days 11–15, may reflect a distinct or downstream inflammatory signaling response to prolonged cellular stress. Transcriptional pathways such as NF-kB represent a potential upstream mechanism that could contribute to IL-6 induction; however, the present study did not directly assess NF-kB activation or other signaling mechanisms linking the observed cytokine responses. This interpretation is consistent with previous reports linking NPL exposure to IL-6 induction during prolonged cellular stress and immune modulation [55,68]. TNFα showed comparatively modest and transient changes, suggesting a more limited contribution to the inflammatory profile in this model, consistent with previous observations in NPL-exposed endothelial systems [55].
Overall, the cytokine profile revealed distinct temporal patterns of cytokine secretion rather than persistent, uniform inflammatory activation. The initial IL-1β response coincided with the initial oxidative stress phase, whereas the later increase in IL-6 secretion occurred during the period in which several preceding stress responses were attenuated. These differences may reflect distinct upstream signaling mechanisms engaged at different stages of repeated PS-NPL exposure, rather than a single temporally regulated inflammatory pathway. ROS-sensitive inflammasome signaling may be involved in the early IL-1β response, whereas NF-kB-associated signaling may contribute to the later IL-6 response. However, these mechanisms were not directly investigated in the present study. Similar initial cellular activation and inflammatory effects have been associated with PS exposure in endothelial models [35].
4.5. Integrated Cellular Response to Repeated PS-NPL Exposure
When considered together, the findings support a dynamic, predominantly sublethal cellular stress response to repeated PS-NPL exposure. The temporal pattern can be broadly divided into three phases. During the early phase (days 1–3), PS-NPL exposure was associated with increased ROS and IL-1β secretion, and initial modulation of stress-related proteins, while overall cell viability remained preserved. During the intermediate phase (days 7–11), oxidative stress became more pronounced, as reflected by changes in ROS, MDA, and GSH, accompanied by modulation of several Hsps and continued changes in inflammatory mediators. During the late phase (day 15), some earlier responses were attenuated, whereas selected oxidative, chaperone, and inflammatory alterations persisted or emerged.
An additional feature of the present findings was the absence of a consistent monotonic relationship between the nominal PS-NPL concentration and the magnitude of the biological responses. For several endpoints, including ROS, GSH, and AOPP, the effects observed at 1.6 or 16 μg/mL were not consistently lower than those observed at 160 μg/mL. Such non-monotonic responses may reflect the complex relationship between the nominal exposure concentration and the effective cellular dose of particulate materials. In particular, particle dispersion, interactions with serum proteins, particle–cell interactions, and cellular uptake may influence the fraction of particles effectively available to the cells. In the present study, the increase in polydispersity observed in the presence of FBS, together with the time-dependent changes in cellular internalization, supports the possibility that particle availability and cellular exposure were not directly proportional to the nominal concentration in the culture medium. Thus, increasing the nominal concentration does not necessarily result in a proportional increase in intracellular particle burden or biological effect.
This may be particularly relevant when interpreting the oxidative responses observed in the present study. Rather than representing a simple concentration-dependent process, the cellular response may result from the interplay between particle physicochemical state, uptake, intracellular processing, and activation of adaptive stress mechanisms. Although hormetic mechanisms have been proposed as one possible explanation for non-monotonic responses to particulate exposures, the present data do not allow us to establish hormesis as the underlying mechanism. Further studies directly quantifying cellular particle burden and intracellular particle fate would be required to distinguish between these possibilities.
Overall, the findings indicate that repeated PS-NPL exposure triggers coordinated redox, proteostatic, and inflammatory responses despite preserved cell survival. The functional consequences of these molecular alterations for lymphatic endothelial barrier integrity and immune cell trafficking were not directly investigated and, therefore, require further investigation in physiologically relevant models.
4.6. Study Novelty and Contribution to the Current Literature
This study provides new insight into the effects of repeated PS-NPL exposure on lymphatic endothelial cells, a cellular target that remains comparatively understudied relative to the vascular endothelium. By examining multiple exposure durations over 15 days, we show that PS-NPL-induced cellular stress is dynamic and non-monotonic, involving coordinated but temporally distinct alterations in redox homeostasis, protein stress responses, and inflammatory signaling despite preserved overall cell viability. These findings highlight that prolonged NPL exposure may induce persistent sublethal molecular alterations in lymphatic endothelial cells that are not captured by conventional acute-exposure or viability-based assessments.
4.7. Limitations and Future Perspectives
Despite its contribution to understanding the cellular response to repeated PS-NPL exposure, this study has several limitations that should be considered when interpreting the findings. First, the experiments were performed using a single immortalized murine lymph node endothelial cell line, SVEC4-10. Although this model provides a suitable and reproducible system for investigating repeated PS-NPL exposure, its immortalized murine origin limits the direct extrapolation of the findings to primary human lymphatic endothelial cells. SVEC4-10 cells may not fully reproduce the phenotype, functional heterogeneity, and signaling responses of primary human lymphatic endothelial cells. Therefore, validation in primary human lymphatic endothelial cells and more physiologically relevant experimental models will be required to determine the translational relevance of the observed responses. In addition, only pristine, non-functionalized 100 nm PS-NPLs were investigated, whereas environmental NPLs are highly heterogeneous in terms of polymer composition, particle size, surface chemistry, and weathering state. Consequently, the biological responses observed in the present study may not fully reflect those induced by environmentally aged or mixed plastic particles. Another limitation is the simplified nature of the in vitro model. Lymphatic endothelial cells continuously interact with immune cells, extracellular matrix components, and lymph flow, all of which influence endothelial homeostasis and inflammatory responses. These interactions were not reproduced under the present experimental conditions. Therefore, although repeated PS-NPL exposure induced pronounced oxidative stress and inflammatory responses at the cellular level, the functional consequences for lymphatic barrier integrity, immune cell trafficking and lymphatic transport remain to be established. Further studies should also investigate these findings in more physiologically relevant experimental models, including co-culture systems incorporating immune cells, three-dimensional lymphatic models or organ-on-chip platforms. It will also be important to determine whether the molecular alterations observed here translate into functional impairment by assessing barrier permeability, leukocyte transmigration, and lymphatic transport. Finally, investigating different types of environmentally relevant nanoplastics, longer exposure periods, and recovery phases will help clarify whether the cellular responses described in this study represent reversible adaptive mechanisms or progress towards persistent endothelial dysfunction.
5. Conclusions
Repeated exposure to 100 nm PS-NPLs induced marked time-dependent and non-monotonic changes across exposure concentrations in redox homeostasis, stress-response proteins, and inflammatory mediators in SVEC4-10 lymph node endothelial cells, while overall cell viability remained preserved. The temporal modulation of these responses may reflect compensatory cellular processes or a degree of cellular accommodation during prolonged exposure, although the present data do not directly demonstrate a protective adaptive mechanism or establish the molecular pathways underlying such a response. These findings highlight lymphatic endothelial cells as an understudied target of repeated nanoplastics exposure and support further investigation using primary human cells and physiologically relevant models.
Supplementary Materials
The following supporting information can be downloaded at https://www.mdpi.com/article/10.3390/microplastics5040205/s1: Figure S1: Quantification of cell viability assessed by Trypan Blue exclusion assay after repeated exposure of SVEC4-10 cells to 1.6, 16, and 160 μg/mL PS-NPLs for 1, 3, 7, 11, and 15 days. Data are presented as absolute values, with individual data points and mean ± standard deviation (SD). Statistical comparisons were performed between each PS-NPL treatment concentration and the corresponding untreated control at each experimental time point. Exact p-values are provided in the figure; Figure S2: Quantification of cytotoxicity assessed by lactate dehydrogenase (LDH) release in the cell culture supernatant after repeated exposure of SVEC4-10 cells to 1.6, 16, and 160 μg/mL PS-NPLs for 1, 3, 7, 11, and 15 days. Data are presented as absolute values, with individual data points and mean ± standard deviation (SD). Statistical comparisons were performed between each PS-NPL treatment concentration and the corresponding untreated control at each experimental time point. Exact p-values are provided in the figure; Figure S3: Quantification of nitrite levels as an indicator of nitric oxide (NO) production after repeated exposure of SVEC4-10 cells to 1.6, 16, and 160 μg/mL PS-NPLs for 1, 3, 7, 11, and 15 days. Data are presented as absolute values, with individual data points and mean ± standard deviation (SD). Statistical comparisons were performed between each PS-NPL treatment concentration and the corresponding untreated control at each experimental time point. Exact p-values are provided in the figure. Figure S4: Quantification of advanced oxidation protein products (AOPP) after repeated exposure of SVEC4-10 cells to 1.6, 16, and 160 μg/mL PS-NPLs for 1, 3, 7, 11, and 15 days. Data are presented as absolute values, with individual data points and mean ± standard deviation (SD). Statistical comparisons were performed between each PS-NPL treatment concentration and the corresponding untreated control at each experimental time point. Exact p-values are provided in the figure; Figure S5: Quantification of reduced glutathione (GSH) levels after repeated exposure of SVEC4-10 cells to 1.6, 16, and 160 μg/mL PS-NPLs for 1, 3, 7, 11, and 15 days. Data are presented as absolute values, with individual data points and mean ± standard deviation (SD). Statistical comparisons were performed between each PS-NPL treatment concentration and the corresponding untreated control at each experimental time point. Exact p-values are provided in the figure; Figure S6: Quantification of malondialdehyde (MDA) levels after repeated exposure of SVEC4-10 cells to 1.6, 16, and 160 μg/mL PS-NPLs for 1, 3, 7, 11, and 15 days. Data are presented as absolute values, with individual data points and mean ± standard deviation (SD). Statistical comparisons were performed between each PS-NPL treatment concentration and the corresponding untreated control at each experimental time point. Exact p-values are provided in the figure; Figure S7: Full-length, uncropped Western blot membranes showing Hsp27 expression and the corresponding β-actin loading control in SVEC4-10 cells after repeated exposure to 1.6, 16, and 160 μg/mL PS-NPLs. (A) Representative full-length membrane showing samples collected after 1 and 3 days of exposure. (B) Representative full-length membrane showing samples collected after 7 and 11 days of exposure. (C) Representative full-length membrane showing samples collected after 15 days of exposure. The molecular weight marker is shown on the left side of each membrane. Sample lanes are indicated as C (untreated control), 1.6, 16, and 160 μg/mL PS-NPLs. Red arrows indicate the β-actin loading-control bands and the Hsp27 bands used for densitometric analysis; Figure S8: Full-length, uncropped Western blot membranes showing Hsp60 expression and the corresponding β-actin loading control in SVEC4-10 cells after repeated exposure to 1.6, 16, and 160 μg/mL PS-NPLs. (A) Representative full-length membrane showing samples collected after 1 and 3 days of exposure. (B) Representative full-length membrane showing samples collected after 7 and 11 days of exposure. (C) Representative full-length membrane showing samples collected after 15 days of exposure. The molecular weight marker is shown on the left side of each membrane. Sample lanes are indicated as C (untreated control), 1.6, 16, and 160 μg/mL PS-NPLs. Red arrows indicate the β-actin loading-control bands and the Hsp60 bands used for densitometric analysis; Figure S9: Full-length, uncropped Western blot membranes showing Hsp70 expression and the corresponding β-actin loading control in SVEC4-10 cells after repeated exposure to 1.6, 16, and 160 μg/mL PS-NPLs. (A) Representative full-length membrane showing samples collected after 1 and 3 days of exposure. (B) Representative full-length membrane showing samples collected after 7 and 11 days of exposure. (C) Representative full-length membrane showing samples collected after 15 days of exposure. The molecular weight marker is shown on the left side of each membrane. Sample lanes are indicated as C (untreated control), 1.6, 16, and 160 μg/mL PS-NPLs. Red arrows indicate the β-actin loading-control bands and the Hsp70 bands used for densitometric analysis; Figure S10: Full-length, uncropped Western blot membranes showing Hsp90 expression and the corresponding β-actin loading control in SVEC4-10 cells after repeated exposure to 1.6, 16, and 160 μg/mL PS-NPLs. (A) Representative full-length membrane showing samples collected after 1 and 3 days of exposure. (B) Representative full-length membrane showing samples collected after 7 and 11 days of exposure. (C) Representative full-length membrane showing samples collected after 15 days of exposure. The molecular weight marker is shown on the left side of each membrane. Sample lanes are indicated as C (untreated control), 1.6, 16, and 160 μg/mL PS-NPLs. Red arrows indicate the β-actin loading-control bands and the Hsp90 bands used for densitometric analysis; Figure S11: Quantification of inflammatory cytokines after repeated exposure of SVEC4-10 cells to 1.6, 16, and 160 μg/mL PS-NPLs for 1, 3, 7, 11, and 15 days. (A) Interleukin-1β (IL-1β), (B) interleukin-6 (IL-6), and (C) tumor necrosis factor-α (TNF-α) levels measured by ELISA in the cell culture supernatants. Data are presented as absolute values, with individual data points and mean ± standard deviation (SD). Statistical comparisons were performed between each PS-NPL treatment concentration and the corresponding untreated control at each experimental time point. Exact p-values are provided in the figure.
Author Contributions
Conceptualization, A.C.B., M.A.B., M.B. and A.D.; methodology, A.C.B., M.A.B., A.H., S.N.V., M.B. and A.D.; software, A.C.B. and A.H.; validation, M.A.B., A.H., S.N.V., M.B., A.D., D.M. and I.-I.S.-S.; formal analysis, A.C.B.; investigation, A.C.B., D.M. and I.-I.S.-S.; resources, S.N.V., D.M., I.-I.S.-S., M.B. and A.D.; data curation, A.C.B., M.A.B., A.H. and M.B.; writing—original draft preparation, A.C.B., M.B. and A.D.; writing—review and editing, M.A.B., M.B., A.D., D.M. and I.-I.S.-S.; visualization, A.C.B., M.A.B., A.H. and M.B.; supervision, M.B. and A.D. All authors have read and agreed to the published version of the manuscript.
Funding
This research received no external funding.
Institutional Review Board Statement
Not applicable.
Informed Consent Statement
Not applicable.
Data Availability Statement
The original contributions presented in this study are included in the article/Supplementary Material. Further inquiries can be directed to the corresponding author.
Acknowledgments
We gratefully acknowledge Geanina Voicu from the “Medical and Pharmaceutical Bionanotechnologies” Department, Institute of Cellular Biology and Pathology “Nicolae Simionescu” of the Romanian Academy, Bucharest, Romania, for her assistance with the dynamic light scattering (DLS) measurements and for her guidance in operating the instrument and associated software.
Conflicts of Interest
The authors declare no conflicts of interest.
Abbreviations
The following abbreviations are used in this manuscript:
| NPLs | Nanoplastics |
| PP | Polypropylene |
| PS | Polystyrene |
| PS-NPLs | Polystyrene nanoplastics |
| MPs | Microplastics |
| ROS | Reactive oxygen species |
| FBS | Fetal bovine serum |
| PBS | Phosphate buffer sodium |
| Calcein-AM | Calcein acetoxymethyl ester |
| EthD-1 | Ethidium homodimer |
| LDH | Lactate dehydrogenase |
| NO | Nitric oxide |
| H2DCFDA | 2′,7′-dichlorodihydrofluorescein diacetate |
| AOPP | Advanced oxidation protein products |
| GSH | Reduced glutathione |
| DTNB | 5, 5′-dithiobis (2-nitrobenzoic acid) |
| MDA | Malondialdehyde |
| TBA | Thiobarbituric acid |
| BSA | Bovine serum albumin |
| IL-1β | Interleukin-1β |
| IL-6 | Interleukin-6 |
| TNFα | Tumor Necrosis Factor α |
| bEnd.3 | Murine brain endothelial cells |
| NLRP3 | Nucleotide-binding oligomerization domain-like receptor containing pyrin domain 3 |
References
- Nihei, Y.; Ota, H.; Tanaka, M.; Kataoka, T.; Kashiwada, J. Comparison of Concentration, Shape, and Polymer Composition between Microplastics and Mesoplastics in Japanese River Waters. Water Res. 2024, 249, 120979. [Google Scholar] [CrossRef] [Scilit] [PubMed]
- Akdogan, Z.; Guven, B. Microplastics in the Environment: A Critical Review of Current Understanding and Identification of Future Research Needs. Environ. Pollut. 2019, 254, 113011. [Google Scholar] [CrossRef] [Scilit] [PubMed]
- Ziani, K.; Ioniță-Mîndrican, C.-B.; Mititelu, M.; Neacșu, S.M.; Negrei, C.; Moroșan, E.; Drăgănescu, D.; Preda, O.-T. Microplastics: A Real Global Threat for Environment and Food Safety: A State of the Art Review. Nutrients 2023, 15, 617. [Google Scholar] [CrossRef] [Scilit] [PubMed]
- Leslie, H.A.; Van Velzen, M.J.M.; Brandsma, S.H.; Vethaak, A.D.; Garcia-Vallejo, J.J.; Lamoree, M.H. Discovery and Quantification of Plastic Particle Pollution in Human Blood. Environ. Int. 2022, 163, 107199. [Google Scholar] [CrossRef] [Scilit] [PubMed]
- Hartmann, C.; Lomako, I.; Schachner, C.; El Said, E.; Abert, J.; Satrapa, V.; Kaiser, A.-M.; Walch, H.; Köppel, S. Assessment of Microplastics in Human Stool: A Pilot Study Investigating the Potential Impact of Diet-Associated Scenarios on Oral Microplastics Exposure. Sci. Total Environ. 2024, 951, 175825. [Google Scholar] [CrossRef] [Scilit] [PubMed]
- Nihart, A.J.; Garcia, M.A.; El Hayek, E.; Liu, R.; Olewine, M.; Kingston, J.D.; Castillo, E.F.; Gullapalli, R.R.; Howard, T.; Bleske, B.; et al. Bioaccumulation of Microplastics in Decedent Human Brains. Nat. Med. 2025, 31, 1114–1119. [Google Scholar] [CrossRef] [Scilit] [PubMed]
- Bunea, A.C.; Badea, M.A.; Dinischiotu, A.; Balas, M. Analysis Methods for the Detection of Plastic Particles in Biological–Environmental Samples. Microplastics 2026, 5, 146. [Google Scholar] [CrossRef] [Scilit]
- Dube, E.; Okuthe, G.E. Plastics and Micro/Nano-Plastics (MNPs) in the Environment: Occurrence, Impact, and Toxicity. Int. J. Environ. Res. Public Health 2023, 20, 6667. [Google Scholar] [CrossRef] [Scilit] [PubMed]
- Kelpsiene, E.; Ekvall, M.T.; Lundqvist, M.; Torstensson, O.; Hua, J.; Cedervall, T. Review of Ecotoxicological Studies of Widely Used Polystyrene Nanoparticles. Environ. Sci. Process. Impacts 2022, 24, 8–16. [Google Scholar] [CrossRef] [Scilit] [PubMed]
- Bunea, A.-C.; Dinischiotu, A. Human Exposure to Micro- and Nanoplastic: Biological Effects and Health Consequence. Rev. Biol. Biomed. Sci. 2023, 5, 1–13. [Google Scholar] [CrossRef] [Scilit]
- Ali, N.; Katsouli, J.; Marczylo, E.L.; Gant, T.W.; Wright, S.; Bernardino De La Serna, J. The Potential Impacts of Micro-and-Nano Plastics on Various Organ Systems in Humans. eBioMedicine 2024, 99, 104901. [Google Scholar] [CrossRef] [Scilit] [PubMed]
- Yacobi, N.R.; Malmstadt, N.; Fazlollahi, F.; DeMaio, L.; Marchelletta, R.; Hamm-Alvarez, S.F.; Borok, Z.; Kim, K.-J.; Crandall, E.D. Mechanisms of Alveolar Epithelial Translocation of a Defined Population of Nanoparticles. Am. J. Respir. Cell Mol. Biol. 2010, 42, 604–614. [Google Scholar] [CrossRef] [Scilit] [PubMed]
- Mathew, A.S.; Harjith, A.; Guruvayoorappan, C. Assessing Microplastics as a Novel Threat to Maternal-Fetal Health: Placental Barrier Penetration and Fetal Developmental Consequences. Reprod. Toxicol. 2025, 137, 109021. [Google Scholar] [CrossRef] [Scilit] [PubMed]
- Peng, Y.; He, Q. Reproductive Toxicity and Related Mechanisms of Micro(Nano)Plastics in Terrestrial Mammals: Review of Current Evidence. Ecotoxicol. Environ. Saf. 2024, 279, 116505. [Google Scholar] [CrossRef] [Scilit] [PubMed]
- Breslin, J.W.; Yang, Y.; Scallan, J.P.; Sweat, R.S.; Adderley, S.P.; Murfee, W.L. Lymphatic Vessel Network Structure and Physiology. Compr. Physiol. 2019, 9, 207–299. [Google Scholar] [CrossRef] [Scilit]
- Corbo, C.; Molinaro, R.; Parodi, A.; Toledano Furman, N.E.; Salvatore, F.; Tasciotti, E. The Impact of Nanoparticle Protein Corona on Cytotoxicity, Immunotoxicity and Target Drug Delivery. Nanomedicine 2016, 11, 81–100. [Google Scholar] [CrossRef] [Scilit] [PubMed]
- Dukhin, S.S.; Labib, M.E. Convective Diffusion of Nanoparticles from the Epithelial Barrier toward Regional Lymph Nodes. Adv. Colloid Interface Sci. 2013, 199–200, 23–43. [Google Scholar] [CrossRef] [Scilit] [PubMed]
- Wang, Y.; Guan, Q.-N.; Zhang, Z.-J.; Zhang, Y.-M. Interaction between Endothelial Injury and Immune Response in Septic Shock: From Basic Research to Clinical Applications. Front. Physiol. 2025, 16, 1627008. [Google Scholar] [CrossRef] [Scilit] [PubMed]
- Manke, A.; Wang, L.; Rojanasakul, Y. Mechanisms of Nanoparticle-Induced Oxidative Stress and Toxicity. BioMed Res. Int. 2013, 2013, 942916. [Google Scholar] [CrossRef] [Scilit] [PubMed]
- Goldsworthy, A.; O’Callaghan, L.A.; Blum, C.; Horobin, J.; Tajouri, L.; Olsen, M.; Van Der Bruggen, N.; McKirdy, S.; Alghafri, R.; Tronstad, O.; et al. Micro-Nanoplastic Induced Cardiovascular Disease and Dysfunction: A Scoping Review. J. Expo. Sci. Environ. Epidemiol. 2025, 35, 746–769. [Google Scholar] [CrossRef] [Scilit] [PubMed]
- Covello, C.; Di Vincenzo, F.; Cammarota, G.; Pizzoferrato, M. Micro(Nano)Plastics and Their Potential Impact on Human Gut Health: A Narrative Review. Curr. Issues Mol. Biol. 2024, 46, 2658–2677. [Google Scholar] [CrossRef] [Scilit] [PubMed]
- Haldar, S.; Yhome, N.; Muralidaran, Y.; Rajagopal, S.; Mishra, P. Nanoplastics Toxicity Specific to Liver in Inducing Metabolic Dysfunction—A Comprehensive Review. Genes 2023, 14, 590. [Google Scholar] [CrossRef] [Scilit] [PubMed]
- Lee, S.E.; Kim, D.Y.; Jeong, T.S.; Park, Y.S. Micro- and Nano-Plastic-Induced Adverse Health Effects on Lungs and Kidneys Linked to Oxidative Stress and Inflammation. Life 2025, 15, 392. [Google Scholar] [CrossRef] [Scilit] [PubMed]
- Kaushik, A.; Singh, A.; Kumar Gupta, V.; Mishra, Y.K. Nano/Micro-Plastic, an Invisible Threat Getting into the Brain. Chemosphere 2024, 361, 142380. [Google Scholar] [CrossRef] [Scilit] [PubMed]
- Lee, S.E.; Yoon, H.K.; Kim, D.Y.; Jeong, T.S.; Park, Y.S. An Emerging Role of Micro- and Nanoplastics in Vascular Diseases. Life 2024, 14, 255. [Google Scholar] [CrossRef] [Scilit] [PubMed]
- Shi, X.; Wang, X.; Huang, R.; Tang, C.; Hu, C.; Ning, P.; Wang, F. Cytotoxicity and Genotoxicity of Polystyrene Micro- and Nanoplastics with Different Size and Surface Modification in A549 Cells. Int. J. Nanomed. 2022, 17, 4509–4523. [Google Scholar] [CrossRef] [Scilit] [PubMed]
- Berber, A.A.; Akinci Kenanoğlu, N.; Nur Demir, Ş.; Aksoy, H. Genotoxic and Cytotoxic Effects of Polystyrene Nanoplastics on Human Lymphocytes: A Comprehensive Analysis. Mutat. Res.-Genet. Toxicol. Environ. Mutagen. 2025, 902, 503850. [Google Scholar] [CrossRef] [Scilit] [PubMed]
- Sert, O.; Bilgi, E.; Coban, R.; Saglam-Metiner, P.; Dogan, B.; Imir-Tekneci, Z.; Cinaroglu, S.S.; Goksel, O.; Oksel Karakus, C.; Yesil-Celiktas, O. Polypropylene Nanoplastic Exposure to Respiratory Epithelial Barrier-On-Chip and Interfacial Interactions With Human Serum Albumin. Allergy 2026, 81, 3488–3503. [Google Scholar] [CrossRef] [Scilit] [PubMed]
- Takeda, A.; Salmi, M.; Jalkanen, S. Lymph Node Lymphatic Endothelial Cells as Multifaceted Gatekeepers in the Immune System. Trends Immunol. 2023, 44, 72–86. [Google Scholar] [CrossRef] [Scilit] [PubMed]
- Sun, J.; Zhang, X.; Broderick, M.; Fein, H. Measurement of Nitric Oxide Production in Biological Systems by Using Griess Reaction Assay. Sensors 2003, 3, 276–284. [Google Scholar] [CrossRef] [Scilit]
- Dinischiotu, A.; Stanca, L.; Gradinaru, D.; Petrache, S.N.; Radu, M.; Serban, A.I. Lipid Peroxidation Due to In Vitro and In Vivo Exposure of Biological Samples to Nanoparticles. In Oxidative Stress and Nanotechnology; Armstrong, D., Bharali, D.J., Eds.; Methods in Molecular Biology; Humana Press: Totowa, NJ, USA, 2013; Volume 1028, pp. 155–164. [Google Scholar]
- Green, L.C.; Wagner, D.A.; Glogowski, J.; Skipper, P.L.; Wishnok, J.S.; Tannenbaum, S.R. Analysis of Nitrate, Nitrite, and [15N]Nitrate in Biological Fluids. Anal. Biochem. 1982, 126, 131–138. [Google Scholar] [CrossRef] [Scilit] [PubMed]
- Yakovenko, N.; Pérez-Serrano, L.; Segur, T.; Hagelskjaer, O.; Margenat, H.; Le Roux, G.; Sonke, J.E. Human Exposure to PM10 Microplastics in Indoor Air. PLoS ONE 2025, 20, e0328011. [Google Scholar] [CrossRef] [Scilit] [PubMed]
- Geppner, L.; Hellner, J.; Henjakovic, M. Effects of Micro- and Nanoplastics on Blood Cells in Vitro and Cardiovascular Parameters in Vivo, Considering Their Presence in the Human Bloodstream and Potential Impact on Blood Pressure. Environ. Res. 2025, 273, 121254. [Google Scholar] [CrossRef] [Scilit] [PubMed]
- Vlacil, A.-K.; Bänfer, S.; Jacob, R.; Trippel, N.; Kuzu, I.; Schieffer, B.; Grote, K. Polystyrene Microplastic Particles Induce Endothelial Activation. PLoS ONE 2021, 16, e0260181. [Google Scholar] [CrossRef] [Scilit] [PubMed]
- Shiwakoti, S.; Ko, J.-Y.; Gong, D.; Dhakal, B.; Lee, J.-H.; Adhikari, R.; Gwak, Y.; Park, S.-H.; Jun Choi, I.; Schini-Kerth, V.B.; et al. Effects of Polystyrene Nanoplastics on Endothelium Senescence and Its Underlying Mechanism. Environ. Int. 2022, 164, 107248. [Google Scholar] [CrossRef] [Scilit] [PubMed]
- Kim, E.-H.; Baek, S.M.; Park, H.J.; Bian, Y.; Chung, H.Y.; Bae, O.-N. Polystyrene Nanoplastics Promote the Blood-Brain Barrier Dysfunction through Autophagy Pathway and Excessive Erythrophagocytosis. Ecotoxicol. Environ. Saf. 2025, 289, 117471. [Google Scholar] [CrossRef] [Scilit] [PubMed]
- Azarm-Karnagh, S.; Sattari, M.; Banaee, M.; Shirkavand Hadavand, B.; Falco, F. Effects of Polystyrene Nanoplastics on Oxidative Stress, Blood Biochemistry, and Digestive Enzyme Activity in Goldfish (Carassius Auratus). Toxics 2025, 13, 336. [Google Scholar] [CrossRef] [Scilit] [PubMed]
- Ji, J.; Kang, X.; Wang, B.; Yuan, H.; Jiang, Z. The Mechanism of Oxidative Stress Induced by Nanoplastics in Caenorhabditis Elegans: Integrated Analysis of Transcriptomics and Metabolomics. Comp. Biochem. Physiol. Part C Toxicol. Pharmacol. 2026, 305, 110507. [Google Scholar] [CrossRef] [Scilit] [PubMed]
- Ayala, A.; Muñoz, M.F.; Argüelles, S. Lipid Peroxidation: Production, Metabolism, and Signaling Mechanisms of Malondialdehyde and 4-Hydroxy-2-Nonenal. Oxidative Med. Cell. Longev. 2014, 2014, 360438. [Google Scholar] [CrossRef] [Scilit] [PubMed]
- Qu, B.-G.; Wang, H.; Jia, Y.-G.; Su, J.-L.; Wang, Z.-D.; Wang, Y.-F.; Han, X.-H.; Liu, Y.-X.; Pan, J.-D.; Ren, G.-Y. Changes in Tumor Necrosis Factor-α, Heat Shock Protein 70, Malondialdehyde, and Superoxide Dismutase in Patients With Different Severities of Alcoholic Fatty Liver Disease: A Prospective Observational Study. Medicine 2015, 94, e643. [Google Scholar] [CrossRef] [Scilit] [PubMed]
- Zieger, M.A.; Gupta, M.P.; Wang, M. Proteomic Analysis of Endothelial Cold-Adaptation. BMC Genom. 2011, 12, 630. [Google Scholar] [CrossRef] [Scilit] [PubMed]
- González, B.; Manso, R. Induction, Modification and Accumulation of HSP70s in the Rat Liver after Acute Exercise: Early and Late Responses. J. Physiol. 2004, 556, 369–385. [Google Scholar] [CrossRef] [Scilit] [PubMed]
- Lu, K.; Liang, C.-L.; Cho, C.-L.; Chen, H.-J.; Hsu, H.-C.; Yiin, S.-J.; Chern, C.-L.; Chen, Y.-C.; Lee, T.-C. Oxidative Stress and Heat Shock Protein Response in Human Paraspinal Muscles during Retraction. J. Neurosurg. Spine 2002, 97, 75–81. [Google Scholar] [CrossRef] [Scilit] [PubMed]
- Yu, X.; Yan, W.; Wei, Y.; Guo, X.; Deng, X.; Hu, L.; Liu, T.; Lei, Y.; Zhang, J. The Regulatory Role of Heat Shock Protein 70 in Modulating Mitochondrial Antioxidant Defense Systems in Esox Lucius during Post-Mortem Storage. Food Biosci. 2025, 74, 107954. [Google Scholar] [CrossRef] [Scilit]
- Niki, E. Do Antioxidants Impair Signaling by Reactive Oxygen Species and Lipid Oxidation Products? FEBS Lett. 2012, 586, 3767–3770. [Google Scholar] [CrossRef] [Scilit] [PubMed]
- Kehm, R.; Baldensperger, T.; Raupbach, J.; Höhn, A. Protein Oxidation—Formation Mechanisms, Detection and Relevance as Biomarkers in Human Diseases. Redox Biol. 2021, 42, 101901. [Google Scholar] [CrossRef] [Scilit] [PubMed]
- Menzel, A.; Samouda, H.; Dohet, F.; Loap, S.; Ellulu, M.S.; Bohn, T. Common and Novel Markers for Measuring Inflammation and Oxidative Stress Ex Vivo in Research and Clinical Practice-Which to Use Regarding Disease Outcomes? Antioxidants 2021, 10, 414. [Google Scholar] [CrossRef] [Scilit] [PubMed]
- Wu, Q.; Zhong, Z.-M.; Pan, Y.; Zeng, J.-H.; Zheng, S.; Zhu, S.-Y.; Chen, J.-T. Advanced Oxidation Protein Products as a Novel Marker of Oxidative Stress in Postmenopausal Osteoporosis. Med. Sci. Monit. 2015, 21, 2428–2432. [Google Scholar] [CrossRef] [Scilit] [PubMed]
- Davies, K.J.A. Degradation of Oxidized Proteins by the 20S Proteasome. Biochimie 2001, 83, 301–310. [Google Scholar] [CrossRef] [Scilit] [PubMed]
- Raynes, R.; Pomatto, L.C.D.; Davies, K.J.A. Degradation of Oxidized Proteins by the Proteasome: Distinguishing between the 20S, 26S, and Immunoproteasome Proteolytic Pathways. Mol. Asp. Med. 2016, 50, 41–55. [Google Scholar] [CrossRef] [Scilit] [PubMed]
- Ahamed, M.; Javed Akhtar, M. Cytotoxic Effect of Polystyrene Nanoplastics in Human Umbilical Vein Endothelial Cells (HUVECs) and Normal Rat Kidney Cells (NRK52E). J. King Saud Univ.-Sci. 2024, 36, 103505. [Google Scholar] [CrossRef] [Scilit]
- Wang, X.; Zhao, J.; Gao, M.; Wang, T.; Zhang, H. Mechanism of Nano-Plastics Induced Inflammation Injury in Vascular Endothelial Cells. J. Environ. Sci. 2025, 154, 624–634. [Google Scholar] [CrossRef] [Scilit] [PubMed]
- Vidyasagar, A.; Wilson, N.A.; Djamali, A. Heat Shock Protein 27 (HSP27): Biomarker of Disease and Therapeutic Target. Fibrogenes. Tissue Repair 2012, 5, 7. [Google Scholar] [CrossRef] [Scilit] [PubMed]
- Martin-Folgar, R.; González-Caballero, M.C.; Torres-Ruiz, M.; Cañas-Portilla, A.I.; de Alba González, M.; Liste, I.; Morales, M. Molecular Effects of Polystyrene Nanoplastics on Human Neural Stem Cells. PLoS ONE 2024, 19, e0295816. [Google Scholar] [CrossRef] [Scilit] [PubMed]
- Singh, M.K.; Shin, Y.; Han, S.; Ha, J.; Tiwari, P.K.; Kim, S.S.; Kang, I. Molecular Chaperonin HSP60: Current Understanding and Future Prospects. Int. J. Mol. Sci. 2024, 25, 5483. [Google Scholar] [CrossRef] [Scilit] [PubMed]
- D’Amico, G.; Gratie, M.I.; Vergilio, G.; Cappello, F.; Vitale, A.M. Beyond Folding: The Dual Life of Hsp60 in Tissue Homeostasis and Pathophysiology. Appl. Biosci. 2026, 5, 7. [Google Scholar] [CrossRef] [Scilit]
- Münch, C. The Different Axes of the Mammalian Mitochondrial Unfolded Protein Response. BMC Biol. 2018, 16, 81. [Google Scholar] [CrossRef] [Scilit] [PubMed]
- Naresh, N.U.; Haynes, C.M. Signaling and Regulation of the Mitochondrial Unfolded Protein Response. Cold Spring Harb. Perspect. Biol. 2019, 11, a033944. [Google Scholar] [CrossRef] [Scilit] [PubMed]
- Zheng, H.; Vidili, G.; Casu, G.; Navarese, E.P.; Sechi, L.A.; Chen, Y. Microplastics and Nanoplastics in Cardiovascular Disease—A Narrative Review with Worrying Links. Front. Toxicol. 2024, 6, 1479292. [Google Scholar] [CrossRef] [Scilit] [PubMed]
- Jenkins, E.C.; Chattopadhyay, M.; Germain, D. Folding Mitochondrial-Mediated Cytosolic Proteostasis Into the Mitochondrial Unfolded Protein Response. Front. Cell Dev. Biol. 2021, 9, 715923. [Google Scholar] [CrossRef] [Scilit] [PubMed]
- He, Y.; Shen, A.; Salam, M.; Liu, M.; Wei, Y.; Yang, Y.; Li, H. Microcystins-Loaded Aged Nanoplastics Provoke a Metabolic Shift in Human Liver Cells. Environ. Sci. Technol. 2023, 57, 10521–10531. [Google Scholar] [CrossRef] [Scilit] [PubMed]
- Reeg, S.; Jung, T.; Castro, J.P.; Davies, K.J.A.; Henze, A.; Grune, T. The Molecular Chaperone Hsp70 Promotes the Proteolytic Removal of Oxidatively Damaged Proteins by the Proteasome. Free Radic. Biol. Med. 2016, 99, 153–166. [Google Scholar] [CrossRef] [Scilit] [PubMed]
- Mackei, M.; Molnár, A.; Nagy, S.; Pál, L.; Kővágó, C.; Gálfi, P.; Dublecz, K.; Husvéth, F.; Neogrády, Z.; Mátis, G. Effects of Acute Heat Stress on a Newly Established Chicken Hepatocyte—Nonparenchymal Cell Co-Culture Model. Animals 2020, 10, 409. [Google Scholar] [CrossRef] [Scilit] [PubMed]
- Stanca, L.; Geicu, O.I.; Serban, A.I.; Dinischiotu, A. Interplay of Oxidative Stress, Inflammation, and Autophagy in RAW 264.7 Murine Macrophage Cell Line Challenged with Si/SiO2 Quantum Dots. Materials 2023, 16, 5083. [Google Scholar] [CrossRef] [Scilit] [PubMed]
- Hoter, A.; El-Sabban, M.E.; Naim, H.Y. The HSP90 Family: Structure, Regulation, Function, and Implications in Health and Disease. Int. J. Mol. Sci. 2018, 19, 2560. [Google Scholar] [CrossRef] [Scilit] [PubMed]
- Alijagic, A.; Hedbrant, A.; Persson, A.; Larsson, M.; Engwall, M.; Särndahl, E. NLRP3 Inflammasome as a Sensor of Micro- and Nanoplastics Immunotoxicity. Front. Immunol. 2023, 14, 1178434. [Google Scholar] [CrossRef] [Scilit] [PubMed]
- Zheng, L.; Ma, X.; Jin, Z.; Rao, Z. Microplastic-Induced Multi-Organ Toxicity: Cellular Mechanisms and Critical Roles of Organ Crosstalk. Front. Public Health 2026, 14, 1746924. [Google Scholar] [CrossRef] [Scilit] [PubMed]
- Wu, D.; Lim, C.H.L.; Jaeger, J.E.; Han, E.; Lim, B.X.H.; Ong, A.; Loh, W.W.; Lim, J.Y.C.; Mehta, J.S.; Riau, A.K. Exposure of Human Corneal Epithelial Cells to Microplastic Particles Induces a Phase-Specific Cytokine Response. Environ. Pollut. 2026, 397, 127960. [Google Scholar] [CrossRef] [Scilit] [PubMed]
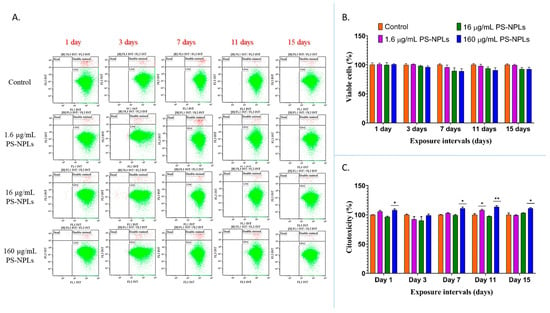
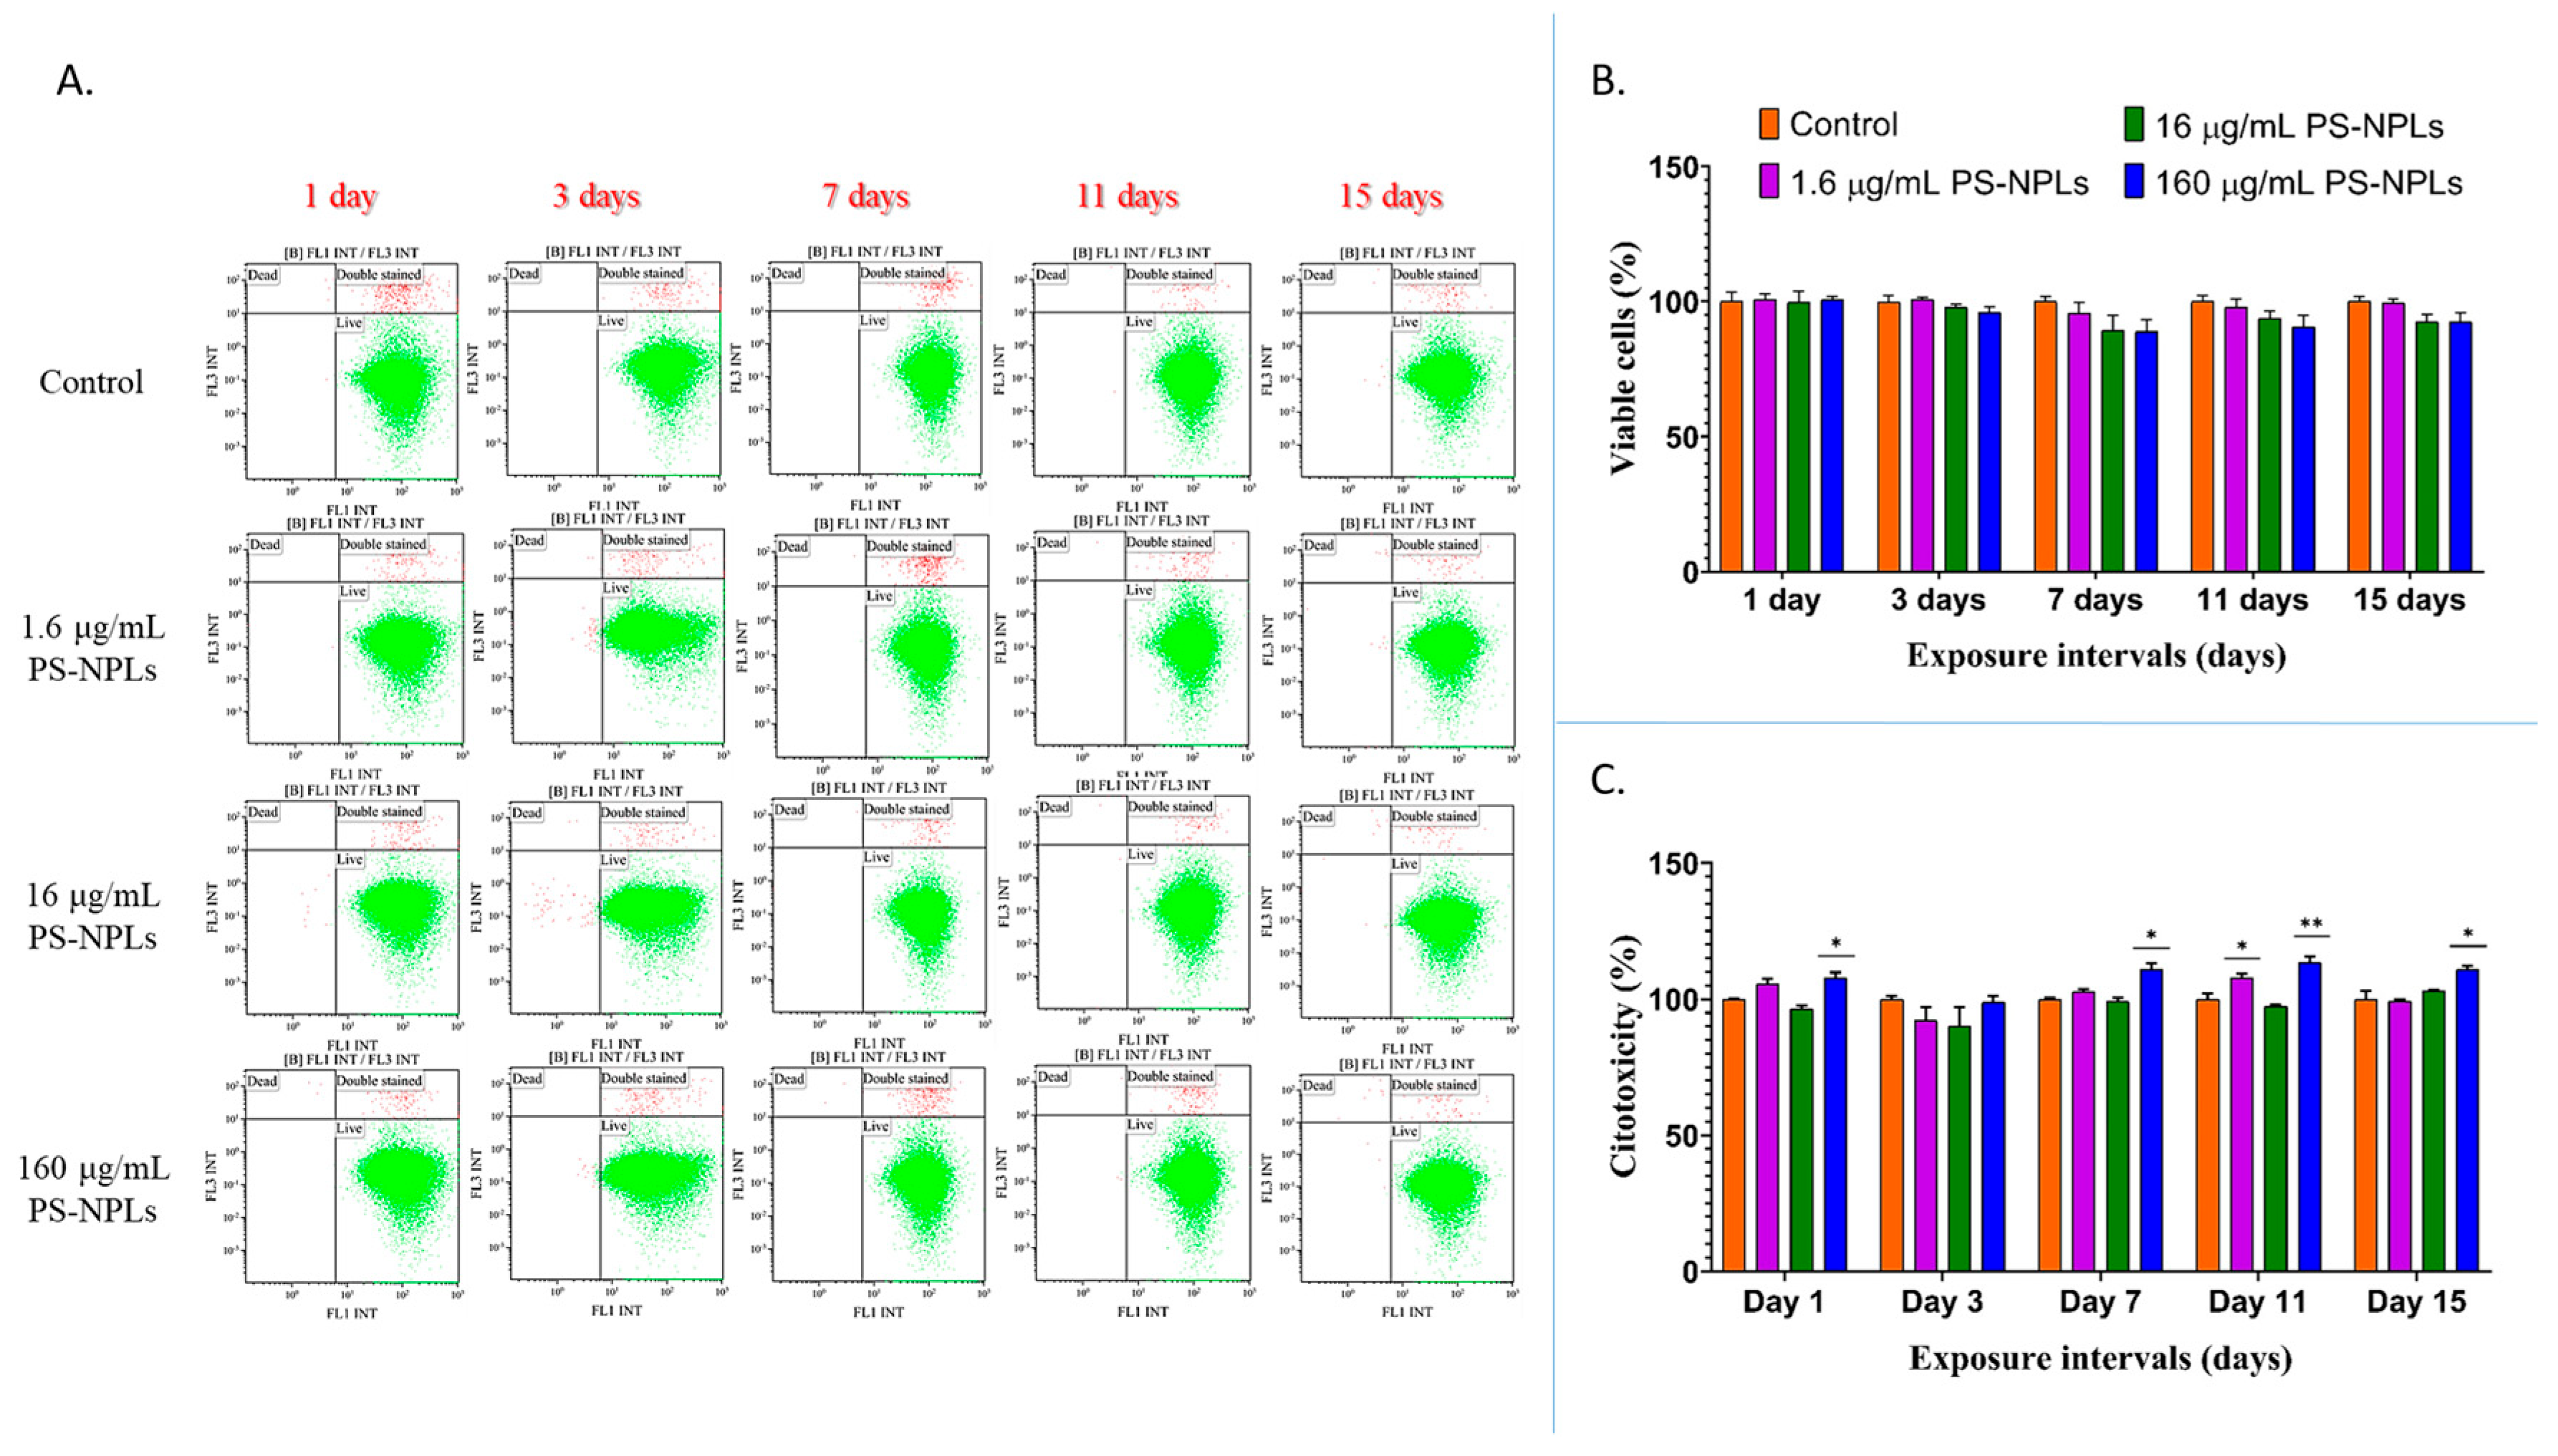
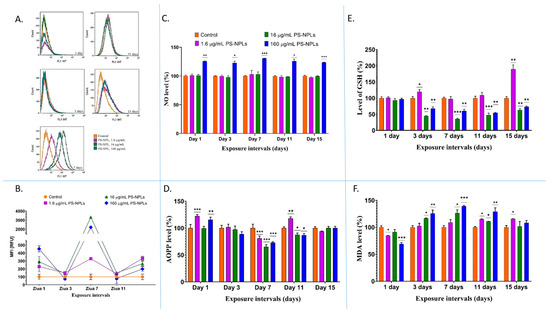
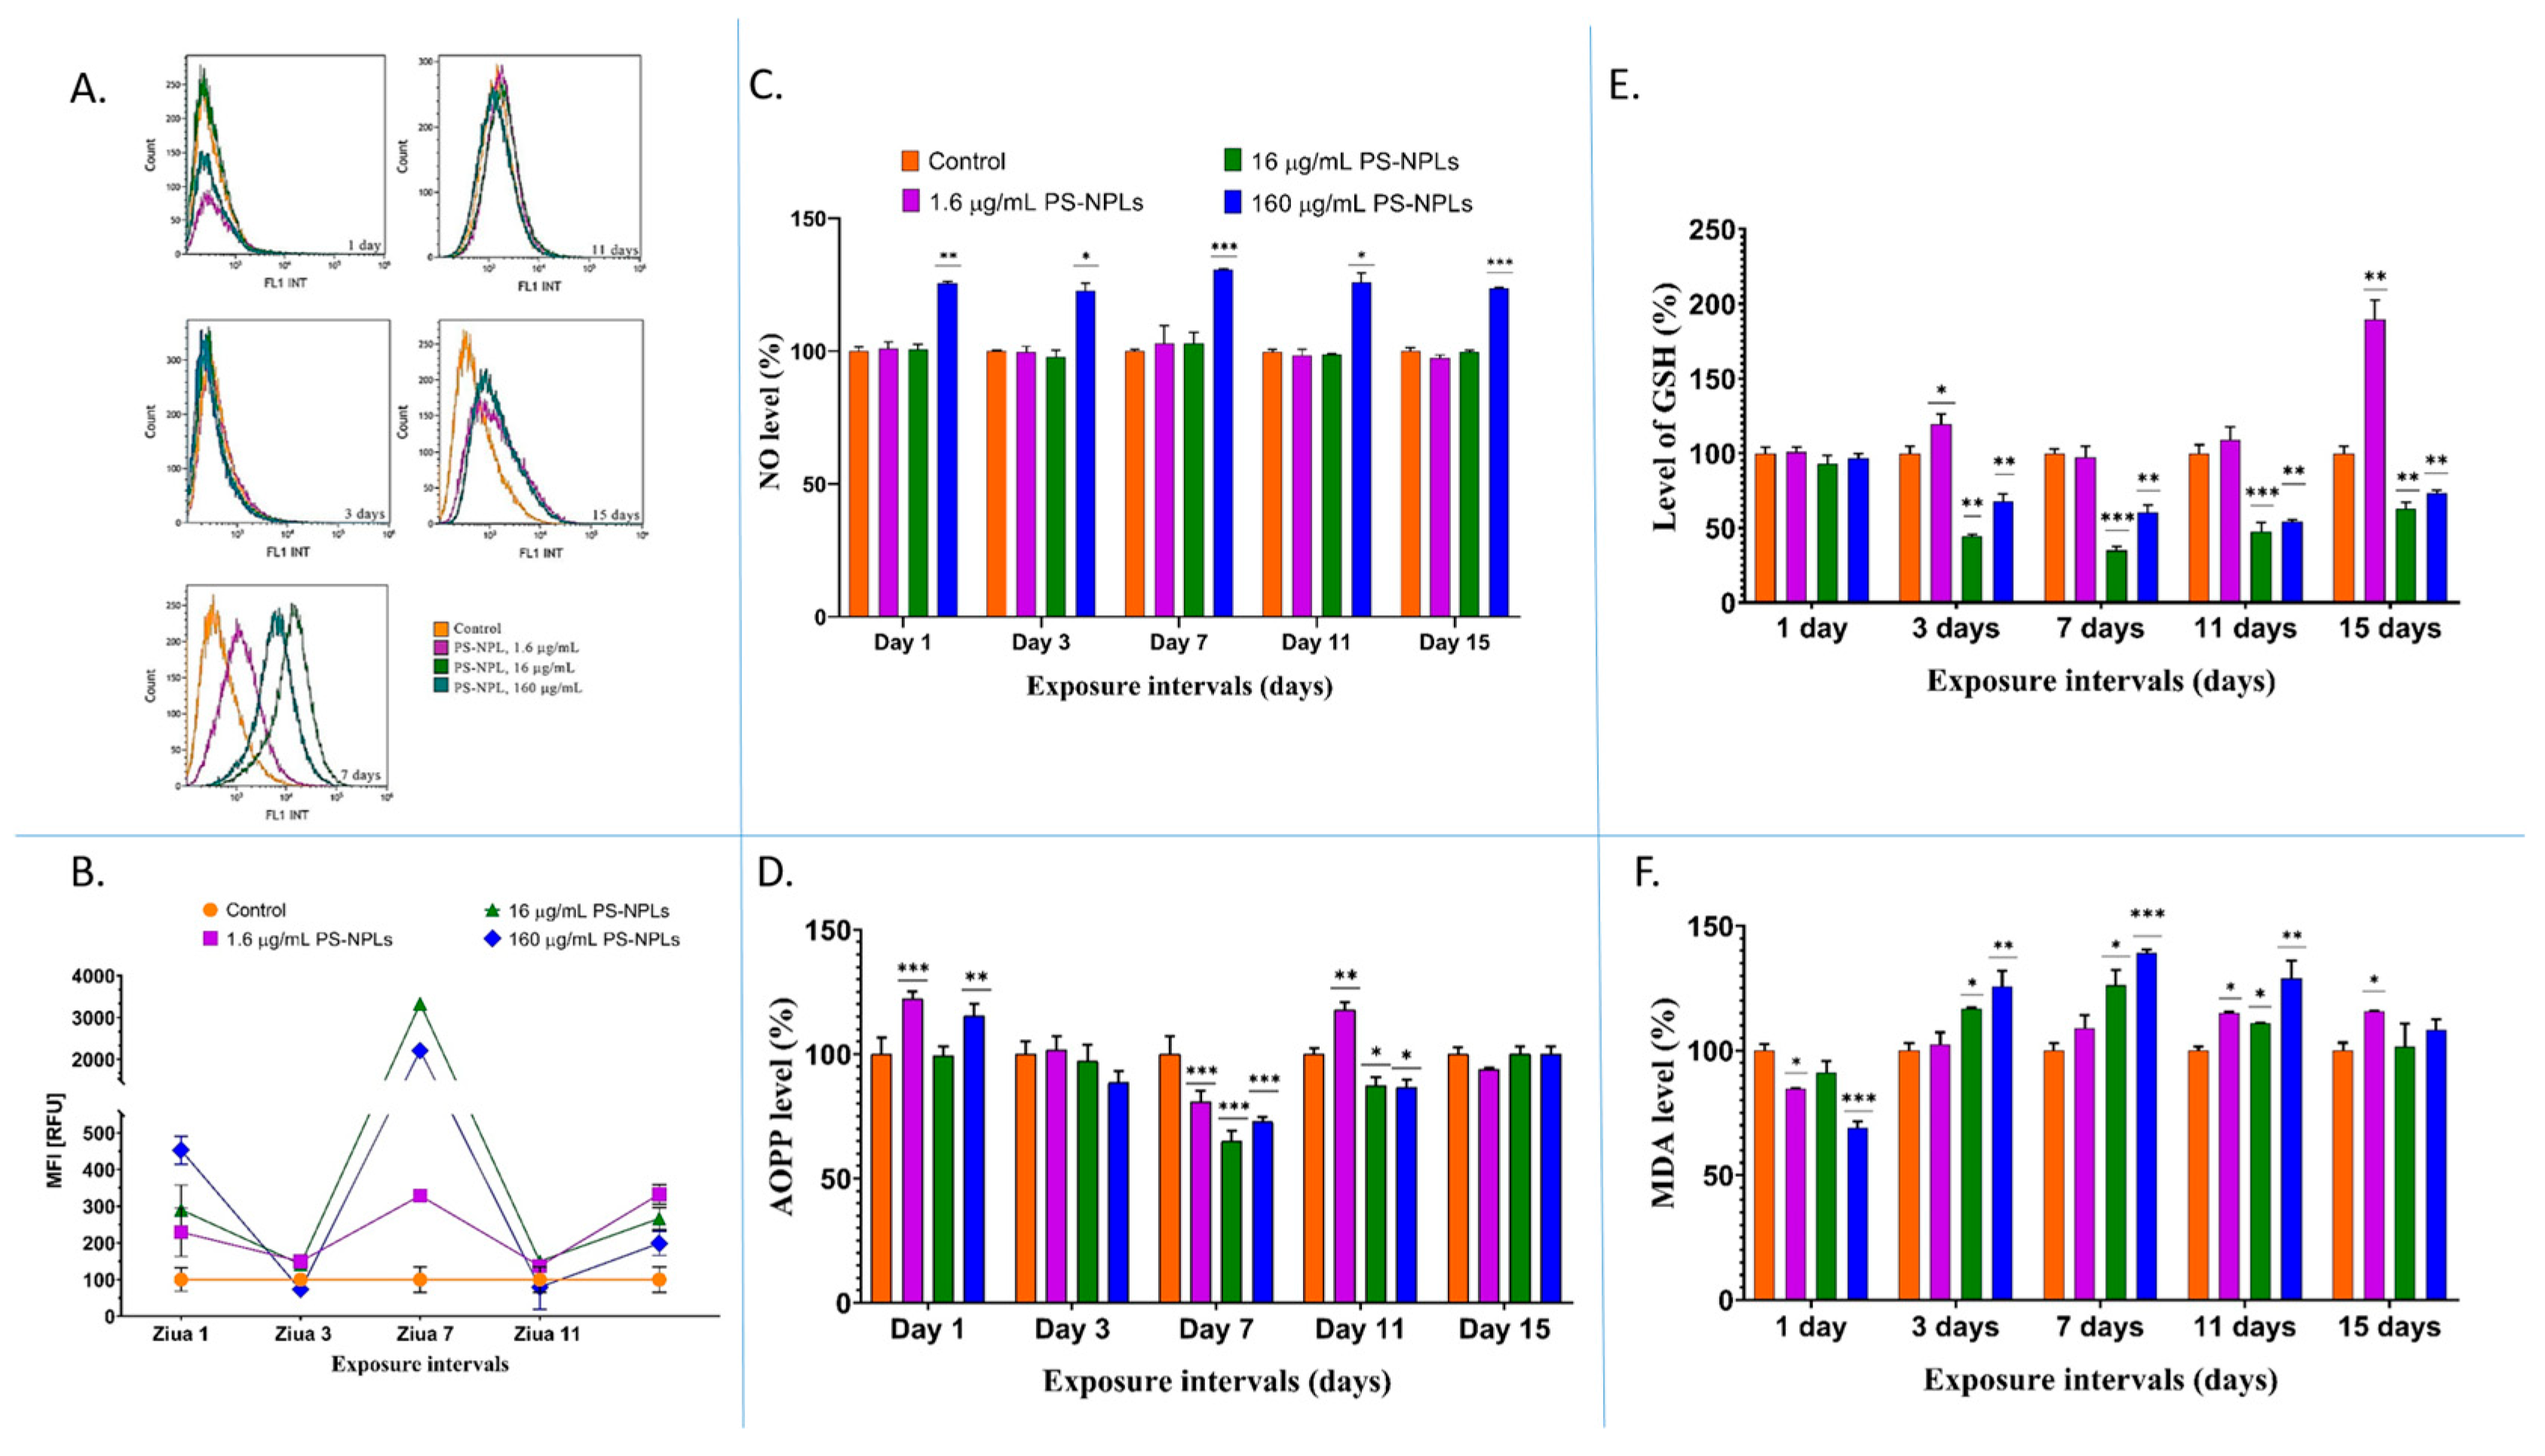
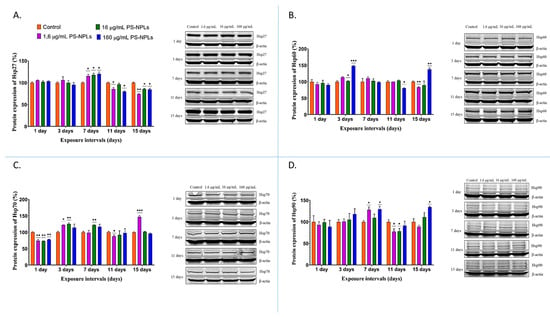
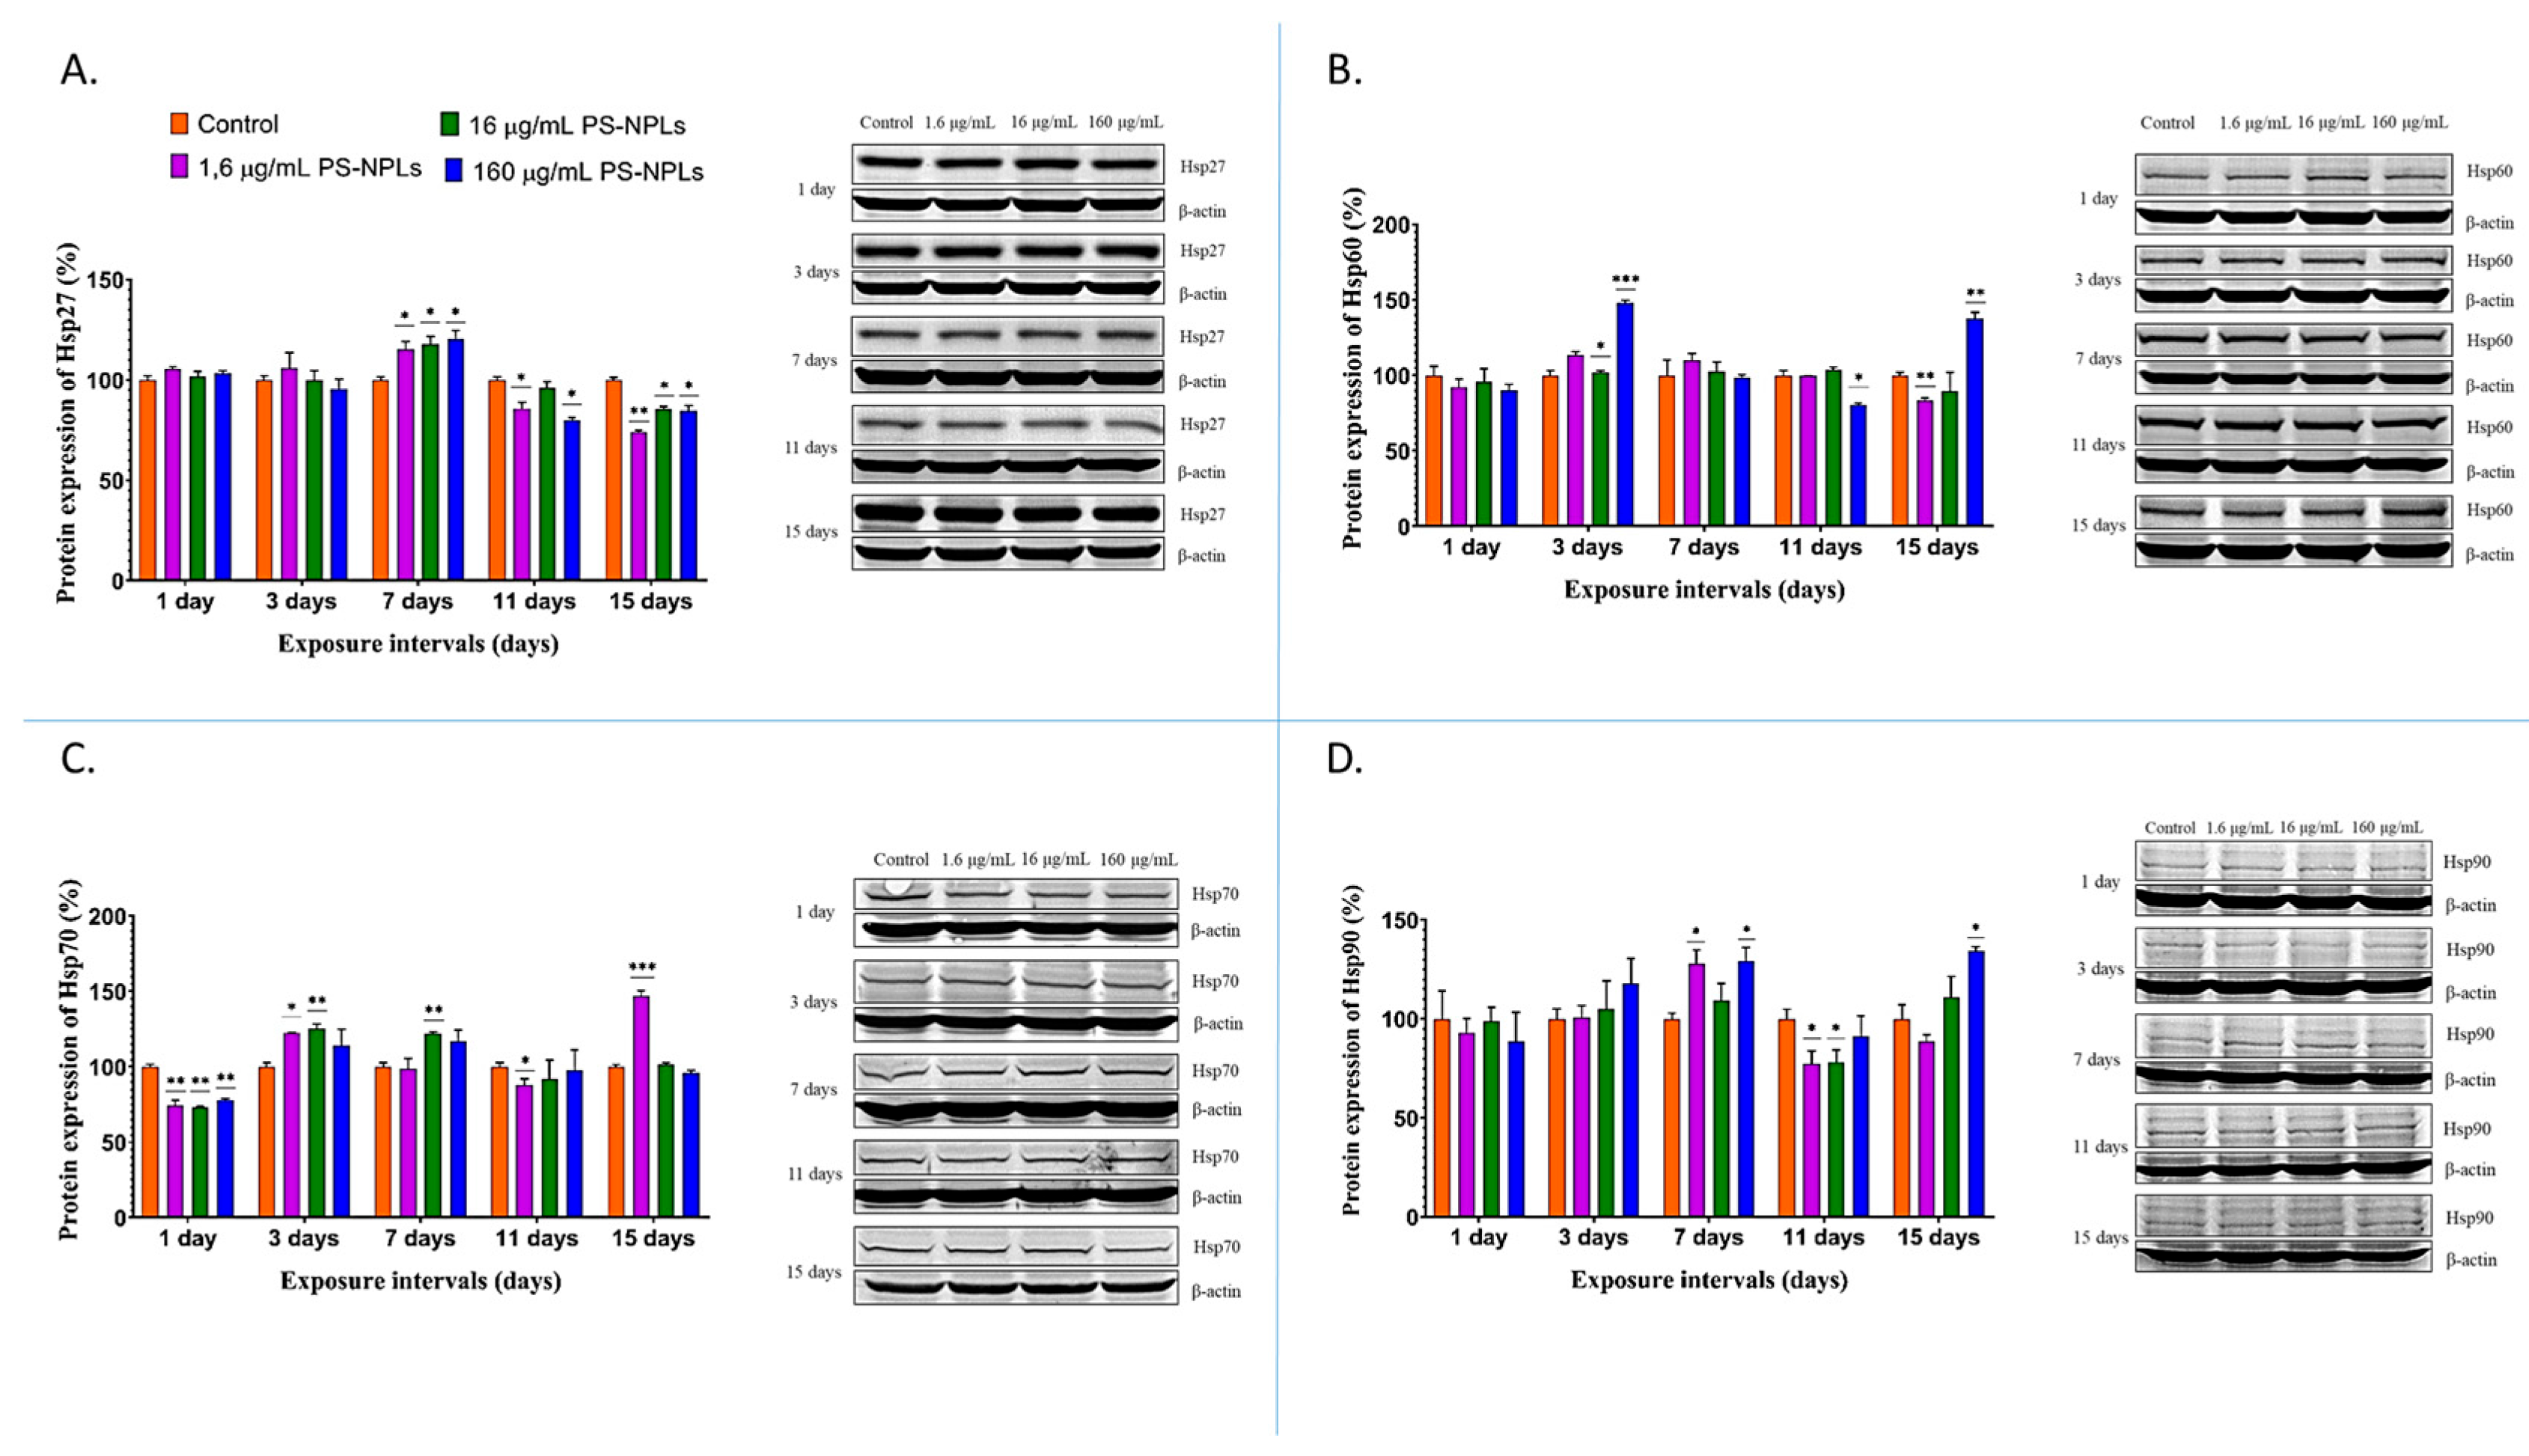
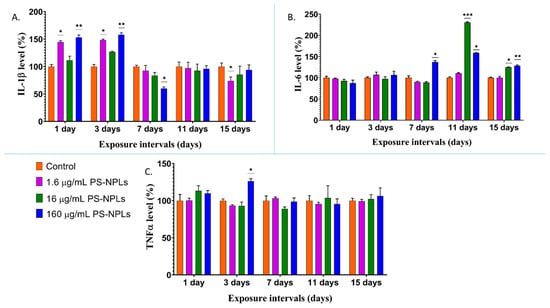
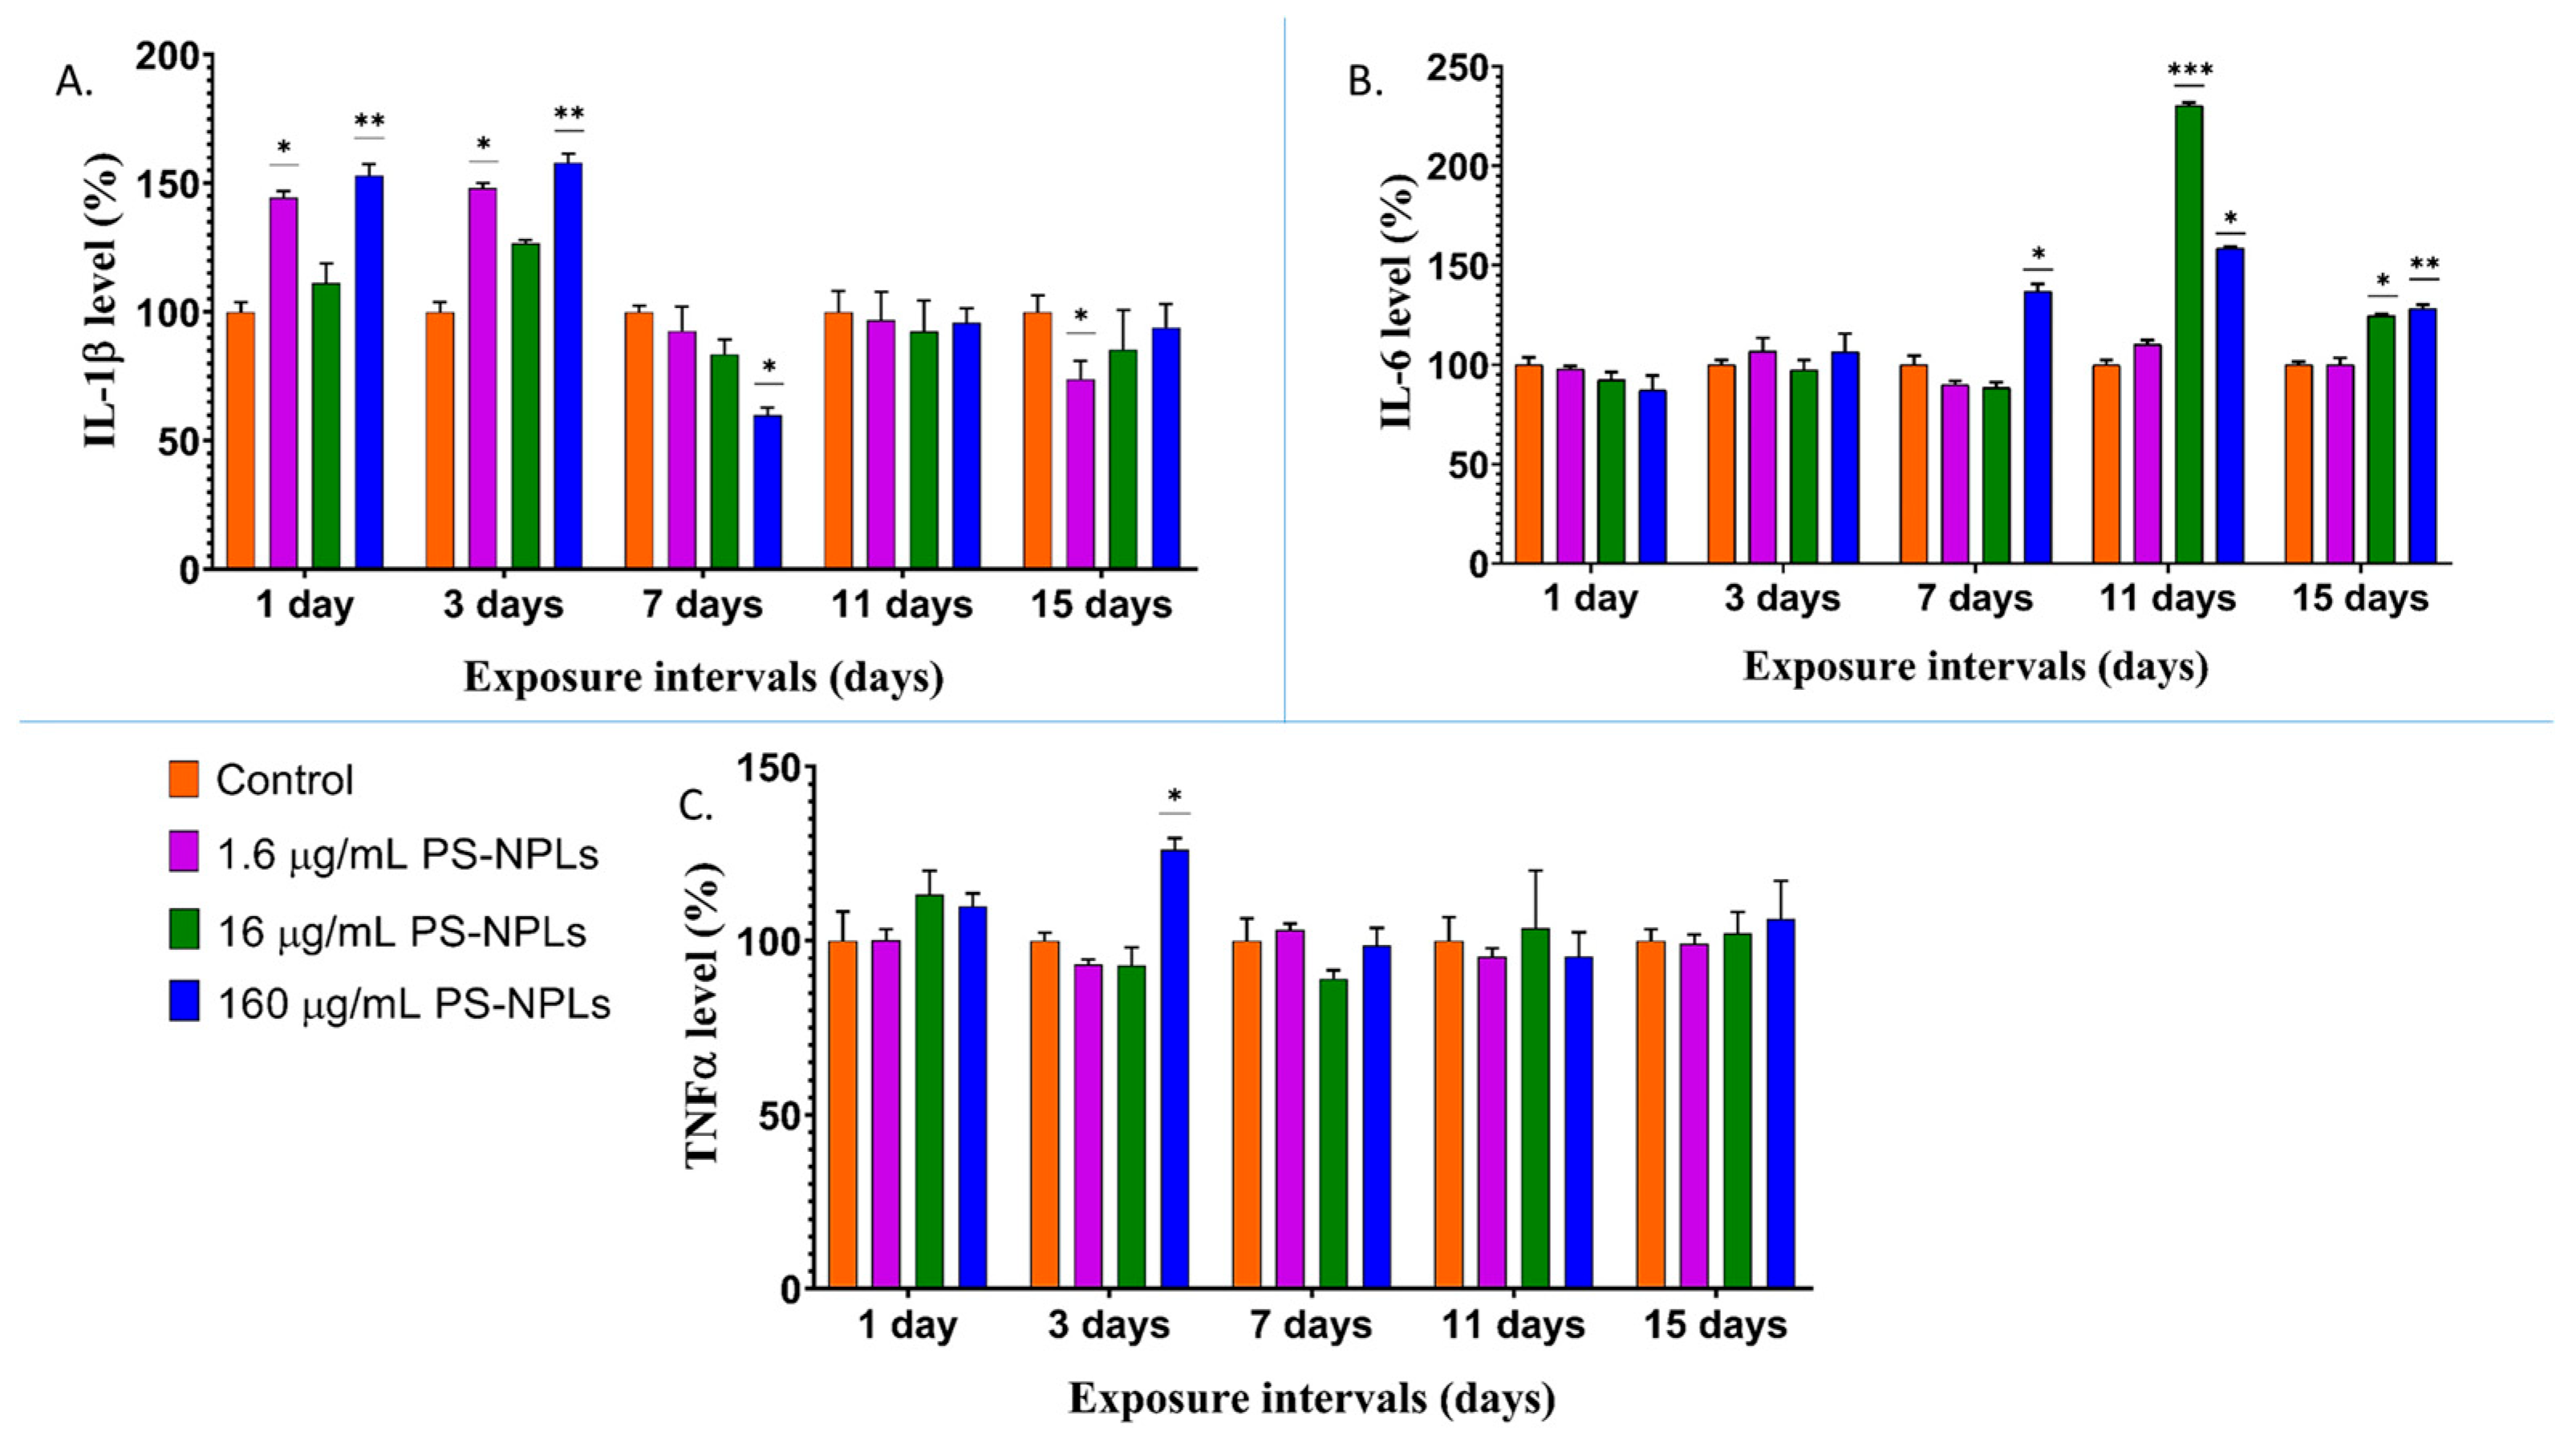

Disclaimer/Publisher’s Note: The statements, opinions and data contained in all publications are solely those of the individual author(s) and contributor(s) and not of MDPI and/or the editor(s). MDPI and/or the editor(s) disclaim responsibility for any injury to people or property resulting from any ideas, methods, instructions or products referred to in the content. |
© 2026 by the authors. Licensee MDPI, Basel, Switzerland. This article is an open access article distributed under the terms and conditions of the Creative Commons Attribution (CC BY) license.