


Abstract
Multifunctional urban lakes provide ecosystem services but may accumulate plastic waste from surrounding activities. This study assessed plastic pollution along the shoreline and within a sampled bottom-deposition area of Bung Xang Lake, Can Tho City, Vietnam. Plastic represented 99.19% of shoreline litter abundance and 95.63% of dry mass. Exploratory omnibus tests yielded p-values of 0.023 and 0.031 for Abundance density and Mass density, respectively, but no Bonferroni-adjusted pairwise comparison was significant, and unverified transect independence limits between-site inference. All 12 shoreline transects were classified as Extremely Dirty by the Clean Coast Index and as Very High Abundance by the Plastic Abundance Index (PAI = 22.66–92.75). Plastic represented 97.68% of item abundance and 86.49% of dry mass among 560 bottom-litter items. Packaging Plastics dominated the bottom plastic assemblage; 91.77% of plastic items measured 100–500 mm, and all four bottom transects showed Very High Abundance under the operationally adapted PAI (19.71–31.62). The findings provide complementary evidence of plastic accumulation in two physical compartments of the same urban lake without establishing direct transport between them. The observed litter composition may inform management planning for the sampled areas, but specific sources, input fluxes, and intervention effectiveness require further investigation.
1. Introduction
Multifunctional urban lakes are important components of blue–green infrastructure because they provide ecosystem services that support environmental sustainability and urban liveability. These water bodies can contribute to stormwater storage, urban flood mitigation, microclimate regulation, biodiversity conservation, recreation, landscape enhancement, and human well-being [1,2,3]. Protecting their environmental quality is therefore important for integrated urban-water management and climate-resilience planning. However, rapid urbanisation and associated land-use changes increasingly expose urban lakes to shoreline modification, stormwater runoff, untreated wastewater discharge, intensive human use, and inadequate solid-waste management, potentially compromising their intended hydrological, environmental, and social functions [1,2,3].
Plastic pollution is a particular concern because urban lakes can receive and retain mismanaged waste originating from their densely populated surroundings. Plastic debris may enter these water bodies through stormwater runoff, direct littering, illegal dumping, wastewater-related discharges, and wind-driven transport [4,5,6]. Residential, commercial, food-service, and recreational activities may further increase the use and disposal of short-lived plastic products near urban waters. Consequently, the same urban environment that benefits from a multifunctional lake’s services may also generate pressures that threaten its environmental quality, landscape value, recreational use, and sustainable management.
Plastic pollution may manifest differently across physical compartments. Floating or wind-driven macroplastics may be transported towards and retained along shorelines [4,6,7], whereas dense objects or items whose effective density increases through aggregation or biofouling may accumulate in bottom environments [7,8,9,10]. These distributions are influenced by interactions among water movement, wind, lake morphology, aquatic vegetation, and the physical properties of plastic items [4,7,8,9]. Environmental exposure may also promote weathering and fragmentation [6,8,9,11]. Shoreline accumulation and bottom-deposited litter therefore provide distinct but complementary evidence of plastic retention within the same lake. Assessing both compartments can reveal contrasts in product composition, size structure, abundance, and mass that would remain obscured in a single-compartment survey.
Previous freshwater studies have documented plastics in surface waters, shoreline zones, bottom sediments, and floodplain lakes [10,11,12,13]. Nevertheless, comparison across physical compartments remains constrained by differences in sampling designs, particle-size definitions, classification systems, and reporting metrics [11,13]. Research has also frequently focused on individual matrices or specific particle-size fractions, producing fragmented evidence on the storage of larger plastic litter within freshwater systems [10,11,13]. This limitation is particularly relevant to tropical urban waters in Southeast Asia, where rapid development, surface runoff, hydrological variability, intensive human activities, and waste-management constraints create multiple pressures for plastic entry and accumulation [14,15,16]. The present study addresses the need for compartment-specific observations that can be interpreted using a common classification and reporting framework. Its contribution is empirical rather than the development of a new sampling method or pollution index: shoreline and bottom-deposited macroplastic assemblages within the same tropical urban lake are characterised using consistent material categories, functional product groups, maximum linear dimensions, and abundance- and mass-based metrics. This framework allows differences in the recovered product assemblages and the influence of bulky items on mass composition to be described alongside numerical abundance. The resulting synthesis concerns selected accumulation areas and does not establish lake-wide representativeness or direct transport between compartments.
Bung Xang Lake is a multifunctional urban lake located in the densely urbanised centre of Can Tho City in the Vietnamese Mekong Delta. With a surface area of approximately 180,000 m2, the lake is officially recognised for its contributions to stormwater storage, urban flood mitigation, microclimate regulation, and landscape enhancement [17]. It also supports walking, exercise, recreation, fishing, community activities, and food-service-related socioeconomic activities. At the same time, surrounding residential, commercial, food-service, transport, and recreational activities, together with stormwater and wastewater-discharge interfaces and waste-management constraints, create potential pressures for plastic entry and accumulation. This coexistence of important urban functions and intensive anthropogenic pressures makes Bung Xang Lake a relevant case study for comparing shoreline accumulation with plastic retained in a sampled bottom-deposition area.
Accordingly, this study aimed to assess plastic pollution in two physical compartments of Bung Xang Lake: the engineered shoreline and a sampled bottom-deposition area. Specifically, the study aimed to: (i) characterise surrounding anthropogenic activities, waste-management conditions, and potential plastic-input interfaces; (ii) quantify the composition, abundance, dry mass, size distribution, spatial variation, and pollution intensity of litter accumulated along the shoreline and retained within the sampled bottom-deposition area; and (iii) synthesise the compartment-specific observations to discuss management considerations and monitoring needs within the scope of the sampled shoreline sections and bottom-deposition area.
2. Materials and Methods
2.1. Study Area
Bung Xang Lake is a multifunctional urban lake located in Ninh Kieu Ward, Can Tho City, Vietnam (Figure 1a). With a surface area of approximately 180,000 m2, it is one of 63 lakes, canals, and channels officially designated as water bodies that must not be reclaimed within Can Tho City. The lake contributes to the city’s blue–green infrastructure and provides multiple urban functions, including stormwater storage, flood mitigation, microclimate regulation, landscape enhancement, and recreational space [17]. It is situated within a densely populated area surrounded by residential neighbourhoods, commercial and food-service establishments, roads, and public spaces used for recreation and fishing. These intensive and overlapping land uses exert substantial anthropogenic pressure on the lake environment.
Figure 1.
Study area and spatial sampling design for macroplastic assessment in Bung Xang Lake, Can Tho City, Vietnam. (a) Locations of the shoreline (Sites 1–3) and bottom-deposition (Site 4) sampling sites; (b–d) arrangement of shoreline sampling transects at Sites 1, 2, and 3, respectively; and (e) arrangement of bottom-deposition sampling transects at Site 4. Transect layouts are schematic and not to scale.
Previous studies have reported impaired water quality in Bung Xang Lake and identified domestic and commercial wastewater inputs, together with the absence of centralised wastewater treatment, as important environmental pressures [18,19]. Local studies have also documented visible litter accumulation and difficulties with routine waste removal along the lakeside embankment [20,21]. The engineered lakeshore includes more than 2.5 km of embankment, with sections of the pedestrian walkway located approximately 1 m below the adjacent road surface. These low-lying sections are periodically inundated during high-water and tidal events. Local reports indicate that rising water can transport floating litter towards the shoreline, where debris becomes trapped behind the lakeside railing and remains on the walkway when routine removal is limited [19,21]. Surface runoff from the adjacent road and surrounding urban area may provide an additional pathway for land-based debris to reach the shoreline.
Regional climatological data indicate that March, the month in which shoreline macroplastic sampling was conducted, is characterised by predominantly easterly winds. The mean hourly wind speed during March is approximately 4.52 m s−1, while the highest daily average reaches approximately 4.60 m s−1 [22]. Wind-driven surface transport, water-level fluctuations, periodic inundation, and the low elevation of the walkway may therefore favour the redistribution and retention of floating litter along particular shoreline sections. We considered these conditions when identifying shoreline areas with litter-accumulation and trapping characteristics. However, wind speed, wind direction, and water level were not measured concurrently during sampling; consequently, their individual contributions to the observed accumulation patterns were not quantified.
Near the downstream end of the lake, the water body narrows towards its outlet, and the bottom is predominantly muddy, creating physical conditions potentially conducive to litter retention and deposition. Collectively, the surrounding land uses, engineered shoreline, hydrological setting, and depositional characteristics make Bung Xang Lake an appropriate system for assessing plastic pollution across the shoreline and sampled bottom-deposition compartments.
2.2. Contextual Field Survey of Anthropogenic Pressures and Potential Plastic Inputs
A qualitative contextual field survey was conducted on 23 November 2025 along approximately 994 m of the Bung Xang Lake shoreline, approximately 20 months after the March 2024 litter-sampling campaign. The survey documented surrounding land uses, waste-management conditions, and potential plastic-input and retention interfaces observed in November 2025. Because these observations were not contemporaneous with litter sampling, they were not used to reconstruct the March 2024 conditions, attribute the collected litter to specific sources, or establish the transport processes responsible for its accumulation. The surveyed shoreline length was determined using the distance-measurement tool in Google Earth (web-based version; https://earth.google.com/web/, accessed on 25 November 2025). Observations were recorded in field notebooks and supported by photographs. Individual residential, commercial, and food-service establishments were neither enumerated nor georeferenced; consequently, the survey provided qualitative context rather than quantitative measures of anthropogenic pressure. The survey did not systematically quantify population density, waste-generation rates, drainage-outlet numbers or discharge rates, commercial activity, or the provision and service frequency of waste-management infrastructure. Consequently, these observations could not be used to quantify source contributions or explain spatial differences in the March 2024 litter inventory. Such interpretation would require quantitative information matched to the spatial extent and timing of litter sampling.
The survey documented land uses and activities potentially associated with the generation of disposable products and solid waste, including residential neighbourhoods, restaurants, cafés, beverage shops, street-food vendors, public green spaces, recreational areas, walking, exercise, fishing, and community gatherings. Waste-management conditions were characterised by recording the presence or absence of public waste bins, roadside and temporary waste-storage locations, scattered or improperly discarded litter, and waste occurring near designated “No dumping” areas. These observations described the anthropogenic pressures and waste-management context surrounding the lake rather than linking individual litter items to specific activities, establishments, or disposal events.
The shoreline and adjacent lake surface were also visually inspected for potential plastic-input and retention interfaces, including stormwater and drainage connections, surface-runoff pathways, areas affected by water-level fluctuations or inundation, floating and stranded litter, and debris retained within aquatic vegetation, particularly water hyacinth (Eichhornia crassipes). The 2025 observations were therefore treated as contextual evidence of potential plastic-input and retention conditions and not as contemporaneous evidence of the sources or transport processes responsible for the litter collected in March 2024.
2.3. Sampling Strategy
The study comprised two complementary sampling components: (i) shoreline litter accumulation at three sites (Sites 1–3) and (ii) bottom-deposited litter within one sampled area exhibiting depositional characteristics (Site 4) (Figure 1). We adapted the shoreline litter-sampling design from the shoreline-monitoring approaches described by the National Oceanic and Atmospheric Administration (NOAA) [23] and Cuong et al. [24] to accommodate the engineered lakeshore. We then modified the transect-based framework to establish standardised sampling units within the selected bottom-deposition area. Four transects were established at each shoreline site and within the bottom site, and samples were retained separately by transect. Both surveys targeted larger plastic litter using an operational lower size threshold of >25 mm in maximum linear dimension, consistent with the >2.5 cm collection threshold described in the UNEP/IOC beach-litter guidelines [25]. This threshold defined the survey scope rather than a validated detection limit. The manual collection procedure did not include systematic sieving or extraction of smaller particles. Items ≤ 25 mm, including mesoplastics in the 5–25 mm range and smaller particles, were therefore outside the sampling scope. Their exclusion limits characterisation of the overall plastic burden: the reported abundance, mass, and size distributions describe only the recovered macroplastic inventory and cannot be used to estimate plastic quantities across all size fractions. The spatial coverage comprised 210 m2 of shoreline walkway distributed across three purposively selected sites and 186 m2 within one selected bottom-deposition area. These distinct sampling environments were analysed separately; their surveyed areas were not combined to estimate lake-wide coverage or plastic stock. The design was sufficient to describe the recovered litter within the selected areas, but not to characterise plastic pollution across the approximately 180,000 m2 lake. Accordingly, the findings were restricted to the sampled shoreline sections and bottom-deposition area and were not extrapolated to the entire shoreline or lake bottom. The two components provided complementary observations but were not spatially or temporally paired to establish transport or fragmentation between compartments.
The shoreline and bottom surveys were conducted sequentially during a single sampling campaign in March 2024 because available personnel were insufficient for simultaneous sampling. Shoreline sampling began on 17 March and required three field days, with one site surveyed per day, followed by two days of sample processing. Bottom sampling was conducted on 22 March. This schedule introduces temporal uncertainty into comparisons among shoreline sites and between compartments. Although the surveys measured accumulated litter stocks, the residence times of individual items were unknown, and hydrological changes could have affected transport, retention, exposure, and recoverability during the campaign. Concurrent water-level and flow measurements were unavailable, so these effects could not be quantified or assumed to be negligible. Differences between the recovered assemblages therefore cannot be attributed solely to spatial or compartment characteristics or interpreted as evidence of direct transport between compartments. The absence of repeated campaigns also prevents assessment of seasonal variability, annual average conditions, accumulation rates, or temporal persistence.
2.3.1. Shoreline Litter Sampling
The shoreline sampling design was adapted from the NOAA shoreline litter-monitoring framework [23] and the approach described by Cuong et al. [24]. These approaches use four 5-m-long transects positioned parallel to the shoreline within a 100-m survey section, with the sampling width extending across the zone between the waterline and the landward boundary. At Bung Xang Lake, the design was modified to accommodate the engineered shoreline, which consists of a paved pedestrian walkway located below the adjacent road surface and subject to periodic inundation. The sampling width was therefore defined as the entire 3.5-m width of the walkway, while the 5-m transect length and four-transect design were retained. Each transect consequently covered 17.5 m2 (3.5 m× 5 m).
Three shoreline sites (Sites 1–3; Figure 1a) were purposively selected to encompass spatially separated sections of the engineered shoreline where litter accumulation and trapping were evident and where standardised transects could be safely established. The selection also considered the low elevation and periodic inundation of the walkway and the surrounding residential, commercial, food-service, and recreational activities. These characteristics were treated as potential contextual influences on litter delivery and retention rather than as demonstrated causes of the observed accumulation.
Shoreline sampling began on 17 March 2024 and was conducted over three field days, with one site surveyed per day. Four transects were sampled at each site, producing 12 shoreline transects and a total surveyed area of 210 m2. Within each transect, all litter items > 25 mm occurring on the walkway surface were manually collected. Items ≤ 25 mm were outside the operational sampling scope. Samples from each transect were stored separately in sealed, clearly labelled bags to preserve the identity of the sampling units during subsequent processing and analysis. Because the three sites were purposively selected for evident litter accumulation and trapping, shoreline sections with little or no visible litter were not adequately represented. This selection may yield higher accumulation estimates than a shoreline-wide probability-based survey. The resulting measurements therefore characterise plastic composition, abundance, and mass within the sampled accumulation areas; they do not provide an unbiased estimate of average shoreline conditions or the total shoreline plastic stock and were not extrapolated to the entire lake shoreline.
Each shoreline site comprised four consecutive transects that characterised local within-site variation. Because adjacent transects may share litter inputs and retention conditions, their spatial independence cannot be assumed. Treating these transects as independent replicates in between-site comparisons introduces a risk of pseudoreplication: the four transects do not constitute four independent replicates of each shoreline setting. The small number of transects and unquantified spatial dependence therefore constrain between-site inference.
2.3.2. Bottom Litter Sampling
Bottom litter was sampled at Site 4, a single area near the downstream end of Bung Xang Lake, where the lake narrows towards its outlet and the bottom is predominantly muddy (Figure 1a). This area was purposively selected because its physical setting exhibited characteristics potentially conducive to litter retention and deposition. The transect framework used for the shoreline survey was modified to establish standardised sampling units for assessing visible and partially exposed litter within this selected bottom area; it was not treated as a validated whole-lake bottom-litter survey design.
Four parallel transects were positioned perpendicular to the shoreline. Each transect extended 9.3 m from the embankment towards the low-water boundary and was 5 m wide, resulting in an area of 46.5 m2 per transect and a total surveyed bottom area of 186 m2 (Figure 1e). Sampling was conducted on 22 March 2024.
Within each transect, visible litter items > 25 mm on the sediment surface were manually recovered. Partially buried items were collected only when an exposed portion allowed recognition, and the object could be retrieved. Some recovered objects extended to an estimated maximum depth of approximately 20 cm below the sediment surface; this described the extent of individual recovered objects and was not a standardised excavation depth. Sediment was neither systematically excavated nor sieved, and fully buried litter was not systematically searched for. Detection and recovery therefore depended on item visibility and accessibility, potentially underrepresenting buried or less readily recoverable objects and biasing the observed product and size composition. Detection and recovery efficiencies were not quantified, so the magnitude of this bias could not be estimated. Items ≤ 25 mm were outside the operational sampling scope. Samples from each transect were stored separately in sealed, clearly labelled bags for subsequent processing and characterisation. Accordingly, the survey quantified only visible and partially exposed litter > 25 mm within the surveyed bottom area of 186 m2. The four adjacent transects were local sampling units within a single purposively selected deposition area, rather than independent sites distributed across the lake bottom. Their measurements describe the composition, abundance, mass, and size characteristics of the recovered litter within that area; they do not provide a representative estimate of average lake-bottom conditions, the complete buried litter inventory, or the total lake-bottom plastic stock. The findings were therefore not extrapolated to the entire lake bottom.
2.4. Shoreline and Bottom Litter Processing and Characterisation
All litter samples were processed separately by transect to preserve the identity of the sampling units. Shoreline items were cleaned by manually removing adhering soil, decomposed leaves, aquatic vegetation, and other organic materials. Bottom items were rinsed with water to remove adhering sediment and mud. After cleaning, the items were counted and their dimensions were measured before drying. Samples from both compartments were then sun-dried until visibly dry and subsequently oven-dried at 85 ± 5 °C using a UN110 drying oven (Memmert GmbH + Co. KG, Schwabach, Germany) to remove residual moisture before dry-mass determination.
Each item was examined individually and assigned to a recognisable discarded-product type. Items for which the original product identity could not be determined because of fragmentation, degradation, or ambiguous characteristics were recorded under the product type “Other/Unidentified.” Product identification and grouping were informed by the NOAA, UNEP/IOC, and OSPAR litter-monitoring frameworks [23,25,26] and adapted to the products encountered in Bung Xang Lake.
Each item was assigned to one of the following mutually exclusive material categories: Plastics, Paper/Cardboard, Metal, Glass/Ceramics, Wood, Textiles, Rubber, Composite/Multilayer, Electrical/Electronic, Hazardous/Medical, or Other. An item was classified as Plastics when a synthetic polymer constituted its principal structural material, and any non-plastic components were minor and ancillary. Products composed of substantial, inseparable combinations of plastic and other materials were classified as Composite/Multilayer, whereas electrical/electronic and hazardous/medical products were assigned to their respective categories. Accordingly, blister packs and multilayer beverage cartons were classified as Composite/Multilayer; power banks as Electrical/Electronic; and predominantly polymer-based products, including the disposable face masks, polyethylene (PE) foam mattress and plastic sandals, as Plastics. For products that could not be physically separated, the dry mass of the entire product was attributed to its assigned material category rather than apportioned among its constituent materials.
Items classified as Plastics were further assigned, according to their identifiable original use, to one of six mutually exclusive functional product groups: Packaging Plastics, Food and Beverage Plastics, Household and Personal-care Plastics, Medical and Pharmaceutical Plastics, Agricultural and Gardening Plastics, and Fragmented/Unidentified Plastics. We assigned general packaging items for which we could not reliably identify a more specific use to Packaging Plastics, whereas fragments whose original products or uses could no longer be determined were assigned to Fragmented/Unidentified Plastics. The same classification criteria and item-assignment rules were applied to shoreline and bottom plastics. This functional classification was used to characterise product-use composition and not to attribute individual items to particular emission sources.
Before drying, we measured the length and width of each item in centimetres using a measuring tape. We retained the larger of the two measurements as the maximum linear dimension and converted it to millimetres for size-distribution analyses. Following oven drying, each item was weighed using an Ohaus NV2201 electronic balance (Ohaus Corporation, Parsippany, NJ, USA; maximum capacity: 2200 g; readability: 0.1 g). Items exceeding the capacity of this balance were weighed using an NHS-5 mechanical spring scale (Nhon Hoa, Ho Chi Minh City, Vietnam; maximum capacity: 5 kg; scale division: 20 g). We recorded product identity, material category, plastic functional group, transect of origin, dimensions, and dry mass for each item to produce the item-level dataset used in subsequent analyses.
2.5. Data Analysis and Pollution Assessment
Data were analysed separately for the shoreline and sampled bottom-deposition area according to their respective sampling designs. Both litter datasets were analysed using a common framework based on product identity, material category, functional plastic product group, item abundance, dry mass, maximum linear dimension, Abundance density, Mass density, and operationally applied pollution indices.
The Clean Coast Index (CCI) was applied as a supplementary descriptor of shoreline cleanliness based on the density of recovered plastic items. The Plastic Abundance Index (PAI) was used to assess plastic-specific litter abundance along the shoreline and was operationally adapted, on an exploratory basis, to the sampled bottom-deposition area. Because the two components differed in sampling design and sampled area, their numerical results were analysed separately and were not combined into a single pollution metric.
2.5.1. Macroplastic Metrics and Size Analysis
Shoreline and bottom litter were analysed separately according to their respective sampling designs. Product and material composition were first characterised for the complete litter inventory, after which analyses of functional product groups, product types, size, Abundance density, and Mass density were restricted to items classified as Plastics.
For the most abundant plastic product types, maximum linear dimensions were summarised using minimum, maximum, mean, standard deviation, median, and coefficient of variation. The coefficient of variation was calculated as the standard deviation divided by the mean and multiplied by 100.
For a given product type, material category, or plastic functional group i, relative abundance was calculated as:
where RAi is the relative abundance (%) of category or product type i, Ni is the number of items assigned to category or product type i, and Nref is the relevant reference total. For analysis of the complete litter inventory, Nref was the total number of plastic and non-plastic litter items in the corresponding shoreline or bottom dataset. For analyses restricted to plastics, Nref was the total number of items classified as Plastics in the corresponding dataset.
The relative mass contribution of category or product type i was calculated as:
where RMi is the relative mass contribution (%) of category or product type i, Mi is the total dry mass of items assigned to category or product type i, and Mref is the corresponding reference dry mass. For analyses of the complete litter inventory, Mref was the total dry mass of all plastic and non-plastic litter items. For plastic-specific analyses, Mref was the total dry mass of items classified as Plastics.
A sensitivity analysis was conducted to assess the influence of the single 4.720-kg PE-foam mattress on shoreline plastic mass composition. Its mass was subtracted from both the Household and Personal-care Plastics group and the total shoreline plastic mass, and the relative mass contributions of all functional groups were recalculated. The complete inventory was retained as the primary result.
The occurrence of each shoreline litter product type among the sampling transects was calculated as:
where Oi is the occurrence (%) of product type i, Ti is the number of shoreline transects in which product type i was recorded, and T is the total number of shoreline transects surveyed (T = 12). Occurrence describes the spatial frequency of a product type across transects and is distinct from its relative abundance in the pooled shoreline inventory.
Items classified as Plastics were further aggregated into six mutually exclusive functional product groups: Packaging Plastics, Food and Beverage Plastics, Household and Personal-care Plastics, Medical and Pharmaceutical Plastics, Agricultural and Gardening Plastics, and Fragmented/Unidentified Plastics [23,25,26]. The classification criteria and item-assignment rules described in Section 2.4 were applied consistently to shoreline and bottom plastics. Relative abundance and relative mass contribution were calculated for each represented functional group using Equations (1) and (2), with the total number and total dry mass of plastic items serving as the respective reference totals.
The maximum linear dimension of each plastic item was determined from its measured length and width:
where Lmax is the maximum linear dimension of the plastic item, L is its measured length, and W is its measured width.
Lmax = max (L,W)
For descriptive comparison, the broad distinction among mesoplastics (5–25 mm), macroplastics (25–1000 mm), and megaplastics (>1000 mm) followed UNEP (2020) [27]. Within the macroplastic range, this study used descriptive groups of small (25–100 mm), medium (100–500 mm), and large (500–1000 mm) items. To provide greater resolution, the small and medium groups were further subdivided into 25–50, 50–100, 100–200, and 200–500 mm classes.
Operationally, the size intervals were defined as >25–≤50, >50–≤100, >100–≤200, >200–≤500, >500–≤1000, and >1000 mm. The abbreviated labels 25–50, 50–100, 100–200, 200–500, 500–1000, and >1000 mm were used in tables and figures. These subdivisions were used for study-specific descriptive purposes and were not treated as additional standardised UNEP size categories. Because the field survey targeted items > 25 mm, items measuring ≤ 25 mm, including mesoplastics, were outside the operational sampling range and were not included in the analysis.
To characterise continuous size distributions without imposing additional size classes, empirical cumulative distribution functions (ECDFs) were constructed using the maximum linear dimension of each plastic item. For a group g containing ng measured items, the ECDF was calculated as:
where Fn,g(x) is the cumulative proportion of plastic items in group g with a maximum linear dimension less than or equal to x; Xk,g is the maximum linear dimension of plastic item k in group g; ng is the total number of plastic items measured in that group; 1/ng is the normalisation factor used to convert the cumulative number of qualifying items into a cumulative proportion; and I is an indicator function that equals 1 when Xk,g ≤ x and 0 otherwise. For the shoreline assessment, group g represented one of the three shoreline sites. Item-level measurements from the four transects within each site were pooled to construct separate descriptive ECDFs for Sites 1, 2, and 3, while transect identity was retained in the dataset. For the bottom assessment, group g represented an individual bottom transect, and a separate ECDF was constructed for each of the four transects. The ECDFs were used to describe differences in the location, spread, and upper tails of the observed size distributions. Because the ECDFs were used solely for descriptive comparison, differences among shoreline sites or bottom transects were not subjected to formal statistical testing.
Macroplastic pollution intensity within each transect was quantified using Abundance density and Mass density:
where DA is Abundance density (items m−2), DM is Mass density (g m−2), NP is the number of plastic items recorded within the transect, MP is their total dry mass (g), and A is the sampled transect area (m2). The sampled area was 17.5 m2 for each shoreline transect and 46.5 m2 for each bottom transect.
2.5.2. Macroplastic Pollution Indices and Statistical Analysis
The Clean Coast Index (CCI), originally developed by Alkalay et al. (2007) [28] and subsequently applied by Rangel-Buitrago et al. (2021) [29], was used as an operational indicator of shoreline cleanliness based on plastic-item density. The CCI was calculated separately for each shoreline transect as:
where NP is the number of plastic litter items recorded within the shoreline transect, A is the sampled area (m2), and 20 is the scaling coefficient used in the original index. CCI values were classified as Very Clean (0 ≤ CCI ≤ 2), Clean (2 < CCI ≤ 5), Moderate (5 < CCI ≤ 10), Dirty (10 < CCI ≤ 20), or Extremely Dirty (CCI > 20) [28].
Because the CCI is based directly on plastic-item density, the Plastic Abundance Index (PAI) proposed by Rangel-Buitrago et al. (2021) [29] was additionally applied to relate plastic abundance to the total litter inventory within the sampled area. PAI was calculated as:
where NP is the number of plastic litter items, NT is the total number of litter items, including plastic and non-plastic items, A is the sampled area (m2), log10 is the base-10 logarithm, and 20 is the index scaling coefficient. PAI values were classified as Very Low Abundance/Absence (PAI = 0), Low Abundance (0 < PAI ≤ 1), Moderate Abundance (1 < PAI ≤ 4), High Abundance (4 < PAI ≤ 8), or Very High Abundance (PAI > 8) [29].
CCI and PAI were calculated separately for each shoreline transect as supplementary index-based descriptors. Abundance density was the primary count-based metric; the indices were not treated as independent evidence of pollution intensity. The two indices were not treated as statistically independent because both incorporate the number of plastic items recorded within the sampling unit.
CCI was restricted to the shoreline survey because manual collection of visible plastic items within a defined surface area provided the plastic-item density required by its formulation [28]. Its use on the paved, periodically inundated walkway was an operational adaptation, not a validation of the index for urban-lake shorelines. The original equation and classification thresholds were retained as a supplementary reporting framework, while Abundance density remained the primary count-based metric. Differences in substrate, inundation, and litter retention limit direct comparison with natural beaches. The classifications also apply only to items > 25 mm within the purposively selected sampling areas and do not represent lake-wide cleanliness or validated ecological condition.
PAI was calculated separately for shoreline and bottom transects using the original equation and thresholds proposed by Rangel-Buitrago et al. (2021) [29], with sampled areas of 17.5 and 46.5 m2 per transect, respectively. Its application to bottom-deposited litter was exploratory because the beach-derived thresholds have not been validated for this compartment. Bottom PAI values were therefore retained only as supplementary descriptors of the recovered visible and partially exposed litter inventory, while Abundance density remained the primary count-based metric. PAI does not correct for detection or recovery bias and was not interpreted as a validated measure of lake-bottom pollution severity or ecological risk.
Spatial variation in shoreline macroplastic pollution intensity was evaluated using the Kruskal–Wallis H test. Abundance density and Mass density were compared among shoreline Sites 1, 2, and 3, using the four transects within each site as the sampling units (n = 4 per site). When an overall Kruskal–Wallis test was statistically significant, post hoc pairwise comparisons were performed using Dunn’s test, with p-values adjusted using the Bonferroni correction. Statistical significance was set at p < 0.05. Statistical analyses and boxplots were produced using IBM SPSS Statistics, version 20 (IBM Corp., Armonk, NY, USA).
The between-site tests used transects as observations, but their contiguous arrangement creates a risk of pseudoreplication. Spatial dependence was not quantified or accounted for in these tests, so the independence assumption could not be verified. Together with the small number of transects and the single sampling occasion, this limits between-site inference. The resulting p-values were therefore treated as exploratory outputs rather than evidence of independently replicated site effects, and the observed site ranking was interpreted descriptively without implying temporally persistent differences.
3. Results and Discussion
3.1. Field Evidence of Anthropogenic Pressures and Potential Plastic Inputs
The contextual field survey covered approximately 994 m of the Bung Xang Lake shoreline within a densely used urban area characterised by overlapping residential, commercial, food-service, and recreational activities (Figure 2a). Residential neighbourhoods were interspersed with restaurants, cafés, beverage shops, and street-food vendors, particularly along the Bung Xang Night Food Street. Public green spaces and small parks also supported walking, exercise, fishing, and community gatherings. These observations demonstrate the intensive and multifunctional use of the lakeshore and the widespread occurrence of activities involving disposable food, beverage, and packaging products near the lake.
Figure 2.
Field evidence of anthropogenic pressures, waste-management conditions, and potential plastic-input and retention interfaces along Bung Xang Lake: (a) location and extent of the approximately 994-m shoreline survey; (b) waste stored in an expanded-polystyrene container; (c) waste bags placed along the roadside; (d) litter accumulation near a “No dumping” sign; and (e) plastic debris retained among dense mats of water hyacinth within the lake.
During the survey on 23 November 2025, no public waste bins were recorded along the approximately 994-m route. Waste was stored in expanded-polystyrene containers and plastic bags placed along roadsides and beneath trees (Figure 2b,c). Scattered litter and localised waste accumulations were also present on pavements, grass-covered areas, and other locations adjacent to the lake, including areas near installed “No dumping” signs (Figure 2d). Food-service and recreational uses of the lakeshore therefore coexisted with limited public waste-containment infrastructure, roadside waste storage, and scattered litter close to the lake.
Plastic litter was visible both along the shoreline and within the lake. Floating and stranded plastic items occurred in nearshore areas, while additional plastic debris was retained among dense mats of water hyacinth (Eichhornia crassipes) covering portions of the lake surface (Figure 2e). Roadside waste storage, scattered shoreline litter, runoff and drainage interfaces, and debris retained within nearshore vegetation occurred in close spatial proximity. These observations identify plausible interfaces through which mismanaged plastic waste may enter, accumulate within, or be retained by the lake environment.
The November 2025 survey describes the lakeside activities, waste-management conditions, and potential plastic-input and retention interfaces observed at that later date. Their presence or intensity during March 2024 was not established. Accordingly, these observations provide qualitative context for the study area but are not evidence of the specific sources or transport pathways responsible for the litter collected in 2024. Interpretation of the March 2024 litter assemblages is therefore based on the sampled items and their measured characteristics.
3.2. Characteristics of Shoreline Litter and Macroplastic Accumulation
3.2.1. Diversity and Composition of Shoreline Litter Items
A total of 37 discarded-item categories were identified in the shoreline litter inventory, indicating a compositionally diverse but strongly uneven assemblage (Figure 3). Styrofoam boxes were the most abundant category, accounting for 32.85% of all recorded shoreline litter, followed by plastic bags (25.42%) and foam food containers (19.37%). Together, these three categories represented 77.64% of the total inventory, demonstrating that shoreline accumulation was numerically dominated by a small number of packaging and consumer products despite the broad range of items recorded.
Figure 3.
Relative abundance (bars) and occurrence frequency (line) of shoreline litter item categories recorded across the 12 shoreline transects of Bung Xang Lake. Relative abundance represents the percentage of each item category relative to the total number of shoreline litter items collected, whereas occurrence frequency represents the percentage of transects (n = 12) in which each category was recorded.
Styrofoam boxes, plastic bags, and foam food containers were each recorded in all 12 shoreline transects, indicating that the three numerically dominant categories were also consistently distributed across the surveyed shoreline. Clear plastic cups and plastic bottles each occurred in 75.00% of the transects, followed by plastic straws (58.33%), clear plastic cup lids (50.00%), and plastic spoons (33.33%). In contrast, 17 categories each accounted for approximately 0.08% of the total inventory and occurred in only one transect. These rare categories included batteries, blister packs, beverage cartons, personal-care containers, footwear, and a power bank. Relative abundance and occurrence frequency therefore provided complementary information: the former identified the product categories contributing most strongly to the accumulated inventory, whereas the latter described how consistently they occurred across the surveyed transects.
The dominant product categories were broadly consistent with packaging, food-service, beverage, retail, and household uses present within the surrounding urban setting. However, product identity does not establish the source or entry location of an individual item because the survey quantified accumulated litter rather than directly observed disposal events. The observed assemblage may also have been modified after entry into the lake. Lightweight expanded polystyrene (EPS) products, plastic bags, and other thin plastic items can be redistributed by wind and surface flow and retained along shoreline margins or within aquatic vegetation [4,7]. Shorelines may consequently function as temporary accumulation zones from which litter can be remobilised when water level, wind, or flow conditions change [4,30]. Comparable freshwater studies indicate that litter composition and spatial occurrence may reflect the combined influence of surrounding human activities, waste-management conditions, transport, and selective retention [13,30,31]. The observed product composition should therefore be interpreted as the accumulated shoreline assemblage under the sampled conditions rather than as a direct inventory of local waste-generation sources.
Overall, the shoreline inventory comprised a small number of abundant, spatially widespread products alongside a long tail of rare or locally occurring items. Styrofoam boxes, plastic bags, and foam food containers were the principal recurring components based on both relative abundance and occurrence across all 12 transects. The distinction between Styrofoam transport or storage boxes and foam food containers was retained because, although both may be composed of expanded polystyrene, they represent different product uses. Section 3.2.3 further considers their potential sources, environmental behaviour, and management implications.
3.2.2. Material Categories and Plastic Product Groups
Plastic overwhelmingly dominated the shoreline litter collected across the 12 transects of Bung Xang Lake, accounting for 99.19% of total item abundance and 95.63% of total dry mass (Figure 4a,b). All other material categories individually represented less than 1% of total item abundance: Glass/Ceramics accounted for 0.40%, Composite/Multilayer for 0.16%, and Metal, Electrical/Electronic, and Hazardous/Medical for 0.08% each. Their dry-mass contributions differed from their numerical representation. In particular, Electrical/Electronic litter, represented by a single power bank, accounted for only 0.08% of total item abundance but contributed 3.56% of total litter dry mass. Glass/Ceramics, Hazardous/Medical, Composite/Multilayer, and Metal contributed 0.27%, 0.23%, 0.19%, and 0.11% of total dry mass, respectively. These results show that item abundance represents the numerical prevalence of litter categories, whereas dry mass captures the disproportionate contribution of uncommon but relatively heavy objects.
Figure 4.
Relative composition of shoreline litter collected across the 12 transects of Bung Xang Lake: (a) material composition based on item abundance; (b) material composition based on dry mass; (c) functional plastic product-group composition based on item abundance; and (d) functional plastic product-group composition based on dry mass. Panels (a,b) were calculated relative to the complete shoreline litter inventory, whereas panels (c,d) were calculated using only items classified as Plastics.
The numerical dominance of plastics is consistent with their widespread occurrence in freshwater environments, where bags, bottles, and packaging products are commonly reported in surface-water, shoreline, and sediment compartments [13]. The extensive use and environmental persistence of plastics, together with the relatively low unit mass and transportability of many common plastic products, may contribute to their prevalence in aquatic environments [4]. Nevertheless, the high proportion of plastics recorded at Bung Xang Lake does not identify the particular sources or transport pathways responsible for their shoreline accumulation.
Within the plastic fraction, Food and Beverage Plastics dominated item abundance, accounting for 71.44% of all plastic items, followed by Packaging Plastics at 26.12% (Figure 4c,d). Together, these two functional groups represented 97.56% of plastic-item abundance. Their numerical dominance reflected the frequent occurrence of Styrofoam boxes, foam food containers, plastic bags, cups, lids, bottles, straws, and spoons. These functional groups describe identifiable product uses rather than emission sources. Household, commercial, food-service, and recreational activities are possible origins of such products, while direct littering, runoff, drainage, and subsequent redistribution are possible entry or transport pathways. These explanations remain hypothetical because individual items were not traced to their origins and source contributions and transport processes were not measured. The November 2025 contextual survey also cannot establish the sources operating during the March 2024 sampling.
The dry-mass composition showed a contrasting pattern. Food and Beverage Plastics contributed 35.35% of total plastic dry mass, and Packaging Plastics contributed 7.81%, whereas Household and Personal-care Plastics represented only 0.41% of plastic-item abundance but accounted for 56.24% of plastic dry mass. This disproportionate contribution was primarily caused by a single PE-foam mattress weighing 4.720 kg and should not be interpreted as evidence of frequent disposal of household products.
The mattress accounted for 54.77% of total shoreline plastic dry mass. In a sensitivity analysis excluding this item, total plastic dry mass decreased from 8617.24 to 3897.24 g, and the mass contribution of Household and Personal-care Plastics decreased from 56.24% to 3.24%. Food and Beverage Plastics became the dominant mass contributor (78.16%), followed by Packaging Plastics (17.26%). These results confirm that the dominance of Household and Personal-care Plastics in the complete inventory depended on one bulky item and should not be interpreted as a stable compositional pattern beyond the sampling event.
The remaining functional groups contributed relatively little. Fragmented/Unidentified Plastics accounted for 0.90% of plastic-item abundance and 0.09% of plastic dry mass; Medical and Pharmaceutical Plastics accounted for 0.65% and 0.26%, respectively; and Agricultural and Gardening Plastics accounted for 0.49% and 0.26%, respectively. The limited proportion of Fragmented/Unidentified Plastics indicates that most collected plastic items retained sufficient recognisable characteristics for product-level classification under the survey procedure. It does not, however, demonstrate recent deposition or limited environmental weathering because recognisability may also depend on product properties, exposure conditions, fragmentation processes, and survey detectability.
Overall, the combined abundance- and mass-based assessment identified two contrasting features of the shoreline plastic assemblage. Food and Beverage Plastics and Packaging Plastics numerically dominated the recurring plastic inventory, whereas the dry-mass composition was strongly influenced by one uncommon, bulky household item. Item abundance and dry mass therefore provide complementary information: the former characterises frequently accumulated products, while the latter captures the disproportionate material contribution of relatively large or heavy objects.
3.2.3. Dominant Discarded Plastic Products
The distribution of individual plastic products was highly uneven, with a small number of product types accounting for most of the shoreline macroplastic inventory (Figure 5). Styrofoam boxes were the most abundant product, representing 33.12% of all plastic items, followed by plastic bags (25.63%) and foam food containers (19.53%) (Figure 5a). Together, these three products accounted for 78.28% of total plastic-item abundance. Clear plastic cups (4.88%) and plastic straws (3.74%) ranked next, bringing the cumulative contribution of the five leading product types to 86.90%. This product-level distribution explains the numerical dominance of Food and Beverage Plastics and Packaging Plastics reported in Section 3.2.2.
Figure 5.
Relative abundance and dry-mass contributions of discarded plastic product types collected across the 12 shoreline transects of Bung Xang Lake: (a) relative abundance calculated from the total number of plastic items; and (b) relative mass contribution calculated from the total dry mass of plastic items.
Styrofoam boxes and foam food containers together accounted for 52.64% of all shoreline plastic items. Their prominence, along with plastic bags, cups, and straws, was broadly consistent with the food-service, commercial, household, and recreational uses present in the surrounding urban setting. Packaging and other short-lived consumer products are also commonly reported in riverine and shoreline litter assemblages [7,31,32] and may enter freshwater environments through direct littering, surface runoff, inadequately managed waste, and urban drainage systems [4,13,30]. Nevertheless, similarities with products reported elsewhere and plausible input pathways do not establish a direct relationship between the recorded products and any particular activity, location, establishment, or emission source. The contextual survey of surrounding activities was also conducted after the March 2024 litter sampling and therefore cannot identify the contemporaneous sources of the collected products.
The physical characteristics of the dominant products may also influence their transport and accumulation along the shoreline. Expanded-foam products are generally lightweight, buoyant, and bulky relative to their mass, whereas plastic bags have a high surface-area-to-mass ratio. These characteristics can facilitate transport by wind and surface flow and promote interception by shoreline structures or aquatic vegetation [4,7]. Continued environmental exposure may cause photo-oxidative weathering and embrittlement, after which mechanical abrasion can promote fragmentation and potentially generate secondary microplastics [33,34]. The accumulated products may therefore constitute potential precursor materials for smaller plastic particles. However, the study did not quantify degradation or fragmentation rates and provides no evidence linking the sampled macroplastic items to smaller particles within the lake.
Product rankings differed markedly when evaluated by dry mass (Figure 5b). A single PE-foam mattress weighing 4.720 kg accounted for 54.77% of total plastic dry mass despite representing only approximately 0.08% of plastic-item abundance. Styrofoam boxes contributed 19.49% of plastic dry mass, followed by plastic bags (7.75%), foam food containers (7.56%), and plastic bottles (3.84%). Together, these five product types accounted for approximately 93.4% of total plastic dry mass. Item abundance therefore primarily reflected the recurrent accumulation of disposable food-service and packaging products, whereas dry mass was strongly influenced by one bulky household item.
Joint consideration of item abundance and dry mass describes both the numerical prevalence of recurring products and the disproportionate mass contribution of occasional bulky items. These observations may inform the selection of product categories for further management assessment within the sampled areas. However, they do not establish source contributions or demonstrate the effectiveness of source reduction, waste containment, litter interception, or bulky-waste collection. Decisions about these measures require additional evidence on inputs, accumulation over time, and intervention outcomes.
3.3. Size Characteristics of Accumulated Shoreline Macroplastics
The size characteristics of shoreline plastic items reflected the dimensions of the discarded products present in the inventory, potentially modified by environmental transport, retention, weathering, and fragmentation. Table 1 summarises the maximum linear dimensions of the nine most abundant plastic product types, each represented by 19–407 items, thereby characterising the principal recurring products accumulated along the shoreline.
Table 1.
Size characteristics of the nine most abundant plastic product types collected across the 12 shoreline transects of Bung Xang Lake. Each product type was represented by 19–407 items.
Marked product-level differences were observed (Table 1). Styrofoam boxes, the most abundant product (n = 407), ranged from 40 to 690 mm, with a mean maximum linear dimension of 152.10 mm (SD = 87.04 mm), a median of 120 mm, and a coefficient of variation (CV) of 57.23%. Foam food containers (n = 240; 30–300 mm; CV = 49.11%) and clear plastic cups (n = 60; 50–280 mm; CV = 48.32%) also exhibited broad size distributions. Plastic bags (n = 315) were more narrowly distributed between 220 and 390 mm (CV = 20.23%), while plastic straws (n = 46) and plastic spoons (n = 26) showed relatively low variability (CV = 8.57% and 5.84%, respectively), consistent with their comparatively standardised manufactured dimensions. Plastic lids exhibited the greatest relative variability (CV = 80.52%; 28–130 mm), indicating that this category comprised lids of substantially different sizes. These contrasts demonstrate a strong product-specific component in the observed size structure and caution against attributing the overall variability solely to environmental modification after disposal.
The size distribution of the 1229 shoreline plastic items was strongly concentrated within the 50–500 mm range (Figure 6a). The 200–500 mm class contained the largest proportion (n = 494; 40.20%), followed by the 100–200 mm (n = 367; 29.86%) and 50–100 mm (n = 305; 24.82%) classes. Collectively, these three classes contained 1166 items, representing 94.87% of the shoreline plastic inventory. A further 61 items (4.96%) occurred in the 25–50 mm class, whereas only one item each was recorded in the 500–1000 mm and >1000 mm classes (0.08% each).
Figure 6.
Size characteristics of plastic items collected across the 12 shoreline transects of Bung Xang Lake: (a) proportional distribution among size classes based on maximum linear dimension; and (b) empirical cumulative distribution functions of maximum linear dimensions at Sites 1–3. Percentages in panel (a) were calculated relative to the total number of shoreline plastic items examined (n = 1229). Within the operational sampling range, items measuring >25–≤1000 mm were categorised as macroplastics, whereas items > 1000 mm were categorised as megaplastics [27].
According to the broader size categories adopted in this study, small macroplastics (25–100 mm) accounted for 29.78% of the inventory, medium macroplastics (100–500 mm) for 70.06%, large macroplastics (500–1000 mm) for 0.08%, and megaplastics (>1000 mm) for 0.08%. The predominance of the 50–500 mm range corresponded broadly to the dimensions of the dominant products presented in Table 1: plastic bags occurred primarily within the 200–500 mm class, whereas Styrofoam boxes and foam food containers extended across several size classes. The pooled size distribution should therefore be interpreted alongside product composition rather than as evidence of environmental size sorting alone.
The site-specific ECDFs provided a complementary description of spatial variation in the maximum linear dimensions of shoreline plastic items (Figure 6b). All three curves increased steeply across the lower and intermediate portions of the observed size range, consistent with the predominance of items between 50 and 500 mm in the pooled dataset. Site 1 showed a higher cumulative proportion of relatively small items across much of the distribution, whereas Site 2 shifted towards larger dimensions and Site 3 generally exhibited an intermediate pattern. These differences may partly reflect site-level variation in product composition because the dominant product types had inherently different characteristic dimensions. Changes in the relative abundance of plastic bags, Styrofoam boxes, foam food containers, and other products could therefore shift the site-specific ECDFs without requiring hydrodynamic size sorting.
Environmental processes may nevertheless modify this product-related size structure. Item size, shape, density, and buoyancy, along with hydrological conditions, shoreline configuration, vegetation, and hydraulic structures, influence plastic transport and retention [4,7]. Freshwater plastics may be temporarily retained along shorelines or within vegetation and subsequently remobilised as water levels and flow conditions change [4,35,36]. Such processes may have contributed to the observed site-specific ECDF patterns, but the present study did not quantify transport or retention probabilities for individual products or size classes. Moreover, because no inferential test was applied to the size distributions, differences among the ECDFs should be interpreted descriptively rather than as statistically confirmed spatial differences or evidence of hydrodynamic size sorting.
From a management perspective, 94.87% of the surveyed plastic items fell within the 50–500 mm range and were large enough for visual detection and manual removal under the sampling procedure used. This interpretation applies only to the operationally sampled > 25-mm fraction and does not address smaller plastic particles. Removing accumulated macroplastics may reduce the stock of material potentially available for subsequent fragmentation. Solar radiation can promote photo-oxidative degradation and embrittlement, after which thermal stress and mechanical abrasion may fragment them into smaller secondary particles [33,34]. Although these processes were not measured in Bung Xang Lake, they provide a scientific basis for preventive removal of recurrent products such as Styrofoam boxes, foam food containers, plastic bags, cups, and straws before further deterioration occurs.
3.4. Shoreline Macroplastic Pollution Assessment
3.4.1. Macroplastic Pollution Intensity
Shoreline plastic pollution intensity varied descriptively among the three sampling sites when evaluated using Abundance density and Mass density (Table 2; Figure 7). For Abundance density, the central tendency declined from Site 1 to Site 3. Median Abundance density was highest at Site 1, at 8.91 items m−2 (Q1–Q3: 7.93–9.87 items m−2), followed by Site 2 at 5.74 items m−2 (4.07–7.43 items m−2) and Site 3 at 2.31 items m−2 (1.96–3.27 items m−2). The median at Site 1 was approximately 1.6 times that at Site 2 and 3.9 times that at Site 3. The Kruskal–Wallis test indicated overall heterogeneity in the transect-level Abundance density distributions among the sampled sites (H = 7.538, df = 2, p = 0.023).
Table 2.
Shoreline macroplastic Abundance density and Mass density across the three sampling sites of Bung Xang Lake. Values are presented as median (Q1–Q3), with four contiguous transects surveyed at each site (n = 4).
Figure 7.
Spatial variation in shoreline macroplastic pollution intensity among the three sampling sites of Bung Xang Lake: (a) Abundance density (items m−2) and (b) Mass density (g m−2). Boxes represent the interquartile range (Q1–Q3), horizontal lines indicate medians, and whiskers extend to the most extreme observations within 1.5 times the interquartile range. Observations beyond the whiskers are displayed individually as outliers. Overall heterogeneity among sites was assessed using the Kruskal–Wallis test (Abundance density: H = 7.538, df = 2, p = 0.023; Mass density: H = 6.962, df = 2, p = 0.031).
Mass density showed a broadly similar site ranking but greater within-site variability (Table 2; Figure 7b). Site 1 had the highest median Mass density, at 28.79 g m−2 (Q1–Q3: 25.29–103.65 g m−2), followed by Site 2 at 11.03 g m−2 (10.31–11.70 g m−2) and Site 3 at 8.87 g m−2 (7.80–13.04 g m−2). The Kruskal–Wallis test also indicated overall heterogeneity in the transect-level Mass density distributions among sites (H = 6.962, df = 2, p = 0.031). However, none of the post hoc pairwise comparisons were statistically significant after Bonferroni adjustment. The omnibus tests therefore indicated overall heterogeneity in the transect-level distributions, but the adjusted pairwise comparisons did not identify a statistically significant difference between any individual pair of sites.
Although the Kruskal–Wallis tests yielded significant omnibus results, none of the Bonferroni-adjusted pairwise comparisons established a statistically significant difference between Site 1 and either Site 2 or Site 3. Moreover, only four spatially contiguous transects were surveyed per site, and their independence cannot be assumed. These limitations constrain between-site statistical inference. The observed site ranking should therefore be interpreted descriptively and cannot be assumed to persist across seasons or hydrological conditions.
The two metrics reflected different aspects of shoreline plastic accumulation. Abundance density showed a relatively consistent decline in central tendency from Site 1 to Site 3, whereas Mass density at Site 1 exhibited pronounced dispersion. This variability was primarily associated with Transect 1.4, which contained a single PE-foam mattress weighing 4.720 kg. The mattress alone contributed approximately 269.71 g m−2 to that transect’s Mass density and increased its total Mass density to approximately 320 g m−2, while contributing only one item to Abundance density. Abundance density therefore reflected the concentration of individual plastic objects, whereas Mass density was more sensitive to uncommon bulky products.
The recovered product composition suggests possible use-related origins, but it does not explain the higher observed Abundance density at Site 1. Local disposal, runoff or drainage inputs, and redistribution from elsewhere are alternative hypotheses that were not tested. The contextual survey was conducted in November 2025 and cannot establish the input conditions prevailing during March 2024. Accordingly, no specific source or transport pathway can be identified as responsible for the observed site ranking.
The observed shoreline accumulation was also consistent with the physical setting of the sampled sites, where sections of the low-lying walkway are periodically inundated and floating debris may become trapped behind the lakeside railing [19,21]. Predominantly easterly winds and relatively elevated climatological wind speeds during March may additionally facilitate the surface redistribution of floating debris towards particular shoreline sections [22]. Because wind direction, wind speed, and water level were not measured concurrently during sampling, their respective contributions to the observed spatial pattern could not be separated or confirmed quantitatively.
Comparable evidence indicates that local human activities can influence litter inputs along freshwater shorelines and riverbanks [31], while hydrological conditions, riparian vegetation, shoreline characteristics, and hydraulic structures can modify plastic transport and temporary retention [4]. Broader assessments also recognise that interactions between spatially variable inputs and environmental transport processes can generate localised accumulation hotspots [37]. The observed differences among Sites 1–3 may therefore reflect variation in local inputs, redistribution, retention conditions, or their combined effects; the present data do not allow these influences to be distinguished.
Overall, Site 1 had the highest observed median Abundance density and Mass density within the sampled shoreline sections. This descriptive ranking does not establish that Site 1 was significantly more polluted than the other sites, because no Bonferroni-adjusted pairwise comparison was statistically significant. The unusually high Mass density in one transect also illustrates the influence of a single bulky item. Abundance density and Mass density describe different aspects of the recovered inventory, but broader spatial sampling and repeated surveys are required to assess whether the observed ranking is consistent over space and time.
3.4.2. Clean Coast Index (CCI)
The Clean Coast Index indicated poor shoreline cleanliness throughout the surveyed area of Bung Xang Lake (Figure 8). CCI values ranged from 33.14 at Transect 3.4 to 210.29 at Transect 1.4. All 12 transects exceeded the upper classification threshold of 20 and were therefore classified as “Extremely Dirty” [28,29]. Because the CCI was calculated from the number of plastic items per unit area, the results represent an index-based assessment of shoreline cleanliness derived specifically from plastic-item density. Plastics constituted 99.19% of the complete shoreline litter inventory; consequently, the CCI pattern was also broadly representative of the numerically dominant material in the accumulated litter assemblage.
Figure 8.
Transect-level Clean Coast Index (CCI) values across the three shoreline sampling sites of Bung Xang Lake. The horizontal line represents the threshold for the “Extremely Dirty” category (CCI = 20) according to Alkalay et al. (2007) [28]. All 12 shoreline transects exceeded this threshold, although continuous CCI values varied within and among the sampled sites.
Although all transects belonged to the same categorical class, their continuous CCI values varied substantially. Median CCI was highest at Site 1, at 178.29 (Q1–Q3: 158.57–197.43), followed by Site 2 at 114.86 (81.43–148.57) and Site 3 at 46.29 (39.14–65.43). The Site 1 median was approximately 1.55 times that of Site 2 and 3.85 times that of Site 3, while the Site 2 median was approximately 2.48 times that of Site 3. At the transect level, the maximum CCI value was approximately 6.34 times the minimum.
Because CCI is obtained by multiplying plastic-item density by a constant factor of 20, its spatial ranking necessarily corresponds to the Abundance density pattern reported in Section 3.4.1. The CCI results should therefore not be interpreted as an independent line of evidence for spatial heterogeneity. Rather, the index translates the observed plastic-item densities into established shoreline-cleanliness categories that facilitate categorical interpretation.
All transects exceeded the upper CCI threshold, so the categorical classification did not distinguish among their observed plastic densities. Although continuous CCI values varied, they contain the same information as Abundance density multiplied by 20 and provide no independent evidence of spatial variation. The ‘Extremely Dirty’ designation is therefore reported only under the adopted beach-derived framework [28,29]. Because its thresholds have not been validated for the engineered urban-lake shoreline, this designation should not be interpreted as a measure of ecological risk, representative cleanliness of the entire shoreline, or direct equivalence with natural-beach conditions.
The highest CCI values occurred at Site 1, within a shoreline setting characterised by nearby commercial, food-service, recreational, and drainage-related interfaces. Similar spatial variation in litter density has been observed among zones of urban freshwater systems [38]. Human activities and inadequate waste management may contribute plastic inputs [13,31], while runoff, shoreline configuration, vegetation, and hydrological conditions can influence subsequent transport and retention [4,37]. Nevertheless, the contextual shoreline reconnaissance was conducted after the March 2024 litter sampling, and neither CCI nor the pooled product composition identifies the source of individual items or separates the relative effects of local inputs and environmental redistribution.
Site 1 had the highest observed CCI values, reflecting its higher plastic-item density within the sampled shoreline sections. This descriptive ranking does not establish a priority for litter interception or cleanup, because CCI provides no independent evidence beyond Abundance density and intervention effectiveness was not assessed. Broader spatial sampling and repeated surveys would be required to determine whether this ranking persists across seasons and hydrological conditions.
3.4.3. Plastic Abundance Index (PAI)
Plastic Abundance Index values varied considerably among the 12 shoreline transects of Bung Xang Lake, ranging from 22.66 to 92.75 (Figure 9). All values exceeded the threshold of PAI = 8 proposed by Rangel-Buitrago et al. (2021) [29] and were therefore classified as Very High Abundance. Nevertheless, the maximum value was approximately 4.09 times the minimum, demonstrating substantial descriptive variation within this common category. Under these highly polluted conditions, categorical classification no longer differentiated the relative intensity of plastic accumulation among transects, whereas the continuous PAI values retained this information.
Figure 9.
Spatial variation in the Plastic Abundance Index (PAI) across the 12 shoreline transects of Bung Xang Lake. Bars represent transect-level PAI values, the dashed line indicates the threshold for the Very High Abundance category (PAI = 8) proposed by Rangel-Buitrago et al. (2021) [29], and the line shows the proportion of plastic items in the total litter assemblage. PAI values are presented as a continuous indicator to complement categorical classification and facilitate descriptive comparison of plastic accumulation intensity among transects.
PAI was consistently elevated at Site 1, ranging from 68.56 to 92.75. The highest value occurred at Transect 1.4 (92.75), followed by Transects 1.1 (86.49), 2.2 (80.35), and 1.3 (75.61). Site 2 showed the greatest within-site variation, with values ranging from 32.46 to 80.35, whereas Site 3 generally occupied the lower end of the observed range, from 22.66 to 54.32. These values describe spatial variation among the sampled transects but were not subjected to a separate inferential comparison among sites.
The correspondence between PAI and Abundance density is expected because both metrics are derived from the same litter counts and sampled area, with PAI additionally incorporating logarithmically transformed total litter abundance [29]. Because plastic constituted approximately 98–100% of recovered items in most transects, PAI provided limited additional information beyond Abundance density. It is therefore retained as a supplementary descriptor under the adopted index framework, rather than as independent confirmation of spatial differences. The Very High Abundance classification describes the sampled litter inventory under the adopted thresholds and does not establish ecological risk.
The observed PAI pattern may reflect interactions among plastic inputs, shoreline use, stormwater pathways, and environmental transport and retention. Recreational and consumer activities can influence the types and quantities of discarded products entering aquatic environments [31,39,40,41], whereas hydrological conditions, shoreline configuration, vegetation, and physical structures may affect where plastic items accumulate [4,41]. These mechanisms provide plausible context for the observed distribution but were not quantified independently and cannot be distinguished using PAI alone. In addition, the contextual field reconnaissance was conducted after the March 2024 litter survey and therefore cannot establish the contemporaneous sources or transport conditions responsible for the transect-level PAI values.
Because PAI was developed for beach-litter assessment [29], its application to the engineered, periodically inundated shoreline walkway represents an operational adaptation. Its categorical thresholds have not been independently validated for this urban-lake setting and are used only as supplementary descriptors of the recovered litter inventory. The comparatively high values at Transects 1.4, 1.1, and 2.2 do not independently justify prioritising these locations for litter interception or cleanup. Broader spatial sampling and repeated surveys would be required to assess the consistency of the observed accumulation patterns before using them to inform spatial management priorities.
3.5. Bottom Macroplastic Deposition
3.5.1. Composition and Size Characteristics
Bottom-deposited litter was overwhelmingly dominated by plastic, although its proportional contribution differed between item abundance and dry mass (Figure 10a). Of the 560 items recovered from the four bottom transects, 547 were classified as Plastic, representing 97.68% of total item abundance. Plastic items contributed 8487 g of the total dry mass (9813 g), corresponding to 86.49%. Composite/Multilayer items accounted for 1.07% of abundance and 2.05% of mass, while Textiles represented only 0.71% of abundance but contributed 7.61% of mass. Similarly, Electrical/Electronic items accounted for 0.36% of abundance and 3.72% of mass, whereas Metal contributed only 0.18% and 0.13%, respectively. Plastic’s lower proportional contribution by mass therefore resulted from the disproportionate influence of a small number of relatively heavy non-plastic items.
Figure 10.
Composition of bottom-deposited litter and plastics in Bung Xang Lake: (a) material categories of the total bottom-deposited litter assemblage by relative abundance and dry mass; and (b) functional plastic product groups by relative abundance and dry mass. Percentages in panel (a) were calculated relative to the total bottom-litter inventory (n = 560), whereas those in panel (b) were calculated relative to the plastic subset (n = 547).
Within the plastic subset (n = 547), Packaging Plastics dominated both metrics, accounting for 75.69% of plastic-item abundance and 60.27% of plastic dry mass (Figure 10b). Food and Beverage Plastics represented a further 14.26% of abundance but only 6.96% of dry mass. In contrast, Household and Personal-care Plastics constituted 8.23% of plastic items but contributed 32.18% of plastic dry mass, reflecting the presence of relatively large or heavy products such as plastic tablecloths, tarpaulins, banners, PVC pipes, and plastic sandals. Medical and Pharmaceutical Plastics contributed a minor 1.83% by abundance and 0.59% by dry mass, while Agricultural and Gardening Plastics and Fragmented/Unidentified Plastics were not recorded. Thus, the numerical dominance of packaging products did not translate proportionally into deposited plastic dry mass. Similar packaging products, particularly plastic bags and wrappers, are commonly recorded in freshwater environments [42]. Although macroplastic debris can undergo transport, temporary storage, retention, and remobilisation within aquatic systems [35], the present sampling design does not establish the transport pathways or residence times responsible for the products observed in the sampled bottom-deposition area.
At the product level, plastic bags contributed most to both item abundance and dry mass in the recovered bottom-litter inventory (Figure 11a). Transparent plastic bags without handles and plastic food wrappers ranked next by abundance, further demonstrating the prominence of packaging-related products. Several less abundant products—including plastic tablecloths, tarpaulins, plastic rice bags, woven plastic cement bags, banners, and PVC water pipes—contributed comparatively large mass. Numerically scarce non-plastic products, particularly Textiles and Electrical/Electronic items, also contributed appreciably to total deposited dry mass. Item abundance therefore identified frequently occurring products, whereas dry mass captured the disproportionate contribution of uncommon but relatively large or heavy objects. Reporting both metrics is consistent with monitoring guidance because either metric alone may provide an incomplete representation of deposited-litter composition [25]. Mass measurements may additionally help characterise the deposited material stock potentially available for subsequent remobilisation [35], although remobilisation was not measured in this study.
Figure 11.
Product composition and size characteristics of bottom-deposited litter and plastics in Bung Xang Lake. (a) Relative abundance and dry-mass contributions of individual bottom-deposited litter product types; (b) empirical cumulative distribution functions (ECDFs) of the maximum linear dimensions of plastic items across the four bottom transects; and (c) size-class distribution of bottom-deposited plastic items based on maximum linear dimension (n = 547).
The 547 bottom-deposited plastic items were strongly concentrated within the 100–500 mm range (Figure 11c). The 200–500 mm class was dominant, comprising 77.33% (n = 423), followed by the 100–200 mm class at 14.44% (n = 79) and the 500–1000 mm class at 6.03% (n = 33). Only 0.73% (n = 4) occurred in the 50–100 mm class and 0.18% (n = 1) in the 25–50 mm class, whereas seven items (1.28%) exceeded 1000 mm. Based on the descriptive size groups adopted in this study, small macroplastics (25–100 mm) accounted for 0.91% of the sampled plastic items, medium macroplastics (100–500 mm) for 91.77%, large macroplastics (500–1000 mm) for 6.03%, and megaplastics (>1000 mm) for 1.28%. These results characterise only plastic items exceeding the operational lower size limit of 25 mm; mesoplastics were outside the sampling range, so this survey cannot evaluate their occurrence.
Product-specific size statistics further clarify the structure of the bottom-deposited plastic assemblage (Table 3). The table includes the five most abundant plastic product types, each represented by 25–330 items, and therefore characterises recurring products rather than isolated observations. Plastic bags were by far the most abundant product (n = 330), with a median maximum linear dimension of 300 mm and a mean of 327.88 ± 88.36 mm (CV = 26.95%). Transparent plastic bags without handles (n = 60) had a larger median maximum linear dimension, with a median of 450 mm and a mean of 379.17 ± 126.99 mm (CV = 33.49%). Plastic food wrappers (n = 44) ranged from 120 to 300 mm, with a mean of 230.45 ± 58.90 mm, a median of 200 mm, and a CV of 25.56%. Plastic tablecloths (n = 26) showed the lowest relative dimensional variability among these products, ranging from 400 to 500 mm, with a mean of 407.69 ± 27.17 mm, a median of 400 mm, and a CV of 6.67%. In contrast, clear plastic cups (n = 25) showed the greatest relative size heterogeneity, ranging from 50 to 500 mm, with a mean of 146.80 ± 107.96 mm, a median of 110 mm, and a CV of 73.54%. The pooled size distribution was therefore strongly shaped by the characteristic dimensions and numerical dominance of recurring products, particularly plastic bags.
Table 3.
Size characteristics of the five most abundant bottom-deposited plastic product types (25–330 items per product type) in Bung Xang Lake. Maximum linear dimensions are reported in millimetres.
The transect-specific ECDFs provided a complementary description of variation in the maximum linear dimensions of bottom-deposited plastic items (Figure 11b). All four curves increased steeply across the lower and intermediate portions of the observed range, consistent with the pooled predominance of items between 100 and 500 mm. Transect 4 generally showed a greater cumulative proportion of relatively small items over the lower part of the distribution, whereas Transect 3 was shifted towards larger dimensions over part of this range. Transect 1 showed the longest upper tail, extending beyond 2000 mm, indicating a small number of exceptionally large items despite the numerical dominance of intermediate-sized products. The curves did not maintain a consistent ordering across the full measured range, indicating that their separation was concentrated in specific portions of the distributions rather than reflecting a uniform shift in item size among transects. These patterns may reflect transect-level differences in product composition and the occurrence of a few unusually large products. Because no inferential test was applied to the size distributions, the ECDF differences should be interpreted descriptively rather than as statistically confirmed evidence of spatial size sorting.
Overall, the sampled bottom-deposition area was characterised by the numerical dominance of plastic, particularly Packaging Plastics, and by a pronounced concentration of plastic items within the medium-macroplastic range. Item abundance, dry mass, product-specific dimensions, and transect-level ECDFs provided complementary descriptions of the recovered assemblage. Collectively, the results indicate that product composition and the presence of a small number of unusually large items strongly influenced the observed size structure. However, because the four contiguous transects were located within a single bottom-deposition area and sampled on one occasion, these findings do not demonstrate hydrodynamic size sorting, temporal persistence, or lake-wide patterns of bottom plastic deposition.
3.5.2. Spatial Variation in Abundance and Mass
Abundance density and Mass density varied descriptively among the four contiguous transects within the sampled bottom-deposition area and showed partly different spatial patterns (Figure 12). Abundance density ranged from 1.94 to 3.53 items m−2. The highest value occurred at Transect 4 (3.53 items m−2), closely followed by Transect 3 (3.51 items m−2), whereas Transects 1 and 2 recorded 2.80 and 1.94 items m−2, respectively. The highest value was approximately 1.8 times the lowest, demonstrating descriptive transect-scale variation in the number of plastic items accumulated within the sampled area.
Figure 12.
Spatial variation in bottom-deposited plastic accumulation among the four contiguous bottom transects within the sampled bottom-deposition area of Bung Xang Lake: (a) Abundance density (items m−2) and (b) Mass density (g m−2). Values represent individual transects sampled on one occasion and are presented descriptively.
Mass density ranged from 32.97 to 66.80 g m−2 and produced a different transect ranking. Transect 3 had the highest Mass density (66.80 g m−2), followed by Transect 4 (45.61 g m−2), Transect 1 (37.14 g m−2), and Transect 2 (32.97 g m−2). The value at Transect 3 was approximately twice that at Transect 2. Although Transects 3 and 4 had nearly identical Abundance densities, Mass density at Transect 3 was approximately 1.46 times that at Transect 4. Thus, the two transects contained similar numbers of plastic items per unit area, but the items recovered from Transect 3 had a greater combined dry mass per unit area.
The divergence between the two metrics was consistent with the product composition described in Section 3.5.1. Packaging Plastics, particularly plastic bags, dominated item abundance, whereas Household and Personal-care Plastics and several less frequent, relatively large products contributed disproportionately to plastic dry mass. Transects containing similar numbers of plastic items could therefore exhibit different Mass densities depending on the identity, dimensions, and individual mass of the products present. Abundance density quantified the number of plastic items per unit area, whereas Mass density represented their accumulated dry mass per unit area. Joint interpretation of the two metrics therefore provided a more complete description of bottom-deposited plastic accumulation than either metric alone.
Macroplastic distributions in aquatic systems may be modified by transport, temporary retention, remobilisation, and redeposition, with these processes influenced by product properties, hydrodynamic conditions, vegetation, sedimentation, and local bottom morphology [35]. Evidence from the Río de la Plata similarly indicates that bottom debris may accumulate preferentially in areas characterised by weak circulation and high sedimentation [43]. These processes provide plausible context for the observed transect-scale variation but were not measured directly at Bung Xang Lake. The comparatively high Mass density at Transect 3 therefore cannot be attributed to a particular depositional mechanism.
Because the four transects were contiguous, located within a single bottom-deposition area, and sampled on one occasion, they represent local sampling units rather than independent sites distributed across the lake. In addition, we did not perform any inferential comparisons among the bottom transects. The observed values should therefore be interpreted as descriptive local variation within the sampled area rather than as statistically confirmed differences, temporally persistent conditions, or a lake-wide spatial gradient. The subsequent PAI assessment provides a standardised categorical and continuous representation of plastic abundance under the sampled conditions, but it is mathematically related to Abundance density and should not be interpreted as independent confirmation of the observed spatial pattern.
3.5.3. Plastic Pollution Assessment
PAI values varied descriptively among the four bottom transects, ranging from 19.71 at Transect 2 to 31.62 at Transect 4, with a nearly identical value at Transect 3 (31.58) and an intermediate value at Transect 1 (26.37) (Figure 13). All four values exceeded the PAI threshold of 8 proposed by Rangel-Buitrago et al. (2021) [29] and were therefore classified as Very High Abundance. Nevertheless, the maximum PAI was about 1.60 times the minimum, showing variation within this common category. As observed for the shoreline transects, continuous PAI values retained information on the relative magnitude of plastic accumulation among the sampled units, whereas the categorical classification did not distinguish among transects once all values exceeded the Very High Abundance threshold.
Figure 13.
Plastic Abundance Index (PAI) and proportion of plastic items recorded in the four contiguous bottom transects within the sampled bottom-deposition area of Bung Xang Lake. Green bars represent transect-level PAI values, the red dashed line indicates the threshold for the Very High Abundance category (PAI = 8), and the blue line represents the percentage of recovered items classified as Plastic. We operationally adapted PAI to the sampled bottom-deposition area using the surveyed area of each transect (46.5 m2).
The PAI ranking closely corresponded to the Abundance densities reported in Section 3.5.2: Transect 4 (3.53 items m−2) ≈ Transect 3 (3.51 items m−2) > Transect 1 (2.80 items m−2) > Transect 2 (1.94 items m−2). This correspondence was expected because PAI incorporates the number of plastic items, sampled area, and logarithmically transformed total item abundance, together with a scaling coefficient [29]. PAI and Abundance density are therefore mathematically related and should not be interpreted as independent evidence of spatial variation. However, they are not identical: Abundance density directly expresses the number of plastic items per unit area, whereas PAI additionally incorporates total item abundance through its logarithmic term.
Plastic items represented 96.47–98.48% of the total recovered item counts across the four bottom transects, whereas PAI showed a wider relative range (Figure 13). Plastic percentage describes the relative material composition of the recovered bottom-deposited litter, while PAI combines plastic-item abundance, total item abundance, and sampled area. Transects with similarly high plastic percentages may therefore have different PAI values when their numbers of plastic items and total litter items within the surveyed area differ. The results indicate that PAI varied within a consistently plastic-dominated assemblage rather than arising from substantial differences in the relative contributions of plastic and non-plastic materials.
Under the original beach-derived thresholds [29], all four bottom transects fell within the category labelled Very High Abundance. This designation is an exploratory description under the adopted framework, rather than a validated classification of lake-bottom pollution severity or ecological risk. Item visibility, partial burial, substrate conditions, and recovery efficiency differ from beach-surface surveys and limit direct comparison. Because detection and recovery efficiencies were not quantified, PAI cannot account for unrecovered buried litter or represent the complete bottom-litter inventory. The values are therefore supplementary to Abundance density and do not constitute independent confirmation of the observed accumulation pattern.
Within the sampled bottom-deposition area, Transects 3 and 4 had the highest abundance-based PAI values, whereas Transect 3 had the highest Mass density. Joint interpretation of PAI, Abundance density, and Mass density therefore distinguishes the number of accumulated plastic items from the dry-mass contribution of relatively large or heavy products. However, PAI provides a transformed representation of the same underlying litter-count data and does not constitute an independent line of evidence.
Because the four transects were contiguous, located within a single bottom-deposition area, and sampled on one occasion, the results describe local variation under the sampled conditions. They do not establish statistically confirmed differences among transects, temporal persistence, or a lake-wide spatial gradient in bottom plastic pollution.
3.6. Complementary Evidence of Plastic Pollution Across Compartments of Bung Xang Lake
3.6.1. Plastic Occurrence Across Shoreline and Bottom Compartments
The combined observations document plastic accumulation in two physical compartments of Bung Xang Lake (Table 4). Plastic accounted for 99.19% of shoreline litter abundance and 95.63% of shoreline litter dry mass. Within the sampled bottom-deposition area, plastic represented 97.68% of item abundance and 86.49% of dry mass. Because the compartments were sampled using different spatial designs, their joint presentation provides complementary evidence of plastic accumulation within the lake rather than a direct quantitative comparison of equivalent sampling environments.
Table 4.
Complementary evidence of plastic occurrence and characteristics in the shoreline and sampled bottom-deposition compartments of Bung Xang Lake.
The two physical compartments differed in their dominant product groups and size structures. Food and Beverage Plastics dominated plastic-item abundance along the shoreline, whereas Packaging Plastics dominated the sampled bottom-deposited assemblage. The 200–500 mm size class was the most abundant in both compartments but accounted for 40.20% of shoreline plastic items compared with 77.33% of bottom-deposited plastic items. These differences indicate that the composition and size distribution of accumulated plastic varied between the sampled compartments. Object properties, hydrodynamic transport, sedimentation, vegetation, shoreline configuration, and local retention conditions can influence macroplastic distributions in freshwater environments [35]. However, the results do not establish that plastic recovered from the bottom-deposition area originated from the surveyed shoreline or identify the processes responsible for the observed distributions.
3.6.2. Implications for a Multifunctional Urban Lake
Bung Xang Lake is intended to provide stormwater retention, flood mitigation, microclimate regulation, landscape value, and recreational space within a densely urbanised area. These functions coexist with anthropogenic pressures associated with residential and commercial activities, food-service areas, recreational use, stormwater drainage, wastewater inputs, and inadequate solid-waste containment. The documented shoreline accumulation and plastic-rich litter within the sampled bottom-deposition area show that plastic pollution occurred in two physically distinct components of the lake under the sampled conditions. Although the study did not quantify effects on hydrological performance, ecosystem services, ecological health, or human use, the evidence identifies plastic pollution as an environmental-management concern for a lake expected to provide multiple urban functions.
The shoreline inventory was numerically dominated by Food and Beverage Plastics and Packaging Plastics, including Styrofoam boxes, foam food containers, plastic bags, cups, and straws. These observations identify recurring product types within the sampled accumulation areas and may inform the selection of litter categories to target in future management planning. However, product identity does not establish where an item was discarded or how it reached the sampling location. The study did not identify specific emission sources, quantify input fluxes, or evaluate the effectiveness of source reduction, waste containment, collection, litter interception, or cleanup. These measures should therefore be regarded as options for further assessment rather than interventions demonstrated to be effective by the present results.
Within the sampled bottom-deposition area, Packaging Plastics dominated item abundance, while some less frequent bulky products contributed disproportionately to dry mass. This local inventory provides a basis for planning broader surveys of bottom litter, but it does not establish the need for, feasibility of, or benefits from lake-wide removal. Decisions about targeted removal would require additional assessment of litter distribution, accessibility, potential sediment disturbance, and associated environmental effects.
Further work should combine spatially distributed and repeated litter surveys with contemporaneous observations of potential inputs and hydrological conditions. Where management measures are implemented, their effectiveness should be evaluated through monitoring before and after intervention, accounting for temporal variability. The present findings provide baseline observations for the sampled areas, rather than evidence of source contributions, input rates, or remediation outcomes.
Figure 14 summarises the complementary observations from the sampled shoreline and bottom-deposition areas and the needs for further assessment.
Figure 14.
Overview of plastic pollution in the shoreline and sampled bottom-deposition compartments of Bung Xang Lake. The diagram summarises the compartment-specific occurrence, composition, size characteristics, and pollution intensity observed in this study. The two compartments provide complementary evidence of plastic accumulation but were not spatially or temporally paired to demonstrate direct transport or fragmentation between them.
4. Conclusions
This study provides a complementary assessment of plastic pollution along the shoreline and within a sampled bottom-deposition area of Bung Xang Lake, a multifunctional tropical urban lake under substantial anthropogenic pressure. Plastic accounted for 99.19% of shoreline litter abundance and 95.63% of shoreline litter dry mass. Food and Beverage Plastics dominated plastic-item abundance (71.44%), whereas Household and Personal-care Plastics contributed 56.24% of plastic dry mass, primarily because of a single bulky PE-foam mattress. Site 1 had the highest observed median Abundance density and Mass density, but no Bonferroni-adjusted pairwise comparison was statistically significant. Limited replication and unverified independence among contiguous transects constrain between-site inference. All 12 shoreline transects were classified as Extremely Dirty according to CCI (33.14–210.29) and as Very High Abundance according to PAI (22.66–92.75), indicating consistently high plastic accumulation across the sampled shoreline under the adopted index classifications.
Plastic similarly dominated the litter recovered from the four bottom transects, representing 97.68% of total item abundance and 86.49% of total dry mass. Packaging Plastics accounted for most plastic-item abundance (75.69%) and plastic dry mass (60.27%), with plastic bags as the dominant product type. Medium macroplastics measuring 100–500 mm represented 91.77% of bottom-deposited plastic items. Abundance density ranged from 1.94 to 3.53 items m−2, and Mass density from 32.97 to 66.80 g m−2, while all four transects were classified as Very High Abundance by the operationally adapted PAI (19.71–31.62). The differing abundance- and mass-based patterns demonstrate that the two metrics provide complementary information on bottom-deposited plastic accumulation. Because the four contiguous transects were located within a single bottom-deposition area and sampled on one occasion, these results characterise local conditions rather than plastic distribution across the entire lake bottom.
Together, the findings provide complementary evidence of plastic accumulation in two physically distinct compartments of the same urban-lake system. They do not demonstrate direct transport between the surveyed shoreline and sampled bottom-deposition area. Establishing connectivity would require spatially and temporally paired sampling together with hydrodynamic observations and polymer or chemical characterisation. The observed product composition may inform the selection of litter categories for future management planning in the sampled areas. However, the study did not identify specific emission sources, quantify plastic input fluxes, or evaluate intervention effectiveness; broader surveys and dedicated monitoring are required before drawing conclusions about appropriate interventions and their outcomes.
Supplementary Materials
The following supporting information can be downloaded at: https://www.mdpi.com/article/10.3390/microplastics5040206/s1, Supplementary File S1: Minimal dataset supporting the shoreline and bottom-litter analyses.
Author Contributions
Conceptualization: N.T.T., K.L. and N.V.C.N.; Methodology: N.T.T., P.V.T., K.L., H.V.T.M. and N.V.C.N.; Formal Analysis: N.T.T., K.L., V.T.T., N.V.T. and N.V.C.N.; Investigation: N.T.T., P.V.T., V.T.T., N.V.C.N., N.V.T. and H.V.T.M.; Resources: N.T.T., K.L., N.V.C.N., V.T.T. and P.V.T.; Writing—original draft preparation: N.T.T., P.V.T., H.V.T.M., K.L., N.K.D. and N.V.C.N.; Writing—review and editing: N.V.C.N., P.V.T., H.V.T.M., T.V.T., K.L. and N.K.D. All authors have read and agreed to the published version of the manuscript.
Funding
This research received no external funding.
Institutional Review Board Statement
Not applicable.
Data Availability Statement
The original contributions presented in this study are included in the article and Supplementary Materials. Further inquiries can be directed to the corresponding author.
Conflicts of Interest
The authors declare no conflicts of interest.
References
- Prudencio, L.; Null, S.E. Stormwater management and ecosystem services: A review. Environ. Res. Lett. 2018, 13, 033002. [Google Scholar] [CrossRef] [Scilit]
- Henny, C.; Meutia, A.A. Urban lakes in megacity Jakarta: Risk and management plan for future sustainability. Procedia Environ. Sci. 2014, 20, 737–746. [Google Scholar] [CrossRef] [Scilit]
- Fletcher, T.D.; Shuster, W.; Hunt, W.F.; Ashley, R.; Butler, D.; Arthur, S.; Trowsdale, S.; Barraud, S.; Semadeni-Davies, A.; Bertrand-Krajewski, J.-L.; et al. SUDS, LID, BMPs, WSUD and more—The evolution and application of terminology surrounding urban drainage. Urban Water J. 2015, 12, 525–542. [Google Scholar] [CrossRef] [Scilit]
- van Emmerik, T.; Schwarz, A. Plastic debris in rivers. WIREs Water 2020, 7, e1398. [Google Scholar] [CrossRef] [Scilit]
- Windsor, F.M.; Durance, I.; Horton, A.A.; Thompson, R.C.; Tyler, C.R.; Ormerod, S.J. A catchment-scale perspective of plastic pollution. Glob. Change Biol. 2019, 25, 1207–1221. [Google Scholar] [CrossRef] [Scilit] [PubMed]
- Lechthaler, S.; Waldschläger, K.; Stauch, G.; Schüttrumpf, H. The way of macroplastic through the environment. Environments 2020, 7, 73. [Google Scholar] [CrossRef] [Scilit]
- Schwarz, A.E.; Ligthart, T.N.; Boukris, E.; van Harmelen, T. Sources, transport, and accumulation of different types of plastic litter in aquatic environments: A review study. Mar. Pollut. Bull. 2019, 143, 92–100. [Google Scholar] [CrossRef] [Scilit] [PubMed]
- Horton, A.A.; Walton, A.; Spurgeon, D.J.; Lahive, E.; Svendsen, C. Microplastics in freshwater and terrestrial environments: Evaluating the current understanding to identify the knowledge gaps and future research priorities. Sci. Total Environ. 2017, 586, 127–141. [Google Scholar] [CrossRef] [Scilit] [PubMed]
- Waldschläger, K.; Lechthaler, S.; Stauch, G.; Schüttrumpf, H. The way of microplastic through the environment—Application of the source–pathway–receptor model. Sci. Total Environ. 2020, 713, 136584. [Google Scholar] [CrossRef] [Scilit] [PubMed]
- Bellasi, A.; Binda, G.; Pozzi, A.; Galafassi, S.; Volta, P.; Bettinetti, R. Microplastic contamination in freshwater environments: A review, focusing on interactions with sediments and benthic organisms. Environments 2020, 7, 30. [Google Scholar] [CrossRef] [Scilit]
- Eerkes-Medrano, D.; Thompson, R.C.; Aldridge, D.C. Microplastics in freshwater systems: A review of the emerging threats, identification of knowledge gaps and prioritisation of research needs. Water Res. 2015, 75, 63–82. [Google Scholar] [CrossRef] [Scilit] [PubMed]
- Blettler, M.C.M.; Ulla, M.A.; Rabuffetti, A.P.; Garello, N. Plastic pollution in freshwater ecosystems: Macro-, meso-, and microplastic debris in a floodplain lake. Environ. Monit. Assess. 2017, 189, 581. [Google Scholar] [CrossRef] [Scilit] [PubMed]
- Blettler, M.C.M.; Abrial, E.; Khan, F.R.; Sivri, N.; Espinola, L.A. Freshwater plastic pollution: Recognizing research biases and identifying knowledge gaps. Water Res. 2018, 143, 416–424. [Google Scholar] [CrossRef] [Scilit] [PubMed]
- Kumar, P.; Inamura, Y.; Bao, P.N.; Abeynayaka, A.; Dasgupta, R.; Abeynayaka, H.D.L. Microplastics in freshwater environment in Asia: A systematic scientific review. Water 2022, 14, 1737. [Google Scholar] [CrossRef] [Scilit]
- Babel, S.; Ta, A.T.; Nguyen, T.P.L.; Sembiring, E.; Setiadi, T.; Sharp, A. Microplastics pollution in selected rivers from Southeast Asia. APN Sci. Bull. 2022, 12, 5–17. [Google Scholar] [CrossRef] [Scilit]
- Strady, E.; Dang, T.H.; Dao, T.D.; Dinh, H.N.; Do, T.T.D.; Duong, T.N.; Duong, T.T.; Hoang, D.A.; Kieu-Le, T.C.; Le, T.P.Q.; et al. Baseline assessment of microplastic concentrations in marine and freshwater environments of a developing Southeast Asian country, Viet Nam. Mar. Pollut. Bull. 2021, 162, 111870. [Google Scholar] [CrossRef] [Scilit] [PubMed]
- People’s Committee of Can Tho City. Decision No. 3771/QD-UBND Approving the List of Lakes, Ponds, Canals and Channels That Must Not Be Reclaimed within Can Tho City; People’s Committee of Can Tho City: Can Tho, Vietnam, 2022. Available online: https://luatvietnam.vn/van-ban/xem-truoc-file-4e42bd61-0832-5700-d0f3-838297ef6367 (accessed on 4 September 2026). (In Vietnamese)
- Nam, T.S.; Thao, V.T.P.; My, T.H.H.; Dieu, N.T.N.; Anh, N.Q.; Ly, T.T.K.; Sanh, N.T.; Ngoc, T.H.M.; Long, H.T.; Thinh, N.P.; et al. Survey of surface water quality in Bung Xang Canal, Ninh Kieu District, Can Tho City. J. Agric. Rural Dev. 2022, 440, 92–99. (In Vietnamese) [Google Scholar]
- Trang, N.T.D.; Jegatheesan, V.; Thao, V.T.P.; Tung, N.C.T.; Nam, T.S.; Cong, N.V.; Thuan, N.C.; Dung, D.T. Local residents’ perception on factors affecting the willingness to pay for improved urban canal water: A case study in Can Tho city of Vietnam. Environ. Sci. Pollut. Res. 2025, 32, 3485–3501. [Google Scholar] [CrossRef] [Scilit] [PubMed]
- Liem, T. Can Tho: Delay in Handing over Flood Prevention Reservoir Worth over VND 220 Billion. Available online: https://baotintuc.vn/kinh-te/can-tho-cham-ban-giao-ho-chong-ngap-hon-220-ty-dong-20230225121049450.htm (accessed on 4 September 2026). (In Vietnamese)
- Phuong, Y. Addressing the Severe Litter Accumulation Along the Embankment of the Hundred-Billion-Dong Lake Adjacent to the Food Street. Available online: https://laodong.vn/photo/khac-phuc-tinh-trang-rac-thai-ngap-ngua-tai-ke-ho-tram-ti-ngay-pho-am-thuc-1170908.ldo (accessed on 4 September 2026). (In Vietnamese)
- Weather Spark. Spring Weather in Can Tho, Vietnam. Available online: https://weatherspark.com/s/115861/0/Average-Spring-Weather-in-Can-Tho-Vietnam (accessed on 4 September 2026).
- Burgess, H.K.; Herring, C.E.; Lippiatt, S.; Lowe, S.; Uhrin, A.V. NOAA Marine Debris Monitoring and Assessment Project Shoreline Survey Guide; NOAA Technical Memorandum NOS OR&R 56; NOAA Marine Debris Program, National Oceanic and Atmospheric Administration: Silver Spring, MD, USA, 2021; 20p. [Google Scholar] [CrossRef]
- Cuong, C.T.; Hien, B.T.T.; Trang, N.T.T.; Quynh, N.M. Vietnam Coastal Plastic Waste Monitoring and Assessment Program—2020 Report; IUCN Viet Nam Country Office: Hanoi, Vietnam, 2021; 42p, Available online: https://www.iucn.org/sites/default/files/content/documents/2021/beach_debris_mornitoring_2020_report_vietnamese_-_1_july_2021.pdf (accessed on 12 September 2026). (In Vietnamese)
- Cheshire, A.C.; Adler, E.; Barbière, J.; Cohen, Y.; Evans, S.; Jarayabhand, S.; Jeftic, L.; Jung, R.T.; Kinsey, S.; Kusui, E.T.; et al. UNEP/IOC Guidelines on Survey and Monitoring of Marine Litter; UNEP Regional Seas Reports and Studies No. 186; IOC Technical Series No. 83; United Nations Environment Programme: Nairobi, Kenya, 2009; xii+120p, Available online: https://www.researchgate.net/publication/256186638_UNEPIOC_Guidelines_on_Survey_and_Monitoring_of_Marine_Litter (accessed on 12 September 2026).
- OSPAR Commission. Guideline for Monitoring Marine Litter on the Beaches in the OSPAR Maritime Area, 1st ed.; Agreement No. 2010-02; OSPAR Commission: London, UK, 2010; Available online: https://www.ospar.org/ospar-data/10-02e_beachlitter%20guideline_english%20only.pdf (accessed on 12 September 2026).
- United Nations Environment Programme. Monitoring Plastics in Rivers and Lakes: Guidelines for the Harmonization of Methodologies; United Nations Environment Programme: Nairobi, Kenya, 2020; Available online: https://wedocs.unep.org/rest/api/core/bitstreams/b71420ab-9c24-4783-a871-11f97d249bd7/content (accessed on 12 September 2026).
- Alkalay, R.; Pasternak, G.; Zask, A. Clean-coast index—A new approach for beach cleanliness assessment. Ocean Coast. Manag. 2007, 50, 352–362. [Google Scholar] [CrossRef] [Scilit]
- Rangel-Buitrago, N.; Velez-Mendoza, A.; Mantilla-Barbosa, E.; Arroyo-Olarte, H.; Arana, V.A.; Trilleras, J.; Gracia, C.A.; Neal, W.J.; Williams, A.T. Plastic pollution on the Colombian central Caribbean beaches. Mar. Pollut. Bull. 2021, 162, 111837. [Google Scholar] [CrossRef] [Scilit] [PubMed]
- Rech, S.; Macaya-Caquilpán, V.; Pantoja, J.F.; Rivadeneira, M.M.; Madariaga, D.J.; Thiel, M. Rivers as a source of marine litter: A study from the SE Pacific. Mar. Pollut. Bull. 2014, 82, 66–75. [Google Scholar] [CrossRef] [Scilit] [PubMed]
- Kiessling, T.; Knickmeier, K.; Kruse, K.; Gatta-Rosemary, M.; Nauendorf, A.; Brennecke, D.; Thiel, M. Plastic Pirates sample litter at rivers in Germany: Riverside litter and litter sources estimated by schoolchildren. Environ. Pollut. 2019, 245, 545–557. [Google Scholar] [CrossRef] [Scilit] [PubMed]
- Castro-Jiménez, J.; González-Fernández, D.; Fornier, M.; Schmidt, N.; Sempéré, R. Macro-litter in surface waters from the Rhône River: Plastic pollution and loading to the NW Mediterranean Sea. Mar. Pollut. Bull. 2019, 146, 60–66. [Google Scholar] [CrossRef] [Scilit] [PubMed]
- Andrady, A.L. Microplastics in the marine environment. Mar. Pollut. Bull. 2011, 62, 1596–1605. [Google Scholar] [CrossRef] [Scilit] [PubMed]
- Gewert, B.; Plassmann, M.M.; MacLeod, M. Pathways for degradation of plastic polymers floating in the marine environment. Environ. Sci. Process. Impacts 2015, 17, 1513–1521. [Google Scholar] [CrossRef] [Scilit] [PubMed]
- Liro, M.; van Emmerik, T.; Wyżga, B.; Liro, J.; Mikuś, P. Macroplastic storage and remobilization in rivers. Water 2020, 12, 2055. [Google Scholar] [CrossRef] [Scilit]
- Barnes, D.K.A.; Galgani, F.; Thompson, R.C.; Barlaz, M. Accumulation and fragmentation of plastic debris in global environments. Philos. Trans. R. Soc. B Biol. Sci. 2009, 364, 1985–1998. [Google Scholar] [CrossRef] [Scilit] [PubMed]
- United Nations Environment Programme. From Pollution to Solution: A Global Assessment of Marine Litter and Plastic Pollution; United Nations Environment Programme: Nairobi, Kenya, 2021; Available online: https://www.gdr-po.cnrs.fr/docs/UNEP_2021.pdf (accessed on 12 September 2026).
- Owens, K.A.; Kamil, P.I. Adapting coastal collection methods for river assessment to increase data on global plastic pollution: Examples from India and Indonesia. Front. Environ. Sci. 2020, 7, 208. [Google Scholar] [CrossRef] [Scilit]
- Williams, A.T.; Rangel-Buitrago, N.; Anfuso, G.; Cervantes, O.; Botero, C.M. Litter impacts on scenery and tourism on the Colombian north Caribbean coast. Tour. Manag. 2016, 55, 209–224. [Google Scholar] [CrossRef] [Scilit]
- Rangel-Buitrago, N.; Williams, A.T.; Anfuso, G.; Arias, M.; Gracia, C.A. Magnitudes, sources, and management of beach litter along the Atlántico Department coastline, Caribbean coast of Colombia. Ocean Coast. Manag. 2017, 138, 142–157. [Google Scholar] [CrossRef] [Scilit]
- Rangel-Buitrago, N.; Gracia, C.A.; Vélez-Mendoza, A.; Mantilla-Barbosa, E.; Arana, V.A.; Trilleras, J.; Arroyo-Olarte, H. Abundance and distribution of beach litter along the Atlántico Department, Caribbean coast of Colombia. Mar. Pollut. Bull. 2018, 136, 435–447. [Google Scholar] [CrossRef] [Scilit] [PubMed]
- Hoellein, T.J.; Westhoven, M.; Lyandres, O.; Cross, J. Abundance and environmental drivers of anthropogenic litter on Lake Michigan beaches: A study facilitated by citizen science data collection. J. Gt. Lakes Res. 2015, 41, 78–86. [Google Scholar] [CrossRef] [Scilit]
- Acha, E.M.; Mianzan, H.W.; Iribarne, O.; Gagliardini, D.A.; Lasta, C.; Daleo, P. The role of the Río de la Plata bottom salinity front in accumulating debris. Mar. Pollut. Bull. 2003, 46, 197–202. [Google Scholar] [CrossRef] [Scilit] [PubMed]
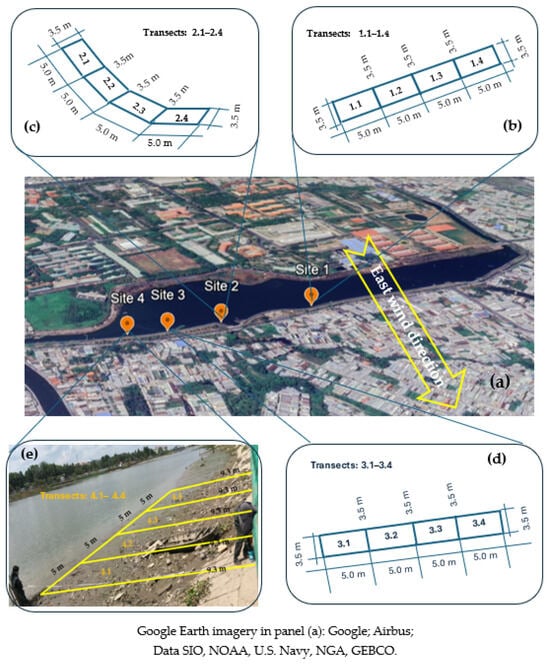
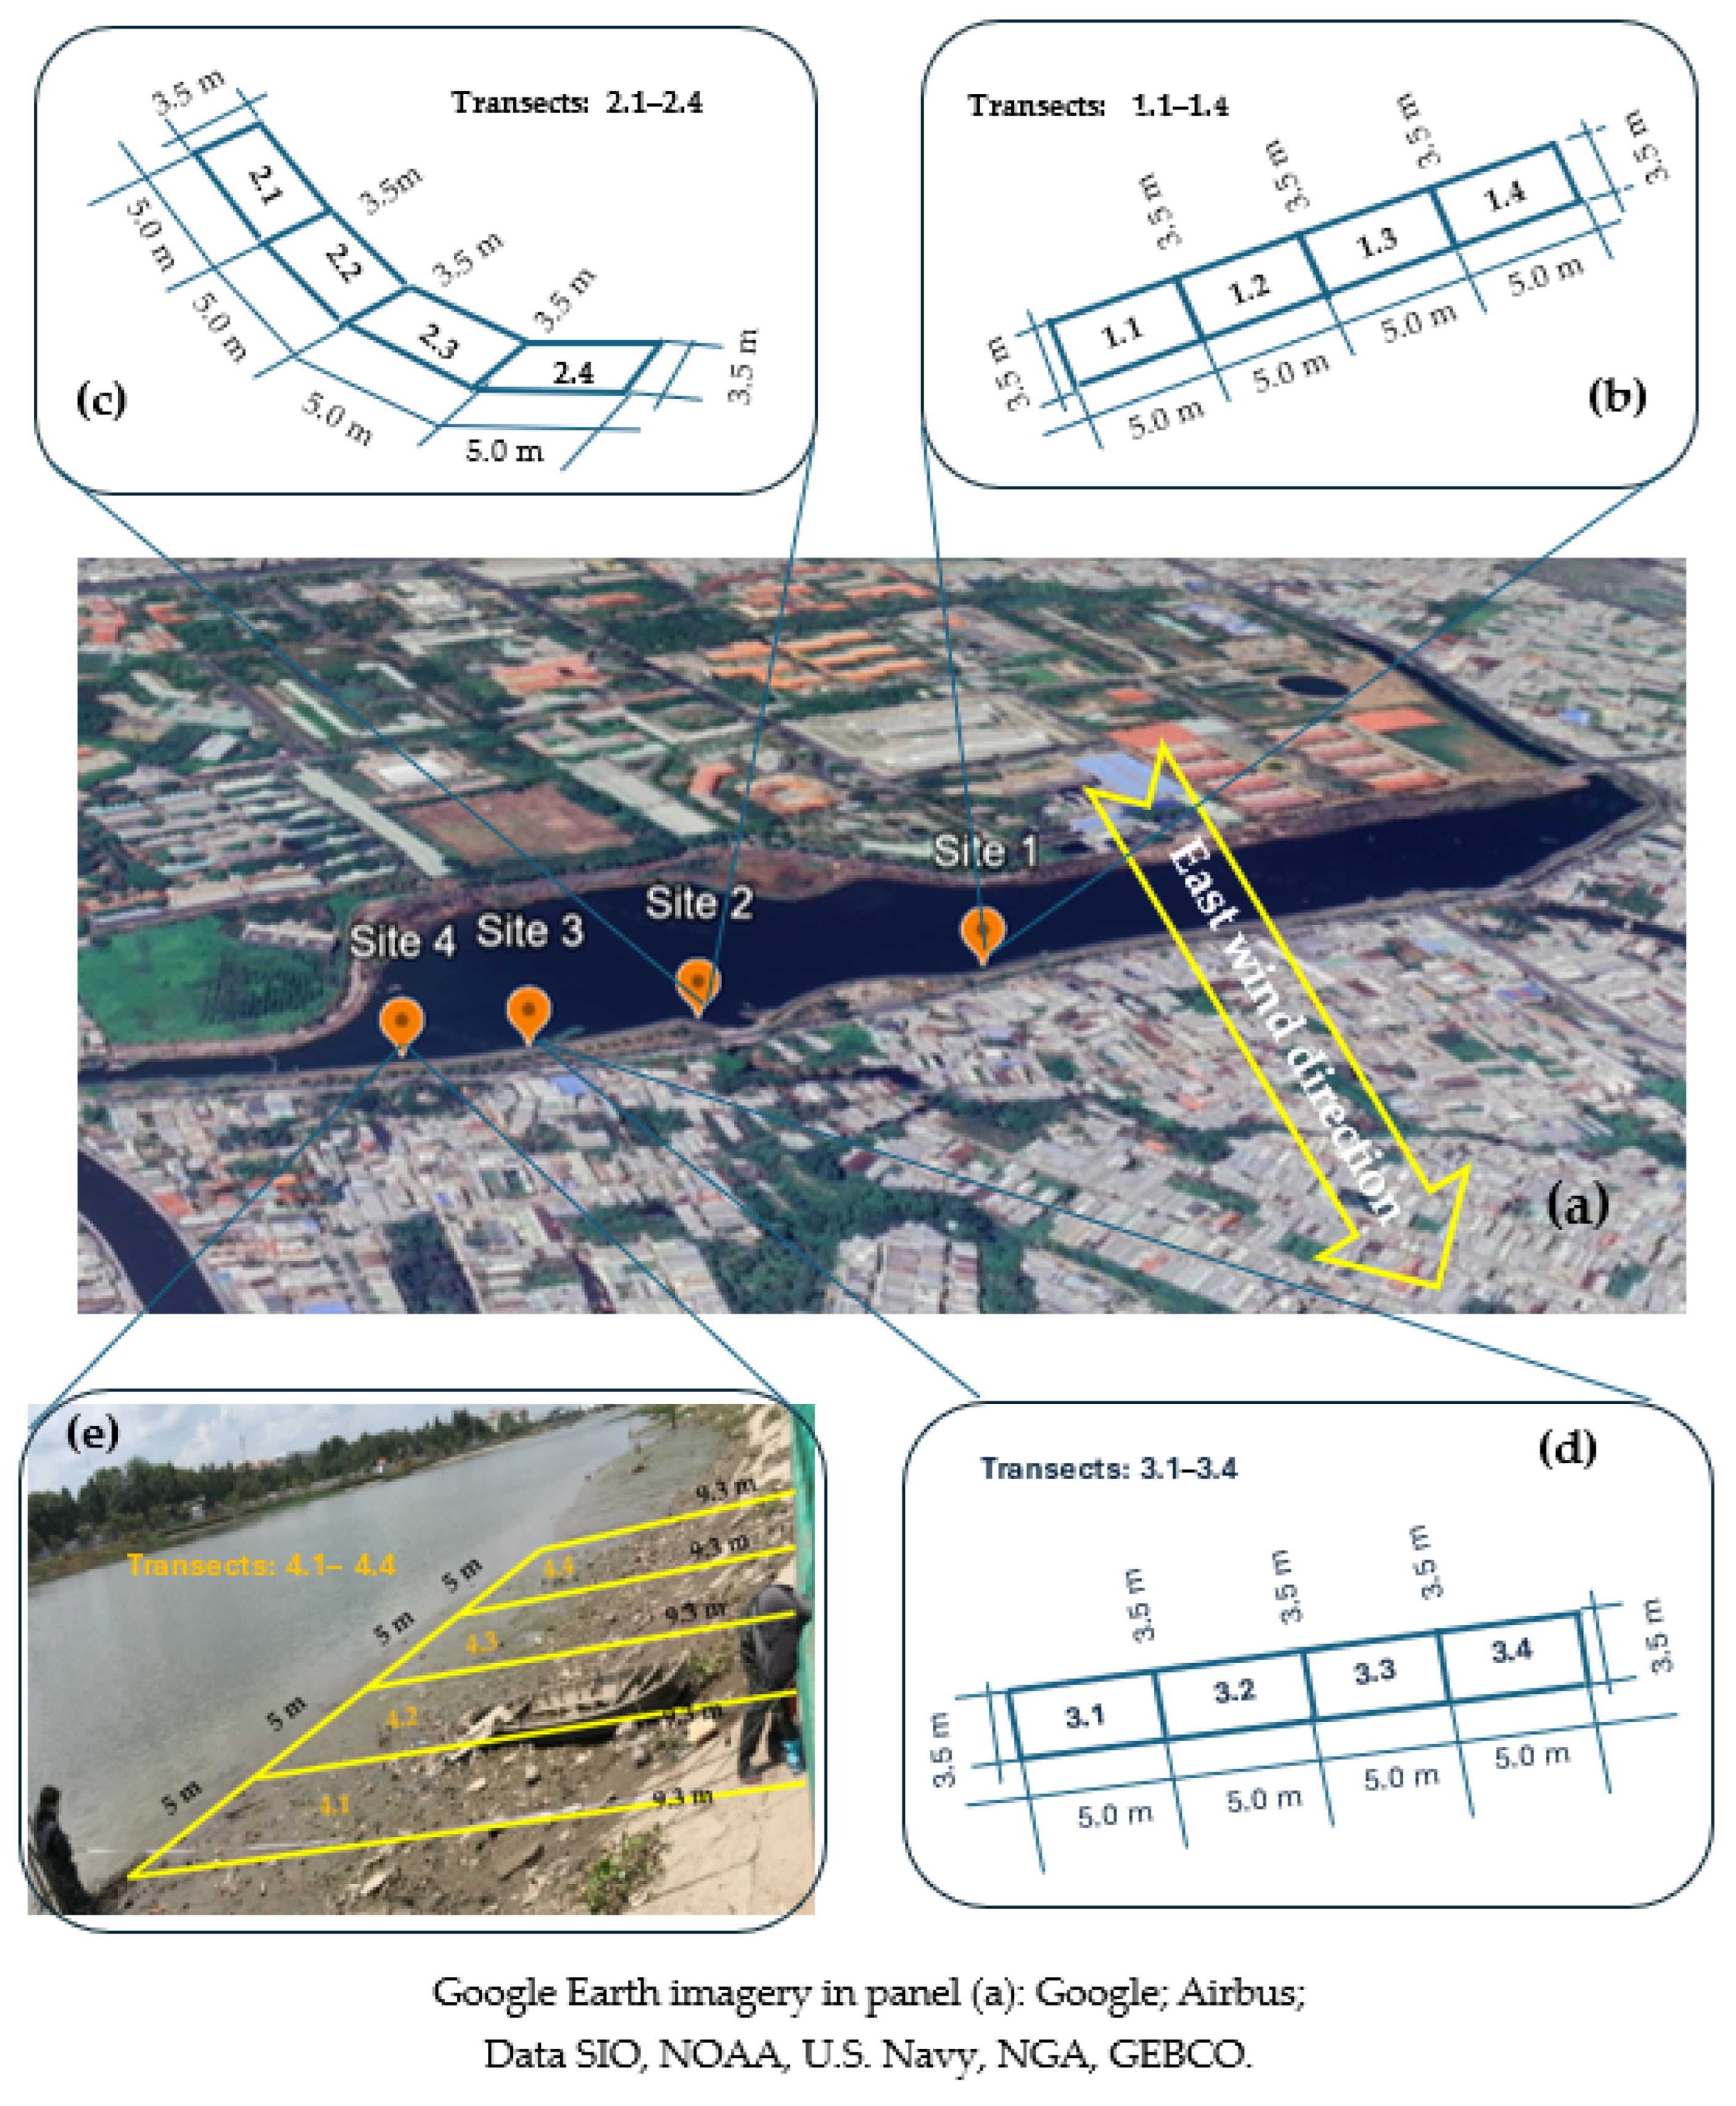
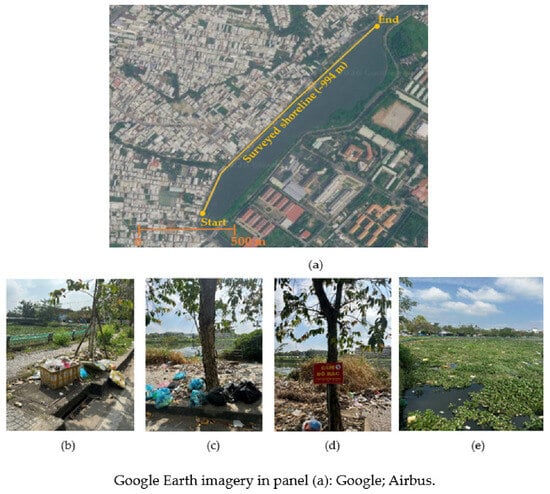
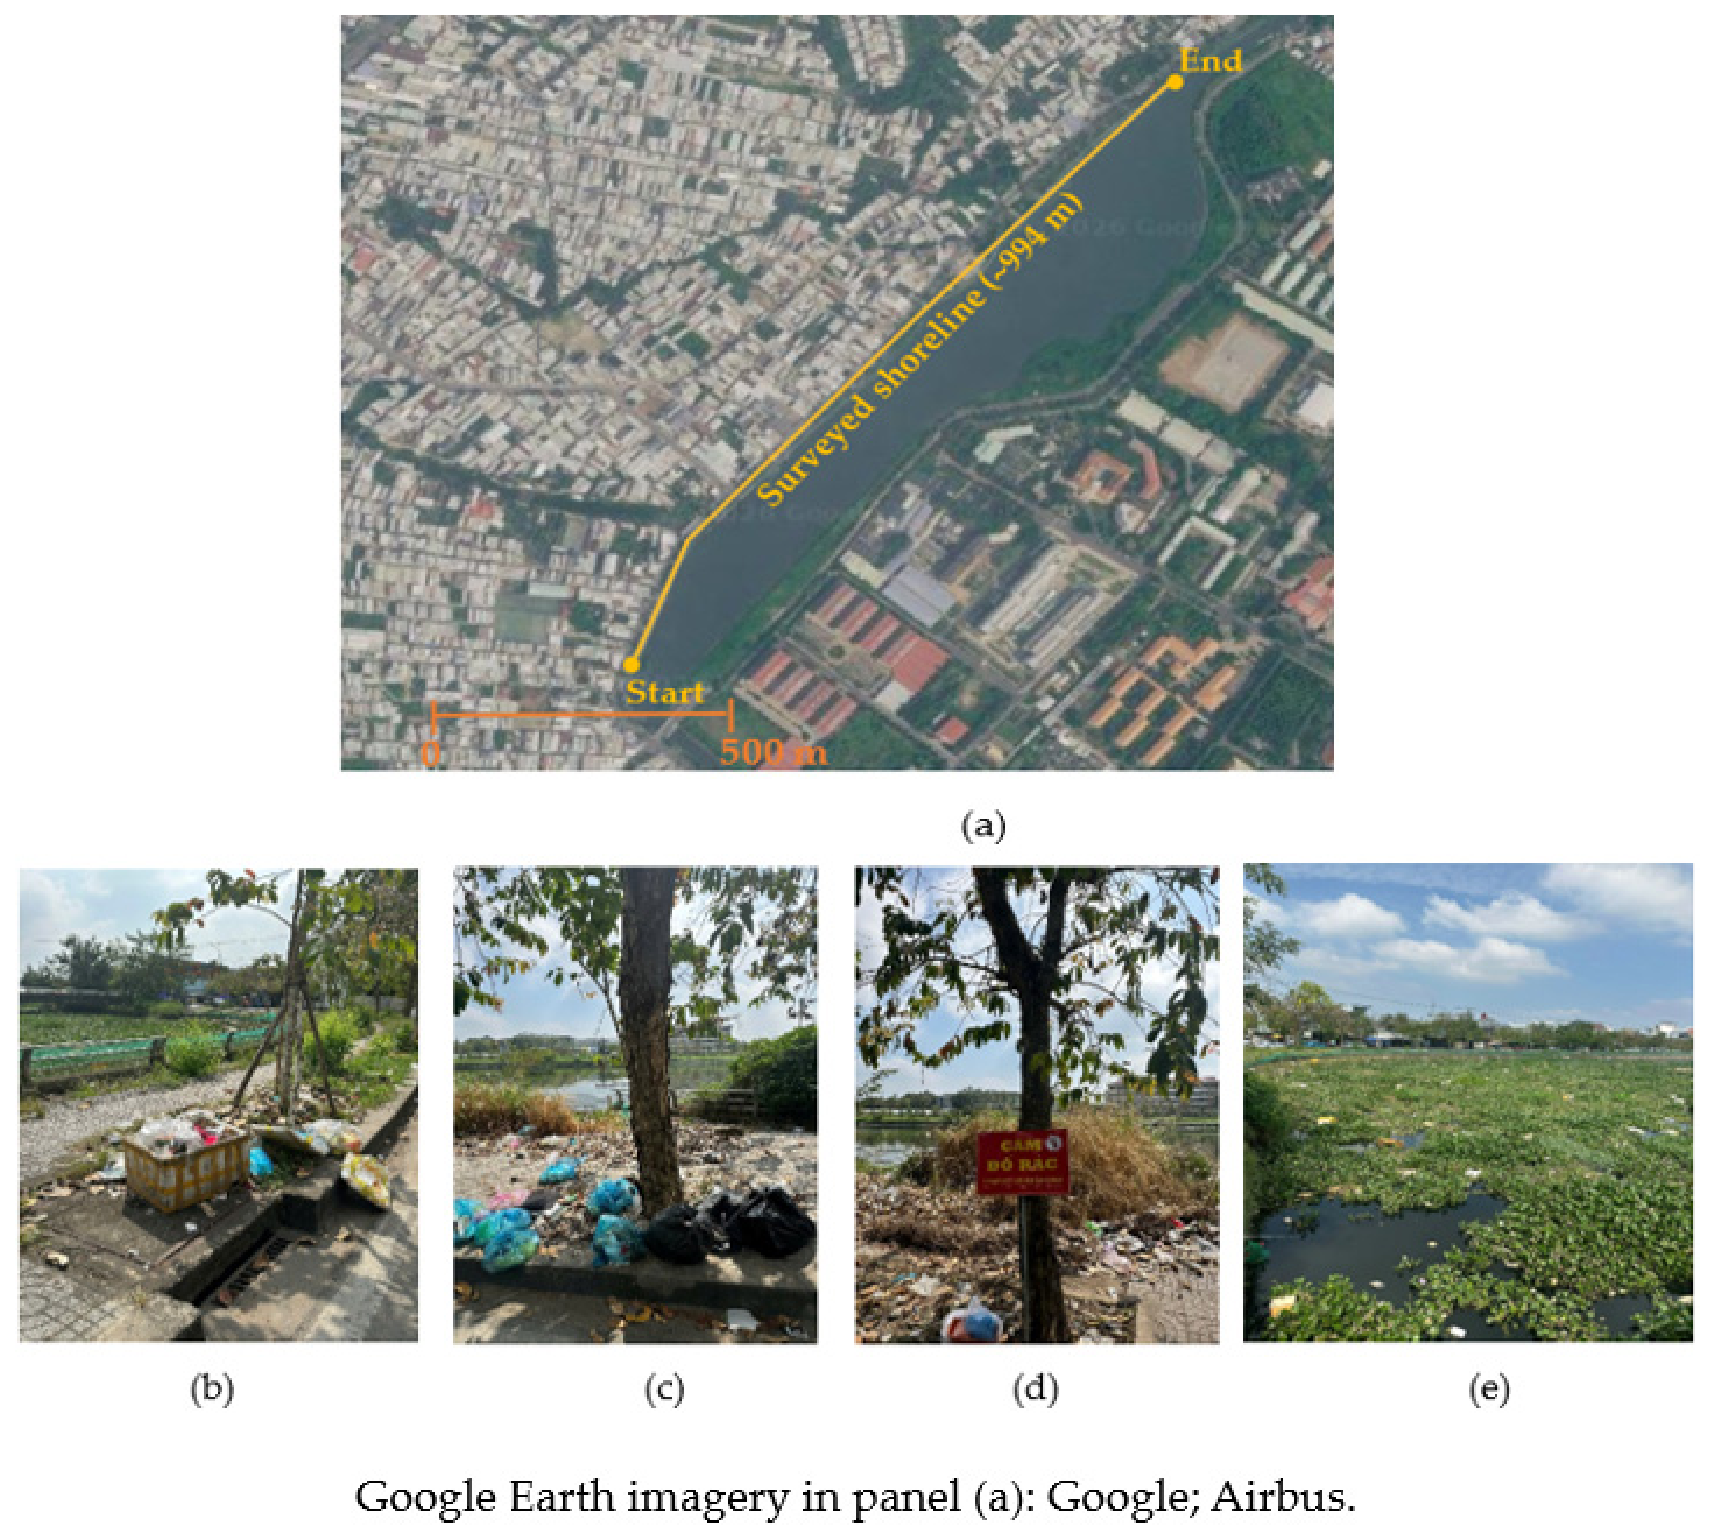
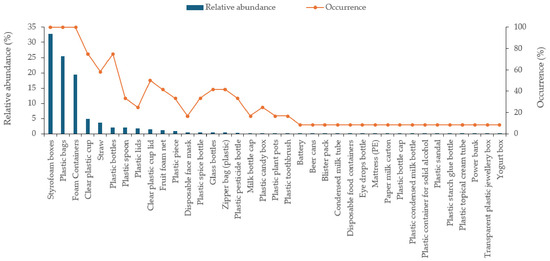
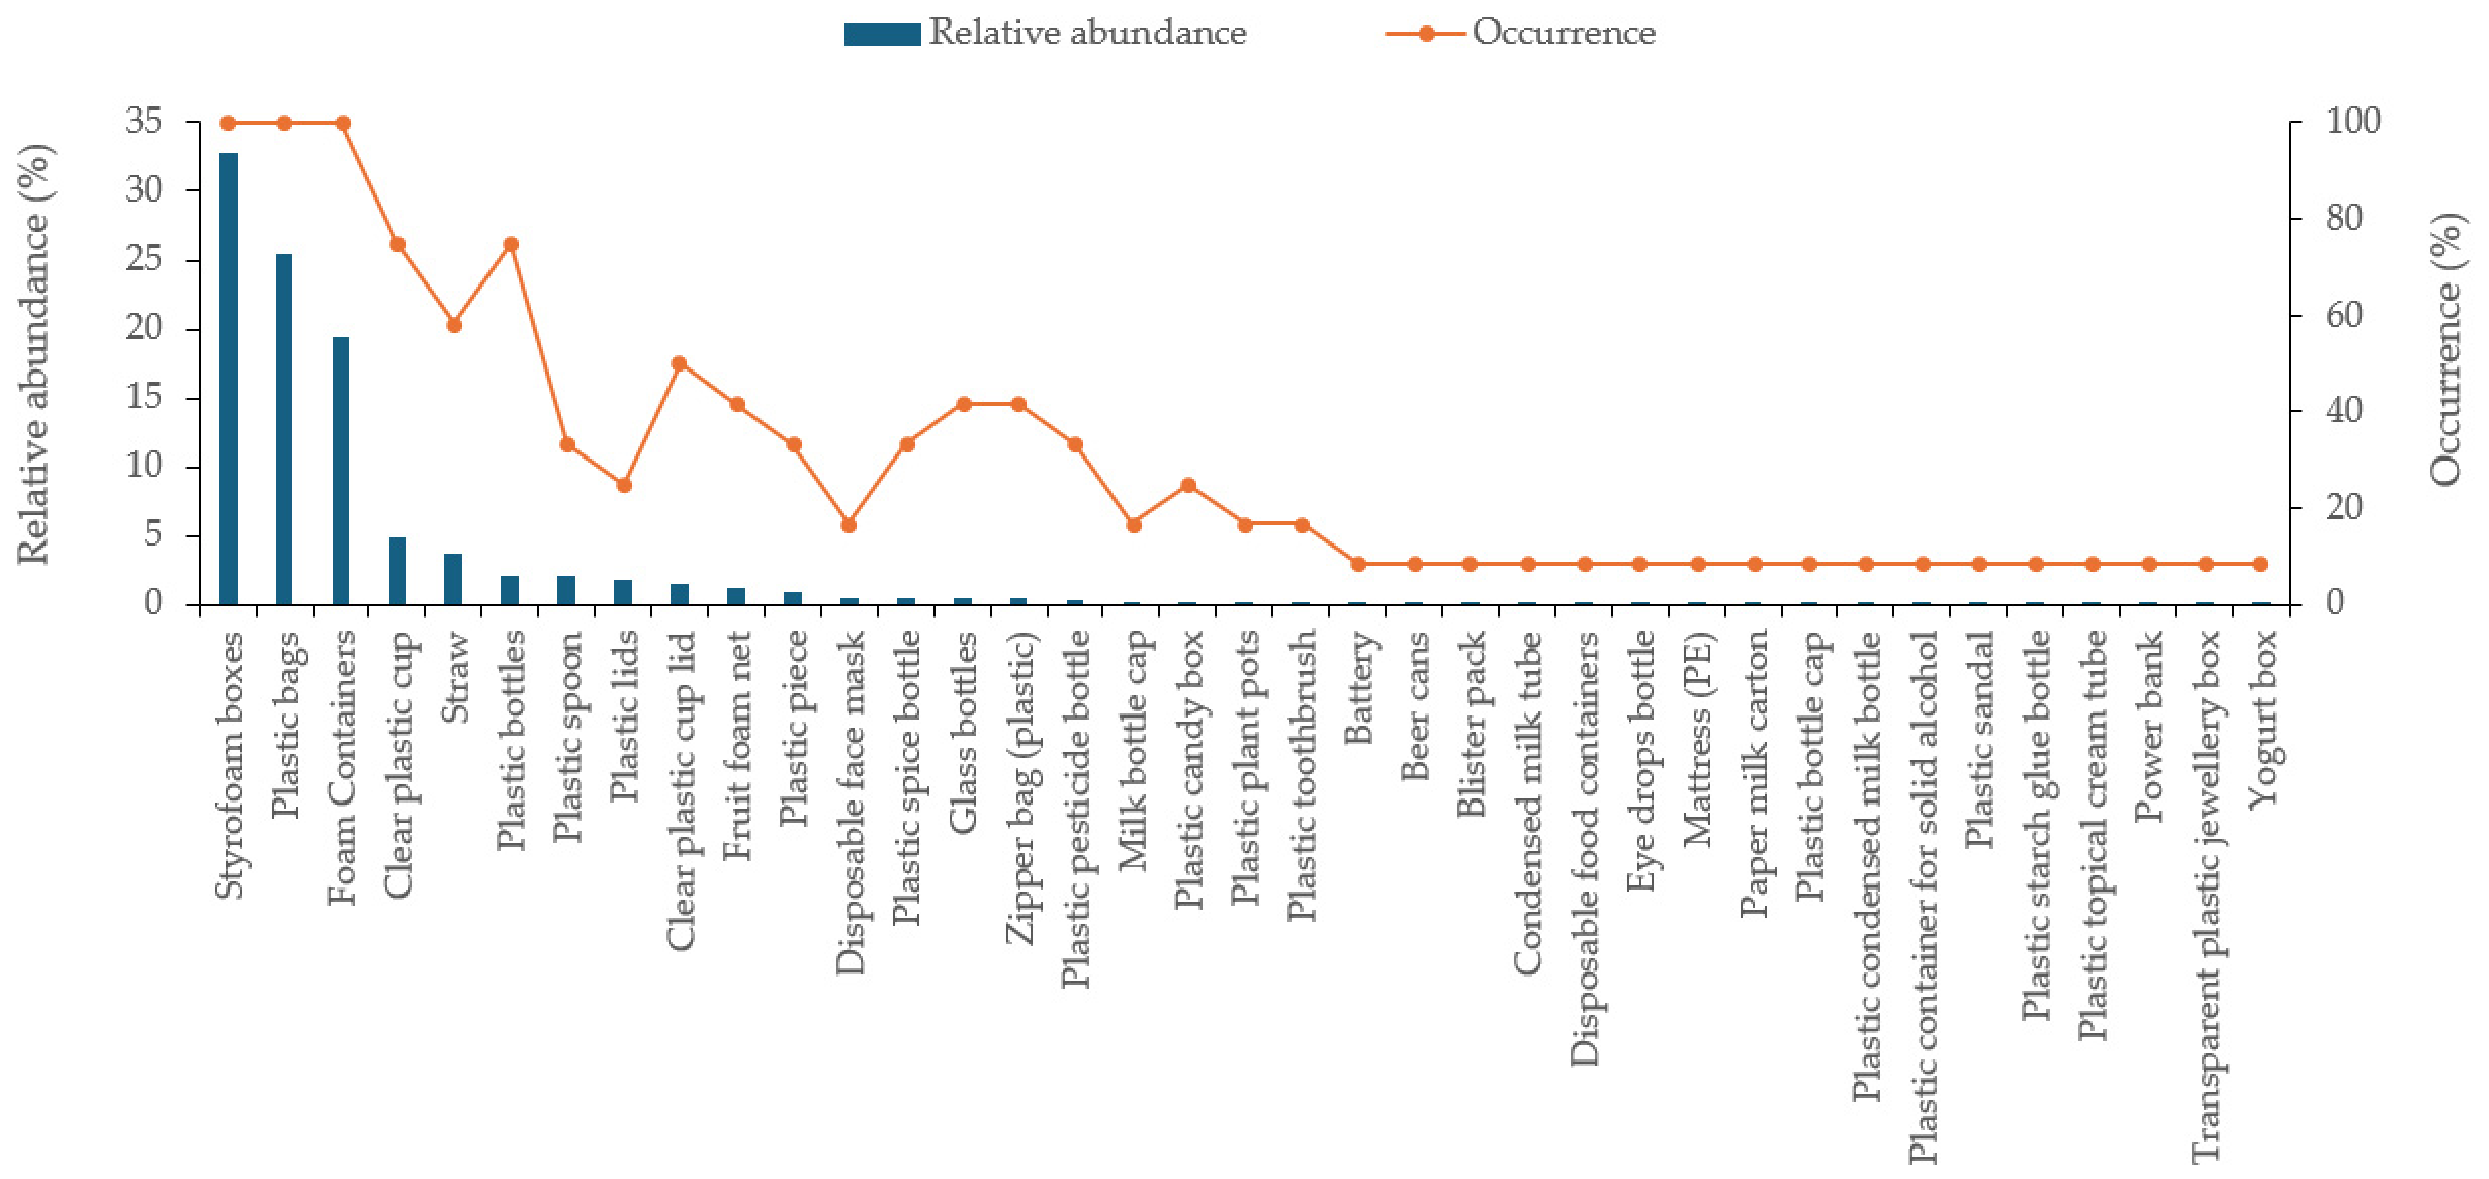
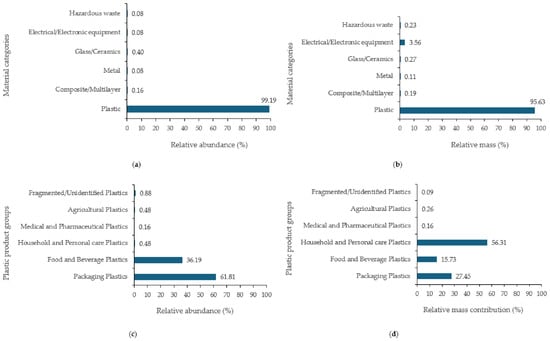
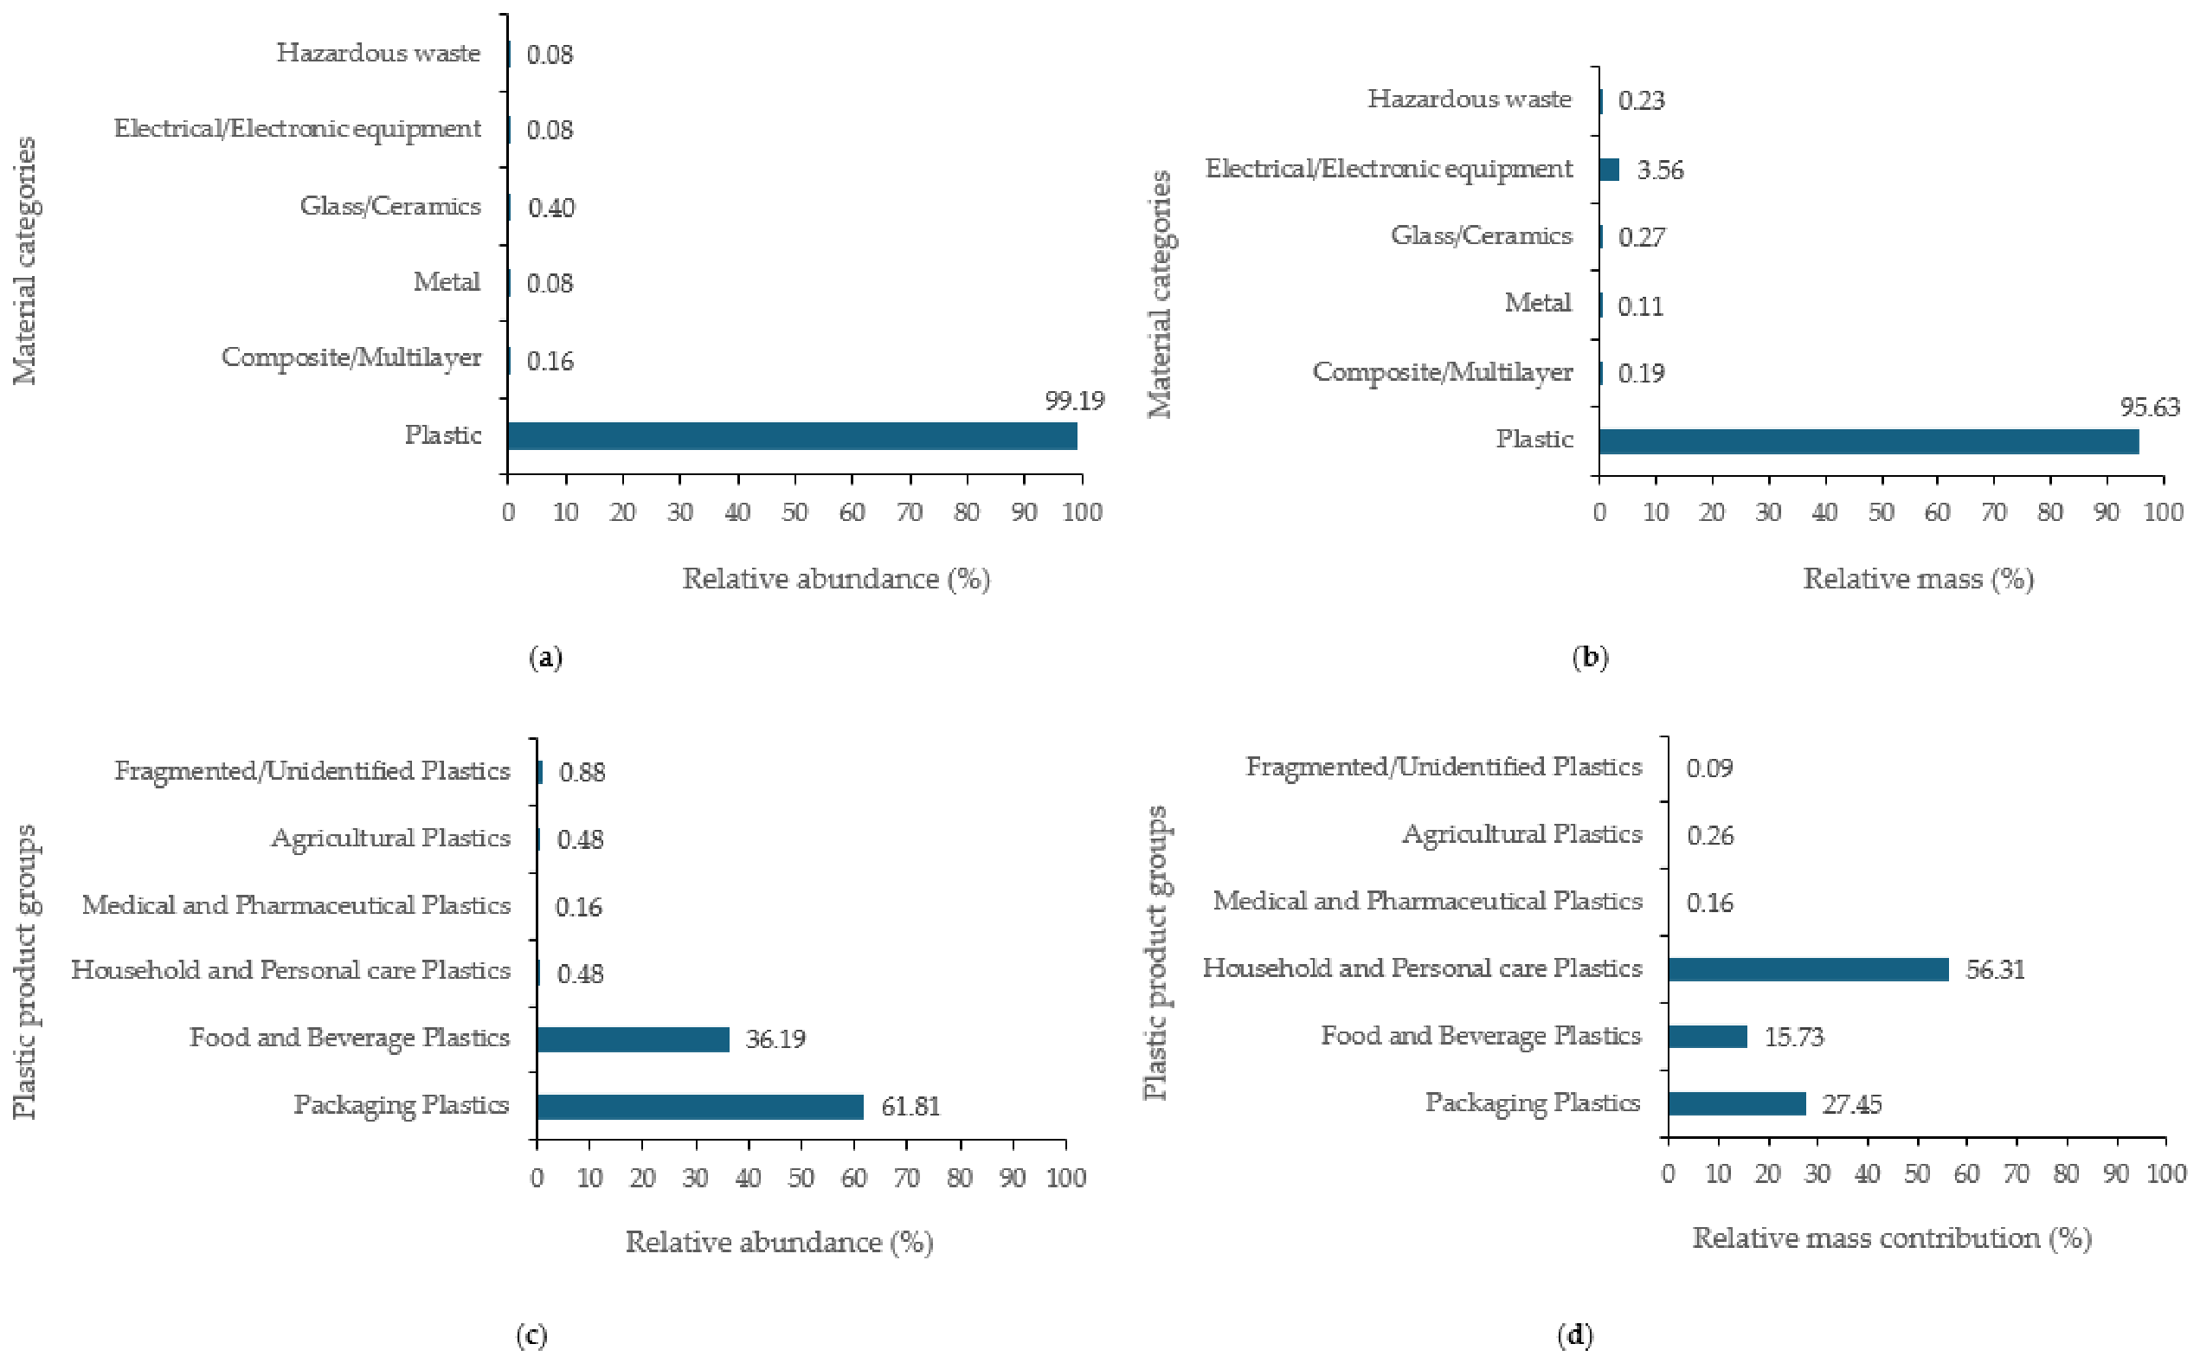
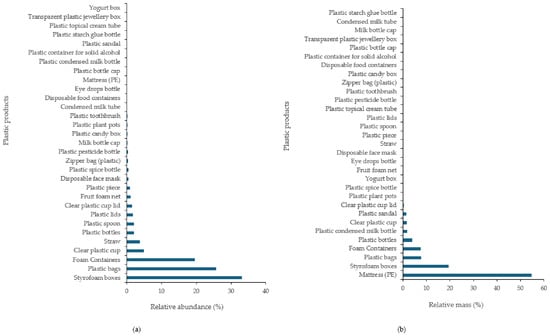
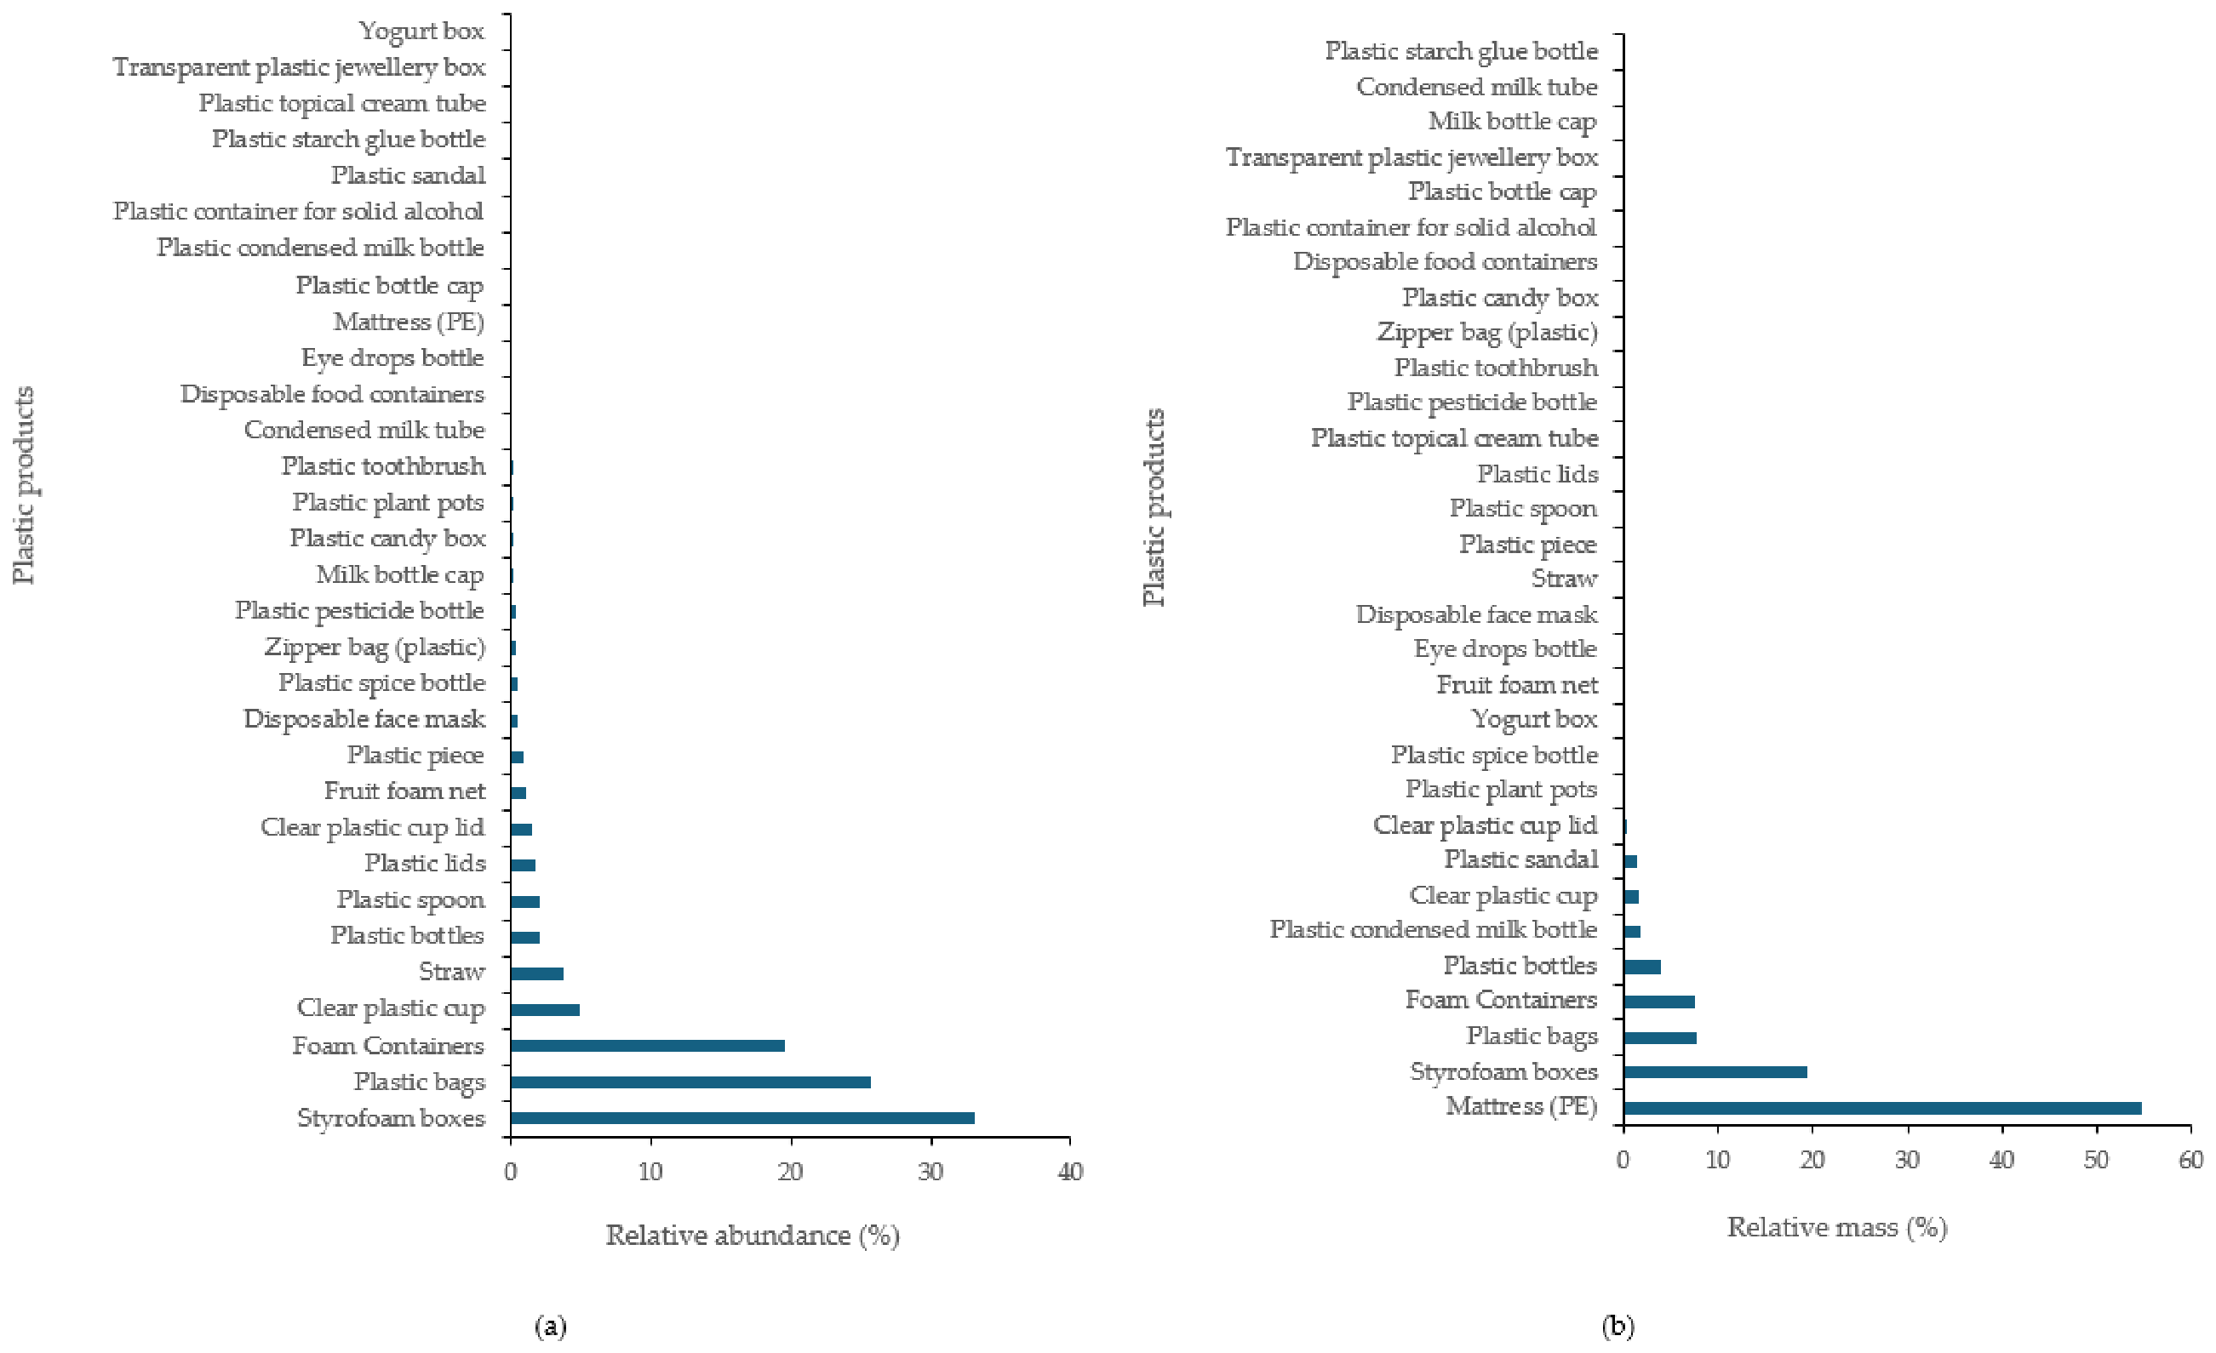
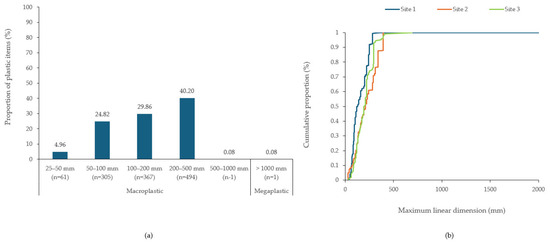
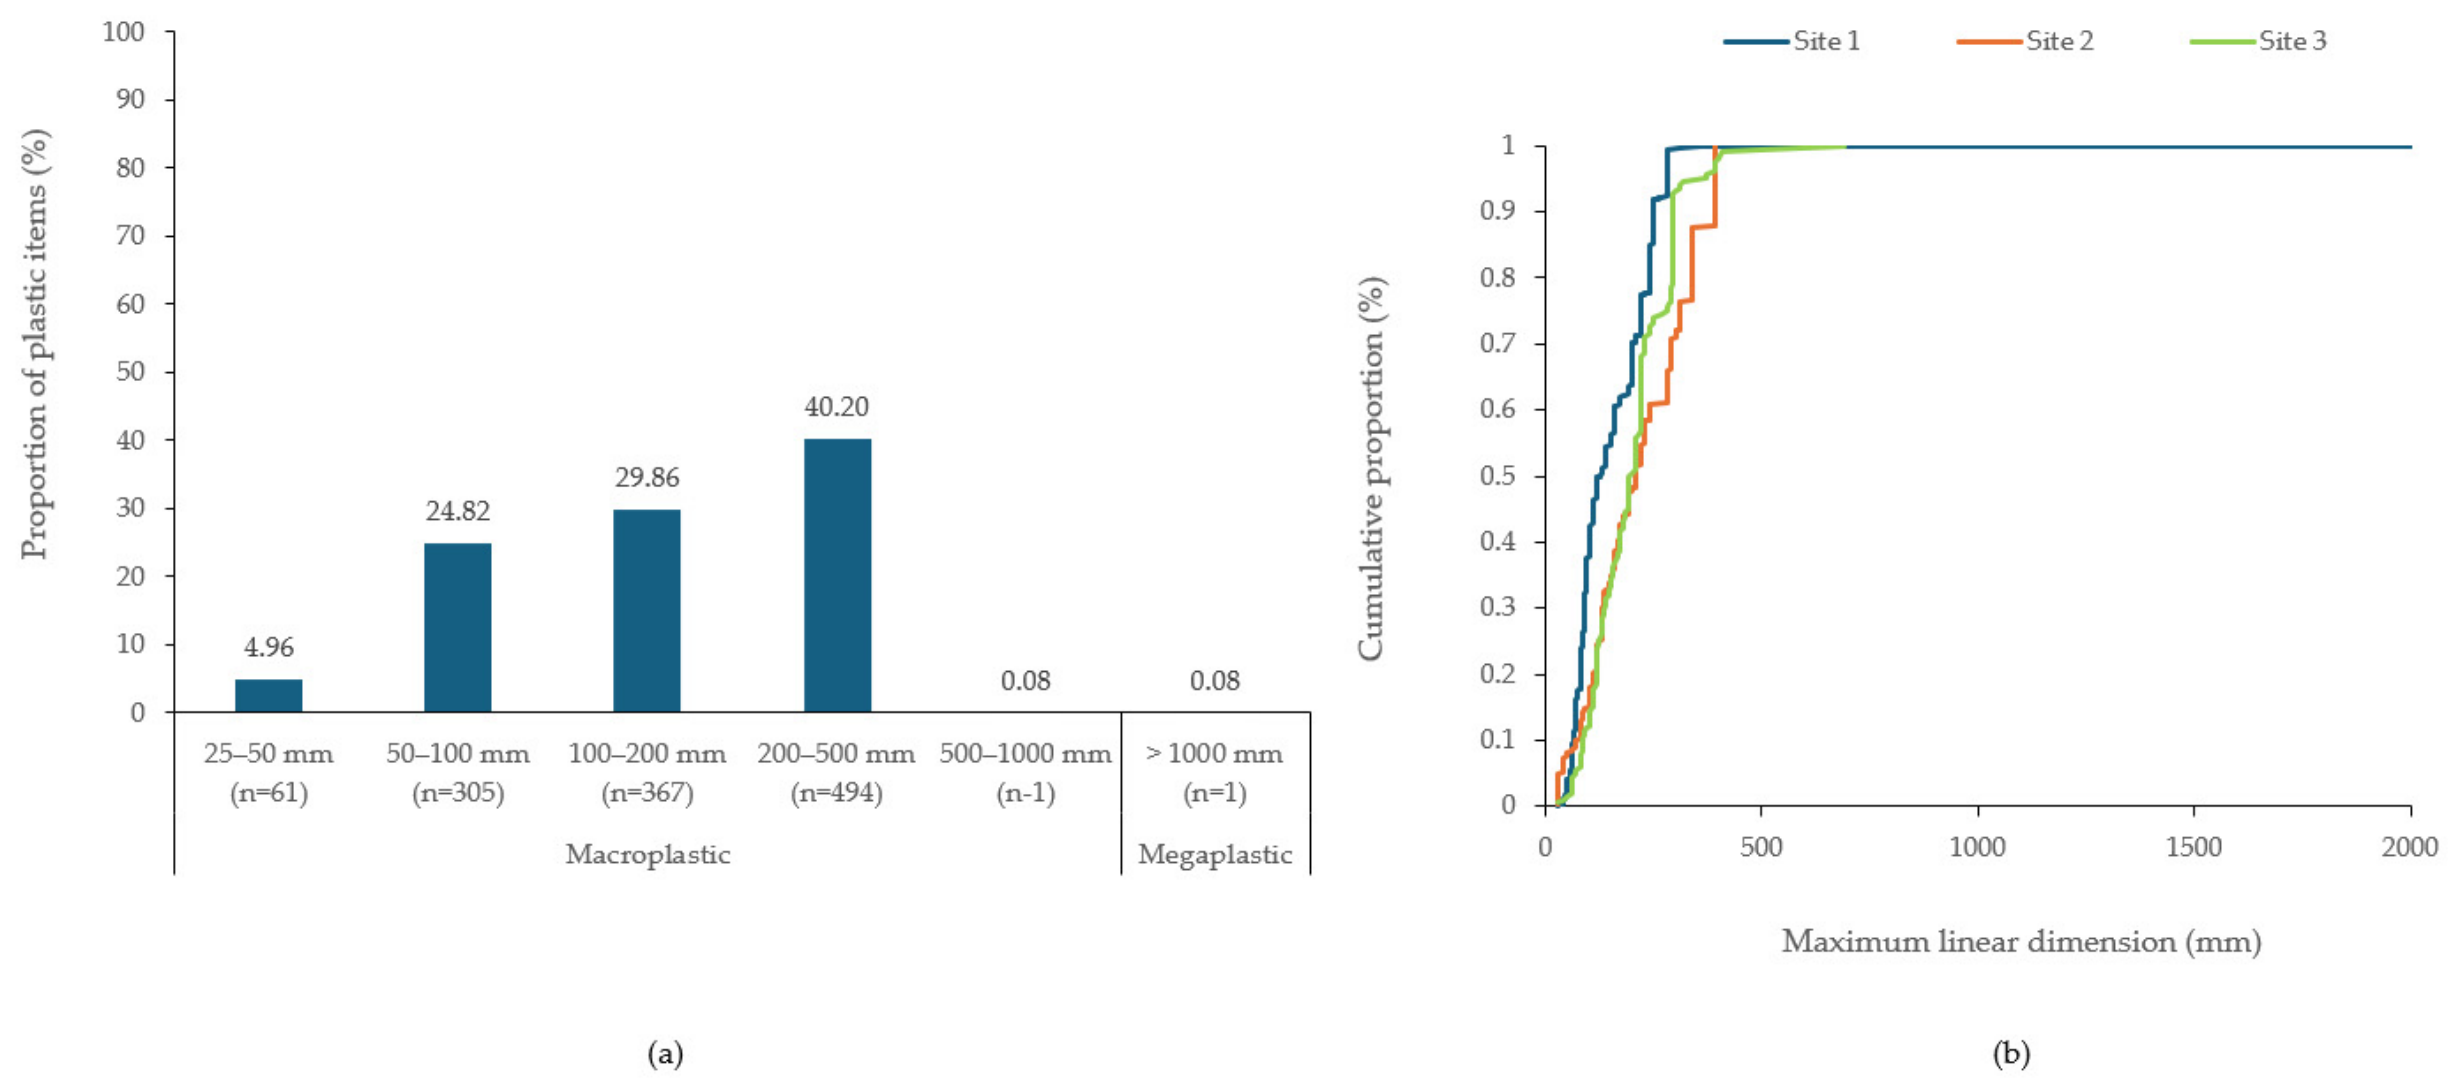
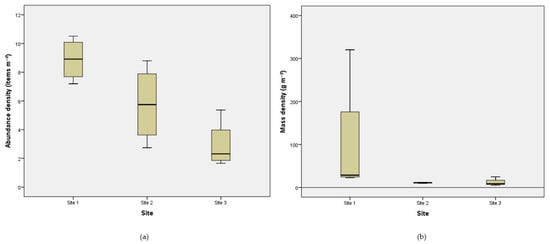
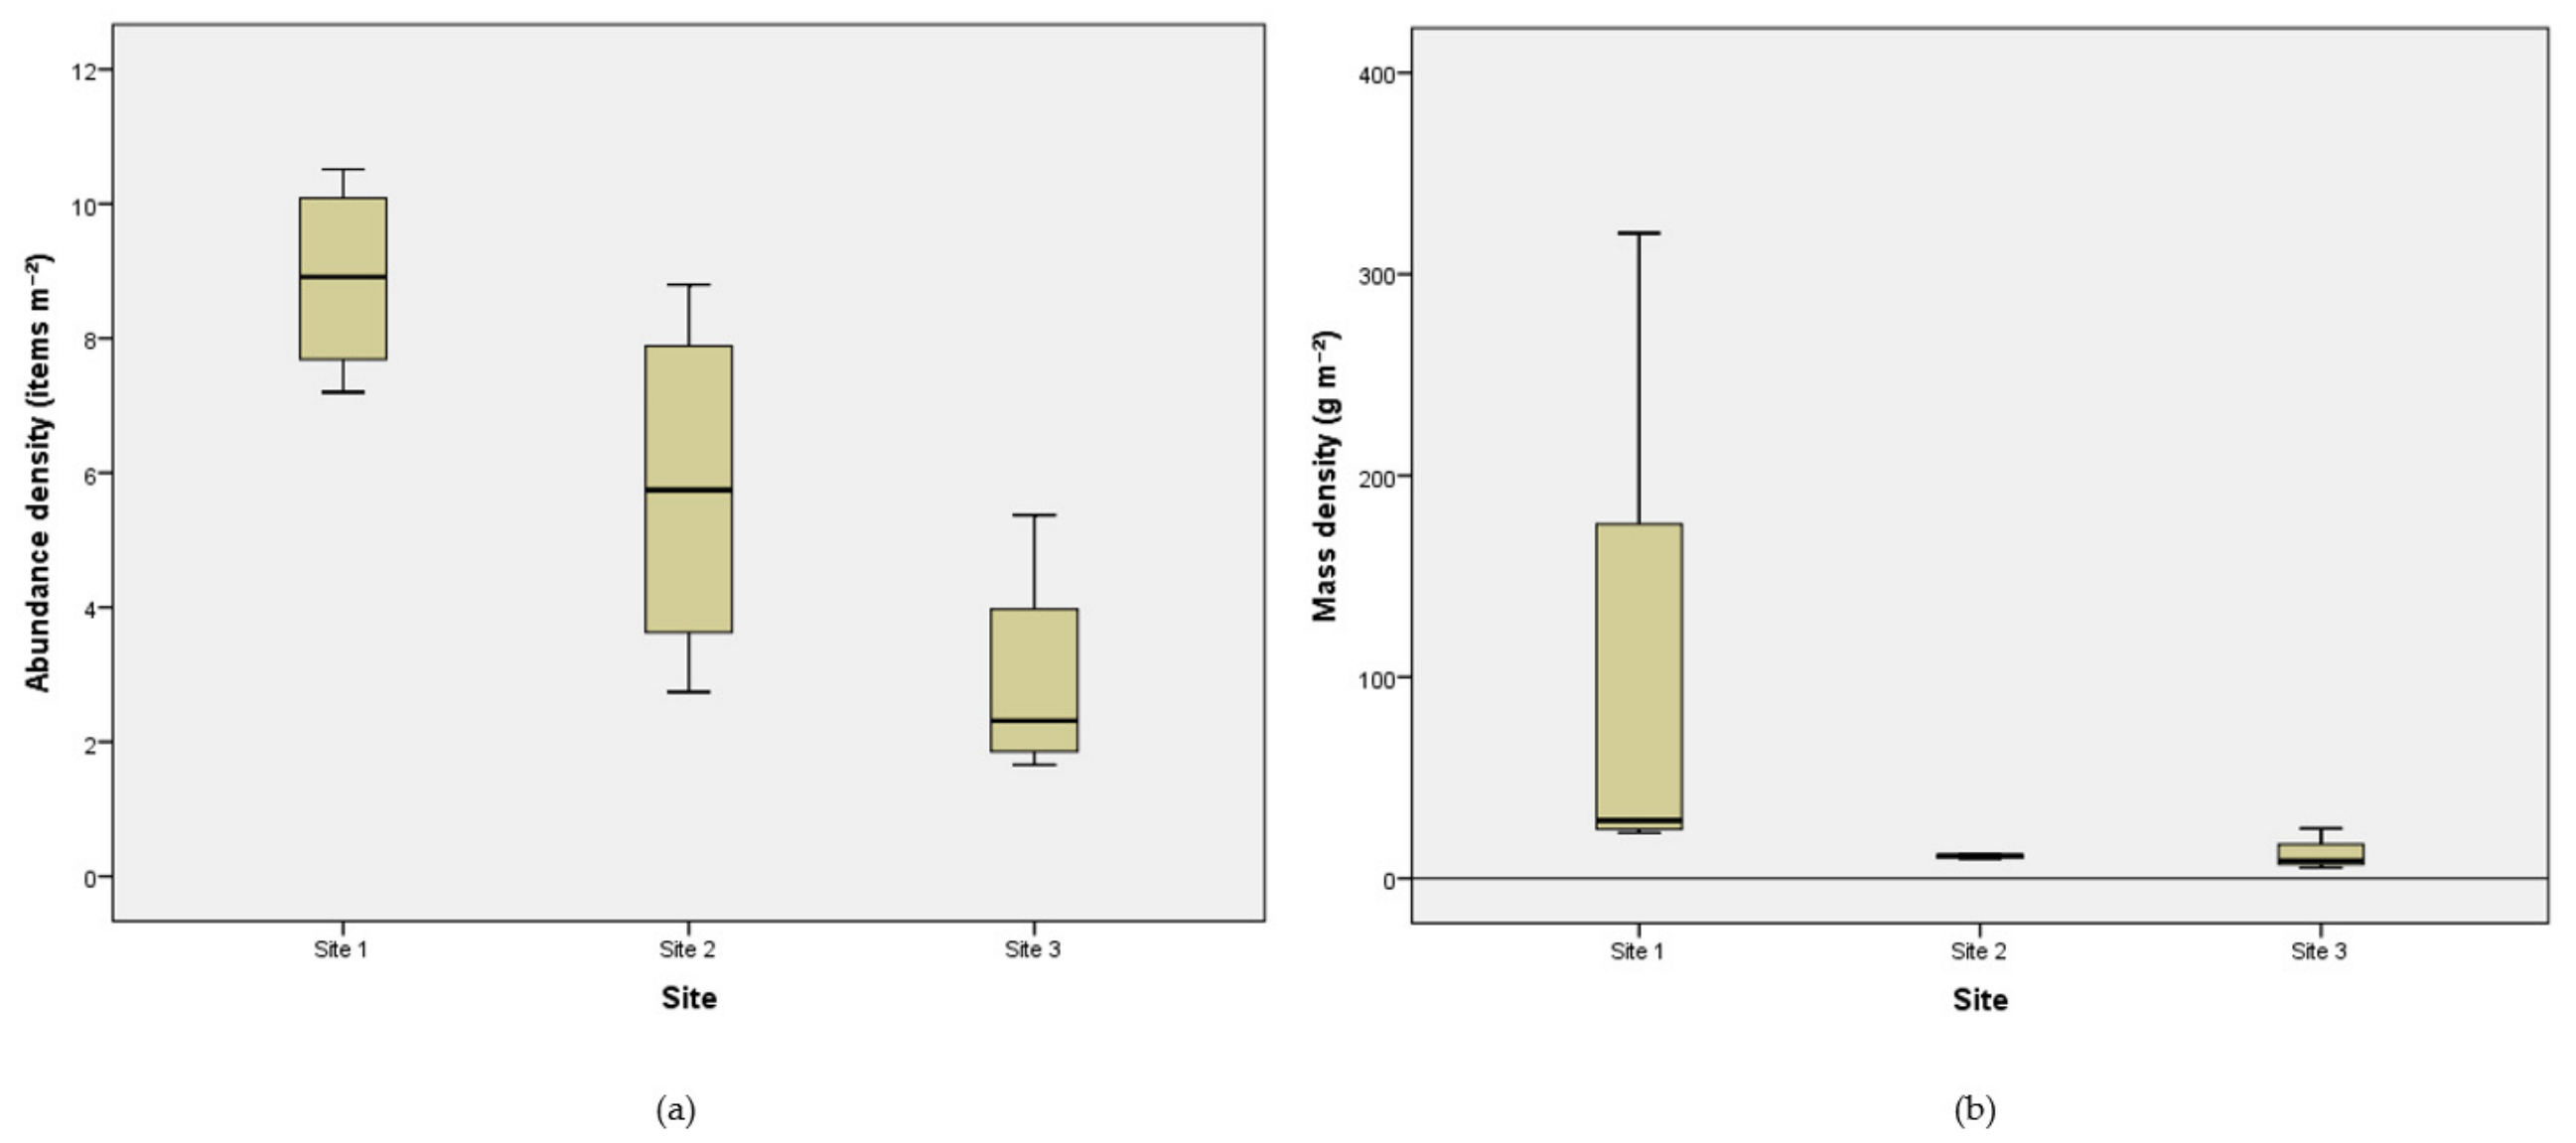
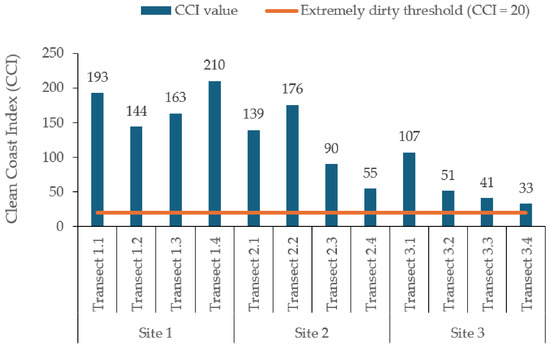
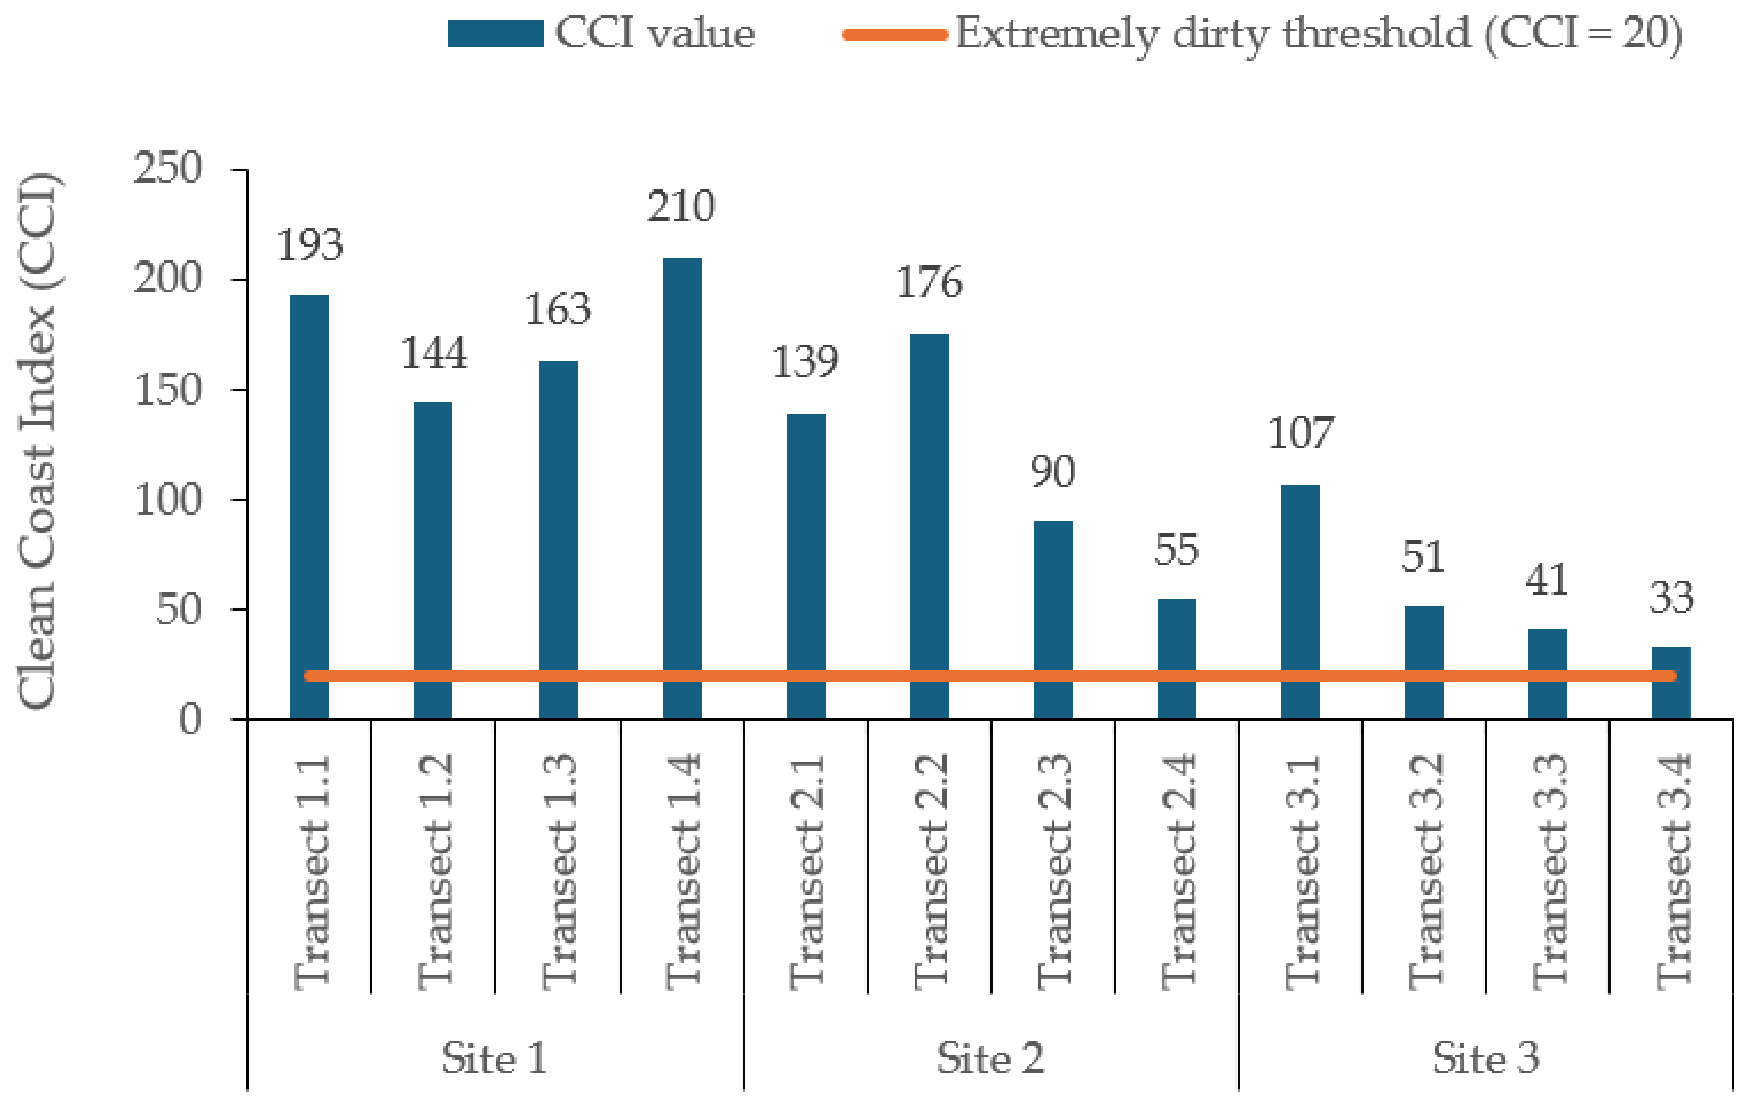
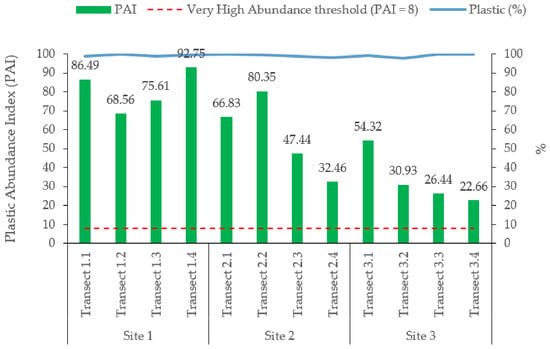
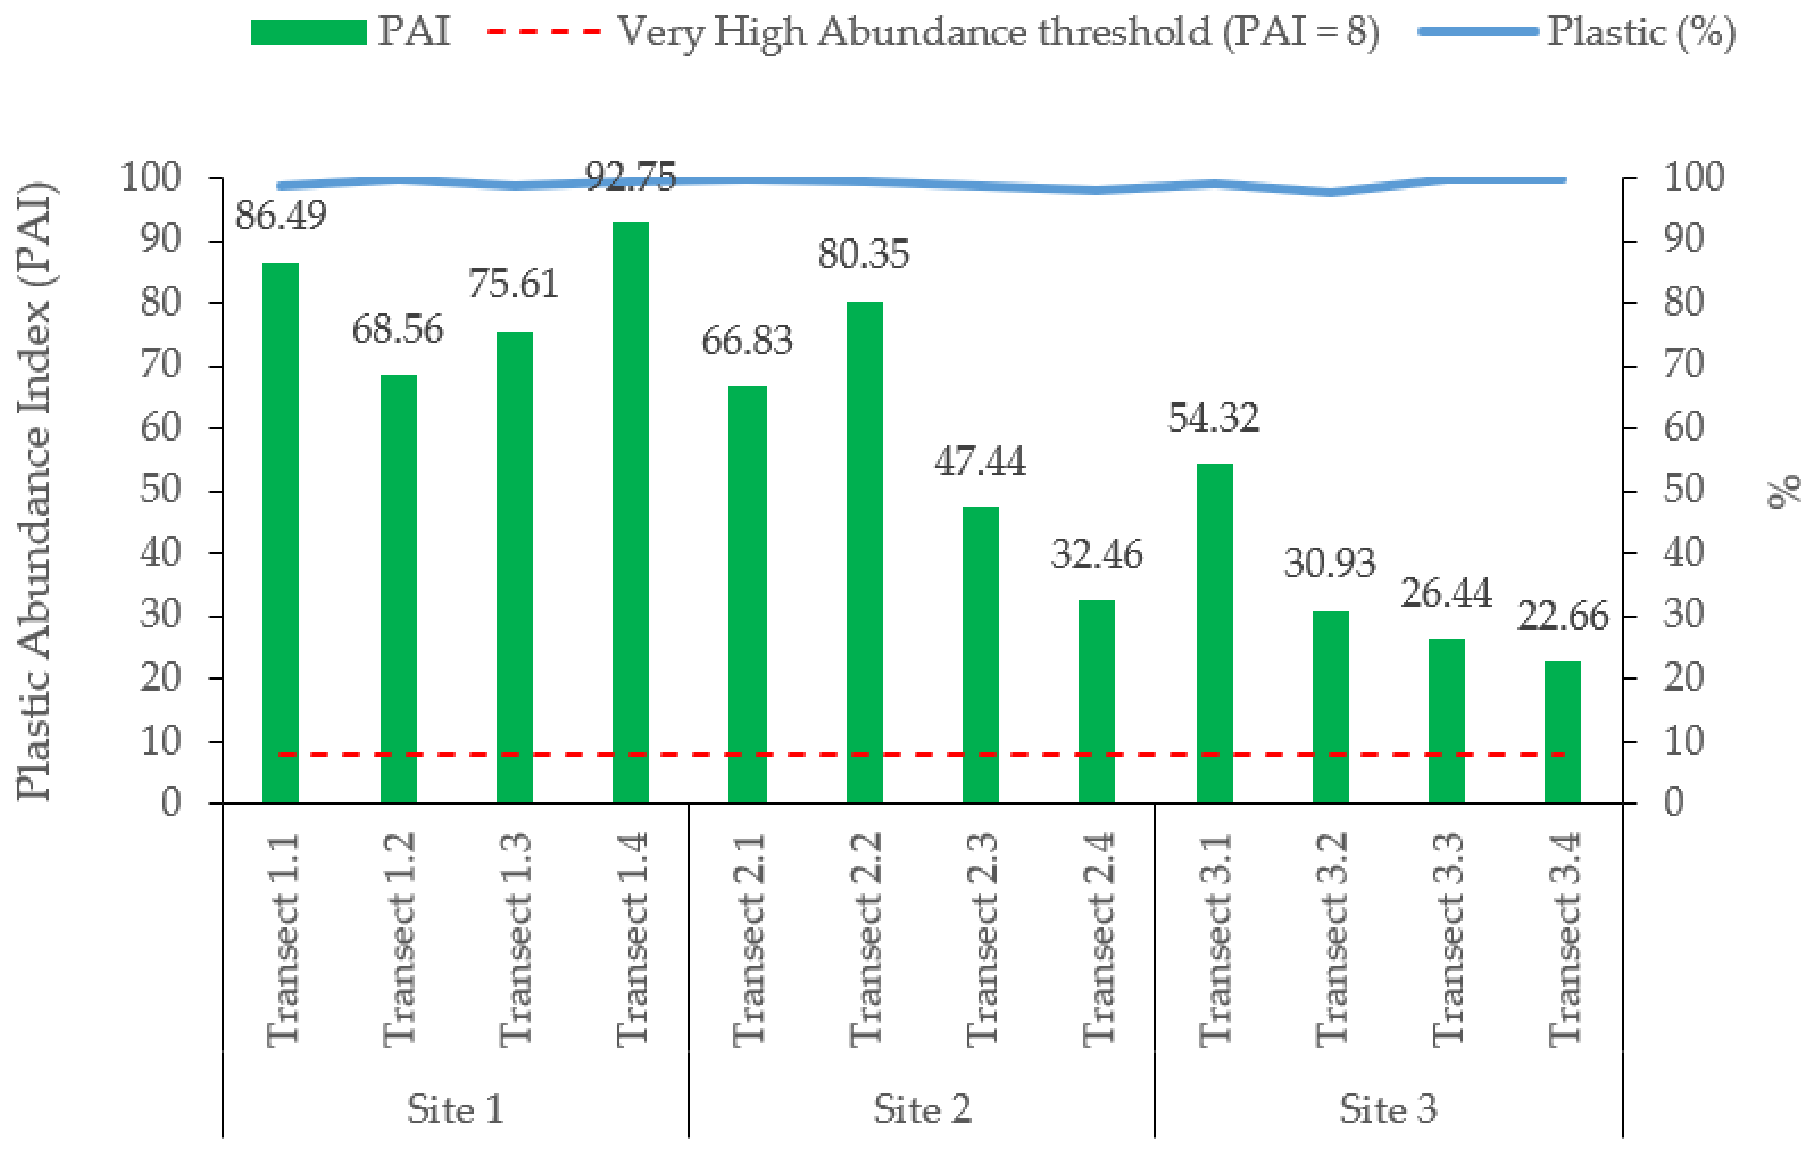
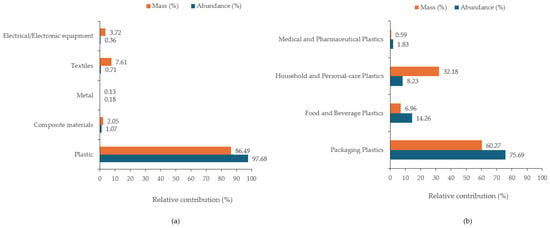
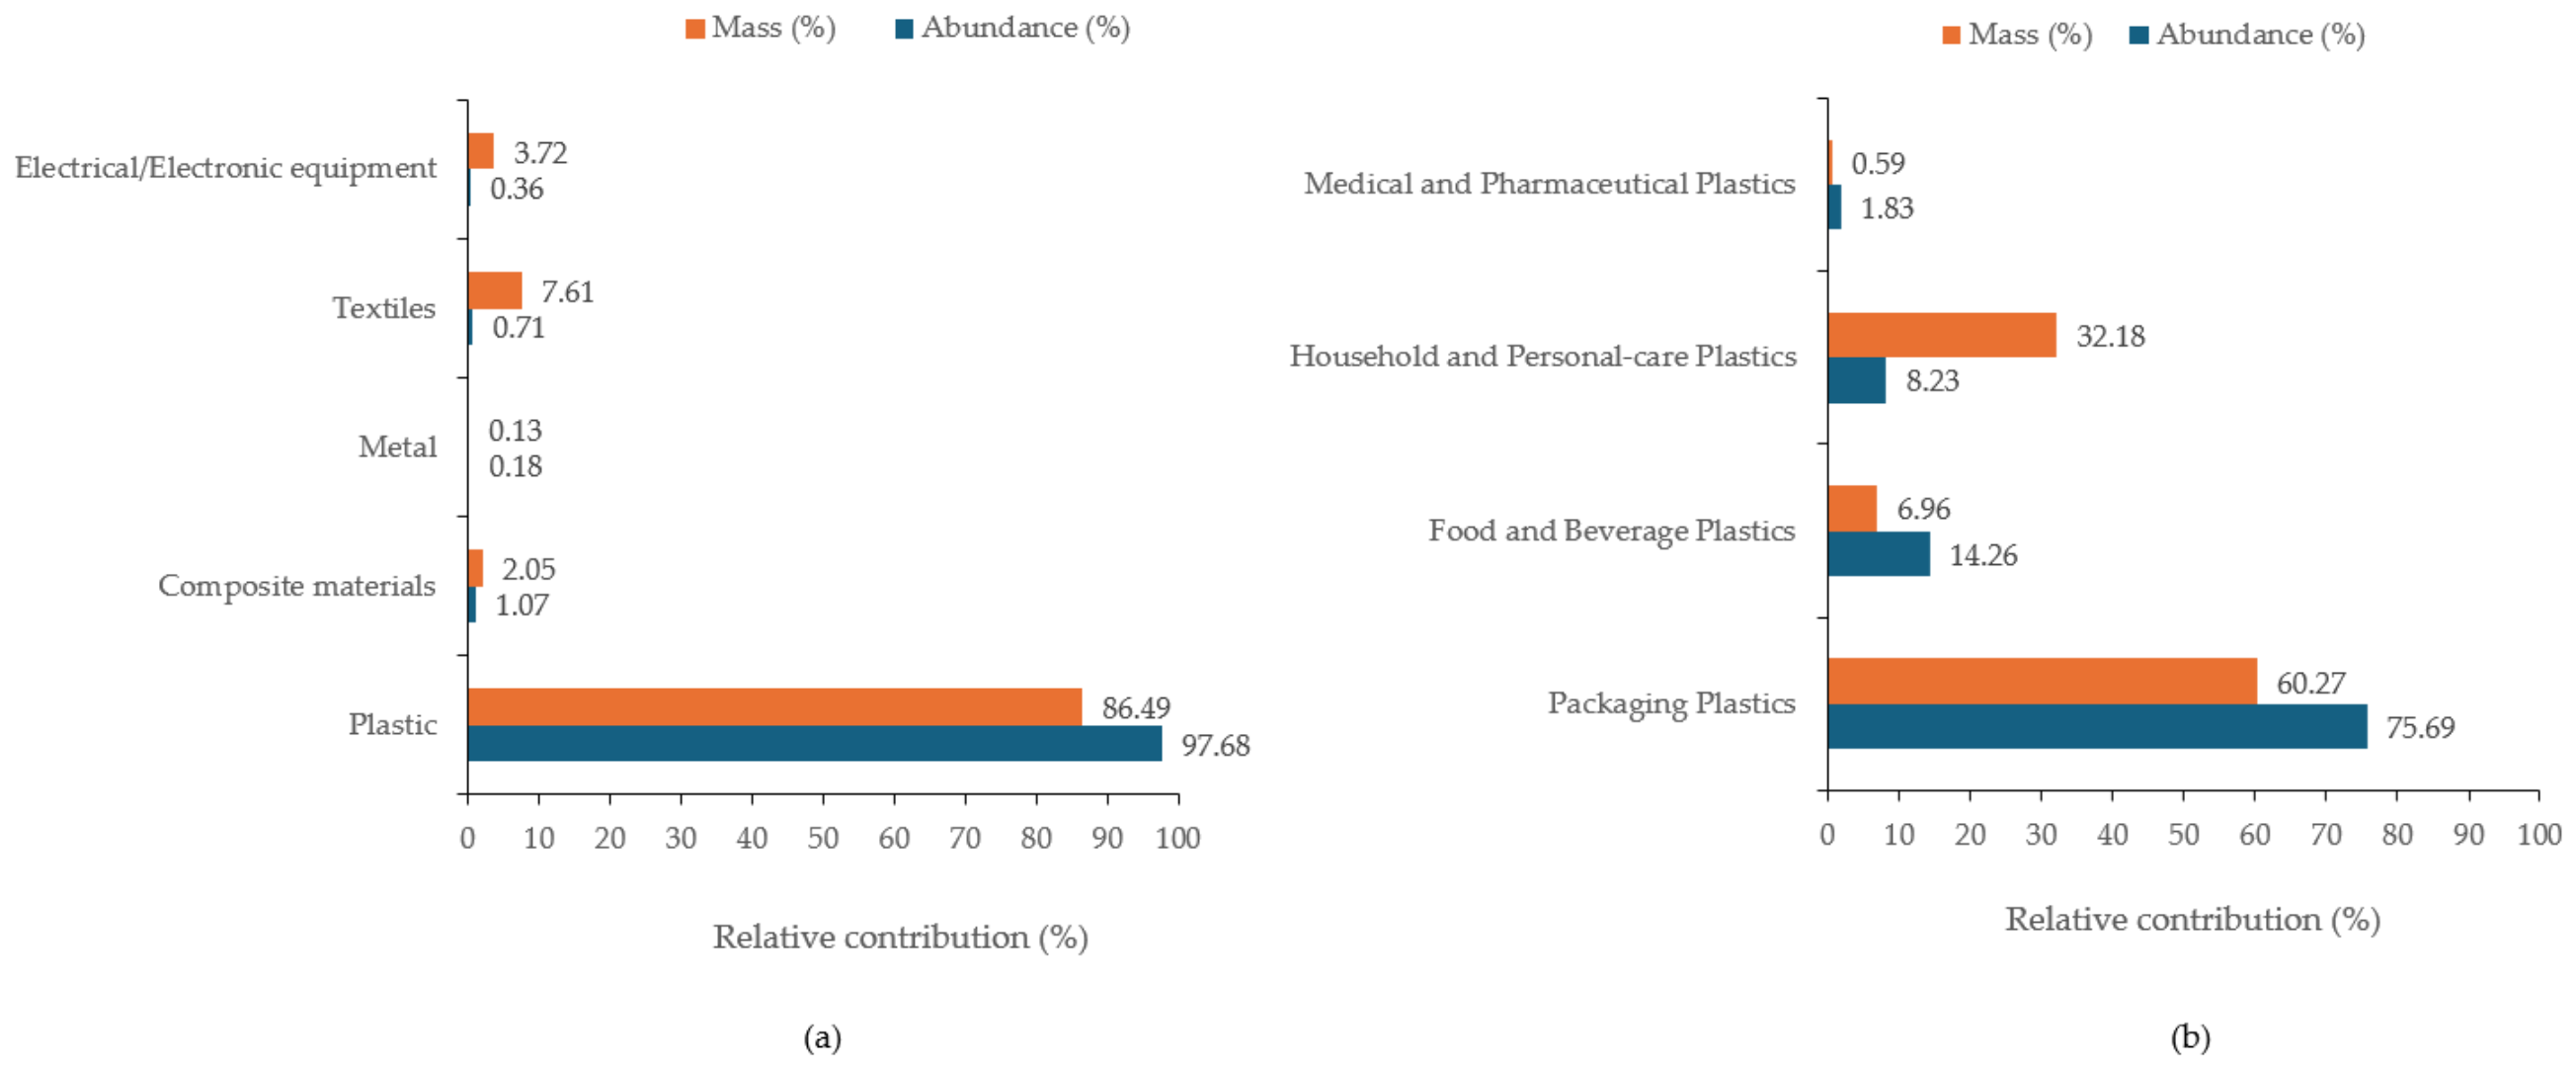
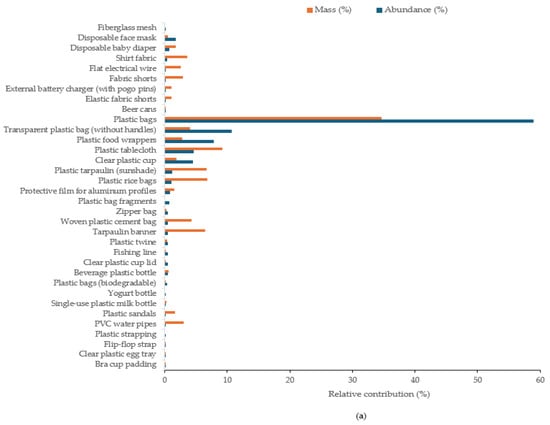
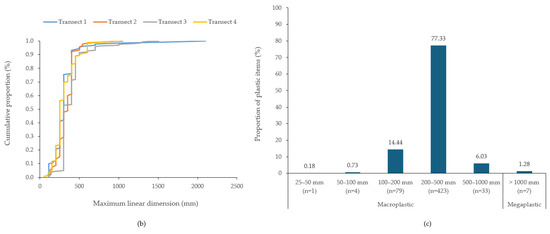
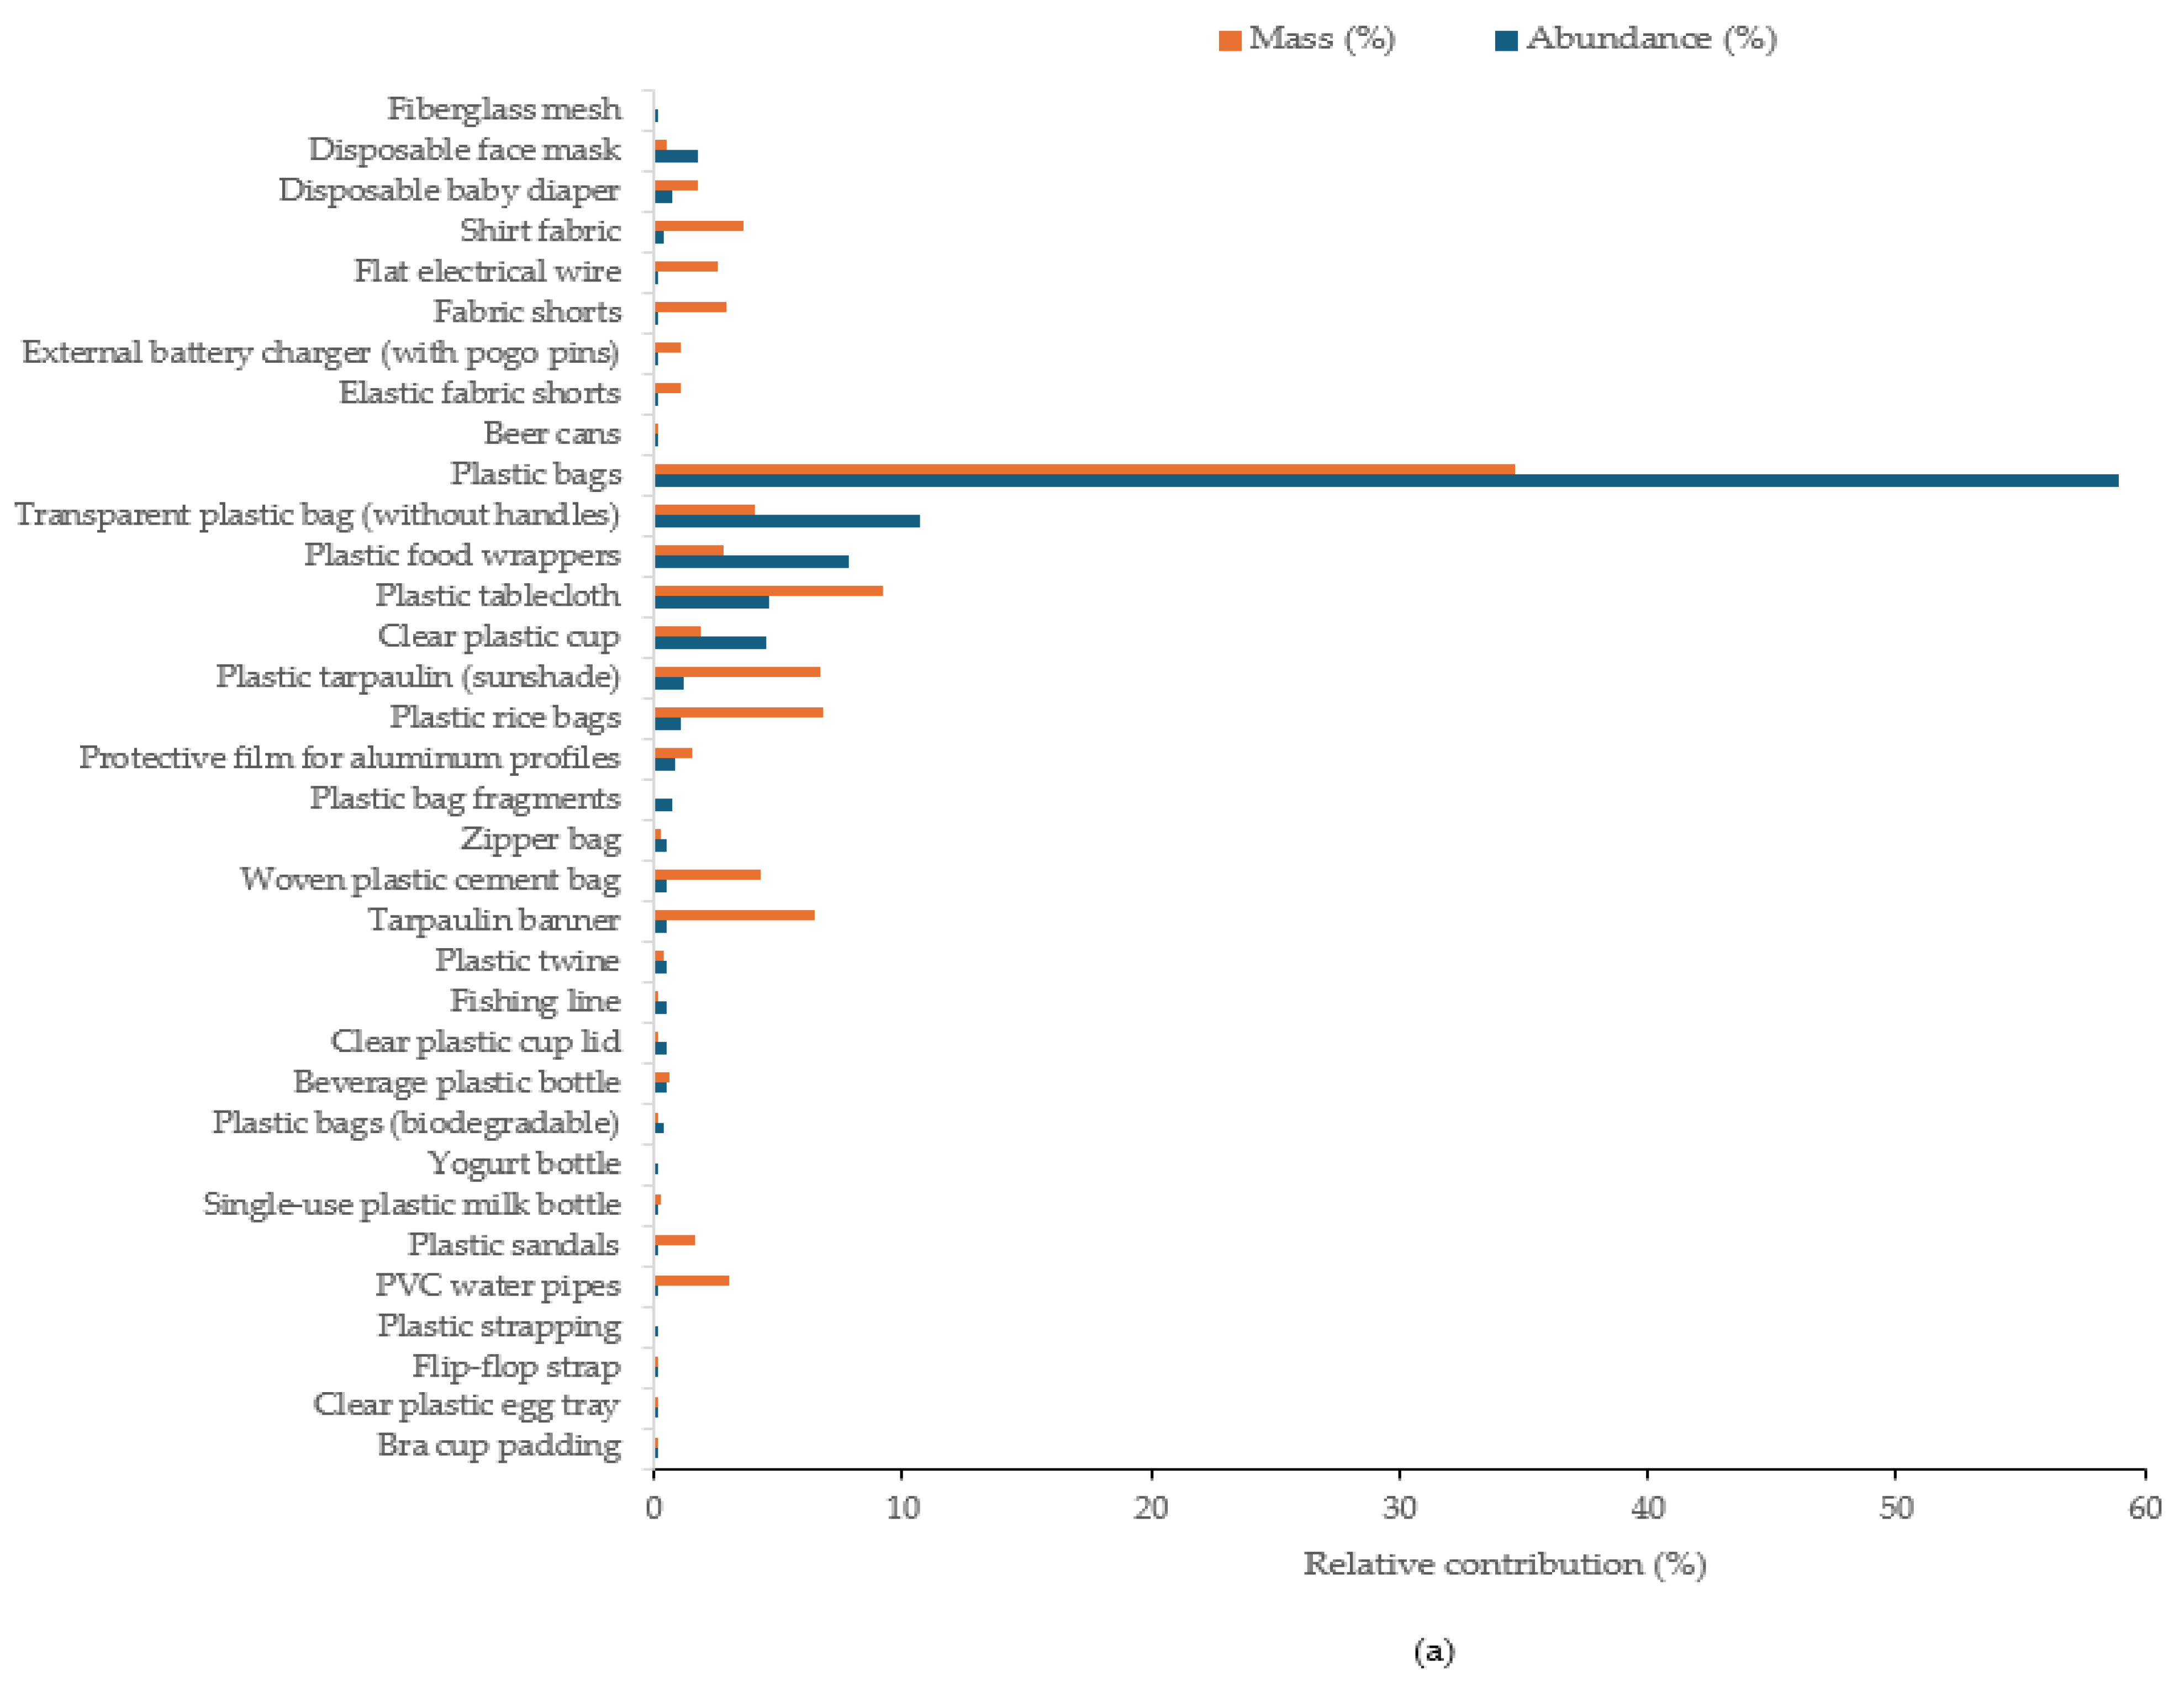
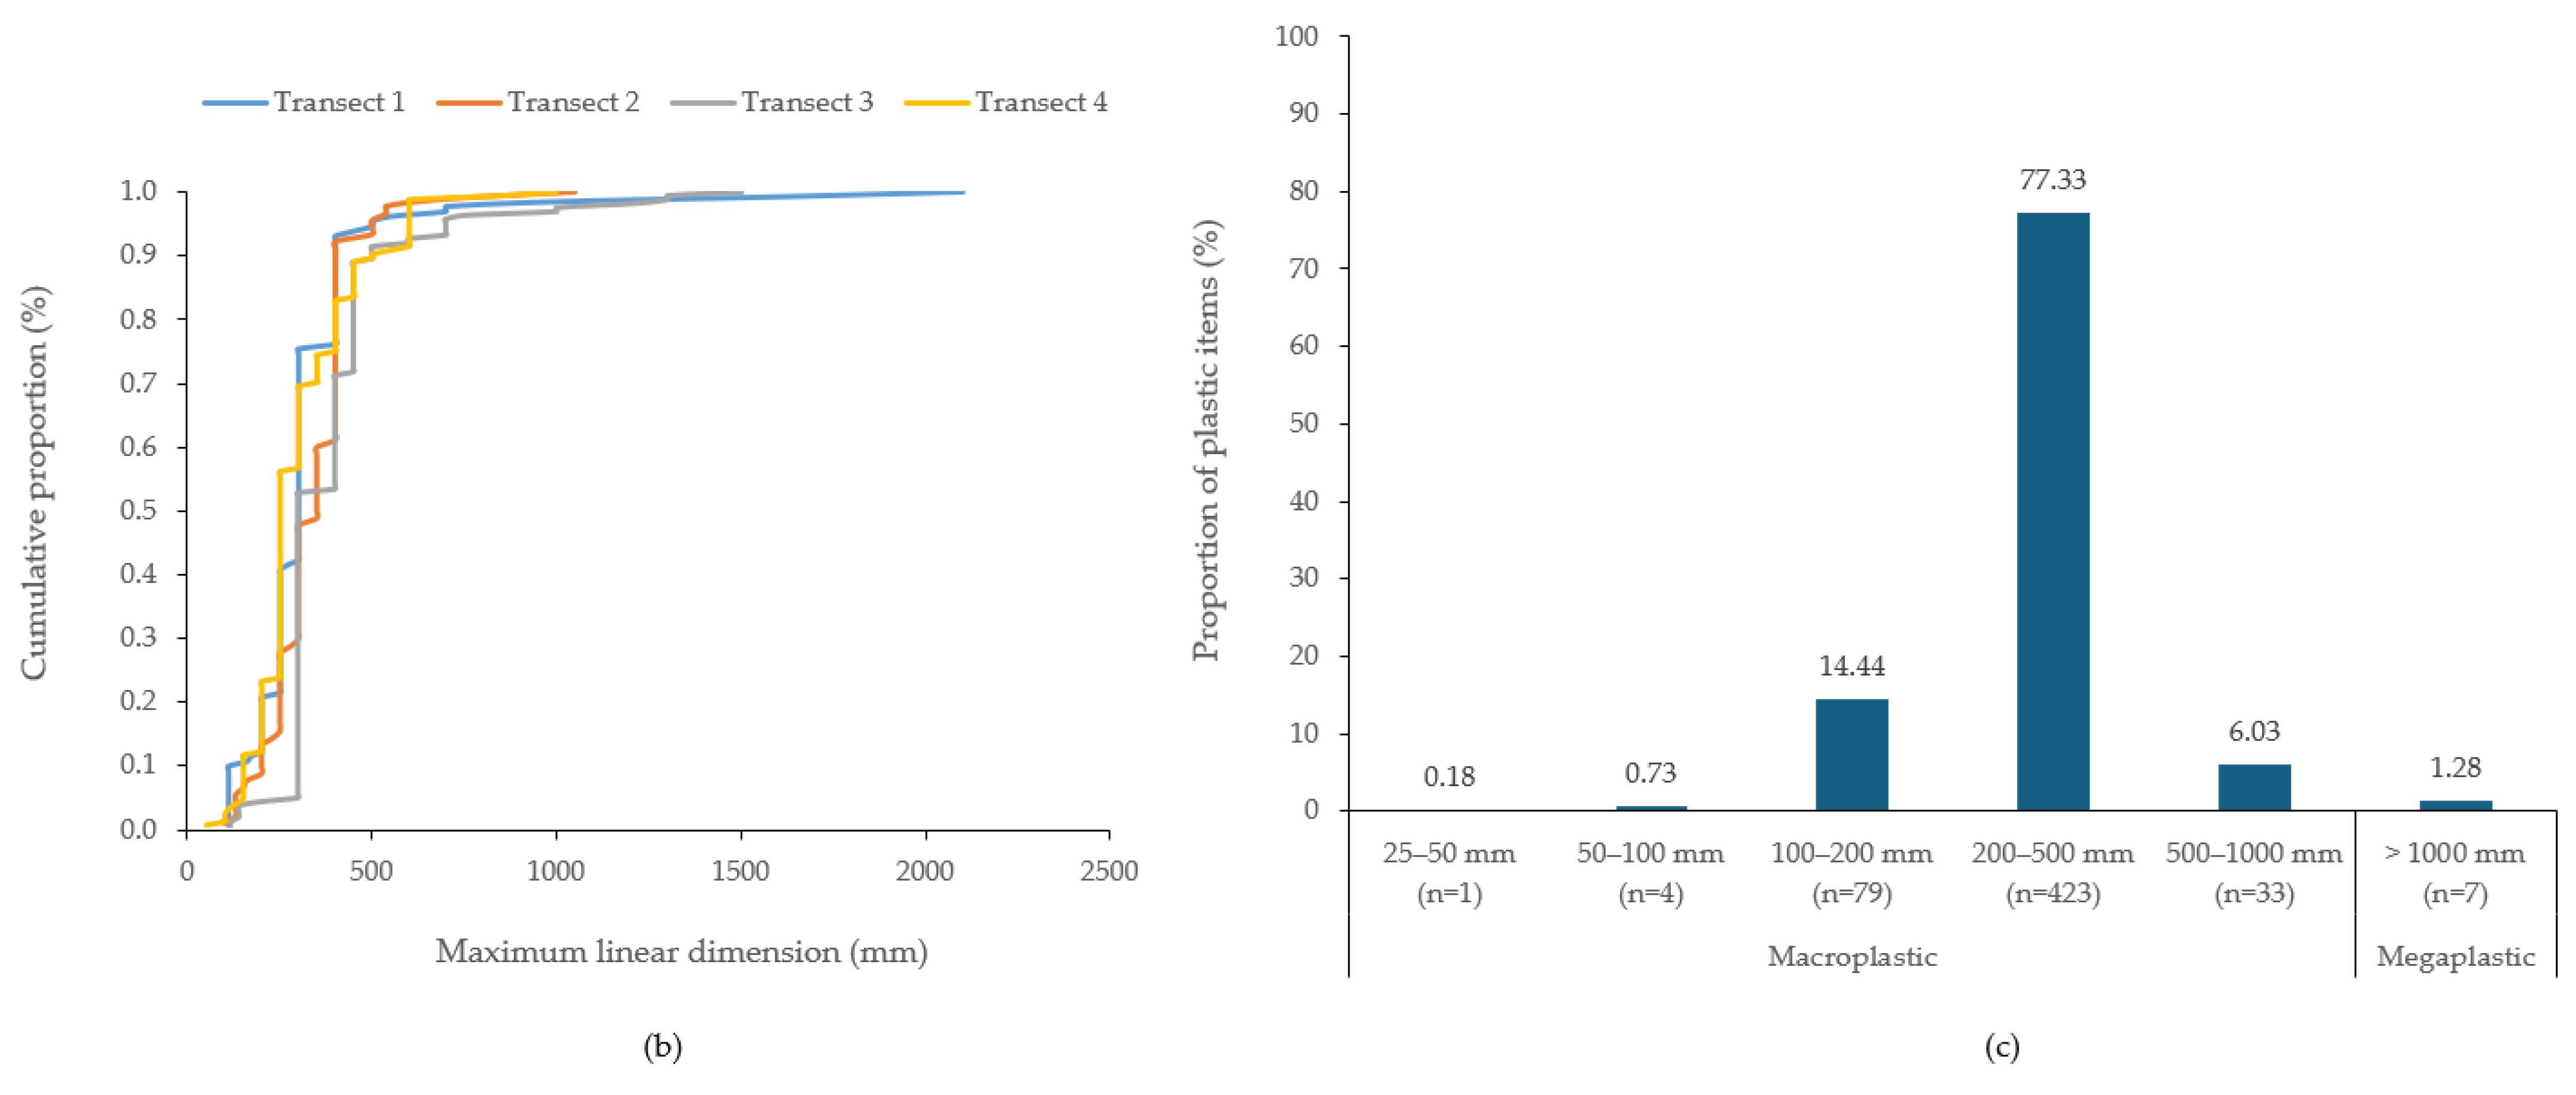
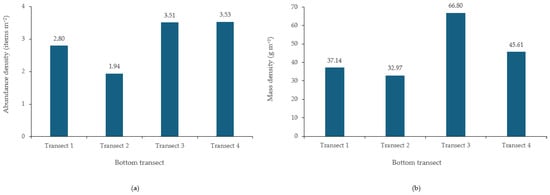
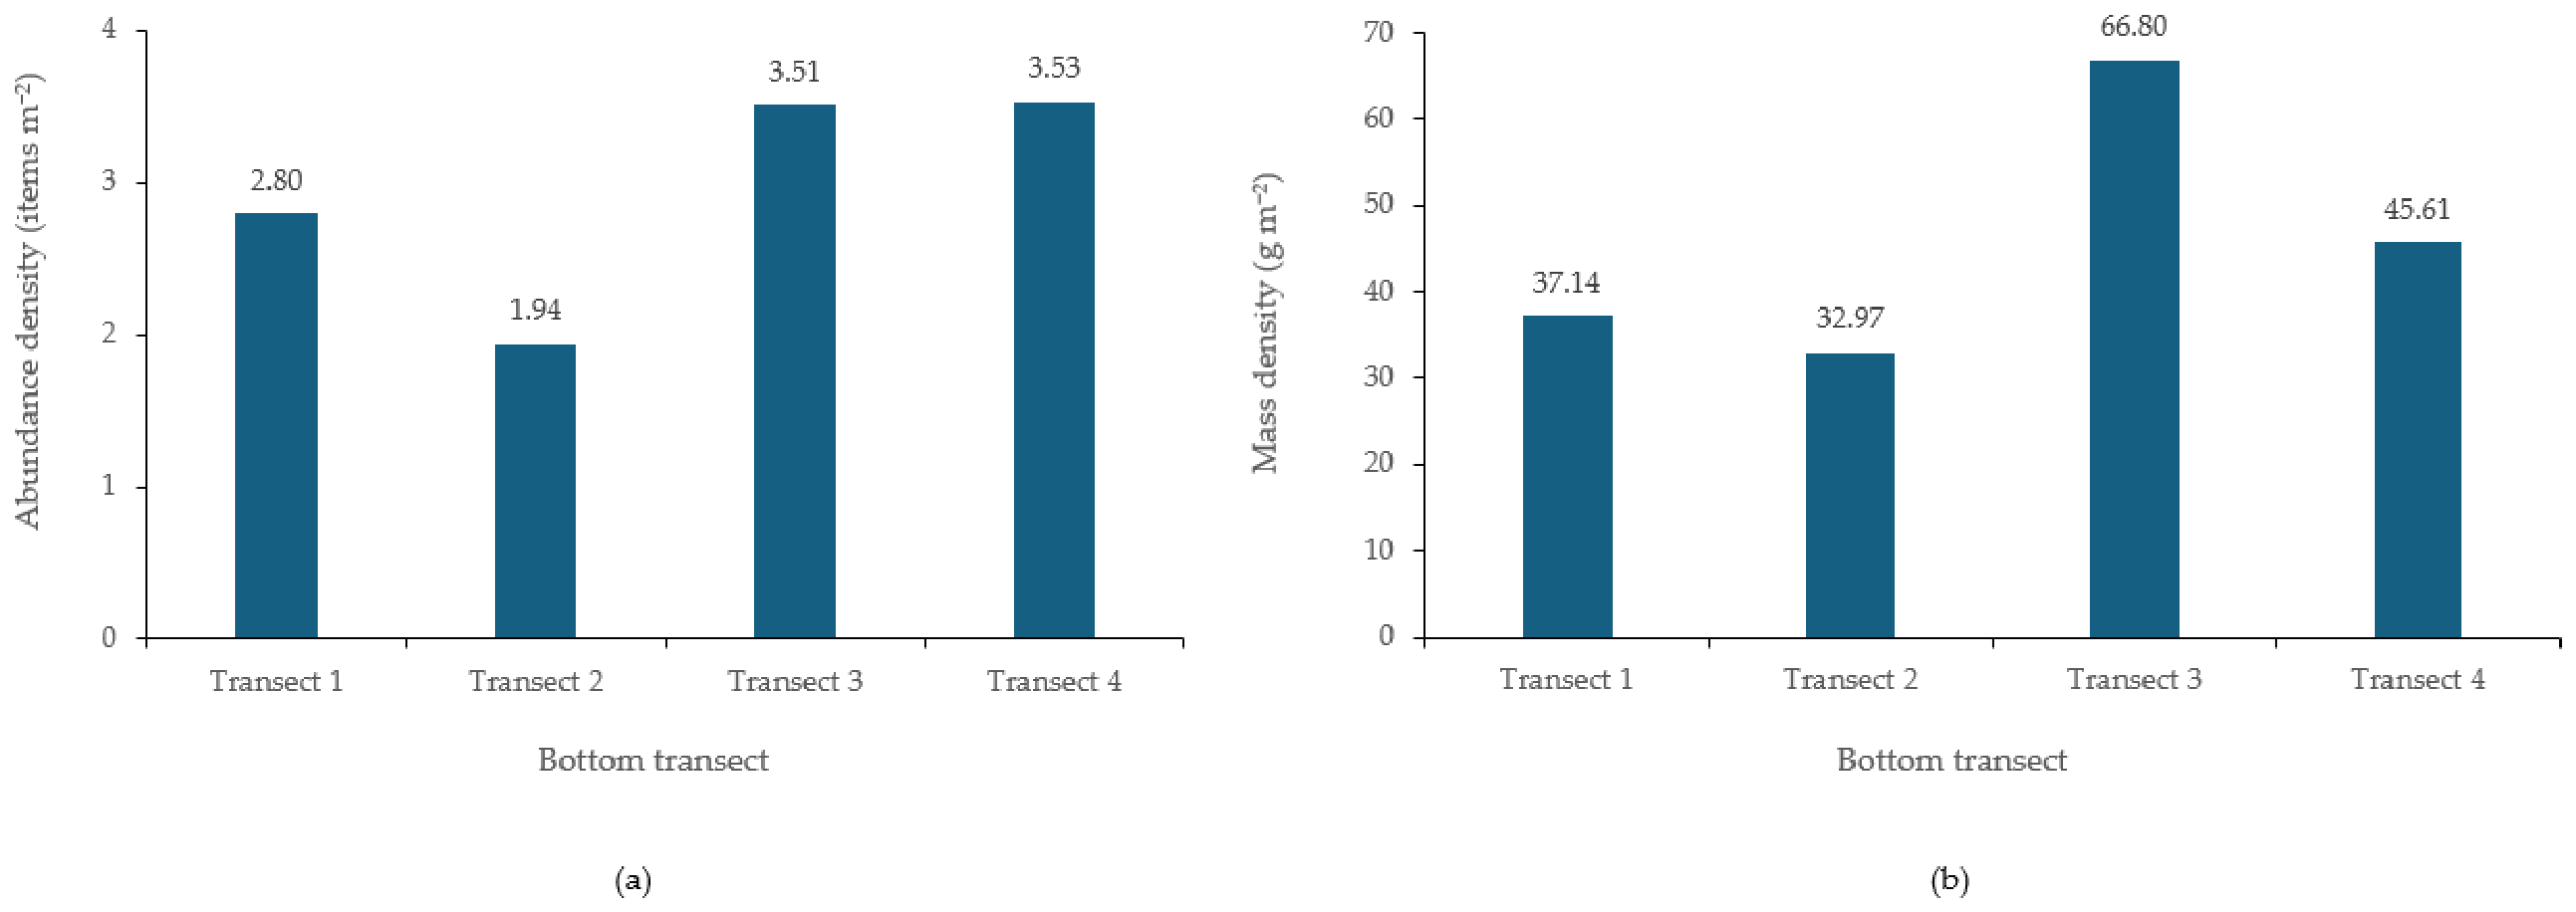
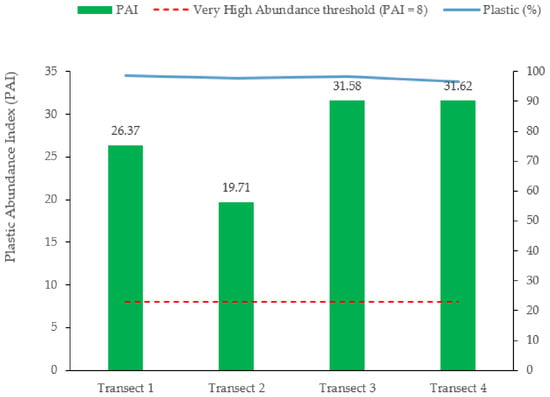
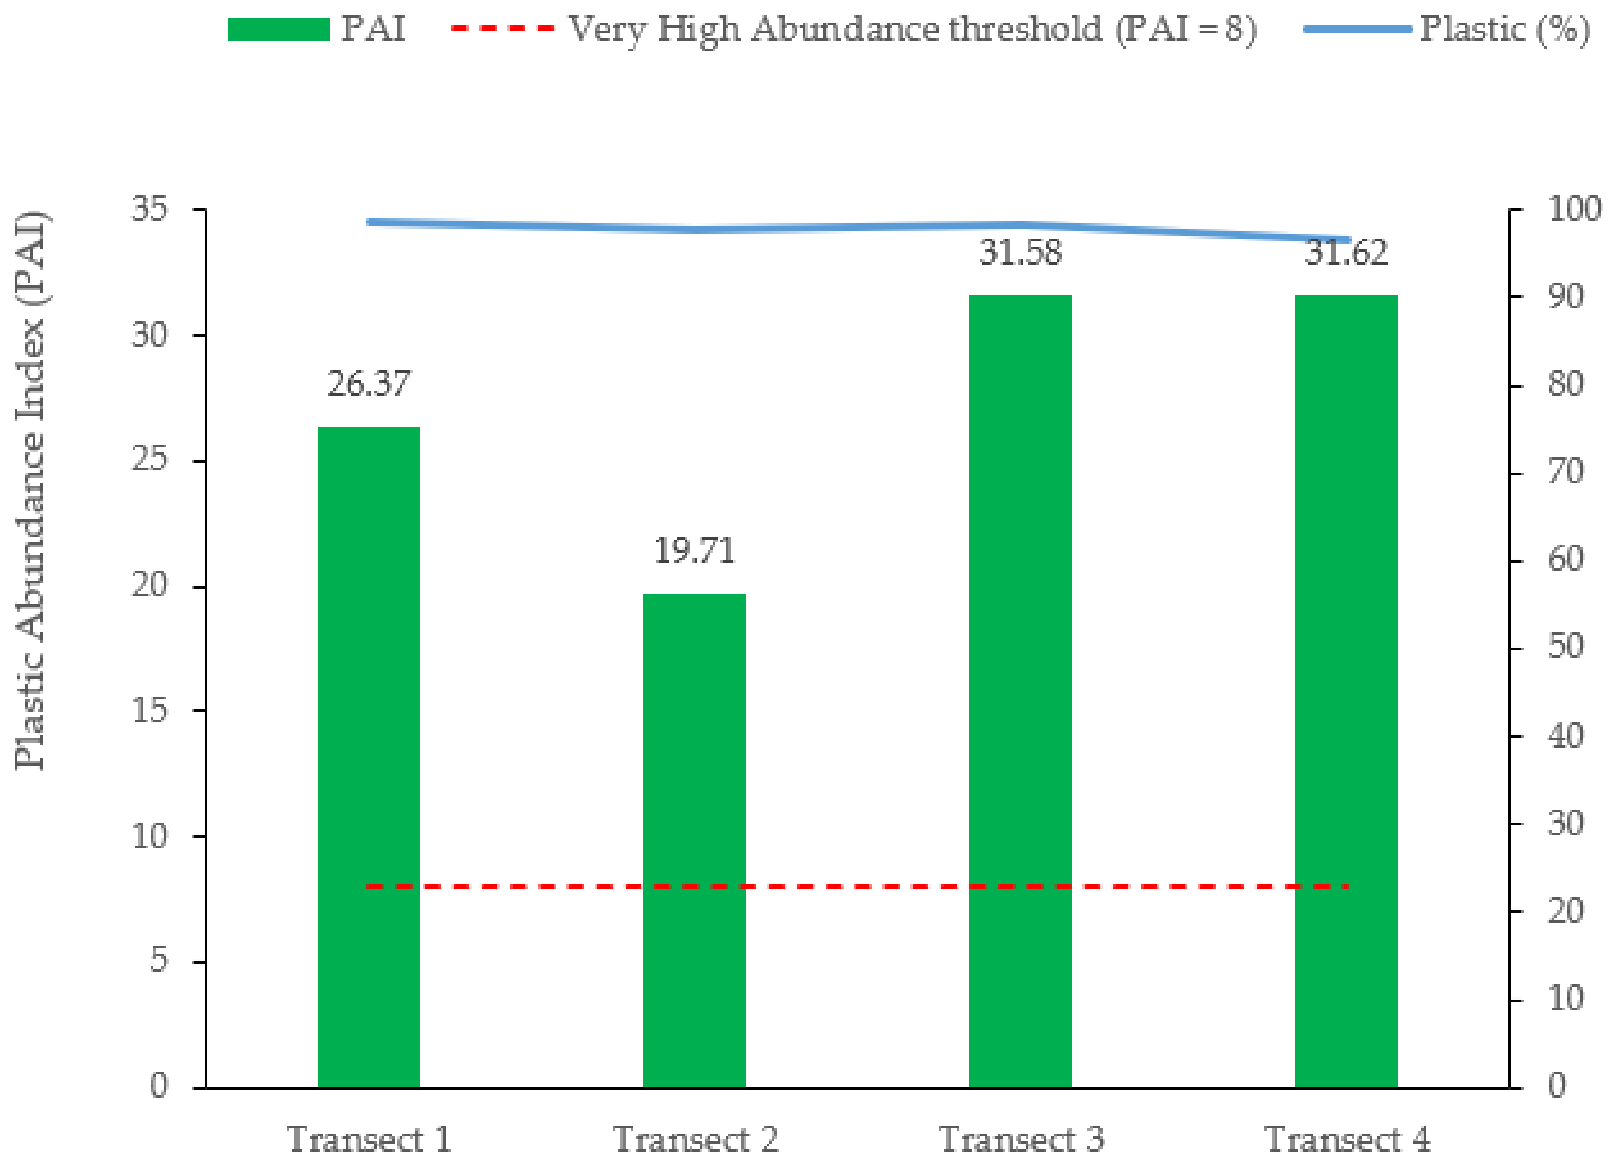
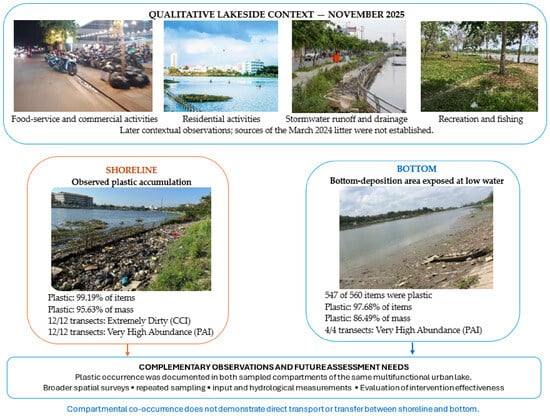
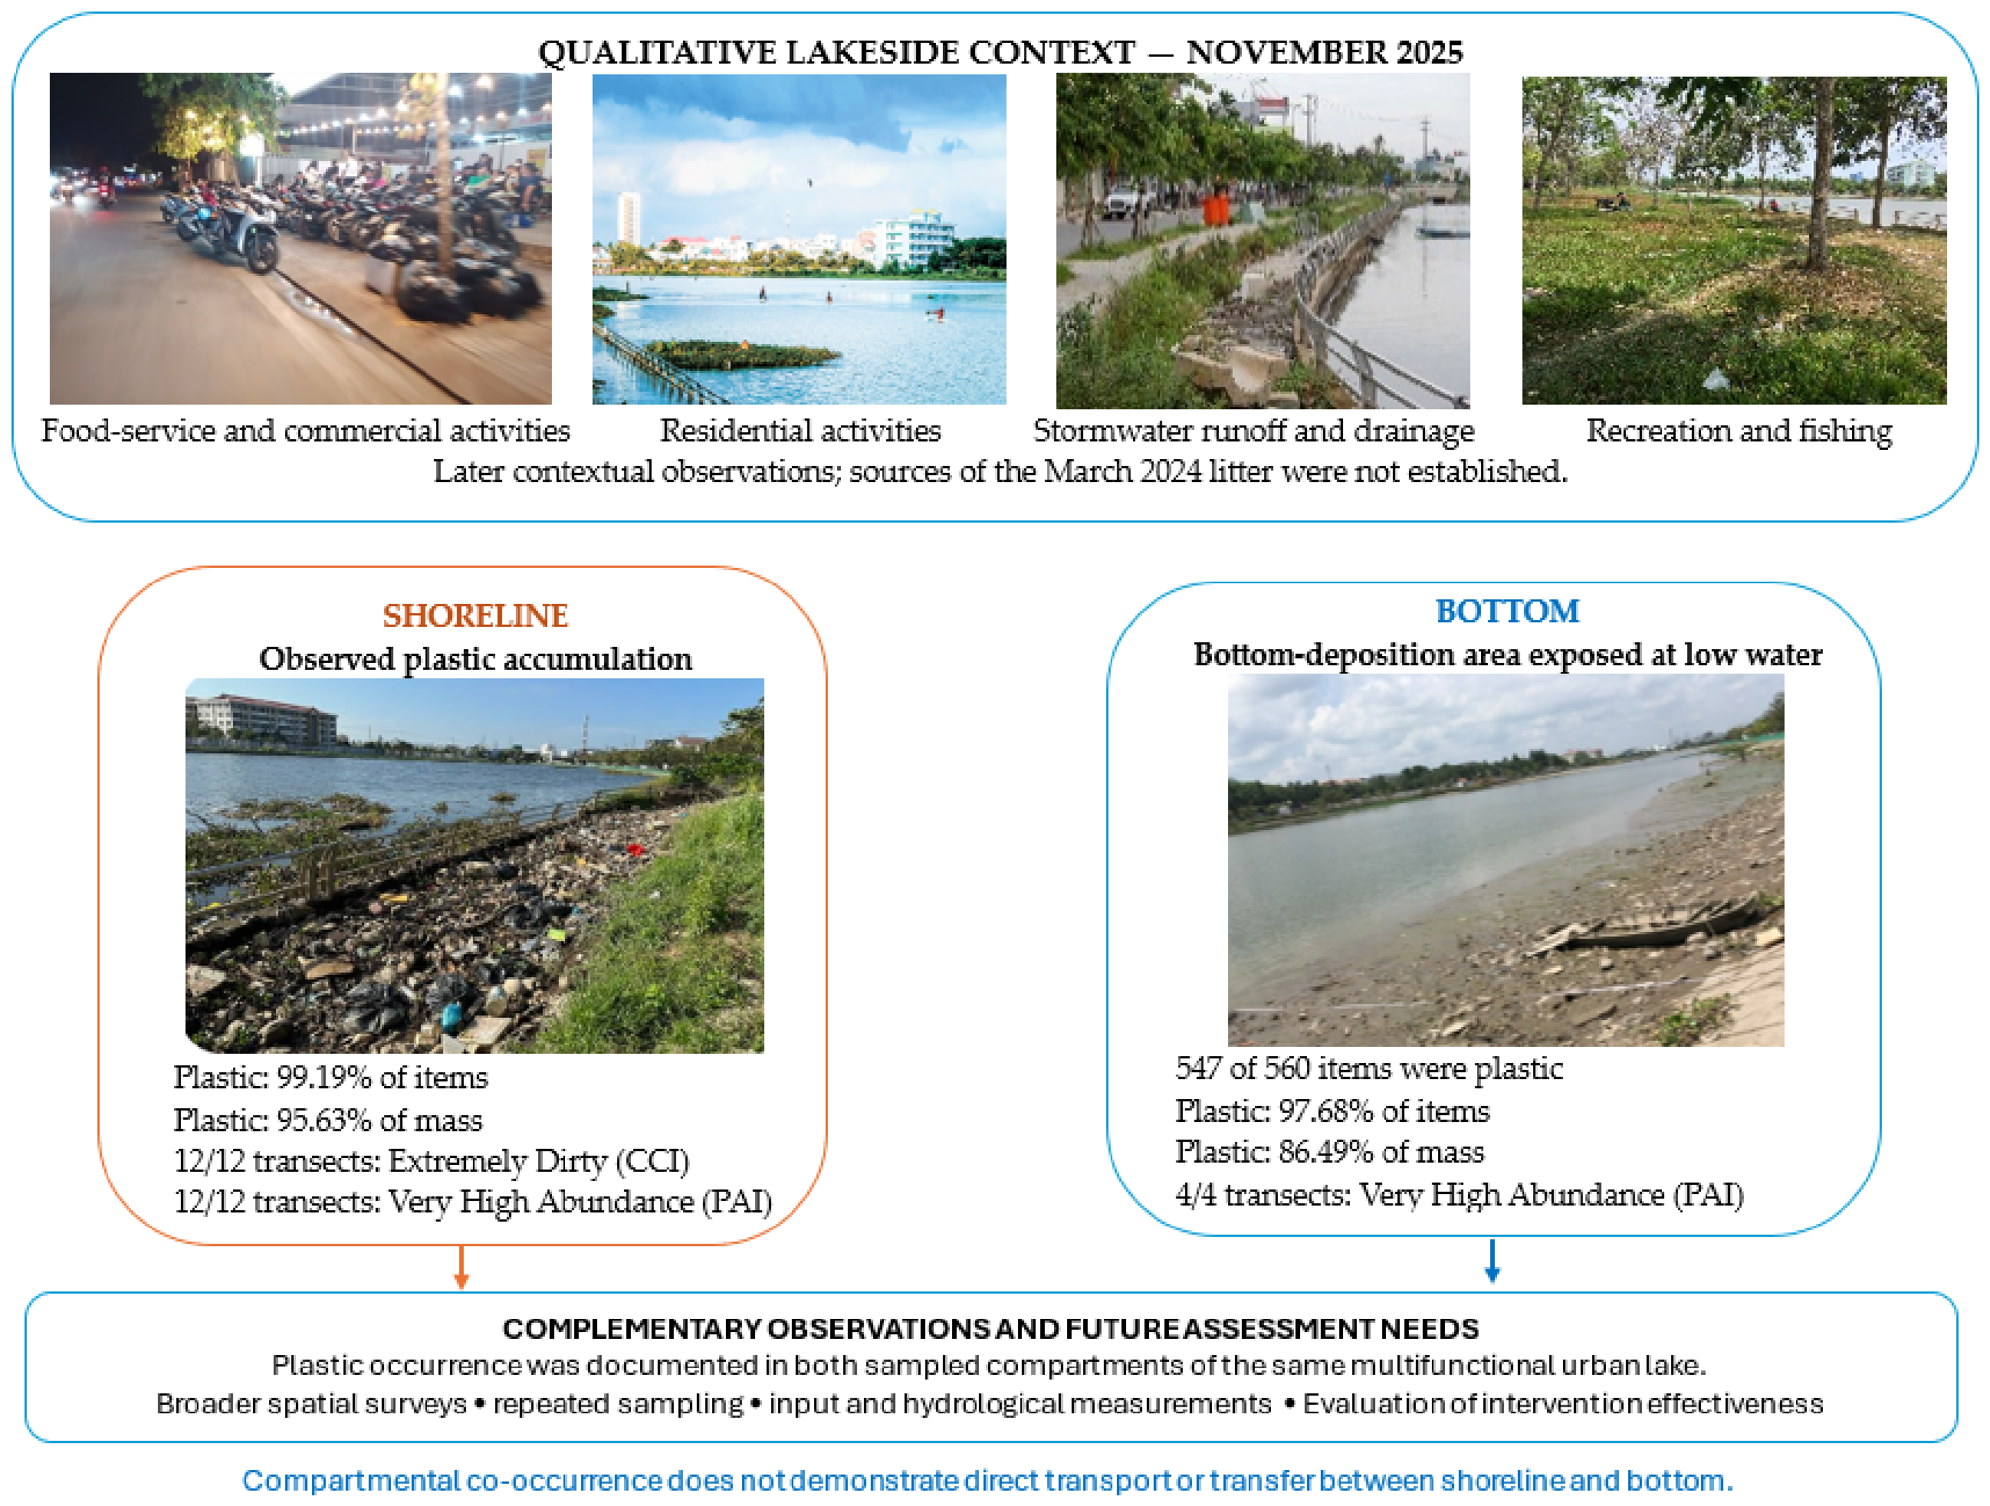

Disclaimer/Publisher’s Note: The statements, opinions and data contained in all publications are solely those of the individual author(s) and contributor(s) and not of MDPI and/or the editor(s). MDPI and/or the editor(s) disclaim responsibility for any injury to people or property resulting from any ideas, methods, instructions or products referred to in the content. |
© 2026 by the authors. Licensee MDPI, Basel, Switzerland. This article is an open access article distributed under the terms and conditions of the Creative Commons Attribution (CC BY) license.