


Abstract
Carboxyl-modified polystyrene microplastics (cPS-MPs) may accumulate in the liver and interfere with cellular metabolism; however, their effects may differ substantially between cancerous and non-cancerous hepatocytes. In this study, we compared the responses of HUH-7 hepatocellular carcinoma cells and immortalized human hepatocytes (IHHs) to two cPS-MP size fractions, M1 (2.1 µm) and M2 (0.49 µm), at concentrations of 10–1000 µg/mL for 24, 48 and 72 h. Cell viability was evaluated by the MTT assay, while mitochondrial morphology and membrane potential (ΔΨm) were assessed using MitoTracker fluorescence microscopy and fluorescence measurements. HUH-7 cells exhibited concentration- and time-dependent loss of viability, with the strongest cytotoxicity observed after 72 h exposure to M2 particles, when viability decreased to approximately 48% at concentrations ≥750 µg/mL. In contrast, IHH cells showed no significant cytotoxicity and exhibited metabolic stimulation under several M1 exposure conditions. Brightfield microscopy further revealed pronounced accumulation of cPS-MPs in association with HUH-7 cells, whereas IHH cells showed substantially less apparent particle accumulation. In HUH-7 cells, prolonged exposure to high cPS-MP concentrations caused extensive mitochondrial network rearrangement, loss of nuclear integrity and heterogeneous changes in ΔΨm, including pronounced hyperpolarization in individual cells and depolarization that predominated at the population level. IHH cells largely maintained mitochondrial network integrity and stable ΔΨm. Based on the experimental dataset, HepatoMP, an open-source web-based Predictive Modelling Tool, was developed as a proof-of-concept framework integrating concentration-, particle size- and time-dependent responses for interactive data visualization and extrapolation. Overall, the findings demonstrate markedly different responses of hepatoma and immortalized hepatocytes to cPS-MPs and identify particle accumulation and mitochondrial dysfunction as prominent features associated with cPS-MP cytotoxicity in HUH-7 cells. HepatoMP provides a complementary hypothesis-generating framework for guiding future experimental investigation of hepatic microplastic toxicity.
1. Introduction
Microplastic (MP) pollution has emerged as a pervasive global environmental and public health concern. Defined as plastic particles with dimensions below 5 mm, MPs enter aquatic and terrestrial ecosystems through diverse pathways, including fragmentation of larger plastic items, wastewater discharge and direct release from personal care products and industrial processes [1,2]. Human exposure occurs primarily through ingestion of contaminated food and water, dermal contact and inhalation of airborne particles [3]. Following systemic absorption, MPs have been detected in human blood, lung tissue, placenta, and critically, liver tissue, underscoring the hepatic system as a principal site of MP accumulation and potential toxicity [4,5].
In vitro hepatocellular models have demonstrated that polystyrene microplastics (PS-MPs) can induce oxidative stress, mitochondrial dysfunction, inflammatory pathway activation and apoptosis [6,7,8]. Surface functionalization has emerged as a primary determinant of hepatocellular toxicity. Aminated particles are substantially more cytotoxic than carboxylated or non-surface-functionalized microplastics, with their positive surface charge enabling direct membrane poration and necrotic cell death. In contrast, carboxylated particles, which carry a negative surface charge comparable to environmentally weathered MPs, are thought to exert toxicity principally through intracellular ROS generation and the intrinsic apoptotic pathway [9]. However, most existing studies have employed cancer-derived hepatocellular lines, which exhibit fundamentally altered metabolic profiles relative to normal hepatocytes.
Carboxyl-functionalized polystyrene latex beads represent an established model MP system, offering reproducible particle size distributions and well-characterized surface chemistry. The carboxyl surface modification confers a negative-charge density comparable to environmental MPs that have undergone weathering-induced oxidation, making them particularly relevant to ecotoxicological modelling [10]. Crucially, the deliberate selection of carboxylated rather than aminated particles allows toxicity to be attributed to intracellular particle accumulation and ROS-mediated mechanisms rather than to surface charge-driven membrane disruption, a confounding factor that has complicated interpretation of several prior studies [9]. Particle size is a critical determinant of cellular uptake: nanoplastics and sub-micron particles access cells via endocytic pathways, achieving direct intracellular delivery to mitochondria and lysosomes, whereas larger micron-scale particles interact primarily at the plasma membrane [11,12]. This size-dependent uptake hierarchy was directly quantified by flow cytometry in HepG2 hepatoma cells, where sub-100 nm particles were internalized significantly more avidly than 1 µm equivalents, irrespective of surface functionalization [9].
A critical gap in the current hepatotoxicity literature is the systematic comparison of cancerous versus normal hepatocyte responses to MP exposure. HUH-7 hepatocellular carcinoma cells display, as a cancer cell line, the Warburg metabolic phenotype—reliance on aerobic glycolysis [13]—which could be responsible for the higher need for amino acids and lipid uptake exhibited by the cancerous phenotype [14,15]. In contrast, immortalized normal human hepatocytes (IHHs) retain oxidative phosphorylation (OXPHOS)-dominated metabolism, which facilitates enough energy and resources potentially enabling the cell to utilize multiple alternative sources for energy and carbon [16,17]. This metabolic dichotomy predicts fundamentally divergent responses to MPs yet has rarely been directly tested under identical experimental conditions.
The present study partially addresses this gap through a systematic in vitro comparison of HUH-7 and IHH cytotoxic responses to two size fractions of carboxyl-modified polystyrene particles (M1: 2.1 µm; M2: 0.49 µm) across seven concentrations (10–1000 µg/mL) and three exposure timepoints (24, 48, and 72 h). Viability of cells was determined by the MTT mitochondrial activity assay, whereas mitochondrial membrane potential (ΔΨm) and mitochondrial network structure were assessed using the MitoTracker assay followed by fluorescence monitoring, enabling both quantitative and morphological characterization of the cellular response.
Building upon the experimental dataset, we further developed and report an open-source, browser-based Predictive Modelling Tool (PMT), HepatoMP Prediction Engine, which extends the empirically validated dose–response relationships to a continuous parameter space encompassing particle sizes and exposure times. This PMT employs a Hill equation prediction engine with size-dependent EC50 scaling, time-decay kinetic modelling and a hormetic component for normal hepatocytes, providing real-time viability predictions, mechanistic commentary and comparative cell-line assessments. Although based on a relatively narrow experimental range of variable conditions, this tool represents a first step toward computational hepatotoxicity screening for environmentally relevant MP/NP exposure scenarios.
2. Materials and Methods
2.1. Cell Lines and Culture Conditions
Two hepatic cell lines were used. Human hepatocellular carcinoma (HUH-7) cells (kindly provided by R. Bartenschlager, University of Heidelberg, Heidelberg, Germany) and immortalized normal human hepatocytes (IHHs), kindly provided by Dr. Ulrike Protzer (Technische Universität München, Munich, Germany), were cultured in Dulbecco’s Modified Eagle Medium (DMEM; Gibco, Thermo Fisher Scientific, Waltham, MA, USA) supplemented with 10% heat-inactivated fetal bovine serum (FBS; Gibco) and 1% penicillin–streptomycin (P/S; Gibco). Cells were maintained at 37 °C in a humidified atmosphere of 5% CO2 and subcultured at 80–90% confluency.
2.2. Microplastic Particles
Carboxyl-modified polystyrene latex bead suspensions were obtained commercially (Sigma-Aldrich, St. Louis, MO, USA). Two size fractions were employed: M1 (nominal diameter of 2.1 ± 0.1 µm) and M2 (nominal diameter of 0.49 ± 0.02 µm). Particle size and zeta potential were characterized by dynamic light scattering (DLS) using a Zetasizer Nano ZS (Malvern Panalytical, Malvern, UK) prior to experimental use, to verify the nominal particle sizes reported by the manufacturer. Stock suspensions (10 mg/mL in sterile phosphate-buffered saline (PBS)) were sonicated for 10 min in a bath sonicator (Elmasonic S 30H, Elma Schmidbauer GmbH, Singen, Germany) immediately before use in cell culture, to minimize particle agglomeration. Working concentrations (10, 50, 100, 250, 500, 750 and 1000 µg/mL) were prepared by serial dilution in the appropriate complete culture medium. Following the exposure of the cells to microplastics, the distribution of the microplastics and cell proliferation were monitored via microscopic observation at 2 h, 24 h, 48 h and 72 h of incubation.
2.3. MTT Cytotoxicity Assay
Cells were seeded in 96-well flat-bottom plates at a density of 5 × 10³ cells/well (HUH-7) and 7 × 10³ cells/well (IHHs) and allowed to adhere for 24 h prior to treatment. The medium was replaced with MP-containing media at the designated concentrations, and cells were incubated for 24, 48, or 72 h. Following exposure, cells were gently washed with PBS to minimize particle carryover before the addition of the MTT reagent. At each timepoint, the media were removed and replaced with 100 µL of MTT solution (0.5 mg/mL; Sigma-Aldrich) in serum-free medium. After 4 h incubation at 37 °C, formazan crystals were dissolved in 100 µL of DMSO (Sigma-Aldrich), and absorbance was measured at 570 nm with reference at 630 nm using a microplate reader (BioTek Synergy HTX, Agilent Technologies, Santa Clara, CA, USA). Cell-free control wells containing cPS-MPs and MTT reagent without cells were included as negative controls to assess potential optical interference or abiotic MTT reduction. Cell viability was expressed as the percentage of the mock-treated control (set to 100%). All experiments were performed in triplicate and repeated independently three times (n = 9 per condition).
2.4. MitoTracker™ Fluorescence Assay
HUH-7 and IHH cells were cultured in 96-well plates and exposed to M1 or M2 carboxyl-modified polystyrene particles for 24, 48, and 72 h. M1 particles were tested at concentrations of 100, 500, and 750 μg/mL, while M2 particles were tested at 500, 750, and 1000 μg/mL.
2.4.1. Microscopic Observations
Following exposure to cPS-MPs, cells were washed with PBS and incubated with 100 nM MitoTracker™ Red (Thermo Fisher Scientific, Waltham, MA, USA) for 30 min. Cells were subsequently washed with PBS, and fresh culture medium was added to each well. MitoTracker-stained cells were examined using brightfield and fluorescence microscopy to assess distribution of microplastics, mitochondrial network structure and mitochondrial membrane potential (ΔΨm). Representative images were acquired (20× objective lens) using fluorescence and brightfield microscopy (Zeiss AX10 (Carl Zeiss, Oberkochen, Germany)).
2.4.2. Fluorescence Measurements
Following exposure to cPS-MPs, cells were washed with PBS and incubated with 100 nM MitoTracker™ Red and 100 nM MitoTracker™ Green (Thermo Fisher Scientific, Waltham, MA, USA) for 30 min. Cells were subsequently washed with PBS, and fresh culture medium was added to each well. Fluorescence intensity was measured using a fluorescence microplate reader (Varioskan, Thermo Fisher Scientific, Waltham, MA, USA) at excitation/emission wavelengths of 490/516 nm for MitoTracker™ Green and 581/644 nm for MitoTracker™ Red. Changes in mitochondrial membrane potential (ΔΨm) were assessed by calculating the ratio of MitoTracker™ Red to MitoTracker™ Green fluorescence intensity, with values normalized to the corresponding mock-treated control [18], and qualitatively evaluated for changes in mitochondrial network organization.
2.5. Statistical Analysis
Statistical analysis was performed using GraphPad Prism v9.0 (GraphPad Software, San Diego, CA, USA). Differences in cell viability between cPS-MP-treated and mock-treated (control) cell groups were evaluated using one-way ANOVA followed by Tukey’s honestly significant difference (HSD) post hoc test. To assess the size-dependent and time-dependent effects of cPS-MPs, two-way ANOVA followed by Tukey’s HSD post hoc test was additionally performed using particle size and concentration or incubation time and concentration as independent variables, respectively (Supplementary Tables S1 and S2). A p-value < 0.05 was considered statistically significant. Data are presented as means ± standard deviation (SD) of three independent experiments.
2.6. Development of the HepatoMP Predictive Modelling Tool
A web-based Predictive Modelling Tool (PMT)—HepatoMP Prediction Engine (v2.0)—was developed as a self-contained, framework-independent HTML/CSS/JavaScript application. The prediction engine employs the four-parameter Hill equation for dose–response modelling:
where V is predicted cell viability (normalized to control = 1.00), c is the particle concentration (µg/mL), Vmin and Vmax are the lower and upper viability asymptotes, EC50 is the half-maximal effect concentration and n is the Hill coefficient governing curve steepness. n is set larger for sub-micron particles because sub-micron particle uptake is relatively homogeneous across a cell population (all cells are similarly exposed via endocytosis), producing a tighter, more synchronized transition to cytotoxicity.
V(c) = Vmin + (Vmax − Vmin)/(1 + (c/EC50)n)
Size-dependent EC50 scaling was implemented as a fitted power function parameterized from two experimental anchor points (M1 and M2 at 48 h):
where d is particle diameter (µm). This relationship encodes the experimentally and mechanistically grounded principle that smaller particles achieve greater intracellular access via endocytosis, producing lower EC50 values (higher potency).
log10(EC50) = 2.30 + 0.62 × log10(d)
An intercept of 2.30 and a slope of 0.62 were obtained by two-point log–log interpolation: the two experimentally derived EC50 estimates (M1 at 48 h: ~700 µg/mL; M2 at 48 h: ~200 µg/mL) were plotted against particle diameter on log–log axes, and the line passing exactly through both points was computed. It must be explicitly stated that this constitutes a two-point parameterization and not a statistically fitted regression: with N = 2 anchor points, the coefficient of determination r2 = 1 is geometrically trivial and statistically uninformative, and there are zero residual degrees of freedom, making it impossible to calculate the standard error of the slope or intercept or to assess statistical significance. Equation (2) should therefore be understood strictly as a mechanistically motivated interpolation formula encoding the well-established principle that smaller particles achieve greater intracellular access via endocytosis and thus exhibit higher potency—not as a statistically validated scaling law. This is a recognized limitation of the model and is addressed further in Section 4.4 (Limitations).
Time-dependent EC50 decay was modelled as a first-order exponential process:
with a time-decay constant ktime ≈ 0.0055–0.0085 h−1, increasing with the decrease in particle size, thus reflecting the faster intracellular accumulation of smaller particles that access the endosomal pathway more efficiently. The range of ktime was anchored to the experimental MTT dataset: the lower bound (0.0055 h−1, assigned to M1 at 2.1 µm) reproduces the modest EC50 shift observed between 48 h and 72 h for the larger fraction, while the upper bound (0.0085 h−1, assigned to M2 at 0.49 µm) captures the steeper temporal acceleration of cytotoxicity observed for the sub-micron fraction. At these rates, the model predicts EC50 reductions of approximately 30–45% over a 72 h window, consistent with the viability trajectories recorded in Table 1. For IHH cells, cytotoxicity was absent across all tested conditions; instead, a hormetic adaptive response was modelled using a saturating stimulation function:
where Smax ≈ 0.32 is the maximum stimulation amplitude (corresponding to the IHH viability peak at approximately 30–35% above the control at 24 h for the M1 size class), Kstim is the half-saturation concentration for stimulation (350–550 µg/mL depending on size and selected so that at the highest tested concentration (1000 µg/mL), the saturating term c/(c + Kstim) reaches approximately 0.65–0.74) and the exponential time term captures progressive saturation of the adaptive response. The first part of this equation (Gaussian size term) describes how much stimulation a given particle size produces, whereas log10(d) = 0.3, i.e., d ≈ 2 µm—which is close to M1 (2.1 µm), the size that produced the strongest stimulation. The second part of the equation, the saturating concentration term, is a Michaelis–Menten saturation function. At low concentrations, it is approximately linear (stimulation increases proportionally with concentration), and at high concentrations, it saturates toward 1 (maximum stimulation regardless of further dose increases). The third part of the equation, the exponential time term, captures the observation that the stimulatory effect is the strongest at early timepoints (24 h) and fades with prolonged exposure.
EC50(t) = EC50,ref × exp(−ktime × (t − tref))
VIHH(c, d, t) = 1 + Smax × exp(−0.4 × (log10(d) − 0.3)2) × (c/(c + Kstim)) × exp(−t/200)
Table 1.
MTT relative cell viability (mean ± SD, normalized to control = 100%) of HUH-7 cells following exposure to M1 (2.1 µm) and M2 (0.49 µm) carboxyl polystyrene particles at 24, 48 and 72 h. Mock-treated cells were used as control. Three independent experiments were performed, n = 9. Asterisk (*) indicates p < 0.05 vs. control (one-way ANOVA, Tukey’s HSD).
3. Results
3.1. cPS-MPs Negatively Affect the Viability of HUH-7 Hepatoma Cells While Causing Only Minimal Adverse Effects on the Viability of Immortalized Hepatocytes (IHHs)
Exposure of HUH-7 cells to M1 particles (2.1 µm cPS-MPs) resulted in a largely non-significant effect at 24 h across the full concentration range tested (10–1000 µg/mL; Table 1). Notably, a slight fluorescence stimulation was observed at 10 µg/mL (116 ± 3.7%; p < 0.05) and 250 µg/mL (115 ± 3.2%; p < 0.05). By 48 h, cytotoxic effects became apparent at higher concentrations, with statistically significant reductions at 750 µg/mL (79 ± 1.9%) and 1000 µg/mL (67 ± 1.3%; p < 0.05 for both). By 72 h, significant cytotoxicity was detected from 100 µg/mL upward, with viability reaching a plateau at approximately 66–68% across the 250–1000 µg/mL range (p < 0.05 for all), suggesting “saturation” of the cellular damage associated-response at higher concentrations.
Exposure of HUH-7 cells to M2 particles (0.49 µm cPS-MPs) produced a markedly more pronounced cytotoxic profile relative to M1 particles, particularly at extended exposure times. At 24 h, modest but statistically significant reductions were observed only at the highest concentrations (750 µg/mL: 83 ± 3.3%; 1000 µg/mL: 81 ± 3.7%; p < 0.05). At 48 h, significant effects were again confined to the upper dose range (750 µg/mL: 85 ± 2.2%; 1000 µg/mL: 79 ± 3.1%; p < 0.05). However, at 72 h, the cytotoxic profile shifted dramatically: significant viability reductions were detected from 50 µg/mL (76 ± 2.2%) upward, with viability reaching 48 ± 1.8% at 500 µg/mL and plateauing at 48 ± 2.2% at 1000 µg/mL (p < 0.05 for all concentrations ≥50 µg/mL). This nearly 50% maximal effect at 72 h with M2 particles represents substantially greater cytotoxic potency than that observed with M1 particles at the same timepoint. Further two-way ANOVA confirmed significant particle size- and time-dependent effects on HUH-7 cell viability, with M2 particles showing a greater overall cytotoxic effect than M1 particles, particularly after 72 h, while increasing concentrations were generally associated with progressively reduced viability (Supplementary Tables S1 and S2).
In stark contrast to HUH-7, IHH cells exhibited no statistically significant cytotoxicity under any tested condition (Table 2). With M1 particles, a progressive and statistically significant metabolic stimulation emerged with the increase in concentration of cPS-MPs and incubation time: at 24 h, mitochondrial metabolic activity reached 124 ± 4.6% at 500 µg/mL, 124 ± 7.6% at 750 µg/mL and 130 ± 3.0% at 1000 µg/mL (p < 0.05 for all three). This stimulatory effect persisted at 48 h, with 1000 µg/mL producing 123 ± 2.5% viability (p < 0.05). At 72 h, significant fluorescence stimulation was observed at 250 µg/mL (117 ± 2.3%) and 500 µg/mL (121 ± 3.6%; p < 0.05 for both). M2 particles produced uniformly non-significant effects across all conditions tested (range: 92–119%) in IHH cells, indicating a complete absence of cytotoxicity and only marginal stimulation.
Table 2.
MTT relative cell viability (mean ± SD, normalized to control = 100%) of IHH cells following exposure to M1 and M2 carboxyl polystyrene particles. Mock-treated cells were used as control. Three independent experiments were performed, n = 9. Asterisk (*) indicates p < 0.05 vs. control (one-way ANOVA, Tukey’s HSD).
3.2. cPS-MPs Strongly Influence Mitochondrial Network and Mitochondrial Membrane Potential (Δψm) of HUH-7 Cells While Displaying Limited Such Effects on IHH Cells
Since effects of cPS-MPs on the viability of HUH-7 cells were observed at concentrations of 100 μg/mL and above, and previous studies link MPs of such type and size with the induction of apoptosis of HepG2 cells [9], we examined the effects of M1 and M2 cPS-MPs on the mitochondrial network and mitochondrial membrane potential (Δψm) of HUH-7 and IHH cells, using three concentrations of cPS-MPs: 100, 500 and 750 μg/mL for M1 particles and 500, 750 and 1000 μg/mL for M2 particles.
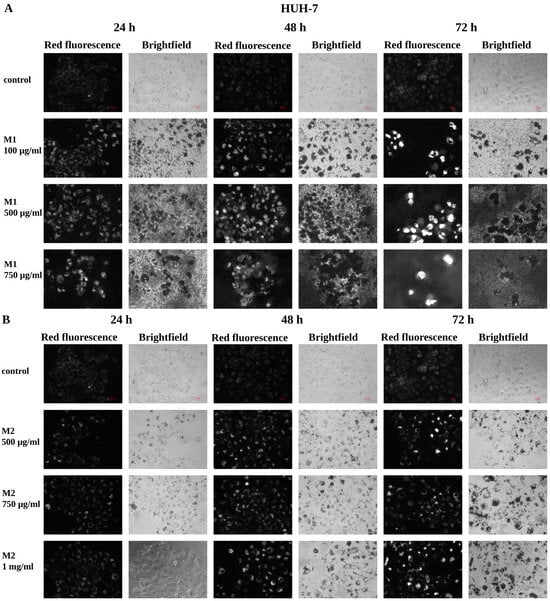
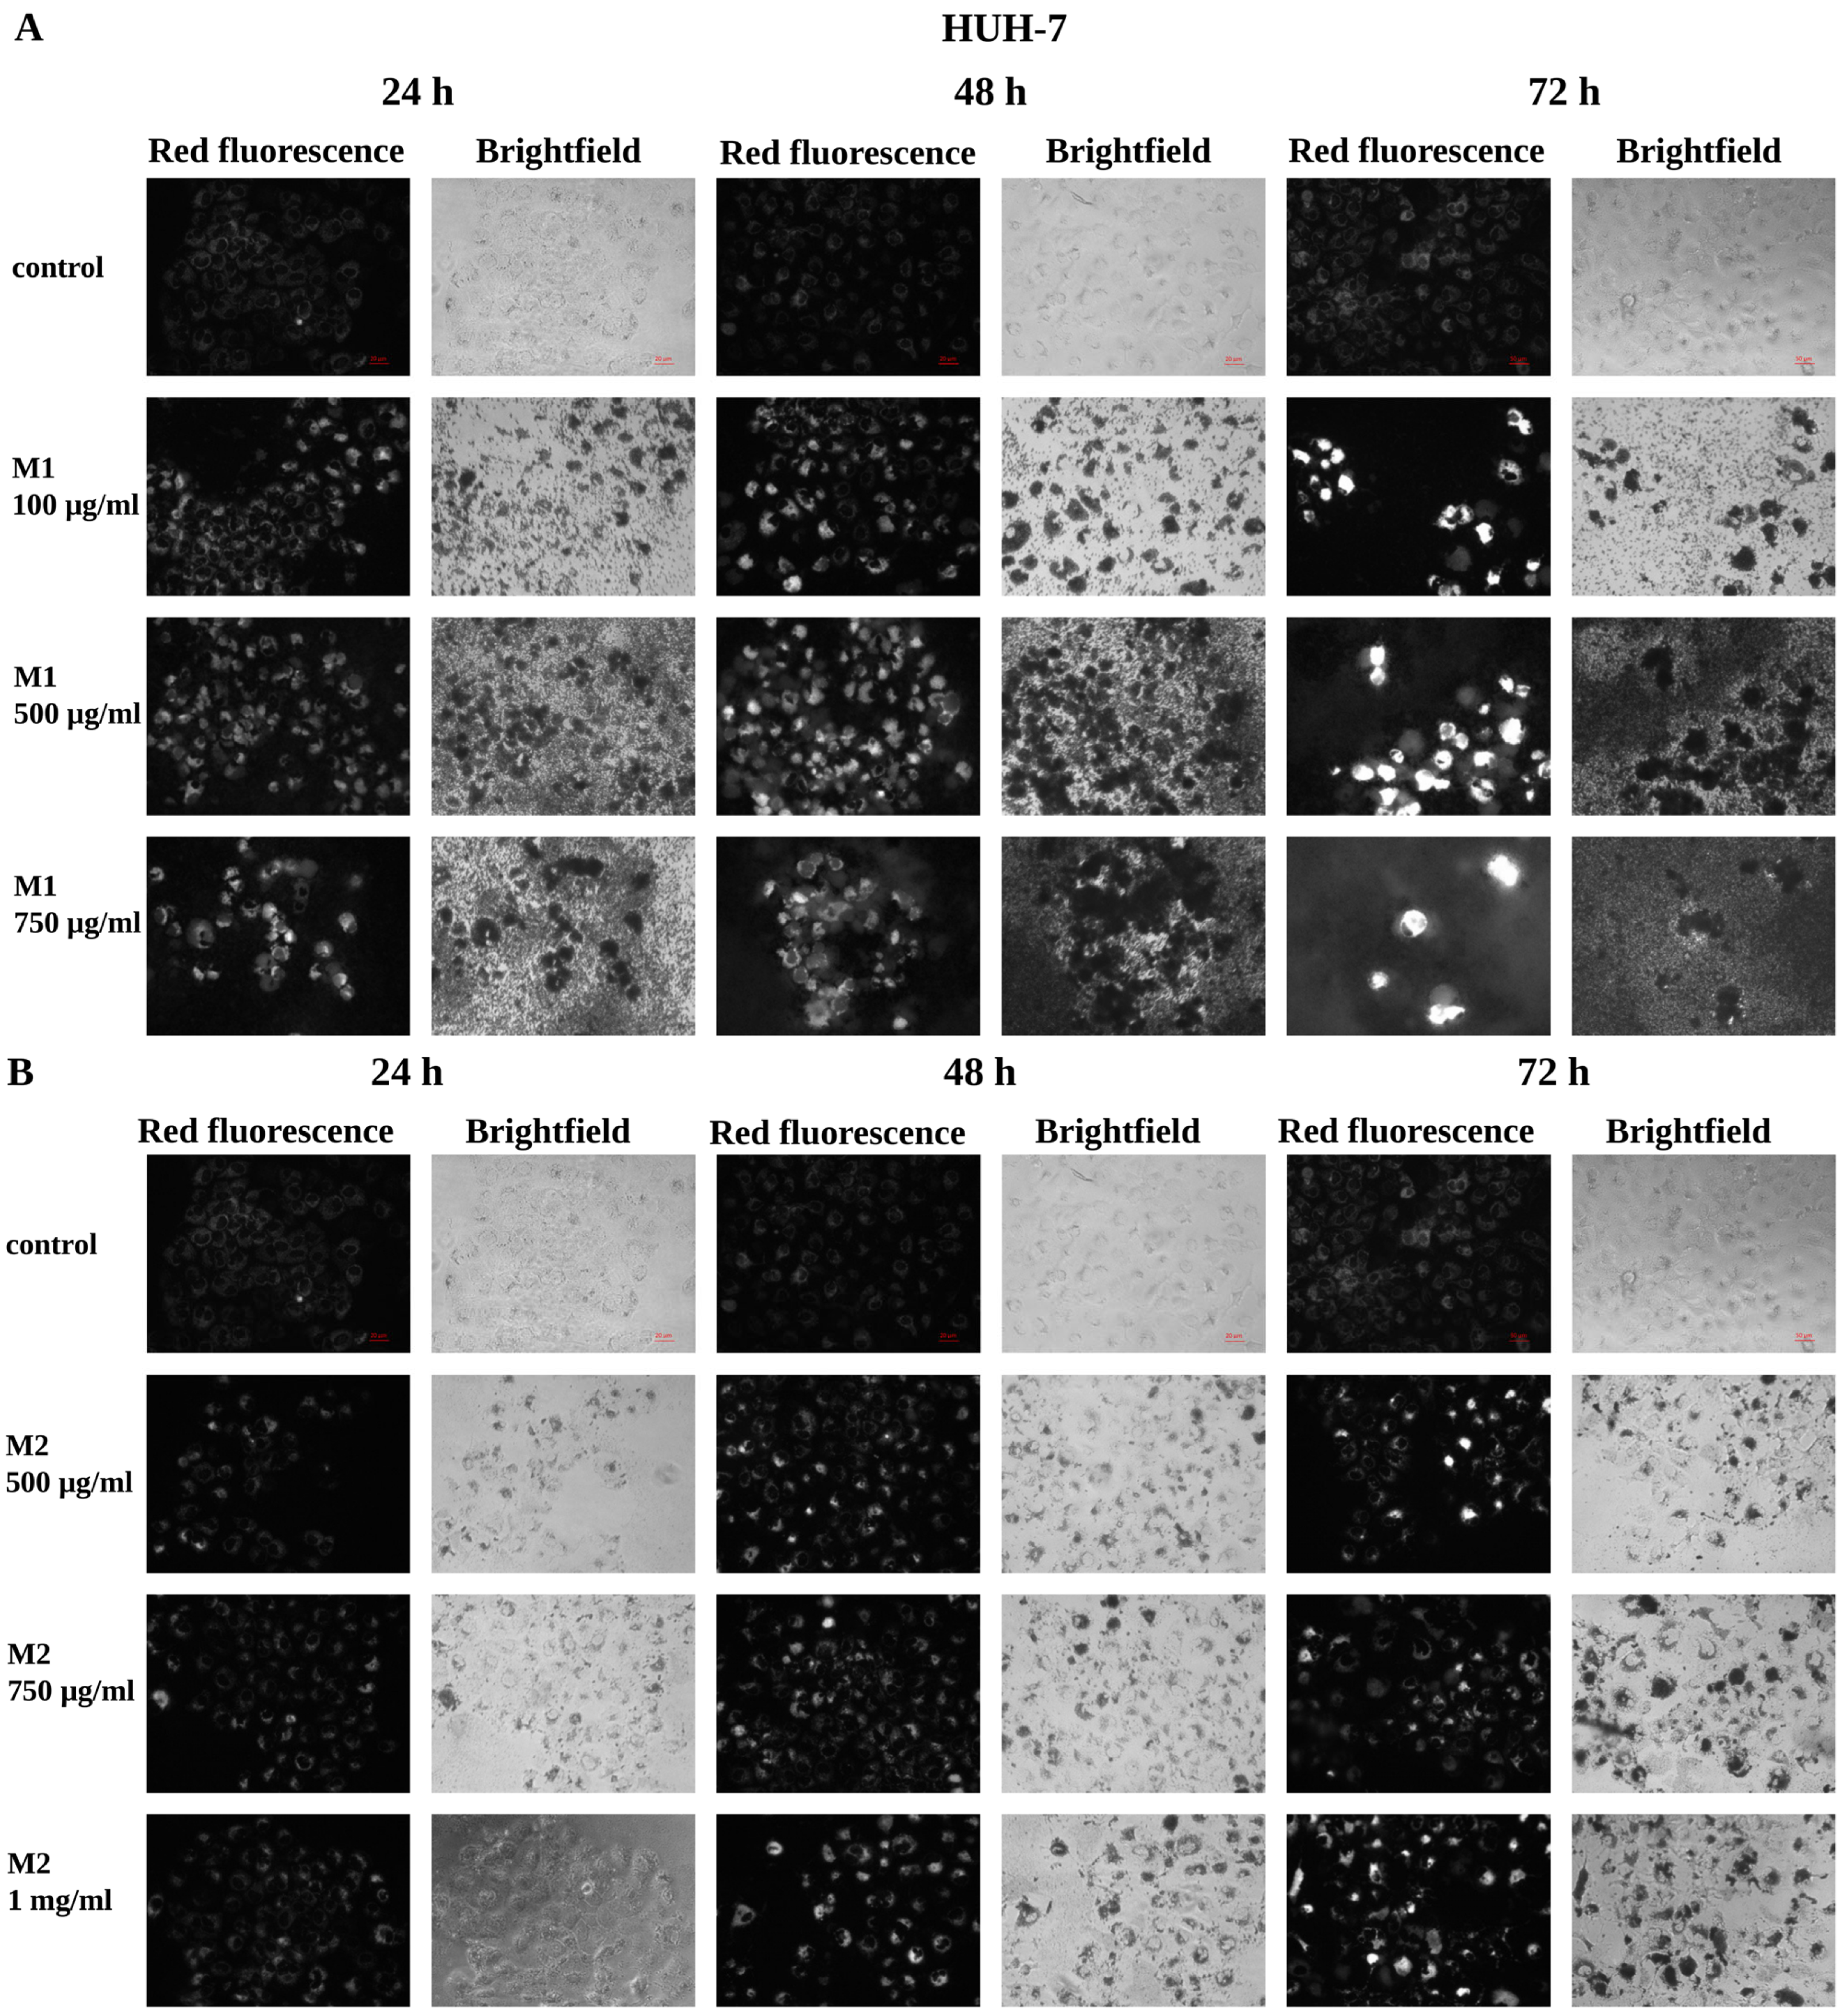
MitoTracker Red fluorescence revealed a significant shift towards higher Δψm, even after a 24 h treatment of HUH-7 cells with the lower concentration of M1 particles (100 μg/mL) used (Figure 1A); however, these cells still retained the mitochondrial network morphology of control cells: an extensive mitochondrial network with uniform signal distribution throughout the cytoplasm and a clearly defined nucleus. For the remaining concentrations of M1 particles and timepoints used, progressive, dose- and time-dependent deterioration of the mitochondrial network and nucleus integrity was observed (Figure 1A). Indeed, at 500 µg/mL M1 particles (24 h), in many cells, the presence of higher Δψm was accompanied by the presence of a not well-defined nucleus, whereas at 750 µg/mL M1 particles (24 h), many cells already exhibited mitochondrial depolarization and loss of nucleus integrity (Figure 1A). At 48 h, these changes were substantially amplified. HUH-7 cells exposed to 100–750 µg/mL M1 particles displayed punctuated, intensified MitoTracker Red foci, a hallmark of mitochondrial fragmentation and early hyperpolarization. Many cells exhibited a not well-defined nucleus, whereas in others, mitochondrial depolarization was evident (Figure 1A). At 72 h, HUH-7 cells treated with the selected concentrations of M1 particles displayed intense hyperpolarization or almost complete depolarization of the mitochondrial membrane and loss of nucleus integrity. Moreover, a dramatic reduction in cell density was observed in agreement with the results of the MTT assay.
Figure 1.
MitoTracker™ Red fluorescence and brightfield microscopy of HUH-7 cells following exposure to carboxyl-modified polystyrene microplastics. Representative images of HUH-7 cells exposed to (A) 100, 500, and 750 µg/mL concentrations of M1 particles and (B) 500, 750, and 1000 µg/mL concentrations of M1 particles for 24, 48, and 72 h. For each condition, MitoTracker™ Red fluorescence images and the corresponding brightfield images are shown. Mock-treated cells served as control. Scale bars (red) correspond to 20 μm for images acquired at 24 and 48 h and 50 μm for images acquired at 72 h; all images within each timepoint are presented at the same scale as their respective control.
Interestingly, brightfield imaging revealed that HUH-7 cells attracted and accumulated M1 particles, with accumulation which was already evident at 24 h of treatment at all concentrations tested and intensified with prolonged incubation time and increased M1 particle concentration (Figure 1A). Furthermore, the cells that had accumulated the most M1 particles also exhibited the most significant effects on the mitochondrial network and mitochondrial membrane potential (Figure 1A). Similar but less intense effects on the mitochondrial network and mitochondrial membrane potential (Δm) were observed when HUH-7 cells were treated with M2 particles (500, 750 and 1000 μg/mL) for up to 72 h (Figure 1B). Indeed, at 24 h of treatment, most cells exhibited a shift towards higher Δψm. At 48 h, few cells displayed intensified fluorescent foci, while at 72 h of treatment, some cells exhibited intense hyperpolarization (especially at the lower M2 particle concentration used) or almost complete depolarization of the mitochondrial membrane and loss of nucleus integrity (Figure 1B). Interestingly, the effect on M2 particles on cell viability at 72 h of treatment was less pronounced than the ones observed in the case of M1 particles even for the highest concentration (1000 μg/mL) of M2 particles used. Although, at first glance, these results might appear inconsistent with those of the MTT assay, this could be attributed to the extreme mitochondrial membrane hyperpolarization in the remaining cells treated with M1 particles, a phenomenon that possibly masks the significant reduction in cell viability.
Brightfield imaging revealed that HUH-7 cells also attracted and accumulated M2 particles; however, the signal obtained was not as strong as in the case of M1 particles possibly due to the difference in particle size (Figure 1B).
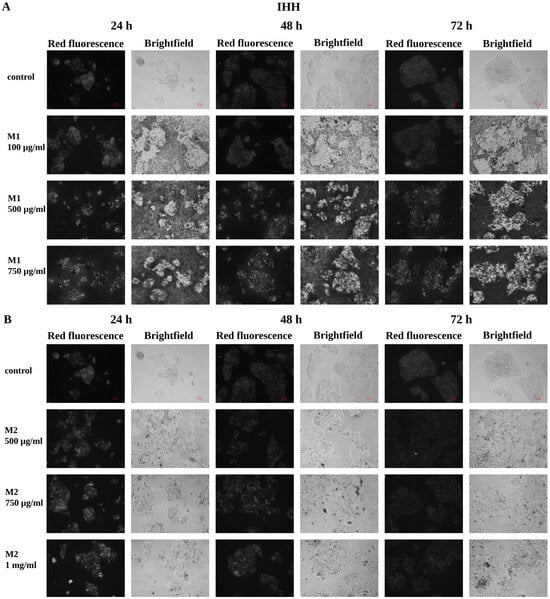
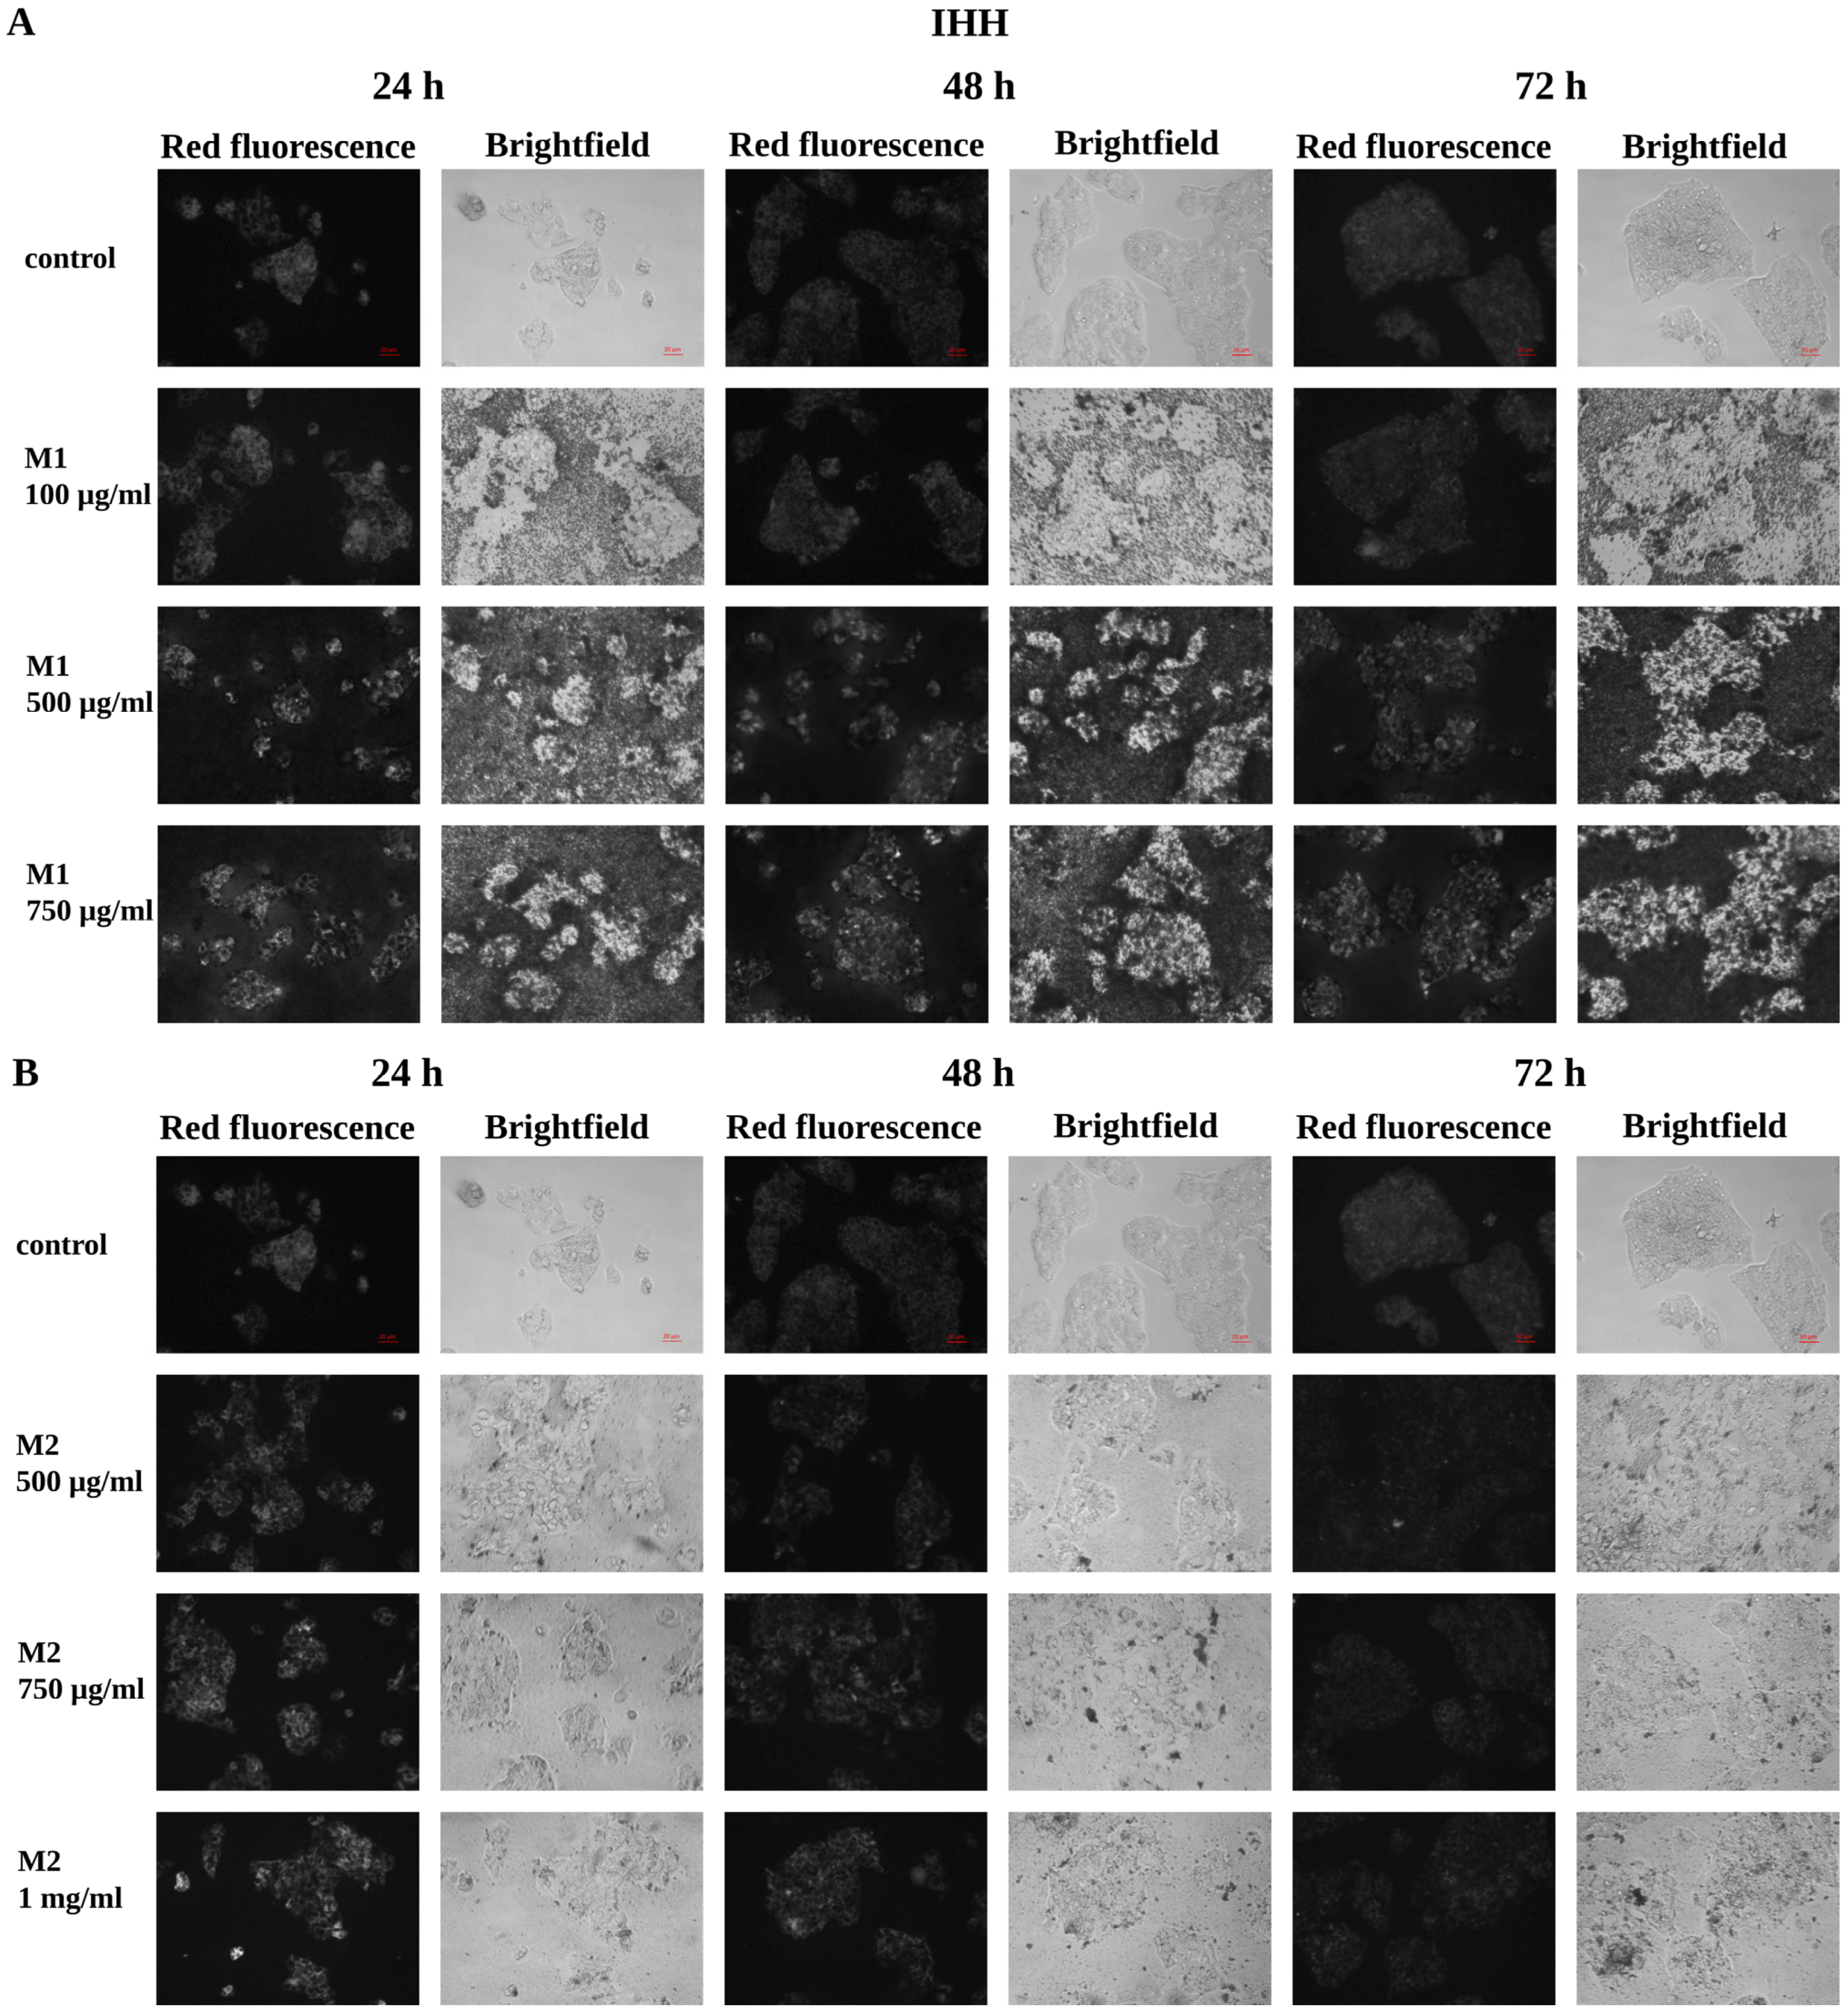
On the other hand, MitoTracker Red fluorescence imaging revealed that IHH cells maintained mitochondrial network architecture across all tested cPS-MP concentrations and timepoints (Figure 2A,B). Notably, only IHH cells exposed to the higher concentrations of M1 particles (500 and 750 µg/mL) exhibited a subtle increase in MitoTracker Red signal intensity relative to control, indicating a slight increase in ΔΨm. Interestingly, brightfield imaging revealed that IHH cells did not accumulate cPS-MPs; on the contrary, the concentration of cPS-MPs appeared increased around ΙHH cells. Moreover, brightfield imaging did not detect negative effects on IHH cell viability by the treatment with cPS-MPs (Figure 2A,B), in agreement with the results obtained by the MTT assay.
Figure 2.
MitoTracker™ Red fluorescence and brightfield microscopy of IHH cells following exposure to carboxyl-modified polystyrene microplastics. Representative images of IHH cells exposed to (A) 100, 500, and 750 µg/mL concentrations of M1 particles and (B) 500, 750, and 1000 µg/mL concentrations of M2 particles for 24, 48, and 72 h. For each condition, MitoTracker™ Red fluorescence images and the corresponding brightfield images are shown. Mock-treated cells served as controls. Scale bars (red) correspond to 20 μm for images acquired at 24 and 48 h and 50 μm for images acquired at 72 h; all images within each timepoint are presented at the same scale as their respective control.
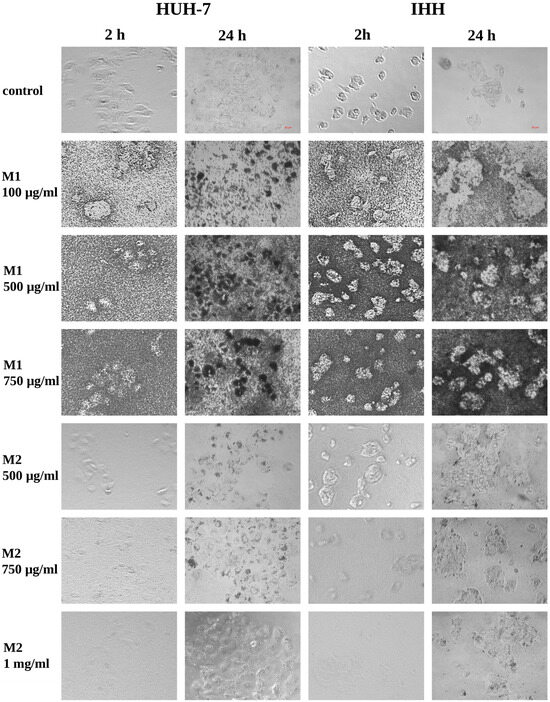
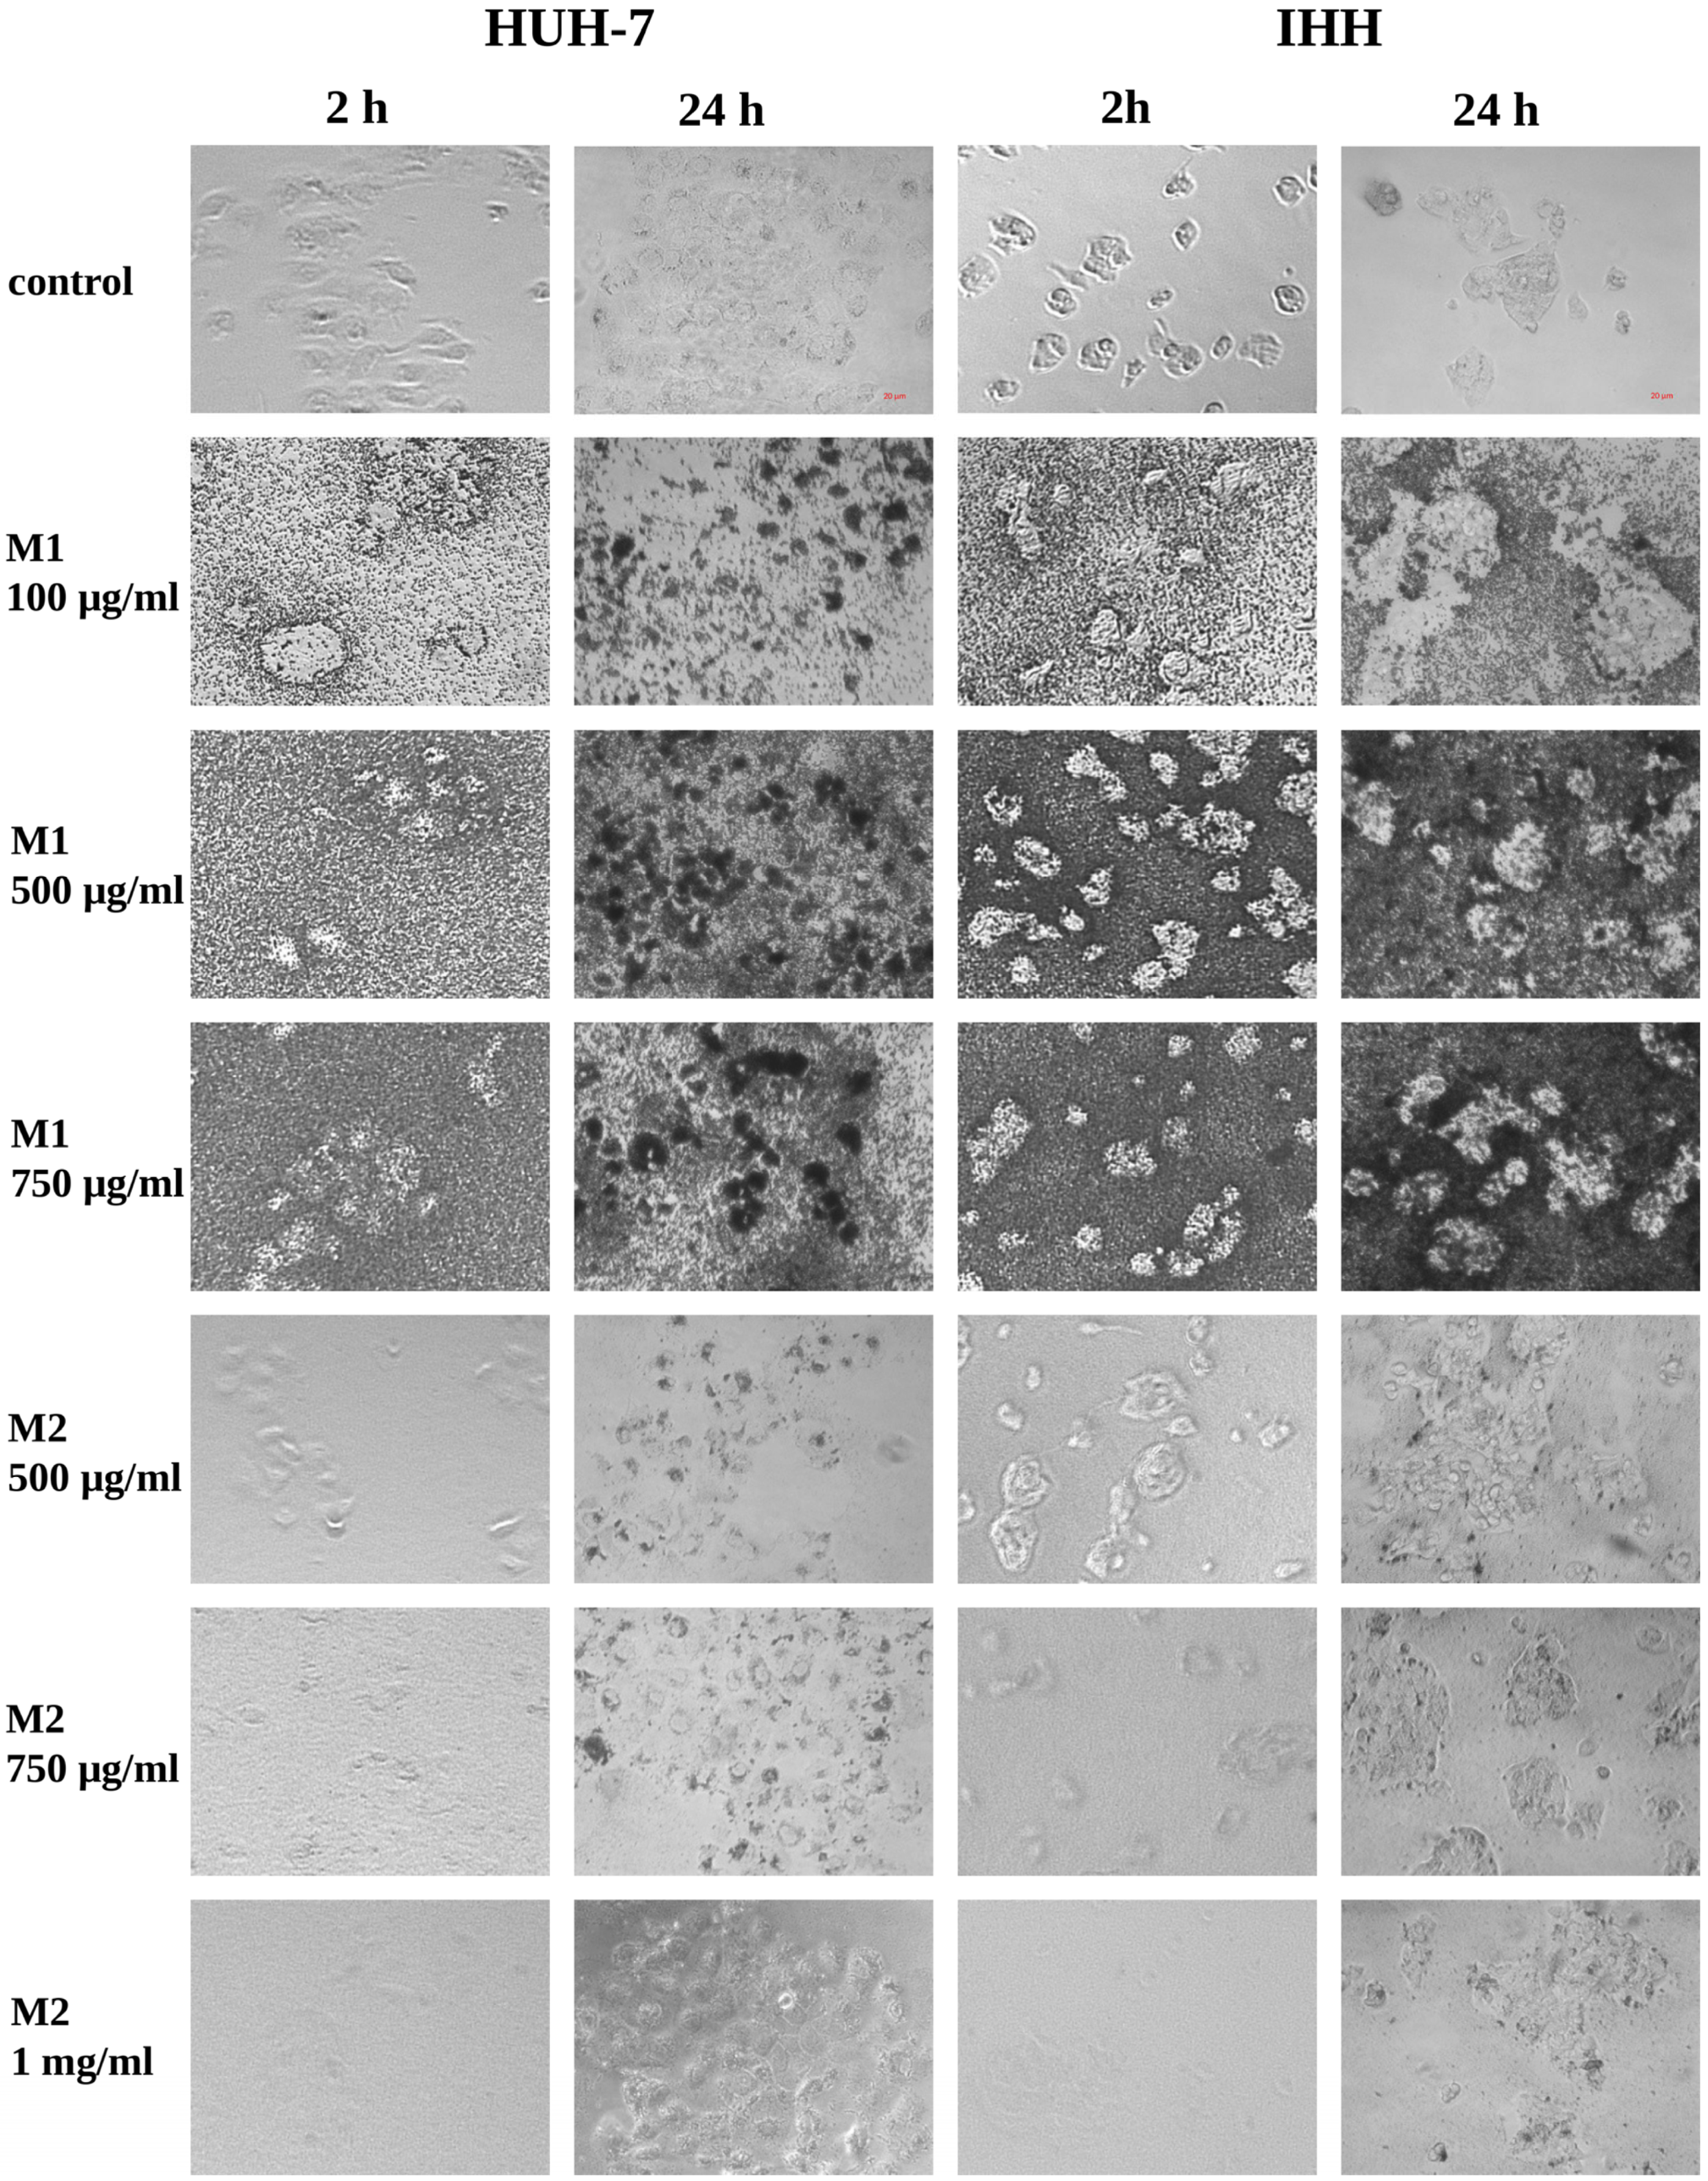
To further examine the accumulation of cPS-MPs by HUH-7 cells, we used brightfield microscopy to check the distribution of cPS-MPs at 2h of treatment compared with 24 h of treatment. In parallel, we performed the same experiment using IHH cells. As shown in Figure 3, at 2 h of treatment, the distribution of M1 particles in the case of HUH-7 cells resembled the one in the case of IHH cells at the same timepoint. In contrast, at 24 h of treatment, the distribution of M1 particles differed significantly between the two cell lines: IHH cells appeared almost free of M1 particles (Figure 3 in combination with Figure 2A), giving a clearer view than that of the 2 h treatment, while HUH-7 cells had accumulated M1 particles, giving a strongly darker view than that of the 2 h treatment (Figure 3 in combination with Figure 2A). The distribution of M2 particles was not easily detectable at 2 h of treatment of cells possibly because their size and electric charge allowed them to remain suspended in the cell medium for a longer time.
Figure 3.
Brightfield microscopy of HUH-7 and IHH cells following 2 h and 24 h treatment with M1 or M2 carboxyl-modified polystyrene microplastics. Representative brightfield images of HUH-7 and IHH cells following exposure to M1 particles at 100, 500, and 750 µg/mL or M2 particles at 500, 750, and 1000 µg/mL for 2 and 24 h. For each cell line, mock-treated cells served as control.
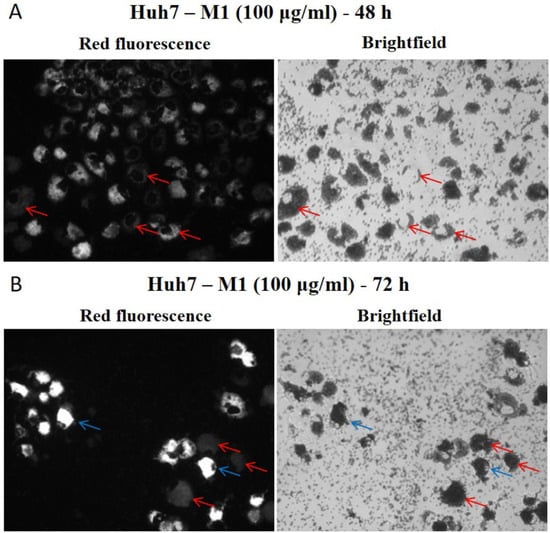
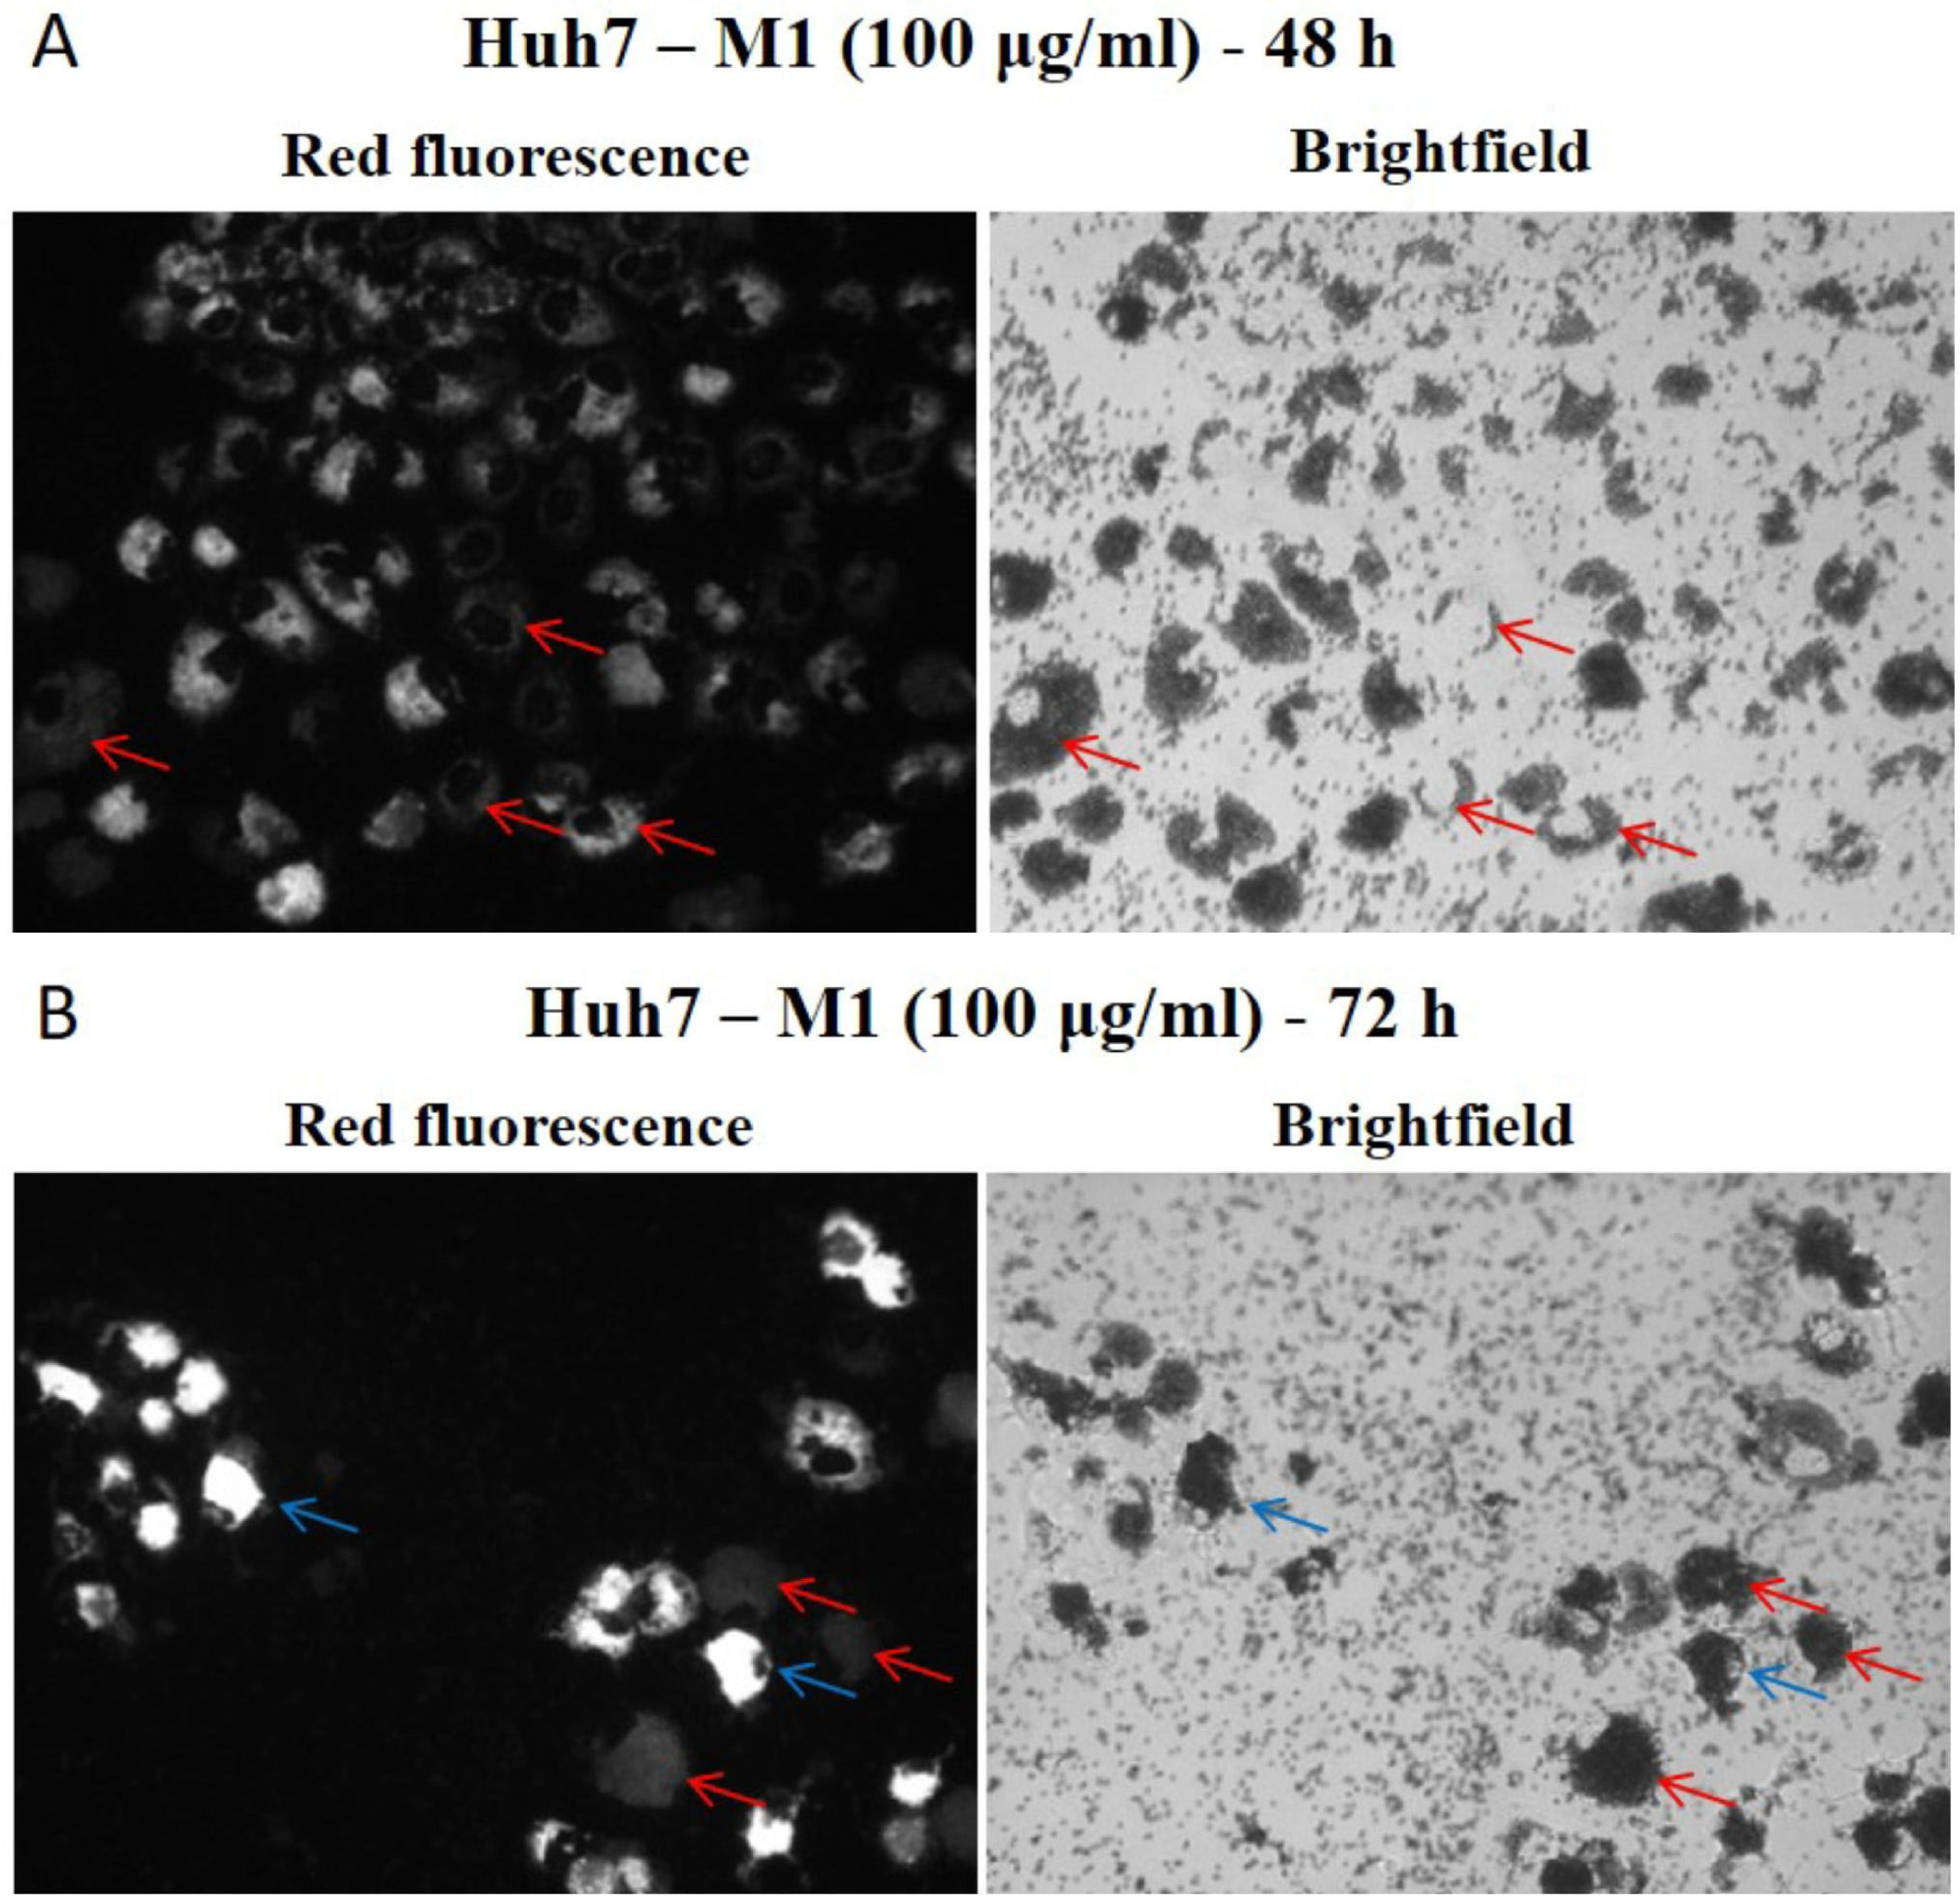
Next, we used larger views of the images in Figure 1A to understand whether HUH-7 cells accumulated M1 particles on the cell membrane outside the cell or inside the cell. As shown in Figure 4A, many HUH-7 cells which had accumulated M1 particles retained a visible and M1 particle-free nucleus at 48 h of treatment, suggesting that M1 particles had accumulated in the cell cytoplasm rather than on the cell membrane outside the cell. At later timepoints of M1 particle treatment (72 h), as shown in Figure 4B, HUH-7 cells exhibited an extensive rearrangement of the mitochondrial network with a concomitant loss of cell nucleus integrity. In some HUH-7 cells, this mitochondrial network rearrangement was accompanied by an extreme but possibly rapid and abrupt hyperpolarization of the mitochondrial membrane, and shrinkage of the cell. Other HUH-7 cells exhibited mitochondrial membrane depolarization and cell swelling. Thus, either there were two independent phenotypes or a transient extreme hyperpolarization of the mitochondrial membrane and the accompanying cell shrinkage could be followed by mitochondrial membrane depolarization and cell swelling during the death process of HUH-7 cells.
Figure 4.
Bigger views of images of Figure 1A corresponding to MitoTracker™ Red fluorescence and brightfield microscopy of HUH-7 cells treated with M1 carboxyl-modified polystyrene microplastics. (A) HUH-7 cells treated for 48 h with M1 particles exhibited M1 particles surrounding the visible and M1 particle-free nucleus, while M1 particles covered the rest of the cell (red arrows), and (B) HUH-7 cells treated for 72 h with M1 particles exhibited mitochondrial network rearrangement and loss of nucleus integrity accompanied by either strong hyperpolarization of the mitochondrial membrane and possible shrinkage of cells (blue arrows) or depolarization of the mitochondrial membrane and cell swelling (red arrows).
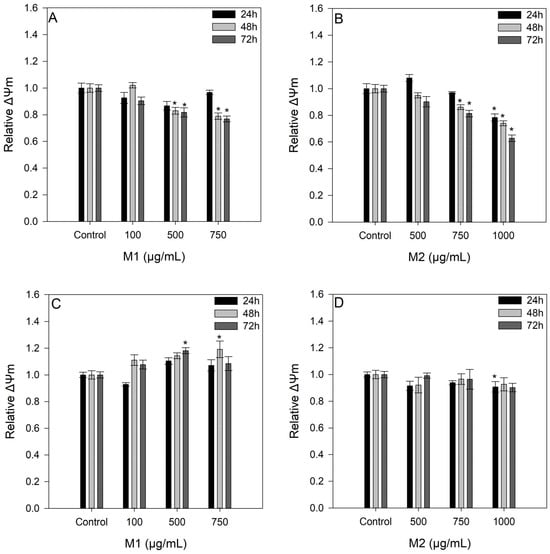
To have a clue as to which of the above two phenotypes dominated, we treated HUH-7 and IHH cells with different concentrations of M1 (100, 500 and 750 μg/mL) and M2 (500, 750 and 1000 μg/mL) particles for 24, 48 and 72 h. Then, we stained the cells with MitoTracker Green and MitoTracker Red, measured the fluorescence intensity of each well and calculated the ratio of MitoTracker™ Red to MitoTracker™ Green fluorescence to detect the global changes in mitochondrial membrane potential (ΔΨm). As shown in Figure 5, the respective ration was significantly reduced in the case of HUH-7 cells treated with higher concentrations of M1 (Figure 5A) or M2 (Figure 5B) particles, whereas as expected, it was not significantly affected in the case of IHH cells (Figure 5C,D). This suggests that most HUH-7 cells exhibited the phenotype related to mitochondrial membrane depolarization when treated with the higher concentrations of M1 and M2 particles.
Figure 5.
Effects of carboxyl-modified polystyrene microplastics on mitochondrial membrane potential (ΔΨm) in HUH-7 and IHH cells. Global ΔΨm was assessed following exposure to M1 and M2 microplastics for 24, 48, and 72 h. (A) HUH-7 cells exposed to M1 particles at 100, 500 and 750 µg/mL. (B) HUH-7 cells exposed to M2 particles at 500, 750, and 1000 µg/mL. (C) IHH cells exposed to M1 particles at 100, 500, and 750 µg/mL. (D) IHH cells exposed to M2 particles at 500, 750, and 1000 µg/mL. Values are expressed relative to the corresponding untreated control, normalized to 1. Data are presented as means ± SD. Asterisks (*) indicate statistically significant differences compared with the corresponding untreated control (p < 0.05).
3.3. HepatoMP PMT: Prediction Performance and Visualization Outputs
3.3.1. User Interface and Functional Layout of HepatoMP PMT
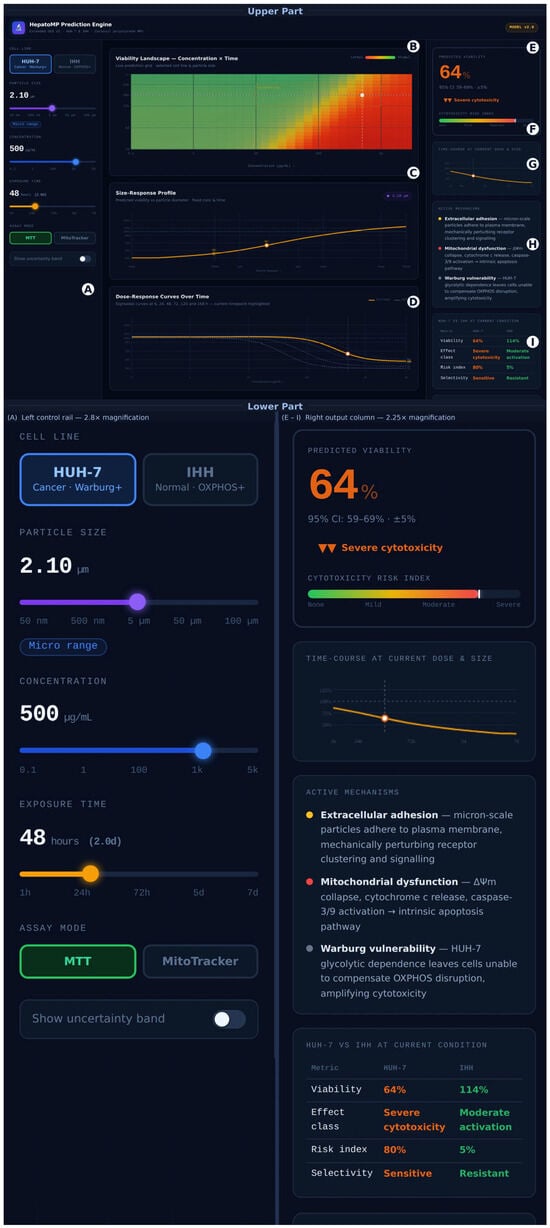
HepatoMP Prediction Engine (v2.0) is implemented as a single-file, self-contained HTML/CSS/JavaScript application requiring no installation nor internet connection. The interface is organized into three functional zones arranged in a fixed three-column layout: a narrow, left control rail housing all input parameters; a central canvas displaying three concurrent data visualizations; and a right-hand result panel delivering the quantitative prediction readout, mechanistic commentary and comparative cell-line assessment. The full interface is shown in Figure 6, and the key components are labelled (A)–(I) as described below.
Figure 6.
Upper part: Annotated screenshot of the HepatoMP Predictive Modelling Tool (v2.0) user interface, shown under the conditions: HUH-7 cell line; M1 particles (2.1 μm); concentration, 500 μg/mL; exposure time, 48 h; MTT assay mode. Panel labels correspond to interface zones described in Section 3.3.1: (A) left control rail with logarithmic particle size, concentration and linear time sliders, cell-line toggle, assay-mode toggle and uncertainty band switch; (B) concentration × time viability heatmap (green = no effect/stimulation; red = severe cytotoxicity); amber dashed rectangle = experimentally validated parameter space; white crosshair = current condition; (C) size–response curve showing predicted viability vs. particle diameter (50 nm–100 μm); filled circles = M1 and M2 experimental anchor points; (D) multi-timepoint dose–response family at 6, 24, 48, 72, 120 and 168 h; amber curve = active timepoint; (E) predicted viability readout with 95% CI and effect classification label; (F) cytotoxicity risk index gauge (None–Mild–Moderate–Severe); (G) time-course kinetics strip (1–168 h) at fixed dose and size; (H) active mechanism panel with color-coded mechanistic annotations; (I) HUH-7 vs. IHH comparison table at current condition. Predicted values: HUH-7 = 64% viability (severe cytotoxicity); IHHs = 114% (moderate metabolic activation). Lower Part: Left: Magnified excerpt of (A). Right: Magnified excerpt of (B–I).
Left control rail (input parameters). The left panel (A) provides five continuous or discrete controls. (i) Cell line selector: A two-button toggle between HUH-7 (hepatocellular carcinoma; Warburg +) and IHHs (immortalized normal hepatocytes; OXPHOS +), which switches the underlying prediction model between the Hill cytotoxicity equation and the IHH hormesis model. (ii) Particle size slider: A logarithmic continuous slider spanning 50 nm to 100 μm, displaying the current value in nm or μm as appropriate and labelling the size regime (Nanoplastic/Micro/Large micro/Macro) dynamically. (iii) Concentration slider: A logarithmic slider covering 0.1 to 5000 μg/ML. (iv) Exposure time slider: A linear slider spanning 1 to 168 h (7 days), with a live day-equivalent display. (v) Assay-mode toggle (MTT/MitoTracker) switches the interpretation framework, with MTT activating quantitative Hill equation predictions and MitoTracker activating the qualitative mitochondrial status readout anchored to the fluorescence microscopy data. An optional uncertainty band toggle enables or disables the display of ±95% confidence intervals on all curve outputs.
Central canvas (visualization outputs). The central zone (B–D) contains three stacked canvas panels, each re-rendered in real time on any slider or toggle change. (vi) The uppermost panel is the concentration × time viability heatmap (Figure 6B): a 34 × 22 grid encoding predicted viability by cell color (green = stimulation/no effect; amber–orange = mild–moderate cytotoxicity; red = severe cytotoxicity), with concentration on the logarithmic x-axis (0.1–5000 μg/mL) and exposure time on the y-axis (1–168 h). A white interactive crosshair marks the currently selected condition; clicking anywhere on the heatmap navigates both the concentration and time sliders simultaneously to that point. An amber dashed rectangle delineates the experimentally validated parameter space (10–1000 μg/mL × 24–72 h). (vii) The middle panel is the size–response curve (C): a continuous curve of predicted viability versus particle diameter on a logarithmic size axis spanning 50 nm to 100 μm, at the currently selected concentration and timepoint. The experimentally validated M1 and M2 anchor points are marked as filled circles; a moving dot tracks the slider-selected size. When the uncertainty band toggle is active, shaded confidence intervals widen progressively outside the validated range. (viii) The lower panel shows the multi-timepoint dose–response family (D): six Hill/hormesis curves computed at 6, 24, 48, 72, 120 and 168 h, rendered in progressively deeper shading, with the currently active timepoint highlighted in amber (HUH-7) or green (IHHs). A dashed vertical line marks the selected concentration and a filled dot indicates the current predicted viability value.
Right result panel. The right panel (Figure 6E–I) consolidates all scalar and interpretive outputs for the selected condition. (ix) The prediction readout card (E) displays the predicted viability percentage in a large, color-coded typeface (green to amber to red), accompanied by the 95% confidence interval, an effect classification label (e.g., “Severe cytotoxicity” and “Metabolic activation”) and a horizontal cytotoxicity risk index gauge (Figure 6F) with a needle spanning None–Mild–Moderate–Severe. (x) A time-course kinetics strip (Figure 6G) plots predicted viability as a continuous function of time (1–168 h) at the fixed selected concentration and particle size, providing rapid visual assessment of cumulative exposure kinetics. (xi) The active mechanism panel (H) dynamically lists the predicted cellular mechanisms operative at the selected condition, with color-coded bullet points (red: cytotoxic mechanisms; amber: stress responses; green: adaptive/protective mechanisms; gray: baseline context). The listed mechanisms update automatically as the user navigates the parameter space, reflecting the size-, concentration- and time-dependent activation logic encoded in the model. (xii) An HUH-7 vs. IHH comparison table (I) presents a side-by-side summary of predicted viability, effect class, cytotoxicity risk index and selectivity for both cell lines simultaneously at the current condition, enabling rapid identification of differential susceptibility windows. In the representative screenshot shown (HUH-7; M1, 2.1 μm; 500 μg/mL; 48 h; MTT mode), the PMT predicts 64% viability (severe cytotoxicity; risk index: 80%) for HUH-7 versus 114% (moderate metabolic activation; risk index: 6%) for IHHs—a differential of 50 percentage points that illustrates the cancer-selective toxicity window discussed in following.
The prediction engine was calibrated against the 84 experimental MTT anchor points spanning all tested cell line, size, concentration and timepoint combinations. At the two characterized size fractions, model RMSE values range from 3.8 to 5.3% viability for HUH-7 cells and from 2.8 to 3.2% for IHH cells across all timepoints. The Hill curves for HUH-7 are well-separated between M1 and M2 at 72 h, with the M2 curve shifted by approximately 0.6 log-units to the left, corresponding to a 4-fold EC50 difference consistent with the size-scaling exponent of 0.62, while the IHH hormesis model reproduces the characteristic inverted saturation profile and its progressive attenuation from 24 to 72 h. The model correctly reproduces all statistically significant deviations from the control identified by ANOVA–Tukey’s HSD analysis, with no false-positive cytotoxicity predictions in IHH cells.
3.3.2. PMT Sensitivity Analysis and Uncertainty Quantification
The PMT implements a transparent uncertainty quantification framework that inflates confidence intervals progressively as predictions move beyond the experimentally validated parameter space. Within the validated range (0.49–2.1 μm; 10–1000 μg/mL; 24–72 h), model uncertainty is set to ±5% viability, reflecting the average experimental SD of the MTT data. Uncertainty increases by approximately 8% per log-unit of particle size deviation from the validated range, by 6% for concentration excursions beyond the tested range and by 5% plus 0.05% per hour for timepoint extrapolation beyond 72 h, yielding a maximum displayed uncertainty of ±35% viability at the extreme corners of the parameter space (e.g., 50 nm particles, 5000 μg/mL, 168 h). This graduated uncertainty display is rendered as shaded bands on all curve outputs and as a color-coded border on the viability readout panel. The approach follows published recommendations for the transparent reporting of in vitro-to-extended-range computational predictions [19].
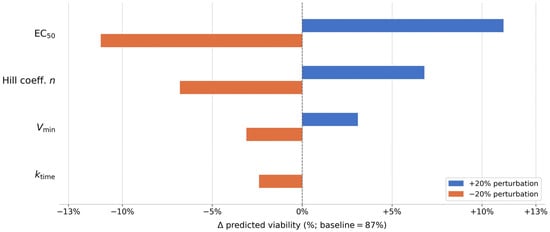
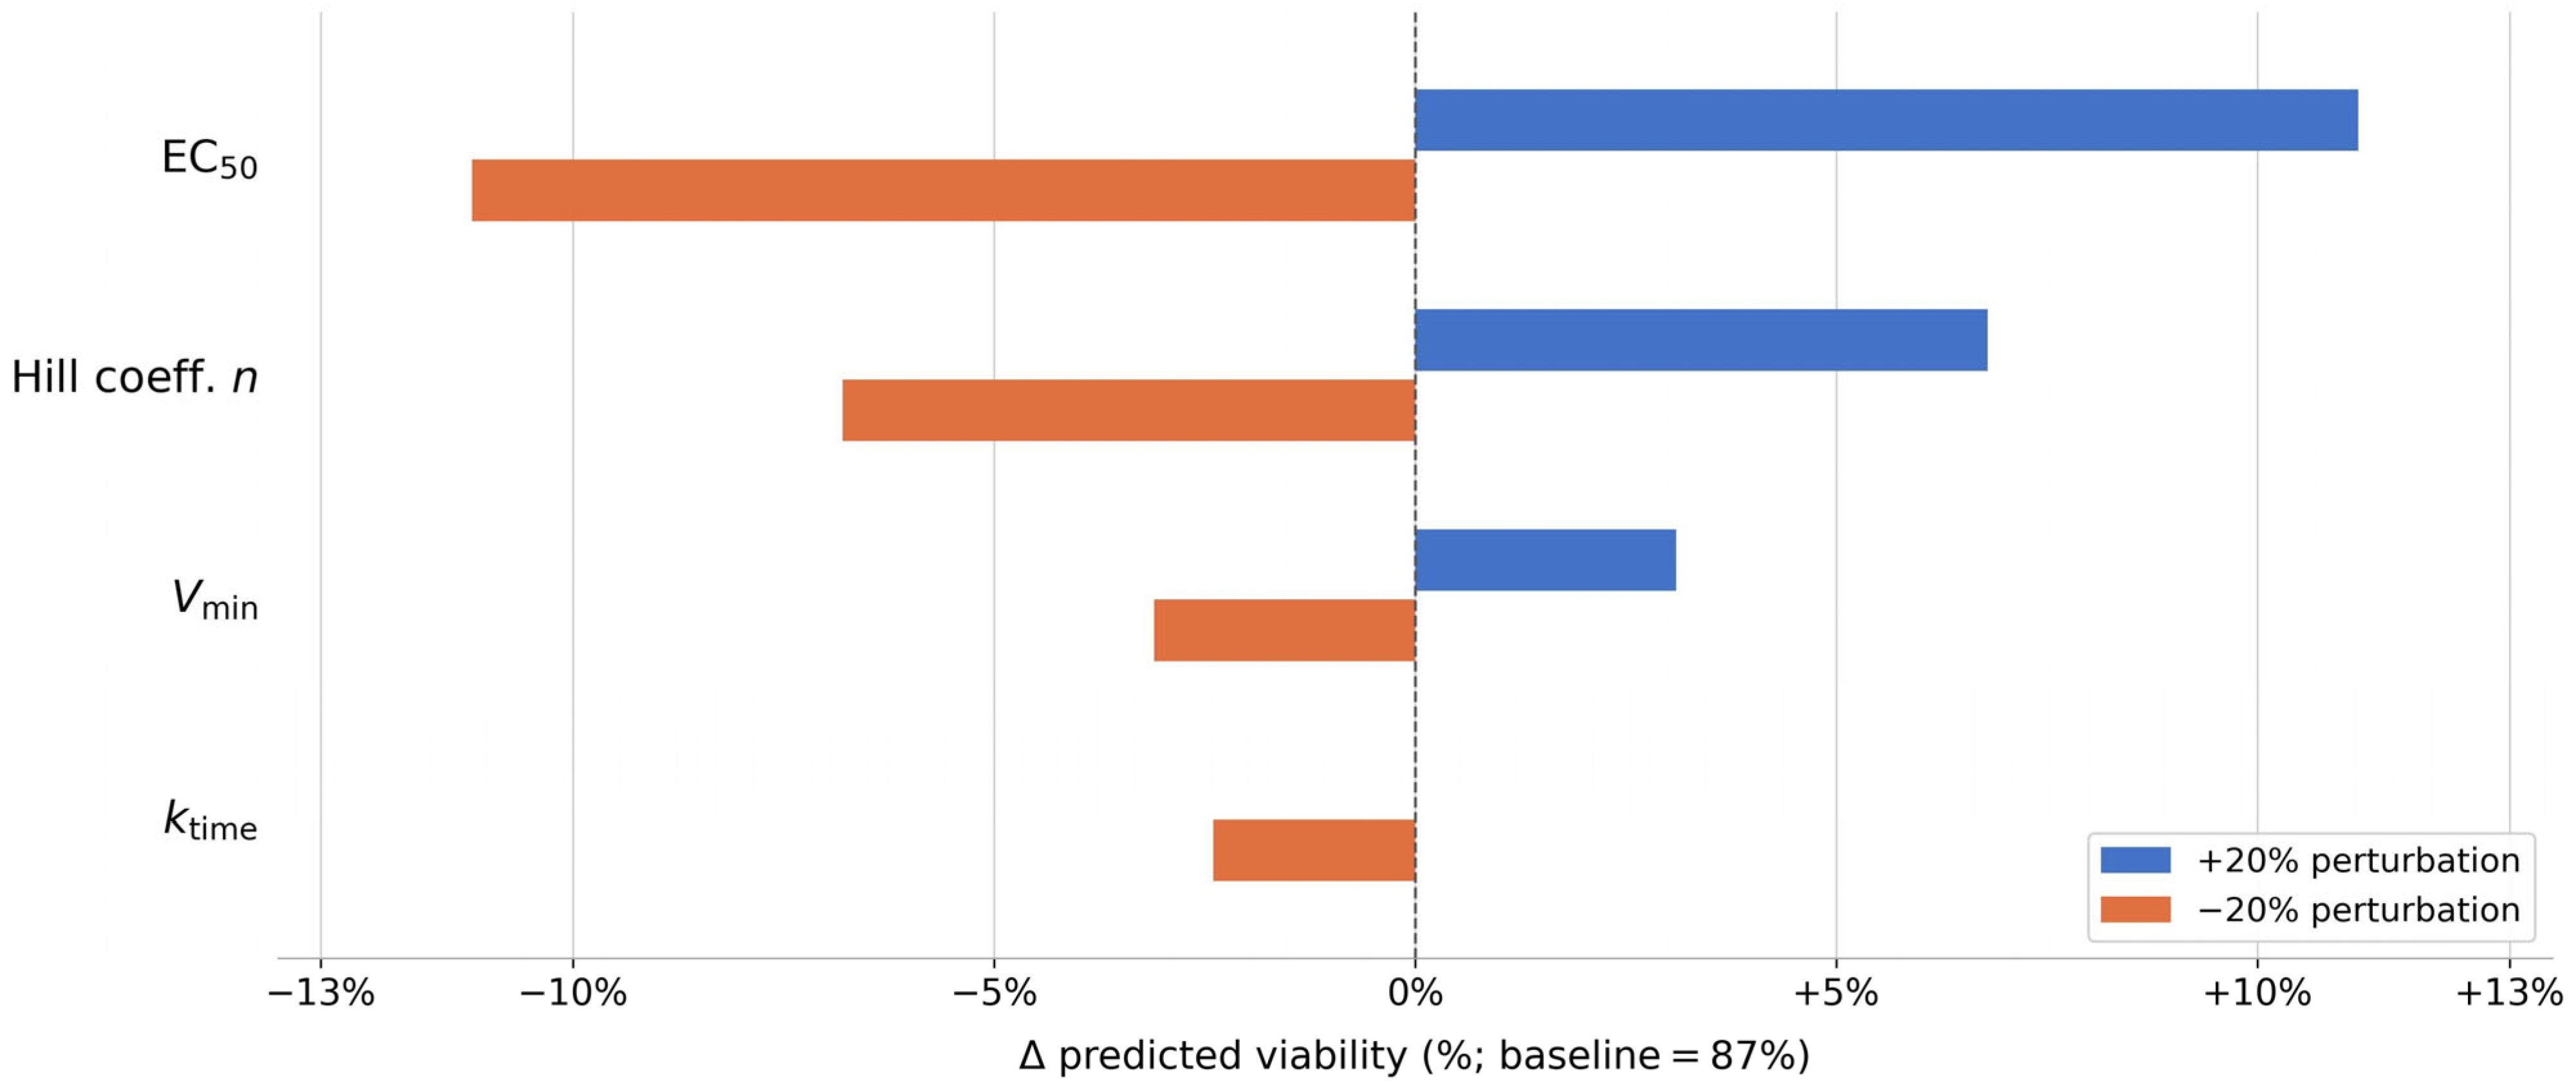
A one-at-a-time sensitivity analysis was conducted by perturbing each model parameter by ±20% from its calibrated value and recording the resulting change in predicted viability at a central condition (HUH-7, M2, 500 μg/mL, 48 h; baseline prediction: 87%). The parameter with the greatest influence on the prediction was EC50 (±11.2% change in predicted viability for ±20% EC50 perturbation), followed by the Hill coefficient n (±6.8%), Vmin (±3.1%) and ktime (±2.4%). The EC50 dominance highlights that the size-scaling relationship is the primary source of prediction uncertainty when extrapolating to untested particle sizes—reinforcing the importance of expanding the experimental anchor dataset to additional size fractions in future studies. Figure 7 presents a tornado plot summarizing the one-at-a-time sensitivity analysis results.
Figure 7.
Tornado plot of one-at-a-time sensitivity analysis for the HepatoMP Hill equation prediction at a central condition (HUH-7, M2, 500 μg/mL, 48 h; baseline prediction = 87% viability). Each bar represents the change in predicted viability (Δ%) resulting from ±20% perturbation of the indicated model parameter. Parameters ranked from the most (top) to the least (bottom) influential: EC50, Hill coefficient n, Vmin, and ktime. Blue bars: increase in predicted viability with +20% perturbation; orange bars: decrease.
4. Discussion
4.1. Scope and Proof-of-Concept Framework
Before discussing the experimental findings in detail, it is important to contextualize the scope of the present work. This study is explicitly conceived as a proof-of-concept investigation, with the dual objective to (i) generate a structured in vitro dataset characterizing the differential cytotoxic response of two contrasting hepatic cell lines to carboxyl-modified polystyrene particles and (ii) demonstrate that such a dataset, even when limited to two particle size fractions, seven concentrations and three timepoints, can serve as a sufficient empirical foundation for a mechanistically grounded computational prediction tool. The HepatoMP PMT should therefore be understood as a first-generation prototype rather than a validated risk assessment instrument: it demonstrates the feasibility and utility of the approach, defines the mathematical framework and identifies the experimental gaps that must be addressed in future studies before the model can be applied to regulatory or clinical contexts.
In vitro studies of MP hepatotoxicity have expanded substantially over the past decade, yet major gaps remain in the literature. The majority of published work has employed a single hepatocellular model, most commonly HepG2 or HUH-7, without a paired normal hepatocyte control, making it impossible to distinguish cancer cell-specific responses from general hepatocellular biology [6,7]. A representative example is the comprehensive study by Banerjee et al. [9], who systematically characterized the effects of particle size (50–5000 nm), surface functionalization (aminated, carboxylated, and non-functionalized), concentration (0.1–100 µg/mL) and exposure period (1–24 h) on HepG2 liver cells, yet without a matched normal hepatocyte comparator, leaving open the question of whether the observed responses reflect general hepatocellular biology or cancer cell-specific vulnerabilities. Where normal hepatocytes have been included, experimental designs have rarely been matched in particle type, surface chemistry and concentration range, precluding direct mechanistic comparison [8,20]. Furthermore, the overwhelming focus on particles in the micron range has left the sub-micron and nanoplastic fraction—arguably the most toxicologically relevant given its superior cellular uptake, largely uncharacterized in hepatic models, despite emerging evidence that polystyrene nanoplastics produce cytotoxic effects at substantially lower concentrations than micron-scale equivalents. The use of carboxyl-functionalized polystyrene as a model particle in the present study is a deliberate design choice: carboxylated particles most closely approximate the oxidized, negatively charged surface that environmental MPs acquire through weathering [10], and—critically—their toxicity operates through intracellular mechanisms rather than the surface charge-driven membrane poration that dominates aminated particle cytotoxicity. It should be noted that the current HepatoMP PMT is calibrated exclusively to carboxylated polystyrene particles; predictions for aminated or non-functionalized particles would require separate calibration datasets and distinct mechanistic assumptions, representing a scope limitation to be addressed in future iterations. Finally, the integration of both metabolic viability (MTT) and mitochondrial morphology (MitoTracker) endpoints in the same experimental system allows for cross-validation of the quantitative dose–response data against an independent, mechanistically informative imaging readout—a dual-endpoint design that is uncommon in the MP hepatotoxicity literature but substantially strengthens the biological interpretation of the modelling outputs.
4.2. Insights on MP-Induced Differential Cytotoxic Sensitivity of HUH-7 and IHH Cells
An interesting finding of the present study is the profound differential in MP-induced cytotoxic sensitivity between the two hepatic cell lines. HUH-7 cells exhibited clear, statistically significant dose- and time-dependent cytotoxicity, which was the most pronounced at 72 h of treatment, where mitochondrial activity reflecting viability reached ≈48% at concentrations ≥ 500 µg/mL M2 particles, while IHH cells remained unaffected, displaying a paradoxical metabolic stimulation under identical conditions. This contrast has direct mechanistic and translational implications.
The vulnerability of HUH-7 cells is best understood in the context of the Warburg effect. Hepatocellular carcinoma cells preferentially utilize aerobic glycolysis for energy production, resulting in relative downregulation of mitochondrial OXPHOS [13]. As cancer cells convert a portion of pyruvate produced by glycolysis into lactate rather than into acetyl-CoA for entry into the Krebs cycle, they exhibit increased requirements for the uptake of amino acids and fatty acids. Indeed, the increased demands of cancer cells for amino acids has been explored to produce tumor treatment strategies that are based on the targeting of specific amino acid transporters with amino acid-mimicking substrates or functional nanocarriers modified with amino acid ligands.
Our results supported a difference in behavior between hepatoma HUH-7 cells and immortalized human hepatocytes towards cPS-MPs using two different sizes of particles (0.49 and 2.1 μm), at the particle concentrations and timepoints used. Indeed, brightfield microscopic studies revealed that HUH-7 cells attracted and accumulated cPS-MPs intracellularly, whereas this did not occur with IHH cells (Figure 1, Figure 2, Figure 3 and Figure 4). Recent studies have also supported the intracellular accumulation of cPS-MPs in another liver cancer cell line, HepG2 cells, and have shown that really high concentrations of cPS-MPs are needed to observe intracellular accumulation of cPS-MPs in IHH cells [9,21]. Thus, we believe that the specific behavior is more general, at least for cancerous hepatocytes. Could this difference in behavior between HUH-7 hepatoma cells and immortalized human hepatocytes regarding cPS-MPs be related to the increased uptake of compounds (like amino acids) bearing carboxyl groups by cancer cells? At the moment this is not known but represents an attractive hypothesis.
However, this difference in behavior is possibly responsible for the cytotoxic effects of cPS-MPs on HUH-7 cells. Indeed, MTT assays (Table 1 and Table 2) and fluorescence microscopy studies (Figure 1 and Figure 2) highlighted the dose- and time-dependent negative effects of the used cPS-MPs on HUH-7 cells, in contrast to the absence of such effects on IHH cells. In vivo studies in mouse models have shown that PS-MPs can induce severe oxidative stress in liver tissue and that the intensity of this stress is higher for particles 5 μm in size than for particles 0.5 μm in size [22]. Moreover, cPS-MPs of 0.03 μm have been shown to induce oxidative stress in metabolically active cells [23]. Thus, our results of the MTT assay and the induced fluorescence of MitoTracker Red observed in cPS-MP-exposed HUH-7 cells (Table 1 and Figure 1) agree with the putative induction of reactive oxygen species (ROS) that could eventually trigger cell death in HUH-7 cells.
Interestingly, our results highlight the implication of mitochondria in the process of cell death in HUH-7 cells, as the two phenotypes of dying cells observed at the late stages of treatment of HUH-7 cells with high concentrations of cPS-MPs implicated changes in the mitochondrial membrane potential along with the loss of nucleus integrity and alterations in cell size. Actually, the phenotype involving extreme hyperpolarization of the mitochondrial membrane and shrinkage of the cell could be more related to the apoptosis way of cell death, whereas the phenotype characterized by mitochondrial membrane depolarization and cell swelling could be more linked to necroptosis [24]. However, we cannot exclude the possibility that the two cell death-related phenotypes observed are different stages of the same pathway, where a transient extreme hyperpolarization of the mitochondrial membrane and the shrinkage of the cell are followed by mitochondrial membrane depolarization and cell swelling. Interestingly, PS-MPs have been related to both the apoptosis and necroptosis ways of cell death [25]. Moreover, our results (Figure 5) support the prevalence of the phenotype involving mitochondrial membrane depolarization and cell swelling among the dying HUH-7 cells due to prolonged exposure to high concentrations of cPS-MPs.
4.3. The HepatoMP Predictive Modelling Tool: Design Rationale and Scope
The HepatoMP tool represents an attempt to translate the validated in vitro dataset into a transparent, interactive framework for data visualization and mechanistically grounded extrapolation beyond the sampled experimental conditions. It is important to state clearly at the outset that HepatoMP is anchored to a purposefully limited empirical base consisting of two particle size fractions (M1: 2.1 µm; M2: 0.49 µm) and a maximum exposure window of 72 h and should therefore be understood as a hypothesis-generating and experiment-planning aid rather than a validated predictive instrument. The mathematical extrapolations it performs, while grounded in well-established pharmacotoxicological models, carry uncertainty that increases rapidly outside the validated parameter space and must be interpreted accordingly. The choice of the Hill equation as the underlying prediction model is well justified: the sigmoidal Hill function is the canonical dose–response model in pharmacotoxicology, and it has been validated for MP cytotoxicity modelling in several cellular systems [26,27]. The four key model extensions, namely, size-dependent EC50 scaling, time-decay kinetics, hormetic component for IHHs and uncertainty band inflation outside the validated range, are each grounded in mechanistic principles supported by the primary literature.
The size-scaling relationship [log10(EC50) = 2.30 + 0.62 × log10(d)] predicts EC50 of approximately 40 µg/mL for 50 nm nanoplastics and approximately 8000 µg/mL for 50 µm particles in HUH-7 cells at 48 h. The nanoplastic end of this prediction is broadly consistent with published hepatocellular toxicity data: as already mentioned above, Banerjee et al. [9] reported statistically significant cytotoxicity in HepG2 cells at concentrations as low as 10–25 µg/mL for 50 nm aminated polystyrene particles, indicating high potency for sub-100 nm particles in hepatocellular models, though toxic concentration thresholds rather than fitted EC50 parameters were reported and concerned aminated rather than carboxylated particles. The qualitative agreement, showing high potency in the nanoplastic range declining steeply with the increase in particle size, is nonetheless consistent with the size-scaling trajectory encoded in the PMT. The macro-scale end of the prediction space remains largely unvalidated experimentally for any surface functionalization and the PMT explicitly flags this through widening uncertainty bands, a key feature for responsible use of the extrapolative model.
The IHH hormesis model captures the empirically observed overcompensatory MTT stimulation and is consistent with the stress-response literature: the Nrf2 and HSP induction pathways show classic hormetic dose–response profiles in non-transformed cells, with a peak stimulatory amplitude of 20–35% above baseline at intermediate stressor concentrations—matching the observed 24–30% MTT stimulation at 500–1000 µg/mL M1 in this study [28,29].
The concentrations used in this study (10–1000 µg/mL) substantially exceed current estimates of human hepatic MP exposure under ambient environmental conditions [3]. However, several considerations support the relevance of this concentration range for both mechanistic characterization and risk assessment modelling. First, the dose–response relationships established at higher concentrations enable reliable extrapolation of EC50 and no-observed-adverse-effect level (NOAEL) parameters to environmentally relevant concentrations—a standard approach in chemical toxicology. Second, specific exposure scenarios (e.g., occupational exposure, seafood-heavy diets, and consumption of highly contaminated water sources) may produce local tissue concentrations substantially higher than blood-based estimates suggest, particularly given the hepatic first-pass accumulation of ingested MPs [4,5]. Third, the nanoplastic fraction, whose environmental concentrations are systematically underestimated due to detection limitations, may produce effects at substantially lower concentrations than the micron-scale MPs studied here, as suggested by the PMT predictions and corroborated by the emerging nanoplastic toxicology literature [30].
The cancer cell-specific sensitivity demonstrated here, specifically HUH-7 versus IHHs, also carries a potential therapeutic implication. The approximately 2–3× higher cytotoxic potency of cPS-MPs in the Warburg-phenotype cancer cells relative to normal hepatocytes suggests that further exploration of MP-associated selective cytotoxicity in cancer models is warranted, particularly in the context of MP surface modification as a vector for intracellular drug delivery to hepatocellular carcinoma [31].
4.4. Limitations and Future Directions
Several limitations of the present study should be acknowledged. The use of only two particle size fractions limits the granularity of size–activity relationship characterization; future studies employing a continuous size series or defined nanoplastic fractions would strengthen the empirical basis for the PMT size-scaling model. Most critically, the size-dependent EC50 scaling relationship (Equation (2)) is a two-point log–log parameterization derived from N = 2 experimental anchor points. This means that r2 = 1 is mathematically guaranteed and statistically uninformative and that it is impossible to calculate standard errors for the slope or intercept or to test the significance of the relationship. Equation (2) should be treated as a mechanistically motivated interpolation formula, not as a statistically validated regression, and extrapolations based on it carry inherently unquantifiable uncertainty beyond the two tested size fractions. In addition, future studies incorporating flow cytometric analysis, including Annexin V/PI staining, would enable quantitative characterization of cell death in response to cPS-MP exposure and complement the mitochondrial alterations observed in the present study. The PMT prediction model, while mechanistically grounded, requires systematic empirical validation across its extended parameter space before clinical or regulatory application.
5. Conclusions
Within the tested parameter space, comprising two particle size fractions (M1: 2.1 µm; M2: 0.49 µm), concentrations of 10–1000 µg/mL, and exposure periods up to 72 h, this study demonstrates that carboxyl-modified polystyrene microplastics induce dose-, time- and size-dependent cytotoxicity in HUH-7 hepatocellular carcinoma cells, while normal IHHs exhibit a hormetic stimulatory response and remain fully viable. Microscopic observations further indicated a preferential accumulation of cPS-MPs in HUH-7 cells, which coincided with progressive mitochondrial network disruption, loss of nuclear integrity and marked alterations in ΔΨm. In contrast, IHH cells preserved mitochondrial organization and ΔΨm, further supporting their greater resistance to cPS-MP-induced stress. Collectively, these findings demonstrate that the cellular response to cPS-MPs is influenced by cell phenotype, particle size, and exposure duration, while the differential accumulation of cPS-MPs between HUH-7 and IHH cells may contribute to their markedly different susceptibility to cPS-MP-induced cytotoxicity and mitochondrial dysfunction. Building upon this dataset, the HepatoMP tool provides an open-access, interactive framework for data visualization and Hill equation-based extrapolation across a wider parameter space. Consistent with its proof-of-concept character and the deliberately limited empirical base of two particle size fractions and a 72 h experimental window, HepatoMP should not be interpreted as a validated risk assessment instrument. Its extrapolations are explicitly flagged by widening uncertainty bands and are best understood as hypothesis-generating outputs to guide future experimental design. The primary contribution of HepatoMP Prediction Engine is to demonstrate that a structured, limited dataset can anchor a mechanistically transparent and extensible modelling framework—one that becomes progressively more reliable as additional size fractions, surface chemistries and longer exposure periods are incorporated in future work.
Supplementary Materials
The following supporting information can be downloaded at: https://www.mdpi.com/article/10.3390/microplastics5030169/s1, Table S1: Effect of particle size and concentration on HUH-7 cell viability after 24, 48 and 72 h of exposure. Data are presented as mean ± SD. Statistical analysis was performed using two-way ANOVA followed by Tukey’s multiple comparisons test, with particle size and concentration as independent variables. Different letters indicate statistically significant differences (p < 0.05).; Table S2: Effect of incubation time and concentration on HUH-7 cell viability following exposure to M1 (2.1 µm) and M2 (0.49 µm) cPS-MPs. Data are presented as mean ± SD. Statistical analysis was performed using two-way ANOVA followed by Tukey’s multiple comparisons test, with incubation time and concentration as independent variables. Different letters indicate statistically significant differences (p < 0.05).
Author Contributions
Conceptualization, S.K., S.M. and M.D.; methodology, G.M., K.K., S.K., S.M. and M.D.; software, M.D. and S.K.; validation, S.K.; investigation, C.G., K.K. and S.M.; resources, K.K. and G.M.; data curation, S.M.; writing—original draft preparation, S.K.; writing—review and editing, K.K., S.K. and S.M.; supervision, S.M. and S.K.; visualization, C.G. and G.M.; formal analysis, C.G. and S.M. All authors have read and agreed to the published version of the manuscript.
Funding
Funding for publication was made through the coverage of National Participation under the “European Universities” Initiative, with a particular focus on EU-CONEXUS Plus: A Significant Step Forward for the European University for Smart Urban Coastal Sustainability at the ELKE of the Agricultural University of Athens—2025ΣΕ44520008.
Institutional Review Board Statement
Not applicable.
Informed Consent Statement
Not applicable.
Data Availability Statement
The original contributions presented in this study are included in the article. Further inquiries can be directed to the corresponding author.
Conflicts of Interest
Authors Maria Daoutakou and Spyros Kintzios were employed by the company Key2Core. The remaining authors declare that the research was conducted in the absence of any commercial or financial relationships that could be construed as a potential conflict of interest.
Abbreviations
The following abbreviations are used in this manuscript:
| ARE | Antioxidant Response Element |
| cPS-MP | Carboxyl-Modified Polystyrene Microplastic |
| IHH | Immortalized Human Hepatocyte |
| MP | Microplastic |
| MTT | 3-(4,5-dimethylthiazol-2-yl)-2,5-diphenyltetrazolium bromide |
| NOAEL | No-Observed-Adverse-Effect Level |
| OXPHOS | Oxidative Phosphorylation |
| PMT | Predictive Modelling Tool |
| PS-MPs | Polystyrene Microplastics |
| ROS | Reactive Oxygen Species |
References
- Daoutakou, M.; Kintzios, S. Biosensors for Micro- and Nanoplastics Detection: A Review. Chemosensors 2025, 13, 143. [Google Scholar] [CrossRef] [Scilit]
- Ge, J.; Wang, M.; Liu, P.; Zhang, Z.; Peng, J.; Guo, X. A systematic review on the aging of microplastics and the effects of typical factors in various environmental media. TrAC Trends Anal. Chem. 2023, 162, 117025. [Google Scholar] [CrossRef] [Scilit]
- Ragusa, A.; Svelato, A.; Santacroce, C.; Catalano, P.; Notarstefano, V.; Carnevali, O.; Papa, F.; Rongioletti, M.C.A.; Baiocco, F.; Draghi, S.; et al. Plasticenta: First evidence of microplastics in human placenta. Environ. Int. 2021, 146, 106274. [Google Scholar] [CrossRef] [Scilit] [PubMed]
- Cornelli, U.; Casella, C.; Belcaro, G.; Cesarone, M.R.; Marucci, S.; Rondanelli, M.; Recchia, M.; Zanoni, G. Definition of Emerging Microplastic Syndrome Based on Clinical and Epidemiological Evidence: A Narrative Review. Microplastics 2025, 4, 93. [Google Scholar] [CrossRef] [Scilit]
- Lee, S. Systemic histopathological responses to nanoplastic exposure: A review of cellular toxicity and organ-level pathology in mammalian systems. Toxicol. Mech. Methods 2026, 16, 1–15. [Google Scholar] [CrossRef] [Scilit] [PubMed]
- Fujiwara, G.H.; Salla, R.F.; Rocha, T.L.; Dos Santos, C.S.; Carvalho, C.D.S. Oxidative stress response biomarkers in gills and liver of bullfrog tadpoles semi-chronically exposed to combined microplastics and titanium dioxide nanoparticles. Ecotoxicol. 2026, 35, 128. [Google Scholar] [CrossRef] [Scilit] [PubMed]
- Zhao, S.; Guan, H.; Zhang, Z.; Li, J.; Tian, C.; Sun, X.; Han, M.; Zhang, Y.; Li, X.; Li, M. Metabolic footprint of microplastics and nanoplastics: From environmental exposure to metabolic diseases. NanoImpact 2026, 43, 100637. [Google Scholar] [CrossRef] [Scilit] [PubMed]
- Hwang, J.; Choi, D.; Han, S.; Jung, S.Y.; Choi, J.; Hong, J. Potential toxicity of polystyrene microplastic particles on the gut-microbiome-liver axis in mice. Part. Fibre Toxicol. 2020, 17, 43. [Google Scholar]
- Banerjee, A.; Billey, L.O.; McGarvey, A.M.; Shelver, W.L. Effects of polystyrene micro/nanoplastics on liver cells based on particle size, surface functionalization, concentration and exposure period. Sci. Total Environ. 2022, 836, 155621. [Google Scholar] [CrossRef] [Scilit] [PubMed]
- Asoodeh, R.; Leitch, A.; Cheng, T. Aggregation and hetero-aggregation of polystyrene microplastics: Roles of surface functionalization, water chemistry, humic acid and kaolinite colloids. J. Contam. Hydrol. 2026, 281, 104978. [Google Scholar] [CrossRef] [Scilit] [PubMed]
- Park, K.; Thi Nguyen, T.; Kwak, I.S. Size-dependent internalization of micro- and nanoplastics induces pro-inflammatory and oxidative stress responses in marine and freshwater fish cell lines. Cell Stress Chaper. 2026, 31, 100195. [Google Scholar] [CrossRef] [Scilit] [PubMed]
- Tay, Y.; Liang, J.; Yang, Y.; Ren, D.; Ma, X.; Bao, M.; Zhou, Z.; Han, M.; Li, Z.; Abdullah, A.L.B.; et al. Gill dysfunction and metabolic disruption: The size-dependent effects of microplastics on Chiromantes haematocheir. Mar. Environ. Res. 2026, 220, 108158. [Google Scholar] [CrossRef] [Scilit] [PubMed]
- Warburg, O. On the origin of cancer cells. Science 1956, 123, 309–314. [Google Scholar] [CrossRef] [Scilit] [PubMed]
- Dominiak, A.; Chełstowska, B.; Nowicka, G. Metabolic Adaptations in Cancer Progression: Optimization Strategies and Therapeutic Targets. Cancers 2025, 17, 2341. [Google Scholar] [CrossRef] [Scilit] [PubMed]
- Zhang, L.; Sui, C.; Yang, W.; Qihua, L. Amino acid transporters: Emerging roles in drug delivery for tumor-targeting therapy. Asian J. Pharm. Sci. 2020, 15, 192–206. [Google Scholar] [CrossRef] [Scilit] [PubMed]
- Rui, L. Energy Metabolism in the Liver. Compr. Physiol. 2014, 4, 177–197. [Google Scholar] [CrossRef] [Scilit]
- Green, D.R.; Galluzzi, L.; Kroemer, G. Mitochondria and the autophagy-inflammation-cell death axis in organismal aging. Science 2011, 333, 1109–1112. [Google Scholar] [CrossRef] [Scilit] [PubMed]
- Marka, S.; Zografaki, M.-E.; Tsolomiti, G.; Kalliampakou, K.I.; Tsolomitis, A.; Koumantou, C.; Smirlis, D.; Vassilaki, N.; Kintzios, S. 2-(4-Nitrophenyl)isothiazol-3(2H)-one: A Promising Selective Agent against Hepatocellular Carcinoma Cells. Pharmaceuticals 2024, 17, 673. [Google Scholar] [CrossRef] [Scilit] [PubMed]
- McNally, K.; Hogg, A.; Loizou, G. A computational workflow for probabilistic quantitative in vitro to in vivo extrapolation. Front. Pharmacol. 2018, 9, 508. [Google Scholar] [CrossRef] [Scilit] [PubMed]
- Guguen-Guillouzo, C.; Guillouzo, A. General review on in vitro hepatocyte models and their applications. Methods Mol. Biol. 2010, 640, 1–40. [Google Scholar] [CrossRef] [Scilit] [PubMed]
- Pandey, N.; Boeira, P.; Clark, N.J.; Walker, E.T.; Aroori, S.; Denson, J.; Thompson, R.C.; Cramp, M.E.; Chokshi, S.; Dhanda, A. Investigating the Impact of Carboxylated Polystyrene Nanoplastics in the Liver Using Cell Lines and Precision-Cut Liver Slices. Liver Int. 2026, 46, e70748. [Google Scholar] [CrossRef] [Scilit] [PubMed]
- Zou, H.; Qu, H.; Bian, Y.; Sun, J.; Wang, T.; Ma, Y.; Yuan, Y.; Gu, J.; Bian, J.; Liu, Z. Polystyrene Microplastics Induce Oxidative Stress in Mouse Hepatocytes in Relation to Their Size. Int. J. Mol. Sci. 2023, 24, 7382. [Google Scholar] [CrossRef] [Scilit] [PubMed]
- Greifová, H.; Jambor, T.; Tokárová, K.; Lukáč, N. In Vitro Assessment of Carboxylated Polystyrene Nanoplastics Toxicity in TM3 Leydig Cells. J. Microbiol. Biotechnol. Food Sci. 2026, 15, e14074. [Google Scholar] [CrossRef] [Scilit]
- Hajibabaie, F.; Abedpoor, N.; Mohamadynejad, P. Types of Cell Death from a Molecular Perspective. Biology 2023, 12, 1426. [Google Scholar] [CrossRef] [Scilit] [PubMed]
- Wang, S.; Wu, H.; Shi, X.; Wang, Y.; Xu, S. Polystyrene microplastics with different sizes induce the apoptosis and necroptosis in liver through the PTEN/PI3K/AKT/autophagy axis. Sci. Total Environ. 2023, 899, 165461. [Google Scholar] [CrossRef] [Scilit] [PubMed]
- Goutelle, S.; Maurin, M.; Rougier, F.; Barbaut, X.; Bourguignon, L.; Ducher, M.; Maire, P. The Hill equation: A review of its capabilities in pharmacological modelling. Fundam. Clin. Pharmacol. 2008, 22, 633–648. [Google Scholar] [CrossRef] [Scilit] [PubMed]
- Wang, D.; Hensman, J.; Kutkaite, G.; Toh, T.S.; Galhoz, A.; GDSC Screening Team; Dry, J.R.; Saez-Rodriguez, J.; Garnett, M.J.; Menden, M.P.; et al. A statistical framework for assessing pharmacological responses and biomarkers using uncertainty estimates. eLife 2020, 9, e60352. [Google Scholar] [PubMed]
- Itoh, K.; Wakabayashi, N.; Katoh, Y.; Ishii, T.; Igarashi, K.; Engel, J.D.; Yamamoto, M. Keap1 represses nuclear activation of antioxidant responsive elements by Nrf2 through binding to the amino-terminal Neh2 domain. Genes Dev. 1999, 13, 76–86. [Google Scholar] [CrossRef] [Scilit] [PubMed]
- Calabrese, E.J.; Baldwin, L.A. Defining hormesis. Hum. Exp. Toxicol. 2002, 21, 91–97. [Google Scholar] [CrossRef] [Scilit] [PubMed]
- Schwabl, P.; Köppel, S.; Königshofer, P.; Bucsics, T.; Trauner, M.; Reiberger, T.; Liebmann, B. Detection of various microplastics in human stool: A prospective case series. Ann. Intern. Med. 2019, 171, 453–457. [Google Scholar] [PubMed]
- Fu, Z.; Zheng, B.; Zhang, J.; Ruan, J.; Zheng, D. Nanoscale delivery systems for hepatocellular carcinoma: Functionalization, delivery strategies and clinical challenges. Mater. Today Bio 2026, 38, 103227. [Google Scholar] [CrossRef] [Scilit] [PubMed]

Disclaimer/Publisher’s Note: The statements, opinions and data contained in all publications are solely those of the individual author(s) and contributor(s) and not of MDPI and/or the editor(s). MDPI and/or the editor(s) disclaim responsibility for any injury to people or property resulting from any ideas, methods, instructions or products referred to in the content. |
© 2026 by the authors. Licensee MDPI, Basel, Switzerland. This article is an open access article distributed under the terms and conditions of the Creative Commons Attribution (CC BY) license.