


Abstract
Microplastics (MPs) are a growing environmental concern due to their ubiquitous presence, especially in wastewater treatment plants (WWTPs), where they are transferred and accumulated in sludge and can be reintroduced into the environment through sludge reuse. The persistence of MPs highlights the need for effective and tailored treatment strategies to enhance their removal or management. This study investigates the effects and impacts of ozonation as a pretreatment method for sludge, followed by anaerobic digestion (AD), on low-density polyethylene (LDPE), polypropylene (PP), and polyamide 66 (PA(66)) MPs. Different ozone doses, ranging from 5 to 50 gO3/gMPs, were tested in both deionized water and synthetic sludge. The study evaluated MPs degradation through mass variation measurements, Fourier Transform Infrared spectroscopy (FTIR), Differential Scanning Calorimetry (DSC), and Carbonyl Index (CI) analysis. Results showed that ozonation induced chemical modifications in MPs, increasing CI values and leading to the formation of oxygen-containing functional groups, particularly carbonyls. FTIR analysis confirmed the development of new absorption peaks at 1716 cm−1 and 1710 cm−1 for LDPE and PP, respectively, while PA(66) exhibited a shift in its carbonyl peak from 1739 cm−1 to 1754 cm−1. DSC analysis revealed a reduction in crystallinity for all tested polymers, suggesting increased structural disorder. However, no significant MPs mass reduction was observed, and AD did not further enhance MPs degradation. These findings highlight ozonation as a promising strategy for modifying MPs surface chemistry and potentially increasing their environmental degradability.
1. Introduction
Plastic pollution represents a growing global environmental concern, driven by the massive production, widespread use, and improper disposal of plastic materials. Additionally, plastics durability and resistance to degradation result in their persistence and ubiquitous presence in the environment. Plastic waste is present in all environmental compartments [1,2,3,4], where it degrades and breaks down into smaller particles, known as microplastics (MPs). MPs originated from the degradation of larger plastic debris due to several biotic and abiotic factors categorized as “secondary MPs”, while MPs intentionally manufactured at a microscopic scale for direct use or as intermediates in industrial applications (e.g., abrasive or in cosmetics) are classified as “primary MPs” [5]. However, according to ISO 24187:2023 [6] and based on their size, MPs have been defined as solid plastic particles insoluble in water with sizes ranging from 1 µm to 1 mm, while particles between 1 mm and 5 mm have been classified as “large microplastics”. Moreover, these contaminants of emerging concern (CECs) [7] have drawn attention for their potential to adsorb and transport hazardous pollutants such as heavy metals, pharmaceuticals, organics, and pathogens [8].
Wastewater treatment plants (WWTPs) are recognized as one of the main terrestrial point sources for MPs entering aquatic environments [9,10,11,12]. Despite the very high MPs removal efficiencies exerted by WWTPs, up to 99% or above [11,13,14], MPs can still be found in WWTPs effluents. Aside from this, MPs are not completely degraded but are transferred and concentrated in solid residues, coming from screenings and grit removal, and above all, sludges. The presence of MPs in sludge raises concerns about the impacts they may cause along the sewage sludge recovery and reuse routes. In fact, sludge is commonly reused in agriculture, due to its high content of nutrients [15,16], and it is thought to be a major pathway for MPs contamination in farmlands [17]. Studies have shown that soils amended with sewage sludge show higher MPs concentration compared to untreated soils [18]. Moreover, since waste sludge is also highly composed of organic matter [19], anaerobic digestion (AD) is a widely adopted sludge treatment method that reduces sludge volume, stabilizes organic matter, and produces biogas that can be used for energetic purpose [20,21]. The rate-limiting step in anaerobic sludge degradation is the hydrolysis of particulate organic matter into soluble substances [22]. To enhance AD efficiency, pretreatment methods have become standard practice, with techniques such as thermal, chemical, biological and mechanical–physical treatments aimed at improving organic matter solubilization and biodegradability [23,24,25,26,27].
Among these pretreatments, ozonation is emerging as a promising method to improve sludge biodegradability in AD. Ozone is able to oxidize organic matter, solubilizing microbial cells and making them accessible to the anaerobic microorganisms [23,28,29]. Ozonation changes both the property of sludge and the physicochemical properties of MPs [30]. Indeed, it has been shown to affect MPs surface, making it rougher, altering its functional group, and increasing adsorption capacity [31]. Despite these findings, very few studies have investigated the combined effects of ozonation and AD on different MPs types. Li et al. (2023) investigated the potential effects of ozone pretreated microfibers on anaerobic digestion [32]. Authors tested different ozone dosages, ranging from 0 to 1.5 mgO3/gTS, and three different microfibers concentration (20 mg/L, 100 mg/L, and 1000 mg/L). Lekše et al. (2023, 2024) evaluated the impact of polyethylene terephthalate, polypropylene, and polyvinyl chloride MPs in the waste sludge with and without ozone pretreatment, and analyzed the biogas and methane production [30,33]. MPs were added in different concentrations, varied from 0.1 g/L to 10 g/L. The ozonation tests were performed just for the MPs concentration of 1 g/L, using 0.059 g/min of ozone dosage, and testing at different times (10, 20, and 30 min). However, the studies conducted by Li et al. (2023) [32] and Lekše et al. (2023, 2024) [30,33] primarily focused on the potential inhibitory effects of MPs on biogas and methane production. In many cases, the tested MPs concentrations in sludge were significantly higher, up to an order of magnitude, than those typically found in real sludge samples. Additionally, from a MPs-focused perspective, the potential of ozone pretreatment combined with subsequent AD to alter the physicochemical properties of MPs represents a critical and emerging research area that requires further exploration, as these alterations may influence the safety and environmental implications of treated sludge. Considering the potential risks posed by MPs, ensuring a safer recovery of sewage sludge, is essential. Together with the previous research on the alkaline-thermal pretreatment of PET and PA (66) [34], this study aims to provide valuable insights into the effects of these two sludge pretreatments, along with subsequent AD, on some of the most relevant and common MPs in digested sludge. Understanding MPs behavior during sludge treatment processes and the impacts of different sludge pretreatments on MPs is fundamental for designing effective sludge management practices and minimizing new environmental risks through the reuse of treated sludge.
The aim of this study, therefore, is to evaluate the effects of ozonation and the following AD on MPs, particularly focusing on low-density polyethylene (LDPE), polypropylene (PP), and polyamide 66 (PA(66)), as three of the most common types of MPs present in WWTPs and more susceptible to ozone, particularly for the polyolefins (LDPE and PP). MPs were spiked in deionized water and in synthetic sludge at a concentration of 100 mg/L, testing different ozone dosages (0, 5, 10, 25, and 50 gO3/gMPs). The analyses involved the evaluation of changes in weight and chemical structure, through infrared spectroscopy, differential scanning calorimetry, and determination of the carbonyl index of the tested polymers.
2. Materials and Methods
2.1. Samples Preparation
2.1.1. Synthetic Sludge Preparation
The sludge used in this study was artificially produced in the laboratory, following a recipe outlined by Baudez et al. (2007) [35]. Major details on the sludge are reported in Supplementary Material.
To preserve their organic properties, the synthetic sludge samples were stored in glass bottles and frozen at −16 °C. Before use, the samples were thawed under controlled conditions by transferring them to a refrigerator maintained at 4 °C for 24 h.
2.1.2. LDPE, PP, and PA(66) MPs
MPs used in this study were obtained by mechanical fragmentation of larger plastic materials, following a protocol similar to the one published by Ducoli et al. (2022) [36]. Specifically, LDPE was sourced from shopping bags, PP from a transparent sheet, and PA(66) from a t-shirt. To facilitate the breakdown of MPs with a wide range of sizes, ensuring a homogeneous granulometric distribution between 1 and 5000 µm, the raw materials were manually cut into smaller pieces of approximately 5 mm using steel scissors. Then the plastic pieces were placed in a polypropylene container, where liquid nitrogen was poured onto them, at around −196 °C, to increase their brittleness. After 30 min, the plastics particles were quickly transferred inside a mixer mill (MM 400, RETSCH) or an ultracentrifugal mill (ZM 200, RETSCH), depending on plastic type. Further details on the two different fragmentation approaches used for MPs production are provided by Ducoli et al. (2025) [37]. Liquid nitrogen was employed to decrease the MPs temperature, increasing their brittleness, and preventing thermal degradation during fragmentation. Then, MPs fragments were sorted according to their size, using a tower of stainless steel sieves with different mesh sizes, obtaining the following size classes: 63–125 µm, 125–212 µm, 212–500 µm, 500–1000 µm, 1000–2000 µm, and 2000–5000 µm. After sieving, the MPs were recovered from the sieve and placed in glass vials. Two different type of MPs samples were prepared, using an analytical balance with precision scale of 0.0001 g (ENTRIS 224i-1S, Sartorius, Germany), as follows:
Mixed MPs samples composed of LDPE, PP, and PA(66) MPs, with a size range of 63–5000 µm. For each polymer, approximately 5.5 mg from each size class were added, resulting in a total of approximately 100 mg of MPs per sample. These mixed samples were used for ozonation batch tests in both deionized water (labeled with the prefix “W”) and synthetic sludge (labeled with the prefix “S” and “AD”).
Single-polymer samples composed of approximately 100 mg of MPs from a single polymer type (either LDPE, PP, or PA(66)) within the 212–500 µm size range. These samples were used for ozonation batch tests and blank tests in deionized water and were labeled with a prefix indicating the polymer type (“LDPE”, “PP” or “PA(66)”).
The compositions of these MPs samples are detailed in Tables S1–S3.
2.2. Experimental Design
The experimental activity comprised three different steps: (i) ozone pretreatment of MPs added in deionized water, (ii) ozonation of MPs added in synthetic sludge, (iii) ozonation followed by AD of MPs added in synthetic sludge. For step (i) the tests were performed both for mixed MPs and single-polymer samples, while for step (ii) and (iii) just the mixed MPs samples were tested, to better simulate real environmental conditions, where a variety of MPs types usually coexist, reflecting a more complex scenario. Two different matrices were examined: deionized water and synthetic sludge. The samples were performed in duplicate, except for the before treatment sample (BFT), resulting in a total of 41 different samples. Their volumes are detailed in Table 1. MPs were added to the samples as described in Section 2.1.2. Four different target O3 dosages were considered for the step (i): 5, 10, 25, and 50 gO3/gMPs. Based on the results from the tests on the aqueous matrix, which were faster and required only filtration through a 10 µm stainless steel filter without the need for MPs extraction, only the two highest O3 dosages (25 and 50 gO3/gMPs) were carried forward to the second step in synthetic sludge. Finally, for step (iii), just the O3 dose of 50 gO3/gMPs was used, and the MPs were added both before and after ozonation to evaluate whether their presence and physicochemical characteristics were influenced by the AD process. By comparing the results of AD samples containing ozonated MPs (AD1 and AD1_II) and non-ozonated MPs (AD2 and AD2_II) under identical conditions, it was possible to determine whether observed effects were attributed to the sole AD or to ozone pretreatment. After performing the O3 pretreatment of the four samples, AD was carried out before proceeding with the MPs extraction.
Table 1.
Experimental design.
The experimental design is summarized in Table 1.
2.3. Lab Scale Sludge (Pre)Treatment
2.3.1. Ozonation Pretreatment Procedure
Ozonation batch tests were carried out in the Laboratory of Environmental Biology and Chemistry of S.I.A.D. S.p.A. (Società Italiana Acetilene e Derivati), in the Osio Sopra establishment (Bergamo, Italy). MPs samples were added and mixed with 1 L of deionized water or 1 L of synthetic sludge and placed in a 2 L glass column (Helios Italquartz, height = 0.7 m, external/internal diameter = 6.5/6.0 cm), equipped with an inlet port at the bottom and a porous septum for a continuous supply of O2/O3 mixture at a predetermined and constant rate (2 L/min) measured by liters counter Zeal-DM3C. The upper part of the column was covered with a glass lid to avoid the loss of MPs that might be entrapped in the upward gas flow. Ozone was generated from pure oxygen by an ozone generator (Wedeco 8HC) with maximal production of 8 gO3/h at 7% by weight. During tests the concentration of O2/O3 mixture was regulated on values of around 4.0–6.7% by weight. The ozone dosage was determined by measuring ozone concentrations in the feed and vent gas streams using two different online analyzers: PCI Ozone Monitor Instrument HC-400 (for supplied gas) and BMT 964 OG (for off-gas). After ozonation, the samples were recovered and stored in glass bottles. The glass column was rinsed twice with about 20 mL of deionized water to recover the MPs that remained attached to it and the water was recovered together with the sample. Different O3 doses were obtained by changing the contact time, in the range of 5–50 min, in order to investigate the relation between O3 doses and their effects on MPs. Ozone was dosed with respect to the mass of MPs, regardless of the matrix type and its O3 consumption and transfer rate. It is worth noting that in the preliminary ozonation tests on rough synthetic sludge (test in a 7-L glass column, external/internal diameter 8.0/7.5 cm, height 1.5 m), a dosage of 104 gO3/kgVS was applied, with 1 L/min of gas flow rate at 4.14% by weight for 19 min. This resulted in an average O3 transfer rate to the sludge matrix of 88% (net ozone dosage of 92 gO3/kgVS and 56 gO3/kgTS). Therefore, most of the ozone was consumed by the synthetic sludge. For this reason, in subsequent tests, ozone was dosed in excess relative to the matrix demand to ensure ozone availability for MPs. This approach resulted in mean O3 transfer rates to the matrices of less than 10% (<4% for tests in deionized water and <8.5% for tests in synthetic sludge). Total ozone dosage tested varied from 5 to 50 gO3/gMPs, corresponding to a net ozone dosage of 0.08–3.1 gO3/gMPs. In the tests with synthetic sludge the ozone dosage respect to TS content varied from 355 to 844 gO3/kgTS, corresponding to a net dosage of 25–41 gO3/kgTS. All tested net dosages can be considered comparable to those typically applied in published studies and real WWTPs, which range from 15 to 500 gO3/kgTS for sewage sludge pretreatment [23,38,39,40].
Gas flow rate, O3 content in the gas, average O3 transfer rate in the matrix, and O3 dosage per each sample, are reported in Table S4.
Blank tests in deionized water (LDPE1, LDPE1_II, PP1, PP1_II, PA(66)1 and PA(66)1_II) were performed by insufflating N2 at a rate of 2 L/min for around 15–30 min.
2.3.2. Batch Anaerobic Digestion Procedure
Batch AD of ozonated synthetic sludge samples, with both ozonated and non-ozonated MPs, was carried out in closed, fully mixed systems using magnetic stirrers to perform Biochemical Methane Potential (BMP) tests, which measures the maximum methane volume producible from a substrate under optimal conditions [41]. The magnetic stirrers featured a central ring to minimize contact with the reactor bottom. BMP tests were performed in 1 L reactors, adding granular inoculum, trace elements, synthetic sludge, and tap water to achieve a final working volume of approximately 225 mL. An inoculum-to-substrate ratio of 2 gVSI/gVSS was used, and the initial pH was adjusted to 7.6–7.8 dosing appropriate volume of NaOH (3 M) solution. Details of the added volumes and the initial and final pH values for samples AD1, AD1_II, AD2, and AD2_II are provided in Table S5. To establish anaerobic conditions, nitrogen gas was purged into the reactors for 15 min. The reactors were maintained in mesophilic conditions (36 ± 0.2 °C) and stirred at 100 rpm for 30 days. Batch tests were conducted in duplicate and blanks containing only granular inoculum, trace elements and tap water were prepared to deduct the gas generated from the inoculum [23]. Measuring the total solids (TS) and volatile solids (VS) of the sludge after AD was not feasible, as MPs loss would hinder accurate evaluation of mass changes.
2.4. Extraction of MPs
After the ozonation of the synthetic sludge (step ii) and AD (step iii), the samples were recovered into a clean 1 L beaker. To ensure complete recovery of MPs, the bottles used to collect samples after ozone pretreatment and AD were rinsed multiple times with ethanol (EtOH, 50% w/w), using a glass syringe and scraping the bottle walls with a stainless-steel spatula. The MPs extraction procedure was then started, following a modified enzymatic–oxidative multistep protocol based on [42,43]. The primary goal of the MPs extraction method is to remove organic and inorganic materials from the initial matrix, making the samples sufficiently clear for analysis and ensuring the isolation and proper characterization of the MPs. To remove cellulose, proteins, and other organic substances, samples were first pre-oxidized by adding hydrogen peroxide (H2O2, 35% w/w), twice a day for six days or until no bubbles or foam formation was observed. The samples were then filtered using a stainless-steel filter (Ø = 47 mm and 10 µm mesh). The particles retained on the filter were then transferred to the original beaker and detached by 5 min sonication in 250 mL of sodium dodecyl sulfate solution (SDS, 5% w/w), followed by incubation in a water bath at 50 °C with agitation at 115 rpm for at least 24 h. All subsequent filtrations were performed using the same 10 µm stainless steel filter to prevent MPs loss or external contamination. The recovery and detachment of MPs retained on the filters were always carried out through a 5 min sonication treatment, using stainless steel tweezers and spatulas.
After the SDS treatment, all samples were filtered and subjected to two enzymatic treatments. The MPs retained on the 10 µm stainless steel filter were recovered in 250 mL of tris buffer solution (pH 8.2), and 0.5 mL of protease (Protease from Bacillus sp.®, Sigma-Aldrich) were added. After incubation in a water bath at 50 °C with agitation at 115 rpm for at least 40 h at, the samples were filtered and underwent the second enzymatic treatment. For this, 1 mL of cellulase blend (prepared by mixing 9.5 mL of Cellulase from Aspergillus sp. (Sigma-Aldrich) with 1 g of Xylanase powder (BakeZyme® HS 10.000 BG, ©DSM Food Specialties B.V.) and 0.5 mL of cellulolytic enzyme mixture (Viscozyme® L, Sigma-Aldrich) were added to 250 mL of acetate buffer (pH 4.8). Following incubation at 50 °C and 100 rpm for at least 40 h, the samples were filtered and recovered in 138 mL of deionized water. Subsequently a catalytic oxidation (Fenton reaction) was performed by adding 207 mL of H2O2 (35% w/w), 65 mL of 0.1 M NaOH solution, and 62 mL of 0.1 M ferrous sulfate (FeSO4) solution. The temperature during this exothermic reaction was kept between 25 and 30 °C, by immersing the samples in an ice bath when necessary. After 4–5 h from the start of the reaction, the reaction rate stabilized, and the samples were left under the hood, at room temperature, to react overnight. Following Fenton oxidation, the samples were filtered and prepared for the inorganic material removal step via density separation. MPs were transferred to approximately 150 mL of zinc chloride (ZnCl2) solution (density: 1.40–1.70 g/cm3). The mixture was mixed by insuffling compressed air in a separatory funnel for 15 min, to detach aggregates, and then left to settle for 24 h. Sediment was discharged every 2 h and replaced with more ZnCl2 until no sediment remained. Approximately half the volume was discharged, while the rest, containing floating MPs, was rinsed with 1 L of deionized water to remove ZnCl2 residues. MPs were collected, transferred to 600 mL of deionized water, incubated at 50 °C and 100 rpm overnight. Finally, the sample was filtered and rinsed with 50 mL of EtOH (50% w/w), before transferring it into a small glass bottle (volume = 100 mL), ready for physicochemical analyses.
2.5. Analytical Methods
2.5.1. Microplastic Analysis with µFTIR Spectroscopy
MPs were analyzed using Fourier Transform Infrared Micro-Spectroscopy (µFTIR) to determine their chemical composition. Following the MPs extraction procedure, the concentrated samples in small glass bottles were homogenized. A specific filtration protocol, described in detail in Supplementary Material, was adopted to ensure uniform distribution of MPs across the entire active area of the filter. This approach prevented MPs overlap, facilitating a more accurate analysis of the MPs and improving the match between their spectra and reference spectra. The filters used in this analysis were the Anodisc inorganic membrane filters (Ø = 47 mm and pore size = 0.2 µm, Whatman®). After filtration, the Anodisc filter was dried on a hot plate at 50 °C for at least one hour. The sample and the deposited MPs were analyzed using a Nicolet iN10MX Microscope (Thermo Scientific, USA) equipped with a cooled Mercury Cadmium Telluride (MCT) detector. Each µFTIR spectrum was collected in transmission mode at a spectral resolution of 8 cm−1, within the range of 4000–675 cm−1, with a collection time of 12 s for each measurement (64 scans). All spectral manipulations were carried out using the OMNIC™ Specta™ (version 2.2) software (Thermo Scientific, Waltham, MA, USA). Knowing the chemical composition of the MPs added to the samples, only spectra corresponding to polymer types similar to the starting materials (LDPE, PP, and PA(66)) were retained, while all other spectra were considered external contaminants and discarded.
2.5.2. Physical Characterization of MPs with Stereomicroscope
Visual analysis of single-polymer MPs samples was performed using a stereomicroscope (ZEISS, Stemi 2000-C) equipped with an OPTIKAM Pro5 4083.12 LT (OPTIKA) camera and Optica Pro View (version x64, 2020) software. The mass of MPs added to deionized water (step i), both mixed MPs and single-polymer samples, was determined using an analytical balance with precision scale of 0.0001 g (ENTRIS 224i-1S, Sartorius, Germany), both before their addition to the sample and after ozone pretreatment.
2.5.3. Carbonyl Index Calculation
The degradation status of the tested MPs (LDPE, PP and PA(66)) was evaluated by calculating the Carbonyl Index (CI), a parameter that quantifies changes in the FTIR spectrum by analyzing the specific absorption band of carbonyl groups, which are predominantly formed during oxidation. This characteristic band is located in the range of 1850–1650 cm−1. Utilizing the Specified Area Under Band (SAUB) methodology [44], the CI was determined as the ratio between the integrated absorbance band of the carbonyl peak (C=O bond) from 1850 to 1650 cm−1 and that of the methylene (CH2 bond) scissoring peak in the range of 1500–1420 cm−1, according to the following equation:
For each polymer and sample analyzed, an average spectrum was generated from a minimum of 25 spectra. The resulting average spectra were uploaded into the SpectraGryph 1.2.16.1 software, where the integrated areas under the specified bands were then calculated using the peak analysis tool.
2.5.4. Differential Scanning Calorimetry Analysis
Differential Scanning Calorimetry (DSC) analysis was performed in single, only on single-polymer samples, after ozone pretreatment in deionized water (step i), as this analysis was not feasible for mixed MPs samples. DSC analysis was used to determine whether ozonation altered the samples crystallinity content. DSC curves were collected using a Mettler-Toledo DSC 823e instrument (Mettler-Toledo, Columbus, OH, USA). Approximately 5–12 mg samples were analyzed under a nitrogen flux. The heating rate was set at 10 °C/min, and the heating range varied depending on the polymer: LDPE and PP were heated from 25 °C to 250 °C, while PA(66) was heated from 25 °C to 300 °C. The heat exchanged during the thermal scan of the MPs samples was recorded as a function of temperature. For each sample, an endothermal peak was observed corresponding to the melting point, where the absorbed heat is used for melting the crystal fraction of the polymer. The enthalpy of melting () and the degree of crystallinity of the polymers () [45] were calculated according to the following equations:
where is the theoretical enthalpy of melting for an ideal 100% crystalline polymer [46].
MPs mass of the samples analyzed with DSC and values for each sample were reported in Table S6.
2.5.5. Characterization of Sludge and Inoculum
TS and VS were determined according to Standard Method 2540 [47]. pH was measured using a multi-probe meter. TS, VS, and pH were determined at least three times. The physicochemical characteristics of the synthetic sludge and inoculum are summarized in Table S7.
2.6. Quality Control and Analysis of Contamination
Rigorous precautions were taken to minimize contamination during MPs analysis. Glassware and stainless-steel materials were used, whenever possible, except for the density separation step, which required silicone tubes and polytetrafluoroethylene (PTFE) stopcocks. The filters were sonicated in deionized water for 20 min to remove any ash content and thoroughly flushed with deionized water for three times. The filter used for the initial treatment was maintained throughout the extraction process and stored in deionized water in a clean 150 mL beaker. Before each use, all equipment was rinsed with deionized water three times, and all the liquid reagents (excluding enzymes) were filtered through 0.7 μm glass fiber filters (Whatman). Sample preparation was conducted in a fume hood, wearing cotton lab coats. All samples were systematically covered with aluminum foils to prevent external contamination. Blank samples and specific recovery tests were not conducted, as the laboratory-prepared samples contained known quantities of LDPE, PP and PA(66) MPs, which were consistently recovered after the extraction protocol.
2.7. Statistical Analysis
RStudio (version 2023.06.0) software was used to perform Principal Component Analysis (PCA) and One-Way Analysis of Variance (ANOVA), at a significant level of 0.05. Data normality was assessed using the Shapiro–Wilk test. PCA was conducted using an average spectrum for each sample, calculated from at least 25 raw spectra, with baseline correction applied. The specific spectral region used for PCA varied (generally considering the entire spectrum) and was specified in the figure captions in Section 3.2.
3. Results and Discussion
3.1. Changes in MPs Mass After the Ozone Pretreatment Process
3.1.1. Effect on Mixed MPs Samples
Figure 1 shows the MPs mass removal for mixed MPs samples after ozonation in deionized water and synthetic sludge. Negligible mass removal was observed after the treatment (average MPs mass removal: −1.2 ± 10.8%, considering all the samples shown in Figure 1), and no increase in removal efficiency was observed with higher ozone doses. All weight measurements of MPs before and after treatment, and the corresponding MPs removal efficiencies, are reported in Table S8. When analyzing samples in deionized water, two opposing trends emerged. For samples W1–W4, an initial increase in MPs weight was observed, which was correlated with increasing ozone doses (weight increase of 6.1% at 5 gO3/gMPs (W1) and 10.8% at 10 gO3/gMPs (W2)). This was followed by a reduction in weight, resulting in enhanced MPs removal rates (removal of 3.6% at 25 gO3/gMPs (W3) and 4.6% at 50 gO3/gMPs (W4)). In contrast, for samples W1_II–W4_II, MPs removal decreased with increasing ozone doses, ranging from 5.6% (W1_II) to −3.4% (W4_II). Thus, no clear trend was established, and in several cases, an increase in sample weight was observed post-treatment (W1, W2, W4_II, S2, S1_II, and S2_II). This was particularly evident in synthetic sludge samples, where, considering all four samples (S1, S2, S1_II, and S2_II), an average weight increase of 4.3 ± 18.0% was recorded. The only exception was sample S1, which exhibited a MPs removal of 15.4%. Given this isolated result, it is likely influenced by material loss during ozonation and MPs extraction processes. Specifically, during ozonation of sludge samples in the glass column, an intense foaming was observed, with the foam height more than doubling, nearly reaching the gas outlet at the top of the column. Although the foam dissipated after ozonation, many MPs were found stuck to the inner walls of the glass column. Despite rinsing the column with deionized water to recover the samples, some MPs may have been lost or remained trapped in the porous membrane used for ozone injection. Additionally, it is important to emphasize that extracting MPs from matrixes rich in organic and inorganic content, such as sludge, is highly challenging [48,49,50,51]. The difficulty arises from the need for multiple treatment steps to significantly reduce organic and inorganic interferents, thereby enabling a more effective separation and a more reliable subsequent analysis of MPs through spectroscopic methods [42,43,51,52]. Nevertheless, despite the extraction protocol employed, complete removal of organic and inorganic matter was not achieved. Small residual materials may remain adhered to the MPs or trapped within cracks and cavities formed on their surfaces due to ozonation process [53,54]. Finally, it should be noted that for AD samples, it was not possible to measure MPs weight after ozone treatment. This was because MPs extraction from pretreated sludge was not feasible for subsequent weighing. As detailed in Section 2.3.2, the substrate containing MPs is required for BMP tests. Furthermore, MPs weight after AD could not be determined, as the ozonated substrate containing MPs was homogenized and sampled from the entire liter of ozonated synthetic sludge and MPs, without the possibility to determine the exact weight of MPs added to AD process.
Figure 1.
MPs mass removal following ozone treatment in deionized water (W1, W2, W3, W4, W1_II, W2_II, W3_II, and W4_II) and synthetic sludge (S1, S2, S1_II and S2_II), at different ozone doses.
3.1.2. Effect on Single-Polymer Samples
Figure 2 shows the average MPs mass removal for the tests involving single-polymers ozonation, in deionized water. Regardless of the applied ozone dose, the average MPs mass loss was −2.0 ± 1.3% for LDPE MPs and −2.5 ± 2.8% for PP MPs and 0.85 ± 1.9% for PA(66) MPs. Additionally, no notable MPs mass removal was observed as a function of ozone dose. Detailed weight measurements of MPs before and after treatment, along with the corresponding mass removal efficiencies, are provided in Table S9. The highest MPs mass removal (3.2%) was observed for PA(66) MPs at the maximum ozone dose (50 gO3/gMPs). PA(66) was the only polymer to exhibit a slight removal following ozonation, except for the PA(66)2 sample (ozone dose: 5 gO3/gMPs), which showed a weight increase of 1.3%. In contrast, for LDPE and PP MPs, a slight weight increase was observed across all samples, without any discernible trend. This phenomenon may be attributed to the formation of new oxygen-containing functional groups as a result of ozonation [54,55,56,57], as well as the presence of hygroscopic water that was not completely evaporated as a consequence of the increased hydrophilicity of polymer samples after ozonation [58]. Although MPs samples were dried for 48 h at 45 °C and subsequently weighed again after an additional 24 h, without weight variation observed, the second hypothesis cannot be excluded. To further investigate, the MPs were analyzed under a stereomicroscope to assess potential structural changes or surface modifications. However, visual inspection at magnifications of up to 50 times did not reveal any structural changes or surface alterations resulting from ozone exposure. The only notable observation was pronounced discoloration, visible even to the naked eye, particularly for LDPE MPs, which changed from a deep yellow to a pale straw-yellow color, as shown in Figure S1. Similar discoloration effects induced by ozone have been reported by Pattanateeradetch et al. (2025) [53]. Furthermore, the slight MPs removal observed exclusively for PA(66) MPs might also be attributed to MPs losses during the recovery of the samples from the glass column after the ozonation tests, as discussed in Section 3.1.1. Specifically, this issue was not related to the adhesion caused by the sludge foam, but rather to the density of PA(66), which is higher than that of deionized water. This higher density likely facilitated the entrapment of MPs in the porous membrane at the bottom of the column.
Figure 2.
MPs mass removal following ozone treatment, at different ozone doses. Single-polymer MPs were added before treatment in deionized water.
3.2. Changes in MPs Chemical Spectrum
3.2.1. LDPE Particles
Figure 3a shows the PCA of mixed MPs samples, centered on the untreated LDPE MPs sample (labeled as BFT), considering the entire spectral region (4000–1200 cm−1). Together, the first two principal components (PC1 and PC2) explained approximately 84.0% of the total variance. Specifically, PC1 accounted for 54.2% of the total variance and is associated with nearly all wavelengths within the analyzed spectral region. Conversely, PC2 explained the remaining 29.8% of the total variance and is primarily correlated with the initial portion of the chemical spectrum between 2200 and 1200 cm−1, specifically the absorption bands at 1500–1410 cm−1 and 1750–1700 cm−1, which are related to the methylene bending vibration and carbonyl bond stretching vibration (carboxylic acid and ketone functional groups), respectively [53,54,55,56,59,60]. The spectral bands associated with PC1 and PC2 are visually highlighted in Figure S2. Additionally, observing Figure 3a, three distinct clusters can be clearly identified, corresponding to the investigated matrixes and the applied treatments (ozonation and AD). Specifically, examining the PC2 values shown on the y-axis, it is evident that lower PC2 values (<−10) were obtained for AD samples, with more negative values observed for MPs samples non-ozonated (AD2 and AD2_II), which were added as-is to ozonated sludge (ozone dose of 50 gO3/gMPs) before the AD process. These samples exhibited values below −35, compared to −13.5 and −31.8 for AD1 and AD1_II, respectively, where MPs were ozonated alongside synthetic sludge (ozone dose of 50 gO3/gMPs) before AD. In contrast, MPs treated only with ozone exhibited PC2 values ranging between 3.2 and −6.5, regardless of the tested matrix. Examining PC1 values reveals clustering based on the tested matrix for samples subjected exclusively to ozonation. Specifically, samples in synthetic sludge (S1, S2, S1_II, and S2_II) showed PC1 values exceeding 24.2, unlike samples in deionized water, which displayed PC1 values between −24.8 and 6.4. However, no specific trends related to the tested ozone doses were observed from the PCA analysis of the entire spectrum. However, repeating the PCA analysis for the spectral region 1850–1420 cm−1, the same used to calculate the carbonyl index and containing key bands associated with carbonyl stretching vibration, and focusing on new PC1 and PC3 (explaining 59.1% and 9.2% of the total variance, respectively), it was observed that increasing ozone doses corresponded to increasingly negative PC3 values compared to BFT sample (Figure S3). In this case, the PC1 was related to the spectral bands at 1695–1420 cm−1 and 1750–1720 cm−1, while PC3 to the wavenumbers between 1720 and 1695 cm−1 (Figure S4). However, exceptions and anomalous behaviors were noted, particularly for MPs samples in deionized water at the lowest concentrations (W1 and W2_II). Additionally, no significant differences were observed among AD samples, which displayed similar PC1 and PC3 values. The presence of synthetic sludge and other polymer particles (PP and PA(66) MPs) in the samples may have led to competitive interactions with the ozone injected into the system, thereby reducing the effective amount of ozone available for the LDPE particles and, consequently, its degradative effect. For this reason, PCA was also performed on individual polymer samples added to deionized water (LDPE1–LDPE4 and LDPE1_II–LDPE4_II). The results, reported in Figure 3b, clearly demonstrate that as the tested ozone dose increases, PC3 decreases significantly. PC3 for single-polymer samples explained the spectral region between 1800–1755 cm−1 and 1730–1680 cm−1, as visually reported in Figure S4.
Figure 3.
PCA results for LDPE MPs spectra, considering (a) mixed MPs samples and (b) single-polymer samples, centered on the untreated samples. The considered spectral region is 4000–1200 cm−1. Green, light blue, yellow, and orange colors represent different ozone doses. Red points represent untreated samples (BFT, LDPE1 and LDPE1_II). Different shapes of the indicators means different typology of matrix and treatment. Analysis of chemical spectrum of LDPE MPs at different ozone doses, revealed the formation of a new peak around 1715 cm−1, considering (c) mixed MPs samples and (d) single-polymer samples.
Spectral analysis revealed the formation of a new peak around 1715 cm−1, consistent with other studies in the literature, which have reported a new peak around 1720–1710 cm−1 after ozone treatment [54,60,61]. Additionally, an increase in peak intensity with higher ozone dosages has been observed both in this study (Figure 3c,d) and in previous research [54,56]. Nevertheless, a peak around 1740 cm−1 was already present in the untreated polymer, suggesting that some oxidative degradation had occurred prior to ozonation. Since samples were only analyzed after MPs fragmentation, it is unclear whether this degradation occurred during the manufacturing of the LDPE plastic bags or afterward, potentially due to environmental exposure to abiotic stressors such as UV light or heat [62,63]. Additionally, the shear forces and heat generated during MPs fragmentation may have contributed to polymer degradation [64].
3.2.2. PP Particles
Figure S6 shows the PCA of PP MPs, considering solely mixed MPs samples and analyzing the entire spectral region (4000–1200 cm−1). Although PC1 and PC2 explained approximately 75% of the total variance, no distinct clusters were observed. However, some patterns similar to those identified for LDPE MPs (Section 3.2.1) can be discerned, though with some exceptions. Specifically, PC2 distinguished the samples based on treatment: samples subjected to AD exhibited negative PC2 values, while ozone-treated samples, regardless of the matrix tested, showed positive PC2 values. The only exceptions were W3_II and W4_II, which showed PC2 values of −7.9 and −33.3, respectively. When focusing exclusively on the ozone-treated samples (W1–W4, W1_II–W4_II, S1, S2, S1_II, and S2_II), PC1 highlighted differences based on the tested matrix. MPs added to synthetic sludge generally exhibited higher PC1 values compared to those in deionized water. Notable exceptions included samples S1, W2_II, and W4_II. As shown in Figure S7, the spectral region between 1770 and 1690 cm−1, corresponding to the carbonyl region, was primarily represented by PC1, PC3, and PC6. Plotting PC3 against PC6 (which together explain approximately 75% of the total variance in the 1770–1690 cm−1 range) revealed clearer clustering patterns based on the different matrices, treatments, and ozone dosages tested. For instance, PC3 values ranged from 0.0 (BFT) to −13.7 (W2) for MPs in deionized water, while MPs added to synthetic sludge exhibited more negative values, ranging from −14.0 (S1_II) to −30.7 (S2). PC6 further highlighted dose-dependent clustering: in deionized water samples (W1–W4 and W1_II–W4_II), negative PC6 values were observed for samples treated with the lowest ozone dose (5 gO3/gMPs), while higher doses yielded increasingly positive PC6 values. The only exception was W4, which showed a PC6 value of 4.8, lower than W3 and W3_II, despite having an ozone dose of 50 gO3/gMPs. A similar trend of increasing PC6 values with higher ozone doses was observed for synthetic sludge samples (S1, S1_II > S2, S2_II). For AD samples, non-ozonated MPs (AD2 and AD2_II) showed lower PC6 values compared to their ozonated counterparts (AD1 and AD1_II). As with LDPE MPs, a more precise evaluation of the impact of ozone dosage was conducted on single-polymer PP MPs in deionized water (PP1–PP4 and PP1_II–PP4_II) to eliminate competitive effects arising from the presence of organic matter or other polymers. The PCA results, shown in Figure 4b, revealed clear clustering based on ozone dosage. Compared to untreated MPs (PP1 and PP1_II), ozonated samples exhibited a consistent increase in both PC1 and PC2 values as the ozone dose increases. In this case, PC1 and PC2 explained approximately 85% of the total variance. The spectral regions associated with these two PCs are shown in Figure S8.
Figure 4.
PCA results for PP MPs spectra, considering (a) mixed MPs samples and (b) single-polymer samples, centered on the untreated samples. The considered spectral region is 4000–1200 cm−1. Green, light blue, yellow, and orange colors represent different ozone doses. Red points represent untreated samples (BFT, PP1, and PP1_II). Different shapes of the indicators means different typology of matrix and treatment. Analysis of chemical spectrum of PP MPs at different ozone doses, revealed the formation of a new peak around 1710 cm−1, considering (c) mixed MPs samples and (d) single-polymer samples.
Finally, spectral analysis of PP MPs under different O3 and AD conditions revealed the formation of a new peak around 1710 cm−1 (Figure 4c,d), consistent with previous findings in the studies of Lekše et al. (2024) [30] and Gomes de Aragão Belé et al. (2021) [60]. This peak corresponds to carbonyl stretching vibrations, suggesting the presence of carboxylic acid, ester and aldehyde or ketone functional groups [30,65], and was absent in the untreated PP MPs (BFT, PP1, and PP1_II), increasing in intensity with higher ozone dosages tested.
3.2.3. PA(66) Particles
Figure 5a shows the PCA of the PA(66) MPs from mixed MPs samples, covering the entire spectral range (4000–1200 cm−1). Together, PC1 and PC2 explained 88.2% of the total observed variance. Notably, PC2, closely associated with the absorption bands corresponding to carbonyl bond stretching vibrations (1770–1730 cm−1) [32], as highlighted in Figure S9, indicated that the AD tests produced values closer to those of the untreated sample (BFT), ranging from 0.5 to −11.9. In contrast, samples in deionized water returned much more negative PC2 values, ranging from −19.1 to −35.2. It should be noted that for the ozonation tests on synthetic sludge (S1, S2, S1_II, and S2_II), sufficient PA(66) MPs were not extracted to generate an average spectrum, preventing the PCA analysis for these samples. This, as previously reported in Section 3.1.1, may be due to the sedimentation of these polyamide particles at the bottom of the glass column, which were not recovered after ozonation. Moreover, this could be due to the use of a ZnCl2 solution with a density of 1.40 g/cm3 during the density separation phase of the extraction protocol, which prevented the PA(66) particles from remaining in suspension, causing them to be discarded with the sediment. Additionally, no trends related to the tested ozone dosage were observed in the PCA conducted on the entire spectrum, even when considering the single-polymer samples in deionized water (PA(66)1–PA(66)4 and PA(66)1_II–PA(66)4_II). However, by repeating the analysis focusing on the spectral range used for the calculation of the carbonyl index (1850–1420 cm−1), it emerged that the PC2 value decreased as the ozone dosage increased (Figure 5b). In this specific case, PC2 explained 16.9% of the total variance and is representative of the spectral regions 1775–1715 cm−1 (Figure S10). Finally, analyzing the spectra of PA(66) MPs (Figure 4c,d), it can be observed that, unlike LDPE and PP particles, a peak in the carbonyl stretching region was present in all samples, including untreated ones (BFT, PA(66)1, and PA(66)1_II). However, it is evident that the peak around 1740 cm−1 shifted towards longer wavelengths as the ozone dosage increased, reaching a maximum absorbance value around 1755 cm−1 for higher ozone dosages (25 and 50 gO3/gMPs).
Figure 5.
(a) PCA results for PA(66) MPs spectra, considering mixed MPs samples and the whole spectral region (4000–1200 cm−1). (b) PCA results for PA(66) MPs spectra, considering single-polymer samples and the spectral region 1850–1420 cm−1. For both (a) and (b), green, light blue, yellow, and orange colors represent different ozone doses. Red points represent untreated sample (BFT, PP1, and PP1_II). Different shapes of the indicators means different typology of matrix and treatment. Analysis of chemical spectrum of PA(66) MPs at different ozone doses, revealed a shift in the carbonyl peak from 1740 cm−1 to 1755 cm−1, considering (c) mixed MPs samples and (d) single-polymer samples.
3.3. Carbonyl Index Analysis
The oxidative degradation of polymers resulting from the applied treatments, particularly ozonation, was evaluated by calculating the carbonyl index (CI). The results are reported in Figure 6, categorized by the three different structures analyzed.
Figure 6.
Average CI values, calculated from the two replicates of each tested condition, for (a) LDPE, (b) PP, and (c) PA(66) MPs. The vertical bars represent the standard deviation. The legend, located at the bottom right, applies to all three polymers.
Figure 6a shows the CI values calculated for LDPE MPs. For both types of samples (mixed MPs and single-polymer MPs), an increase in CI was observed compared to the untreated particles (BFT and LDPE1), with higher increases corresponding to higher ozone doses tested. The only exception was the W4 sample, which showed a CI value 24 ± 30% lower than the previous W3 sample, despite receiving a double ozone dose. However, this observation was not observed for single-polymer added samples. For these, the CI increased by 32 ± 6%, 93 ± 17%, and 156 ± 6%, compared to the untreated sample, for the ozone doses of 5, 25, and 50 gO3/gMPs, respectively. The same trend was observed for MPs added to synthetic sludge (S1 and S2), with an average increase of 26 ± 29% in CI. Regarding the anaerobic digestion tests (AD1 and AD2), an opposite trend was noted: the AD2 sample, which consisted of non-ozonated particles subjected only to AD, exhibited a CI value 2.5 times higher than the AD1 sample, which underwent ozonation prior to anaerobic digestion. However, the AD1 sample showed a higher average CI than the S2 sample, suggesting that anaerobic digestion could also have a degradative effect on LDPE MPs. This finding, however, is not supported by existing literature and requires further investigation for confirmation. Although an increase in CI following ozonation appears evident, this effect was not statistically significant (p-value = 0.060).
Regarding the PP MPs, CI values are shown in Figure 6b. As observed with the LDPE MPs, a general increase in the average CI value was observed for PP MPs as ozone dose increased. Specifically, for mixed MPs samples in deionized water, CI increased by 49.9 ± 0.1%, 106 ± 63%, 143 ± 62%, and 146 ± 62% post-ozonation with doses of 5, 10, 25, and 50 gO3/gMPs, respectively. The CI value at the highest dose was similar to that of the W3 sample (ozone dose: 25 gO3/gMPs). The CI variations for single-polymer samples clearly demonstrated the degradative effect of ozone on PP MPs, which increased proportionally with the ozone dose applied (14 ± 9% at 5 gO3/gMPs, 88 ± 34% at 25 gO3/gMPs, and 194 ± 24% at 50 gO3/gMPs). Moreover, ANOVA confirmed that the ozone dose had a statistically significant effect on CI, and consequently, on the degradation of PP MPs (p-value = 0.015). For the sludge samples, both ozonated samples (S1 and S2) and anaerobic digestion samples (AD1 and AD2) showed similar trends to those observed for LDPE MPs. In particular, the S2 sample showed a 59 ± 46% higher CI value compared to the untreated sample (BFT), compared to the increase of 40 ± 16% observed for the S1 sample, which received half the ozone dose. Meanwhile, the AD2 sample exhibited a 75 ± 36% higher CI than AD1. However, for PP MPs, the average CI value for the AD1 sample was lower than that of the S2 sample, suggesting a very marginal or inconsistent degradative effect on the polymer from AD. Further analysis and research are needed to clarify any uncertainties. Furthermore, as shown in both Figure 6a and Figure 6b, the CI values for both polymers (LDPE and PP) after ozonation tests performed on sludge (S1 and S2) were generally lower than the corresponding tests performed in deionized water (W3 and W4). This discrepancy may be attributed to the competitive effect of the organic matter present in the synthetic sludge, which could have been degraded by the ozone, thereby reducing the amount of ozone available for MPs degradation.
Finally, Figure 6c highlights the average CI values for PA(66) MPs. For this polymer, a general increase in CI following ozonation was observed, but no distinct or significant differences were detected with increasing ozone dose (p-value = 0.197). For mixed samples, compared to the untreated sample (BFT), CI increased by 32 ± 3% at the minimum tested dose (W1, 5 gO3/gMPs) and by 57 ± 13% for the W2 sample, treated with an ozone dose of 10 gO3/gMPs. However, despite an overall average increase of 54 ± 15% compared to the BFT sample, a slight average decrease in CI of 2 ± 12% was observed at the two highest doses (25 and 50 gO3/gMPs) relative to the W2 sample. The CI increase with the ozone dose was also observed for single-polymer added samples, but the increase was marginal, with values remaining roughly constant for the samples treated with the highest ozone doses (25 and 50 gO3/gMPs). For the samples treated with anaerobic digestion, no clear difference between the AD1 and AD2 samples was observed, unlike the other two polymers. However, the AD2 sample showed a CI value 8 ± 9% higher than AD1. Therefore, it seems that anaerobic digestion did not have a relevant degradative effect.
Overall, for all three polymers tested, ozone treatment led to the formation of oxygen-containing functional groups on the MPs surfaces, as evidenced by the increases in both the oxygen proportion and CI values. These changes indicated an increase in the aging degree of the MPs [53,54,55,56,57]. Furthermore, with a few exceptions for PA(66) MPs, the CI values increased with higher ozone concentrations, reflecting the incorporation of oxygen into the polymer structure [54,55,56,57].
3.4. DSC Analysis on Single-Polymer Samples
DSC analysis was performed solely on single-polymer samples subject to ozonation, at different O3 doses (5, 25 and 50 gO3/gMPs). The obtained results, reported in Table 2, revealed that ozonation affects the melting point temperature and the crystallinity of MPs.
Table 2.
Melting point temperature, melting enthalpy, variation of melting enthalpy with respect to untreated polymers and degree of crystallinity of single-polymer samples subject to ozonation.
A marginal effect on the melting temperature was observed for LDPE and PA(66) MPs with increasing ozone dose. Notably, the LDPE2 sample (O3 dose = 10 gO3/gMPs) exhibited a marginal increase (<1%) compared to the untreated sample (LDPE1). At the highest tested dose, the melting temperature decreased by 1.1 °C (<1%). On the other hand, PA(66) MPs showed a general increase in melting temperature, reaching the highest value (+3.5 °C (+1.4%)) for the PA(66)3 sample (O3 dose = 25 gO3/gMPs). Conversely, a significant decrease of the melting temperature, up to 12.0 °C at the highest ozone dosage tested (−7.2% compared to the melting temperature of the untreated MPs), was recorded for PP MPs. The greater sensitivity of PP MPs to oxidative degradation processes may be related to the presence of tertiary hydrogen atoms in its molecular structure, which are absent in LDPE and PA(66). Additionally, when evaluating the enthalpy variation, a general trend common to all three polymers was observed, albeit with some exceptions. Specifically, the variation recorded for the tests with the highest ozone dose was consistently negative, with a reduction in melting enthalpy exceeding 10% compared to the untreated particles (−10.1% for LDPE MPs, −16.1% for PP MPs, and −12.4% for PA(66) MPs). The heat flow rate as a function of temperature for the three polymers is shown in Figures S11–S13. Along with the changes in melting temperature, a decrease in crystallinity was observed for all three polymers, which may facilitate enhanced material degradability. It is well known that both degradation and biodegradation processes typically start in the amorphous phase [66]. Specifically, when comparing the samples treated with the highest ozone dose (LDPE4, PP4, and PA(66)4) to their respective untreated samples (LDPE1, PP1, and PA(66)1), an overall reduction in crystallinity content was observed: 5.9% for PP and 3.6% for both LDPE and PA(66). This decrease in the crystalline region, along with a corresponding increase in the amorphous region, resulted in a more random and less ordered arrangement of polymer chains [56,67,68]. Furthermore, crystallinity has been associated with higher mechanical strength and rigidity in polymers, whereas the less ordered chains in the amorphous region make the polymers less resistant and more flexible, allowing the material to deform more freely without breaking [68,69]. Moreover, the DSC scans (Figures S11–S13) revealed not only a decrease in the melting temperature but also a change in peak shape, including peak splitting, suggesting a partial morphological transformation, potentially indicating a modification in the unit cell structure. This effect was particularly evident in PP and, to some extent, in PA(66), whereas LDPE appeared the most resistant to ozonation. PP is known to exhibit three polymorphic forms: the α-phase (monoclinic unit cell) with a melting point of 165 °C, the β-phase (hexagonal) melting at 145–155 °C, and the γ-phase (orthorhombic) melting at 150–160 °C [70,71,72]. The β and γ phases are less stable and can be induced by shear stress, temperature gradients, pressure variations, and other energy inputs, including possibly ozone exposure.
4. Conclusions
This study evaluated the effects of ozone pretreatment and the subsequent AD process on the physicochemical properties of LDPE, PP, and PA(66) MPs. The results highlighted that ozone altered the tested polymers, with evident modifications in surface characteristics and chemical structure, but minimal mass loss reduction, across all tested ozone dosages. However, a slight increase in mass was observed in some samples, which could be attributed to the oxidation of MPs and the subsequent formation of new oxygen-containing functional groups, as well as to the retention of hygroscopic or interstitial water on their irregular surface, particularly within superficial cracks induced by ozonation. These trapped water molecules may not have evaporated completely, leading to an apparent increase in mass. Additionally, visual inspection of the MPs through stereomicroscopy revealed noticeable discoloration, particularly in LDPE, although no visible surface modifications were observed. Despite this, chemical analyses confirmed the formation of oxygen-containing functional groups, predominantly carbonyl groups, indicative of oxidative aging. CI values increased with ozone dosage, which is consistent with the development of carbonyl functional groups on the MPs. Specifically, FTIR spectra of LDPE and PP MPs showed the formation of new peaks around 1715 cm−1 and 1710 cm−1, respectively. On the other hand, for PA(66), a shift in the carbonyl absorption peak from 1740 cm−1 to 1755 cm−1 was observed at the higher ozone doses (25 and 50 gO3/gMPs), confirming the progression of oxidative surface degradation. These findings confirm that ozonation facilitates the formation of new functional groups, which may increase the susceptibility of MPs to further degradation. DSC analysis further supported these observations, revealing a reduction in crystallinity for all the three polymers, which indicates an increase in amorphous regions. Regarding the impact of AD, no notable improvement in MPs degradation was observed. Despite the oxidative modifications introduced by ozonation, the microbial activity in the AD process did not show relevant effects on the degradation of the MPs, as there was no reduction in mass. However, this result is based on 30 days of AD, and further research involving longer digestion periods, up to 60 days, would need to be investigated to fully assess the microbial degradation of ozonated MPs. From an analytical perspective, the study also underscores the challenges associated with MPs extraction and characterization in complex matrices such as sludge. These methodological challenges are critical for ensuring accurate assessments of MPs degradation and fate in sewage sludge.
Supplementary Materials
The following supporting information can be downloaded at: https://www.mdpi.com/article/10.3390/microplastics5010052/s1, Table S1: Mass of LDPE, PP and PA(66) MPs added in mixed MPs samples. The reported mass for each polymer is calculated as the sum of all MPs size classes (63–125 µm, 125–212 µm, 212–500 µm, 500–1000 µm, 1000–2000 µm, and 2000–5000 µm); Table S2: Mass of LDPE, PP and PA(66) MPs for all size classes added in mixed MPs samples; Table S3: Mass of LDPE, PP and PA(66) MPs added in single-polymer samples. The added MPs were in the range of 212–500 µm; Table S4: Gas flow rate, O3 content in the gas, average O3 transfer rate in the matrix, and O3 dosage per each sample, both mixed and single-polymer samples. Tests were carried out bubbling N2, for samples LDPE1, LDPE1_II, PP1, PP1_II, PA(66)1 and PA(66)1_II; Table S5: Volume of each substance added to AD samples and initial and final pH values recorded; Filtration protocol; Table S6: MPs mass of the samples analyzed with DSC and values of the theoretical enthalpy of melting for a 100% crystalline polymer (); Table S7: Physico-chemical characteristics (mean ± standard deviation) of synthetic sludge and granular inoculum; Table S8: Total MPs weight before and after ozone treatment, and the corresponding MPs removal; Table S9: Total single-polymer MPs weight before and after ozone treatment, and the corresponding MPs removal; Figure S1: Microscopic images (50X) of MPs before and after ozonation tests, for the single-polymer samples: (a) LDPE, 0 gO3/gMPs; (b) LDPE, 5 gO3/gMPs; (c) LDPE, 25 gO3/gMPs; (d) LDPE, 50 gO3/gMPs; (e) PP, 0 gO3/gMPs; (f) PP, 5 gO3/gMPs; (g) PP, 25 gO3/gMPs; (h) PP, 50 gO3/gMPs; (i) PA(66), 0 gO3/gMPs; (l) PA(66), 5 gO3/gMPs; (m) PA(66), 25 gO3/gMPs; (n) PA(66), 50 gO3/gMPs. Source: SIAD; Figure S2: Spectral bands significantly influencing PC1 and PC2 for LDPE MPs (mixed MPs samples), considering the whole spectral region (4000–1200 cm−1); Figure S3: PCA results for LDPE MPs spectra (mixed MPs samples) and centered on the BFT sample. The considered spectral region is 1850–1420 cm−1. Green, light blue, yellow and orange colors represent different ozone doses. Red point represent BFT sample. Different shape of the indicators means different typology of matrix and treatment; Figure S4: Spectral bands significantly influencing PC1 and PC3 for LDPE MPs (mixed MPs samples), considering the spectral region 1850–1420 cm−1; Figure S5: Spectral bands significantly influencing PC1 and PC3 for LDPE MPs (single-polymer samples), considering the whole spectral region (4000–1200 cm−1); Figure S6: PCA results for PP MPs spectra (mixed MPs samples) and centered on the BFT sample. The considered spectral region is 4000–1200 cm−1. Green, light blue, yellow and orange colors represent different ozone doses. Red point represent BFT sample. Different shape of the indicators means different typology of matrix and treatment; Figure S7: Spectral bands significantly influencing PC1, PC2, PC3 and PC6 for PP MPs (mixed MPs samples), considering the whole spectral region (4000–1200 cm−1); Figure S8: Spectral bands significantly influencing PC1 and PC2 for PP MPs (single-polymer samples), considering the whole spectral region (4000–1200 cm−1); Figure S9: Spectral bands significantly influencing PC1 and PC2 for PA(66) MPs (mixed MPs samples), considering the whole spectral region (4000–1200 cm−1); Figure S10: Spectral bands significantly influencing PC1 and PC2 for PA(66) MPs (single-polymer samples), considering the spectral region 1850–1420 cm−1; Figure S11: Heat flow rate as a function of temperature showing the fusion point for LDPE MPs (single-polymer samples) treated with different ozone doses; Figure S12: Heat flow rate as a function of temperature showing the fusion point for PP MPs (single-polymer samples) treated with different ozone doses; Figure S13: Heat flow rate as a function of temperature showing the fusion point for PA(66) MPs (single-polymer samples) treated with different ozone doses.
Author Contributions
A.Z.: Methodology, validation, formal analysis, investigation, writing—original draft, visualization. R.C.: investigation. S.D.: methodology, writing—review and editing. S.T.: methodology, resources, writing—review and editing. S.F.: methodology, investigation, resources, writing—review and editing. M.P.: methodology, investigation, validation, writing—review and editing. E.P.: methodology, investigation, resources, writing—review and editing. F.M.: conceptualization, methodology, writing—review and editing, supervision, project administration, funding acquisition. All authors have read and agreed to the published version of the manuscript.
Funding
Alberto Zoccali was funded by the Italian Ministry of Research (PON 2021 PhD Grant DOT1316729-2, CUP D45F21003710001) during his PhD and by EU-funded LIFE CASCADE project LIFE-2022-SAP-ENV–LIFE-PJG Action LIFE22-ENV-IT-LIFE–CASCADE Project Grant Management Number 101113942 for his postdoc position.
Institutional Review Board Statement
Not applicable.
Data Availability Statement
The raw data supporting the conclusions of this article will be made available by the authors on request.
Acknowledgments
The authors would like to thank Davide Soderino for his valuable support and active participation in the ozonation experiments carried out during his time at SIAD S.p.A. Special thanks are also due to Ilaria Vicari, undergraduate student at Politecnico di Milano—Department of Civil and Environmental Engineering, for her contribution in the laboratory activities.
Conflicts of Interest
Authors Michela Peroni and Eleonora Pasinetti were employed by the company SIAD S.p.A. The remaining authors declare that they have no known competing financial interests or personal relationships that could have appeared to influence the work reported in this paper.
Abbreviations
The following abbreviations are used in this manuscript:
| AD | Anaerobic digestion |
| AFT | After treatment |
| ANOVA | One-Way Analysis of Variance |
| BFT | Before treatment |
| BMP | Biochemical Methane Potential |
| CECs | Contaminants of Emerging Concern |
| CI | Carbonyl Index |
| DSC | Differential Scanning Calorimetry |
| LDPE | Low-density polyethylene |
| MCT | Mercury Cadmium Telluride |
| MPs | Microplastics |
| PA(66) | Polyamide 66 |
| PCA | Principal Component Analysis |
| PP | Polypropylene |
| PTFE | Polytetrafluoroethylene |
| SAUB | Specified Area Under Band |
| S# | Synthetic sludge samples |
| TS | Total solids |
| VS | Volatile solids |
| WWTPs | Wastewater treatment plants |
| W# | Deionized water samples |
| Xc | Degree of crystallinity |
| µFTIR | Fourier Transform Infrared Micro-Spectroscopy |
| Enthalpy of melting | |
| Theoretical enthalpy of melting |
References
- da Costa, J.P.; Paço, A.; Santos, P.S.M.; Duarte, A.C.; Rocha-Santos, T. Microplastics in soils: Assessment, analytics and risks. Environ. Chem. 2019, 16, 18–30. [Google Scholar] [CrossRef] [Scilit]
- Dris, R.; Gasperi, J.; Rocher, V.; Saad, M.; Renault, N.; Tassin, B. Microplastic contamination in an urban area: A case study in Greater Paris. Environ. Chem. 2015, 12, 592–599. [Google Scholar] [CrossRef] [Scilit]
- Horton, A.A.; Walton, A.; Spurgeon, D.J.; Lahive, E.; Svendsen, C. Microplastics in freshwater and terrestrial environments: Evaluating the current understanding to identify the knowledge gaps and future research priorities. Sci. Total Environ. 2017, 586, 127–141. [Google Scholar] [CrossRef] [Scilit]
- Wright, S.L.; Ulke, J.; Font, A.; Chan, K.L.A.; Kelly, F.J. Atmospheric microplastic deposition in an urban environment and an evaluation of transport. Environ. Int. 2020, 136, 105411. [Google Scholar] [CrossRef] [Scilit]
- Arthur, C.; Baker, J.; Bamford, H. Proceedings of the International Research Workshop on the Occurrence, Effects, and Fate of Microplastic Marine Debris; NOAA: Washington, DC, USA, 2009; 530p.
- ISO 24187:2023; Principles for the Analysis of Microplastic Present in the Environment. ISO: Geneva, Switzerland, 2023.
- Wagner, M.; Lambert, S. Freshwater Microplastics: Emerging Environmental Contaminants; The Handbook of Environmental Chemistry; Springer Nature: Berlin/Heidelberg, Germany, 2018; Volume 58. [Google Scholar]
- Ali, I.; Ding, T.; Peng, C.; Naz, I.; Sun, H.; Li, J.; Liu, J. Micro- and nanoplastics in wastewater treatment plants: Occurrence, removal, fate, impacts and remediation technologies—A critical review. Chem. Eng. J. 2021, 423, 130205. [Google Scholar] [CrossRef] [Scilit]
- Alvim, C.B.; Bes-Piá, M.A.; Mendoza-Roca, J.A. Separation and identification of microplastics from primary and secondary effluents and activated sludge from wastewater treatment plants. Chem. Eng. J. 2020, 402, 126293. [Google Scholar] [CrossRef] [Scilit]
- Edo, C.; González-Pleiter, M.; Leganés, F.; Fernández-Piñas, F.; Rosal, R. Fate of microplastics in wastewater treatment plants and their environmental dispersion with effluent and sludge. Environ. Pollut. 2020, 259, 113837. [Google Scholar] [CrossRef] [Scilit]
- Sun, J.; Dai, X.; Wang, Q.; van Loosdrecht, M.C.M.; Ni, B.J. Microplastics in wastewater treatment plants: Detection, occurrence and removal. Water Res. 2019, 152, 21–37. [Google Scholar] [CrossRef] [Scilit]
- Talvitie, J.; Heinonen, M.; Pääkkönen, J.P.; Vahtera, E.; Mikola, A.; Setälä, O.; Vahala, R. Do wastewater treatment plants act as a potential point source of microplastics? Preliminary study in the coastal Gulf of Finland, Baltic Sea. Water Sci. Technol. 2015, 72, 1495–1504. [Google Scholar] [CrossRef] [Scilit] [PubMed]
- Akarsu, C.; Kumbur, H.; Gökdağ, K.; Kıdeyş, A.E.; Sanchez-Vidal, A. Microplastics composition and load from three wastewater treatment plants discharging into Mersin Bay, north eastern Mediterranean Sea. Mar. Pollut. Bull. 2020, 150, 110776. [Google Scholar] [CrossRef] [Scilit] [PubMed]
- Habib, R.Z.; Thiemann, T.; Al Kendi, R. Microplastics and Wastewater Treatment Plants—A Review. J. Water Resour. Prot. 2020, 12, 1–35. [Google Scholar] [CrossRef]
- Franco, A.A.; Martín-García, A.P.; Egea-Corbacho, A.; Arellano, J.M.; Albendín, G.; Rodríguez-Barroso, R.; Quiroga, J.M.; Coello, M.D. Assessment and accumulation of microplastics in sewage sludge at wastewater treatment plants located in Cádiz, Spain. Environ. Pollut. 2023, 317, 120689. [Google Scholar]
- Zuo, W.; Gu, C.; Zhang, W.; Xu, K.; Wang, Y.; Bai, Y.; Shan, Y.; Dai, Q. Sewage sludge amendment improved soil properties and sweet sorghum yield and quality in a newly reclaimed mudflat land. Sci. Total Environ. 2019, 654, 541–549. [Google Scholar] [CrossRef] [Scilit]
- Nizzetto, L.; Bussi, G.; Futter, M.N.; Butterfield, D.; Whitehead, P.G. A theoretical assessment of microplastic transport in river catchments and their retention by soils and river sediments. Environ. Sci. Process. Impacts 2016, 18, 1050–1059. [Google Scholar] [CrossRef] [Scilit] [PubMed]
- Hooge, A.; Hauggaard-Nielsen, H.; Heinze, W.M.; Lyngsie, G.; Ramos, T.M.; Sandgaard, M.H.; Vollertsen, J.; Syberg, K. Fate of microplastics in sewage sludge and in agricultural soils. TrAC Trends Anal. Chem. 2023, 166, 117184. [Google Scholar] [CrossRef] [Scilit]
- He, Z.W.; Tang, C.C.; Liu, W.Z.; Ren, Y.X.; Guo, Z.C.; Zhou, A.J.; Wang, L.; Yang, C.X.; Wang, A.J. Enhanced short-chain fatty acids production from waste activated sludge with alkaline followed by potassium ferrate treatment. Bioresour. Technol. 2019, 289, 121642. [Google Scholar] [CrossRef] [Scilit] [PubMed]
- Zhang, X.; Chen, J.; Li, J. The removal of microplastics in the wastewater treatment process and their potential impact on anaerobic digestion due to pollutants association. Chemosphere 2020, 251, 126360. [Google Scholar] [CrossRef] [Scilit]
- Ma, H.; Guo, Y.; Qin, Y.; Li, Y.Y. Nutrient recovery technologies integrated with energy recovery by waste biomass anaerobic digestion. Bioresour. Technol. 2018, 269, 520–531. [Google Scholar] [CrossRef] [Scilit] [PubMed]
- Appels, L.; Baeyens, J.; Degrève, J.; Dewil, R. Principles and potential of the anaerobic digestion of waste-activated sludge. Prog. Energy Combust. Sci. 2008, 34, 755–781. [Google Scholar] [CrossRef] [Scilit]
- Catenacci, A.; Peroni, M.; Gievers, F.; Mainardis, M.; Pasinetti, E.; Malpei, F. Integration of sludge ozonation with anaerobic digestion: From batch testing to scenario analysis with energy, economic and environmental assessment. Resour. Conserv. Recycl. 2022, 186, 106539. [Google Scholar] [CrossRef] [Scilit]
- Çelebi, E.B.; Aksoy, A.; Sanin, F.D. Maximizing the energy potential of urban sludge treatment: An experimental study and a scenario-based energy analysis focusing on anaerobic digestion with ultrasound pretreatment and sludge combustion. Energy 2021, 221, 119876. [Google Scholar] [CrossRef] [Scilit]
- Tonanzi, B.; Gallipoli, A.; Gianico, A.; Annesini, M.C.; Crognale, S.; Mininni, G.; Rossetti, S.; Braguglia, C.M. Cascade systems to recover resources from sludge by the integration of pretreatments to fermentation-based anaerobic bioleaching process. J. Environ. Chem. Eng. 2022, 10, 107711. [Google Scholar] [CrossRef] [Scilit]
- Wang, Z.; Wang, Y.; Li, X.; Chen, Z.; Kou, X.; Gao, L.; Wu, S.; Chai, B. Effect of calcium peroxide pretreatment on anaerobic digestion of primary and secondary sludge of A2/O process. J. Water Process Eng. 2022, 49, 102994. [Google Scholar]
- Zhao, C.; Liu, H.; Liu, H.; Zhan, X.; Zhang, X.; Fu, B.; Shi, M.; Lu, S.; Huang, F.; Cui, M.; et al. Influence of thermal hydrolysis on sludge anaerobic digestion: Release of humic acid promotes electron transport of methanogen. Chem. Eng. J. 2023, 451, 138455. [Google Scholar]
- Dogruel, S.; Cetinkaya Atesci, Z.; Aydin, E.; Pehlivanoglu-Mantas, E. Ozonation in advanced treatment of secondary municipal wastewater effluents for the removal of micropollutants. Environ. Sci. Pollut. Res. 2020, 27, 45460–45475. [Google Scholar] [CrossRef] [Scilit]
- Zhu, X.; Hao, C.; Zhang, M.; Lan, B. Enhanced Adsorption of Bromoform onto Microplastic Polyethylene Terephthalate Exposed to Ozonation and Chlorination. Molecules 2023, 28, 259. [Google Scholar] [CrossRef] [Scilit]
- Lekše, N.; Griessler Bulc, T.; Žgajnar Gotvajn, A. The Potential of Ozonation to Reduce Impact of Waste Sludge-Entrapped Microplastics to Biogas Production. Ozone Sci. Eng. 2024, 46, 255–266. [Google Scholar] [CrossRef] [Scilit]
- Shao, Y.; Zhou, X.; Liu, X.; Wang, L. Pre-oxidization-induced change of physicochemical characteristics and removal behaviours in conventional drinking water treatment processes for polyethylene microplastics. RSC Adv. 2020, 10, 41488–41494. [Google Scholar]
- Li, J.; Dagnew, M.; Ray, M.B. Microfibers in anaerobic digestion: Effect of ozone pretreatment. J. Environ. Manag. 2023, 346, 118792. [Google Scholar] [CrossRef] [Scilit]
- Lekše, N.; Bulc, T.G.; Kukovičič, N.; Černic, T.; Gotvajn, A. Impact of preozonation on biogas potential of PVC microplastics containing waste sludge. Glob. NEST J. 2023, 25, 13–19. [Google Scholar]
- Zoccali, A.; Vianello, A.; Malpei, F.; Vollertsen, J. How does alkaline-thermal pretreatment followed by anaerobic digestion affect the content of polyethylene terephthalate and polyamide 66 microplastics? Sci. Total Environ. 2025, 968, 178861. [Google Scholar] [CrossRef] [Scilit] [PubMed]
- Baudez, J.C.; Ginisty, P.; Peuchot, C.; Spinosa, L. The preparation of synthetic sludge for lab testing. Water Sci. Technol. 2007, 56, 67–74. [Google Scholar] [CrossRef] [Scilit]
- Ducoli, S.; Federici, S.; Nicsanu, R.; Zendrini, A.; Marchesi, C.; Paolini, L.; Radeghieri, A.; Bergese, P.; Depero, L.E. A different protein corona cloaks ‘true-to-life’ nanoplastics with respect to synthetic polystyrene nanobeads. Environ. Sci. Nano 2022, 9, 1414–1426. [Google Scholar] [CrossRef] [Scilit]
- Ducoli, S.; Rani, M.; Marchesi, C.; Speziani, M.; Zacco, A.; Gavazzi, G.; Federici, S.; Depero, L.E. Comparison of different fragmentation techniques for the production of true-to-life microplastics. Talanta 2024, 283, 127106. [Google Scholar] [CrossRef] [Scilit]
- Carrère, H.; Dumas, C.; Battimelli, A.; Batsone, D.J.; Delgenès, J.P.; Steyer, J.P.; Ferrer, I. Pretreatment methods to improve sludge anaerobic degradability: A review. J. Hazard. Mater. 2010, 183, 1–15. [Google Scholar] [CrossRef] [Scilit]
- Bougrier, C.; Battimelli, A.; Delgenès, J.P.; Carrère, H. Combined ozone pretreatment and anaerobic digestion for the reduction of biological sludge production in wastewater treatment. Ozone Sci. Eng. 2007, 29, 201–206. [Google Scholar] [CrossRef] [Scilit]
- Hodaei, M.; Ghasemi, S.; Khosravi, A.; Vossoughi, M. Effect of the ozonation pretreatment on biogas production from waste activated sludge of tehran wastewater treatment plant. Biomass Bioenergy 2021, 152, 106198. [Google Scholar] [CrossRef] [Scilit]
- Catenacci, A.; Santus, A.; Malpei, F.; Ferretti, G. Early prediction of BMP tests: A step response method for estimating first-order model parameters. Renew. Energy 2022, 188, 184–194. [Google Scholar] [CrossRef] [Scilit]
- Liu, F.; Olesen, K.B.; Borregaard, A.R.; Vollertsen, J. Microplastics in urban and highway stormwater retention ponds. Sci. Total Environ. 2019, 671, 992–1000. [Google Scholar] [CrossRef] [Scilit]
- Chand, R.; Rasmussen, L.A.; Tumlin, S.; Vollertsen, J. The occurrence and fate of microplastics in a mesophilic anaerobic digester receiving sewage sludge, grease, and fatty slurries. Sci. Total Environ. 2021, 798, 149287. [Google Scholar] [PubMed]
- Almond, J.; Sugumaar, P.; Wenzel, M.N.; Hill, G.; Wallis, C. Determination of the carbonyl index of polyethylene and polypropylene using specified area under band methodology with ATR-FTIR spectroscopy. e-Polymers 2020, 20, 369–381. [Google Scholar] [CrossRef] [Scilit]
- Shi, K.; Ye, L.; Li, G. Thermal oxidative aging behavior and stabilizing mechanism of highly oriented polyamide 6. J. Therm. Anal. Calorim. 2016, 126, 795–805. [Google Scholar] [CrossRef] [Scilit]
- Wunderlich, B. Thermal Analysis of Polymeric Materials; Springer: Berlin/Heidelberg, Germany, 2005. [Google Scholar]
- Lipps, W.C.; Baxter, T.E.; Braun-Howland, E. APHA, AWWA and WEF, Standard Methods for the Examination of Water and Wastewater, 23rd ed.; American Public Health Association: Washington, DC, USA, 2017. [Google Scholar]
- Rani, M.; Ducoli, S.; Depero, L.E.; Prica, M.; Tubi, A. Complex Environmental Matrices. Molecules 2023, 28, 5710. [Google Scholar] [CrossRef] [Scilit]
- Maw, M.M.; Boontanon, N.; Fujii, S.; Boontanon, S.K. Rapid and efficient removal of organic matter from sewage sludge for extraction of microplastics. Sci. Total Environ. 2022, 853, 158642. [Google Scholar] [CrossRef] [Scilit]
- Li, X.; Chen, L.; Ji, Y.; Li, M.; Dong, B.; Qian, G.; Zhou, J.; Dai, X. Effects of chemical pretreatments on microplastic extraction in sewage sludge and their physicochemical characteristics. Water Res. 2020, 171, 115379. [Google Scholar] [CrossRef] [Scilit]
- Sadia, M.; Mahmood, A.; Ibrahim, M.; Irshad, M.K.; Quddusi, A.H.A.; Bokhari, A.; Mubashir, M.; Chuah, L.F.; Show, P.L. Microplastics pollution from wastewater treatment plants: A critical review on challenges, detection, sustainable removal techniques and circular economy. Environ. Technol. Innov. 2022, 28, 102946. [Google Scholar] [CrossRef] [Scilit]
- Li, Q.; Wu, J.; Zhao, X.; Gu, X.; Ji, R. Separation and identification of microplastics from soil and sewage sludge. Environ. Pollut. 2019, 254, 113076. [Google Scholar] [CrossRef] [Scilit] [PubMed]
- Pattanateeradetch, A.; Sakulthaew, C.; Lin, Y.T.; Watcharenwong, A.; Žgajnar Gotvajn, A.; Chen, Y.C.; Xu, Q.; Chokejaroenrat, C. Efficient activation of UV-driven ozonation using ultrasonics for LDPE decomposition. J. Water Process Eng. 2025, 69, 106800. [Google Scholar] [CrossRef] [Scilit]
- Kye, H.; Yoon, Y.; Hwang, T.M. Changes in physical and chemical properties of microplastics by ozonation. Process Saf. Environ. Prot. 2024, 192, 1062–1072. [Google Scholar] [CrossRef] [Scilit]
- Amelia, D.; Karamah, E.F.; Mahardika, M.; Syafri, E.; Rangappa, S.M.; Siengchin, S.; Asrofi, M. Effect of advanced oxidation process for chemical structure changes of polyethylene microplastics. Mater. Today Proc. 2021, 52, 2501–2504. [Google Scholar] [CrossRef] [Scilit]
- Zafar, R.; Park, S.Y.; Kim, C.G. Surface modification of polyethylene microplastic particles during the aqueous-phase ozonation process. Environ. Eng. Res. 2020, 26, 200412. [Google Scholar] [CrossRef] [Scilit]
- Ren, H.; He, Z.; Xu, J.; Yan, X.; Liu, P. Evaluation of the Abilities of Ozone Resistance for Polyamide Fibers: Structures, Properties, and Aging Mechanism. Ind. Eng. Chem. Res. 2019, 58, 17814–17823. [Google Scholar] [CrossRef] [Scilit]
- Smagin, A.V.; Sadovnikova, N.B. Hygroscopy as an Indicator of Specific Surface Area in Polymer Materials. Polymers 2024, 16, 593. [Google Scholar] [CrossRef] [Scilit]
- Lessa Belone, M.C.; Kokko, M.; Sarlin, E. Degradation of common polymers in sewage sludge purification process developed for microplastic analysis. Environ. Pollut. 2021, 269, 116235. [Google Scholar] [CrossRef] [Scilit]
- de Aragão Belé, T.G.; Neves, T.F.; Cristale, J.; Prediger, P.; Constapel, M.; Dantas, R.F. Oxidation of microplastics by O3 and O3/H2O2: Surface modification and adsorption capacity. J. Water Process Eng. 2021, 41, 102072. [Google Scholar] [CrossRef] [Scilit]
- Wang, C.Y.; Wei, S.Y.; He, G.J. Ozone-based in-situ reactive extrusion for rapid functionalisation and degradation of low density polyethylene. Polym. Degrad. Stab. 2024, 220, 110640. [Google Scholar] [CrossRef] [Scilit]
- Iram, D.; Riaz, R.; Iqbal, R.K. Usage of Potential Micro-organisms for Degradation of Plastics. Open J. Environ. Biol. 2019, 4, 007–015. [Google Scholar]
- Lucas, N.; Bienaime, C.; Belloy, C.; Queneudec, M.; Silvestre, F.; Nava-Saucedo, J.E. Polymer biodegradation: Mechanisms and estimation techniques—A review. Chemosphere 2008, 73, 429–442. [Google Scholar]
- Schall, C.; Schöppner, V. Measurement of material degradation in dependence of shear rate, temperature, and residence time. Polym. Eng. Sci. 2022, 62, 815–823. [Google Scholar] [CrossRef] [Scilit]
- Liu, P.; Qian, L.; Wang, H.; Zhan, X.; Lu, K.; Gu, C.; Gao, S. New Insights into the Aging Behavior of Microplastics Accelerated by Advanced Oxidation Processes. Environ. Sci. Technol. 2019, 53, 3579–3588. [Google Scholar] [CrossRef] [Scilit] [PubMed]
- Arias, V.; Olsén, P.; Odelius, K.; Höglund, A.; Albertsson, A.C. Selective degradation in aliphatic block copolyesters by controlling the heterogeneity of the amorphous phase. Polym. Chem. 2015, 6, 3271–3282. [Google Scholar] [CrossRef] [Scilit]
- Starkweather, H.W. Crystalline organization in useful plastics. Polym. Eng. Sci. 1963, 3, 57–60. [Google Scholar] [CrossRef] [Scilit]
- Murmu, U.K.; Adhikari, J.; Naskar, A.; Dey, D.; Roy, A.; Ghosh, A.; Ghosh, M. Mechanical Properties of Crystalline and Semicrystalline Polymer Systems. Encycl. Mater. Plast. Polym. 2022, 2, 917–927. [Google Scholar]
- Polinska, M.; Kozanecki, M.; Rozanski, A. Temperature and Deformation-Induced Changes in the Mechanical Properties of the Amorphous Regions of Semicrystalline Polypropylene. J. Phys. Chem. B 2025, 129, 1426–1438. [Google Scholar] [CrossRef] [Scilit] [PubMed]
- Morrow, D.R. Polymorphism in isotactic polypropylene. J. Macromol. Sci. Part B 1969, 3, 53–65. [Google Scholar] [CrossRef] [Scilit]
- Nedkov, E.; Dobreva, T. Optical properties of the three polymorphic forms of isotactic polypropylene. e-Polymers 2002, 2, 41. [Google Scholar] [CrossRef] [Scilit]
- Cao, Y.; Van Horn, R.M.; Tsai, C.C.; Graham, M.J.; Jeong, K.U.; Wang, B.; Auriemma, F.; De Rosa, C.; Lotz, B.; Cheng, S.Z.D. Epitaxially dominated crystalline morphologies of the y-Phase in isotactic polypropylene. Macromolecules 2009, 42, 4758–4768. [Google Scholar] [CrossRef] [Scilit]
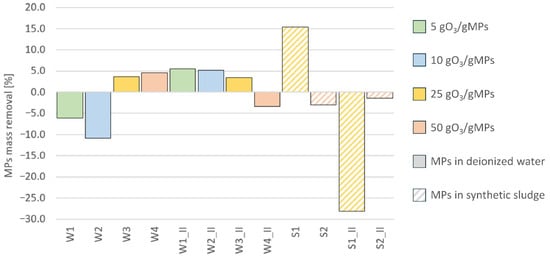
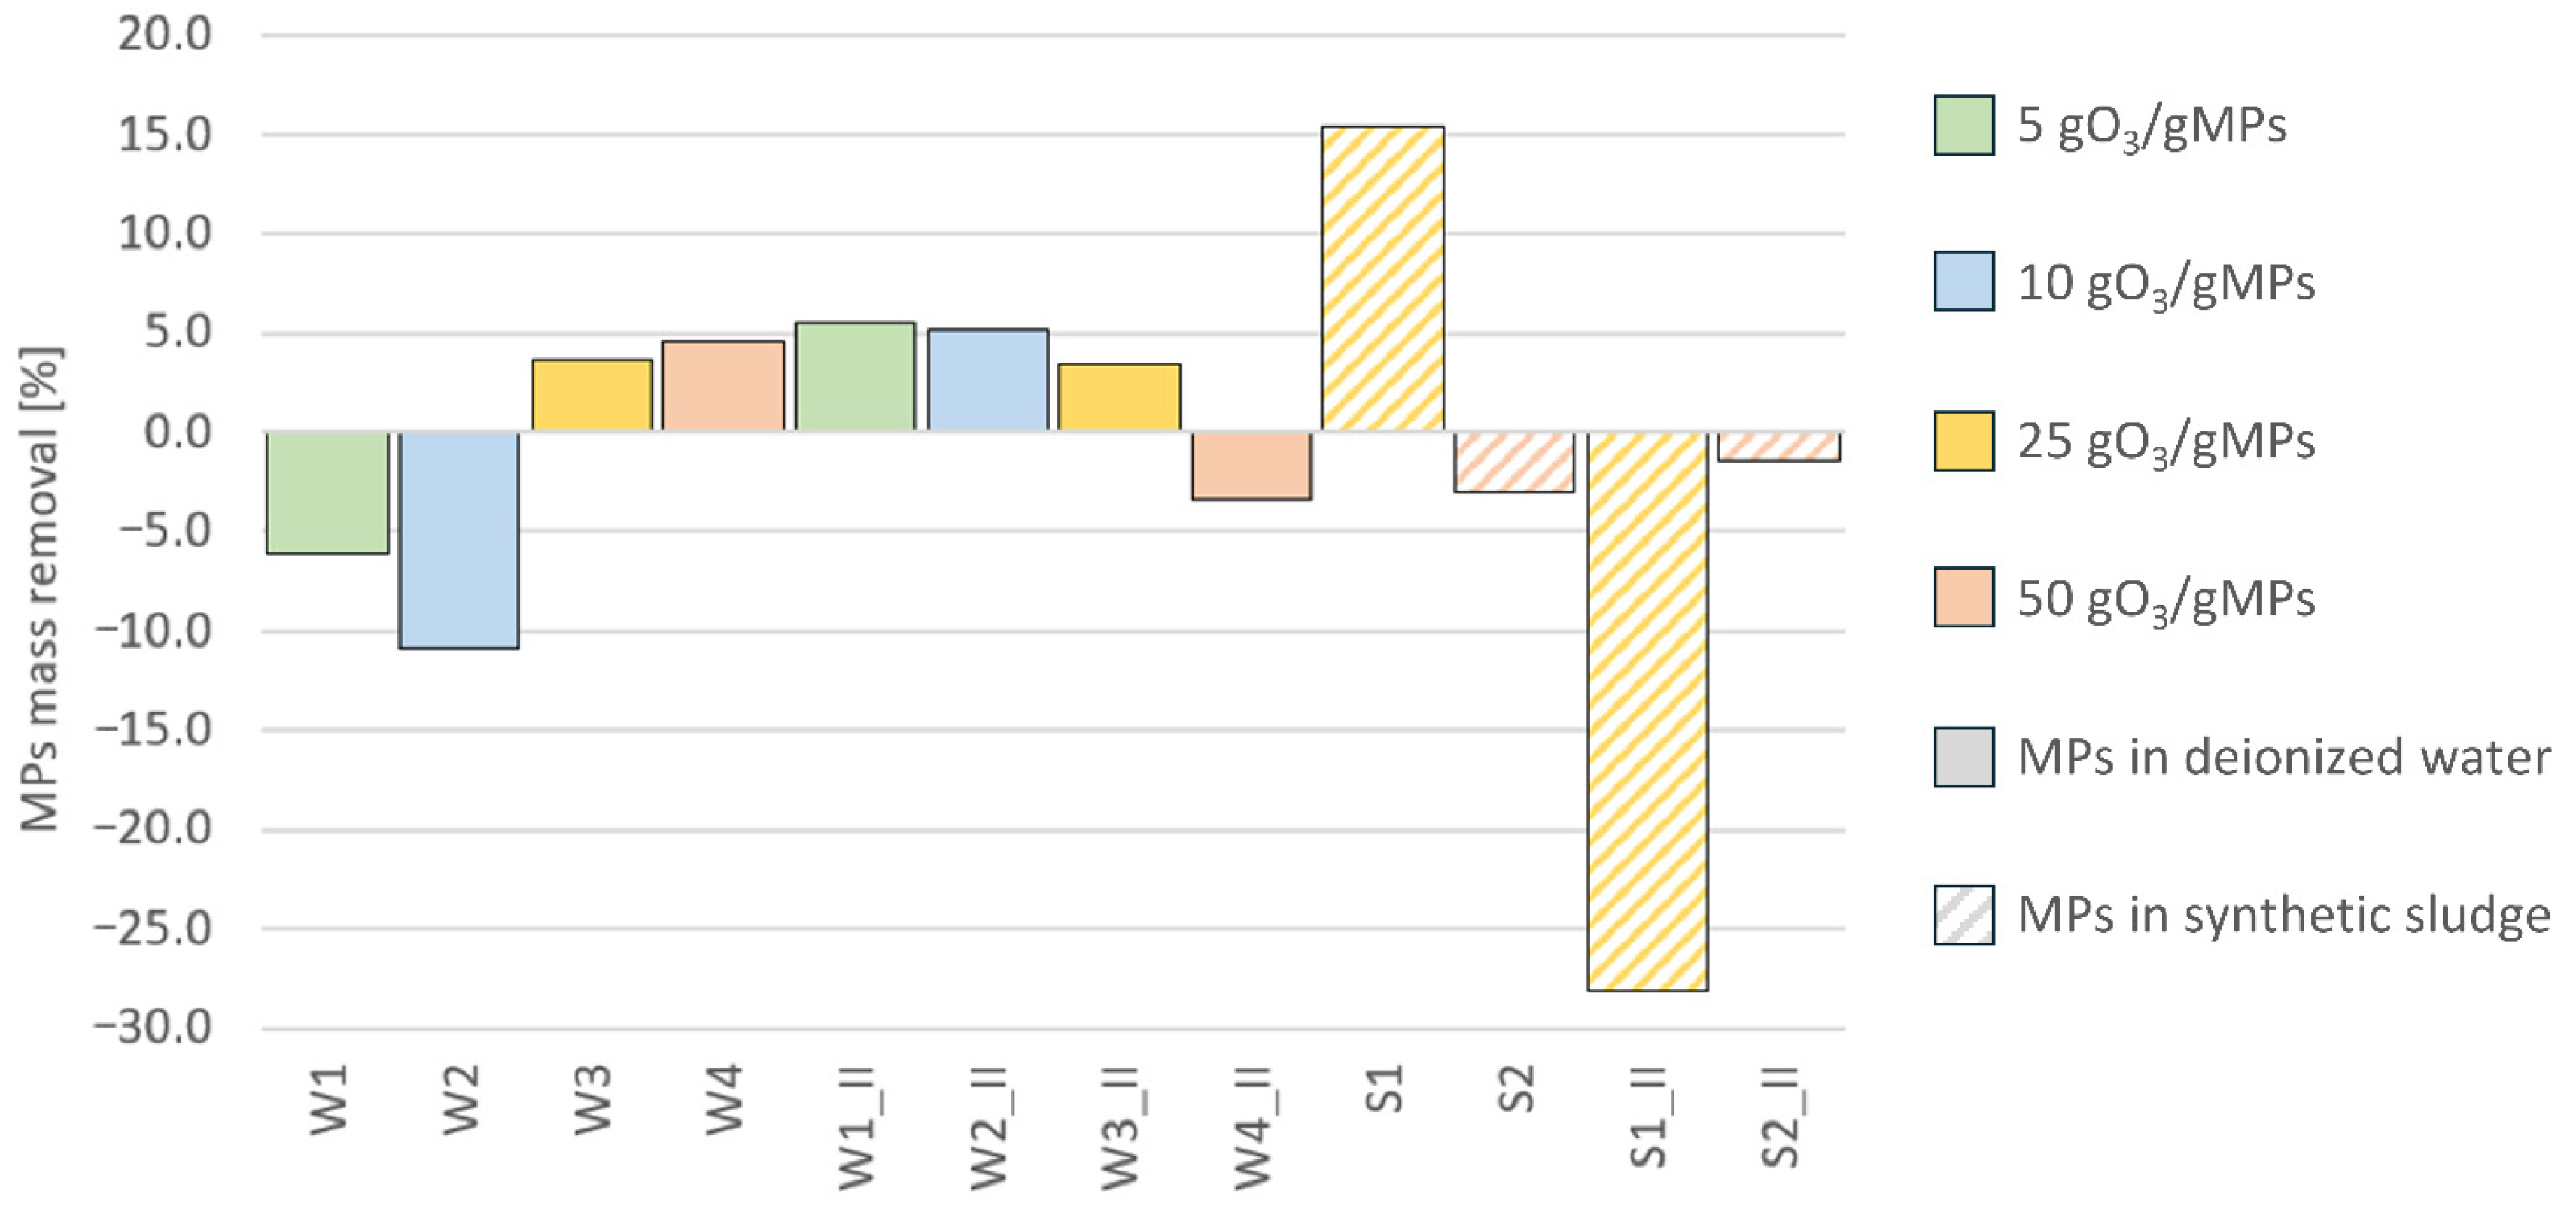
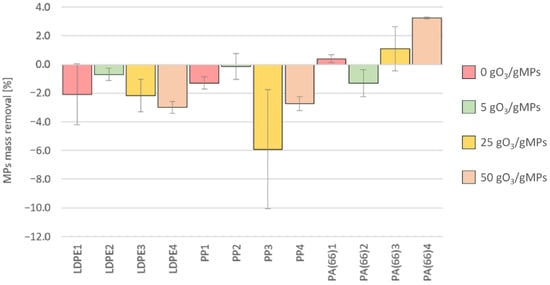
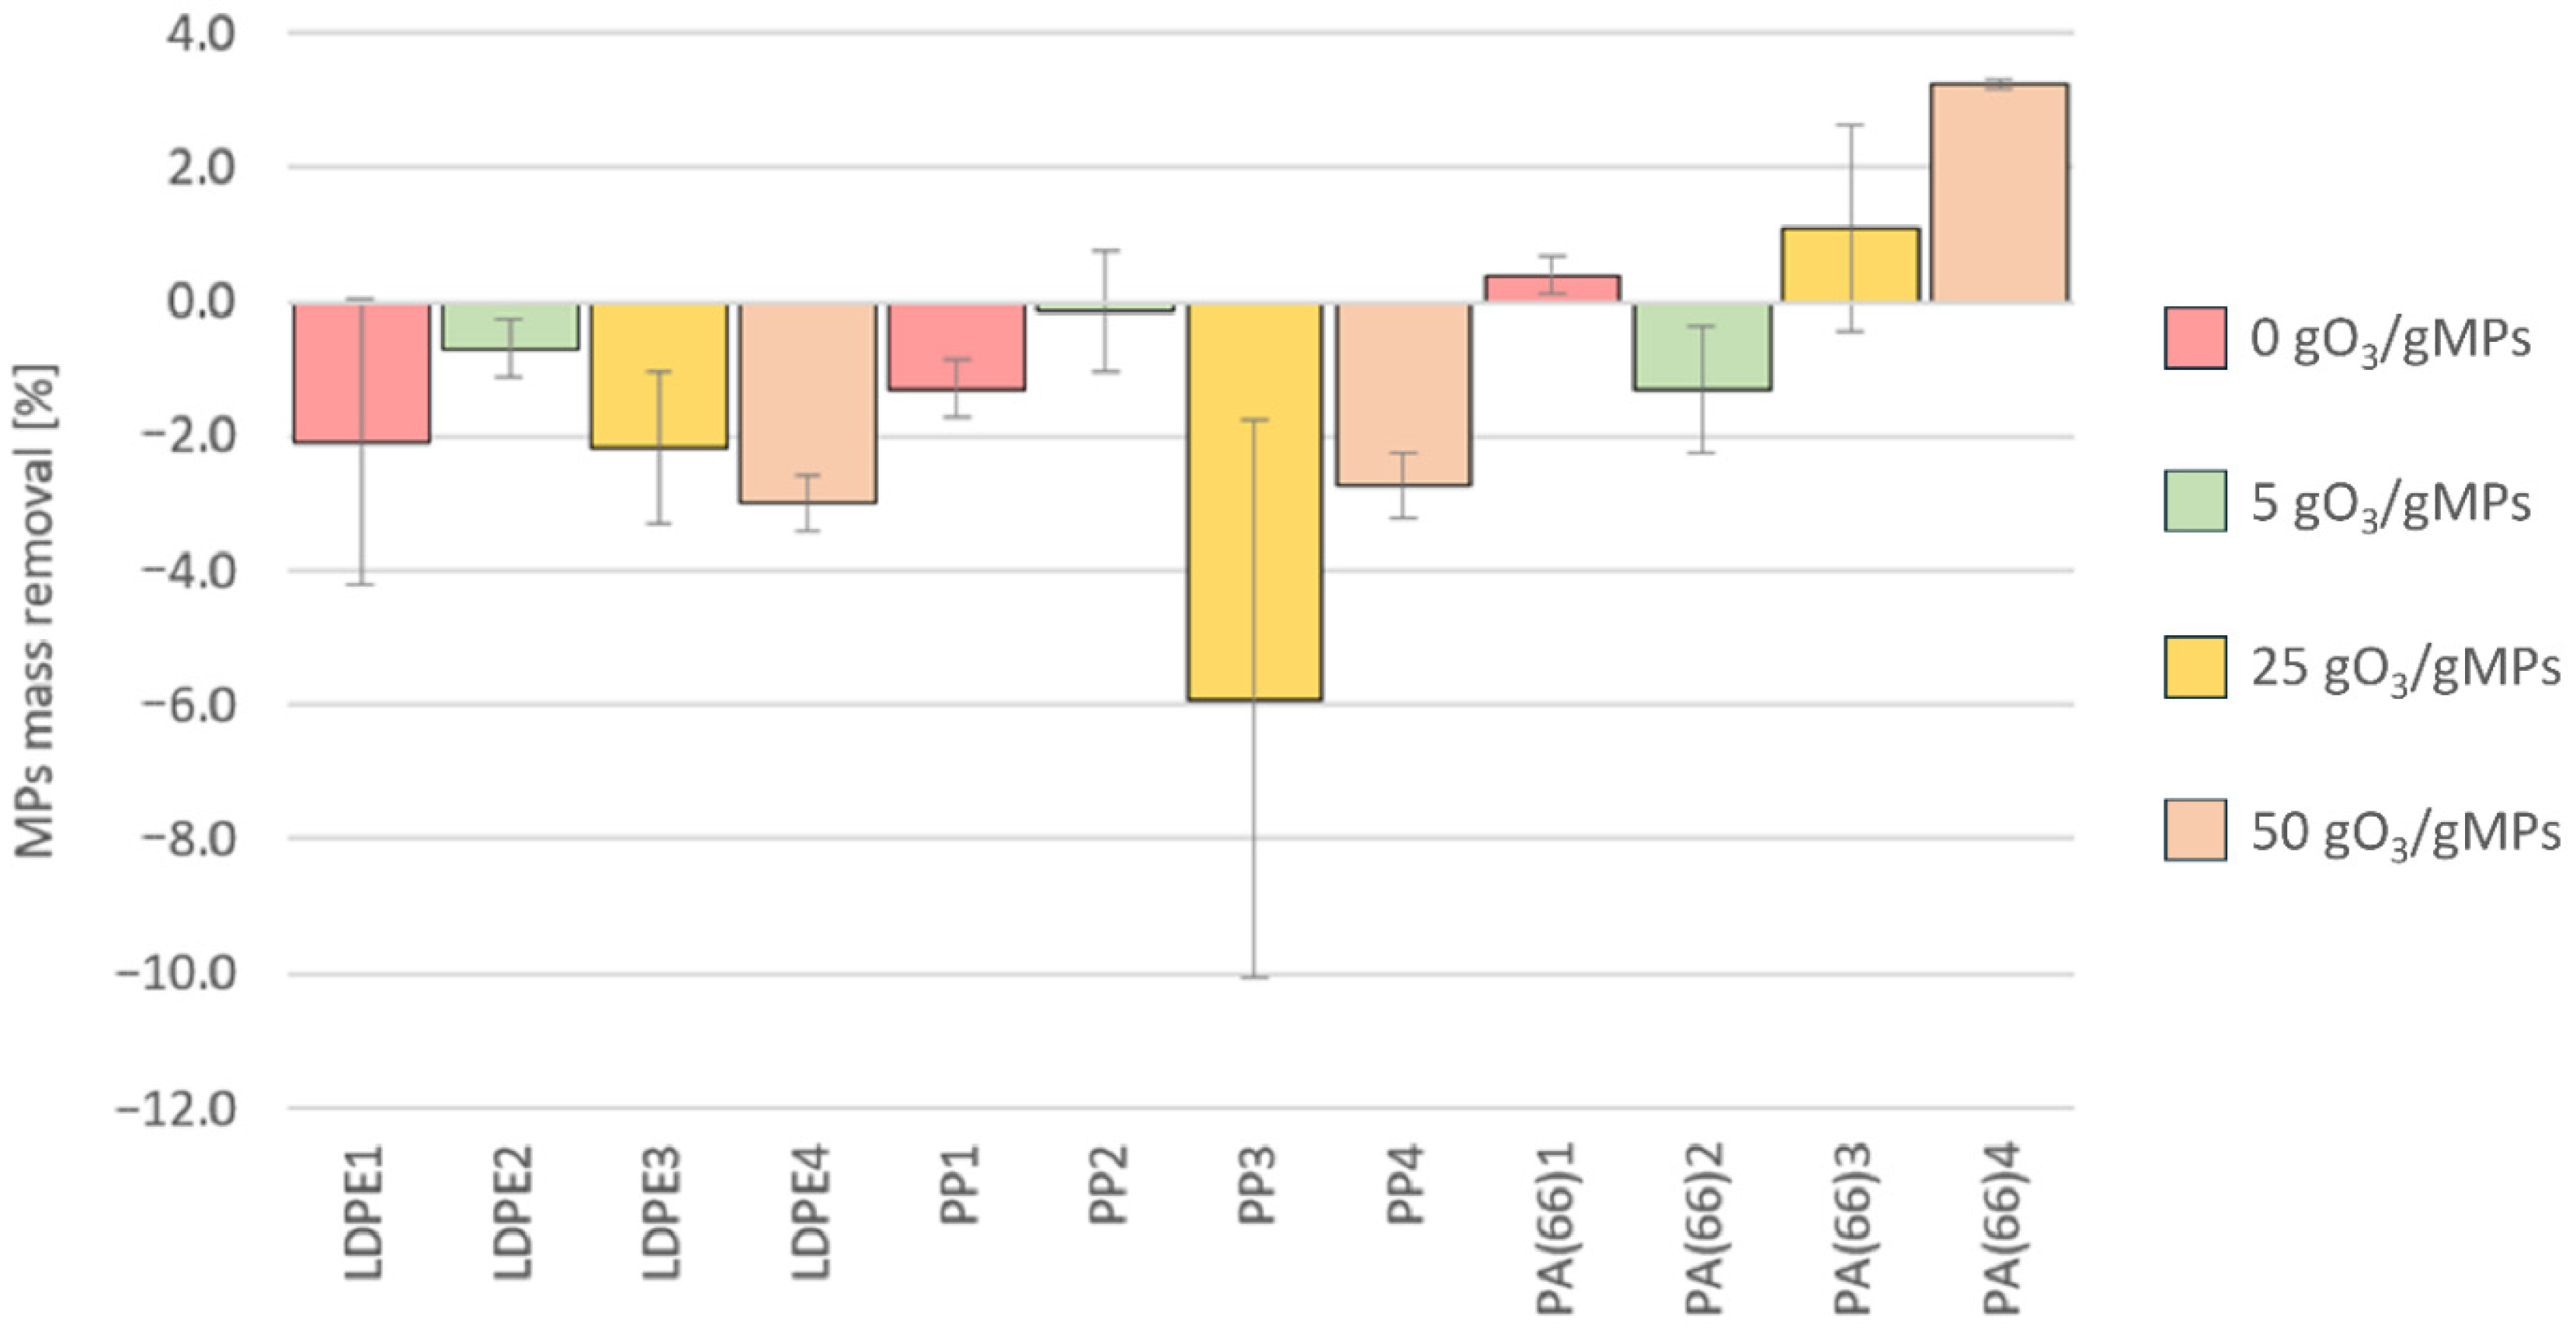
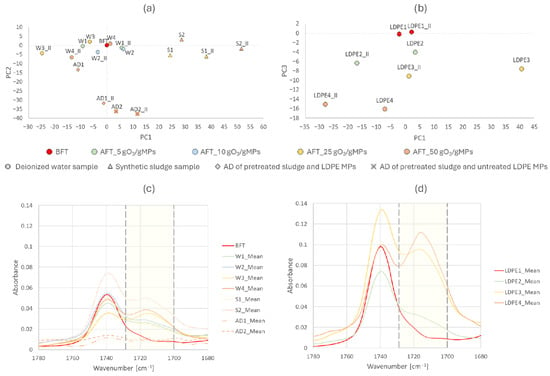
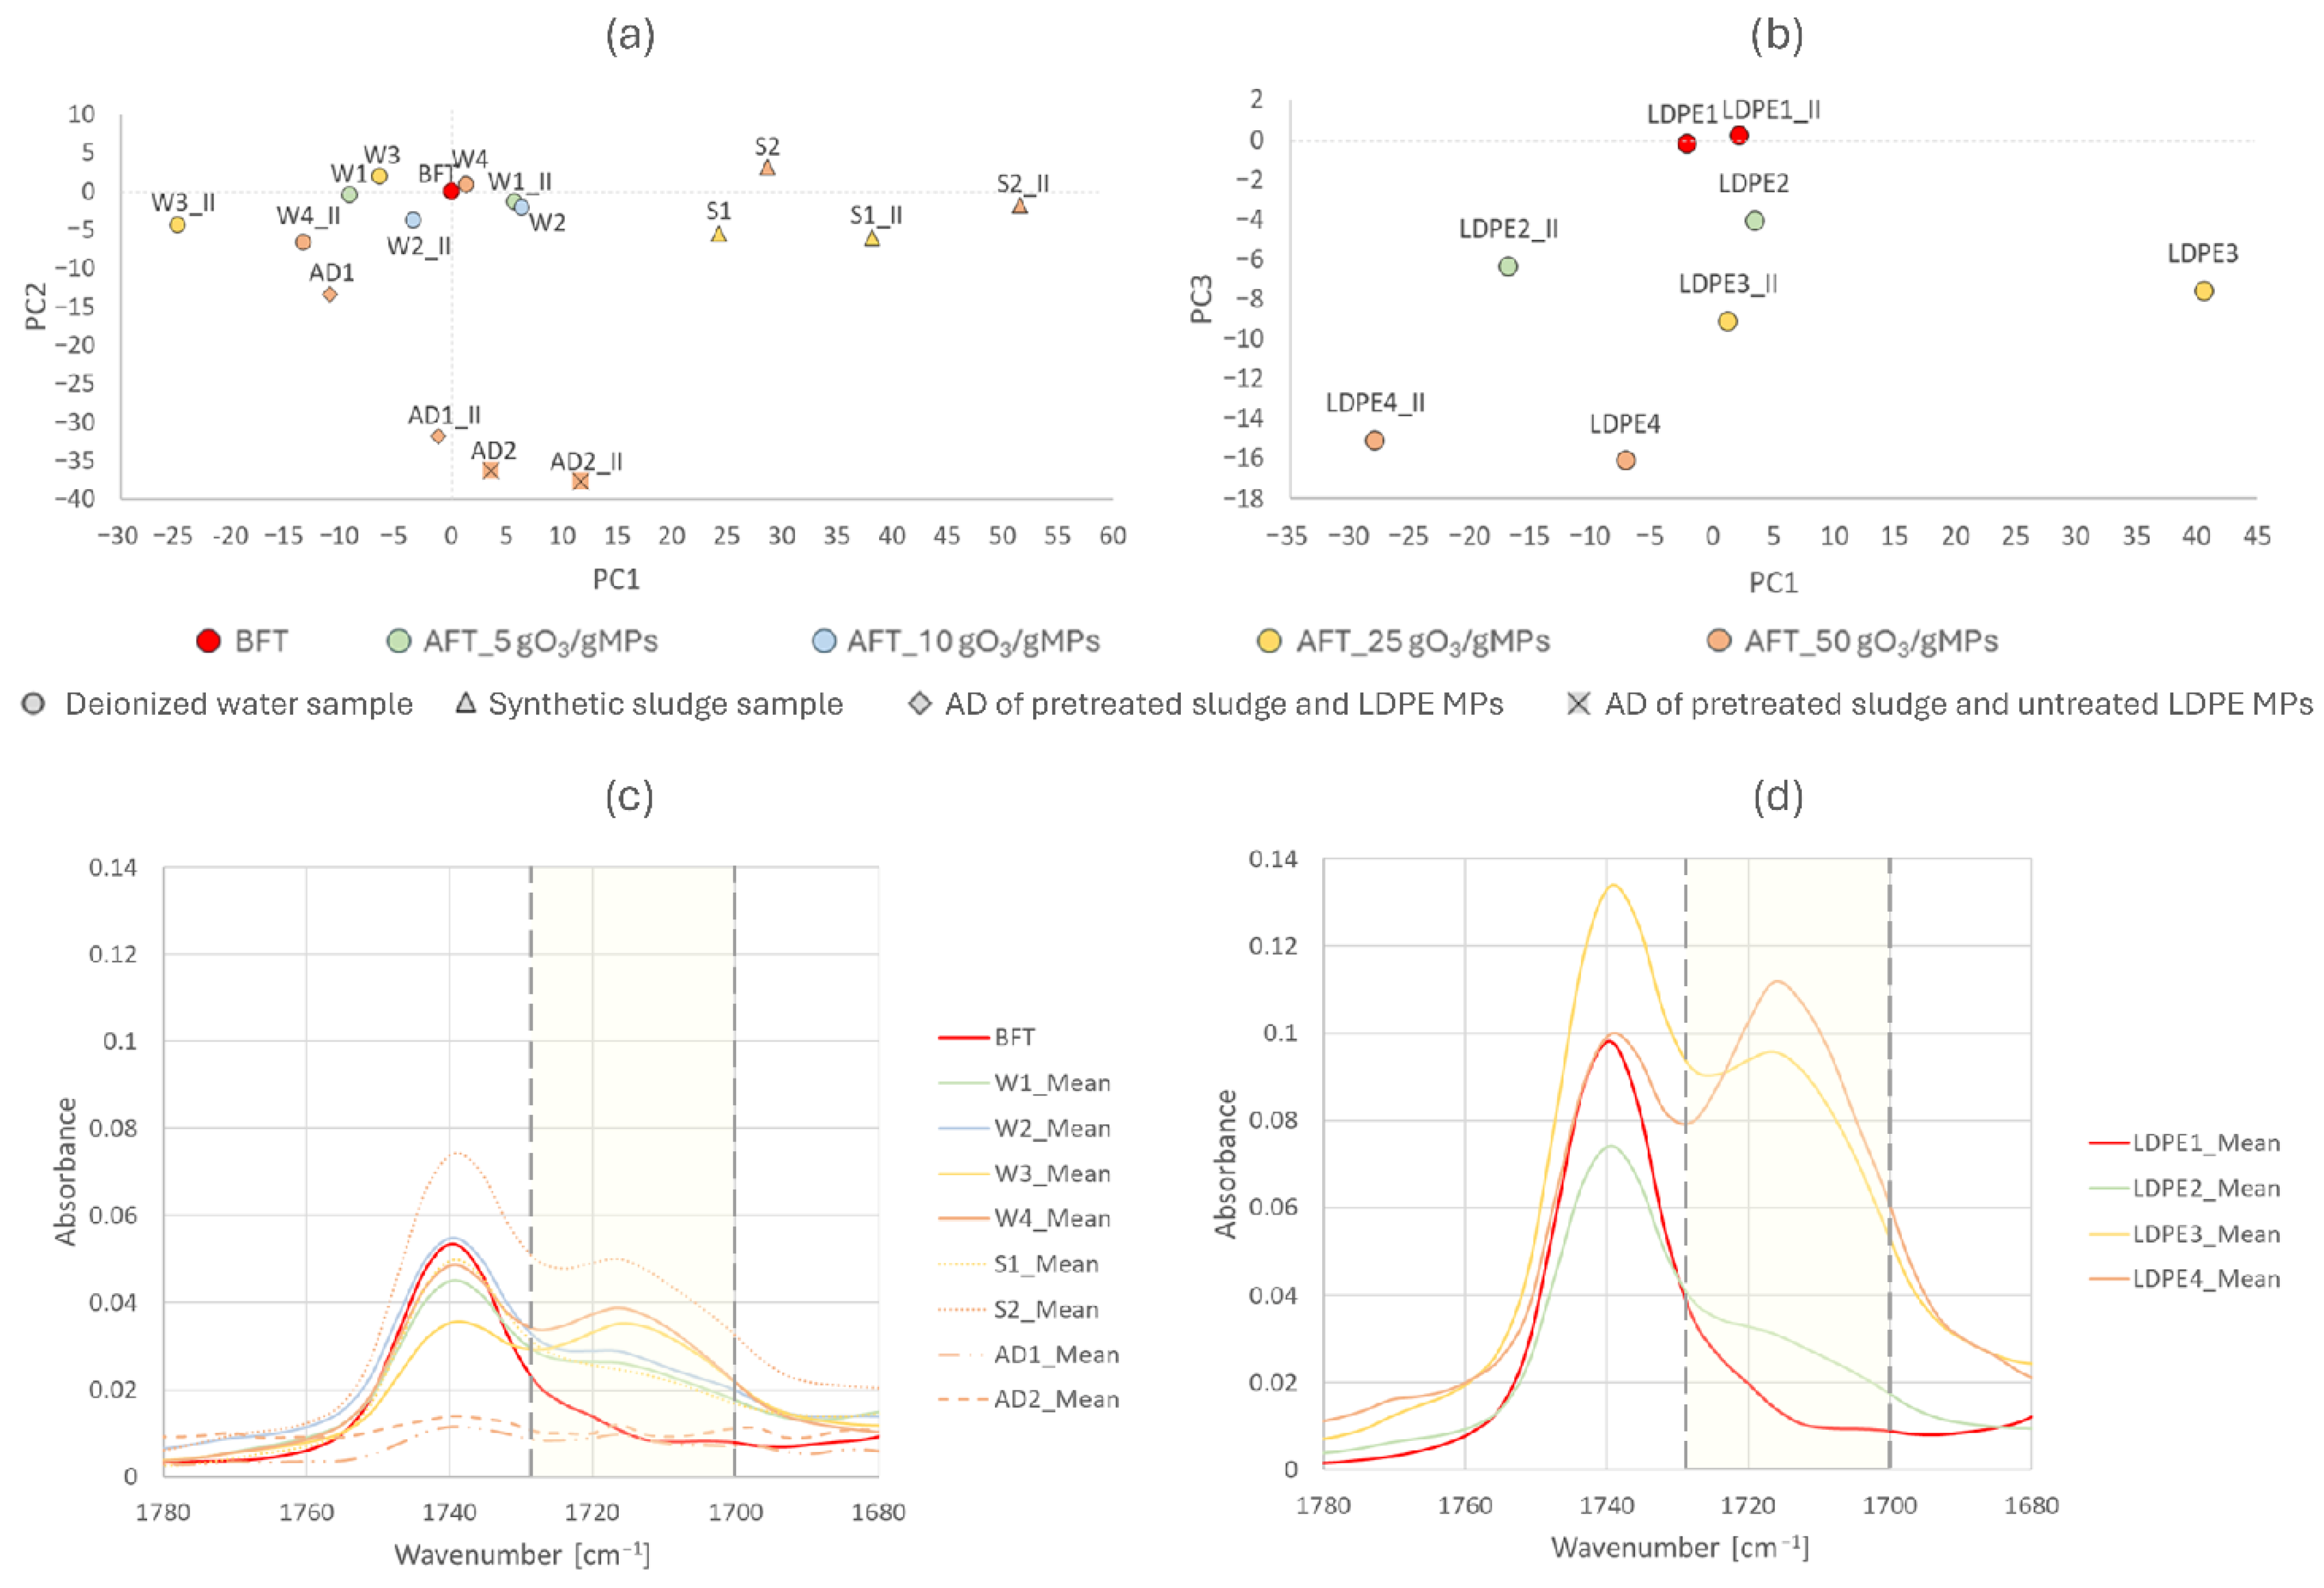
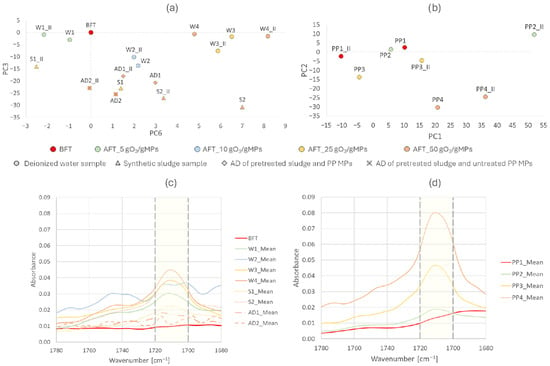
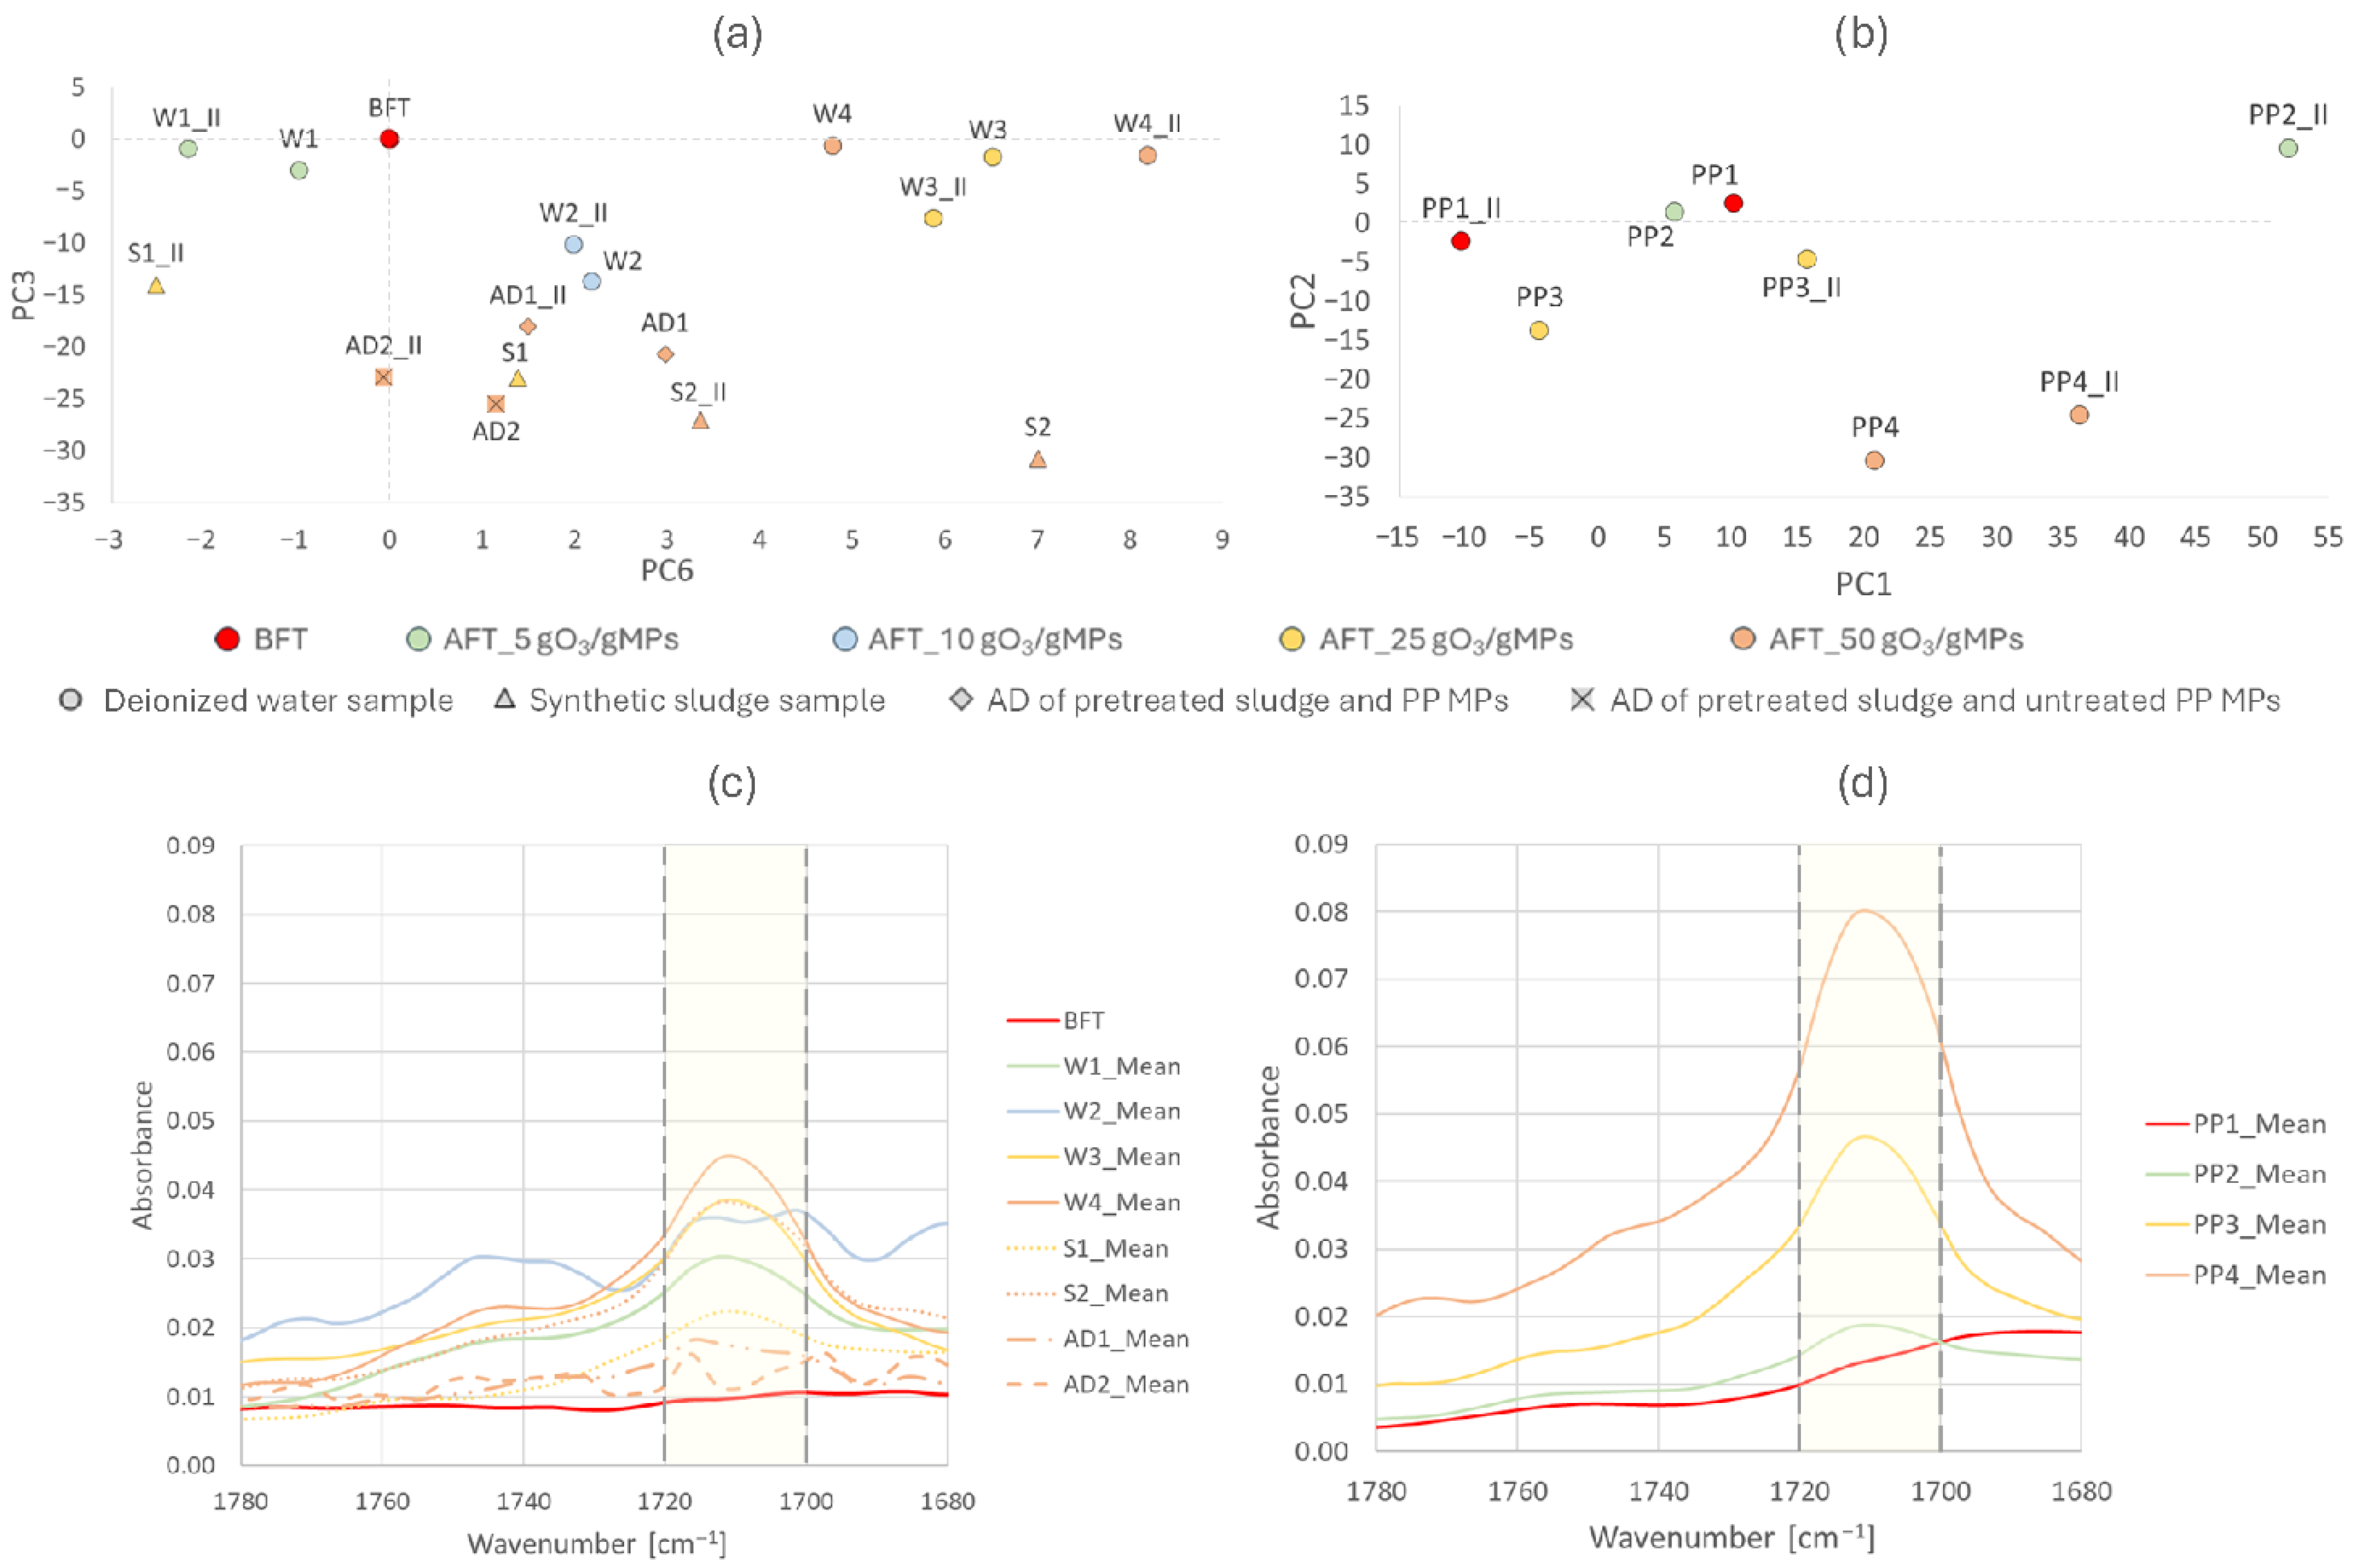
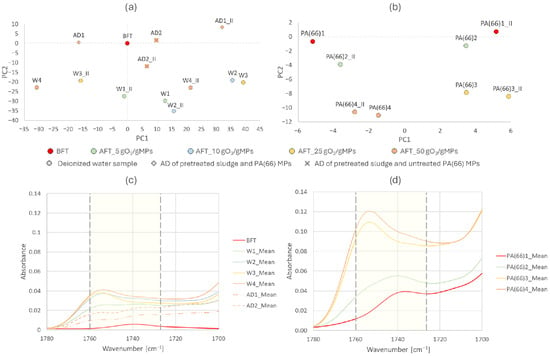
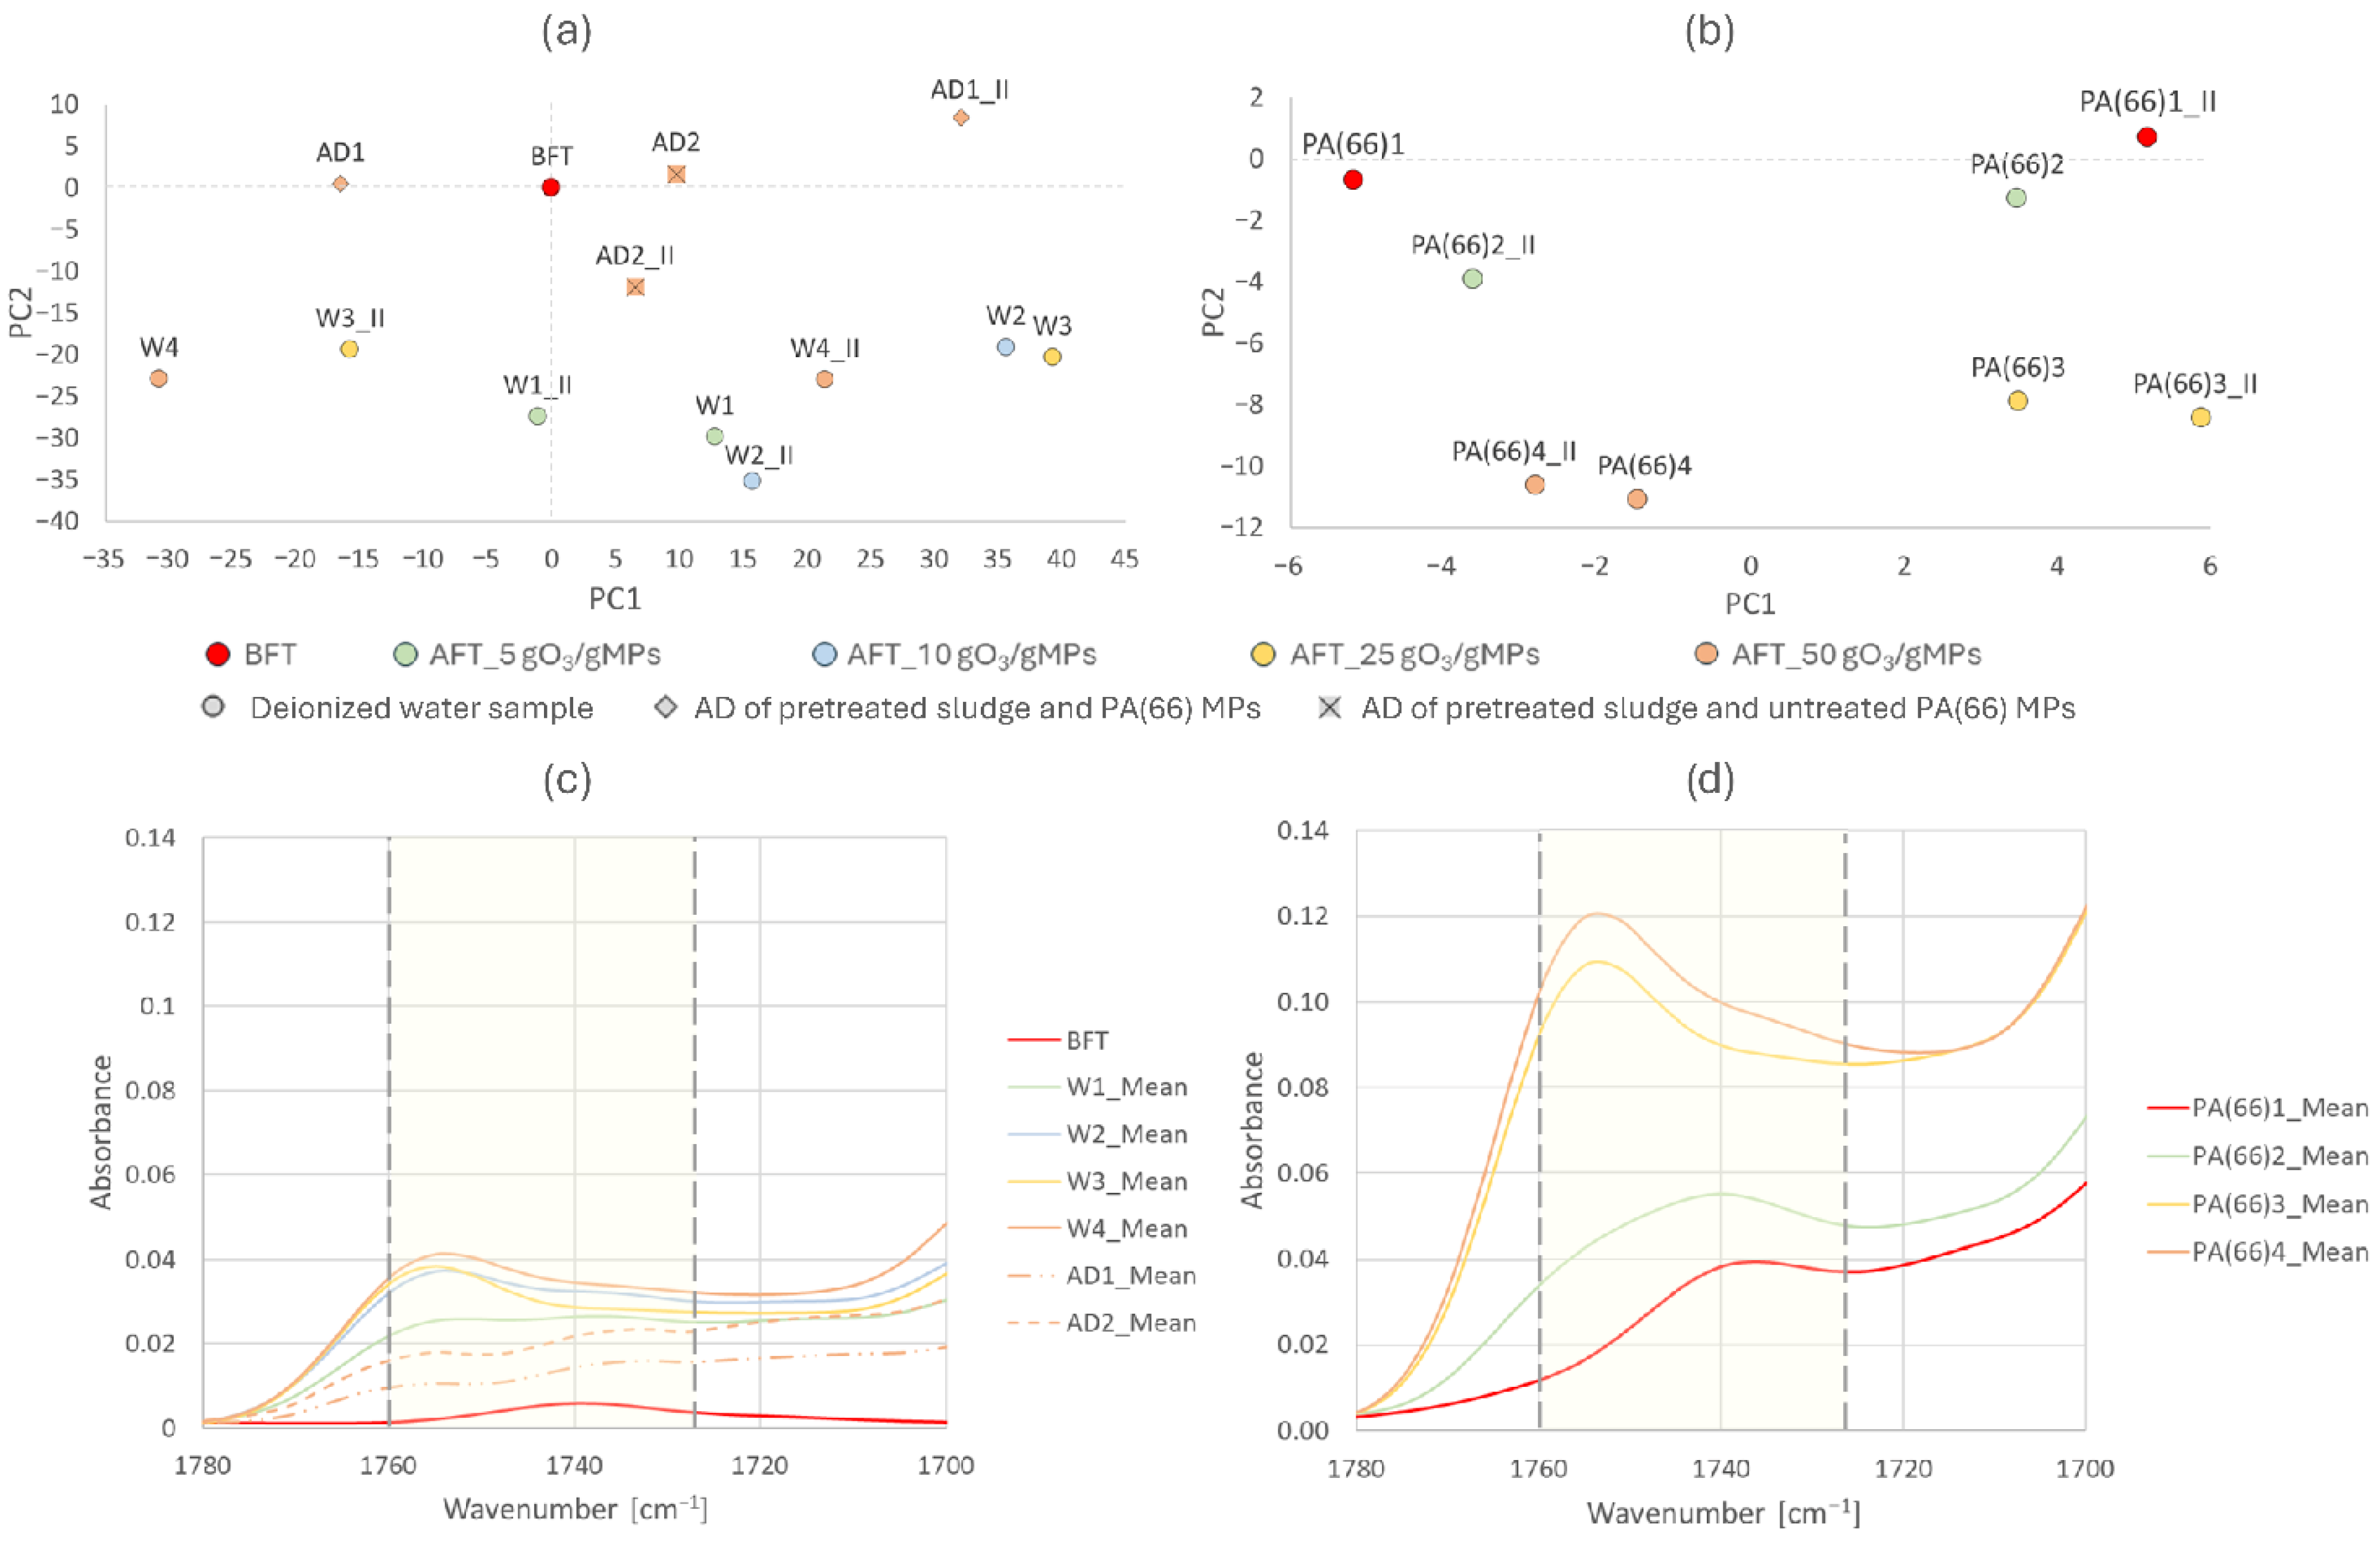
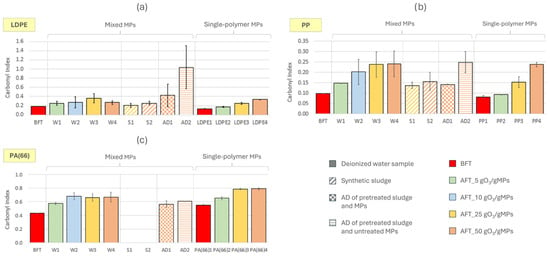
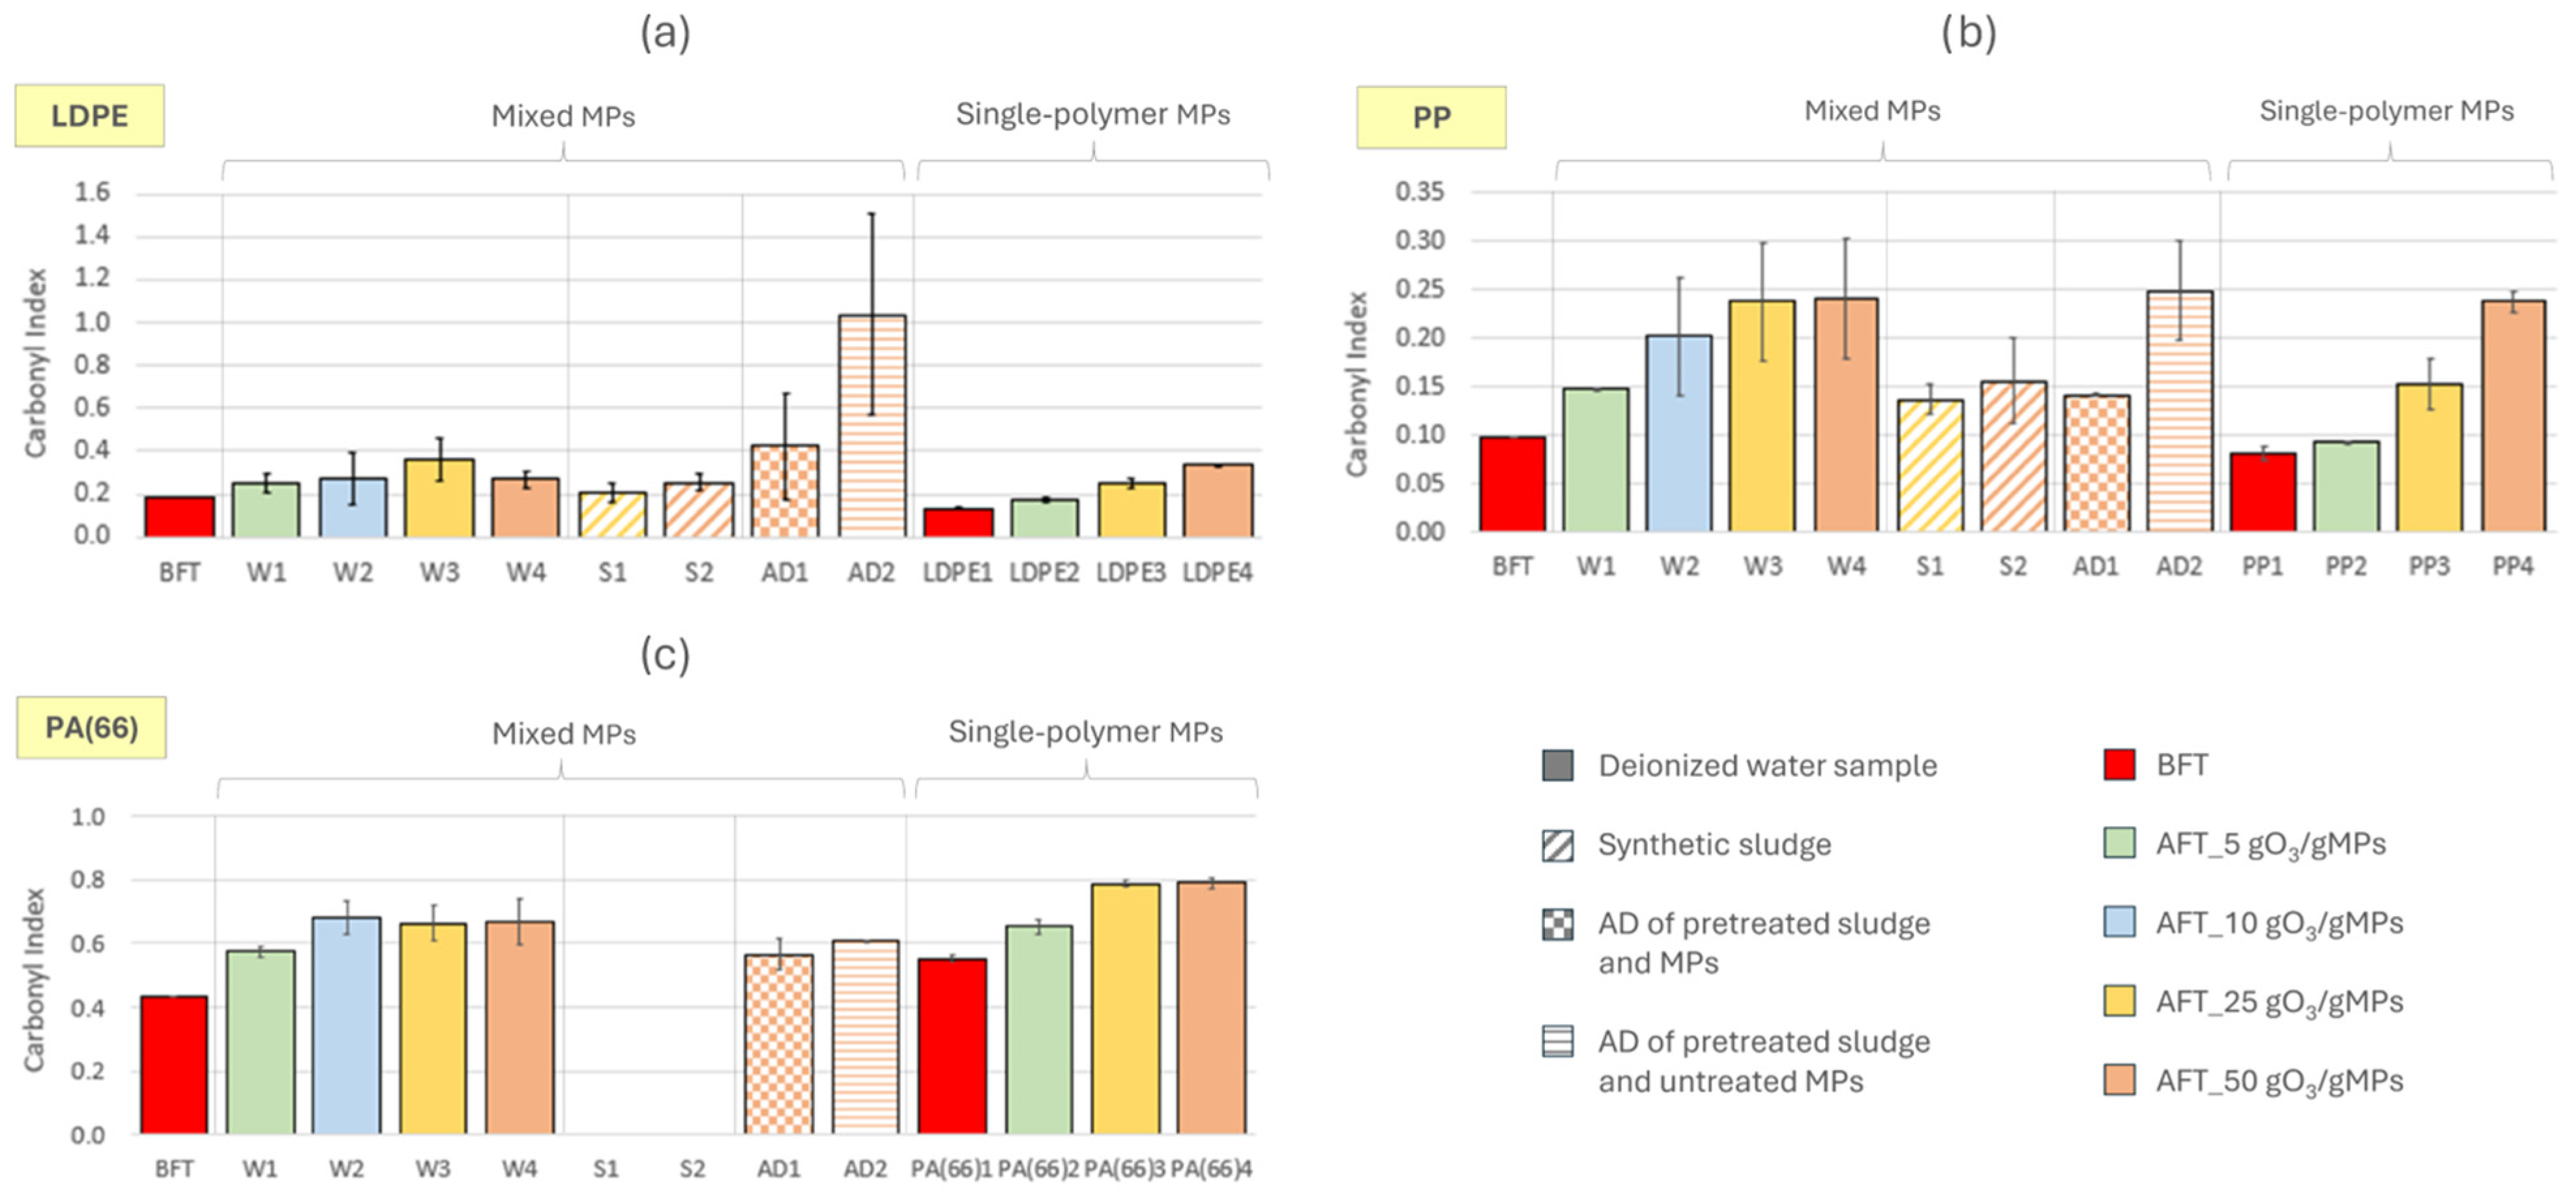

Disclaimer/Publisher’s Note: The statements, opinions and data contained in all publications are solely those of the individual author(s) and contributor(s) and not of MDPI and/or the editor(s). MDPI and/or the editor(s) disclaim responsibility for any injury to people or property resulting from any ideas, methods, instructions or products referred to in the content. |
© 2026 by the authors. Licensee MDPI, Basel, Switzerland. This article is an open access article distributed under the terms and conditions of the Creative Commons Attribution (CC BY) license.