


Abstract
Ilex guayusa Loes., an Amazonian holly cultivated by indigenous Kichwa communities, is valued for its caffeine-rich leaves (2.0–3.5% dry weight). However, industrial processing generates substantial by-products that remain undercharacterized and underutilized. This study provides baseline quantitative assessment and physicochemical characterization of guayusa processing residues from the Kallari cooperative (Napo, Ecuador) to explore their potential within a circular bioeconomy framework. Granulometric analysis showed that processing produces predominantly coarse material (>425 μm, 67.5%), while intermediate and fine fractions (<425 μm) account for 32.5% of total biomass. Comparative analysis of pooled fractions (n = 10 subsamples per fraction) did not show clear compositional differences across twelve physicochemical parameters (p > 0.05), suggesting relatively comparable compositional profiles within the analyzed material. Residues contained relevant bioactive compounds, including total phenolics (15.7–16.0 mg GAE g−1 DW) and condensed tannins (9.4–10.0 mg GAE g−1 DW). Preliminary caffeine analysis (n = 2 composite samples) indicated values of 1.89–2.09% DW. Correlation analysis showed a negative association between protein and tannins (r = −0.785, p = 0.007) and a positive relationship between fiber and tannins (r = 0.660, p = 0.038). Exploratory principal component analysis suggested structural–phenolic patterns, although results should be interpreted cautiously due to the limited sample size. At the cooperative scale (18–25 t yr−1), these residues represent 5.8–8.1 t yr−1 of underutilized biomass. While the findings suggest potential suitability for applications such as functional ingredients, bioactive extraction, and cosmetic formulations, further validation including independent biological replication, compound-specific profiling, and techno-economic assessment is required. This study establishes a baseline dataset to support future valorization strategies within Amazonian indigenous bioeconomy contexts.
1. Introduction
Guayusa (Ilex guayusa Loes.) is an evergreen tree native to the upper Amazon basin, where it has been cultivated for centuries across Ecuador, southern Colombia, and northern Peru [1,2]. Its current distribution is strongly associated with managed agroforestry systems rather than wild populations, reflecting long-term cultivation and propagation practices [1,3]. Ecologically, guayusa is typically grown within multistrata agroforestry systems (chakras), where it tolerates shaded understory conditions and is actively managed by local communities [2,3].
Ethnobotanical studies describe guayusa as a culturally and economically important species among Amazonian indigenous groups, particularly the Kichwa, where it is consumed as a stimulant infusion and used in ritual and daily contexts [1,4]. This long history of cultivation has led to its characterization as a semi-domesticated species, with human management influencing its distribution, genetic diversity, and integration into traditional agroforestry systems [2,5].
The cultivation and management of guayusa integrate with the chakra agroforestry system, a traditional polyculture practice employed by Kichwa communities that combines diverse plant species to promote agricultural biodiversity, ecological sustainability, and food sovereignty [2,6,7]. Women play a central role in managing these systems—referred to locally as mama chakra (mother of the agroforestry)—assuming responsibility for seed selection, plant propagation, intercropping design, and the transmission of agroecological knowledge across generations [8,9].
Guayusa leaves accumulate high concentrations of bioactive compounds, with caffeine as the dominant alkaloid (2.0–3.5% dry weight, approximately 95–136 mg g−1 in aqueous extracts) [10], exceeding levels found in yerba mate (Ilex paraguariensis) and approaching those of coffee [9,11]. This high caffeine content makes guayusa a potent natural stimulant with documented central nervous system effects [3,12]. Beyond caffeine, the phytochemical profile includes theobromine, chlorogenic acid derivatives (predominantly 5-caffeoylquinic acid and dicaffeoylquinic acid isomers), and a diverse array of flavonoids, condensed tannins, terpenes, and carotenoids [7,9]. These chlorogenic acids account for a substantial fraction of total phenolic content and contribute significantly to the antioxidant activity of guayusa extracts, which has been reported to exceed that of green tea [11,13].
Collectively, these bioactive constituents underpin guayusa’s documented pharmacological activities, including central nervous system stimulation, antioxidant protection, glycemic regulation, antimicrobial action, and potential cosmetic applications. The combination of high caffeine content with a robust polyphenolic profile positions guayusa as a potentially valuable botanical resource for functional foods, nutraceuticals, and natural product development.
Despite these advances, the agroindustrial development of guayusa faces sustainability challenges. Commercial processing operations generate substantial quantities of organic by-products that are frequently underutilized [14]. These processing residues often retain valuable bioactive and functional compounds comparable to those found in the primary commercial product [14,15]. Food processing by-products are increasingly recognized as low-cost, sustainable sources of functional ingredients that can be recovered and incorporated into value-added products, offering both economic and environmental benefits [15].
The circular economy paradigm offers a framework to transform agroindustrial residues from waste liabilities into value-generating inputs through strategies that maximize resource efficiency, minimize environmental impacts, and create closed-loop production systems [16,17]. In the Amazonian bioeconomy context, residue valorization aligns with principles of sustainable biodiversity utilization, indigenous economic empowerment, and climate change mitigation through reduced waste generation [18,19].
Successful valorization models for botanically and chemically similar agroindustrial residues provide relevant precedents. Coffee processing by-products (husks, pulp, silverskin) have been developed into functional food ingredients, antioxidant extracts, and biofuel substrates [20]; tea processing residues have been valorized for polyphenol extraction and animal feed supplementation; and cocoa pod shells have been transformed into dietary fiber sources, natural colorants, and bioactive compound concentrates [21]. These examples suggest that processing residues often retain significant portions of the bioactive compounds present in primary products, rendering them suitable for diverse applications in food, pharmaceutical, cosmetic, and energy sectors.
Despite growing scientific interest in guayusa leaf composition and bioactivity [12,22,23], the physicochemical characteristics, nutritional composition, and valorization potential of processing residues remain poorly documented. This knowledge gap limits the development of evidence-based circular economy strategies for guayusa-producing cooperatives and restricts opportunities to capture economic value from currently discarded biomass fractions. Characterization of residue properties is essential to identify retained bioactive compounds, assess quality parameters relevant to potential applications, and match residue characteristics to specific end-uses. Such information is particularly relevant for functional food development, where bioactive-rich plant residues may serve as ingredients providing nutritional enhancement, natural flavoring, antioxidant fortification, or functional properties in food matrices [24].
This study provides an exploratory characterization of guayusa processing residues, addressing a gap in the literature. While previous research has focused on whole-leaf composition and bioactivity, residue generation rates during industrial processing and physicochemical properties of particle-size fractions have not been quantified. This study (1) provides a quantitative assessment of granulometric distribution and by-product generation in an operational facility; (2) generates comparative data on physicochemical properties, nutritional composition, and bioactive compound retention across particle-size fractions; (3) applies multivariate statistical approaches to explore compositional patterns; and (4) frames findings within circular economy and indigenous bioeconomy contexts, addressing practical needs of small-scale Amazonian cooperatives.
To address these knowledge gaps and enable evidence-based valorization strategies, a comprehensive characterization framework is required. This framework integrates: (1) quantification of residue generation by particle-size fractions in the guayusa processing chain at Kallari cooperative; (2) comprehensive characterization of the physicochemical properties, nutritional composition, and bioactive compound content of these residues; and (3) evaluation of their potential for valorization within circular economy applications, particularly for functional food development.
2. Materials and Methods
2.1. Study Site
This study was conducted in Kallari cooperative (Asociación Agroartesanal de Producción de Bienes Agrícolas y Pecuarios de Napo), located in Tena Canton, Napo Province, within the Ecuadorian Amazon region (0°59′ S, 77°49′ W; approximately 500 m above sea level). The region is characterized by a humid tropical climate with annual temperatures ranging from 23.5 to 24.6 °C. Precipitation is high throughout the year, with a peak period occurring between March and May (414.3–451.7 mm), whereas relatively lower precipitation is recorded in August and September (264.5–298.4 mm) [25]. Kallari is a grassroots Indigenous cooperative comprising 333 smallholder producers dedicated to the cultivation of cacao, vanilla, and guayusa within traditional chakra agroforestry systems. These traditionally managed agroforestry ecosystems span an estimated area of 7791.17 hectares, with 673.68 hectares certified as a climate-resilient agricultural land.
The cooperative operates local facilities in Tena for post-harvest handling, including drying, milling, and granulometric classification of guayusa leaves destined primarily for international export markets. The industrial processing chain—encompassing harvesting, washing, dehydration, milling, and particle-size classification—generates variable quantities of processing by-products depending on buyer specifications. Unlike standardized tea commodities with defined granulometric grades, guayusa processing adapts particle-size distribution according to buyer-specific requirements negotiated prior to each production run. Buyers targeting premium loose-leaf tea markets typically specify coarser particles (generally >425 μm), which may result in the accumulation of finer fractions (<425 μm) as processing by-products. Conversely, buyers requiring powdered products or functional food ingredients may accept or prefer fine particles, potentially leaving coarser material underutilized. Additional rejection criteria include heterogeneous granulometry, oxidative discoloration, stem contamination, or elevated moisture content.
Preliminary internal assessments indicate that approximately 25–35% of processed biomass accumulates as by-products during typical quality control procedures, representing a potential economic limitation for producer organizations but also an emerging environmental management challenge in remote Amazonian production contexts. At present, these by-product fractions are commonly managed through low-value practices such as composting or land application, thereby limiting opportunities for the recovery and valorization of bioactive compounds retained within these plant materials.
Annual processing volume ranges from 18 to 25 metric tons of dried guayusa leaves, representing production from approximately 333 member families operating diversified agroforestry (chakra) systems, with guayusa cultivated at low densities (100–200 trees per hectare) in association with other crops.
2.2. Sample Collection and Preparation
2.2.1. Sampling Strategy and Processing Workflow
Processed guayusa leaf material was collected from Kallari’s cooperative processing facility (Tena, Ecuador) in December 2024. The samples consisted of composite material aggregated from multiple production batches processed during a two-week period, reflecting typical operational processing conditions within the cooperative’s supply network. This sampling approach was designed to capture representative material from the cooperative’s standard production stream rather than to assess inter-batch or inter-field variability.
The cooperative produces loose-leaf tea products through a standardized processing chain: fresh guayusa leaves harvested from mature plants in member chakras undergo (1) manual selection to remove damaged leaves and foreign material; (2) washing with potable water; (3) forced-air drying at 45–50 °C for 18–24 h until moisture content reaches 6–8%; and (4) mechanical milling using a hammer mill followed by air classification.
Unlike standardized tea commodities with defined granulometric specifications, guayusa processing lacks industry-wide particle-size standards. The cooperative adapts particle-size distribution according to buyer-specific requirements established prior to each production run. Buyers targeting premium loose-leaf tea markets typically specify coarser particles (generally >425 μm), while those producing tea bags or functional food ingredients may accept or prefer finer fractions. Depending on contracted specifications, either coarse or fine particles may accumulate as processing by-products.
2.2.2. Quantification of Residue Generation by Granulometry
To quantify the mass distribution of particle-size fractions generated during guayusa leaf processing, nine replicate laboratory sieving analyses were performed using standardized protocols. Each replicate consisted of 160.0 ± 0.01 g of dried, milled guayusa leaves obtained from the industrial processing line. Material was loaded onto the uppermost sieve (425 μm aperture) of a three-tier sieve stack and subjected to mechanical agitation for 10 min to ensure complete particle separation. Following sieving, the mass retained on each screen was determined gravimetrically using a calibrated analytical balance (±0.01 g precision) (Camry EK3252, China):
- Coarse fraction (R1): Material retained on 425 μm screen;
- Intermediate fraction (R2): (300–425 μm): processing by-product;
- Fine fraction (R3): (<300 μm): processing by-product.
The percentage of each fraction was calculated as:
2.3. Fraction Pooling and Subsampling Strategy
Physicochemical analysis was conducted on two pooled fractions: intermediate-fine (<425 μm, combining the 300–425 μm and <300 μm size classes) and coarse (>425 μm). This pooling strategy was adopted because (1) intermediate and fine fractions collectively represented a smaller proportion of total material (32.5%), limiting availability for separate analysis of each size class, and (2) preliminary visual inspection suggested similar physical characteristics between the two smaller fractions.
Ten (10) analytical subsamples were obtained from each pooled fraction and processed separately to characterize within-sample analytical variability. These measurements do not represent independent biological replicates but repeated analytical observations of composite material.
Accordingly, this experimental design supports compositional characterization of representative processed material but does not permit statistical inference regarding variability across production batches, cultivation sites, or temporal conditions.
All analyses were performed at the Science Laboratory, Escuela Superior Politécnica de Chimborazo (Riobamba, Ecuador), following standardized protocols described in the corresponding sections.
2.3.1. Apparent Bulk Density Determination
The apparent bulk density (loose, uncompacted) of the solid guayusa residue fractions was determined using the graduated cylinder method. Dried samples (15–17 g) were weighed using an analytical balance (Camry EK3252, China; max 5 kg, ±0.01 g) to obtain mass (m). Each sample was then gently transferred into a 100 mL graduated cylinder (Glassco, India; ±1.0 mL, calibrated at 20 °C) without compaction or tapping.
The volume occupied by the sample (V) was recorded directly from the cylinder graduations. Apparent bulk density (p) was calculated as:
where p is expressed in g cm−3 (equivalent to g mL−1). All measurements were conducted at ambient laboratory temperature (20 ± 2 °C).
2.3.2. Electrical Conductivity Determination
Electrical conductivity was measured using a calibrated conductivity meter (Thermo Orion, USA; AUTO-READ function) with automatic temperature compensation. The instrument was calibrated using standard conductivity solutions (84 μS/cm and 1413 μS/cm at 25 °C) before each measurement session.
Aqueous extracts were prepared following the same protocol described for pH determination (3.0 g sample + 45 mL distilled water, shaking 30 min, centrifugation 5 min at 3000 rpm). The conductivity probe was immersed in the clarified supernatant, and readings were recorded after stabilization. Results are expressed in microsiemens per centimeter (μS/cm) at the measurement temperature (20 ± 2 °C). The electrode was rinsed thoroughly with distilled water between measurements.
2.3.3. pH Determination
pH measurements were performed using a calibrated digital pH meter (Thermo Orion, USA; AUTO-READ function with timed stabilization intervals). The instrument was calibrated daily using standard buffer solutions at pH 4.00, 7.00, and 10.00 (NIST-traceable) before each measurement session.
For solid residue samples, aqueous extracts were prepared by mixing 3.0 g of homogenized sample with 45 mL of distilled water (1:15 w/v ratio) in 50 mL centrifuge tubes. Samples were homogenized using an orbital shaker (ISOCIDE, China) at 200 rpm for 30 min at room temperature (20 ± 2 °C), then centrifuged (ORTO Alresa, Spain) at 3000 rpm for 5 min. The supernatant (approximately 35 mL) was decanted into clean beakers, and the pH electrode was immersed directly in the supernatant. pH readings were recorded after signal stabilization (typically 30–60 s). The electrode was rinsed with distilled water and blotted dry between measurements.
2.3.4. Moisture Content and Dry Matter Determination
Moisture content of residue samples was determined by thermogravimetric analysis using a halogen moisture analyzer (RADWAG, Poland; Balance and Scales, precision ±0.001%). Approximately 3.0 g of homogenized sample was placed on the aluminum pan after instrument taring. The analysis was performed under controlled heating conditions (105 °C) with automatic termination when mass loss stabilized (change < 0.1 mg over 90 s), indicating complete moisture evaporation. Moisture content was recorded directly as percentage mass loss. Dry matter content was calculated by difference:
Dry matter (%) = 100 − Moisture (%)
2.3.5. Ash Content Determination
Ash content (total inorganic residue) was determined by dry ashing following AOAC Official Method 923.03 with minor modifications. Empty porcelain crucibles were pre-dried in a forced-air oven (ESCO Isotherm, Singapore: max 300 °C) at 100 °C for 1 h, cooled in a desiccator containing anhydrous silica gel, and weighed to obtain tare mass (W1).
Approximately 3.0–5.0 g of homogenized sample was accurately weighed into pre-tared crucibles (W2 = mass of crucible + sample). Crucibles were initially heated gently on a hot plate under a fume hood (Fume Hood FH1000(X), China; 110 V ± 10%) to volatilize organic compounds and prevent flaming, continuing until smoke emission ceased (typically 30–45 min). Subsequently, crucibles were transferred to a muffle furnace (AIKEN ROAD, China; max 1200 °C) and subjected to incineration at 550 ± 25 °C for 3 h until a white or light gray ash residue was obtained, indicating complete combustion of organic matter. After ashing, crucibles were cooled to approximately 250 °C in the furnace, then transferred to a desiccator and cooled to room temperature before final weighing (W3 = mass of crucible + ash).
Ash content was calculated as:
2.3.6. Organic Matter Determination
Organic matter content was calculated by difference, assuming complete recovery of inorganic material as ash:
Organic matter (%) = 100 − Ash (%)
2.3.7. Crude Fiber Determination
Crude fiber content was determined using a semi-automated fiber analysis system (ANKOM 200 Fiber Analyzer, ANKOM Technology, Macedon, NY, USA) following a sequential acid–base digestion procedure based on AOAC Official Method 978.10.
Approximately 0.5 g of dried and finely ground sample (particle size < 1 mm) was accurately weighed (W2) and placed into heat-sealed filter bags (ANKOM F57, Macedon, NY, USA; pore size ~25 µm, pre-weighed as W1). The sealed bags were subjected to sequential digestion with 2.0 L of sulfuric acid solution (H2SO4, 0.255 N) followed by 2.0 L of sodium hydroxide solution (NaOH, 0.313 N), each at boiling temperature (~100 °C) for 40 min under continuous agitation.
After digestion, the bags were thoroughly rinsed with hot distilled water (3 × 500 mL) to remove residual reagents and then immersed in acetone for 10 min to eliminate soluble organic compounds. The bags were dried in a forced-air oven at 105 °C until constant weight, cooled in a desiccator, and weighed (W3).
Subsequently, the bags were transferred to pre-weighed porcelain crucibles and ashed in a muffle furnace at 550 °C for 3 h. After cooling in a desiccator, the crucibles were weighed again (W4).
Crude fiber content was calculated as:
where (W3 − W4) represents the mass of organic residue remaining after acid–base digestion and ash correction.
2.3.8. Crude Protein Determination
Crude protein content was determined by the Kjeldahl method (AOAC Official Method 2001.11) using an automated Kjeldahl digestion and distillation apparatus (Germany). Approximately 0.5 g of dried, finely ground sample was accurately weighed into Kjeldahl digestion tubes. Digestion catalyst mixture (2.0 g anhydrous potassium sulfate + 0.2 g copper sulfate pentahydrate) and 15 mL of concentrated sulfuric acid (95–98%, analytical grade) were added to each tube. Samples were digested at 420 °C for approximately 2 h until the digest became clear and colorless, indicating complete conversion of organic nitrogen to ammonium sulfate.
After cooling to room temperature, digests were quantitatively transferred to the distillation apparatus. Distillation was performed by adding 50 mL of sodium hydroxide solution (40% w/v) to liberate ammonia, which was steam-distilled into 50 mL of boric acid solution (2% w/v) containing mixed pH indicators (methyl red and bromocresol green). Distillation proceeded for 6 min, collecting approximately 150 mL of distillate. The ammonia trapped in boric acid was titrated with standardized hydrochloric acid solution (0.1 N) to a gray endpoint, with the volume of titrant recorded.
Total nitrogen content was calculated from the titration volume, and crude protein content was estimated using the nitrogen-to-protein conversion factor of 6.25 (assuming average nitrogen content of 16% in plant proteins):
2.3.9. Crude Fat Determination
Crude fat (total lipid) content was determined by an automated Soxhlet system (Gerhardt SOXTHERM SOX414, Germany) using n-hexane as the extraction solvent. Approximately 15 g of dried, ground sample was weighed and placed in cellulose extraction thimbles (Whatman, 33 × 80 mm).
Thimbles were placed in a Soxhlet extraction apparatus connected to pre-weighed, dried round-bottom flasks (W1) containing 250 mL of n-hexane (analytical grade, 95% purity). Extraction was performed under reflux conditions for 4 h at a condensation rate of 5–6 drops per second, ensuring continuous extraction of lipophilic compounds.
Following extraction, thimbles were removed, and the solvent was recovered using a rotary evaporator (BÜCHI Rotavapor R-210, Switzerland) operated at 50 °C and 60 rpm under reduced pressure until complete solvent removal. Flasks containing extracted fat were dried in an oven at 105 °C for 1 h to remove residual moisture and solvent, cooled in a desiccator, and weighed (W2).
Crude fat content was calculated as:
2.3.10. Total Phenolic Content Determination
Total phenolic content was determined using the Folin–Ciocalteu spectrophotometric method adapted from Singleton and Rossi [26]. Aqueous extracts were prepared by mixing 1.0 g of finely ground sample with 10 mL of distilled water, homogenizing for 30 min at room temperature, and centrifuging at 3000 rpm for 10 min. The supernatant (200 μL) was mixed with 1.0 mL of diluted Folin–Ciocalteu reagent (1:10 v/v with distilled water) and allowed to react for 5 min. Subsequently, 800 μL of sodium carbonate solution (7.5% w/v) was added to neutralize the acidic conditions and develop the blue chromophore. The reaction mixture was incubated in darkness at room temperature for 2 h, and absorbance was measured at 765 nm using a UV-Vis spectrophotometer (Thermo Scientific Evolution 201, USA) against a reagent blank. Total phenolic content was quantified using a calibration curve prepared with gallic acid standards (0–500 μg/mL) and expressed as mg gallic acid equivalents per gram of dry sample (mg GAE/g DW).
2.3.11. Tannin Content Determination
Tannin content was determined using a modified Folin–Ciocalteu method incorporating polyvinylpolypyrrolidone (PVPP) precipitation to differentiate condensed tannins from other phenolic compounds. Two parallel extracts were prepared: (1) total phenolics extract (as described in 2.5.10), and (2) non-tannin phenolics extract, prepared by treating the aqueous extract with 100 mg of PVPP, which selectively binds and precipitates tannins. After 15 min of mixing and centrifugation, the supernatant containing non-tannin phenolics was analyzed using the Folin–Ciocalteu method.
Tannin content was calculated by difference:
Tannins = Total phenolics − non-tannin phenolics
Results are expressed as mg gallic acid equivalents per gram of dry sample (mg GAE/g DW)
2.3.12. Gelatinization Temperature Determination
Gelatinization temperature was determined by a simplified heating method. One gram of finely ground sample was mixed with 10 mL of distilled water in a glass beaker. The mixture was heated gradually on a temperature-controlled hot plate (ISOLAB, Germany) with continuous magnetic stirring at 200 rpm. Temperature was monitored using a calibrated thermometer (±0.5 °C precision) immersed in the mixture. The gelatinization temperature was recorded as the temperature at which the mixture exhibited a noticeable increase in viscosity, indicated by resistance to stirring and visible thickening, signaling the onset of starch gelatinization. This parameter provides exploratory information on potential thermal processing behavior.
2.3.13. Soluble Solids Content (°Brix) Determination
Soluble solids content was measured using a digital refractometer (KEM RA-620, Japan) calibrated with distilled water (0.0 °Brix) and operated at ambient temperature (20–25 °C). For solid samples, aqueous extracts were prepared by mixing 3.0 g of sample with 45 mL of distilled water (1:15 w/v), homogenizing with orbital shaking for 30 min, and centrifuging at 3000 rpm for 5 min. A drop of clarified supernatant was placed on the prism surface, and the measurement was recorded after automatic temperature compensation. Results are expressed as degrees Brix (°Bx), representing the mass percentage of dissolved solids in the aqueous extract. The prism was cleaned with distilled water and dried with lint-free tissue between measurements.
2.3.14. Preliminary Caffeine Quantification
Indicative caffeine quantification was performed by high-performance liquid chromatography with UV detection (HPLC-UV) to obtain indicative values for comparative assessment with published whole-leaf data. Due to resource constraints, two composite samples per fraction were analyzed (n = 2), representing duplicate technical measurements rather than biological replication. These data should be interpreted as exploratory indicators of caffeine retention patterns; formal statistical validation would require larger datasets with independent biological replication and full method validation.
Detailed analytical protocol: Dried residue samples (5.0 g) were extracted with 50 mL of 70% aqueous methanol under ultrasonic agitation (40 kHz, 30 min at 25 °C). Extracts were filtered (0.45 μm PTFE), and 20 μL aliquots were analyzed using an Agilent 1260 Infinity HPLC system equipped with a C18 reversed-phase column (250 mm × 4.6 mm, 5 μm particle size; Phenomenex Luna, Torrance, CA, USA). Mobile phase consisted of water: acetonitrile (85:15, v/v, isocratic) at a 1.0 mL min−1 flow rate. Column temperature was maintained at 30 °C. Caffeine was detected at 272 nm with a retention time of approximately 6.2 min.
Calibration and quantification: External calibration was performed using caffeine standard (≥99% purity, Sigma-Aldrich, St. Louis, MO, USA) at concentrations ranging from 10 to 200 mg L−1 (R2 = 0.9998, n = 6). Peak identification was confirmed by retention time matching and UV spectral comparison with the authentic standard. Caffeine content was calculated as a percentage of dry weight basis after correction for extraction recovery (estimated at 90% based on preliminary spiking recovery assessments).
2.4. Statistical Analysis
Statistical analyses were performed to describe the variability of physicochemical parameters in guayusa residue subsamples. All analyses were conducted using Jamovi statistical software (version 2.3.6, The Jamovi Project, Sydney, Australia). Data are reported as mean ± standard deviation (SD), along with median, minimum, and maximum values to characterize distribution patterns.
The analyzed samples correspond to subsamples obtained from composite processed fractions and therefore represent technical replicates rather than independent biological samples. Consequently, statistical comparisons (t-tests, correlation analysis, and PCA) are used here as exploratory tools to assess patterns of variability within the analyzed material. These analyses are not intended to support population-level inference across different production batches, cultivation sites, or seasons.
2.4.1. Normality and Variance Homogeneity Assessment
Data distributions were evaluated using the Shapiro–Wilk test for each variable within each fraction (intermediate-fine and coarse). Homogeneity of variance between fractions was assessed using Levene’s test.
2.4.2. Comparative Analysis Between Fractions
Exploratory comparisons between intermediate-fine and coarse residue fractions were conducted using independent-samples Student’s t-tests. Given the nature of the dataset (technical replicates derived from pooled material), these comparisons are intended to describe observed differences within the analyzed samples rather than to test inferential hypotheses regarding independent biological populations. The significance threshold (α = 0.05) is reported as a reference for interpreting relative differences.
2.4.3. Correlation Analysis
Relationships among chemical composition variables within the analyzed dataset were explored using Pearson correlation coefficients within the pooled dataset from both fractions. The analysis focused on key variables (crude protein, crude fat, crude fiber, total phenolic compounds, and total tannins) to identify potential compositional patterns. Reported p-values are provided as descriptive indicators of association strength within the dataset rather than as evidence of generalizable relationships.
2.4.4. Principal Component Analysis (PCA)
Exploratory Principal Component Analysis (PCA) was performed on the standardized chemical composition dataset to explore multivariate compositional patterns within the analyzed samples. Prior to PCA, all variables were standardized (z-score transformation: mean = 0, standard deviation = 1) to ensure comparability across parameters with different units and scales.
The PCA was conducted using the correlation matrix of selected chemical variables from the pooled dataset (N = 20 subsamples). Components were retained based on eigenvalues greater than 1 (Kaiser criterion). Component loadings were examined to evaluate the relative contribution of each variable, and the percentage of total variance explained was used to describe the structure of the dataset.
Given that the dataset is composed of subsamples derived from composite processed fractions, the PCA should be interpreted as an exploratory analysis of within-sample variability rather than as a representation of independent population structure. Additionally, the limited sample size (N = 20) further restricts the robustness of multivariate interpretation. Therefore, the identified patterns should be considered preliminary and require validation using larger datasets with independent biological replication.
3. Results
3.1. Granulometric Distribution of Processing Residues
Nine replicate laboratory sieving analyses were conducted to quantify the particle-size distribution of processed guayusa material. Each trial used 160.0 g of dried material separated through a three-tier sieve stack (425 μm, 300 μm, and <300 μm mesh openings). Results showed consistent mass distribution across the three fractions (Table 1).
Table 1.
Particle-size distribution of guayusa processing residues from composite pooled material (n = 9 laboratory sieving replicates).
The coarse fraction (>425 μm) accounted for 67.5 ± 0.9% of total mass (108.00 ± 1.41 g), representing the material currently commercialized as a loose-leaf tea product. The intermediate fraction (300–425 μm) comprised 11.9 ± 0.5% (19.11 ± 0.78 g), while the fine fraction (<300 μm) represented 20.6 ± 0.9% (32.89 ± 1.45 g). Combined, the intermediate and fine fractions constituted 32.5% of processed biomass.
Separation reproducibility was high across all fractions, with coefficients of variation ranging from 1.3% (coarse) to 4.4% (fine). These values suggest that particle-size distribution was relatively consistent across the nine sieving replicates and that the laboratory sieving protocol provided reproducible classification results under the analyzed conditions.
3.2. Exploratory Comparative Physicochemical Characterization
Physicochemical analysis of subsamples drawn from the pooled fractions (n = 10 subsamples per fraction, N = 20 total analytical measurements) clear compositional differences within the analyzed material across twelve parameters (all p-values > 0.05, reported as descriptive exploratory indicators rather than inferential statistics) (Table 2).
Table 2.
Physicochemical comparison between particle-size fractions (n = 10 per fraction).
Crude fat content showed the lowest observed p-value within the dataset (p = 0.058), with the coarse fraction exhibiting slightly higher mean values (6.63 ± 0.14% vs. 6.78 ± 0.18% DW). This pattern may indicate minor variations in lipophilic compound retention during milling, although the absolute difference (0.15 percentage points) was small.
No clear compositional differences were observed across major parameters (protein, fiber, ash, phenolics, and tannins) within the analyzed subsamples. These findings suggest that particle size was not strongly associated with compositional variation within the analyzed material and do not fully support common market assumptions regarding the lower value of finer fractions.
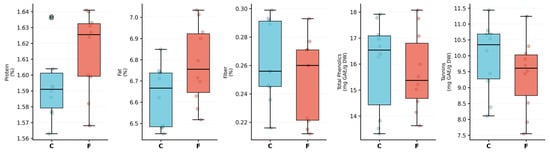
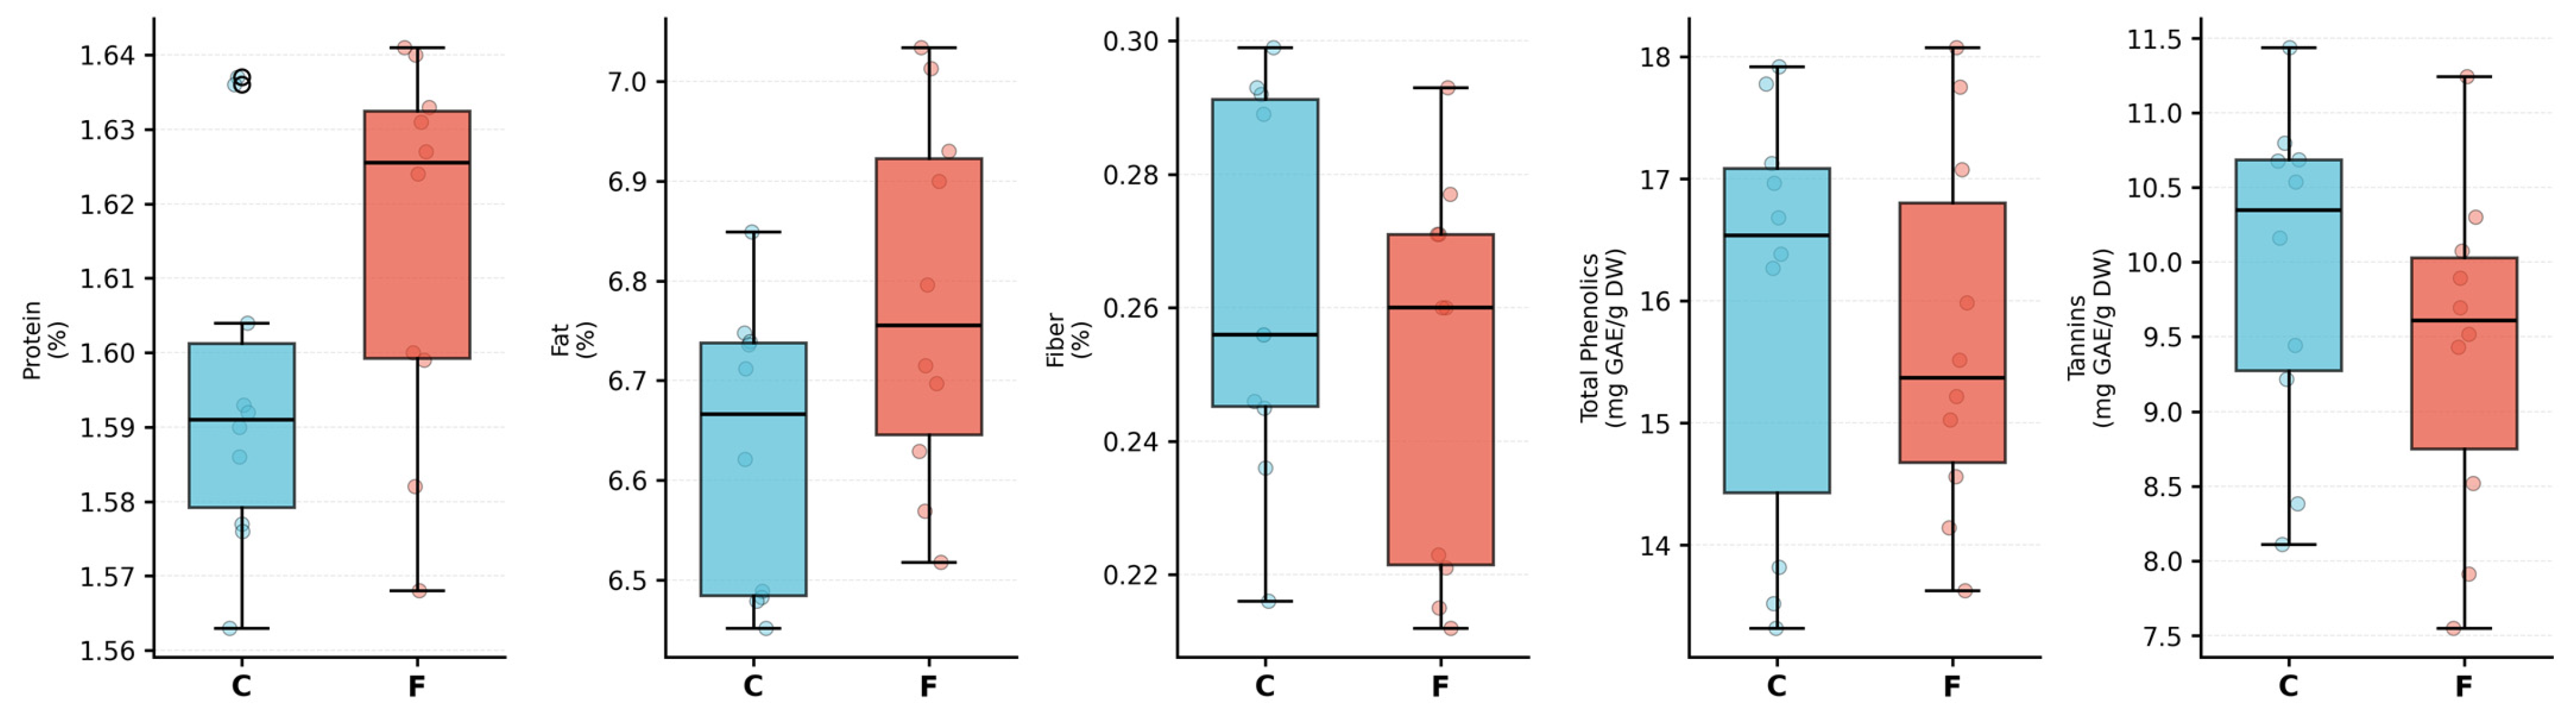
Boxplot distributions (Figure 1) further indicated substantial overlap between fractions across all evaluated parameters, consistent with the absence of clear compositional differences within the analyzed material.
Figure 1.
Boxplot comparison of selected physicochemical parameters between coarse (C) and Intermediate-fine (F) fractions, showing the distribution of protein, fat, fiber, total phenolics, and tannins.
Overall, these results suggest that granulometric separation did not result in clear compositional differences within the analyzed guayusa residue subsamples. The similarity in macronutrient and bioactive compound content suggests that both fractions may exhibit comparable compositional characteristics relevant for downstream valorization applications, though validation with independent biological replicates from different production batches is required.
3.3. Exploratory Correlation Analysis of Chemical Components
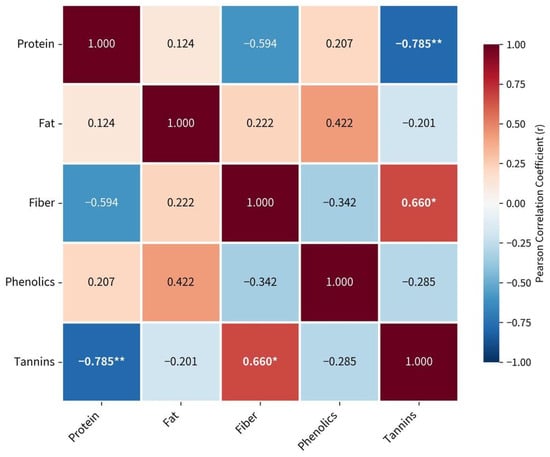
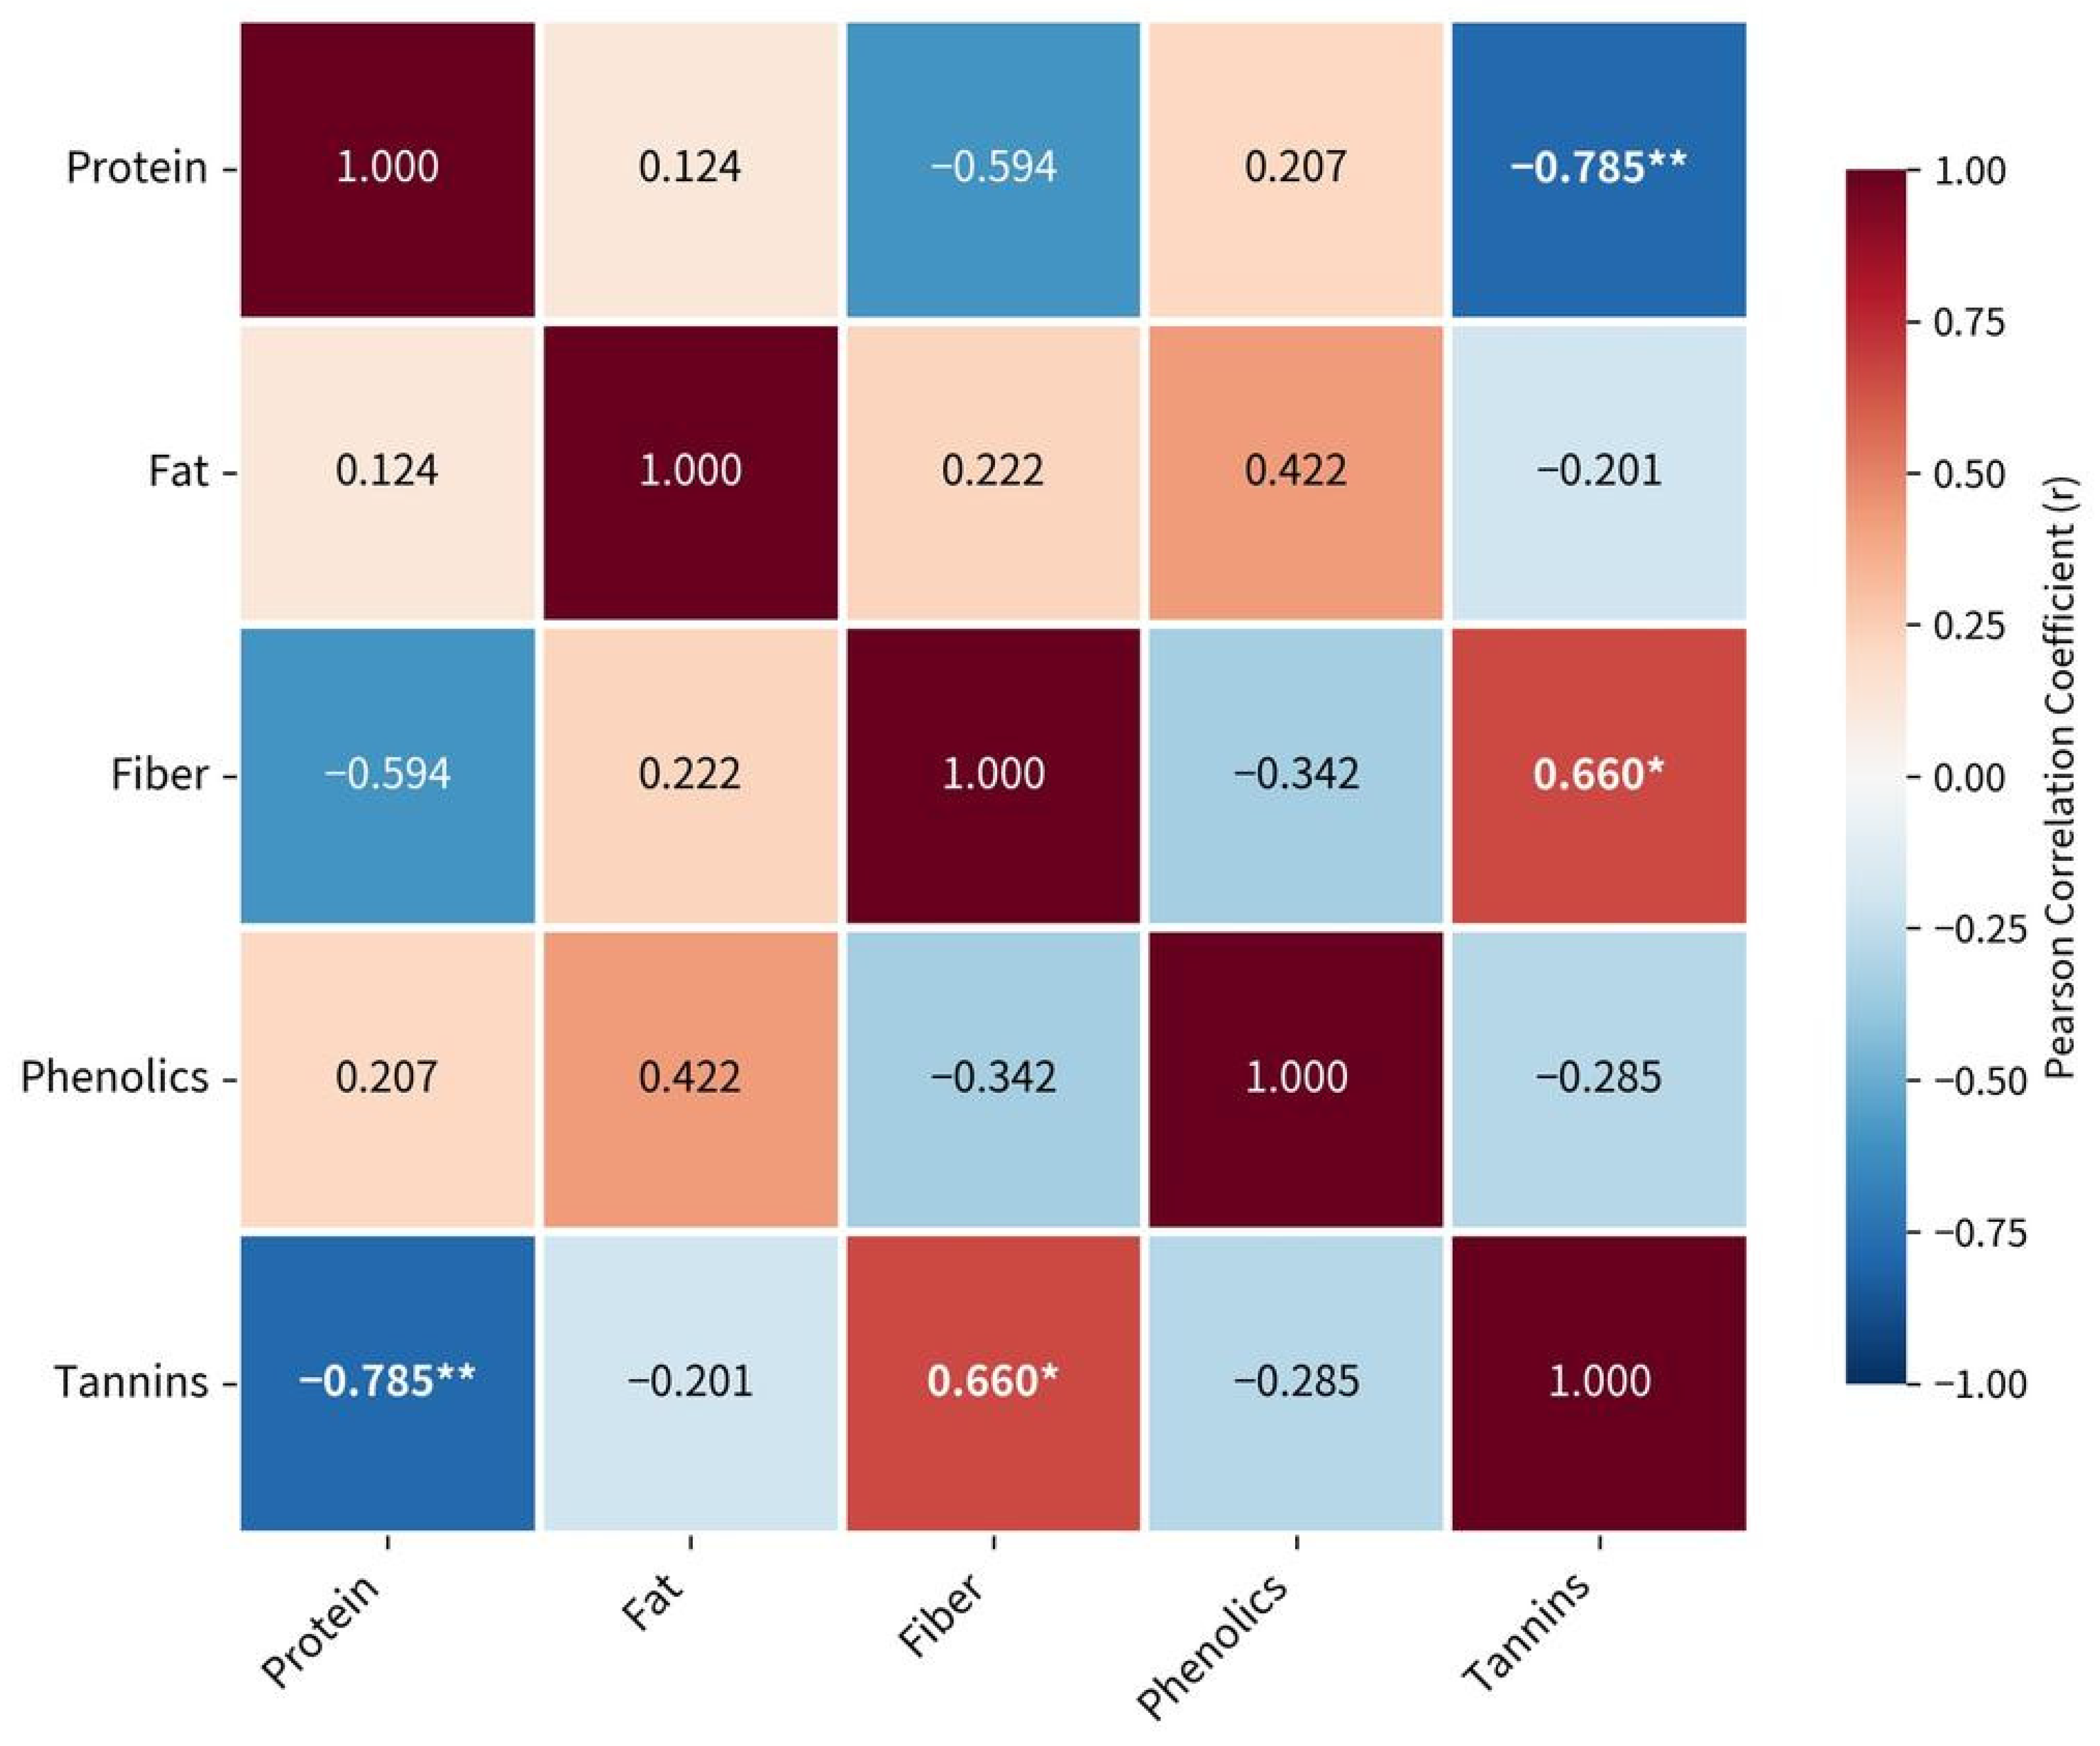
An exploratory Pearson correlation analysis was performed on key nutritional and bioactive parameters (protein, fiber, fat, phenolics, tannins), using the pooled dataset from both fractions (N = 20 observations: n = 10 intermediate-fine + n = 10 coarse). Two correlations showed comparatively stronger association patterns within the analyzed dataset (Figure 2).
Figure 2.
Exploratory Pearson correlation matrix for selected chemical composition variables (n = 20 analytical measurements pooled from both fractions). * p < 0.05; ** p < 0.01.
The strong negative correlation observed between crude protein and condensed tannins (r = −0.785, p = 0.007) may be associated with the documented ability of tannins to interact with proteins through hydrogen bonding and hydrophobic interactions, which may influence protein extractability and analytical quantification [27,28]. The positive association between crude fiber and tannins (r = 0.660, p = 0.038) may indicate the co-localization of phenolic compounds within plant cell wall structures, where tannins are frequently bound to lignocellulosic matrices that are resistant to chemical hydrolysis during fiber determination [29,30].
3.4. Exploratory Principal Component Analysis
Exploratory principal component analysis (PCA) was performed on five compositional variables (crude protein, crude fat, crude fiber, total phenolics, and condensed tannins) using standardized data (z-scores) from the pooled fractions (N = 20 observations). Varimax rotation was applied to improve the interpretability of component loadings.
The Kaiser–Meyer–Olkin (KMO) measure of sampling adequacy was 0.546, indicating marginal suitability for factor analysis; therefore, results should be interpreted as exploratory patterns rather than robust multivariate structures.
Three principal components were initially extracted; however, only two components with eigenvalues greater than 1.0 were retained according to Kaiser’s criterion, explaining 62.8% of the total variance (Table 3).
Table 3.
Eigenvalues and variance explained by principal components.
Exploratory PCA (N = 20, KMO = 0.546) identified two components with eigenvalues > 1.0, cumulatively explaining 62.8% of the total variance. These patterns should be considered preliminary, given the limited sample size. The component loadings are presented in Table 4.
Table 4.
Rotated component matrix (varimax rotation) for exploratory PCA (N = 20).
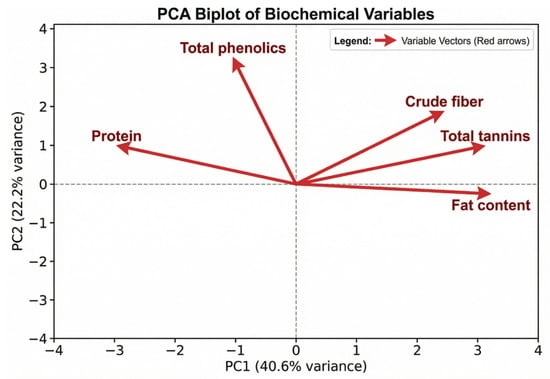
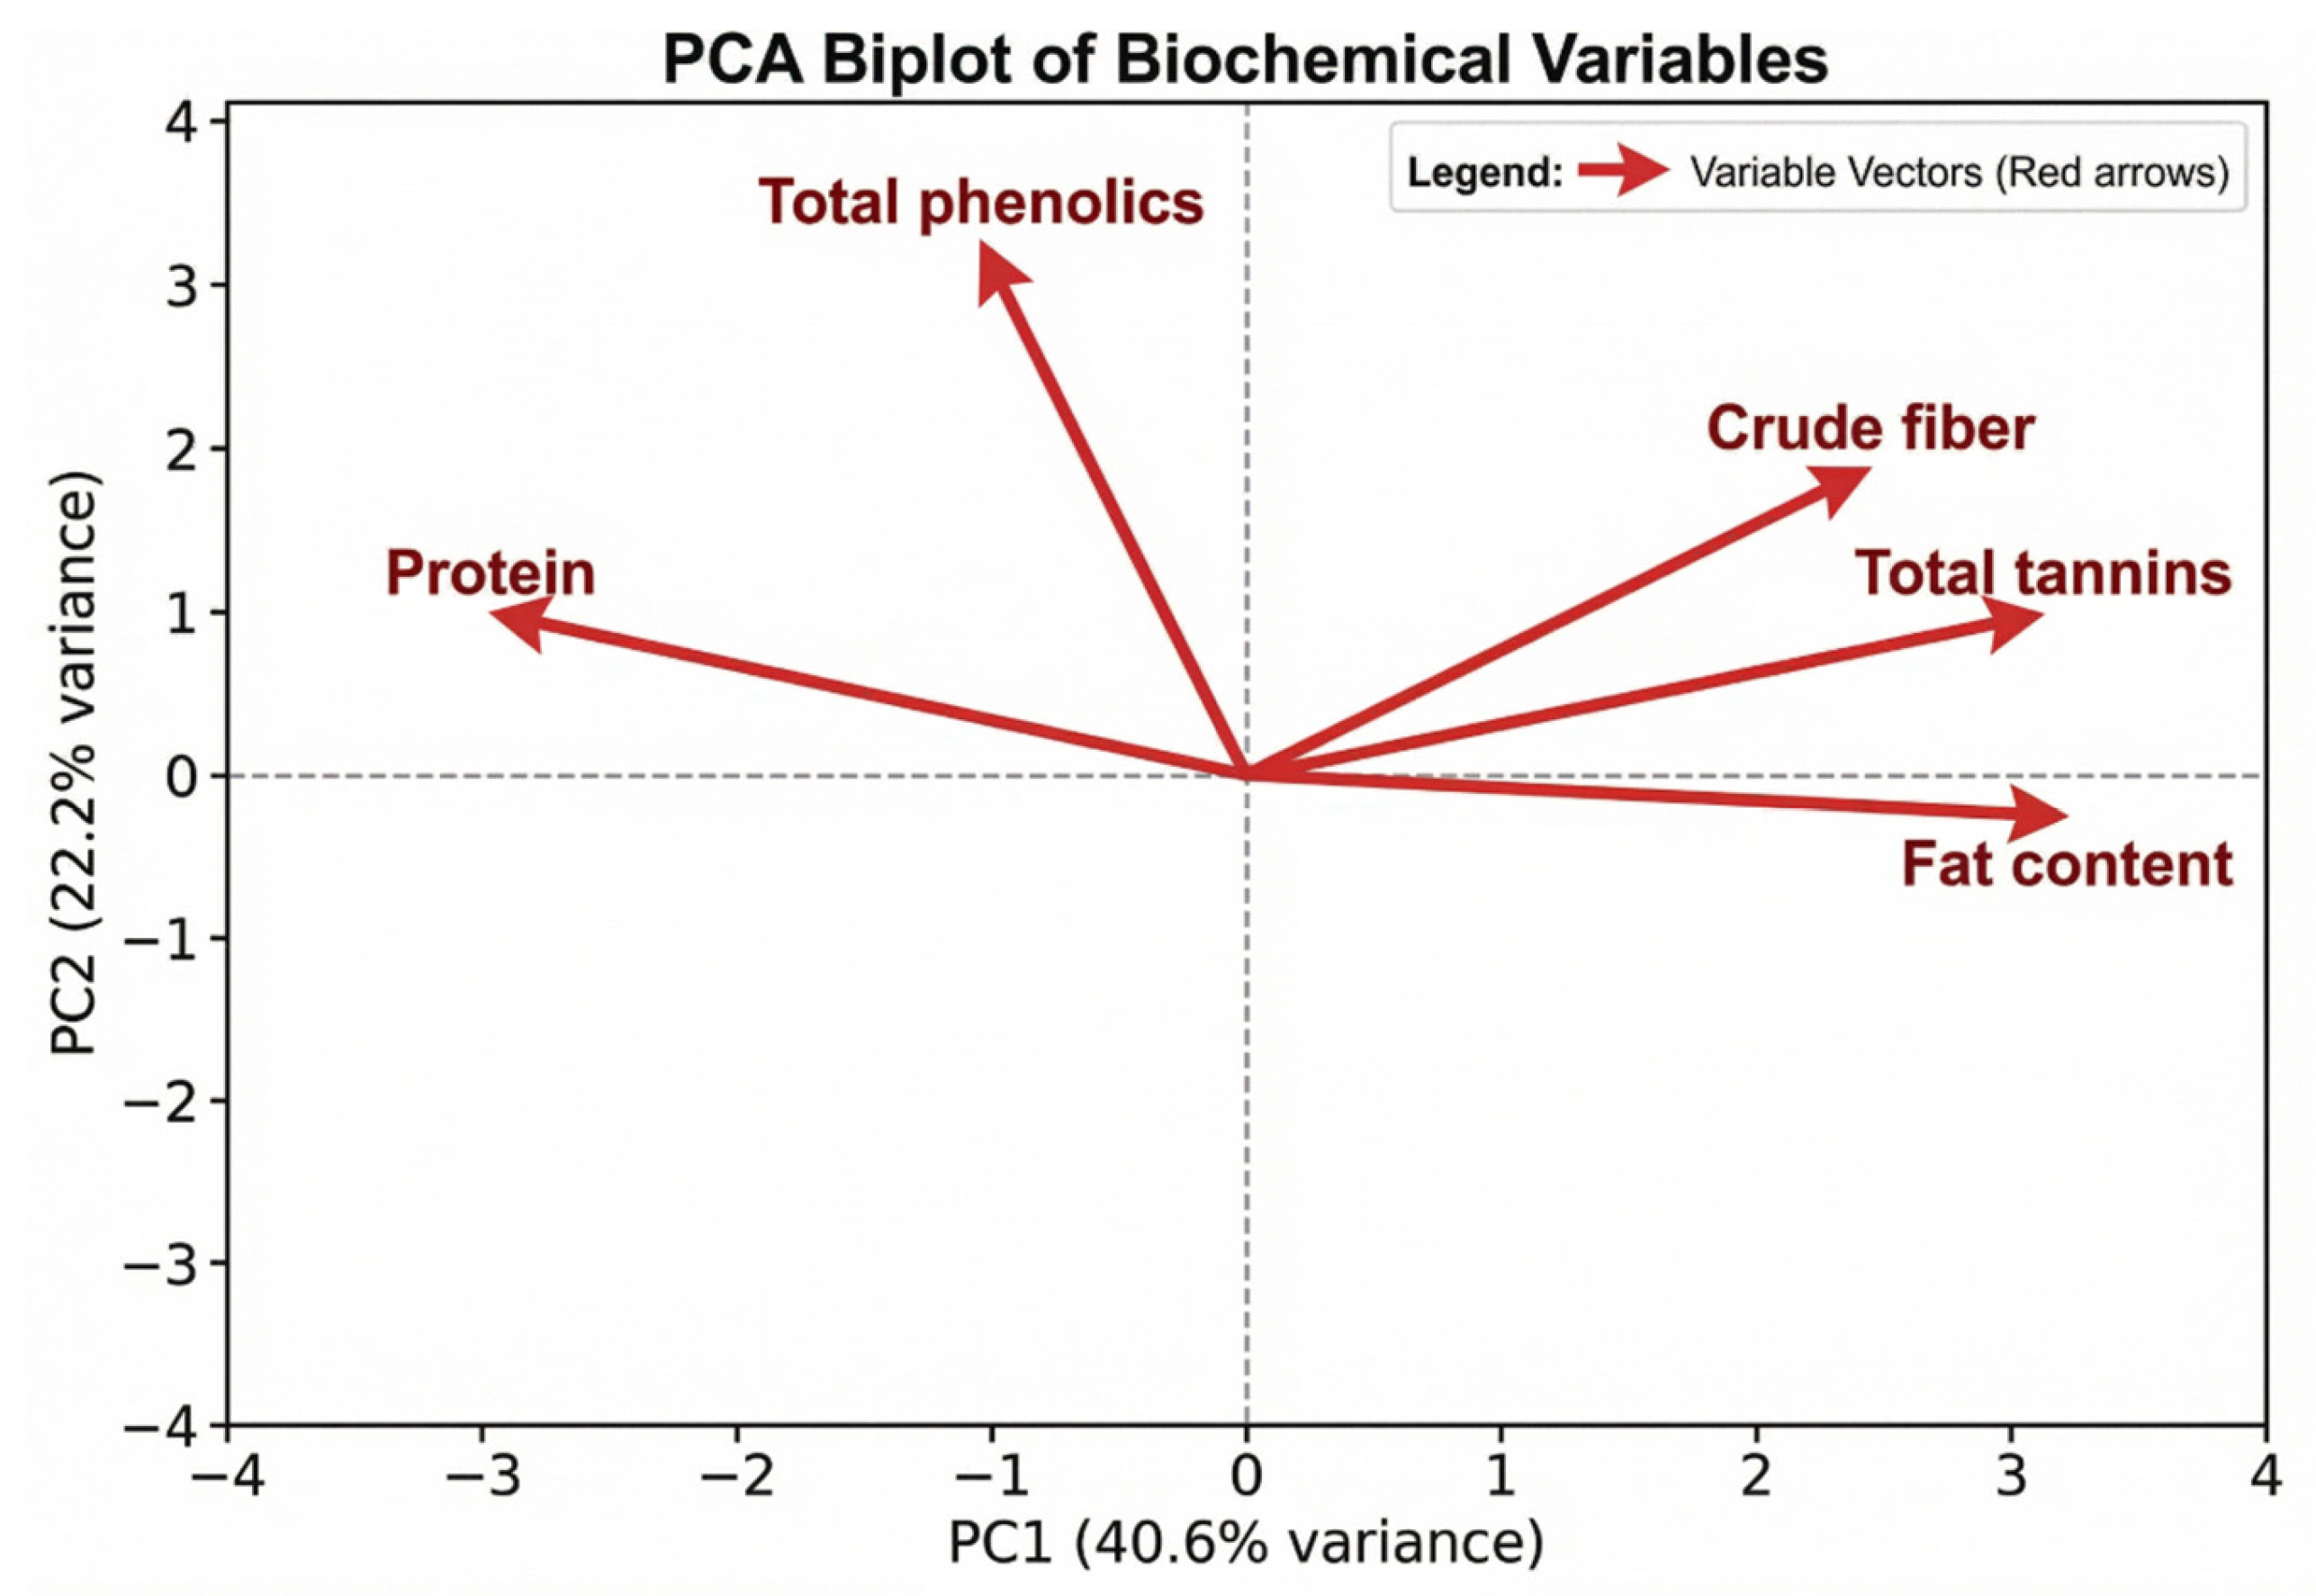
Exploratory PCA suggested two components explaining 62.8% of the total variance within the analyzed samples. PC1 (40.6%) was positively associated with crude fat, crude fiber, and condensed tannins, and negatively associated with crude protein, potentially reflecting a structural–phenolic pattern. PC2 (22.2%) was dominated by total phenolic compounds, suggesting a partially independent pattern of variation.
The PCA biplot (Figure 3) provides a visual representation of these multivariate relationships. Crude fiber, condensed tannins, and fat content clustered along the positive axis of PC1, while crude protein was positioned on the negative side, consistent with the negative association observed in the correlation analysis. Total phenolic compounds were primarily aligned with PC2, suggesting that their variation may differ from the structural–tannin grouping observed in PC1. These results should be interpreted as exploratory patterns rather than robust multivariate structures.
Figure 3.
Principal Component Analysis (PCA) biplot showing the distribution of variables along the first two principal components (PC1 and PC2), cumulatively explaining 62.8% of the total variance within the analyzed samples (N = 20).
3.5. Preliminary Caffeine Content Assessment
Preliminary HPLC—UV analysis was conducted on two composite samples (one per fraction) to obtain indicative caffeine values. Chromatographic peaks appeared at retention times of approximately 7.5 min, consistent with the elution profile of caffeine standards. Duplicate injections indicated caffeine concentrations of 18.88 mg g−1 (1.89% w/w DW) for the coarse fraction and 20.91 mg g−1 (2.09% w/w DW) for the intermediate-fine fraction (Table 5).
Table 5.
Preliminary caffeine content in guayusa processing residue fractions determined by HPLC-UV.
The observed concentrations (1.89–2.09% w/w) correspond to approximately 55–70% of the caffeine concentrations reported for whole dried guayusa leaves in the literature (typically 2.5–3.5% w/w) [3,10,31]. These preliminary observations indicate that guayusa processing residues may retain substantial amounts of caffeine, although confirmation through larger datasets with independent biological replication is required before assessing their suitability for industrial applications.
4. Discussion
This study provides a baseline physicochemical and nutritional characterization of guayusa (Ilex guayusa Loes.) processing residues from the Kallari cooperative in the Ecuadorian Amazon, contributing baseline data for understanding their potential role in Amazonian biomass valorization.
The analytical approach employed composite pooled material from Kallari cooperative’s production stream (December 2024), with physicochemical measurements conducted on technical replicates (subsamples, n = 10 per fraction) drawn from pooled size fractions rather than independent biological samples from different processing batches or cultivation sites. This sampling design enabled characterization of analytical variability within pooled fractions but limits generalizability regarding inter-batch, seasonal, or geographic compositional variation. Statistical comparisons (t-tests, correlations, PCA) should therefore be interpreted as exploratory characterizations of patterns within the analyzed material rather than as formal hypothesis tests permitting broad inference to the cooperative’s entire production stream or to guayusa processing residues generally.
Within this interpretive framework, our findings suggest that processing by-products representing approximately one-third of total processed biomass (32.5%) contained relevant bioactive compounds, with no clear compositional differences observed between particle-size fractions within the analyzed subsamples. These observations provide a preliminary dataset for evidence-based circular economy strategies in indigenous cooperative contexts, though significant analytical validation, independent biological replication, and economic feasibility assessment remain necessary before commercial valorization claims can be substantiated.
4.1. Residue Generation and Processing Implications
Granulometric analysis showed a relatively consistent particle-size distribution: 67.5% coarse (>425 µm), 11.9% intermediate (300–425 µm), and 20.6% fine (<300 µm) fractions. The combined intermediate-fine material (32.5%) translates to 5.8–8.1 t yr−1 at Kallari’s processing scale. Low coefficients of variation (1.3–4.4%) suggest relatively reproducible industrial classification patterns.
This residue generation rate is moderate compared to coffee (50–65%) [32], cocoa (70–75%) [33], and tea (10–25%) [34], suggesting manageable volumes for small-scale cooperative processing. The predominance of coarse material may reflect market preference for loose-leaf formats, though this distribution varies with buyer specifications for tea bags or functional food powders.
4.2. Compositional Uniformity Within Analyzed Subsamples
Within the analyzed subsamples, no clear compositional differences were observed across twelve physicochemical parameters (all p-values > 0.05). Moisture content similarity (6.22–6.54%) is particularly relevant, as both fractions remained well below the 12–14% threshold for fungal growth [35], conferring storage stability superior to spent coffee grounds (40–60% moisture), requiring immediate drying [36]. Ash content similarity (7.63–7.76% DW) indicates minimal stem contamination. The comparatively lower p-value observed for crude fat (p = 0.058) may be associated with minor differences in lipophilic compound distribution during milling, although the absolute difference was small.
These exploratory findings suggest that, within the analyzed material, market preferences against finer particles may be more closely associated with visual or commercial characteristics than with clear compositional differences, suggesting potential suitability for applications where particle size is less relevant (extracts, encapsulated products) or potentially advantageous (bakery fortification). However, validation through independent biological replication across multiple production batches, seasons, and cultivation sites is required to confirm compositional uniformity at the cooperative’s production scale.
4.3. Bioactive Compound Retention
4.3.1. Polyphenolic Compounds
Total phenolics (15.7–16.0 mg GAE g−1 DW) and condensed tannins (9.4–10.0 mg GAE g−1 DW) correspond to approximately 55% of the concentrations reported for whole leaves [37,38], which may be associated with the moderate drying temperatures (45–50 °C) that preserve heat-sensitive compounds [39]. Mechanical milling may enhance extractability by disrupting cell walls [40].
Within this exploratory characterization, guayusa residue phenolic content exceeds spent coffee grounds (12–14 mg GAE g−1) [41] but was lower than yerba mate waste (35–42 mg GAE g−1) [42] and green tea residues (28–32 mg GAE g−1) [34]. Previous studies identified chlorogenic acids as major guayusa phenolics (40–60% of total) [43], which have been associated with radical scavenging, metal chelation, and α-glucosidase inhibition [44], suggesting potential relevance for applications involving glycemic control supplements or antioxidant-fortified foods.
4.3.2. Preliminary Caffeine Assessment
Preliminary HPLC-UV analysis (n = 2 composite samples) indicated caffeine concentrations of 1.89–2.09% DW, corresponding to approximately 55–70% of the concentrations reported for whole guayusa leaves (2.4–3.5% DW) in the literature [3,10]. If confirmed through larger datasets with independent biological replication, the observed concentrations appear higher than those reported for spent coffee grounds (0.3–0.6% DW) [20] and comparable to yerba mate waste (1.2–1.6% DW) [42]. These differences may be associated with processing methodology: guayusa undergoes dry milling without aqueous extraction, whereas coffee brewing is typically associated with caffeine depletion.
However, the insufficient sample size (n = 2) precludes statistical inference, representing an important limitation of this study. Further validation would require larger datasets with independent biological replication, full HPLC method validation following ICH Q2(R1) guidelines (specificity, linearity, accuracy, precision, robustness), and HPLC-MS/MS confirmation to ensure peak purity and compound specificity. Additionally, the lack of matched whole-leaf controls from the same processing batches introduces potential confounding from seasonal, geographic, or cultivar variation when comparing to literature benchmarks. Therefore, caffeine content claims should be considered preliminary indicators warranting validation rather than substantiated quantitative findings suitable for economic feasibility assessment.
4.4. Exploratory Compositional Relationships
The strong negative correlation observed between crude protein and condensed tannins (r = −0.785, p = 0.007) is consistent with previously reported tannin–protein interactions [45] and may be associated with metabolic trade-offs or post-harvest complexation. This relationship may be relevant to reduced protein digestibility in feed-related applications [46] versus potentially beneficial antimicrobial properties associated with food preservation [47].
The positive fiber–tannin correlation (r = 0.660, p = 0.038) may suggest co-localization within plant cell wall structures [48], suggesting that tannin extraction efficiency could potentially depend on mechanical or enzymatic pre-treatment to disrupt fibrous matrices, whereas soluble caffeine and phenolics may extract more readily. These exploratory patterns warrant validation through extraction optimization trials.
Exploratory PCA (N = 20, KMO = 0.546) suggested PC1 (40.6% variance) potentially reflecting a structural–phenolic axis (fat, fiber, tannins versus protein) and PC2 (22.2% variance) dominated by total phenolics. This pattern may reflect differences between cell wall-bound tannins and more soluble chlorogenic acids and flavonoids. However, the marginal KMO value (0.546, below the commonly recommended 0.60 threshold) limits the robustness of multivariate interpretation; larger datasets with independent biological replication are needed for component structure validation [49].
4.5. Potential Valorization Pathways and Economic Considerations
Based on the exploratory compositional profile, several valorization applications merit further investigation, although all require validation through pilot-scale trials and techno-economic assessment.
Functional food ingredient incorporation (e.g., energy bars, supplements) would require relatively limited infrastructure and aligns with current upcycling trends, with precedents including spent coffee flour and cocoa pod powder. However, regulatory approval (GRAS determination or EU Novel Food authorization), sensory optimization (management of tannin astringency), and consumer acceptance testing would be required prior to commercialization.
Natural antioxidant extraction for food preservation or cosmetic applications could potentially leverage the observed phenolic content, although such approaches may require substantial capital investment and may be constrained by scale-dependent extraction efficiency. Economic feasibility remains uncertain without pilot-scale extraction trials evaluating yield, purity, and operating costs.
Caffeine extraction, contingent on analytical validation of content and consistency, faces similar scale-related challenges. Preliminary exploratory estimates based on literature-reported extraction efficiencies and market values suggest potentially relevant economic value, although these estimates remain highly speculative pending: (1) caffeine content validation with independent biological replication, (2) extraction efficiency determination through bench-scale trials, (3) cost accounting for solvents, energy, and labor, and (4) minimum viable scale assessment.
Cosmetic applications could potentially capitalize on consumer demand for Amazonian botanicals, although partnerships with formulators, safety testing (dermal irritation, sensitization), and preservation stability assessment would be required. Ruminant feed supplementation may represent a low-value utilization pathway, potentially benefiting from tannin-associated anti-parasitic effects [50], although feeding trials assessing animal performance and product safety (including caffeine toxicity considerations) would be necessary.
Economic viability at Kallari’s current processing scale (5.8–8.1 t yr−1 residue) remains uncertain and may require larger-scale cooperative aggregation, partnerships with established extraction companies, or potential organic/fair-trade certification premiums to offset small-scale processing inefficiencies. A phased implementation strategy beginning with low-capital functional food applications, followed by extraction infrastructure investment if market demand is validated, may represent a pragmatic approach. Nevertheless, all proposed pathways require rigorous feasibility assessment beyond the scope of this exploratory characterization.
4.6. Indigenous Bioeconomy Context
Valorization strategies must align with indigenous sovereignty and equitable benefit-sharing principles. The Nagoya Protocol requires fair compensation for genetic resource utilization [51]. Guayusa residues from domesticated chakra cultivation support indigenous ownership and governance structures, with cooperative structures providing potential benefit distribution frameworks, though capacity-building in intellectual property management, contract negotiation, and market linkage development is needed. Valorization strategies should avoid incentivizing monoculture intensification that could undermine chakra biodiversity and agroecological resilience [52]. Protective measures, including geographical indication registration, community-held trademarks, and participatory research with Free, Prior, and Informed Consent protocols, can help mitigate biopiracy risks documented for other Amazonian products [53].
4.7. Limitations and Research Priorities
These exploratory findings suggest that finer particles were not associated with reduced compositional quality within the analyzed material. These observations do not fully support common market assumptions associating a smaller particle size with lower value.
Sampling design limitations include the use of composite pooled material derived from multiple production batches, which prevents assessment of inter-batch variability. The analytical measurements (n = 10 per fraction) correspond to subsamples of these pooled fractions and therefore represent technical rather than independent biological replicates, limiting the scope of statistical inference. In addition, sampling was conducted at a single time point (December 2024) and within a single geographic region (Napo, Ecuador), restricting evaluation of seasonal and regional variability.
From an analytical perspective, total phenolics and condensed tannins were determined using aggregate spectrophotometric assays, which do not provide compound-specific resolution. Further characterization using HPLC-PDA-MS/MS is required to identify individual phenolic constituents. Caffeine quantification remains preliminary (n = 2 composite samples) and requires expansion with independent biological replication and full method validation (ICH Q2(R1)) prior to supporting quantitative claims. The absence of matched whole-leaf controls from the same processing batches also limits direct assessment of processing-related compositional changes.
Regarding valorization, the present study is based on compositional data and does not include extraction trials, process optimization, or techno-economic analysis. Market validation, including consumer acceptance, regulatory considerations, and economic feasibility, remains to be established.
Finally, this study did not incorporate participatory approaches with indigenous communities. Future research should include community perspectives, benefit-sharing frameworks, and gender-related considerations associated with valorization strategies.
Despite these limitations, the study provides baseline compositional data, documents the mass distribution of processing fractions, and offers a first systematic characterization of guayusa residues under real processing conditions. These findings support further investigation of valorization pathways within an indigenous bioeconomy context.
5. Conclusions
This exploratory characterization provides baseline physicochemical data for guayusa processing residues, representing approximately 32.5% of industrial throughput at Kallari cooperative. Within the analyzed subsamples, residues contained measurable levels of bioactive compounds, including total phenolics (15.7–16.0 mg GAE g−1 DW), condensed tannins (9.4–10.0 mg GAE g−1 DW), and preliminary caffeine content of 1.89–2.09% DW (n = 2 composite samples). No clear compositional differences were observed between particle-size fractions within the analyzed material (p > 0.05 for all twelve parameters, n = 10 subsamples per fraction), suggesting that fine and intermediate materials may retain compositional characteristics comparable to coarse commercial-grade fractions. These observations should be interpreted as exploratory rather than inferential, as the dataset was derived from pooled composite material.
At the current processing scale (18–25 t yr−1), residues represent 5.8–8.1 t yr−1 of underutilized biomass. Observed compositional patterns, including protein–tannin and fiber–tannin associations, may be relevant for future extraction and valorization strategies. Standard processing conditions may be associated with the presence of heat-sensitive compounds, with preliminary caffeine concentrations appearing higher than some values reported for comparable agro-industrial residues.
These findings suggest that guayusa residues may represent a potential resource for circular economy applications, including functional ingredients, bioactive extracts, and related products. However, validation through independent biological replication, compound-specific analytical techniques, and techno-economic assessment is required before practical implementation.
Overall, this study establishes baseline compositional data under real processing conditions and provides a foundation for future research aimed at developing sustainable and culturally appropriate valorization pathways within Amazonian indigenous bioeconomy systems.
Supplementary Materials
The following supporting information can be downloaded at: https://www.mdpi.com/article/10.3390/biomass6030037/s1. Table S1: Complete physicochemical dataset for guayusa residue fractions analyzed in this study. Table S2: Descriptive statistics of physicochemical parameters by fraction (mean ± SD, n = 10), Figure S1: Boxplot distribution of physicochemical parameters according to residue fraction. Table S3: Extended Pearson correlation matrix for physicochemical and compositional variables.
Author Contributions
Conceptualization, A.S.-H.; methodology, A.S.-H.; software, A.S.-H.; validation, A.S.-H., A.M.-G. and R.Z.-G.; formal analysis, A.S.-H.; investigation, A.S.-H.; resources, P.B.-A., R.Z.-G. and A.M.-G.; data curation, A.S.-H.; writing—original draft preparation, A.S.-H.; writing—review and editing, A.M.-G., R.Z.-G. and P.B.-A.; visualization, A.S.-H.; project administration, R.Z.-G. All authors have read and agreed to the published version of the manuscript.
Funding
This research was funded by Escuela Superior Politécnica de Chimborazo (ESPOCH) through the research project “Cuantificación y caracterización de los residuos agroindustriales de las organizaciones asesoradas por la ONG TRIAS con visión de economía circular”, (Project Code: DIPI-022), with co-funding support from TRIAS NGO.
Informed Consent Statement
Not applicable.
Data Availability Statement
The data presented in this study are available in the Supplementary Materials and from the corresponding author upon reasonable request.
Acknowledgments
The authors used an ChatGPT (OpenAI, GPT-5.5) and Genspark AI as artificial intelligence-based tools to assist with English editing and grammar improvement during manuscript preparation. All scientific content, data analysis, interpretations, and conclusions presented in this study are the sole responsibility of the authors.
Conflicts of Interest
The authors declare no conflicts of interest.
References
- Dueñas, J.F.; Jarrett, C.; Cummins, I.; Logan–Hines, E. Amazonian Guayusa (Ilex guayusa Loes.): A Historical and Ethnobotanical Overview. Econ. Bot. 2016, 70, 85–91. [Google Scholar] [CrossRef] [Scilit]
- Krause, T.; Ness, L. Energizing agroforestry: Ilex guayusa as an additional commodity to diversify Amazonian agroforestry systems. Int. J. Biodivers. Sci. Ecosyst. Serv. Manag. 2017, 13, 191–203. [Google Scholar] [CrossRef] [Scilit]
- Wise, G.; Negrin, A. A critical review of the composition and history of safe use of guayusa: A stimulant and antioxidant novel food. Crit. Rev. Food Sci. Nutr. 2020, 60, 2393–2404. [Google Scholar] [CrossRef] [Scilit]
- Caranqui, E.; Romero, M.; Vargas, J. Estudio sobre la Taxonomía y Estado de Conservación de la Guayusa (Ilex guayusa Loess.) del Cantón Pastaza. Bachelor’s Thesis, Escuela Superior Politécnica de Chimborazo, Riobamba, Ecuador, 2011. [Google Scholar]
- Ochoa-Ocampo, M.A.; Niño-Ruiz, Z.; Torres-Gutiérrez, R.; Mogollón, N.G.; Diéguez-Santana, K. Characterization, biological activity and application trends of Ilex guayusa Loes: A systematic literature review and bibliometric analysis. Food Chem. Adv. 2025, 7, 100958. [Google Scholar] [CrossRef] [Scilit]
- Jarrett, C.; Cummins, I.; Logan-Hines, E. Adapting indigenous agroforestry systems for integrative landscape management and sustainable supply chain development in Napo, Ecuador. In Integrating Landscapes: Agroforestry for Biodiversity Conservation and Food Sovereignty; Springer: Cham, Switzerland, 2017; Volume 12, pp. 283–309. [Google Scholar]
- FAO. Amazonian Chakra, Ecuador. Globally Important Agricultural Heritage Systems (GIAHS). Food and Agriculture Organization of the United Nations. Available online: https://www.fao.org/giahs/giahs-around-the-world/ecuador-amazonian-chakra/en (accessed on 19 May 2026).
- Jarrett, C. The Social Life of Guayusa from Amazonian Ecuador: An Examination of Livelihoods, Landscapes, and Politics. Ph.D. Dissertation, University of Florida, Gainesville, FL, USA, 2019. [Google Scholar]
- Noriega, P.; Moreno, E.; Falcón, A.; Quishpe, V.; Noriega, P.D.C. Guayusa (Ilex guayusa Loes.) Ancestral Plant of Ecuador: History, Traditional Uses, Chemistry, Biological Activity, and Potential Industrial Uses. Molecules 2025, 30, 2837. [Google Scholar] [CrossRef] [Scilit]
- Cadena-Carrera, S.; Tramontin, D.P.; Jacques, R.; Scapin, E.; Müller, J.M.; Hense, H. Green-based methods to obtain bioactive compounds from Ilex guayusa Loes. using polar solvent. Nat. Prod. Res. 2023, 37, 3103–3108. [Google Scholar] [CrossRef] [Scilit]
- Molina Núñez, P.E. Exportación de Té de Guayusa a Alemania; Universidad de las Américas: Quito, Ecuador, 2016. [Google Scholar]
- Kelebek, H.; Sasmaz, H.K.; Aksay, O.; Selli, S.; Kahraman, O.; Fields, C. Exploring the Impact of Infusion Parameters and In Vitro Digestion on the Phenolic Profile and Antioxidant Capacity of Guayusa (Ilex guayusa Loes.) Tea Using Liquid Chromatography, Diode Array Detection, and Electrospray Ionization Tandem Mass Spectrometry. Foods 2024, 13, 694. [Google Scholar] [CrossRef] [Scilit]
- García-Ruiz, A.; Baenas, N.; Benítez-González, A.M.; Stinco, C.M.; Meléndez-Martínez, A.J.; A Moreno, D.; Ruales, J. Guayusa (Ilex guayusa L.) new tea: Phenolic and carotenoid composition and antioxidant capacity. J. Sci. Food Agric. 2017, 97, 3929–3936. [Google Scholar] [CrossRef] [Scilit]
- Torres, B.; Radice, M.; Moreno, W.S.O.; Rojas, K.C. Economía de Recursos Naturales y Biocomercio-Oportunidades y Desafíos; Universidad Estatal Amazónica: Puyo, Ecuador, 2017. [Google Scholar]
- Llerena, W.; Samaniego, I.; Vallejo, C.; Arreaga, A.; Zhunio, B.; Coronel, Z.; Quiroz, J.; Angós, I.; Carrillo, W. Profile of Bioactive Components of Cocoa (Theobroma cacao L.) By-Products from Ecuador and Evaluation of Their Antioxidant Activity. Foods 2023, 12, 2583. [Google Scholar] [CrossRef] [Scilit]
- European Commission (EC). Circular Economy Action Plan for a Cleaner and More Competitive Europe; European Commission (EC): Brussels, Belgium, 2020; p. 28. [Google Scholar]
- Rojas, L.F.; Zapata, P.; Ruiz-Tirado, L. Agro-industrial waste enzymes: Perspectives in circular economy. Curr. Opin. Green Sustain. Chem. 2022, 34, 100585. [Google Scholar] [CrossRef] [Scilit]
- Denny, D.M.T.; Martins, M.M.V.; Burnquist, H.L. From extractivism and illegalities to a circular bioeconomy in the Amazon Region. Rev. Tempo Mundo 2021, 27, 127–163. [Google Scholar] [CrossRef] [Scilit]
- Paes, M.X.; Campos-Silva, J.V.; de Oliveira, J.A.P. Integrating circular economy in urban Amazon. npj Urban Sustain. 2021, 1, 29. [Google Scholar] [CrossRef] [Scilit]
- Campos-Vega, R.; Loarca-Piña, G.; Vergara-Castañeda, H.A.; Oomah, B.D. Spent coffee grounds: A review on current research and future prospects. Trends Food Sci. Technol. 2015, 45, 24–36. [Google Scholar] [CrossRef] [Scilit]
- Rojo-Poveda, O.; Barbosa-Pereira, L.; Zeppa, G.; Stévigny, C. Cocoa bean shell—A by-product with nutritional properties and biofunctional potential. Nutrients 2020, 12, 1123. [Google Scholar] [CrossRef] [Scilit]
- Wise, G.; Santander, D.E. Assessing the History of Safe Use of Guayusa. J. Food Nutr. Res. 2018, 6, 471–475. [Google Scholar] [CrossRef] [Scilit]
- Wise, G.; Santander, D.E. Comparative composition analysis of the dried leaves of Ilex guayusa (Loes.). J. Food Nutr. Res. 2018, 6, 638–644. [Google Scholar] [CrossRef] [Scilit]
- Rizou, M.; Galanakis, I.M.; Aldawoud, T.M.; Galanakis, C.M. Safety of foods, food supply chain and environment within the COVID-19 pandemic. Trends Food Sci. Technol. 2020, 102, 293–299. [Google Scholar] [CrossRef] [Scilit]
- Gobierno Autónomo Descentralizado Municipal del Cantón Tulcán. Plan de Desarrollo y Ordenamiento Territorial (PDOT) y Plan de Uso y Gestión de Suelo (PUGS) del Cantón Tena 2023–2027; GAD Municipal del Cantón Tena: Tena, Ecuador, 2025.
- Singleton, V.L.; Rossi, J.A. Colorimetry of total phenolics with phosphomolybdic-phosphotungstic acid reagents. Am. J. Enol. Vitic. 1965, 16, 144–158. [Google Scholar] [CrossRef] [Scilit]
- Barry, T.; Manley, T. The role of condensed tannins in the nutritional value of Lotus pedunculatus for sheep: 2. Quantitative digestion of carbohydrates and proteins. Br. J. Nutr. 1984, 51, 493–504. [Google Scholar] [CrossRef] [Scilit]
- Frutos, P.; Hervás, G.; Ramos, G.; Giráldez, F.; Mantecón, A. Condensed tannin content of several shrub species from a mountain area in northern Spain, and its relationship to various indicators of nutritive value. Anim. Feed Sci. Technol. 2002, 95, 215–226. [Google Scholar] [CrossRef] [Scilit]
- Rebole, A. Fiber and tannins of some agricultural and forest byproducts. Inclusion of these parameters in the prediction of in vitro digestibility. J. Agric. Food Chem. 1994, 42, 739–743. [Google Scholar] [CrossRef] [Scilit]
- Giridhar, K.; Prabhu, T.M.; Singh, K.C.; Nagabhushan, V.; Thirumalesh, T.; Rajeshwari, Y.B.; Umashankar, B.C. Nutritional potentialities of some tree leaves based on polyphenols and rumen in vitro gas production. Vet. World 2018, 11, 1479–1485. [Google Scholar] [CrossRef] [Scilit]
- Saldarriaga, S.; Rodríguez-Salazar, C.A.; Recalde-Reyes, D.P.; Beltrán, G.M.P.; Álvarez, L.N.C.; Ortíz, Y.L.S. Phenolic Composition, Antioxidant, and Anti-Proliferative Activities Against Human Colorectal Cancer Cells of Amazonian Fruits Copoazú (Theobroma grandiflorum) and Buriti (Mauritia flexuosa). Molecules 2025, 30, 1250. [Google Scholar] [CrossRef] [Scilit]
- Mussatto, S.I.; Machado, E.M.S.; Martins, S.; Teixeira, J.A. Production, composition, and application of coffee and its industrial residues. Food Bioprocess Technol. 2011, 4, 661–672. [Google Scholar] [CrossRef] [Scilit]
- Okiyama, D.C.; Navarro, S.L.; Rodrigues, C.E. Cocoa shell and its compounds: Applications in the food industry. Trends Food Sci. Technol. 2017, 63, 103–112. [Google Scholar] [CrossRef] [Scilit]
- Sharangi, A. Medicinal and therapeutic potentialities of tea (Camellia sinensis L.)–A review. Food Res. Int. 2009, 42, 529–535. [Google Scholar] [CrossRef] [Scilit]
- Magan, N.; Hope, R.; Cairns, V.; Aldred, D. Post-harvest fungal ecology: Impact of fungal growth and mycotoxin accumulation in stored grain. Eur. J. Plant Pathol. 2003, 109, 723–730. [Google Scholar] [CrossRef] [Scilit]
- Murthy, P.S.; Naidu, M.M. Sustainable management of coffee industry by-products and value addition—A review. Resour. Conserv. Recycl. 2012, 66, 45–58. [Google Scholar] [CrossRef] [Scilit]
- Kapp, R.W., Jr.; Mendes, O.; Roy, S.; McQuate, R.S.; Kraska, R. General and Genetic Toxicology of Guayusa Concentrate (Ilex guayusa). Int. J. Toxicol. 2016, 35, 222–242. [Google Scholar] [CrossRef] [Scilit]
- Radice, M.; Viafara, D.; Neill, D.; Asanza, M.; Sacchetti, G.; Guerrini, A.; Maietti, S. Chemical characterization and antioxidant activity of Amazonian (Ecuador) Caryodendron orinocense Karst. and Bactris gasipaes Kunth seed oils. J. Oleo Sci. 2014, 63, 1243–1250. [Google Scholar] [CrossRef] [Scilit]
- Friedman, M.; Jürgens, H.S. Effect of pH on the stability of plant phenolic compounds. J. Agric. Food Chem. 2000, 48, 2101–2110. [Google Scholar] [CrossRef] [Scilit] [PubMed]
- Azmir, J.; Zaidul, I.S.M.; Rahman, M.M.; Sharif, K.M.; Mohamed, A.; Sahena, F.; Jahurul, M.H.A.; Ghafoor, K.; Norulaini, N.A.N.; Omar, A.K.M. Techniques for extraction of bioactive compounds from plant materials: A review. J. Food Eng. 2013, 117, 426–436. [Google Scholar] [CrossRef] [Scilit]
- Ballesteros, L.F.; Teixeira, J.A.; Mussatto, S.I. Chemical, functional, and structural properties of spent coffee grounds and coffee silverskin. Food Bioprocess Technol. 2014, 7, 3493–3503. [Google Scholar] [CrossRef] [Scilit]
- Heck, C.I.; De Mejia, E.G. Yerba Mate Tea (Ilex paraguariensis): A comprehensive review on chemistry, health implications, and technological considerations. J. Food Sci. 2007, 72, R138–R151. [Google Scholar] [CrossRef] [Scilit]
- Villacís-Chiriboga, J. Ethnobotany and traditional health systems in Ecuador: Focus on Guayusa (Ilex guayusa Loes). Etnobiología 2018, 15, 79–88. [Google Scholar]
- Santana-Gálvez, J.; Cisneros-Zevallos, L.; Jacobo-Velázquez, D.A. Chlorogenic acid: Recent advances on its dual role as a food additive and a nutraceutical against metabolic syndrome. Molecules 2017, 22, 358. [Google Scholar] [CrossRef] [Scilit]
- Hagerman, A.E.; Butler, L.G. The specificity of proanthocyanidin-protein interactions. J. Biol. Chem. 1981, 256, 4494–4497. [Google Scholar] [CrossRef] [Scilit]
- Jansman, A. Tannins in feedstuffs for simple-stomached animals. Nutr. Res. Rev. 1993, 6, 209–236. [Google Scholar] [CrossRef] [Scilit]
- Daglia, M. Polyphenols as antimicrobial agents. Curr. Opin. Biotechnol. 2012, 23, 174–181. [Google Scholar] [CrossRef] [Scilit]
- Barbehenn, R.V.; Constabel, C.P. Tannins in plant–herbivore interactions. Phytochemistry 2011, 72, 1551–1565. [Google Scholar] [CrossRef] [Scilit]
- Hair, J.F.; Black, W.C.; Babin, B.J.; Anderson, R.E. Multivariate Data Analysis, 8th ed.; Cengage Learning: Andover, UK, 2019. [Google Scholar]
- Min, B.; Hart, S. Tannins for suppression of internal parasites. J. Anim. Sci. 2003, 81, E102–E109. [Google Scholar]
- Buck, M.; Hamilton, C. The Nagoya Protocol on access to genetic resources and the fair and equitable sharing of benefits arising from their utilization to the Convention on Biological Diversity. Rev. Eur. Community Int. Environ. Law 2011, 20, 47–61. [Google Scholar] [CrossRef] [Scilit]
- Caballero-Serrano, V.; Onaindia, M.; Alday, J.G.; Caballero, D.; Carrasco, J.C.; McLaren, B.; Amigo, J. Plant diversity and ecosystem services in Amazonian homegardens of Ecuador. Agric. Ecosyst. Environ. 2016, 225, 116–125. [Google Scholar] [CrossRef] [Scilit]
- Brondízio, E.S. The Amazonian Caboclo and the Açaí Palm: Forest Farmers in the Global Market; Advances in Economic Botany; New York Botanical Garden Press: Bronx, NY, USA, 2008; Volume 16. [Google Scholar]

Disclaimer/Publisher’s Note: The statements, opinions and data contained in all publications are solely those of the individual author(s) and contributor(s) and not of MDPI and/or the editor(s). MDPI and/or the editor(s) disclaim responsibility for any injury to people or property resulting from any ideas, methods, instructions or products referred to in the content. |
© 2026 by the authors. Licensee MDPI, Basel, Switzerland. This article is an open access article distributed under the terms and conditions of the Creative Commons Attribution (CC BY) license.