


Abstract
Vehicular Ad Hoc Networks (VANETs) are essential components of Intelligent Transportation Systems (ITS), allowing communication exchanges between vehicles and road infrastructure elements. These networks face challenges from vehicular mobility, including frequent topology changes, link instability, and variable wireless channel quality. This paper presents an extensive evaluation of Software-Defined Networking (SDN) integrated with two traffic engineering technologies, Multi-Protocol Label Switching (MPLS) and Segment Routing (SR), applied to the AODV and OLSR routing protocols. Nine incremental configurations are evaluated for each protocol, ranging from the default protocol through MPLS-enhanced forwarding, SDN-based centralized optimization, combined SDN-MPLS and SDN-SR integration, to advanced configurations using distance-based IS-IS weighted topology metrics with both Fixed and Adaptive metric computation approaches. Two distinct SDN topology construction methods are compared: a Protocol-based approach that uses routing table entries with equal hop-count metrics, and a distance-based approach using IS-IS weighted metrics. The simulation uses a realistic urban topology with 50 vehicles and 5 RSUs, evaluated across several traffic patterns, representing different application types. Results demonstrate that SR with distance-based IS-IS metrics achieves the highest Packet Delivery Ratio (PDR) and lowest delay by leveraging RSU infrastructure as reliable forwarding relays. Moreover, the proposed SDN-SR framework reduces routing overhead and control-plane signaling, improving network resource utilization and thereby indicating its potential to enhance the energy efficiency of vehicular communication infrastructures.
1. Introduction
Vehicular Ad Hoc Networks (VANETs) provide the wireless communication layer that enables Intelligent Transportation Systems (ITS) to deliver cooperative driving services, hazard notifications, and real-time traffic management across vehicles and roadside infrastructure [1,2]. The evolution toward connected and autonomous vehicles requires reliable and low-latency network communication, putting pressure on routing protocols in order to maintain high overall performance in the unstable vehicular network topologies.
The challenges of VANET routing are inherited by the network architecture and design [3,4,5,6]. The continuous movement of vehicles at unpredictable speeds and trajectories produces a network where wireless links have short lifetimes, rendering routing state obsolete almost as quickly as it is established, and the broadcast nature of route discovery mechanisms consumes wireless bandwidth. Although MANET routing protocols support dynamic topologies, they struggle under the rapid and large-scale link disruptions characteristic of vehicular mobility.
Three routing and forwarding technologies have been evaluated in this paper to address the challenges of traditional protocols. Multi-Protocol Label Switching (MPLS) introduces a forwarding plane where packets traverse pre-computed label-switched paths, avoiding IP routing table consultations at each intermediate node [7,8]. Segment Routing (SR) extends this concept by encoding the complete forwarding path as a list of segments in the packet header, removing the need for per-flow state in intermediate nodes and enabling source-routed traffic engineering [8,9]. Software-Defined Networking (SDN) relocates routing decisions from individual nodes to a centralized controller that operates on a complete network graph, enabling path optimization that distributed protocols cannot achieve with local information alone, features that traditional protocols cannot compute independently using only the local node information [10,11,12].
This paper evaluates these technologies, integrating them with two VANET routing protocols: AODV (reactive, on-demand route discovery) and OLSR (proactive, pre-computed routing tables). Nine configurations are tested for each protocol, progressing from the baseline protocol through more sophisticated integration layers. A key contribution of this work is the comparison of two distinct SDN topology implementation approaches: a protocol-based method that builds the topology graph from the protocol routing table entries using its metrics, and a distance-based method using IS-IS weighted metrics that assigns different costs to V2V, V2I, and I2I links.
The novelty of this work lies in the direct comparison of MPLS and Segment Routing under identical SDN-controlled conditions in a VANET environment, which, to the best of our knowledge, has not been addressed in prior vehicular networking research, together with an evaluation of how the SDN topology construction approach affects routing performance.
The simulation is executed on a realistic simulation environment modeled on the road network of Tirana, Albania, with 50 vehicles and 5 RSUs connected in a ring Ethernet backbone. Three traffic patterns (CBR, VBR, and Burst) are used to verify network performance under different applications, services and conditions. The Key Performance Indicators collected and evaluated from the simulation include Packet Delivery Ratio (PDR), end-to-end delay, jitter, throughput, and routing overhead.
The remainder of this paper is organized as follows. Section 2 reviews background literature on VANET routing, MPLS, SR, and SDN. Section 3 presents the proposed methodology including the study area, integration approaches, and metric computation methods. Section 4 provides the simulation setup, results, and detailed analysis. Section 5 concludes the paper.
2. Background and Related Works
2.1. VANET Routing Protocols
Routing in vehicular environments is complex due to the high node mobility, topology variations, and connectivity disruptions in vehicle-to-vehicle communication [3,5]. A wireless link established between two vehicles may last only a few seconds, requiring continuous route recalculations in real time. Standard MANET protocols such as AODV and DSR, even though designed for dynamic networks, face difficulties maintaining performance in vehicular domains where control-message flooding, route-discovery times, and outdated routing information lead to packet loss and increased end-to-end latency [3,5].
VANET routing protocols are classified into four categories [5,9]: topology-based protocols including AODV, OLSR, and DSDV that use link-state or distance-vector information to create paths; position-based protocols such as GPSR that use geographic coordinates rather than routing tables; cluster-based protocols that organize vehicles into groups managed by cluster heads; and hybrid protocols that utilize both geographic location and topology information by combining features of the other classifications.
AODV follows a reactive paradigm: routes are constructed only when a source has data to transmit, through a network-wide RREQ flood answered by a unicast RREP along the reverse path. Because route state is discarded once traffic ceases, AODV conserves bandwidth during idle periods but incurs discovery latency each time a new or broken route is needed [5]. OLSR uses the opposite approach by proactively building and maintaining a full routing table at every node through periodic Hello and Topology Control exchanges. Its Multi-Point Relay selection mechanism limits the broadcast of control messages, yet the continuous signaling still imposes significant overhead as mobility or network size increases [3,5].
Both protocols must satisfy QoS requirements including low latency for safety messages, high PDR, and low jitter for multimedia services, while overcoming the design and architectural challenges [1,13,14,15]. Without a total view of network state, distributed protocols turn to redundant flooding and lack the ability to enforce network-wide coordinated forwarding policies, which motivates the adoption of centralized traffic engineering approaches [4,9].
2.2. MPLS and SR Traffic Engineering
Traffic engineering is the process of optimizing network performance by controlling flow paths and resource utilization. Its main objectives are reducing delays, reducing congestion, balancing load and creating a reliable network. In vehicular environments where bandwidth and latency fluctuate inconsistently, traffic engineering is essential for maintaining stable throughput and consistent QoS [7,8]. MPLS and SR are the most well-known and used traffic engineering methods.
MPLS assigns a fixed-length label to every flow at the edge of the network. Packets then flow through a pre-established Label Switched Path, where intermediate routers swap labels without performing IP-layer route lookups, achieving forwarding speeds closer to layer-2 switching than traditional IP routing. This mechanism is particularly suitable for delay-sensitive vehicular applications including safety awareness messages and video streaming [8,16].
Segment Routing (SR) is a network-layer technology that uses source-based path routing by implementing forwarding instructions as a sequence of segments within packet headers [8,17]. Rather than following traditional hop-by-hop route computation, SR creates a list of segments representing nodes or node groups that a packet must traverse. This model simplifies network operations by eliminating the need for per-flow state in intermediate nodes, which is a significant advantage in dense vehicular networks with high flow counts. SR can be implemented over MPLS (SR-MPLS) using labels to represent segments, or over IPv6 (SRv6) using IPv6 addresses as segment identifiers [8,9,18,19].
Implementing both MPLS and SR in VANETs requires adapting to mobility and frequent topology changes, as Label Switched Paths (LSPs) or segment lists must be dynamically reconfigured based on the new routes. Simulation studies demonstrate that SDN-controlled MPLS VANETs achieve higher packet-delivery ratios and reduced average delays compared to standard routing, as the label-switching mechanism eliminates repeated route discoveries while centralized management ensures load-balanced link utilization [7,16,20]. Table 1 compares the key characteristics of MPLS and Segment Routing for vehicular network deployment.
Table 1.
Comparison of MPLS and Segment Routing characteristics.
2.3. SDN Framework
Software-Defined Networking separates the control plane from the data plane, creating a logically centralized controller that maintains a global view of network topology and traffic conditions [9,10,11]. The SDN controller provides a programmable environment where routing algorithms, applications and services can be deployed as software modules. It creates the possibility of centralized optimization that is impossible with distributed protocols operating on local information alone. Through southbound interfaces, the controller pushes and implements forwarding rules in data-plane devices, while northbound interfaces are used for applications, policy configuration and monitoring [12,21].
In vehicular environments, SDN enables proactive congestion control, dynamic path optimization, and flow prioritization for delay-sensitive packets [9,11,22,23,24]. SD-VANET architecture is typically built in a tiered design: vehicles and their OBUs constitute the data-plane edge, RSUs or RSU clusters serve as fog-layer aggregation points for regional decision-making, and the SDN controller acts as the cloud-layer orchestrator responsible for network-wide analytics and path optimization [12,21,25,26,27]. This approach balances global optimization with the latency constraints of vehicular applications.
The centralized control model allows the SDN controller to compute optimal paths using algorithms such as Dijkstra’s shortest-path algorithm throughout the whole network topology. The controller can consider link quality metrics, node reliability, and traffic load that are unavailable to individual nodes operating with only local routing information. Combined with MPLS or SR, the SDN controller can implement network-wide traffic engineering policies that route packets along paths optimized for specific performance objectives or application requirements [8,9,11].
While Segment Routing under SDN control has been implemented and evaluated in backbone, IP, and multi-layer network contexts [19], and SDN has been applied to vehicular networks for adaptive traffic management [24], no prior work has implemented and compared MPLS and Segment Routing under identical SDN-controlled conditions in a vehicular ad hoc network environment, nor investigated the impact of topology construction approaches on SDN path optimization in VANETs [28], which we address in this paper.
3. Materials and Methods
3.1. Problem Description and Study Area
This study evaluates the integration of MPLS, SR, and SDN technologies with AODV and OLSR routing protocols to test and analyze the performance improvements through each integration layer and their combinations. The research addresses two fundamental objectives: whether each technology layer provides consistent and measurable improvements while using different routing paradigms and traffic conditions; and how the SDN topology construction approach impacts the efficiency of centralized route optimization.
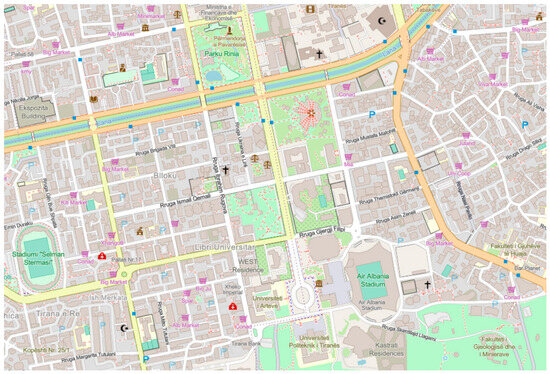
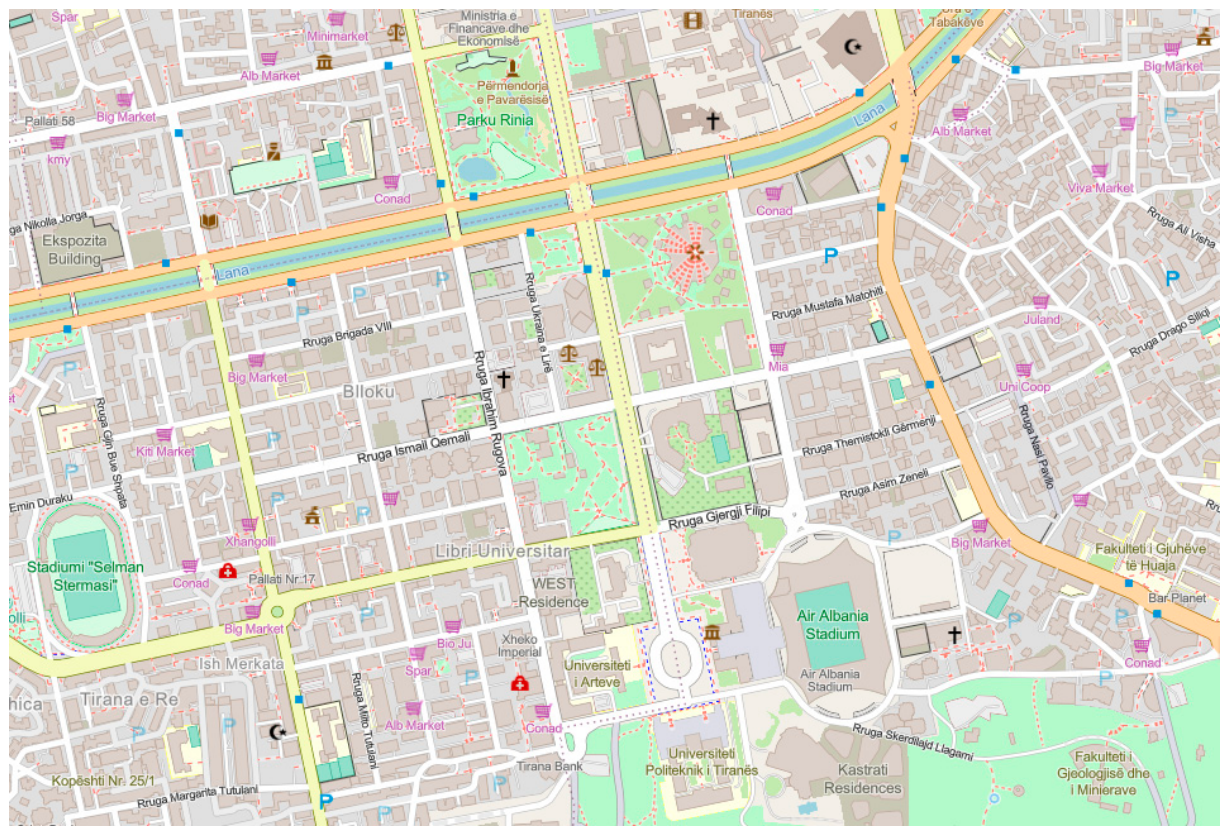
The simulation environment is based on the urban road network of Tirana, Albania, covering an area of 2500 m by 2000 m, displayed in Figure 1. The topology is extracted from OpenStreetMap and processed through SUMO to generate realistic vehicular traffic, using traffic signals, intersection behavior, and driving dynamics. The simulation uses 50 vehicles that follow the same trail and schedules throughout all scenarios to guarantee comparable results. Moreover, 5 RSUs are positioned at strategic locations in the city’s bus stations, providing infrastructure coverage across the area.
Figure 1.
Considered study area, a section of the road network in Tirana, Albania.
Adjacent RSUs are interconnected by 1 Gbps fiber links arranged in a ring, providing a wired backbone whose capacity and reliability are independent of the shared wireless channel. RSU positions are selected to ensure good overall coverage of the study area. Vehicles use the IEEE 802.11p standard [29] at 5.9 GHz with 10 MHz bandwidth and 20 mW transmit power, providing approximately 300 m of radio transmission distance, which limits the communication range for both V2V and V2I interfaces. The SDN controller connects to all RSUs using point-to-point Ethernet links and is positioned centrally within the network area.
The three used traffic generators represent specific application models: CBR transmits one packet every 0.5 s for periodic status updates; VBR uses uniform intervals from 0.1 to 2.0 s for variable-rate multimedia; and Burst releases 10 back-to-back packets every 5 s, for cooperative awareness bursts. Simulations run for 100 s with multiple seed values for statistical reliability.
3.2. Integration Architecture
The proposed framework is structured as a step-by-step integration of three technologies: MPLS, SDN, and Segment Routing, which are set on top of the default routing protocol. Each configuration adds one or more capabilities to the baseline, allowing us to test and measure the performance and contribution of each added layer. The same integration architecture is applied to both AODV and OLSR, producing nine configurations per protocol and eighteen scenarios in total for each traffic pattern.
The first configuration contains the default routing protocol operating independently, which establishes the baseline KPIs. The second one introduces MPLS forwarding on top of the default protocol, lowering per-hop packet processing time, without modifying route discovery. The third configuration replaces MPLS with SDN centralized control, where the controller computes optimized routes using the collected network-wide routing tables, building a topology graph with equal weights per hop, which is equivalent to a minimum-hop-count metric. The fourth integration combines SDN and MPLS, providing both centralized path optimization and label-switched forwarding. The fifth one replaces MPLS with Segment Routing under the same SDN protocol-based topology, encoding the complete path in the packet header rather than relying on per-hop label state.
The last four configurations introduce the distance-based IS-IS weighted topology approach, which changes how the SDN controller constructs its topology graph and selects paths. SDN-MPLS and SDN-SR are each evaluated with two metric allocation methods: Fixed metrics, which set static costs based on link type, and Adaptive metrics, which utilize dynamic link quality measurements from periodic vehicle telemetry. Table 2 summarizes all nine configurations and their characteristics.
Table 2.
Evaluated Configurations Summary.
This layered design is used as an evaluation method for two objectives. Firstly, by comparing configurations that differ by a single technology layer (for example, SDN versus SDN-MPLS, or SDN-MPLS versus SDN-SR), we can measure the individual contribution of each integrated mechanism. Secondly, by comparing configurations that share the same forwarding technology but differ in the topology graph building (for example, SDN-MPLS versus SDN-MPLS-Fixed), the impact of the topology construction method can be evaluated without being affected by the forwarding mechanism.
3.3. MPLS Forwarding
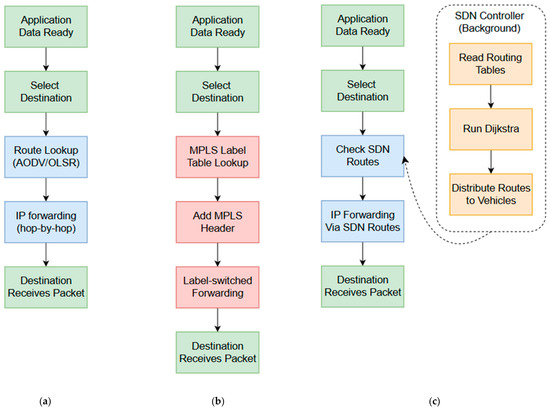
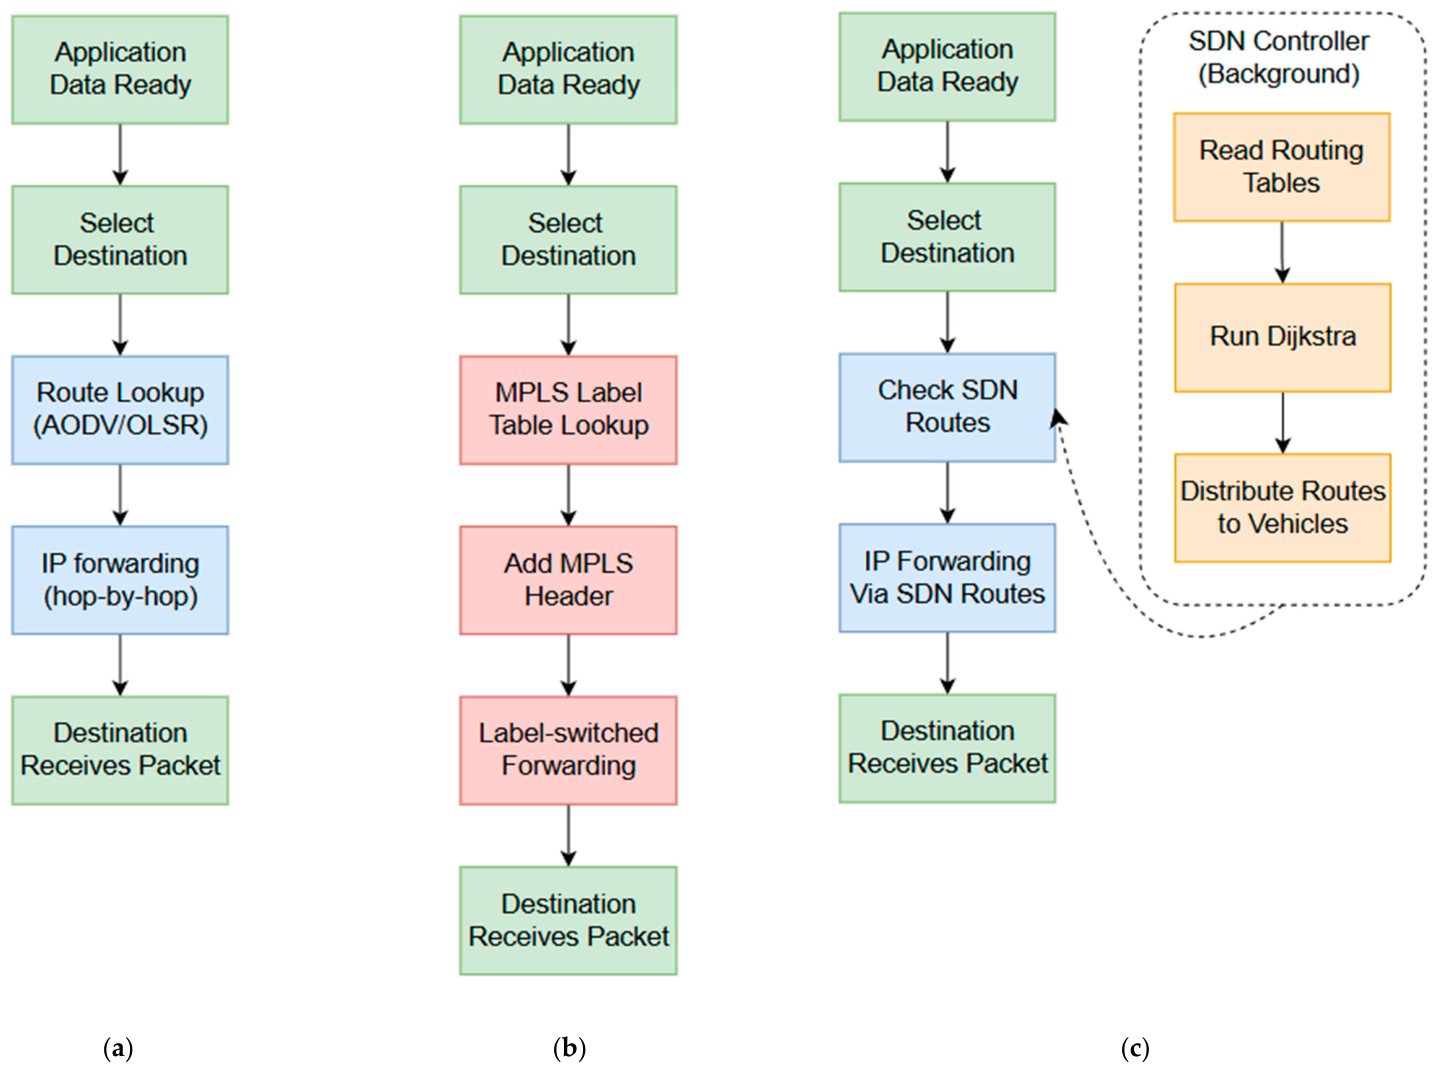
The MPLS layer adds label-switched forwarding without modifying the route discovery mechanisms of the used routing protocol. Every node derives a local label forwarding table from the active routing protocol entries, binding each reachable destination to an outgoing MPLS label that is periodically refreshed as the underlying topology evolves. For OLSR, label bindings are available in the routing table for all destinations; meanwhile, for AODV, label bindings are created only for destinations with an active route. A label mapping exists only after AODV has discovered the corresponding route. When forwarding data, the vehicle prepends a 4-byte MPLS header containing the label value, enabling intermediate nodes to perform fast label lookup without consulting the IP routing table. Traffic flow using MPLS forwarding is represented by Figure 2b.
Figure 2.
Tested Scenarios Flowchart: (a) Default Protocol. (b) MPLS Enhanced. (c) SDN Integration.
Label distribution uses periodic wireless broadcast announcements where each vehicle advertises its label bindings to neighbors, adapting the LDP model to the broadcast nature of wireless ad hoc networks. The additional wireless overhead from label announcements severely affects routing overhead, as each broadcast consumes channel capacity and is received by all nodes within range.
3.4. SDN and Topology Construction
The SDN integration introduces a centralized controller connected to all RSUs via the wired backbone. Two distinct topology construction approaches are implemented in order to simulate and measure different levels of infrastructure awareness.
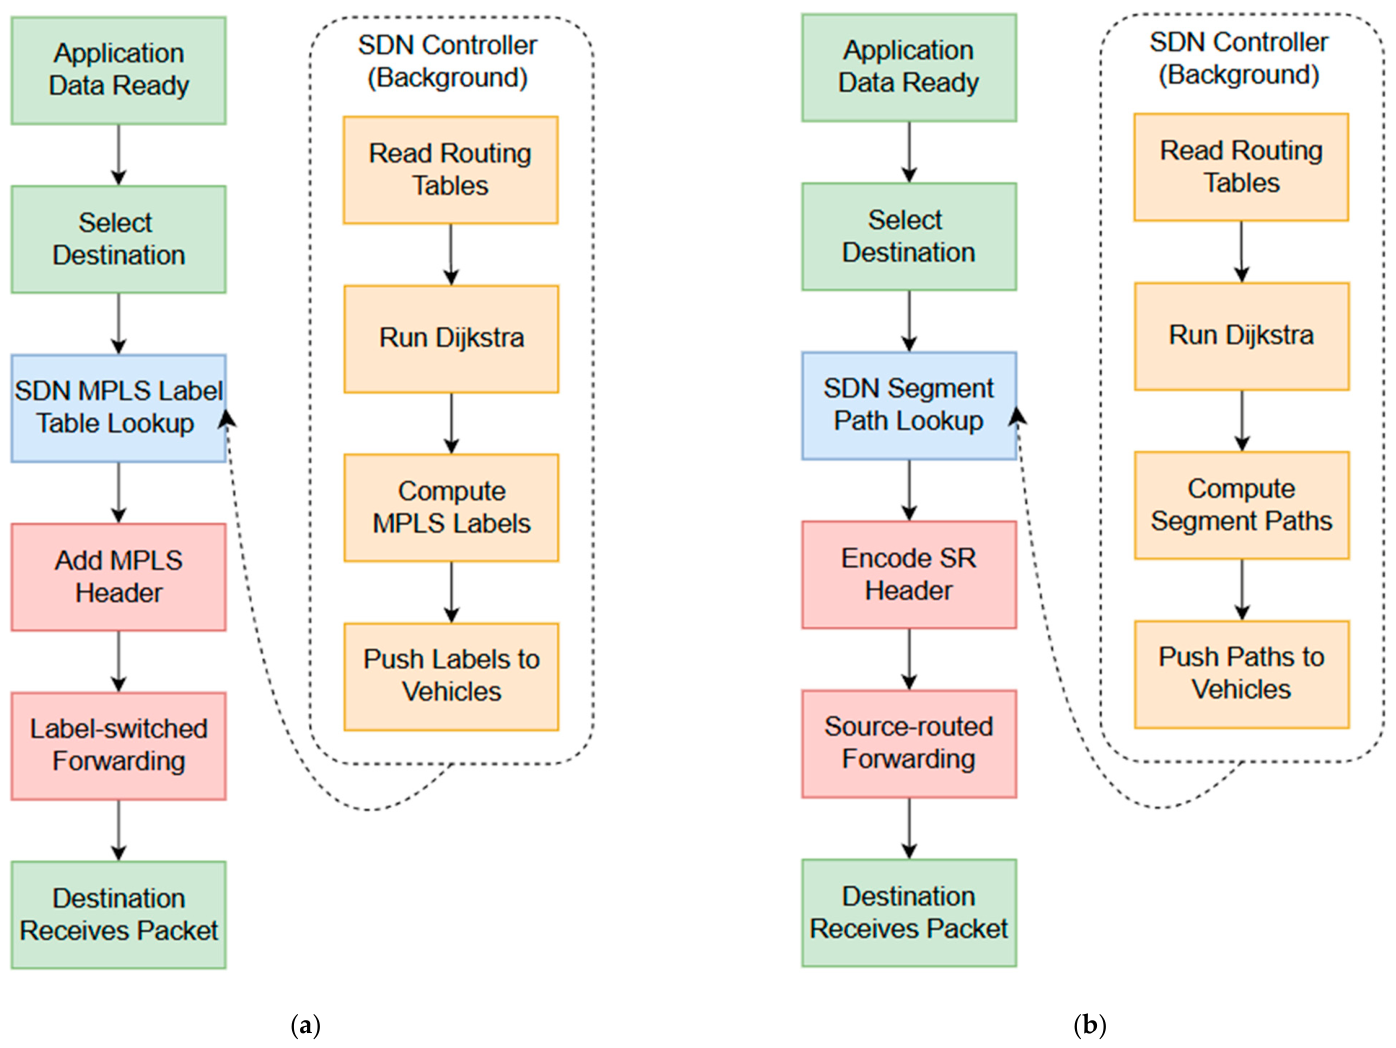
The first approach, protocol-based topology construction shown in Figure 2c and Figure 3, builds the topology graph by reading the routing tables from all vehicles and RSUs in the network. V2V, V2I, and I2I links are identified from routing entries, with all links having an equal hop-count metric of 1. This method uses only those links that the routing protocol has previously verified through message exchange. Since this graph is created at the controller, Dijkstra runs on the combined network-wide view rather than on the partial table of any single node, which is sparser for AODV when compared to OLSR.
Figure 3.
Protocol-Based Topology Scenarios (using equal hop-count metrics) (a) SDN + MPLS forwarding. (b) SDN + Segment Routing.
As a next step, by using the Dijkstra shortest-path algorithm on this graph, the SDN Controller computes optimal routes. Since all links have equal weights, Dijkstra selects the path with the fewest hops, which typically favors direct V2V paths over longer RSU-bridged paths. If the controller has no computed path for a given destination, the packet uses the underlying AODV or OLSR route, so delivery can still occur.
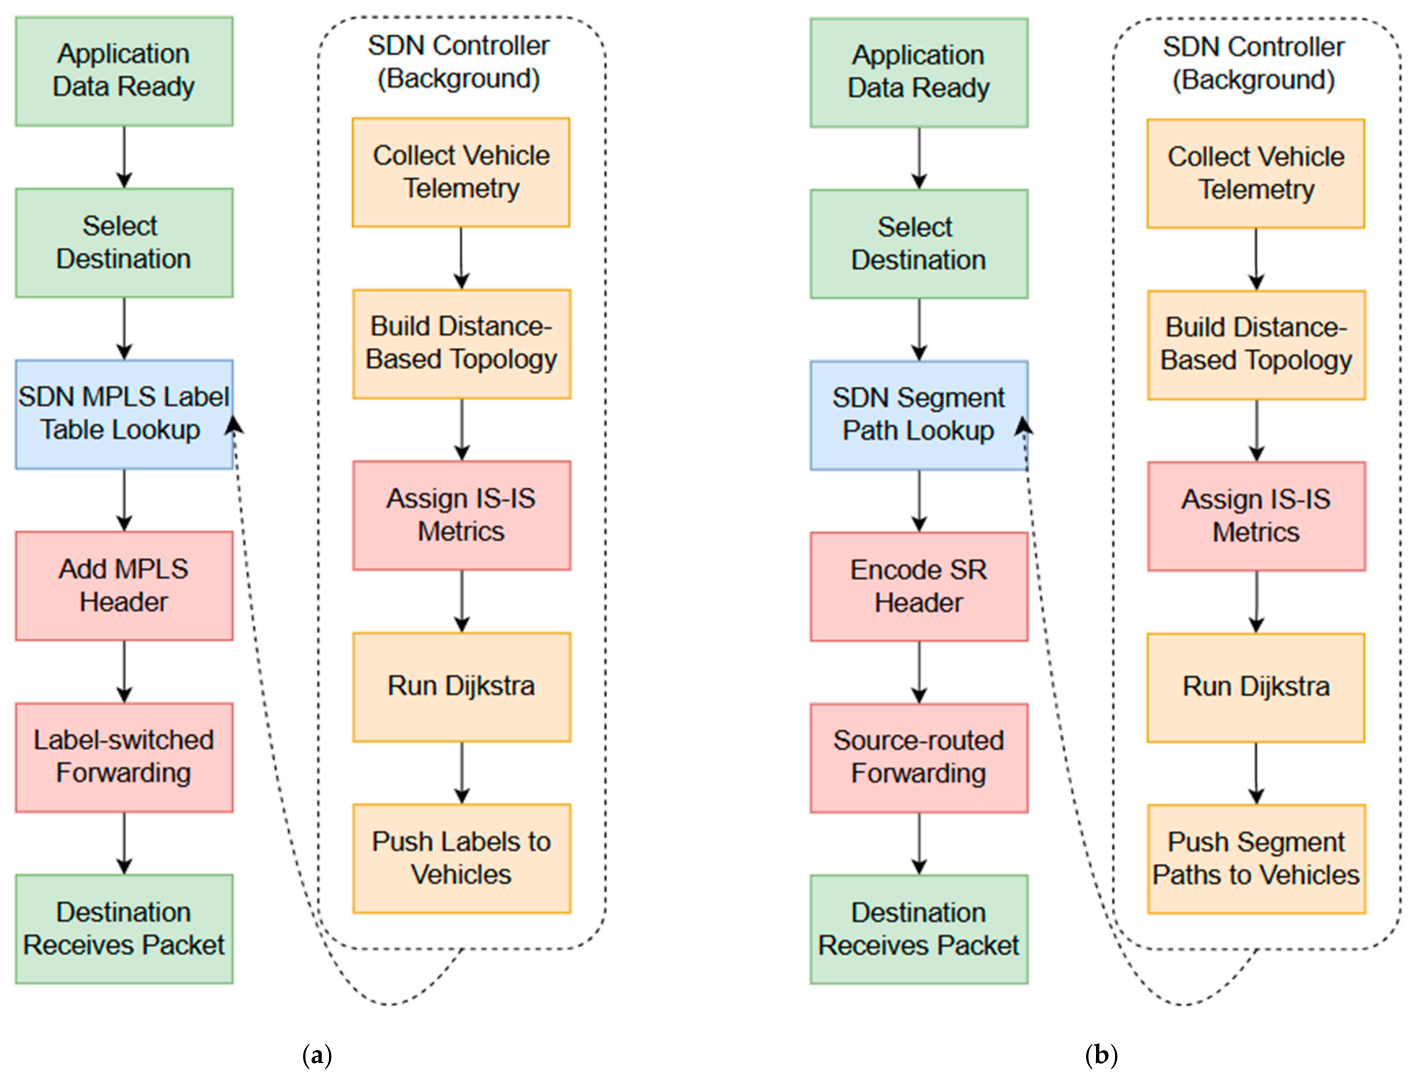
The second approach, distance-based topology construction with IS-IS weighted metrics, presented in Figure 4, builds the topology from vehicle position telemetry and RSU locations. Links are established based on distance: V2V links for vehicles within 300 m, V2I links for vehicles within 300 m of an RSU, and I2I links for RSU pairs connected via wired interfaces. IS-IS metrics are assigned to each link type: V2V links receive a metric of 200 (high cost, reflecting link instability), V2I links receive a metric of 100 (moderate cost), and I2I links receive a metric of 10 (low cost, reflecting the stable wired backbone).
Figure 4.
Distance-Based IS-IS Weighted Topology Scenarios (using differentiated V2V/V2I/I2I costs): (a) SDN + MPLS forwarding. (b) SDN + Segment Routing.
When Dijkstra computes shortest paths using these weights, it prefers to route traffic through the RSU infrastructure, even when shorter V2V paths exist in terms of hop count. RSU infrastructure links are more reliable than V2V links because RSUs are fixed and connected via a wired backbone. A path traversing Vehicle—RSU—RSU—Vehicle (cost: 100 + 10 + 100 = 210) is preferred over a two-hop V2V path (cost: 200 + 200 = 400), despite having more hops, because the RSU-bridged path uses more stable links.
3.5. MPLS and SR Integration with SDN
The combined SDN-MPLS integration uses the SDN controller for centralized path computation and distributes MPLS labels for the computed paths. The controller operates in MPLS push mode, computing unique labels for each established link and forwarding them to vehicles and RSUs. Due to the VANET’s dynamic nature, links are interrupted and created continuously; for this reason, the SDN controller listens for new links and assigns labels as soon as they are established. SDN-MPLS integration is represented in Figure 3a and Figure 4a, using a different SDN controller architecture in each.
The SDN-SR integration encodes the complete forwarding path as a segment list in the packet header. The SDN controller computes segment paths for all source-destination pairs and distributes them to vehicles and RSUs. Each segment corresponds to a node or link in the computed path, and intermediate nodes forward packets by following the instructions of the segment list. Per-hop delay for SDN-SR is lower since there is no processing required at intermediate nodes for segment-based forwarding. For this simulation, the segment list is capped at a maximum of 20 segments to prevent packet size overflow in scenarios with many intermediate nodes. SDN-SR integration is represented in Figure 3b and Figure 4b, using a different SDN controller architecture in each.
Both MPLS and SR can operate with both suggested topology construction approaches. The protocol-based approach (SDN_MPLS_AODV, SDN_SR_AODV) uses equal weights for each entry of the routing tables. The distance-based approach with IS-IS metrics is used by the Fixed and Adaptive configurations (SDN_MPLS_AODV_Fixed, SDN_SR_AODV_Fixed, etc.), which route traffic through the more reliable link and infrastructure. The Adaptive algorithm uses periodic telemetry updates (every 1 s) to maintain more current topology information at the controller.
3.6. IS-IS Metric Computation
IS-IS is an Interior Gateway Protocol (IGP) that is used by the SDN controller to collect topology information and also push updates to nodes. Coupled with SR or MPLS, IS-IS is also used to distribute labels and segment lists throughout the network, facilitating this process. Each established link running IS-IS is assigned a metric (cost), which is associated with the link quality and reliability. The proposed Fixed metric mode assigns static weights based on link type, while the Adaptive mode uses telemetry updates including link stability, signal quality and vehicle interactivity to assign dynamic metrics.
The telemetry data (vehicle position, speed, and link distance) used in the metric computation are obtained from the SUMO mobility trace running on the realistic Tirana Road network, and are measured directly within the simulation at each telemetry interval. Each vehicle transmits this telemetry to the SDN controller by finding a path to the nearest RSU. The telemetry is treated as protocol control traffic and is included in the routing overhead KPI. Since it must reach the controller like any other traffic, in the AODV case the route towards the controller is established through on-demand route discovery, which contributes to the higher control overhead observed for the reactive protocol.
In the fixed metric mode, the controller pushes a fixed value metric for each link based on the link type. The infrastructure links (I2I) IS-IS metrics have the lowest cost (10), vehicle-to-infrastructure links (V2I) are assigned a moderate cost (100), and vehicle-to-vehicle links (V2V) are assigned the highest cost (200). This hierarchy facilitates the process for the Dijkstra SPF algorithm to select paths through the RSU backbone, utilizing their stability and bandwidth.
The Adaptive metric mode extends the Fixed metric allocation by incorporating dynamic link quality measurements and vehicle telemetry data. The metric calculation algorithm uses node speed and distance, link type V2V or V2I, link quality and lifetime coefficients, following a five-step computation process. The Adaptive approach provides a more responsive path optimization at the cost of higher computational load and routing overhead due to the frequent telemetry updates.
3.6.1. Algorithm Preliminary Inputs
The proposed metric computation algorithm uses three categories of input parameters:
- Measured network variables that are collected from vehicle telemetry every 1 s:
- d = distance between link endpoints (meters);
- su, sv = speed of vehicular nodes u and v (m/s);
- interface type = {V2I, V2V}.
- Algorithm tuning parameters that control the metric sensitivity and stability:
- α = 0.7, link quality weight;
- β = 0.3, link lifetime weight;
- γ = 0.75, hysteresis smoothing factor;
- H = 10%, hysteresis change threshold;
- K = 100, IS-IS metric scaling factor.
- System constants that are used to define the physical and protocol boundaries:
- R = 300 m, maximum V2V and V2I communication radius;
- Mmax = 10,000, IS-IS metric upper cap;
- ε = 10−6, guard value to prevent division by zero.
The weight values (α = 0.7, β = 0.3) give more importance to link quality than to the predicted lifetime, following the multi-metric routing principles used in vehicular networks [23]. The hysteresis parameters (γ = 0.75, H = 10%) keep the metric stable and avoid frequent path recalculations. These values were selected through preliminary simulation runs and kept the same across all configurations, in order to maintain a fair comparison. A more detailed sensitivity analysis of these parameters is left as future work.
3.6.2. Adaptive Metrics Calculation Algorithm
- Predicted Link Lifetime (T)
Estimates the time that a wireless link will survive before the two endpoints move out of range. For a V2I link, only the vehicle moves, so “T” is simply the remaining distance to the edge of radio range divided by the vehicle’s speed. For a V2V link, both nodes move, so the relevant speed is the relative speed between them. A higher “T” value means the link is expected to be stable for a significant amount of time; meanwhile, a lower “T” means it will break soon. The “ε” constant prevents division by zero when nodes are stationary, reflecting that a stationary link will not break.
V2I:
V2V:
- 2.
- Link Quality (Q)
Captures how strong the wireless connection is, using an exponential decay based on distance. When two nodes are close together (d ≈ 0), “Q” approaches 1.0 (good quality); meanwhile, when moving towards the maximum range R, Q drops toward e−1 ≈ 0.37 (poor quality). The exponential model reflects the real-world model that signal strength degrades non-linearly with distance.
V2I:
V2V:
- 3.
- Raw Metric Calculation (M_raw)
M_raw formula uses link lifetime, quality and type to calculate a provisional metric value. A link that is far away (low Q) or about to break (low T) produces a high metric (expensive path), while a close and stable link produces a low metric (cheap path). The α and β weights (0.7 and 0.3) indicate that link quality is more important than its lifetime, because a strong signal is a better predictor of successful packet delivery. M_raw also penalizes V2V links (W = 1.0) compared to V2I links (W = 0.5), since V2I links are inherently more stable and reliable than V2V links, where both endpoints are moving.
- 4.
- Metric Hysteresis (M_raw → M_smooth)
The hysteresis smoothing prevents the metric from oscillating rapidly. If the new candidate metric differs from the previously pushed metric by less than 10% (the H threshold), the controller maintains the old value, not to trigger Dijkstra recomputation and new labels/segments distribution. If the difference is larger than 10%, the candidate is accepted, and the smoothing factor γ = 0.75 combines 75% of the old value with 25% of the new raw value, in order for the new metric to be applied more smoothly in the network. Hysteresis application supports VANETs because vehicle speeds and distances change continuously, promoting path recalculation every telemetry cycle (every 1 s) and causing constant path switching, which degrades performance.
- 5.
- Final Metric (M_final)
The smoothed value is scaled by K = 100 to produce an integer IS-IS metric, which is rounded to an integer because IS-IS natively uses integer metrics. Metrics are limited at M_max = 10,000 to prevent unstable links from high metric values that could cause numerical issues in Dijkstra. The cap ensures that even the worst link has an associated cost and can be used as a last resort if no better path exists.
Overall, this implementation suggests that a vehicle connected to a stationary RSU with a strong signal receives a low link metric, while a distant V2V link between two fast-moving vehicles gets a high metric. Dijkstra naturally routes traffic through the cheap and stable infrastructure paths, which is why the Adaptive configurations achieve similar results to Fixed, but Adaptive can additionally distinguish between good and bad V2I and V2V links based on real-time conditions. Table 3, extracted from the simulation, displays the calculated metrics for vehicles with ID “0” and “1” at a specific time.
Table 3.
Adaptive metric computation example.
4. Results and Discussion
4.1. Simulation Setup
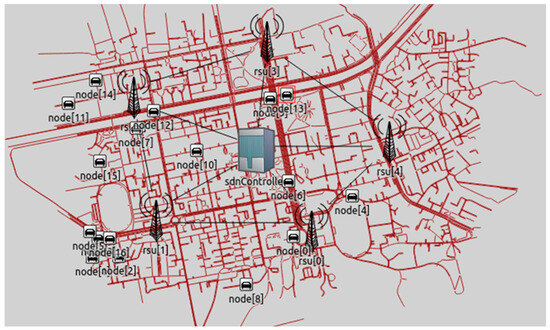
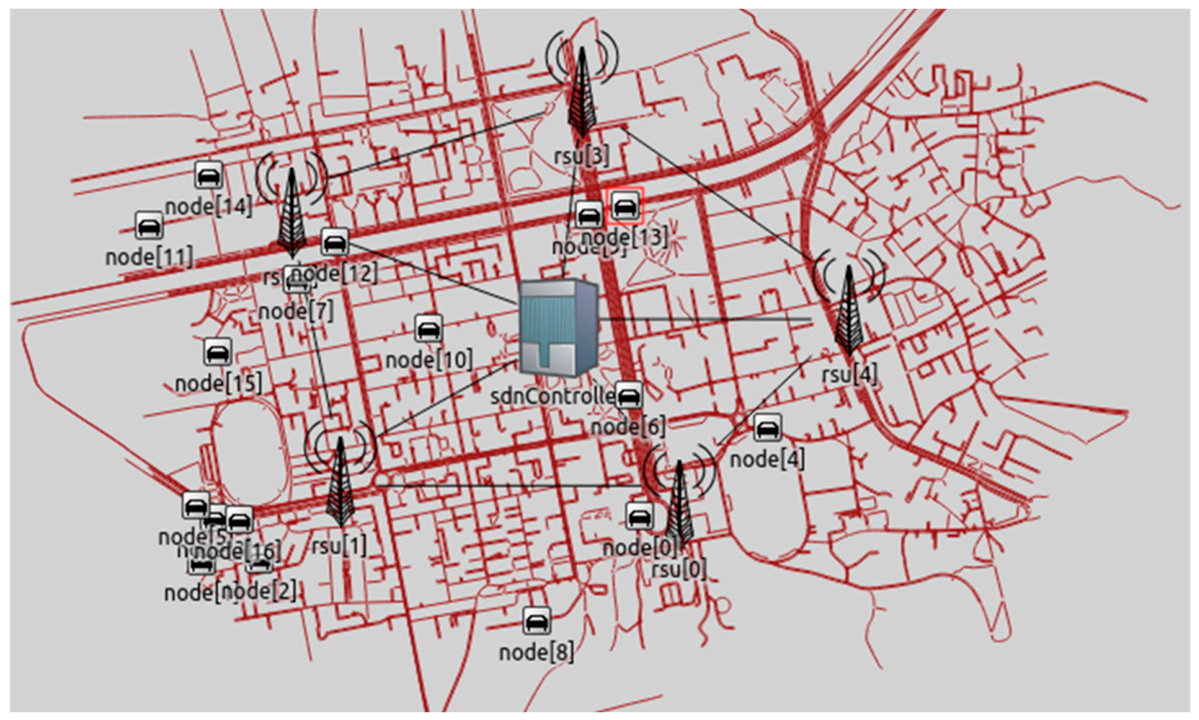
The simulation platform combines OMNeT++ 6.1 as the discrete-event engine, INET 4.5 for protocol-stack modeling, Veins 5.3.1 for the IEEE 802.11p PHY/MAC layer, and SUMO for vehicle mobility. In the simulation implementation, AODV and MPLS use the build-in INET 4.5 modules. The OLSR protocol, SDN controller logic and Segment Routing forwarding, along with the IS-IS metric computation, were implemented by the authors as custom modules on top of INET, since these are not available in the standard framework. Simulation parameters are summarized in Table 4, and the network infrastructure and elements are shown in Figure 5.
Table 4.
Simulation parameters.
Figure 5.
Simulation infrastructure, network elements and topology.
Each scenario was executed with 5 different random seeds, and the reported values are averaged across these runs. The evaluated metrics include:
- Packet Delivery Ratio (PDR): the ratio of data packets successfully received at their destinations to the total number of data packets generated by the sources.
- Average end-to-end delay: the mean time for a data packet to travel from the source to the destination, including all queuing, processing and propagation delays.
- Average jitter: the mean variation between the end-to-end delays of consecutive received packets, following the standard delay-variation definition.
- Throughput: the average rate of successfully delivered data at the destination, measured in kilobits per second (kbps).
- Routing overhead: the ratio of control traffic (route discovery, telemetry, and label or segment distribution messages) to the total traffic in the network.
4.2. Simulation Results
This section presents the simulation results for all nine configurations of the AODV and OLSR protocol families across CBR, VBR, and Burst traffic patterns (Table 5, Table 6, Table 7, Table 8, Table 9 and Table 10).
Table 5.
AODV scenario results under CBR traffic.
Table 6.
AODV scenario results under VBR traffic.
Table 7.
AODV scenario results under Burst traffic.
Table 8.
OLSR scenario results under CBR traffic.
Table 9.
OLSR scenario results under VBR traffic.
Table 10.
OLSR scenario results under Burst traffic.
The variation across seeds confirms the stability of the results: for PDR, throughput, and routing overhead, the variation remains narrow (on average ±2.5%, ±2.7%, and ±0.5%, respectively), while end-to-end delay and jitter show wider variation (on average ±12% and ±19%) due to their sensitivity to per-packet timing and queueing across seeds.
To confirm that the observed differences are not caused by random variation, Welch’s t-tests were performed between the key configurations using the 5 seeds. The improvements of SR-Fixed over both the default protocol and MPLS-Fixed are statistically significant for PDR and delay across all traffic patterns and both protocols (p < 0.001 in most cases). The PDR difference between SDN-SR and SDN-MPLS under the protocol-based topology is not significant, since they use the same paths and differ only in forwarding, while their delay difference is significant.
The simulation results reveal two distinct performance behaviors. The first four configurations (Default, MPLS, SDN, SDN-MPLS) and SDN-SR with protocol-based topology produce incremental improvements in delay and jitter while PDR remains essentially unchanged. The IS-IS weighted configurations (Fixed and Adaptive) break out of this pattern, producing clear improvements in PDR, delay, jitter, and throughput. This transition identifies the differences in the tested topology construction approaches in SDN-enhanced VANET performance.
4.3. Simulation Analysis
4.3.1. Progressive Improvement Analysis
The simulation results demonstrate clear and consistent performance improvements as each integration layer is added on top of the AODV and OLSR routing protocols. The progression from Default through MPLS, SDN, SDN-MPLS, and SDN-SR shows that each technology brings distinct improvements to specific KPIs, and that these improvements increase when the technologies are combined.
PDR remains essentially stable across these four configurations, varying by less than 1% within each traffic pattern. This confirms that MPLS and SDN improve forwarding efficiency without affecting the routing protocol’s path discovery mechanisms. The delay reduction follows a clear additive pattern: MPLS alone reduces delay by approximately 8% through label-switched forwarding, SDN alone achieves a consistent 15% reduction through centralized path optimization, and SDN-MPLS combines both effects for a 26% average reduction across all traffic patterns. The introduction of SDN-SR represents a significant advancement over SDN-MPLS, achieving 37% average delay reduction compared to the default, while maintaining substantially lower routing overhead (56% versus 91% for SDN-MPLS), an advantage examined in detail in Section 4.3.3.
For OLSR, the same improvement pattern is present throughout the tested baseline scenarios. MPLS reduces delay by 21% on average, a larger improvement than AODV, because OLSR’s proactive routing tables provide more stable label paths. SDN reduces delay by 16% and jitter by 22%, clearly showing that centralized path optimization particularly benefits the jitter performance of proactive protocols. SDN-SR achieves a 73% average delay reduction for OLSR, bringing average delay down from 120 ms to approximately 34 ms across all traffic patterns. This improvement reflects the synergy between OLSR’s pre-computed routing tables and SR’s source-routed forwarding, where the complete path is determined at the source node and intermediate nodes simply forward based on the segment list without consulting routing tables.
4.3.2. Topology Approach Comparison: Protocol-Based vs. IS-IS Weighted Metrics
The transition from protocol-based equal-weight topology to distance-based IS-IS weighted topology represents the most impactful architectural change evaluated in this study. The IS-IS weighted approach produces large-scale improvements in all KPIs, especially PDR, which was the one metric that the protocol-based SDN configurations were unable to improve.
With protocol-based topology (equal hop-count metrics), the SDN configurations achieve delay and jitter improvements, but PDR remains essentially unchanged from the default. This occurs because the SDN computation selects shortest hop-count paths, using AODV and OLSR routing tables, without discovering new routing possibilities, which usually are direct V2V paths. These paths have the fewest hops but traverse the most unstable links, as V2V connections break frequently due to vehicle mobility.
The IS-IS weighted metrics fundamentally change the path selection by assigning fixed or variable costs to V2V, V2I and I2I links. Integrating IS-IS makes it possible for the SDN controller to read the whole network topology without relying on the base protocol routing tables, allowing for better path computation. The result is that Dijkstra forwards traffic mainly through RSU infrastructure, leveraging the stability and capacity of fixed infrastructure nodes and their wired backbone.
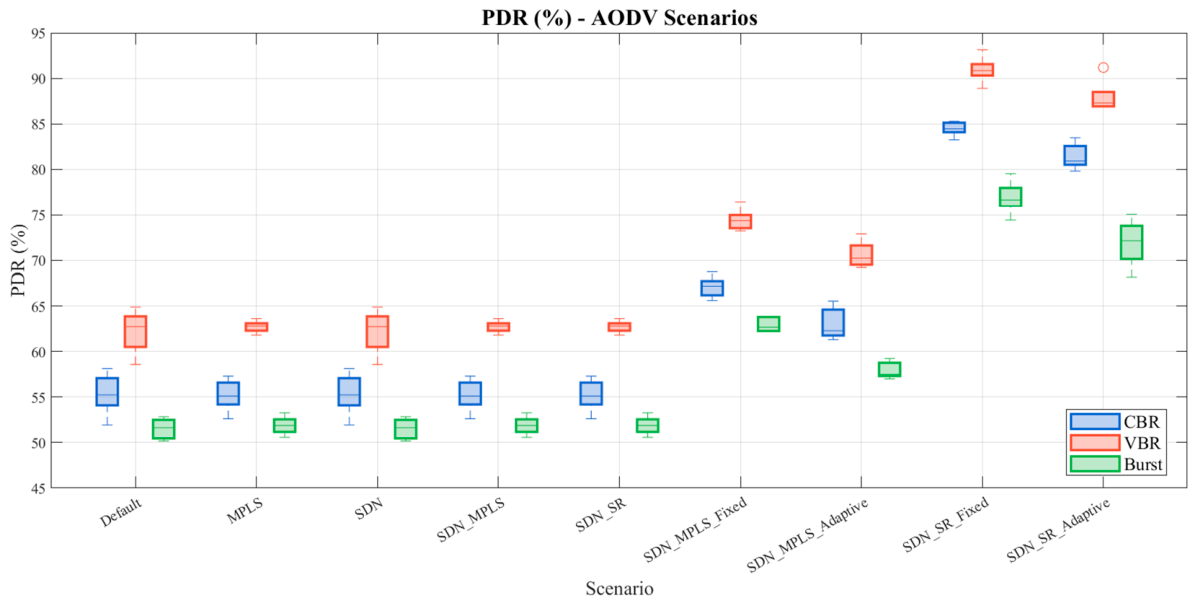
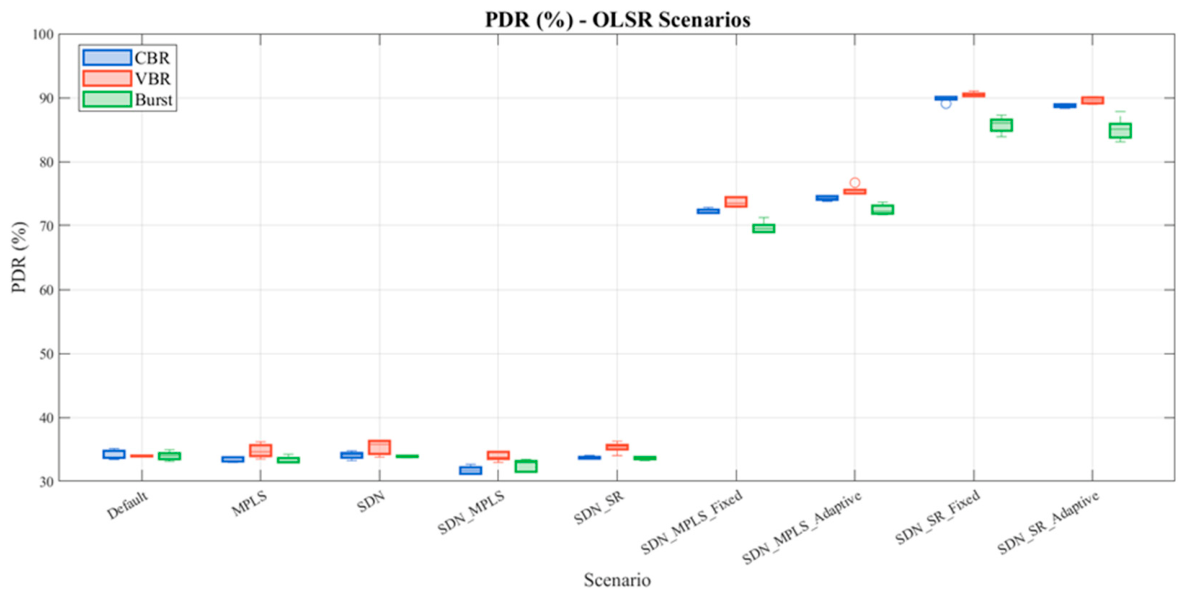
The PDR improvements from IS-IS metrics are noticeable. For AODV under CBR traffic, SR-Fixed increases PDR from 55.37% to 84.49%, a gain of 53%; meanwhile, for OLSR, the improvement is even more pronounced: SR-Fixed raises PDR from 34.14% to 89.85%, an increase of 163%. These improvements are consistent across all traffic patterns, confirming that IS-IS weighted routing creates more reliable paths regardless of the traffic characteristics. The PDR improvements directly translate to throughput gains, with AODV SR-Fixed achieving 63% higher throughput, and OLSR SR-Fixed achieving 181% higher throughput compared to the default, averaged across all traffic patterns.
IS-IS configurations achieve both higher PDR and lower routing overhead compared to the protocol-based configurations; this demonstrates that infrastructure-aware routing reduces the need for repeated control signaling. This happens because RSU-bridged paths break less often than direct V2V paths, so fewer route repairs and label updates are triggered. When paths remain valid for longer, the routing protocol and the SDN controller exchange fewer control messages to repair or rediscover broken routes, which lowers the total control traffic.
4.3.3. MPLS vs. Segment Routing Comparison
When comparing MPLS and SR under the same topology approach, SR consistently outperforms MPLS in every measured KPI. Under protocol-based equal-weight topology, SDN-SR reduces delay by 14% to 15% compared to SDN-MPLS while maintaining roughly half the routing overhead (56% versus 91% average). Under IS-IS weighted topology, the SR advantage becomes even more pronounced: SR-Fixed achieves 46% to 57% lower delay than MPLS-Fixed for AODV, and 67% to 73% lower delay for OLSR.
The PDR advantage of SR over MPLS is consistent across both protocols and all traffic patterns. For AODV with IS-IS Fixed metrics, SR achieves 22% to 26% higher PDR than MPLS across all traffic patterns. For OLSR, SR achieves 23% to 24% higher PDR. This advantage is due to SR’s source-routing architecture, since the complete path is encoded in the packet header and intermediate nodes do not need to maintain per-flow forwarding state. In a VANET environment, this feature is valuable because even when an intermediate node’s label table is not updated, SR packets can continue forwarding along the segment list.
The overhead advantage of SR over MPLS is equally significant, as SR eliminates the need for LDP label distribution broadcasts, which in the MPLS configurations consume substantial wireless bandwidth. Under Burst traffic, AODV SR-Fixed overhead is 17.86% compared to 38.28% for MPLS-Fixed, a reduction of more than half. This is true for OLSR as well: SR-Fixed at 16.54% versus MPLS-Fixed at 36.96%. This lower overhead contributes to higher PDR, as more wireless channel capacity is available for data packets when control traffic is reduced.
The results show that SR performs better than MPLS in both topology types. Since this advantage appears even in the protocol-based topology, where no infrastructure-aware costs are used, it confirms that the improvement of SR over MPLS comes from the forwarding method itself and not from the topology construction. The improvement seen in the distance-based configurations comes from the way the topology is built, which routes traffic through the more stable RSU infrastructure. SR improves forwarding regardless of topology, while the distance-based topology adds improvement on top of it.
4.3.4. Fixed vs. Adaptive Metric Comparison
The comparison between Fixed and Adaptive metric computation reveals that static IS-IS metrics are satisfactory and often preferable for this simulation environment. For AODV, Fixed performs slightly better than Adaptive across all KPIs: SR-Fixed achieves 3 to 5 percentage points higher PDR than SR-Adaptive, with 11% to 16% lower delay. MPLS-Fixed similarly outperforms MPLS-Adaptive by 4 to 6 percentage points in PDR.
For OLSR, Fixed and Adaptive produce nearly identical results for SR configurations, with PDR differences of less than 1.2 percentage points and delay differences of less than 1 ms. In the MPLS configurations, Adaptive slightly outperforms Fixed in PDR by 2 to 3 percentage points, while maintaining comparable delay and jitter. This suggests that OLSR’s proactive routing tables, combined with the more frequent telemetry updates of Adaptive, provide enough topology freshness to benefit from dynamic metric adjustments.
The general advantage of Fixed metrics in the AODV configurations can be attributed to the additional overhead and instability introduced by Adaptive’s frequent metric recalculations. Each metric update triggers a Dijkstra computation, which can cause path oscillation in the reactive AODV environment where routes are already changing due to on-demand discovery. The Fixed approach provides a more consistent path selection, reducing the number of forwarding changes. However, the Adaptive algorithm may be underperforming due to the weights, coefficients or calculation formulas used by the metric computation. A better algorithm could help Adaptive outperform Fixed performance indicators.
4.3.5. Traffic Pattern Sensitivity
The three traffic patterns are used to represent different types of vehicular applications, revealing their performance characteristics. VBR traffic consistently produces the best absolute PDR across both protocols and all configurations. AODV SR-Fixed achieves its peak PDR of 90.94% under VBR, and OLSR SR-Fixed reaches 90.46%. This occurs because VBR’s variable send intervals create periods of lower channel utilization that reduce collision probability and allow more packets to be delivered.
CBR traffic provides a steady baseline where the regular packet intervals guarantee consistent channel load. The configurations perform predictably under CBR, with SR-Fixed achieving 84.49% PDR for AODV and 89.85% for OLSR. The consistent intervals make CBR the most reliable traffic pattern for comparing configuration performance, because the load is evenly distributed in time, there is no overload in the wireless channel, so packet losses come mostly from link breaks rather than from collisions.
Meanwhile, Burst traffic presents the most challenging conditions, with concentrated packet transmissions causing channel saturation during burst periods. PDR is lowest under Burst for all configurations: AODV SR-Fixed drops to 76.89% and OLSR SR-Fixed to 85.72%. Sending packets back-to-back fills the channel faster than it can be cleared, so packets from neighboring vehicles collide during the burst window and are lost before reaching an intermediate node. However, the infrastructure-aware paths keep delivering a large share of the traffic, because after a packet reaches an RSU, it travels over the stable wired backbone instead of competing for the wireless channel.
4.3.6. AODV vs. OLSR Protocol Comparison
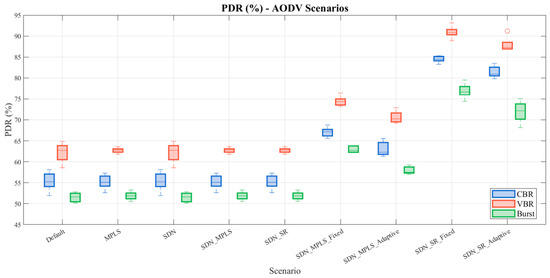
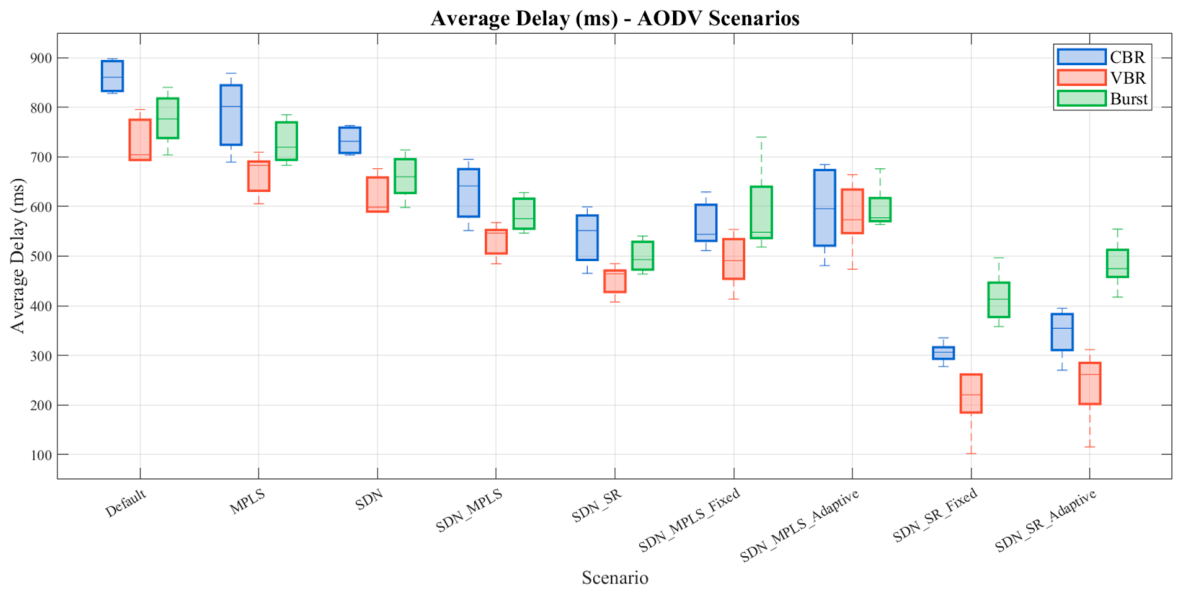
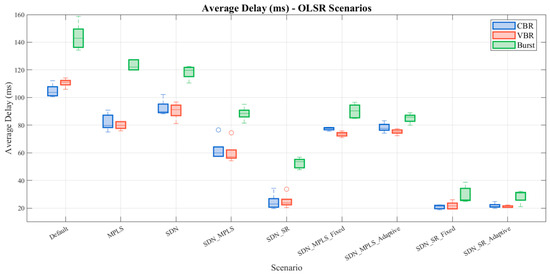
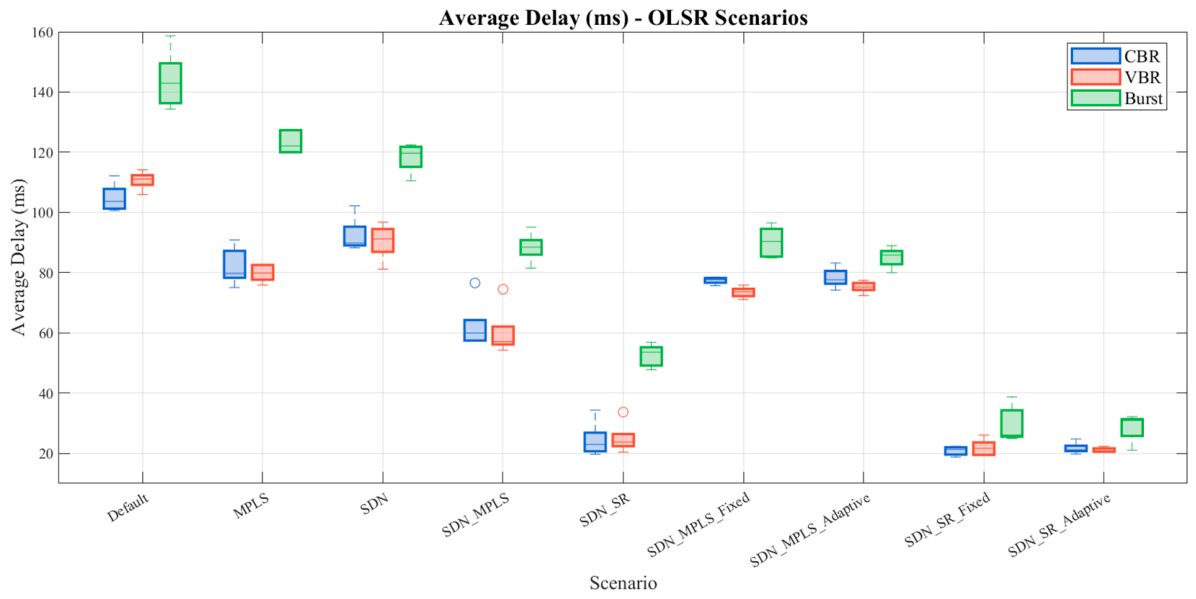
Under the default configurations, AODV’s advantage is in PDR (55% versus 34%), while OLSR’s advantage is in delay (105 ms versus 863 ms for CBR). With SR-Fixed and IS-IS metrics, OLSR surpasses AODV in PDR (89.85% versus 84.49% for CBR) while maintaining its delay advantage (20.83 ms versus 305.32 ms). This convergence occurs because the IS-IS weighted topology engages more of the RSU infrastructure, which changes the network dynamics. The distribution of results for PDR is displayed in Figure 6 and Figure 7, while for Average Delay in Figure 8 and Figure 9.
Figure 6.
The distribution of Packet Delivery Ratio results for the AODV Protocol.
Figure 7.
The distribution of Packet Delivery Ratio results for the OLSR Protocol.
Figure 8.
The distribution of Average Delay results for the AODV Protocol.
Figure 9.
The distribution of Average Delay results for the OLSR Protocol.
Overall, OLSR’s complete routing tables provide the SDN controller with a richer topology view, as OLSR discovers links through periodic Hello messages even when no data traffic is flowing. AODV, being reactive, only discovers routes when data needs to be sent, resulting in a sparser topology graph at the controller. In the IS-IS weighted topology, where path quality depends on having knowledge of all available links, OLSR’s proactive discovery has a clear advantage, achieving both higher PDR and lower delay than AODV.
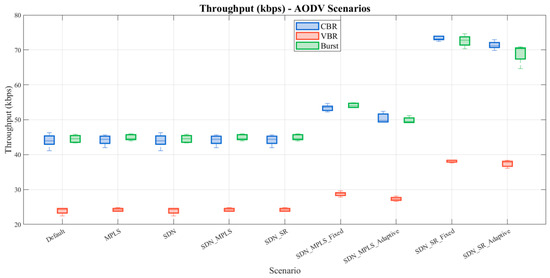
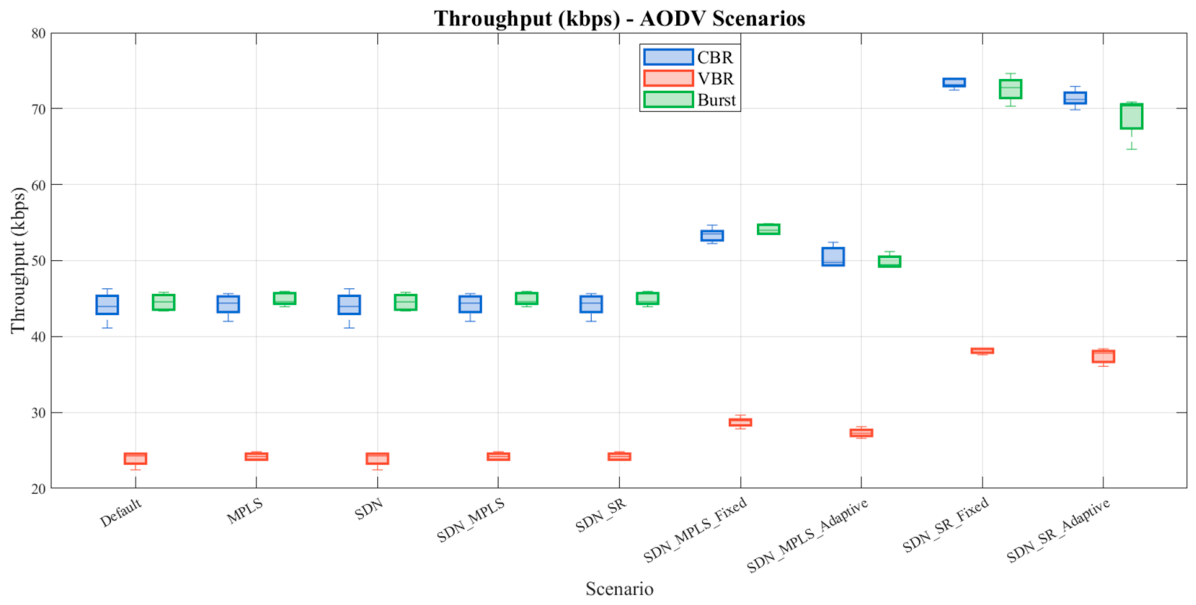
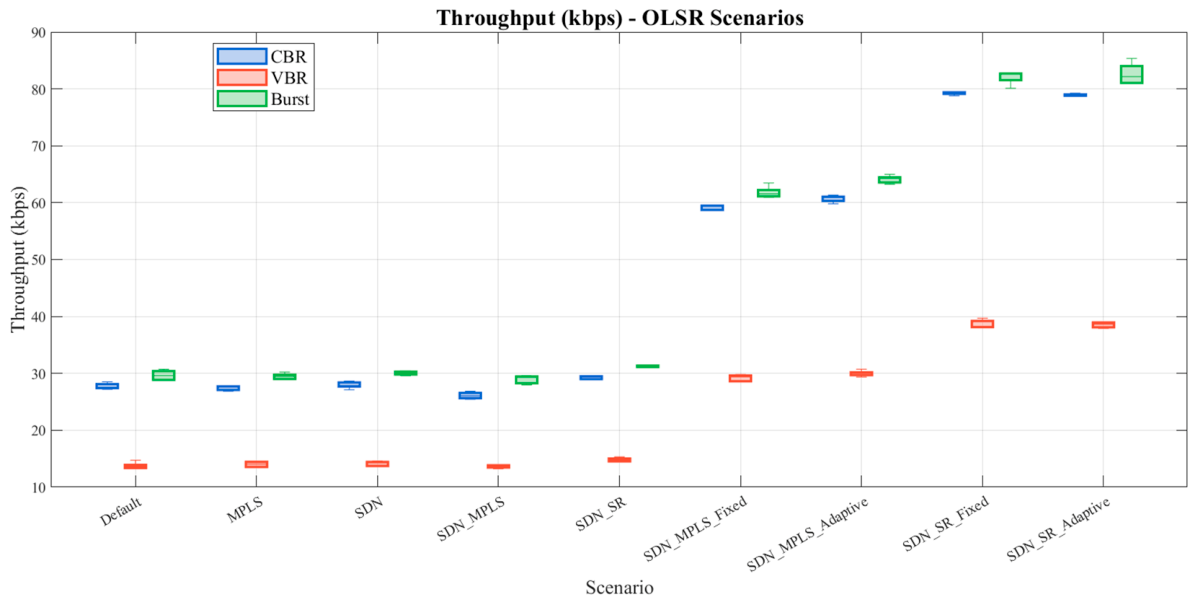
The throughput results, also shown by Figure 10 and Figure 11, reflect the PDR differences: OLSR SR-Fixed achieves 79.25 kbps under CBR compared to 73.32 kbps for AODV SR-Fixed. Jitter performance also favors OLSR in the advanced configurations, with OLSR SR-Fixed achieving 17.13 ms jitter versus 391.30 ms for AODV SR-Fixed under CBR. The jitter difference shows the benefit of OLSR pre-computed routes, which can fulfill delay-sensitive application requirements. AODV builds routes on demand, so packets sent while a route is being discovered or repaired experience very different delays compared to packets sent once the route is ready, producing high jitter. OLSR keeps routes ready in advance, so consecutive packets follow the same path with similar delays, keeping jitter low.
Figure 10.
The distribution of Throughput results for the AODV Protocol.
Figure 11.
The distribution of Throughput results for the OLSR Protocol.
Table 11 and Table 12 summarize the average change in percentage from the default configuration across all three traffic patterns for AODV and OLSR, respectively.
Table 11.
Average change over Default configuration for AODV scenarios.
Table 12.
Average change over Default configuration for OLSR scenarios.
4.4. Comparison with Existing Approaches
To position the results of this study within the existing literature, Table 13 compares the improvements achieved by the proposed SDN-SR configuration with those reported by related MPLS-VANET and SDN-VANET works. Kadir [7] applied MPLS on top of AODV and OLSR and reported an end-to-end delay reduction of 18% for AODV and 34.5% for OLSR compared to IP-based routing, together with a PDR increase from 0.306 to 0.388 for AODV and from 0.41 to 0.442 for OLSR. Fathy [16] used MPLS over a roadside backbone network and reported improved end-to-end delay, packet loss, and throughput, with the delay stabilizing at a near-constant rate compared to the fluctuating delay of direct V2V routing. More recently, Rajan et al. [24] applied adaptive SDN with priority algorithms in a vehicular network and reported improvements in QoS, traffic flow management, and scalability.
Table 13.
Comparison of the proposed approach with related works.
The proposed SDN-SR configuration with distance-based IS-IS metrics achieves larger improvements than these MPLS-only approaches, with delay reductions of 61% for AODV and 80% for OLSR, and PDR improvements of 49% and 161%, respectively, compared to the default protocols. The main reason for this larger improvement is that the previous MPLS-based works accelerate forwarding but continue to use the paths provided by the base routing protocol, which are usually direct V2V paths. The proposed approach instead uses IS-IS weighted metrics to redirect traffic through the more stable RSU infrastructure, which improves both delay and PDR at the same time.
It is important to note that a direct numerical comparison between these studies is limited, because the simulation parameters differ across works, including vehicle density, coverage area, radio propagation model, and simulator used. Kadir [7] and Fathy [16] use NS-2 with different network sizes, while Rajan et al. [24] use COOJA with a different traffic model. For this reason, the comparison in Table 13 is qualitative, showing the general level of improvement rather than an exact one-to-one benchmark. Nevertheless, the internal comparison across the nine configurations remains a controlled evaluation, as all configurations are tested under identical topology, mobility, and traffic conditions, which isolates the effect of each technology layer without the confounding factors present when comparing across different studies.
5. Conclusions
This paper presents a comprehensive evaluation of SDN-based traffic engineering with MPLS and Segment Routing applied to AODV and OLSR routing protocols in VANETs. Nine configurations were evaluated for each protocol, on a realistic urban simulation environment using three traffic patterns.
The results identify Segment Routing with distance-based IS-IS weighted metrics as the most effective configuration across all evaluated KPIs. SR-Fixed achieves the best PDR for both protocols: 84.49% to 90.94% for AODV and 85.72% to 90.46% for OLSR, representing improvements of 49% and 161%, respectively, compared to the default configurations. These improvements are followed by delay reductions of 61% and 80%, jitter reductions of 59% and 74%, and throughput increases of 63% and 181%, respectively, for AODV and OLSR. These gains come from routing traffic through the RSU backbone instead of the unstable V2V links, which is the common cause behind the improvement in every KPI.
The most critical finding of this study is the role of SDN coupled with IS-IS weighted metrics in leveraging network infrastructure for reliable packet delivery. The protocol-based equal-weight topology approach, despite providing delay improvements through centralized path optimization, fails to improve PDR because it selects shortest hop-count paths that traverse unstable V2V links. The IS-IS weighted approach, by assigning differentiated costs to V2V, V2I, and I2I links, redirects traffic through the RSU backbone, achieving dramatically higher PDR with simultaneously lower routing overhead. This finding demonstrates that in an SD-VANET deployment, topology-aware metric assignment is more important than the choice of forwarding technology.
Segment Routing consistently outperforms MPLS under the same topology conditions. When using IS-IS Fixed metrics, SR achieves 22% to 26% higher PDR and 46% to 73% lower delay compared to MPLS, while maintaining half of the routing overhead. These advantages come from SR’s forwarding model: encoding the complete path in the packet header eliminates the need for LDP label distribution broadcasts and removes the dependency on per-flow state at intermediate nodes, both of which are problematic in mobile environments where forwarding tables become stale quickly.
The comparison between Fixed and Adaptive metric computation shows that static IS-IS metrics are sufficient for the tested scenario; however, Adaptive does not lag behind. For AODV, Fixed surpasses Adaptive by 3 to 5 percentage points in PDR, as the frequent metric recalculations of Adaptive introduce path oscillation in the reactive routing environment. For OLSR, Fixed and Adaptive produce nearly identical results. The routing overhead analysis reveals that the most effective configurations also achieve the lowest overhead among all SDN-enhanced scenarios. SR-Fixed averages 37% overhead for AODV and 36% for OLSR, compared to 91% and 93% for protocol-based SDN-MPLS topology. This finding contradicts the assumption that more advanced traffic engineering necessarily increases control traffic, demonstrating instead that infrastructure-aware source routing can simultaneously improve performance and reduce overhead.
Another important finding is the comparison between AODV and OLSR under the advanced configurations. While AODV achieves higher PDR than OLSR in the default and basic integration scenarios, OLSR surpasses AODV with IS-IS weighted topology and SR: OLSR SR-Fixed achieves 89.85% PDR and 20.83 ms delay under CBR, compared to 84.49% and 305.32 ms for AODV SR-Fixed. This occurs because OLSR’s proactive routing tables provide the SDN controller with a more complete topology view, enabling better path computation through the RSU infrastructure and suggesting that proactive routing protocols are better suited for SDN-enhanced VANETs.
The reduction in routing overhead and control-plane signaling achieved by the proposed SDN-SR architecture indicates its potential to improve the energy efficiency of vehicular communication infrastructures. By minimizing unnecessary control packet exchanges, reducing redundant packet transmissions, and optimizing forwarding paths through RSU infrastructure, the proposed solution enhances network resource utilization and supports the development of more sustainable Intelligent Transportation Systems.
This study has some limitations that should be considered. The evaluation is based on a single urban topology with 50 vehicles and 5 RSUs, so the findings are not generalized to denser networks, higher vehicle speeds, or different infrastructure deployments. The IS-IS link costs and the adaptive metric parameters were selected to reflect link stability and were not tuned through a full sensitivity analysis. The SDN control model assumes the controller obtains topology information through periodic telemetry, without modeling controller processing delays or control-channel failures. Also, the lower overhead of Segment Routing compared to MPLS is observed in the studied urban scenario with limited path lengths, and could be affected in networks with much longer paths.
Future work can extend this research to include larger vehicle densities, additional urban and highway topologies, different RSU deployments and a sensitivity analysis of the IS-IS costs and Adaptive metric parameters to evaluate the robustness of the results. The centralized control model can also be evaluated under more realistic conditions by modeling controller processing delays, telemetry latency, and control-channel failures, to assess their effect on route optimality in highly dynamic environments. Further directions include integration with 5G cellular infrastructure and enhanced adaptive metric computation for real-time traffic engineering optimization.
Author Contributions
Conceptualization, R.H. and E.S.; methodology, R.H.; software, R.H.; validation, R.H. and E.S.; formal analysis, R.H.; investigation, R.H. and E.S.; resources, R.H.; data curation, R.H.; writing—original draft preparation, R.H.; writing—review and editing, R.H., E.S. and A.A.; visualization, R.H.; supervision, E.S.; project administration, E.S.; funding acquisition, A.A. All authors have read and agreed to the published version of the manuscript.
Funding
This research work is supported by the “Energy Efficiency and Renewable Energy Research Infrastructure” project of the Estonian Research Council under Grant TARISTU24-TK12.
Data Availability Statement
Data are included in the paper.
Conflicts of Interest
The authors declare no conflicts of interest.
Abbreviations
The following abbreviations are used in this manuscript:
| 5G | Fifth Generation Cellular Network |
| AODV | Ad hoc On-Demand Distance Vector |
| CBR | Constant Bit Rate |
| DSDV | Destination-Sequenced Distance-Vector |
| DSR | Dynamic Source Routing |
| GPSR | Greedy Perimeter Stateless Routing |
| I2I | Infrastructure-to-Infrastructure |
| IEEE | Institute of Electrical and Electronics Engineers |
| IGP | Interior Gateway Protocol |
| INET | OMNeT++ INET Framework |
| IP | Internet Protocol |
| IPv6 | Internet Protocol version 6 |
| IS-IS | Intermediate System to Intermediate System |
| ITS | Intelligent Transportation Systems |
| KPI | Key Performance Indicator |
| LDP | Label Distribution Protocol |
| LSP | Label Switched Path |
| MAC | Medium Access Control |
| MANET | Mobile Ad Hoc Network |
| MPLS | Multi-Protocol Label Switching |
| OBU | On-Board Unit |
| OLSR | Optimized Link State Routing |
| OMNeT++ | Objective Modular Network Testbed in C++ |
| PDR | Packet Delivery Ratio |
| PHY | Physical Layer |
| QoS | Quality of Service |
| RREP | Route Reply |
| RREQ | Route Request |
| RSU | Roadside Unit |
| SD-VANET | Software-Defined Vehicular Ad Hoc Network |
| SDN | Software-Defined Networking |
| SPF | Shortest Path First |
| SR | Segment Routing |
| SR-MPLS | Segment Routing over MPLS |
| SRv6 | Segment Routing over IPv6 |
| SUMO | Simulation of Urban Mobility |
| V2I | Vehicle-to-Infrastructure |
| V2V | Vehicle-to-Vehicle |
| VANET | Vehicular Ad Hoc Network |
| VBR | Variable Bit Rate |
References
- Qureshi, K.N.; Abdullah, A.H.; Iqbal, S. Improving quality of service through road side backbone network in VANET. J. Teknol. 2016, 78, 7–14. [Google Scholar] [CrossRef] [Scilit]
- Syla, V.; Lala, A. Evaluating Semi-Adaptive Signal Control Systems for Traffic Management: A Case Study of Key Intersections in Tirana. Int. J. Innov. Technol. Interdiscip. Sci. 2025, 8, 1021–1038. [Google Scholar] [CrossRef] [Scilit]
- Ghori, M.R. VANET routing protocols: Review, implementation and analysis. J. Phys. Conf. Ser. 2018, 1049, 012064. [Google Scholar] [CrossRef] [Scilit]
- Trivedi, H. Software Defined Network-Based Vehicular Adhoc Networks for Intelligent Transportation System: Recent Advances and Future Challenges. In Proceedings of the First International Conference on Futuristic Trends in Network and Communication Technologies (FTNCT 2018), Solan, India, 9–10 February 2018. [Google Scholar] [CrossRef] [Scilit]
- Wahid, I. Vehicular ad hoc networks routing strategies for ITS. Electronics 2022, 11, 2298. [Google Scholar] [CrossRef] [Scilit]
- Jaupi, O.; Spaho, E. A Systematic Literature Review on Integrating VANETs, VDTNs, 5G, and IoT for Smart Cities: Current Approaches, Challenges, and Future Directions. J. Trans. Syst. Eng. 2025, 3, 420–448. [Google Scholar]
- Kadir, G. Combining MPLS with ad-hoc routing protocols for a VANET congestion alert. Passer J. Basic Appl. Sci. 2024, 6, 242–253. [Google Scholar] [CrossRef] [Scilit]
- Ku, I. Towards software-defined VANET: Architecture and services. In Proceedings of the 2014 13th Annual Mediterranean Ad Hoc Networking Workshop (MED-HOC-NET), Piran, Slovenia, 2–4 June 2014. [Google Scholar] [CrossRef] [Scilit]
- Al-Heety, O.S. A comprehensive survey: Benefits, services, recent works, challenges, security and use cases for SDN-VANET. IEEE Access 2020, 8, 91028–91047. [Google Scholar] [CrossRef] [Scilit]
- Truong, N.B.; Lee, G.M.; Ghamri-Doudane, Y. Software defined networking-based vehicular adhoc network with fog computing. In Proceedings of the 2015 IFIP/IEEE International Symposium on Integrated Network Management (IM), Ottawa, ON, Canada, 11–15 May 2015. [Google Scholar] [CrossRef] [Scilit]
- Mekki, T.; Jabri, I.; Rachedi, A.; Chaari, L. Software-defined networking in vehicular networks: A survey. Emerg. Technol. Telecom. 2021, 33, e4265. [Google Scholar] [CrossRef] [Scilit]
- Kai, K.; Cong, W.; Tao, L. Fog computing for vehicular ad-hoc networks: Paradigms, scenarios, and issues. J. China Univ. Posts Telecommun. 2016, 23, 56–96. [Google Scholar] [CrossRef] [Scilit]
- Yeferny, T.; Hamad, S. Vehicular ad-hoc networks: Architecture, applications and challenges. arXiv 2021, arXiv:2101.04539. [Google Scholar]
- Azzoug, Y.; Boukra, A. Bio-inspired VANET routing optimization: An overview. Artif. Intell. Rev. 2020, 54, 1005–1062. [Google Scholar] [CrossRef] [Scilit]
- Tripp-Barba, C.; Zaldívar-Colado, A.; Urquiza-Aguiar, L.; Aguilar-Calderón, J.A. Survey on Routing Protocols for Vehicular Ad Hoc Networks Based on Multimetrics. Electronics 2019, 8, 1177. [Google Scholar] [CrossRef] [Scilit]
- Fathy, M. Improving QoS in VANET using MPLS. Procedia Comput. Sci. 2012, 10, 1018–1025. [Google Scholar] [CrossRef] [Scilit]
- Ventre, P.L.; Salsano, S.; Polverini, M.; Cianfrani, A.; Abdelsalam, A.; Filsfils, C.; Camarillo, P.; Clad, F. Segment Routing: A comprehensive survey of research activities, standardization efforts and implementation results. IEEE Commun. Surv. Tutor. 2020, 23, 182–221. [Google Scholar] [CrossRef] [Scilit]
- Wu, D.; Cui, L. A comprehensive survey on Segment Routing Traffic Engineering. Digit. Commun. Netw. 2023, 9, 990–1008. [Google Scholar] [CrossRef] [Scilit]
- Boregowda, V.K.S.; Arya, R.; Kapoor, T.; Satapathy, P.; Suma, N.G.; Gowda, D.R. Performance Evaluation of Segment Routing Protocols in Modern Networks. J. Internet Serv. Inf. Secur. 2025, 15, 111–128. [Google Scholar] [CrossRef] [Scilit]
- Davoli, L.; Veltri, L.; Ventre, P.L.; Siracusano, G.; Salsano, S. Traffic engineering with Segment Routing: SDN-based architectural design and open source implementation. In Proceedings of the 2015 Fourth European Workshop on Software Defined Networks, Bilbao, Spain, 30 September–2 October 2015. [Google Scholar] [CrossRef] [Scilit]
- Wijesekara, P.A.D.S.N. An optimization framework for data collection in SDVNs. Sensors 2023, 23, 1600. [Google Scholar] [CrossRef] [Scilit]
- Ghafoor, H.; Koo, I. CR-SDVN: A cognitive routing protocol for software-defined vehicular networks. IEEE Sens. J. 2017, 18, 1761–1772. [Google Scholar] [CrossRef] [Scilit]
- Hussein, N.H.; Koh, J.S.P.; Yaw, C.T.; Tiong, S.K.; Benedict, F.; Yusaf, T.; Kadirgama, K.; Hong, T.C. SDN-Based VANET Routing: A Comprehensive Survey on Architectures, Protocols, Analysis, and Future Challenges. IEEE Access 2024, 12, 126801. [Google Scholar] [CrossRef] [Scilit]
- Rajan, S.J.; Narayanaswamy, S.; Balashanmugam, T.; Sengottaiyan, K.; Selvaraj, A.; Majumder, P.; Al-Rasheed, A.; Getahun, M.; Soufiene, B.O. Efficient traffic management with adaptive SDN in vehicular networks. Sci. Rep. 2025, 15, 11785. [Google Scholar] [CrossRef] [Scilit] [PubMed]
- Qafzezi, E.; Bylykbashi, K.; Spaho, E.; Barolli, L. A New Fuzzy-Based Resource Management System for SDN-VANETs. Int. J. Mob. Comput. Multimed. Commun. 2019, 10, 1–12. [Google Scholar] [CrossRef] [Scilit]
- Chahal, M.; Harit, S. Network selection and data dissemination in heterogeneous SDVN. Comput. Netw. 2019, 161, 32–44. [Google Scholar] [CrossRef] [Scilit]
- Islam, M.M.; Khan, M.T.R.; Saad, M.M.; Kim, D. Software-defined vehicular network (SDVN): A survey on architecture and routing. J. Syst. Archit. 2021, 114, 101961. [Google Scholar] [CrossRef] [Scilit]
- Mershad, K.; Artail, H. Performance analysis of routing in VANETs using the RSU network. In Proceedings of the 2011 IEEE 7th International Conference on Wireless and Mobile Computing, Networking and Communications (WiMob), Shanghai, China, 10–12 October 2011. [Google Scholar] [CrossRef] [Scilit]
- IEEE; Std 802.11p-2010; Part 11: Wireless LAN Medium Access Control (MAC) and Physical Layer (PHY) Specifications, Amendment 6: Wireless Access in Vehicular Environments. IEEE: New York, NY, USA, 2010.

Disclaimer/Publisher’s Note: The statements, opinions and data contained in all publications are solely those of the individual author(s) and contributor(s) and not of MDPI and/or the editor(s). MDPI and/or the editor(s) disclaim responsibility for any injury to people or property resulting from any ideas, methods, instructions or products referred to in the content. |
© 2026 by the authors. Licensee MDPI, Basel, Switzerland. This article is an open access article distributed under the terms and conditions of the Creative Commons Attribution (CC BY) license.