


Abstract
Smart and sustainable mobility increasingly relies on distributed sensing, low-power communication technologies, and cloud-based ICT platforms. This article presents a comprehensive scientific analysis of the technological foundations of sensitized mobility, reviewing the state of the art in embedded sensing, distributed systems, and communication paradigms for future mobility challenges. The research project “MOST” and in particular its subgroup “Spoke 5” falls within this framework of sustainable and sensorized mobility, with numerous activities in data collection, analysis, and field experimentation. In order to allow data collection, retention and analysis, one of the challenges that we must address is the definition of an adequate ICT architecture. The core contribution of this work is the presentation of the MOST ICT architecture, designed as a containerized, scalable, and resilient infrastructure capable of integrating heterogeneous data coming from field-deployed systems. In addition, it discusses the primary research challenges encountered in the definition and development of the presented architecture by examining two representative case studies within the MOST-Spoke 5 research project: renewable energy charging stations for light electric vehicles and cyclists monitoring systems.
Keywords:
smart cities; smart mobility; IoT; light mobility; sustainable mobility; charging stations 1. Introduction
Urban mobility systems are undergoing a profound transformation driven by the imperatives of sustainability, safety, energy efficiency, and digital integration. Smart mobility represents an emerging paradigm where traditional transportation systems evolve into interconnected, data-driven ecosystems. The concept is rooted in the integration of information technologies, intelligent infrastructures, and sensor-equipped mobility assets, enabling real-time monitoring, optimization, and prediction of mobility flows.
The increasing prevalence of micromobility, including bicycles, e-bikes, cargo bikes, scooters, and autonomous small-scale vehicles, has amplified the need for sensing capabilities embedded directly into mobility platforms. Such devices capture information on rider behavior, vehicle dynamics, system performance, and environmental conditions. These data streams allow operators, municipalities, and researchers to develop new services, optimize mobility infrastructures, and contribute to sustainable development goals.
The main contribution of this work lies in the holistic and comprehensive approach adopted for the design, integration, deployment, and operational assessment of a unified ICT architecture for heterogeneous light mobility systems deployed in real-world field conditions, within the framework of the MOST Spoke 5 project. The architecture is intended to act as a common digital backbone for different classes of mobility assets, including bicycle-mounted devices, renewable energy charging stations, and environmental monitoring nodes. This fills a critical gap in the state of the art, as existing studies typically address isolated technological components or specific mobility scenarios rather than the end-to-end implementation and validation of an integrated ICT infrastructure. Although based on well-known technologies, the proposed solution offers advantages in terms of heterogeneous use-case integration, modularity, reproducibility, field deployability, observability, and extensibility. Two carefully selected use cases confirm that typical requirements of the considered application scenario can be effectively satisfied by the proposed backend architecture. More specifically, the contributions relevant to the paper audience are as follows:
- A comprehensive ICT architecture is developed, acting as a laboratory for addressing the heterogeneous needs of light mobility and micromobility services.
- A resource (CPU, memory, network traffic)-monitoring analysis of the deployed infrastructure is conducted, offering concrete baselines for capacity planning in comparable scenarios.
- Two detailed case studies are outlined, grounding the architectural choices: a BlackBox cyclist safety monitor, and a portfolio of four renewable energy e-bike charging stations. These are deployed at real events such as the Giro-E.
Regarding the last item, although dedicated studies exist on IoT monitoring frameworks for renewable energy communities and on LoRaWAN deployments, application-driven case studies combining both within the light mobility context are few. The paper addresses this intersection by discussing findings from real deployment data rather than simulations or laboratory prototypes alone.
The remainder of the paper is organized as follows. Section 2 discusses the existing frameworks and the related works on the subject. Section 3 describes smart mobility as a data-centric ecosystem, addressing needs and requirements. Section 4 then presents the implemented backend, which has been tested against the experimental scenarios considered in Section 5, namely cyclist safety monitoring and renewable energy charging stations for light mobility options. Performance indicators and results are subsequently discussed in Section 6. Finally, the concluding section summarizes the main findings and outlines the broader implications of the work. For the sake of completeness, a taxonomy and framing of light mobility are added in Appendix A, which serves as the conceptual scaffold to properly position the technical design choices. Additionally, Appendix B reviews the main limitations and research directions emerging from the literature, with particular attention to interoperability, scalability, data quality, and governance issues.
2. Related Works and the MOST Spoke 5 Project
Despite its potential, the combined scenario of light and smart mobility introduces challenges that are directly relevant to ICT architectures and sensorized mobility systems. Previous studies span urban testbeds, shared mobility hubs, Mobility-as-a-Service (MaaS) pilots, large-scale electric vehicle and e-bus demonstrations, Sustainable Urban Mobility Plans (SUMPs), and rural or peripheral mobility initiatives. Across these strands, authors not only report technical achievements but also systematically document governance challenges, data and interoperability issues, user acceptance barriers, financial and regulatory constraints, and the persistent difficulty of scaling pilots into permanent services. In what follows, we review this body of work with a specific focus on research projects and their reported shortcomings and drawbacks, highlighting how governance arrangements, data infrastructures, business models, and evaluation practices condition the contribution of smart and electric mobility projects to broader sustainability objectives.
2.1. Related Projects
Related work on smart and electric mobility, particularly in projects of national or strategic interest, highlights a rich body of experience in which technical innovation is tightly interwoven with governance, behavioral, and institutional challenges. Urban testbeds such as “Mobility Lab Helsinki” have been used to experiment with digital twins [1], sensor networks, and new shared mobility services within a controlled but real-world setting. These initiatives emphasize the importance of a permanent data backbone and open data catalogs that allow pilot results to be reused and scaled, rather than remaining isolated experiments. At the same time, the literature on these initiatives consistently reports the high coordination effort required across municipal departments, the complexity of permitting and street management, and the difficulty of managing private partners’ expectations when pilots do not automatically lead to procurement or long-term contracts [2].
A large number of European projects have focused specifically on shared mobility hubs and intermodal nodes. The “ShareDiMobiHub” [3] and “SmartHubs” [4] projects, for example, have developed and tested physical hubs in which bike-sharing, car-sharing, and micromobility services are integrated with public transport. Their evaluations show that such hubs perform best when they are strongly embedded in the public transport network and when service frequency, pricing, and information are jointly planned. However, they also document recurrent drawbacks: actual use often remains modest despite relatively high awareness; in car-dependent or peripheral areas, hubs may be used more as parking or parcel-delivery infrastructure than as genuine shared mobility access points. Project partners underline governance complexity, especially when private operators, municipalities, and transport authorities must agree on standards such as TOMP-API, and emphasize the fragility of business models once project funding ends.
In parallel, MaaS pilots provide insights into how digital integration can support more sustainable mobility patterns, but also reveal structural barriers. The “BIPforMaaS” [5] pilot in the Piedmont Region illustrates a public governance model in which a regional authority coordinates a MaaS platform aggregating multiple operators and modes. This pilot demonstrates that such governance can protect non-discriminatory access, align services with public policy objectives, and achieve measurable environmental benefits. Nevertheless, the evaluation also reports limited user uptake, the need for sustained communication and marketing, and protracted negotiations over data sharing and revenue distribution with private actors. Corporate or institutional MaaS pilots reach similar conclusions: even when staff are offered a user-friendly application to book low-carbon modes for business travel, existing organizational cultures, travel policies, and cost-accounting rules often encourage a continued preference for private cars or air travel. Integration of these tools with legacy IT systems emerges as a further technical and organizational drawback.
Electric mobility projects, particularly those framed as national or regional flagship initiatives, provide a complementary set of lessons learned. High-level syntheses by international organizations, such as the “United Nations Economic Commission for Europe”, and multi-country projects like “E-MOB” [6], stress that electric vehicle (EV) deployment cannot be treated as a purely technological substitution. Successful projects treat e-mobility as part of a broader industrial and energy strategy, linking vehicle uptake with grid reinforcement, renewable generation, and local industrial capacity. At the same time, these studies point to recurring barriers: fragmented responsibilities for charging infrastructure, slow and unpredictable permitting procedures, and limited planning tools available to local authorities for deciding where and how to deploy public charging. In many contexts, affordability constraints and the absence of a robust second-hand EV market limit adoption even when public incentives are available.
Project-level demonstrations, such as the electric bus corridor in Milton Keynes and similar e-bus deployments in other cities, further illuminate operational and economic risks [7]. Detailed ex-post evaluations show that route design, layover times, and charging strategies are critical to maintaining reliability and avoiding range anxiety. Overly optimistic assumptions about battery degradation, electricity prices, and vehicle utilization often lead to disappointing life cycle economics compared with those projected in feasibility studies. Furthermore, these projects expose skill gaps among maintenance staff, emergency personnel, and depot operations, revealing the need for systematic training and new procedures. The lesson learned from these cases is that electric mobility requires not only vehicles and charging hardware, but also adapted operational planning, institutional learning, and risk-management frameworks.
SUMP and related planning frameworks constitute another major strand of relevant literature. Comparative analyses of best practices in sustainable urban mobility highlight that substantial and durable changes in modal split typically result from a coherent mix of “pull measures” (high-quality public transport, cycling infrastructure, shared mobility) and “push measures” (parking management, congestion charging, low-emission zones). Case studies of SUMP implementation in European and non-European cities, such as “CIVITAS” [8], show that the methodology can provide a robust structure for stakeholder participation, indicator selection, and monitoring. However, they also reveal significant implementation challenges: interdepartmental coordination is often weak, especially where land-use, transport, and environment responsibilities are split; data availability and quality are uneven; and political cycles may be shorter than the time horizon required to see benefits from structural measures.
Sustainable mobility initiatives in specific functional areas, such as ports and logistics zones, reinforce these findings. Projects that introduce internal shuttle services, hybrid buses, or other low-emission solutions for employee and freight movements within ports demonstrate the potential for emission reductions and improved accessibility within complex industrial environments. At the same time, these projects report limited initial awareness among users, scheduling and reliability problems that reduce attractiveness, and institutional inertia in organizations whose core mission is not transport. These experiences underline that even in confined, employer-controlled settings, behavioral changes and service design require dedicated resources and iterative adaptation.
Rural and peripheral mobility has been addressed in projects such as “SMARTA” [9] and similar initiatives that test demand-responsive transport, shared taxis, or community-based services. Their assessments show that flexible, small-scale solutions can significantly improve accessibility in low-density areas and support social inclusion. Yet they also emphasize that many such services are financially fragile once pilot subsidies end and that robust evaluation frameworks are needed to demonstrate their value to national or regional authorities. The risk of pilot graveyards, whereby promising services disappear once project funding ends, is a recurrent theme in this strand of the literature.
Finally, meta-studies and national surveys of smart mobility projects offer a more systemic perspective. Large-scale surveys of Italian municipalities and comparative analyses of Italian and European cases classify projects by type (traffic management, shared mobility, ITS, e-mobility, MaaS) and map them against contextual variables such as city size, institutional capacity, and funding sources [10,11,12]. These works converge on a set of cross-cutting limitations: scarcity and fragmentation of funding, lack of specialized skills in smaller administrations, weak evaluation practices, and the tendency to implement technology-driven pilots without a clear plan for long-term integration into planning and budgeting processes. At the same time, they identify promising trajectories in which smart mobility solutions are tightly coupled with SUMP processes, national regulatory frameworks, and explicit sustainability targets.
2.2. The MOST Spoke 5 Project
Against this backdrop, the “MOST” project, and in particular “Spoke 5”, can be read as a deliberate attempt to operationalize these lessons within a national-interest initiative focused on light and smart mobility. On the one hand, MOST shares key features with earlier testbeds, MaaS pilots, and e-mobility demonstrations: it targets connected, sensorized light vehicles and smart infrastructure; it foregrounds data collection and analytics as enablers of safer, more efficient, and more sustainable mobility; and it is implemented in partnership with public authorities and private operators. On the other hand, its design explicitly addresses several weaknesses highlighted in the literature, in particular the fragmentation of pilots and the lack of a durable digital backbone. Within MOST Spoke 5, one of the main focal points is the ICT architecture; in this context, the project proposes a containerized, scalable ICT architecture that is conceived from the outset as a shared platform for heterogeneous mobility applications rather than as a project-specific prototype. By embedding this architecture within broader planning and governance processes, and by focusing on light and electric mobility as priority application domains, the project positions itself not simply as another experimental deployment, but as a contribution to bridging the pilot-to-scale gap and strengthening the data, organizational, and technological foundations of sustainable mobility policies. As a concluding remark, this work does not claim novelty in each individual technology, but in their end-to-end integration and validation as a coherent, open infrastructure that can effectively support research in the field of sustainable, sensorized light mobility.
Table 1 summarizes the main strands of related work discussed in this section, grouping previous initiatives according to their focus, lessons learned, and recurrent limitations. This synthesis helps position the MOST Spoke 5 experience within the broader landscape of smart, shared, electric, and sustainable mobility projects, while emphasizing the common governance, technical, and organizational challenges that motivate the proposed ICT architecture.
Table 1.
Summary of related work on smart, shared, electric, and sustainable mobility initiatives.
3. Smart Mobility as a Data-Centric Ecosystem
Smart mobility is increasingly conceptualized as a data-centric ecosystem composed of sensing, communication, and intelligence layers. Micromobility applications, including bike-sharing, scooter-sharing, and lightweight cargo bike services, impose distinctive communication requirements that differ substantially from those of conventional vehicular systems. These platforms typically involve mobile devices operating at relatively low speeds, generally in the range of 0–25 km/h for pedal-assisted e-bikes and shared e-scooters, with effective urban speeds often closer to 10–20 km/h, depending on infrastructure, traffic conditions, and local regulations. For example, the observational study [15] reported an average measured e-scooter speed of approximately km/h. In the Italian context, electric scooters are commonly subject to speed limits of 20 km/h, which are reduced to 6 km/h in pedestrian areas.
3.1. Distributed Sensing for Mobility
The sensing subsystem is also typically composed of heterogeneous devices characterized by markedly different sampling rates, data volumes, and communication requirements. Inertial measurement units (IMUs), integrating accelerometers and gyroscopes, are among the most relevant sensors for motion analysis, vehicle dynamics, and anomaly detection; although they commonly operate in the range 25–200 Hz and may exceed 1 kHz, the transmission of raw measurements is generally impractical, since it can generate data streams on the order of tens of kilobytes per second. For this reason, edge-based feature extraction is usually preferred, also considering that modern IMUs increasingly embed machine-learning-oriented processing capabilities that reduce both energy consumption and transmitted data volume. Global Navigation Satellite System (GNSS) receivers, typically operating at 1–10 Hz, provide position and velocity information with relatively modest data rates, making them well suited to periodic telemetry applications. Distance-sensing technologies such as single-point LiDAR or time-of-flight modules may span a wide range of update rates, from a few tens of hertz to nearly 1 kHz, but in light mobility scenarios they are generally exploited through locally processed events or aggregated indicators rather than continuous raw transmission. Similarly, ultrasonic sensors, which usually operate at relatively low frequencies, are adequate for sparse status updates and short-range obstacle detection. By contrast, cameras and MEMS microphones represent the most data-intensive sensing modalities: video streams, even when compressed, can reach the megabit-per second scale, whereas audio sampled at several kilohertz rapidly becomes expensive in both bandwidth and energy terms. Consequently, these sensors are rarely used for continuous cloud transmission in lightweight mobile platforms; instead, they are more commonly associated with snapshot-based reporting, event-driven uploads, or edge analytics [16]. Finally, electrical sensing devices, including current and voltage monitors as well as battery fuel-gauge algorithms [17], operate at very low rates and generate negligible traffic, yet they are essential for diagnostics, energy monitoring, and fleet-management functions. Overall, this sensor landscape shows that, despite the coexistence of high-rate local sensing and low-rate monitoring channels, most data actually transmitted over the network in smart and light mobility applications consists of compact telemetry packets or event-based messages, thereby making communication protocol selection more dependent on reliability, intermittency tolerance, security, and operational efficiency than on pure throughput requirements.
3.2. Communication Technologies for Mobility
From a communication standpoint, micromobility is a form of “slow vehicular” mobility: it is less demanding than automotive use cases in terms of Doppler effects and very frequent handovers, yet it still entails frequent changes in radio conditions due to urban canyons, multipath propagation, and repeated cell transitions. Consequently, the principal bottleneck is rarely peak throughput; rather, it lies in the combined challenge of ensuring robust real-world coverage, low energy consumption, acceptable command latency, operational scalability, and sustainable connectivity costs. A fundamental trade-off exists in micromobility communications: techniques adopted to improve robustness and extend coverage may simultaneously reduce energy efficiency and network capacity. Therefore, relying solely on nominal range considerations is not effective; instead, the selected technology must carefully balance node density, radio-parameter adaptation, infrastructure redundancy, and the energy constraints of battery-powered devices.
A further source of complexity is the marked heterogeneity of micromobility ecosystems. Fleet deployments include battery-powered onboard units installed on scooters and bicycles, auxiliary wireless sensors such as wheel, brake, or anti-theft devices, grid-powered infrastructure including docking stations, charging stations, and roadside units, and remote photovoltaic-powered devices such as environmental sensors placed along cycle paths, traffic counters, or micro-weather stations. These heterogeneous energy and deployment conditions strongly affect communication technology selection. LoRaWAN, for instance, is inherently designed according to a battery-first paradigm and is therefore well suited to low-power end devices, whether fixed or mobile, that transmit relatively small and infrequent data payloads [18]. For this reason, LoRaWAN is a strong candidate communication technology for these smart mobility applications because it is designed for long-range, low-power, low-cost Internet of Things connectivity. This technology-driven suitability is reflected in the literature, where LoRaWAN has been evaluated across diverse smart mobility scenarios, as summarized in Table 2.
Table 2.
Comparison of LoRaWAN smart mobility solutions.
In contrast with LoRaWAN, cellular technologies such as 4G and 5G, especially IoT-oriented extensions, can also support energy-efficient operation through mechanisms such as Power-Saving Mode (PSM) and extended Discontinuous Reception (eDRX), but typically at the cost of reduced reachability, longer wake-up times, or latency trade-offs that may be problematic for interactive commands and time-sensitive control functions. This trade-off is also highlighted in [27], where LoRaWAN is systematically compared with DASH7 and NB-IoT for Internet of Mobile Things scenarios in terms of coverage, cost, battery lifetime, latency, QoS, reliability, and mobility support. This distinction is crucial because micromobility generates highly heterogeneous traffic patterns, ranging from low-frequency heartbeat telemetry and diagnostics to higher-rate positioning and geofencing updates during a trip, asynchronous safety or tampering alarms, and, in some cases, bandwidth-intensive firmware updates.
3.3. Middleware for Mobility
The selection of communication mechanisms and ICT infrastructure for edge-cloud interaction is closely related to broader IoT architectural requirements. IoT systems must support heterogeneous devices, low-power operation, interoperability, resilience, and scalable architectures, as highlighted in prior work on IoT challenges and reference architectures [28]. Moreover, IoT adoption in industrial and organizational contexts increasingly depends on the ability to collect, transfer, process, and exploit real-time data across sensing, communication, software, and service layers [29]. Accordingly, regarding data dispatching and retrieval between the edge and the cloud, common approaches for data management and routing rely on the highly interoperable HTTP/REST request/response protocol (most widely used for web APIs) and message-oriented middleware. This classification is consistent with prior IoT platform surveys, where REST/HTTP, MQTT, and AMQP are identified as relevant application layer/data-exchange protocols, with different communication models such as client–server interaction, polling, and publisher–subscriber messaging [30]. The former is stateless and, by its nature, is suitable for managing intermittently connected devices that wake up, send a request, and go back to sleep. Nevertheless, its relatively high overhead makes it inefficient for frequent low-payload telemetry that must be accessed by many endpoints. The latter includes well-known technologies like MQTT and AMQP. Compared with more specialized IoT protocols, MQTT is a lightweight, broker-centric protocol optimized for low-bandwidth, power-constrained IoT device telemetry via simple topic-based publishing and subscribing. AMQP is a robust, feature-rich enterprise protocol designed for secure, highly reliable, and complex message routing and queuing between distributed business systems and microservices. Experimental evidence obtained in a homogeneous IoT environment highlights clear performance differences among the considered protocols under high-load conditions. In particular, the average message enqueued acknowledge latency was reported to be approximately ms for MQTT, ms for AMQP, and ms for HTTP, while the corresponding mean CPU utilization was around % for MQTT, % for AMQP, and % for HTTP [31]. In light of this, combining REST’s simplicity for configuration and service access with MQTT’s efficient publish/subscribe model is a good compromise for enabling real-time updates from distributed mobile nodes.
To make these trade-offs explicit, Table 3 summarizes the main characteristics of HTTP/REST, MQTT, and AMQP from the perspective of edge-cloud data exchange. The comparison is organized around architectural aspects, such as communication model, addressing mechanism, transport layer, and message format, as well as operational properties, including overhead, reliability, security, scalability, and typical usage scenarios. This synthesis helps clarify why no single protocol is universally preferable: HTTP/REST remains attractive for interoperable service access and configuration tasks, MQTT is well suited to lightweight and frequent telemetry from constrained or mobile devices, whereas AMQP provides stronger queuing, routing, and reliability guarantees for more complex enterprise or backend workflows. Moreover, this protocol-level comparison should be interpreted within the broader role of IoT middleware, whose main purpose is to hide device, network, and application heterogeneity while enabling interoperability among distributed services and sensing infrastructures [32,33]. In fact, prior middleware surveys emphasize that IoT platforms must cope with ultra-large-scale deployments, heterogeneous interfaces, spontaneous event generation, and the integration of diverse technologies such as WSNs, RFID, M2M communication, and SCADA systems [33]. At the communication layer, this heterogeneity translates into the need to select application protocols according to system-specific requirements, including security, latency, energy consumption, reliability, scalability, and suitability for constrained devices [32,34]. Existing surveys therefore highlight that protocols such as HTTP/REST, MQTT, AMQP, CoAP, WebSocket, and LoRaWAN are not interchangeable solutions, but rather provide different trade-offs depending on the interaction pattern and deployment context [32,34].
Table 3.
Comparison of Middleware Technologies [31,32,35,36]: AMQP, MQTT, HTTP, and REST API.
4. The MOST Backend ICT Infrastructure
The requirements for the MOST Spoke 5 have been challenging in terms of requirements and integration. As highlighted in the previous section, no single technology or protocol can be regarded as universally optimal, since the most appropriate choice depends on several concurrent factors, including the characteristics of the underlying radio technology (e.g., BLE, LoRa, or NB-IoT), the application traffic pattern (such as periodic telemetry versus event-driven communication), device-management needs (including provisioning and OTA/FOTA updates), and the required security and compliance constraints.
The goal was the design and implementation of a coherent operational framework capable of supporting real-time supervision, long-term scientific analysis, and multi-domain interoperability across diverse sustainable mobility applications. At its core, the architecture is conceived as a flexible and extensible digital backbone that brings together sensorized mobility devices, renewable energy infrastructures, IoT communication networks, cloud-hosted processing pipelines, and advanced visualization interfaces, creating an environment where data originating from radically different sources, such as bicycles, e-bikes, mobile charging stations, IoT gateways, solar controllers, localization modules, and inertial sensors, can be acquired, transmitted, decoded, stored, and interpreted with reliability, reproducibility, and high temporal fidelity.
Security and privacy are implemented through a layered model. At the network layer, field gateways and backend services communicate through VPN-protected channels, while public access is mediated by a reverse proxy ingress layer. At the service layer, authenticated access is required for dashboards, databases, brokers, and management interfaces. Authorization is organized according to role-based access control, distinguishing administrators, researchers, operators, maintainers, and external stakeholders. In multi-actor deployments, role-based access control (RBAC) can be complemented by attribute-based policies based on device type, installation, dataset sensitivity, and institutional affiliation. Audit trails are maintained for user access, configuration changes, data-ingestion errors, VPN connections, and container life cycle events, supporting accountability, incident reconstruction, and compliance verification. Finally, data minimization and pseudonymization are applied to mobility traces and device identifiers whenever full identification is not required for the intended analysis.
4.1. Implementation Details
The block diagram in Figure 1 illustrates the system-level ICT infrastructure developed within the MOST Spoke 5 project and deployed inside a private virtualized environment based on Proxmox. Rather than serving a single device class, the platform was designed to support multiple operational use cases simultaneously (including bicycle-mounted BlackBox units, smart charging infrastructures, and air-quality monitoring stations), where all are characterized by different sensing modalities, data rates, and communication requirements. The architecture is designed not merely as a tool pipeline but as a scientific instrumentation system capable of supporting academic studies on mobility behavior, crash patterns, renewable energy integration, infrastructure performance, and user safety dynamics.
Figure 1.
Block diagram of the MOST ICT backend infrastructure.
To accommodate the heterogeneous and intermittent nature of data sources, the MOST architecture employs a hybrid communication model using LoRaWAN and cloud-based brokers supporting MQTT. This dual model allows MOST to support applications with drastically different communication profiles: safety monitoring requires sparse, low-power messages that may be triggered only during anomalies or periodic status intervals, whereas energy monitoring involves high-frequency telemetry that must be ingested without data loss and with consistent timestamp alignment.
A central role in the architecture is played by the ingress layer which acts as the controlled access point between the distributed field domain and the virtualized services hosted in the private infrastructure. In this implementation, ingress functions are mediated by a reverse proxy component, represented by Traefik, which is responsible for routing, endpoint exposure, and secure access mediation. The ingress therefore constitutes the boundary between external devices and the internal service ecosystem, ensuring that all communication entering the platform is properly directed, authenticated, and segmented according to the destination stack. This ingestion layer is built entirely on containerized microservices, ensuring modularity, portability, and isolated fault domains.
Within the Proxmox-based virtualized environment, the services are organized into three main logical domains that also correspond to different virtual machines running on the host.
The first is the LoRaWAN stack (notably, an on-premises containerized version of the ChirpStack solution), which includes a VPN front-end, based on OpenVPN, and the core network elements required for LoRaWAN operation, namely the Network Server (NS) and the Application Server (AS). Node-RED is adopted as a graphical flow-processing environment for handling LoRaWAN ingestion: it subscribes to MQTT topics produced by the LoRaWAN AS, decodes binary payloads, extracts information such as fall-detection status, orientation patterns, timestamps, GPS coordinates, and device identifiers, and transforms these data into structured metrics ready for database insertion. This stack is responsible for managing long-range wireless communication with remote sensing devices and for translating low-power wireless traffic into application-level data streams that can be processed by the rest of the infrastructure. Its separation from the other layers reflects the need to isolate radio-network management functions.
The second domain is the data-collection stack, which forms the operational core of the platform. Here, the incoming data are received through a VPN server, based on WireGuard, and then handled by a message-oriented middleware based on MQTT with a Mosquitto broker. A dedicated data-parser service decodes and normalizes the payloads generated by the different field systems, converting heterogeneous device messages into a consistent internal representation. This can be achieved either by using custom scripts, mainly developed using the Python programming language, running in a containerized environment, or by using standard services like Telegraf, depending on the nature of the incoming data and the amount of processing needed before storage. These processed data are then stored in the InfluxDB time series database (TSDB), selected as the most suitable backend for continuous telemetry, environmental measurements, and event-driven observations. Telemetry is stored using a consistent schema so that IMU-derived events, GPS coordinates, energy flows, state-of-charge measurements, and environmental data can all be queried, aggregated, compared, and visualized across devices, installations, or time intervals. The clarity of the database schema also supports longitudinal scientific research, enabling reproducible experiments, comparative analyses, and cross-domain studies where fall events, environmental conditions, and energy profiles may need to be jointly interpreted.
The third domain is the data-analysis stack, which exposes the collected information to higher-level users and processing workflows. Through controlled HTTP access, authorized users can use visualization services, based on Grafana dashboards, for real-time and historical inspection of the stored data, as well as interactive analysis environments for batch processing, exploratory analysis, and scientific post-processing. The architecture therefore closes the loop between acquisition and exploitation, enabling not only data collection from distributed MOST use cases, but also their subsequent transformation into actionable information for data scientists, control-room operators, maintenance workers, and local processing services.
For clarity, Table 4 provides a summary of the prominent technologies adopted. The table shows that requirements in terms of scalability and generalizability are ensured by means of the explicit separation between communication, ingestion, processing, storage, visualization, and monitoring layers. Containerized microservices allow each backend function to be independently deployed and scaled, while MQTT decouples data producers and consumers, simplifying the integration of additional devices and services. The coexistence of LoRaWAN and VPN-protected IP connectivity enables the same infrastructure to support both low-power mobile nodes and higher-rate fixed assets. Moreover, the adoption of generic time series storage and dashboarding tools, such as InfluxDB and Grafana, makes the backend independent of a specific use case, allowing heterogeneous measurements from bicycles, charging stations, and environmental sensors to be stored and analyzed within a common framework. The observability layer, described in greater detail in the next section and based on Prometheus, further supports scalable operation by making resource usage and bottlenecks measurable as the deployment grows.
Table 4.
Main technologies adopted in the MOST Spoke 5 ICT infrastructure.
4.2. ICT Infrastructure Monitoring
The isolation provided by the use of containers ensures that failures in one installation do not affect the rest of the system, while the ability to redeploy components via Ansible ensures that the entire infrastructure can be reproduced, migrated, or restored with minimal downtime. The proposed architecture is also highly resilient thanks to integrated self-healing mechanisms such as the Autoheal container, which continuously inspects container health and automatically restarts failed instances, and the Ofelia scheduler, which performs periodic tasks including log rotation, database maintenance, and system checks. Monitoring, implemented as a containerized observability stack deployed through Docker Compose, was therefore conceived as a supporting layer superimposed on the ICT infrastructure, allowing the various services and hosts to be continuously observed without altering their functional role. The central element was the Prometheus server, configured as the main scraping and time series acquisition engine and using a pull-based mechanism to periodically query the HTTP endpoints exposed by exporters and monitored services. Through this approach, the ICT architecture was not only implemented as a running environment, but also transformed into a measurable system whose internal activity could be systematically recorded and analyzed. The monitoring phase thus provided the methodological bridge between the description of the infrastructure itself and the quantitative assessment of its performance. At the lowest layer, the monitored hosts and containers acted as metric sources: system-level telemetry, such as CPU utilization, memory occupation, file system usage, load average, and network throughput, was exposed through host-oriented exporters, while container-level statistics (including per-container resource consumption, process activity, and runtime behavior) were gathered through dedicated collectors interfacing with the Docker engine. This arrangement allowed the monitoring system to capture both the global state of the infrastructure and the local behavior of the individual services deployed within it.
5. MOST Spoke 5 Use Cases
Within the MOST Spoke 5 project, the definition of the proposed ICT infrastructure was closely tied to the analysis of concrete experimental needs arising from the development of smart light mobility solutions. The project addressed a variety of use cases, ranging from embedded monitoring systems for bicycles and micromobility platforms to renewable-energy-powered charging stations designed for different deployment contexts. Although diverse in purpose and scale, these applications shared a common requirement for reliable data collection, distributed communication, remote observability, and efficient integration between edge devices and centralized services. For this reason, the use cases discussed below are not presented merely as examples of technological demonstrators, but as the practical foundation upon which the architectural choices of the overall ICT framework were established. By examining these cases, it becomes possible to clarify the operational problems encountered in the project and to justify the need for a modular, scalable, and field-oriented digital infrastructure. In particular, use-case implementation confirms the following architectural criteria are satisfied by the MOST backend infrastructure:
- Modularity: separation of ingestion, parsing, storage, visualization, monitoring, VPN access, and reverse proxy services into distinct components.
- Extensibility: possibility of adding new data sources by deploying additional collectors/parsers and extending the time series schema.
- Scalability: support for horizontal extension through additional containerized collectors and service replication, while acknowledging that maximum device capacity was not exhaustively benchmarked.
- Fault isolation: containment of failures through service/container separation and independent collectors for different installations.
- Reproducibility: deployment based on containerized services and configuration automation.
- Observability: monitoring of CPU, memory, and network behavior through the observability stack.
- Security of access: controlled ingress, VPN-mediated communication, and non-exposure of internal services.
5.1. Case Study 1: BlackBox for Light Mobility
Within the broader activities of the MOST Spoke 5 project, a highly relevant use case concerns the development of compact smart black-box systems for lightweight vehicles, with particular emphasis on standard bicycles and micromobility platforms, including electrically driven variants. In this context, a so-called “BlackBox” has been proposed as a practical implementation of a low-cost, unobtrusive, and energy-efficient sensing unit conceived for in-field deployment on light vehicles operating in real-world environments. The system was designed to support continuous acquisition of motion and positioning data, enabling the collection of valuable information on vehicle dynamics, riding conditions, and user behavior during everyday mobility and controlled experimental campaigns. The proposed solution combines embedded sensing, local intelligence, and low-power wireless communication in a form factor compatible with everyday bicycle deployment, thus enabling advanced monitoring functions without compromising usability or rider comfort.
The block diagram in Figure 2 summarizes the proposed architecture for the BlackBox system as a modular embedded platform. At the core of the system lies a microcontroller unit (MCU), which constitutes the central processing element of the architecture. The MCU receives power from the energy management stage, acquires data from the connected sensing modules, performs local processing, and coordinates the exchange of information with the available communication interfaces. The power section has been conceived to maximize operational flexibility and to accommodate different deployment scenarios. A battery provides the main energy reservoir of the system, while a charge controller manages power conversion, battery charging, and energy distribution to the processing subsystem. Three alternative charging sources are indicated: USB-C represents the preferred solution for offline recharge, offering simplicity, compatibility with common chargers, and ease of maintenance. In addition, the architecture enables energy harvesting or powering during use through a dynamo, which is particularly suitable for conventional human-powered bicycles, and through a micro-photovoltaic module (PV), which may support auxiliary charging in outdoor applications. This multi-source approach is especially relevant for field deployments, since it improves autonomy and broadens the operational envelope of the device without requiring major modifications to the core electronics. Below the processing unit, the diagram identifies the sensor and input/output layer, which includes all possible units and modules connected to the microcontroller and acting as sensing or input/output interfaces. The proposed BlackBox has been conceived not as a single-purpose logger, but as an extensible sensing platform. For the targeted functionalities, the IMU plays a primary role in detecting sudden accelerations, abnormal attitudes, or impact patterns associated with falls, while the GPS subsystem supports continuous localization and route reconstruction. Additional sensors may enrich contextual awareness, for example by capturing proximity information, environmental conditions, or acoustic and visual cues. The light-signaling module provides feedback or alerts directly on the vehicle, thereby extending the role of the system from passive monitoring to active interaction with the user or surrounding traffic. The communication section complements the local intelligence of the MCU by providing multiple connectivity and positioning options, each addressing different operational requirements:
Figure 2.
Block diagram of the proposed BlackBox system architecture, showing the power management, processing core, communication interfaces, and sensor/input–output modules supporting position monitoring and fall detection in light mobility applications.
- GPS supplies geolocation information essential for tracking and trajectory analysis;
- Bluetooth supports short-range communication, for example with smartphones or maintenance interfaces, facilitating configuration, data download, and local diagnostics;
- A 4G/5G module supports wide-area, real-time transmission when cellular coverage is available, making it appropriate for continuous remote monitoring or emergency event notification;
- LoRaWAN, in contrast to the 4G/5G module, offers a low-power, long-range alternative for delay-tolerant telemetry and infrastructure-oriented smart mobility scenarios.
The proposed architecture is particularly suitable for unobtrusive installation on bicycles and other micromobility vehicles, while preserving the capability to operate as a robust in-field monitoring unit. It therefore provides a coherent technical basis for implementing reliable position-tracking and fall-detection functions within the broader framework of smart and sustainable mobility envisioned by the MOST Spoke 5 project.
Two main BlackBox prototypes were developed, reflecting two different design philosophies and operational priorities. The first prototype was based on a Raspberry Pi platform (Figure 3b), whereas the second was developed around an Arduino architecture (Figure 3a). The Raspberry Pi solution was conceived to provide a richer computational environment and greater flexibility in terms of advanced functionalities, communication handling, and integration of multiple peripherals. Among the Raspberry Pi family, the Zero W and Zero 2 W models were identified as the most suitable for bicycle deployment, owing to their reduced dimensions, low weight, and lower cost compared with larger boards. Despite their compact form factor, these models still provide the essential features required by the application, including Wi-Fi and Bluetooth connectivity and standard communication interfaces such as SPI, I2C, and UART, thereby enabling the integration of a wide range of sensors and external modules.
Figure 3.
BlackBox prototypes: (a) Arduino-based and (b) Raspberry PI-based.
The second prototype, based on an Arduino platform, was developed to address the limitations associated with power consumption in battery-operated applications. Although Arduino boards offer significantly lower processing capability than Raspberry Pi devices, they are characterized by much lower energy demand and greater simplicity of implementation, making them especially suitable for long-duration autonomous operation [37]. The comparison between the two prototypes therefore highlights a fundamental trade-off: the Raspberry Pi BlackBox offers higher computational power, broader software flexibility, and a more feature-rich environment, making it appropriate for more complex sensing and communication tasks. By contrast, the Arduino BlackBox prototype prioritizes energy efficiency and extended battery life, representing a more suitable solution when low-power operation is the dominant design requirement.
5.2. Case Study 2: Renewable Energy Monitoring for Light Mobility
The MOST project explicitly targets the promotion of light mobility solutions, with a specific focus on electrically assisted modes such as e-bikes, due to their potential to reduce local emissions, mitigate congestion, and improve accessibility for both residents and visitors. However, the effective uptake of e-bike mobility, particularly in urban centers and tourist destinations, is strongly dependent on the availability of charging infrastructure that is easy to access, reliable, and aligned with the operational constraints of the end users [38]. In this respect, charging is not merely a complementary service, but a prerequisite for enabling longer trips, reducing range anxiety, and supporting multimodal travel patterns. Although renewable-source monitoring has been widely investigated in the literature, no consolidated standard has yet emerged. Moreover, only limited domain-specific research addressing charging stations explicitly designed for light electric mobility (e.g., e-bikes and e-scooters) exists [39]. This gap is largely driven by the strong variability of operating contexts (urban versus suburban, private versus shared fleets, stationary versus semi-mobile deployments) and by the lack of harmonized electrical and communication interfaces across vehicle and battery platforms.
The scarcity of application-driven case studies has direct implications for the associated ICT layer, although some efforts have been made to apply the IoT paradigm, as in [40,41]. In particular, it leaves open questions regarding the most appropriate architectures for data acquisition, connectivity, edge-cloud orchestration, and secure interoperability in light mobility charging scenarios. Moreover, it motivates the need for dedicated monitoring solutions capable of providing comprehensive and context-aware metrics, spanning energy production and conversion, storage behavior, charging demand patterns, availability, reliability, and user interaction, so as to support improved design choices, site selection, and evidence-based operation of these infrastructures.
A straightforward approach would be to deploy fixed charging points managed by municipalities or other public or private stakeholders. Despite its apparent simplicity, this option introduces several non-trivial barriers [42]. These constraints become particularly critical in contexts in which demand is variable and uncertain, since cycling volumes are not temporally stable: unlike motorized traffic, bicycle use is highly responsive to exogenous drivers such as weather conditions, daylight availability, and trip purpose, which jointly induce large fluctuations over both short and long time horizons and therefore require proper calibration [43].
Under such conditions, purely fixed infrastructure risks either underutilization during low-demand periods or insufficient capacity during peaks. For these reasons, the project considers a portfolio of charging solutions characterized by different degrees of portability, ease of deployment, and capacity, intended to support both stable and transient demand scenarios.
Accordingly, four deployment classes are considered:
- Lightweight charging stations: highly compact systems primarily oriented toward individual end users, designed to be handled autonomously for both transport and placement, enabling ad hoc charging in proximity to the user’s activity location.
- Portable charging stations: solutions intended for intermediate-duration stays (e.g., multi-day trips or temporary accommodation-based use), with relaxed weight constraints relative to lightweight units. They remain suitable for personal or family usage but, due to increased mass and size, are not intended for continuous carry-on operation by a single individual.
- Mobile charging stations: higher-capacity units explicitly designed to be relocated using a vehicle. Typically implemented on trailers, these systems can be towed and rapidly deployed at selected points of interest, supporting temporary installations with enhanced service availability during demand peaks.
- Fixed charging stations: permanent or long-term installations dedicated to public locations (e.g., public parks, sports facilities, and commercial areas), suitable where stable demand and long planning horizons justify the associated infrastructure and administrative overhead.
Figure 4 provides a combined tabular and graphical comparative overview of the main characteristics of the developed charging stations; additional details will be provided in the following sections.
Figure 4.
Main characteristics of the developed charging station prototypes. The radar plot values are normalized with respect to the maximum value of each parameter.
Collectively, these archetypes provide a scalable design space that balances accessibility, administrative feasibility, and deployment flexibility, enabling charging services to be tailored to both persistent demand and seasonal or event-driven peaks. All of the aforementioned charging station classes share a common requirement: continuous monitoring of operational status. Effective supervision, as well as reliable and accountable service provision, requires the systematic measurement and communication of a set of key state variables. In particular, it is essential to quantify the energy produced by the system (where local generation is available) and the energy delivered to the user during charging sessions, in order to support energy accounting and performance assessment. Likewise, the energy currently stored in the onboard battery, typically expressed through the battery state of charge (SoC), must be tracked to guarantee service availability and to enable informed operational decisions.
Centralized data collection and monitoring therefore enable the aggregation of observations across a larger fleet of devices, increasing the statistical basis for inference and supporting the development of more robust and generalizable models. These models can, in turn, inform both the operational use of the stations and the iterative refinement of their design. For instance, in the case of lightweight charging stations, empirical usage profiles and energy demand patterns can guide the selection of a more appropriate battery capacity, ensuring that user requirements are satisfied while minimizing mass and volume, two constraints that directly affect portability and usability. In addition, continuous remote monitoring provides a practical decision-support tool for service operators and public authorities. By tracking performance indicators and health metrics over time, stakeholders can plan maintenance actions proactively rather than reactively, reducing downtime and extending asset lifetime. Moreover, spatiotemporal analysis of utilization can support strategic planning decisions, such as increasing capacity where demand persistently exceeds availability or relocating stations to better match seasonal, event-driven, or emerging mobility patterns within the territory [44,45].
The charging stations proposed and developed within the MOST project share a common hardware and software backbone. In particular, this baseline architecture is designed to address the communication and energy-management challenges discussed above, including reliable data acquisition and transmission, energy metering and accounting, and the monitoring of battery availability and degradation. Nevertheless, depending on operational requirements and expected usage conditions, the common design has been tailored to the constraints of each targeted use case.
In Figure 5, the reference functional architecture adopted for the charging stations developed in the framework of the MOST Spoke 5 activities is reported. The scheme highlights the modular organization of the system into four functional domains: DC power electronics, AC power electronics, processing, and communication. From an energy perspective, the system is organized around a central DC link, which acts as the main electrical backbone interconnecting generation, storage, conversion, and auxiliary delivery functions. On the generation side, one or more PV modules provide renewable energy input, which is conditioned through an MPPT unit (Victron—SmartSolar) in order to maximize power extraction under varying irradiance and temperature conditions. The regulated energy is then injected into the DC link, from which it can be distributed to the other subsystems. A battery (Victron—Lithium SuperPack and BMV Smart) is connected to the same bus to provide energy buffering, support operation under low solar availability, and guarantee continuity of service during transient or off-sun conditions. The presence of a USB-C power output connected to the DC stage further extends the versatility of the station by enabling the direct supply of low-power electronic devices or auxiliary loads without the need for additional AC conversion. The conversion toward end-user charging services is performed in the AC power electronics section. Here, the DC energy stored in the battery is converted by an inverter (Victron—Inverter VE.Direct), which generates the AC power required by the bike charging units. Between the inverter and the final bike charger, there is a dedicated protection and monitoring circuitry. This is responsible for electrical protection, operational supervision, and measurement of relevant quantities (voltage, current, frequency and power) associated with the bike charging process. The architecture also includes a processing layer, implemented through a centralized controller (Victron—Cerbo GX and GX Touch 50). This unit performs the supervisory functions of the charging station by coordinating the operation of the power converters, monitoring the status of the battery and charging interfaces, and managing the exchange of measurements and commands with the various subsystems. Communication with field devices may rely on industrial serial protocols such as Modbus RTU or custom protocols over the RS232 communication layer. The controller acts as the local intelligence of the station, ensuring coherent operation of the entire platform. The communication layer provides the interface between the charging station and the external digital infrastructure. This layer may include a mobile gateway, used for TCP/IP-based connectivity and remote data transfer, and, when required, a LoRaWAN gateway for low-power wide-area communication with distributed sensors and peripheral nodes. This dual approach reflects the heterogeneous communication needs that may characterize MOST charging stations, ranging from local telemetry and diagnostics to cloud integration and low-power field sensing.
Figure 5.
Block diagram of the charging station architecture developed within the MOST Spoke 5 project.
The following sections present the main design details and distinctive features of the prototypes implemented for each station class.
5.2.1. Lightweight Charging Stations
Figure 6 depicts the prototype of the lightweight charging station, conceived as a compact and transportable off-grid unit for temporary and user-proximate charging applications. The overall design adopts a rugged heavy-duty suitcase architecture, which integrates the main electrical and electronic subsystems within a single protected enclosure while preserving ease of transport and field usability.
Figure 6.
Prototype of a lightweight charging station (heavy-duty suitcase) deployed at the “Giro-E” in May 2025 (a) and its construction: view of the internal components (b), top view of the display (c), side view with connectors (d).
Figure 6a shows the station during deployment at the “Giro-E” in May 2025, where the suitcase-based unit is operated together with a foldable photovoltaic module. This effectively illustrates the intended use scenario: the charging station can be positioned close to the point of demand and quickly connected to portable solar generation, thereby enabling an energy-autonomous configuration without the need for fixed infrastructure.
The internal arrangement of the prototype is illustrated in Figure 6b. The image shows the main protective and distribution devices that are housed in a dedicated electrical panel, while the remaining volume accommodates the DC/AC inverter, battery storage module, cabling, and auxiliary components. Figure 6c provides a top view of the enclosure, where a compact display and user-interface module is mounted externally. The top surface also hosts an external PV module connection, confirming that the prototype was designed not only for portability but also for practical field operability, with user-accessible interfaces placed in ergonomically convenient positions. Finally, Figure 6d presents a side view of the station, emphasizing the external AC outlet and service interfaces integrated into the suitcase walls.
In contrast with larger mobile or fixed installations, this solution is clearly oriented toward rapid deployment, autonomous handling, and operational flexibility in contexts where the charging demand is discontinuous or spatially distributed. The compact geometry of the enclosure, combined with the folding PV panel, highlights the system’s suitability for temporary events, demonstration activities, and distributed charging services in outdoor environments. The concentration of the electrical subsystems within a sealed transport case is particularly relevant for lightweight stations, as it allows the unit to be moved and deployed without requiring extensive assembly procedures on site.
5.2.2. Portable Charging Stations
Portable charging stations constitute a complementary approach to fixed charging infrastructure, enabling rapid and flexible deployment of off-grid services in contexts where charging demand is intermittent, spatially dispersed, or strongly seasonal [46]. Within the MOST activities, two portable prototypes were developed to support temporary deployments and event-based use cases while preserving a common electrical and communication architecture.
Figure 7 illustrate the development and field deployment of a portable charging station prototype conceived as a self-contained off-grid unit for temporary charging services in contexts characterized by short–medium-term permanence and limited infrastructure availability. The system is distinguished by a compact cylindrical body, the battery-like shape of which is both functional and visually evocative of its energy-storage role.
Figure 7.
Prototype of portable charging station “Pila” (battery-shaped) deployed at the “Giro-E” in May 2024 (a) and May 2025 (b) and its last laboratory prototype with LoRaWAN gateway (c).
In the field configurations shown in Figure 7a,b, the charging station is coupled with lightweight flexible photovoltaic panels; due to their placement, they assume a semi-curved geometry and are supported only by a simple top aluminum bar. From a constructional perspective, the prototype integrates energy generation, storage, and delivery functions into a single portable architecture.
Figure 7c represents the latest laboratory prototype, which incorporates additional communication hardware: a LoRaWAN gateway (Milesight—UG67) has been mounted externally, together with two vertical antenna elements. This evolution indicates the transition from a purely energy-oriented demonstrator toward a connected smart charging node capable of remote monitoring, telemetry acquisition, and integration within a wider IoT-enabled charging infrastructure.
The resulting system appears particularly suitable for temporary mobility hubs, outdoor events, tourism-related applications, and other scenarios in which flexible, autonomous, and relocatable charging services are required. The reported images, acquired during the Giro-E events in May 2024 and May 2025, show the station operating in real conditions, where it can be positioned directly along streets or in public spaces without requiring permanent installation. The photovoltaic modules can be oriented and inclined to maximize solar exposure while maintaining mechanical simplicity and ease of handling.
Figure 8 illustrates an alternative implementation of the portable off-grid charging station, redesigned as a compact flight-case prototype and deployed during the Giro-E event (May 2025). Compared with the previously presented portable configuration, the core electrical and communication architecture is intentionally preserved: the station integrates the same charging electronics and embeds a LoRaWAN gateway within the enclosure, coupled with two external antennas. Likewise, the photovoltaic generation subsystem relies on the same PV modules adopted in the earlier prototype, ensuring functional continuity in energy harvesting and simplifying replication and maintenance across different station variants.
Figure 8.
Prototype of the flight-case portable charging station deployed during the “Giro-E” in May 2025. Side view (a), lateral view (b), the portable charging station closed (c), its internal construction showing the LoRaWAN gateway (d), and the electrical board and components (e).
The principal contribution of this version lies in its mechanical integration and portability strategy. In the earlier prototype, the PV modules required an auxiliary supporting structure, increasing the overall mass and the number of components to assemble on site. Here, to reduce weight and streamline logistics, no additional frame is provided: the solar modules can be directly attached to the exterior of the flight-case, thereby minimizing both structural material and assembly time. This design choice prioritizes rapid setup and dismantling in event-based scenarios, where the station may need to be relocated frequently and where storage volume and transport handling are critical constraints. While direct attachment may impose limitations on panel orientation and fine-grained tilt optimization, the approach represents a trade-off that favors operational simplicity and reduced ancillary hardware.
A further improvement concerns mobility and user handling. The flight-case is equipped with integrated wheels, which substantially facilitates movement by a single operator and reduces the need for lifting or additional transport aids. This feature is particularly relevant in temporary deployments such as public demonstrations or sporting events, where the charging station must be positioned opportunistically, often along constrained pathways or within crowded areas.
5.2.3. Mobile Charging Stations
Mobile off-grid charging stations powered entirely by photovoltaic generation are particularly relevant in contexts where charging demand is spatially and temporally discontinuous and/or where the deployment of fixed infrastructure is administratively complex, time-consuming, or economically uncertain. A representative example is the case study of Favignana island, Italy, where seasonal tourism substantially increases the resident-equivalent population during summer months, thereby stressing an already constrained and relatively weak local electricity system [47]. In such settings, grid-independent stations can provide charging services without introducing additional peak loads on the local network, while simultaneously enabling a more sustainable supply chain; by relying on on-site solar energy rather than fossil-based electricity, they can markedly reduce the CO2 emissions associated with charging operations.
The prototype shown in Figure 9 is a trailer-mounted mobile charging station designed to be towed by a standard vehicle and rapidly deployed in temporary or event-based locations. The system integrates ten charging outlets and a foldable PV generator composed of eight 400 W modules arranged across two hinged wings. For transportation, the wings are closed in a vertical position to reduce their overall dimensions and improve handling, leaving four out of the eight modules exposed; during operation, the wings are opened to an inclination of approximately 45 deg to increase the collecting surface and facilitate energy production. Mechanical stability in the deployed configuration is provided by the bicycle racks (five stands per side) which act simultaneously as parking and charging infrastructure for the e-bikes and as structural supports for the PV wings, arranged with 90 deg mutual orientation to enhance stiffness and prevent overturning. A detailed description and analysis of electrical safety issues and specific risk analysis for this prototype can be found in [48,49].
Figure 9.
First prototype of off-grid photovoltaic mobile charging station (trailer-based, foldable PV array) for e-bikes deployed during the “Giro-E 2024” in May 2024. Left side view (a), right side view (b).
To improve visual compatibility in high-value landscapes, the station employs green-tinted PV modules, which enhance the aesthetic integration in touristic environments. However, this color has lower conversion performance than standard panels. Moreover, the geometry and constraints imposed by the foldable, transport-oriented installation do not optimize irradiance capture under all sun angles. As a result, despite the nominal installed capacity, the effective peak electrical output is limited to approximately kW under optimal operating conditions. Overall, the design prioritizes rapid deployment, modularity, and landscape-sensitive integration, offering a scalable approach for decarbonized charging services in locations where the grid is weak, access is restricted, or demand is strongly seasonal.
5.2.4. Fixed Charging Stations
The possibility of deploying a fixed charging station enables a more accurate and context-specific system design, since both site-dependent solar irradiance data and realistic demand profiles can be incorporated into the sizing procedure. This supports a systematic optimization of the PV generator and battery storage, allowing the designer to identify an appropriate cost vs. quality-of-service (QoS) trade-off, limiting the overall system cost while keeping the fraction of unmet charging requests within an acceptable threshold [45]. Moreover, although fixed installations may entail additional constraints related to siting, permitting, and landscape integration, they remove the mass and portability limitations that typically constrain mobile or user-transportable solutions. As a result, fixed stations offer substantially greater freedom in the selection of the storage technology and, in particular, in the choice of battery capacity, which can be increased as needed to enhance service continuity under seasonal variability in solar resource and demand [37,50].
The photographs in Figure 10 document two examples of fixed installation of off-grid charging stations deployed at the Bike Park of the CUS (Centro Sportivo Universitario) of the University of Brescia in Italy. The system is implemented through containerized modules, enabling rapid siting and a clear separation between user-facing functions and technical infrastructure. Figure 10a shows the “human-usable” unit, where the container facade integrates access doors, ventilation openings, and service interfaces, indicating a configuration intended for regular interaction by end users and maintenance personnel. Image Figure 10b illustrates the warehouse/technical configuration, in which container modules are arranged to provide a sheltered and secure space for equipment housing, storage, and servicing activities.
Figure 10.
Fixed installation of off-grid charging station at the “Bike Park” at the University of Brescia, Brescia, Italy. It is possible to see two different installations: human-usable (a) and warehouse (b).
6. Experimental Evaluation
The previously described use cases represent the source of data managed by the proposed backend infrastructure. In this section, for the sake of completeness, backend performance is characterized in terms of CPU, memory, and network usage. These results are not intended to constitute a complete benchmark of the architecture, nor to demonstrate absolute superiority with respect to other platforms. Rather, they are intended to provide an operational overview of the effectiveness and observability of the proposed architecture under a real MOST deployment. First, they show that the proposed containerized backend can be monitored in operation and that its main resource-consuming components can be identified. Second, they provide examples of the kind of evidence that the architecture is able to generate for capacity planning, maintenance, and future optimization. Finally, the LoRaWAN link has been evaluated as well, in order to highlight the latency of this wide-coverage wireless solution.
6.1. CPU and Memory Metrics
The Table 5 reports descriptive statistics of CPU usage for each deployed container. Overall, infrastructure services such as Telegraf, Grafana, Mosquitto, and WireGuard show relatively low and stable CPU consumption, with limited variability. Grafana and Telegraf remain consistently lightweight, while Mosquitto exhibits a slightly higher median but still a very small maximum value of %. The most computationally demanding service is clearly Influx, which has the highest average CPU usage (%), the largest standard deviation (%), and by far the highest maximum value (%). This suggests a highly bursty workload, likely associated with periodic database-intensive operations such as writes, queries, or aggregation tasks. Some containers, including Ofelia and Nginx, appear almost idle throughout the observation period, with near-zero averages and negligible variability. Node-RED also shows a low average load, though its mode and upper quartile suggest occasional short activity periods.
Table 5.
Container CPU usage statistics by service. All the values are percentages.
Several application containers display a different behavior. Although median CPU usage is generally low for most charging stations, several of them exhibit notably higher average consumption, standard deviation, and maximum values. This suggests that CPU utilization is usually limited, but sporadic workload bursts lead to significant usage spikes. Such a pattern is especially visible in portable-cs1, light-cs1, mobile-cs2, mobile-cs3, and fixed-cs4, whose maximum CPU usage exceeds 14%. It should be noted that the containers and services associated with light, portable, and mobile charging stations do not always receive data, because these devices are not deployed continuously, unlike fixed charging stations, which are expected to operate more steadily.
The data indicate that most containers operate with low baseline CPU demand, while a smaller subset, especially Influx and some charging stations containers, exhibits intermittent peaks that dominate their average resource consumption. This suggests that resource provisioning should primarily account for burst behavior rather than steady-state utilization.
Table 6 reports the main descriptive statistics of memory usage for the containers running on a single containerization host. In particular, the table summarizes mean, minimum, maximum, and standard deviation values of memory usage ordered by overall memory footprint. For clarity, the table does not include the data-collection services associated with the individual charging stations, whose contribution is comparatively limited and statistically homogeneous. Across this class of services, the mean memory usage is MB, with values ranging 18.6–26.0 MB. Moreover, in all cases the standard deviation of memory utilization is on the order of 500 kB, indicating a highly stable memory footprint over time. As a general observation, unlike CPU utilization, which is often characterized by short-lived fluctuations associated with processing activity, memory consumption offers a clearer view of the persistent resource footprint imposed by each container on the host system.
Table 6.
Summary statistics of memory usage for the main containers. Values are expressed in MB.
The memory usage data show a markedly heterogeneous distribution among containers. The Influx container exhibits by far the highest memory demand, with an average value above 8 GB and relatively limited variability compared with its absolute magnitude. This result indicates that InfluxDB constitutes the dominant structural memory load of the host, consistently occupying a substantial fraction of the available RAM. Telegraf represents the second largest consumer, although at a much lower scale, while Grafana shows a moderate and highly stable footprint. Other infrastructure-oriented services, such as Nginx and Autoheal, remain almost negligible in terms of memory usage. A partial exception is Ofelia, which, despite a limited average value, reaches a large maximum value and a comparatively high standard deviation, suggesting occasional transient memory expansions.
When compared with CPU usage, the memory profile appears substantially more stable and persistent. The CPU analysis showed that most containers operate with a low baseline demand, while only a few services, especially InfluxDB and some charging-station-related containers, generate intermittent peaks that disproportionately affect average utilization. By contrast, memory consumption is less governed by burst-like events and more by the intrinsic software role of each service. This distinction has important implications for resource provisioning: CPU allocation should primarily account for short-term burst behavior, while memory sizing must ensure sufficient baseline capacity to sustain the persistent requirements of high-footprint services, most notably the database container.
6.2. Network Load
Figure 11 shows the distribution of network traffic generated by the main containers during the observation period from 5 to 15 March 2026, distinguishing between sent and received data; charging station instances have been aggregated into the “CSs” group. The comparison provides an overview of the relative contribution of each service to the total communication load of the system.
Figure 11.
Overall network traffic distribution across containers in the period from 5–15 March 2026.
Over the observation period, the infrastructure received a total of GB and sent GB, showing that inbound traffic was approximately 1.9 times higher than outbound traffic. This indicates that the system mainly operates as a data collection and aggregation platform, where measurements and service messages are predominantly ingested rather than generated externally. In both traffic directions, WireGuard represents the largest contribution, accounting for about 58% of both sent and received traffic, thus highlighting that the VPN overlay could be the main source of communication overhead. Among the application services, Telegraf is the major contributor to outgoing traffic (%), whereas Mosquitto and InfluxDB are more relevant on the incoming side, contributing % and %, respectively. This behavior is coherent with the expected telemetry workflow, in which data are collected from field devices, brokered through MQTT, and finally stored in the time series database. Overall, the results show that the network load is dominated by secure tunneling and telemetry management services, while auxiliary components such as Node-RED, Nginx, and the charging station instances have only a marginal effect on the total traffic.
Figure 12 illustrates the temporal evolution of the network traffic metrics over the observation window. It provides a comparative view of the three most network-intensive containers, highlighting differences in activity patterns and the variability of resource-related behavior over time. By comparing the three most network-intensive containers, the figure reveals distinct activity patterns and different degrees of temporal variability in network resource usage. Among them, the WireGuard service is characterized by a nearly constant traffic profile, with average incoming and outgoing rates equal to 24.13(35) kB/s and 12.56(30) kB/s, respectively, expressed as the mean value and standard deviation.
Figure 12.
Container-level network traffic over time in the period from 5–15 March 2026.
Figure 13 presents the aggregate incoming and outgoing network traffic measured at the containerization host over the same monitoring window. A significant peak in received traffic appears approximately 30 h after the start of the observation period and can reasonably be attributed to an external request to the InfluxDB service. Excluding this isolated event, both ingress and egress traffic exhibit an almost steady behavior, with mean values of MB and MB, respectively. These figures are consistent with the traffic levels observed for the WireGuard container, which is expected: apart from the traffic associated with internal container monitoring, nearly all communications traverse the WireGuard endpoint. By design, Mosquitto, InfluxDB, and Telegraf are not directly accessible from the public network; therefore, their traffic remains limited to internal host communications.
Figure 13.
Containerization host network traffic over time in the period from 5–15 March 2026.
6.3. LoRaWAN Performance
The on-premises ChirpStack LoRaWAN backend is implemented as a set of cooperating server components connected through a message broker. They are instantiated as Docker containers within a VM (providing isolation). This approach makes the backend easier to install, update, backup, reproduce, and maintain: individual components such as the Eclipse Mosquitto MQTT broker, the PostgreSQL database, or ChirpStack service can be restarted or upgraded without reinstalling the whole backend. A testbed was implemented to evaluate the end-to-end latency. The LoRaWAN traffic was injected via a Microchip RN2483 LoRaWAN modem hosting a Semtech SX1276 transceiver and a Microchip microcontroller PIC18LF46K22 (acting as an AT-command-like interpreter). The complete end-device communication stack is handled by the modem, which, once properly configured, listens indefinitely for the user data provided by a PC (Intel Core i7-10710U CPU, Windows 11 OS) running a purposely coded Python-based terminal program. For the sake of completeness, 18 B and 113 B long messages are sent by the mote (including the 13 B long LoRaWAN header). In both cases, 120 messages have been transmitted every 60 s using the following communication parameters: bandwidth BW = 125 kHz, spreading factor SF = 7 and coding rate CR = 4/5, on a default channel (centered around MHz), and respecting the duty-cycle limitation d = 1% (in accordance with EU limitations). The LoRaWAN gateway is the aforementioned Milesight UG67, connected via a 100 Mbps Ethernet link. The mote and the gateway have been located close to each other to avoid any message loss. The opposite communication endpoint is a Python-based MQTT client hosted in the same PC and subscribing to the corresponding mote topic. A timestamp was collected by both the Python (version 3.12) applications. The overall round-trip time for the 18 B-long message has an average value of with standard deviation ; whereas for the 113 B-long message is considered and .
The reported latency values must be interpreted as a controlled single-device, loss-free baseline for validating the end-to-end communication path through the gateway, ChirpStack backend, MQTT broker, and client application, rather than as a full capacity benchmark of the LoRaWAN access network. In fact, the experiment was intentionally performed with the mote located close to the gateway and with one periodic uplink source; therefore, it does not quantify the packet–delivery ratio under radio contention, the maximum number of supportable end-devices, or the behavior under a high degree of concurrent load. These quantities are strongly scenario-dependent, since, as as discussed in [51], LoRaWAN relies on an ALOHA-like medium access scheme and packets transmitted at the same time, on the same frequency, and with the same spreading factor may collide. Consequently, no general maximum-device figure is claimed from this experiment. For the considered MOST Spoke 5 use cases, this limitation is partially mitigated by the low reporting rate of the nodes, the duty-cycle constraint, and the possibility of distributing traffic over different channels, spreading factors, and gateways. Nevertheless, a dedicated scalability campaign is planned as future work, this will progressively increase the number of physical and emulated end-devices and will measure packet–delivery ratio, packet loss, latency percentiles, retransmission and acknowledgment behavior, ChirpStack/MQTT resource usage, and backend queueing delays under concurrent load.
7. Conclusions
This work has examined the challenges associated with designing and deploying ICT infrastructures as backend systems for light and sustainable mobility applications. Particular attention has been devoted to the MOST Spoke 5 project, which has been discussed as a representative design case through two complementary application scenarios: the power monitoring of sustainable charging stations for light electric vehicles, and the development of a low-power communication infrastructure based on LoRaWAN technology for the monitoring of bicycles and riders.
The experimental deployment of such an infrastructure reveals that the problem extends well beyond the purely technical dimension. In addition to hardware integration, communication reliability, and cloud service orchestration, substantial difficulties emerge from the limited availability of consolidated methodological guidelines for defining, implementing, and operating digital infrastructures tailored to these environments. Although the literature provides numerous examples of ICT solutions for smart and sustainable mobility, these contributions are often highly specialized and typically address only a single mobility domain, vehicle class, or operational objective. As a result, they offer only partial support for the design of flexible backend architectures capable of serving heterogeneous light mobility scenarios.
A first critical issue concerns the definition of use cases. Light mobility is not a single, uniform sector, but rather a broad ecosystem that includes bicycles, e-bikes, scooters, shared vehicles, and related charging or monitoring services, each characterized by different operational requirements, sensing needs, data rates, and user interactions. Consequently, backend infrastructures cannot be designed effectively without a sufficiently clear and comprehensive framing of the intended services, actors, and data flows. The absence of a shared taxonomy and of reference use cases makes it difficult to identify common architectural requirements and to generalize design choices across deployments.
A second challenge lies in the intrinsic unpredictability of mobility itself. Unlike static monitoring applications, light mobility systems are shaped by dynamic and often irregular behaviors, including variable routes, intermittent connectivity, changing environmental conditions, fluctuating user demand, and highly context-dependent event generation. This inherent variability complicates the design of backend systems, which must remain robust under non-deterministic operating conditions while still guaranteeing timely data acquisition, secure transmission, and scalable storage and processing. In this sense, backend architectures for mobility must be conceived not only as data repositories, but as adaptive digital systems capable of supporting uncertainty and continuous variation in the field.
Interoperability represents a further and particularly relevant limitation. At present, there is no widely adopted and clearly defined standard for light mobility data exchange that ensures seamless integration among devices, platforms, and service providers. Many existing solutions are based on proprietary ecosystems in which data formats, interfaces, and access policies are controlled by individual vendors. This approach may simplify product-level service delivery, but it significantly restricts cross-platform integration, prevents the creation of open data environments, and limits the reuse of information for research, public planning, and multimodal service development. As a consequence, universal accessibility and true interoperability are rarely treated as primary design objectives, despite being essential conditions for the long-term evolution of sustainable mobility ecosystems.
Overall, the analysis highlights that the development of ICT backends for light and sustainable mobility requires a broader perspective than conventional infrastructure engineering alone. The presented ICT architecture demonstrates the feasibility and potential advantages of integrating distributed sensing, low-power communication technologies, and cloud-based analytics within a unified and scalable framework. The results indicate that such an approach can effectively support the operational requirements of light and sustainable mobility applications, while providing the flexibility needed to accommodate heterogeneous devices, communication layers, and data services. In addition, a preliminary assessment of the resource impact of each service infrastructure service has been carried out. Although still exploratory, this analysis represents an important first step toward the definition of resource-aware design criteria and capacity-planning strategies for comparable application contexts. In this sense, the obtained results may serve as a useful basis for forecasting computational, storage, and communication requirements in future deployments of similar ICT systems.
Finally, Table 7 summarizes the main lessons learned from the MOST Spoke 5 use cases, highlighting how the field deployments translate into reusable design criteria for similar ICT-enabled light mobility systems.
Table 7.
Lessons learned from the MOST Spoke 5 use cases.
Author Contributions
Conceptualization, S.D.I. and E.S.; methodology, S.D.I. and E.S.; software, P.B. and C.F.; validation, A.F.; formal analysis, S.D.I.; investigation, S.D.I. and E.S.; resources, A.F.; data curation, C.F.; writing—original draft preparation, S.D.I. and E.S.; writing—review and editing, S.D.I. and E.S.; visualization, S.D.I.; supervision, E.S.; project administration, A.F.; funding acquisition, A.F. All authors have read and agreed to the published version of the manuscript.
Funding
This study was carried out within the Sustainable Mobility National Research Center (MOST) and received funding from the European Union Next-GenerationEU (Piano Nazionale di Ripresa e Resilienza (PNRR) Missione 4, Componente 2, Investimento 1.4, D.D.1033 17 June 2022, CN00000023), Spoke 5 “Light Vehicle and Active Mobility”.
Data Availability Statement
Supporting material for the article, together with links to the companion GitHub repositories documenting the MOST Spoke 5 ICT infrastructure, is publicly available at: https://github.com/delloiaconos/most-spoke5-ict (accessed on 1 April 2026). The data presented in this study are available on request from the corresponding author due to restrictions related to funding project policies.
Conflicts of Interest
Author Dr. Paolo Bellagente was employed by the company Apogeo Space S.r.l. The remaining authors declare that the research was conducted in the absence of any commercial or financial relationships that could be construed as a potential conflict of interest.
Appendix A. Smart and Light Mobility
This appendix clarifies the scope and taxonomy of light mobility, distinguishing its main categories and functional characteristics, and then focuses on micromobility as a particularly relevant urban domain. Finally, it outlines the notion of smart mobility, highlighting the role of digital technologies, sensing, and data-driven architectures in contemporary mobility systems.
Appendix A.1. Scope and Taxonomy of Light Mobility
In current policy and research, light mobility can be defined as the ability to move using smaller and lighter means than cars. Importantly, this definition is not limited to a single vehicle class; it is best understood as an umbrella term that covers the full spectrum of “smaller-than-car” mobility, including modes requiring no vehicle (e.g., walking) and/or no powered propulsion. A key contribution in this field was made by the International Transport Forum (ITF), which treats light mobility as a street-design and policy-relevant taxonomy, rather than only a legal vehicle homologation classification [52,53,54]. In this framing, the light mobility landscape spans:
- Self-locomotion and active mobility: urban movement primarily generated by human effort [55], especially walking and cycling, and more broadly other non-motorized or minimally assisted modes centered on bodily propulsion. In policy terms, this category covers proximity trips, daily commuting, first and last mile access to public transport, and inclusive mobility for vulnerable users. Its scope is therefore functional as well as infrastructural, since it depends on sidewalks, crossings, cycle lanes, and safe street design [56]. Taxonomically, the category includes pedestrians, conventional bicycles, and pedal-assist bicycles compliant with legal limits, which remain close to active mobility because propulsion is still fundamentally rider-driven.
- Micromobility and rideables refer to a heterogeneous family of small, low-mass, low-speed vehicles designed mainly for short urban trips. Unlike active mobility, this category often includes electrically powered devices and is defined less by human effort than by limited size, kinetic energy, and operational range. Its scope typically covers first and last mile travel, shared urban fleets, and highly flexible personal mobility in dense areas. From a taxonomic perspective, it includes e-scooters and other personal light electric vehicles, especially stand-on devices [57,58].
- Powered light mobility identifies the light motorized segment of urban and peri-urban transport, especially where vehicles fall within the European L-category framework. In contrast with micromobility, the defining criterion is not simply small size, but a more formal combination of propulsion, configuration, design speed, and homologation requirements [59]. Its scope includes vehicles intended for regular road circulation with clearer regulatory status, bridging the gap between personal light devices and conventional motor vehicles [60]. Taxonomically, this macro-category comprises mopeds, motorcycles, tricycles, and quadricycles. It is therefore best understood as the “normatively codified” domain of light motorized mobility rather than a generic label for any small powered vehicle.
- Micro-electric vehicles and microcars are the smallest road-oriented electric vehicles that approach the automobile model more closely than micromobility devices do [61]. Their defining features are compact size, electric propulsion, limited passenger capacity, and suitability for short to medium urban trips, often with greater comfort, weather protection, and storage than rideables can offer. Their scope includes personal urban travel, neighborhood mobility, and in some cases low-emission local logistics [62]. Taxonomically, the most robust classification places them within the quadricycle families. In this sense, microcar is not just a descriptive term for a very small car, but a category that overlaps with specific regulatory subclasses of micro-electric road vehicles.
In [52], it is highlighted why this reframing of mobility definitions is needed is needed: conventional regulatory taxonomies (e.g., UNECE categories) only partially capture the diversity of light mobility, leaving notable shaded areas in which relevant devices (such as e-kick scooters, many bicycles and pedelecs) are not neatly covered by standard vehicle categories. This mismatch is not simply terminological; it has practical consequences for infrastructure rules, speed management, safety requirements, research, and data collection obligations. From a system and performance perspective, light mobility can be commonly associated with three interrelated families of benefits. (i) It can generate public-health gains by increasing the uptake of active modes, thereby embedding physical activity into everyday travel and supporting broader objectives in preventive health. (ii) Light mobility may deliver energy and environmental advantages, particularly where it enables electrification and promotes vehicle downsizing and lightweighting; together, these features tend to reduce energy demand per passenger-kilometer and mitigate both local emissions and climate-relevant impacts. (iii) Because light vehicles and active modes have markedly smaller physical footprints than private automobiles, they can contribute to lower space consumption in streets and public areas, alleviating pressure on scarce urban land and enabling more efficient allocation of curbside and roadway space.
Taken together, these benefits help explain why light mobility has emerged as a prominent application scenario for sensorized and data-driven mobility research, where continuous observation and analytics are increasingly employed to quantify impacts, manage operations, and support evidence-based planning and governance.
Appendix A.2. Micromobility
Within the light mobility landscape, micromobility has become a pivotal category because it sits at the intersection of short-trip substitution, first/last-mile connectivity, and platform-mediated services (shared fleets). The ITF notes that micromobility generally describes personal vehicles much smaller and lighter than cars and that no single standard definition exists across jurisdictions and classification schemes [54]. Nonetheless, multiple operational definitions are used in the academic literature. For example, in [63] micromobility is defined as small and lightweight modes, often used individually, with relatively low speeds (lower than 25 km/h), and e-micromobility is distinguished as the subset using electric powertrains (e-bikes, e-scooters, e-skateboards).
To support policy and safety design, the ITF proposes a safety-oriented typology based on two parameters that strongly influence crash severity: speed and mass [53]. This framework identifies broad micromobility types (A-D) by weight thresholds and design speeds, and explicitly highlights e-scooters and e-bikes as focal vehicle families in current urban practice. This kind of classification is particularly valuable for engineering applications because it connects vehicle properties to requirements for sensing (e.g., speed and acceleration profiles), infrastructure interaction (mixing with pedestrians/cyclists), and safety interventions.
Appendix A.3. Smart Mobility
While light mobility is primarily framed around vehicle typologies and urban space, smart mobility concerns the digital transformation of how mobility is organized, delivered, and governed. The systematic review of smart mobility adoption [64] identifies it as a cornerstone of smart-city strategies aimed at reducing congestion, travel time, and crashes through technology-backed interventions. The review also proposes that smart mobility can be analyzed through four interconnected segments: intelligent transport systems (ITSs), open data, big data analytics, and citizen engagement.
Smart mobility is therefore not reducible to a single technology but instead reflects a broader socio-technical transition. In this regard, in [65] the authors conceptualize the “smart mobility transition” as one where emerging technologies-such as the Internet of Things, sharing platforms, and automation-combine to reshape the organization and operation of the mobility system, with governance and public-value objectives becoming central to ensure that digitalization does not simply reproduce old externalities in new forms.
At the infrastructure and architecture level, IoT-enabled sensing is frequently described as a core enabler: smart mobility systems integrate sensing devices, connectivity, and data analytics to improve efficiency, safety, and sustainability outcomes [66], and to support planning and operational optimization. This view aligns directly with ICT architectures designed for distributed sensing, low-power communications, and cloud-based analytics in mobility applications.
Appendix B. ICT Challenges in Smart and Light Mobility
This appendix highlights a series of research challenges in the field of smart and light mobility. The design of ICT infrastructures for smart and sustainable mobility is evolving from isolated monitoring systems toward real-time, cloud-native, and increasingly federated platforms. This transition is driven by the need to integrate heterogeneous data streams generated by urban sensors, mobility services, connected electric vehicles, charging infrastructure, and field-deployed experimental devices. Within this context, the experience of MOST Spoke 5 highlights a central research problem: building an ICT architecture that is not only technically scalable and interoperable but also robust enough to support operational experimentation, scientific analysis, and future service evolution. The challenge is therefore broader than data collection alone. It concerns the definition of an end-to-end digital ecosystem capable of transforming fragmented sensing infrastructures into coherent, reliable, and reusable knowledge systems.
The MOST ICT architecture can be interpreted as a concrete response to these open challenges, but also as a research testbed through which they become visible. Its relevance lies not only in integrating heterogeneous sensing systems, but also in exposing the deeper scientific questions that define next-generation mobility platforms. Future work should therefore focus on adaptive edge-cloud coordination, semantic interoperability layers, quality-aware data engineering, causal and uncertainty-aware analytics, compliance-oriented system design, and reproducible cloud-native experimentation. These directions are essential if smart and sustainable mobility is to evolve from fragmented pilots into dependable digital infrastructures for research, operations, and public value.
Appendix B.1. Balance Between Scalability, Latency, and Architectural Distribution
Smart mobility environments generate highly dynamic and heterogeneous streams, including telemetry, charging events, localization traces, environmental measurements, and safety-related alerts. These flows often exhibit bursty behavior and require different temporal guarantees, ranging from non-critical historical storage to near-real-time processing for operational awareness and anomaly detection. In this setting, purely cloud-centric solutions are often insufficient, especially when bandwidth is constrained, connectivity is intermittent, or response times must remain low. Conversely, fully edge-centric systems are difficult to manage at scale and may limit data integration and long-term analytics. The key research direction is therefore the definition of hybrid edge-cloud orchestration strategies capable of dynamically allocating computation, filtering, and storage across infrastructure layers. This includes function placement, fault tolerance, quality-of-service enforcement, and adaptive scaling mechanisms that reflect application priorities rather than merely infrastructure availability. For projects such as MOST, this challenge becomes concrete when field devices deployed in heterogeneous environments must remain operational, synchronized, and analytically useful despite network variability and changing workloads.
Appendix B.2. Interoperability and Semantic Integration
The current landscape offers many mature standards and protocols, including NGSI-LD and SensorThings for context and IoT data, DATEX II for traffic information, GTFS, NeTEx, and SIRI for public transport, and OCPP, OCPI, and ISO 15118 for electric mobility and charging ecosystems. However, the existence of standards does not automatically guarantee interoperable systems. In practice, smart mobility platforms remain fragmented because standards are often adopted only within specific subdomains, with partial profiles, local extensions, and inconsistent semantics. As a result, integration frequently relies on ad hoc mappings that are difficult to maintain and rarely reusable across projects. A major research direction is the development of a semantic integration layer capable of connecting entities, events, assets, and services across domains [67], enabling the platform to reason consistently over relationships among vehicles, trips, charging sessions, infrastructure, and safety events. An example of Smart Data Models for harmonizing fragmented subdomains is provided in [68]; even though it is focused on agritech, the methodology can be applied analogously to mobility. This requires not only syntactic compatibility but also spatiotemporal entity resolution, ontology alignment, model versioning, and governance of evolving information models. In other words, the missing component is often not another standard, but the “semantic glue” that enables standards to coexist within a coherent operational architecture.
Appendix B.3. Data Quality, Annotation, and Methodological Reliability
Mobility data are intrinsically noisy, incomplete, and context-dependent. GPS signals degrade in dense urban areas, edge devices may disconnect, sensors drift over time, and sampling rates differ across vendors and deployments [69]. These problems are amplified in experimental settings, where devices are often deployed under real-world operating constraints rather than controlled laboratory conditions. Moreover, many relevant analytical tasks, such as cyclist near-miss detection, anomaly detection in charging infrastructure [70], or behavioral classification from embedded signals, depend on labels that are expensive, ambiguous, or difficult to validate. Consequently, the research issue is not merely how to ingest data, but how to create trustworthy data products from imperfect observations. Future research directions include operational data-quality frameworks for mobility time series, provenance-aware ingestion pipelines, uncertainty-aware analytics, and semi-supervised or weakly supervised strategies for labeling rare or safety-critical events. The role of ontologies should also be reconsidered in an operational sense: not only as formal semantic descriptions, but also as living instruments that connect metadata, units, quality indicators, sensor configurations, and event definitions across the platform life cycle.
Appendix B.4. Intersection Between Predictive Analytics and Decision Support
Many existing smart mobility systems focus on forecasting, optimization, and anomaly detection, but public and infrastructural decision making increasingly requires causal reasoning rather than correlation alone. Questions such as whether a safety intervention reduces cyclist risk, whether an operational policy improves charging availability, or whether new mobility services change traffic patterns cannot be addressed satisfactorily through predictive models alone. This opens an important research direction around the integration of high-frequency sensing platforms with causal inference, simulation, and digital twins. Such integration is particularly relevant for research initiatives like MOST, where field experimentation provides an opportunity to observe interventions under realistic conditions. The main methodological difficulty lies in the presence of confounding factors, spatial bias, incomplete coverage, and non-stationary behavior. Future ICT architectures should therefore be designed not only for data acquisition and dashboarding but also for reproducible policy-evaluation pipelines capable of supporting robust scientific claims about system effects.
Appendix B.5. Privacy, Security, and Regulatory Compliance
Smart mobility platforms process data that are often personal or re-identifiable, including movement traces, behavioral patterns, charging histories, and vehicle-generated telemetry. These data are subject to a complex regulatory environment shaped by the GDPR, the recommendations of European data-protection bodies on connected vehicles, cybersecurity obligations such as NIS2 and UNECE R155/R156, and the emerging requirements introduced by the AI Act for risk-sensitive AI systems. In this context, compliance cannot be treated as an external legal constraint added after deployment: it must become an architectural principle. Privacy by design, security by design, data minimization, access control, auditability, and accountability mechanisms must be embedded into the platform from the beginning. A promising research direction is the co-design of ICT architectures in which data engineering, cybersecurity, and legal compliance are treated as mutually constraining dimensions. This is particularly important in federated or multi-actor ecosystems, where municipalities, operators, utilities, researchers, and service providers must exchange data without losing trust, control, or traceability.
Appendix B.6. Long-Term Reproducibility and Software Sustainability
Many smart-city and smart mobility prototypes fail when transitioning from pilot deployments to reliable operational infrastructure. Common causes include fragile pipelines, poorly documented dependencies, lack of observability, and difficulty reproducing the same data and software conditions over time. Containerization and orchestration technologies offer an important foundation for addressing these issues, as they support modular deployment, versioning, and elasticity. However, containerization alone is not sufficient. Scientific ICT infrastructures also need replayable streams, synthetic data generation, regression testing for data pipelines, infrastructure-as-code practices, and unified observability for metrics, traces, and logs. Future research should therefore examine how FAIR principles can be extended beyond datasets to software, workflows, and platform configurations [71]. In the context of MOST, this means designing the ICT architecture not only as an operational backend, but as a reproducible scientific instrument whose behavior can be inspected, validated, and evolved over time.
Appendix B.7. Multi-Stakeholder Governance
Smart mobility systems are inherently interdisciplinary, involving transportation engineering, energy systems, telecommunications, data science, software engineering, law, and public policy. Their infrastructures must mediate between partially conflicting objectives: openness versus privacy, optimization versus fairness, innovation versus robustness, and local needs versus interoperability across sites. This implies that research on ICT architectures cannot remain purely technical: it must address governance models for shared data spaces, responsibilities across actors, validation procedures, and criteria for trustworthy data reuse. In this sense, the future direction is not only toward smarter platforms but also toward governable platforms: infrastructures that can sustain collaboration across institutions while preserving scientific rigor, operational resilience, and regulatory accountability.
References
- Juho-Pekka, V.; Sami, S.; Juho, K.; Jukka, A.; Matias, O.; Jussi, K.; Janne, R.; Koskela, A. Mobility Lab Helsinki—Digital Twin for Mobility. Techinical Report, Forum Virum Helsinki. 2024. Available online: https://testbed.hel.fi/wp-content/uploads/2025/01/digital-twin-for-mobilty-working-paper-v2-1124.pdf (accessed on 1 April 2026).
- Kostiainen, J. Mobility Lab Helsinki—Summary and Insights from a Smart Mobility Testbed. Final Report, Forum Virum Helsinki. 2024. Available online: https://forumvirium.fi/wp-content/uploads/2025/01/Mobility-Lab-Helsinki-lessons-from-a-smart-mobility-testbed.pdf (accessed on 1 April 2026).
- Interreg North-Sea Region. Shared Mobility and Mobility Innovation in the North Sea Region. 2023. Available online: https://www.interregnorthsea.eu/sharedimobihub (accessed on 1 April 2026).
- Smart Mobility Hubs. 2023. Available online: https://smarthubs.eu/ (accessed on 1 April 2026).
- BIPforMaas. 2020. Available online: https://www.bipformaas.it/ (accessed on 1 April 2026).
- E-MOB. 2023. Available online: https://www.interregeurope.eu/e-mob (accessed on 1 April 2026).
- Kontou, A.; Miles, J. Electric Buses: Lessons to be Learnt from the Milton Keynes Demonstration Project. Procedia Eng. 2015, 118, 1137–1144. [Google Scholar] [CrossRef] [Scilit]
- Richard, A.; Robert, M. CIVITAS Research Project—Lesson Learned 2015–2018. 2019. Available online: https://civitas.eu/sites/default/files/civitas_research_projects_-_lessons_learned_2015-2018(1).pdf (accessed on 1 April 2026).
- SMARTA Consortium. Rural Mobility Matters—Insights from SMARTA. 2021. Available online: https://ruralsharedmobility.eu/wp-content/uploads/2021/01/Smarta-broschure-II-08-03.pdf (accessed on 1 April 2026).
- Battarra, R.; Gargiulo, C.; Tremiterra, M.R.; Zucaro, F. Smart mobility in Italian metropolitan cities: A comparative analysis through indicators and actions. Sustain. Cities Soc. 2018, 41, 556–567. [Google Scholar] [CrossRef] [Scilit]
- Battarra, R.; Zucaro, F.; Tremiterra, M.R. Smart mobility: An evaluation method to audit Italian cities. In Proceedings of the 2017 5th IEEE International Conference on Models and Technologies for Intelligent Transportation Systems (MT-ITS); IEEE: Piscataway, NJ, USA, 2017; pp. 421–426. [Google Scholar] [CrossRef] [Scilit]
- Pinna, F.; Masala, F.; Garau, C. Urban Policies and Mobility Trends in Italian Smart Cities. Sustainability 2017, 9, 494. [Google Scholar] [CrossRef] [Scilit]
- Chang, H.; Behrendt, F. From sustainable toward ‘city-friendly’ logistics: Using light electric freight vehicles in zero-emission zones. Cities 2026, 170, 106716. [Google Scholar] [CrossRef] [Scilit]
- Golinska-Dawson, P.; Sethanan, K. Sustainable Urban Freight for Energy-Efficient Smart Cities—Systematic Literature Review. Energies 2023, 16, 2617. [Google Scholar] [CrossRef] [Scilit]
- Pazzini, M.; Cameli, L.; Lantieri, C.; Vignali, V.; Dondi, G.; Jonsson, T. New Micromobility Means of Transport: An Analysis of E-Scooter Users’ Behaviour in Trondheim. Int. J. Environ. Res. Public Health 2022, 19, 7374. [Google Scholar] [CrossRef] [Scilit] [PubMed]
- Ghasemi, A.; Keshavarzi, A.; M. Abdelmoniem, A.; Nejati, O.R.; Derikvand, T. Edge Intelligence for Intelligent Transport Systems: Approaches, challenges, and future directions. Expert Syst. Appl. 2025, 280, 127273. [Google Scholar] [CrossRef] [Scilit]
- Mumtaz Noreen, M.T.; Fouladfar, M.H.; Saeed, N. Evaluation of Battery Management Systems for Electric Vehicles Using Traditional and Modern Estimation Methods. Network 2024, 4, 586–608. [Google Scholar] [CrossRef] [Scilit]
- Rosendo, M.; Granjal, J. Energy–Aware Security Adaptation for Low–Power IoT Applications. Network 2022, 2, 36–52. [Google Scholar] [CrossRef] [Scilit]
- Aburukba, R.; Al-Ali, A.R.; Riaz, A.H.; Al Nabulsi, A.; Khan, D.; Khan, S.; Amer, M. Fog Computing Approach for Shared Mobility in Smart Cities. Energies 2021, 14, 8174. [Google Scholar] [CrossRef] [Scilit]
- Al mojamed, M. On the Use of LoRaWAN for Mobile Internet of Things: The Impact of Mobility. Appl. Syst. Innov. 2021, 5, 5. [Google Scholar] [CrossRef] [Scilit]
- Klaina, H.; Guembe, I.P.; Lopez-Iturri, P.; Astrain, J.J.; Azpilicueta, L.; Aghzout, O.; Alejos, A.V.; Falcone, F. Aggregator to Electric Vehicle LoRaWAN Based Communication Analysis in Vehicle-to-Grid Systems in Smart Cities. IEEE Access 2020, 8, 124688–124701. [Google Scholar] [CrossRef] [Scilit]
- Santana, J.R.; Sotres, P.; Pérez, J.; Sánchez, L.; Lanza, J.; Muñoz, L. LoRaWAN-based Smart Parking Service: Deployment and Performance Evaluation. In Proceedings of the 19th ACM International Symposium on Performance Evaluation of Wireless Ad Hoc, Sensor, & Ubiquitous Networks on 19th ACM International Symposium on Performance Evaluation of Wireless Ad Hoc, Sensor, & Ubiquitous Networks, MSWiM ’22, Montreal, QC, Canada, 24–28 October 2022; ACM: New York, NY, USA, 2022; pp. 107–114. [Google Scholar] [CrossRef] [Scilit]
- Sanchez-Iborra, R.; Bernal-Escobedo, L.; Santa, J. Eco-Efficient Mobility in Smart City Scenarios. Sustainability 2020, 12, 8443. [Google Scholar] [CrossRef] [Scilit]
- Nor, R.F.A.M.; Zaman, F.H.K.; Mubdi, S. Smart traffic light for congestion monitoring using LoRaWAN. In Proceedings of the 2017 IEEE 8th Control and System Graduate Research Colloquium (ICSGRC); IEEE: Piscataway, NJ, USA, 2017; pp. 132–137. [Google Scholar] [CrossRef] [Scilit]
- Johnston, S.J.; Basford, P.J.; Bulot, F.M.J.; Apetroaie-Cristea, M.; Easton, N.H.C.; Davenport, C.; Foster, G.L.; Loxham, M.; Morris, A.K.R.; Cox, S.J. City Scale Particulate Matter Monitoring Using LoRaWAN Based Air Quality IoT Devices. Sensors 2019, 19, 209. [Google Scholar] [CrossRef] [Scilit] [PubMed]
- Ferrari, P.; Sisinni, E.; Bellagente, P.; Carvalho, D.F.; Depari, A.; Flammini, A.; Pasetti, M.; Rinaldi, S.; Silva, I. On the Use of LoRaWAN and Cloud Platforms for Diversification of Mobility-as-a-Service Infrastructure in Smart City Scenarios. IEEE Trans. Instrum. Meas. 2022, 71, 5501109. [Google Scholar] [CrossRef] [Scilit]
- Ayoub, W.; Samhat, A.E.; Nouvel, F.; Mroue, M.; Prevotet, J.C. Internet of Mobile Things: Overview of LoRaWAN, DASH7, and NB-IoT in LPWANs Standards and Supported Mobility. IEEE Commun. Surv. Tutor. 2019, 21, 1561–1581. [Google Scholar] [CrossRef] [Scilit]
- Gazis, V.; Goertz, M.; Huber, M.; Leonardi, A.; Mathioudakis, K.; Wiesmaier, A.; Zeiger, F. Short Paper: IoT: Challenges, projects, architectures. In Proceedings of the 2015 18th International Conference on Intelligence in Next Generation Networks; IEEE: Piscataway, NJ, USA, 2015; pp. 145–147. [Google Scholar] [CrossRef] [Scilit]
- Ancarani, A.; Di Mauro, C.; Legenvre, H.; Cardella, M.S. Internet of things adoption: A typology of projects. Int. J. Oper. Prod. Manag. 2019, 40, 849–872. [Google Scholar] [CrossRef] [Scilit]
- Domínguez-Bolaño, T.; Campos, O.; Barral, V.; Escudero, C.J.; García-Naya, J.A. An overview of IoT architectures, technologies, and existing open-source projects. Internet Things 2022, 20, 100626. [Google Scholar] [CrossRef] [Scilit]
- Gemirter, C.B.; Senturca, C.; Baydere, S. A Comparative Evaluation of AMQP, MQTT and HTTP Protocols Using Real-Time Public Smart City Data. In Proceedings of the 2021 6th International Conference on Computer Science and Engineering (UBMK); IEEE: Piscataway, NJ, USA, 2021; pp. 542–547. [Google Scholar] [CrossRef] [Scilit]
- Gupta, P.; M, I.O.P. A Survey of Application Layer Protocols for Internet of Things. In Proceedings of the 2021 International Conference on Communication Information and Computing Technology (ICCICT); IEEE: Piscataway, NJ, USA, 2021; pp. 1–6. [Google Scholar] [CrossRef] [Scilit]
- Razzaque, M.A.; Milojevic-Jevric, M.; Palade, A.; Clarke, S. Middleware for Internet of Things: A Survey. IEEE Internet Things J. 2016, 3, 70–95. [Google Scholar] [CrossRef] [Scilit]
- Lalhriatpuii; Ruchi; Wasson, V. Comprehensive Exploration of IoT Communication Protocol: CoAP, MQTT, HTTP, LoRaWAN and AMQP. In Machine Learning Algorithms; Springer Nature: Cham, Switzerland, 2024; pp. 261–274. [Google Scholar] [CrossRef] [Scilit]
- Rafique, S.H.; Abdallah, A.; Alhosani, S.A.; Jamil, N. A Review of AMQP Protocol: Characteristics, Security Challenges and Proposed Enhancement. JOIV Int. J. Inform. Vis. 2025, 9, 1283. [Google Scholar] [CrossRef] [Scilit]
- Uy, N.Q.; Nam, V.H. A comparison of AMQP and MQTT protocols for Internet of Things. In Proceedings of the 2019 6th NAFOSTED Conference on Information and Computer Science (NICS); IEEE: Piscataway, NJ, USA, 2019; pp. 292–297. [Google Scholar] [CrossRef] [Scilit]
- Dello Iacono, S.; Astolfi, D.; Vasile, A.; Pasetti, M.; Depari, A.; Ferrari, P.; Flammini, A.; Rinaldi, S.; Sisinni, E. Application of the LoRaWAN Technology for Managing E-Bikes Charging in Urban Scenario. In Proceedings of the 2025 IEEE International Workshop on Metrology for Automotive (MetroAutomotive); IEEE: Piscataway, NJ, USA, 2025; pp. 97–102. [Google Scholar] [CrossRef] [Scilit]
- Zhang, X.; Lim, E.S.; Chen, M. Promoting Sustainable Urban Mobility: Factors Influencing E-Bike Adoption in Henan Province, China. Sustainability 2024, 16, 10136. [Google Scholar] [CrossRef] [Scilit]
- Corti, F.; Dello Iacono, S.; Astolfi, D.; Pasetti, M.; Vasile, A.; Reatti, A.; Flammini, A. A comprehensive review of charging infrastructure for Electric Micromobility Vehicles: Technologies and challenges. Energy Rep. 2024, 12, 545–567. [Google Scholar] [CrossRef] [Scilit]
- Velvizhi, V.A.; Anbarasan, M.; S, G.; K, S.E.; K, S.G.; R, S.N. Real-Time Energy Monitoring for Renewable Power Systems: Enhancing Stability and Efficiency with IoT-Based Wireless Sensor Networks. In Proceedings of the 2025 International Conference on Computing and Communication Technologies (ICCCT); IEEE: Piscataway, NJ, USA, 2025; pp. 1–4. [Google Scholar] [CrossRef] [Scilit]
- Bonavolontà, F.; Liccardo, A.; Mottola, F.; Proto, D. Real-Time Monitoring of Energy Contributions in Renewable Energy Communities Through an IoT Measurement System. Sensors 2025, 25, 1402. [Google Scholar] [CrossRef] [Scilit] [PubMed]
- Liu, Y.Z.; Nguyen, H.M.; Nguyen, M.T. Electric Vehicles and Urban Tourism in Smart Cities: A Bibliometric Review of Sustainable Mobility Trends and Infrastructure Development. World Electr. Veh. J. 2025, 16, 545. [Google Scholar] [CrossRef] [Scilit]
- Fournier, N.; Christofa, E.; Knodler, M.A. A sinusoidal model for seasonal bicycle demand estimation. Transp. Res. Part D Transp. Environ. 2017, 50, 154–169. [Google Scholar] [CrossRef] [Scilit]
- Corti, F.; Dello Iacono, S.; Astolfi, D.; Pasetti, M.; Flammini, A.; Lozito, G.M.; Reatti, A. Optimization of Charging Infrastructure for Electric Micromobility Vehicles in Touristic Areas. In Proceedings of the 2024 IEEE 22nd Mediterranean Electrotechnical Conference (MELECON); IEEE: Piscataway, NJ, USA, 2024; pp. 1368–1373. [Google Scholar] [CrossRef] [Scilit]
- Corti, F.; Maria Lozito, G.; Astolfi, D.; Dello Iacono, S.; Vasile, A.; Pasetti, M.; Reatti, A.; Flammini, A. Multi–Objective Optimization of Off-Grid E-Bikes Charging Stations Powered by PhotoVoltaics. IEEE Access 2025, 13, 75416–75433. [Google Scholar] [CrossRef] [Scilit]
- Astolfi, D.; Bellagente, P.; Brandão, D.; Dello Iacono, S.; Depari, A.; Ferrari, P.; Flammini, A.; Gaffurini, M.; Pasetti, M.; Rinaldi, S.; et al. ICT-Equipped Portable E-Bike Charging Station Powered by Renewables for Mass Cycling Events. In Proceedings of the 2024 IEEE International Workshop on Metrology for Automotive (MetroAutomotive); IEEE: Piscataway, NJ, USA, 2024; pp. 141–146. [Google Scholar] [CrossRef] [Scilit]
- Favuzza, S.; Zizzo, G.; Vasile, A.; Astolfi, D.; Pasetti, M. Comparative Analysis of Charging Station Technologies for Light Electric Vehicles for the Exploitation in Small Islands. Energies 2025, 18, 1477. [Google Scholar] [CrossRef] [Scilit]
- Vasile, A.; Astolfi, D.; Pasetti, M.; Zizzo, G.; Sanseverino, E.R.; Flammini, A. From the Laboratory to the Market: Considerations on the Electrical Safety of a Prototype of Off-Grid Charging Station for E-Bikes. In Proceedings of the 2025 IEEE/IAS 61st Industrial and Commercial Power Systems Technical Conference (I&CPS); IEEE: Piscataway, NJ, USA, 2025; pp. 1–6. [Google Scholar] [CrossRef] [Scilit]
- Astolfi, D.; Bellagente, P.; Dello Iacono, S.; Flammini, A.; Malighetti, P.; Pasetti, M.; Vasile, A. Design and Pilot Tests of a Transportable Off-Grid Charging Station for E-Bikes Powered by Renewables. In Proceedings of the 2024 IEEE International Humanitarian Technologies Conference (IHTC); IEEE: Piscataway, NJ, USA, 2024; pp. 1–6. [Google Scholar] [CrossRef] [Scilit]
- Pasetti, M.; Vasile, A.; Astolfi, D.; Dello Iacono, S.; Sisinni, E.; Gaffurini, M.; Ferrari, P.; Rinaldi, S. Techno-Environmental Assessment of Photovoltaic-Powered Charging Stations for Light Electric Vehicles. In Proceedings of the 2025 International Conference on Clean Electrical Power (ICCEP); IEEE: Piscataway, NJ, USA, 2025; pp. 948–955. [Google Scholar] [CrossRef] [Scilit]
- Georgiou, O.; Raza, U. Low Power Wide Area Network Analysis: Can LoRa Scale? IEEE Wirel. Commun. Lett. 2017, 6, 162–165. [Google Scholar] [CrossRef] [Scilit]
- Forum, I.T. Towards the Light: Effective Light Mobility Policies in Cities; OECD Publishing: Paris, France, 2023. [Google Scholar] [CrossRef] [Scilit]
- Forum, I.T. Safer Micromobility; OECD Publishing: Paris, France, 2024. [Google Scholar] [CrossRef] [Scilit]
- Forum, I.T. Greener Micromobility; OECD Publishing: Paris, France, 2024. [Google Scholar] [CrossRef] [Scilit]
- Scrivano, L.; Tessari, A.; Marcora, S.M.; Manners, D.N. Active mobility and mental health: A scoping review towards a healthier world. Camb. Prism. Glob. Ment. Health 2023, 11, e1. [Google Scholar] [CrossRef] [Scilit] [PubMed]
- Pucher, J.; Buehler, R. (Eds.) City Cycling; The MIT Press: Cambridge, MA, USA, 2012. [Google Scholar] [CrossRef] [Scilit]
- Marques, D.L.; Coelho, M.C. A Literature Review of Emerging Research Needs for Micromobility-Integration through a Life Cycle Thinking Approach. Future Transp. 2022, 2, 135–164. [Google Scholar] [CrossRef] [Scilit]
- Shaheen, S.; Cohen, A.; Chan, N.; Bansal, A. Sharing strategies: Carsharing, shared micromobility (bikesharing and scooter sharing), transportation network companies, microtransit, and other innovative mobility modes. In Transportation, Land Use, and Environmental Planning; Elsevier: Amsterdam, The Netherlands, 2020; pp. 237–262. [Google Scholar] [CrossRef] [Scilit]
- Santucci, M.; Pieve, M.; Pierini, M. Electric L-category Vehicles for Smart Urban Mobility. Transp. Res. Procedia 2016, 14, 3651–3660. [Google Scholar] [CrossRef] [Scilit]
- Seiffert, R.; Brost, M.; Gebhardt, L. The Potential of Light Electric Vehicles to Substitute Car Trips in Commercial Transport in Germany. World Electr. Veh. J. 2025, 16, 547. [Google Scholar] [CrossRef] [Scilit]
- Şengül, B.; Mostofi, H. Impacts of E-Micromobility on the Sustainability of Urban Transportation-A Systematic Review. Appl. Sci. 2021, 11, 5851. [Google Scholar] [CrossRef] [Scilit]
- Figenbaum, E. Perspectives on Norway’s supercharged electric vehicle policy. Environ. Innov. Soc. Transit. 2017, 25, 14–34. [Google Scholar] [CrossRef] [Scilit]
- Biyik, C.; Abareshi, A.; Paz, A.; Ruiz, R.A.; Battarra, R.; Rogers, C.D.; Lizarraga, C. Smart Mobility Adoption: A Review of the Literature. J. Open Innov. Technol. Mark. Complex. 2021, 7, 146. [Google Scholar] [CrossRef] [Scilit]
- Alam, T.; Gupta, R.; Ahamed, N.N.; Ullah, A.; Almaghthwi, A. Towards sustainable IoT-based smart mobility systems in smart cities. GeoJournal 2024, 89, 235. [Google Scholar] [CrossRef] [Scilit]
- Docherty, I.; Marsden, G.; Anable, J. The governance of smart mobility. Transp. Res. Part A Policy Pract. 2018, 115, 114–125. [Google Scholar] [CrossRef] [Scilit]
- Dossou, M.; Chédé, S.; Honfoga, A.C.; Balogoun, M.; Dassi, P.; Rottenberg, F. IoT Applications in Agriculture and Environment: A Systematic Review Based on Bibliometric Study in West Africa. Network 2025, 5, 23. [Google Scholar] [CrossRef] [Scilit]
- Roccatello, E.; Pagano, A.; Levorato, N.; Rumor, M. State of the Art in Internet of Things Standards and Protocols for Precision Agriculture with an Approach to Semantic Interoperability. Network 2025, 5, 14. [Google Scholar] [CrossRef] [Scilit]
- Dautov, R.; Tverdal, S.; Bondevik, A.S.; Arild Frøshaug, S.; Szabo, V.; Fiksdal, J.R. Data Interoperability Using Smart Data Models and NGSI-LD for the Norwegian Agrifood Sector. In Proceedings of the 2025 20th Conference on Computer Science and Intelligence Systems (FedCSIS), Kraków, Poland, 14–17 September 2025; pp. 297–302. [Google Scholar] [CrossRef] [Scilit]
- Zhou, Z.; Wang, Y.; Xie, X.; Qiao, L.; Li, Y. STUaNet: Understanding Uncertainty in Spatiotemporal Collective Human Mobility. In Proceedings of the Web Conference 2021, WWW ’21, Ljubljana, Slovenia, 19–23 April 2021; ACM: New York, NY, USA, 2021; pp. 1868–1879. [Google Scholar] [CrossRef] [Scilit]
- Li, H.; Liu, T.; Chan, H.K.H.; Lu, H. Spatial data analysis for intelligent buildings: Awareness of context and data uncertainty. Front. Big Data 2022, 5, 1049198. [Google Scholar] [CrossRef] [Scilit] [PubMed]
- Wilkinson, M.D.; Dumontier, M.; Aalbersberg, I.J.; Appleton, G.; Axton, M.; Baak, A.; Blomberg, N.; Boiten, J.W.; da Silva Santos, L.B.; Bourne, P.E.; et al. The FAIR Guiding Principles for scientific data management and stewardship. Sci. Data 2016, 3, 160018. [Google Scholar] [CrossRef] [Scilit] [PubMed]
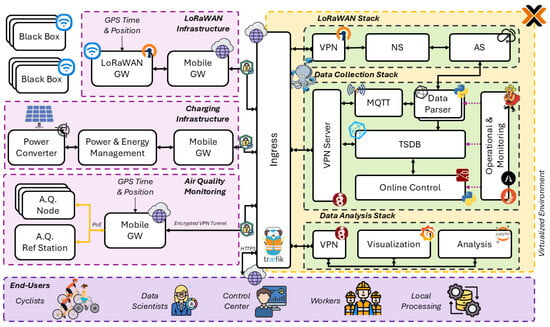
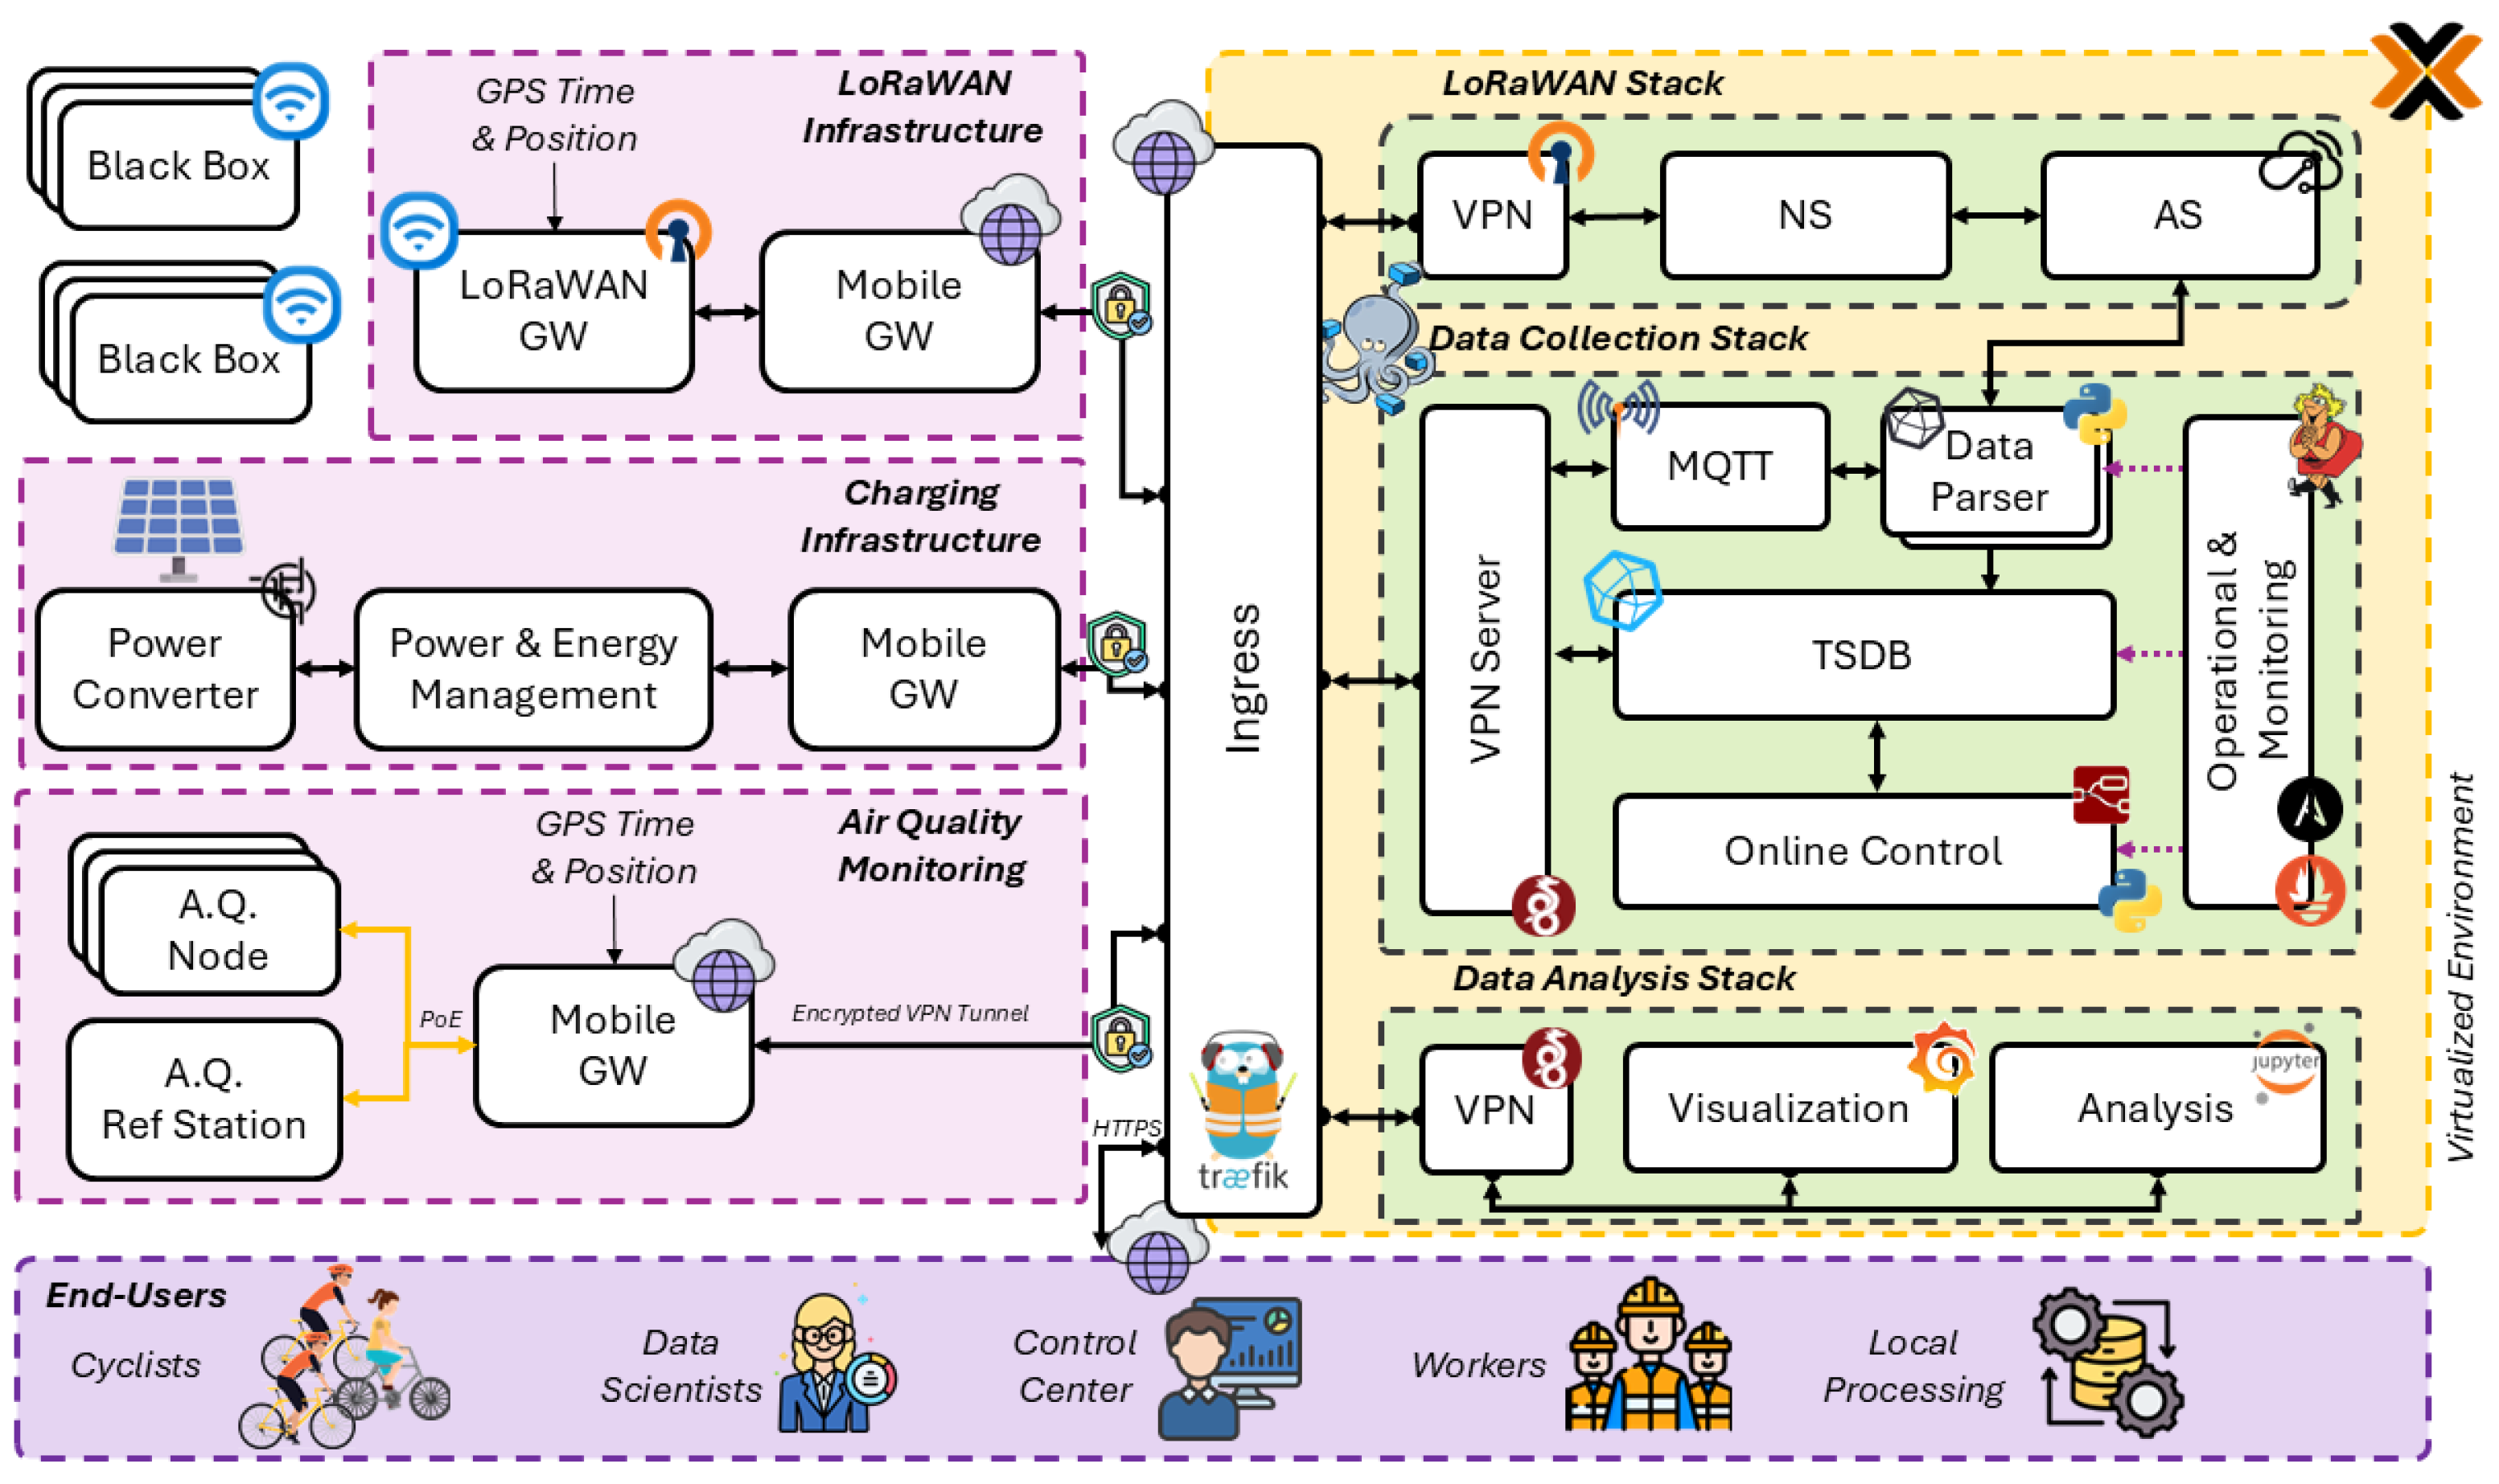
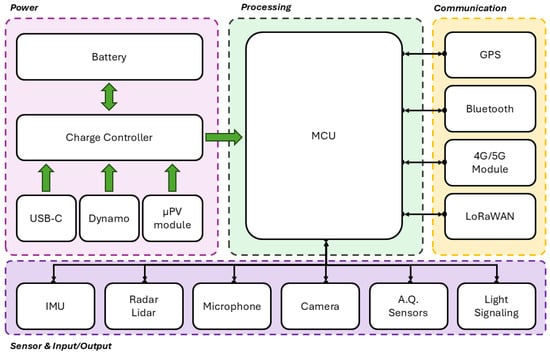
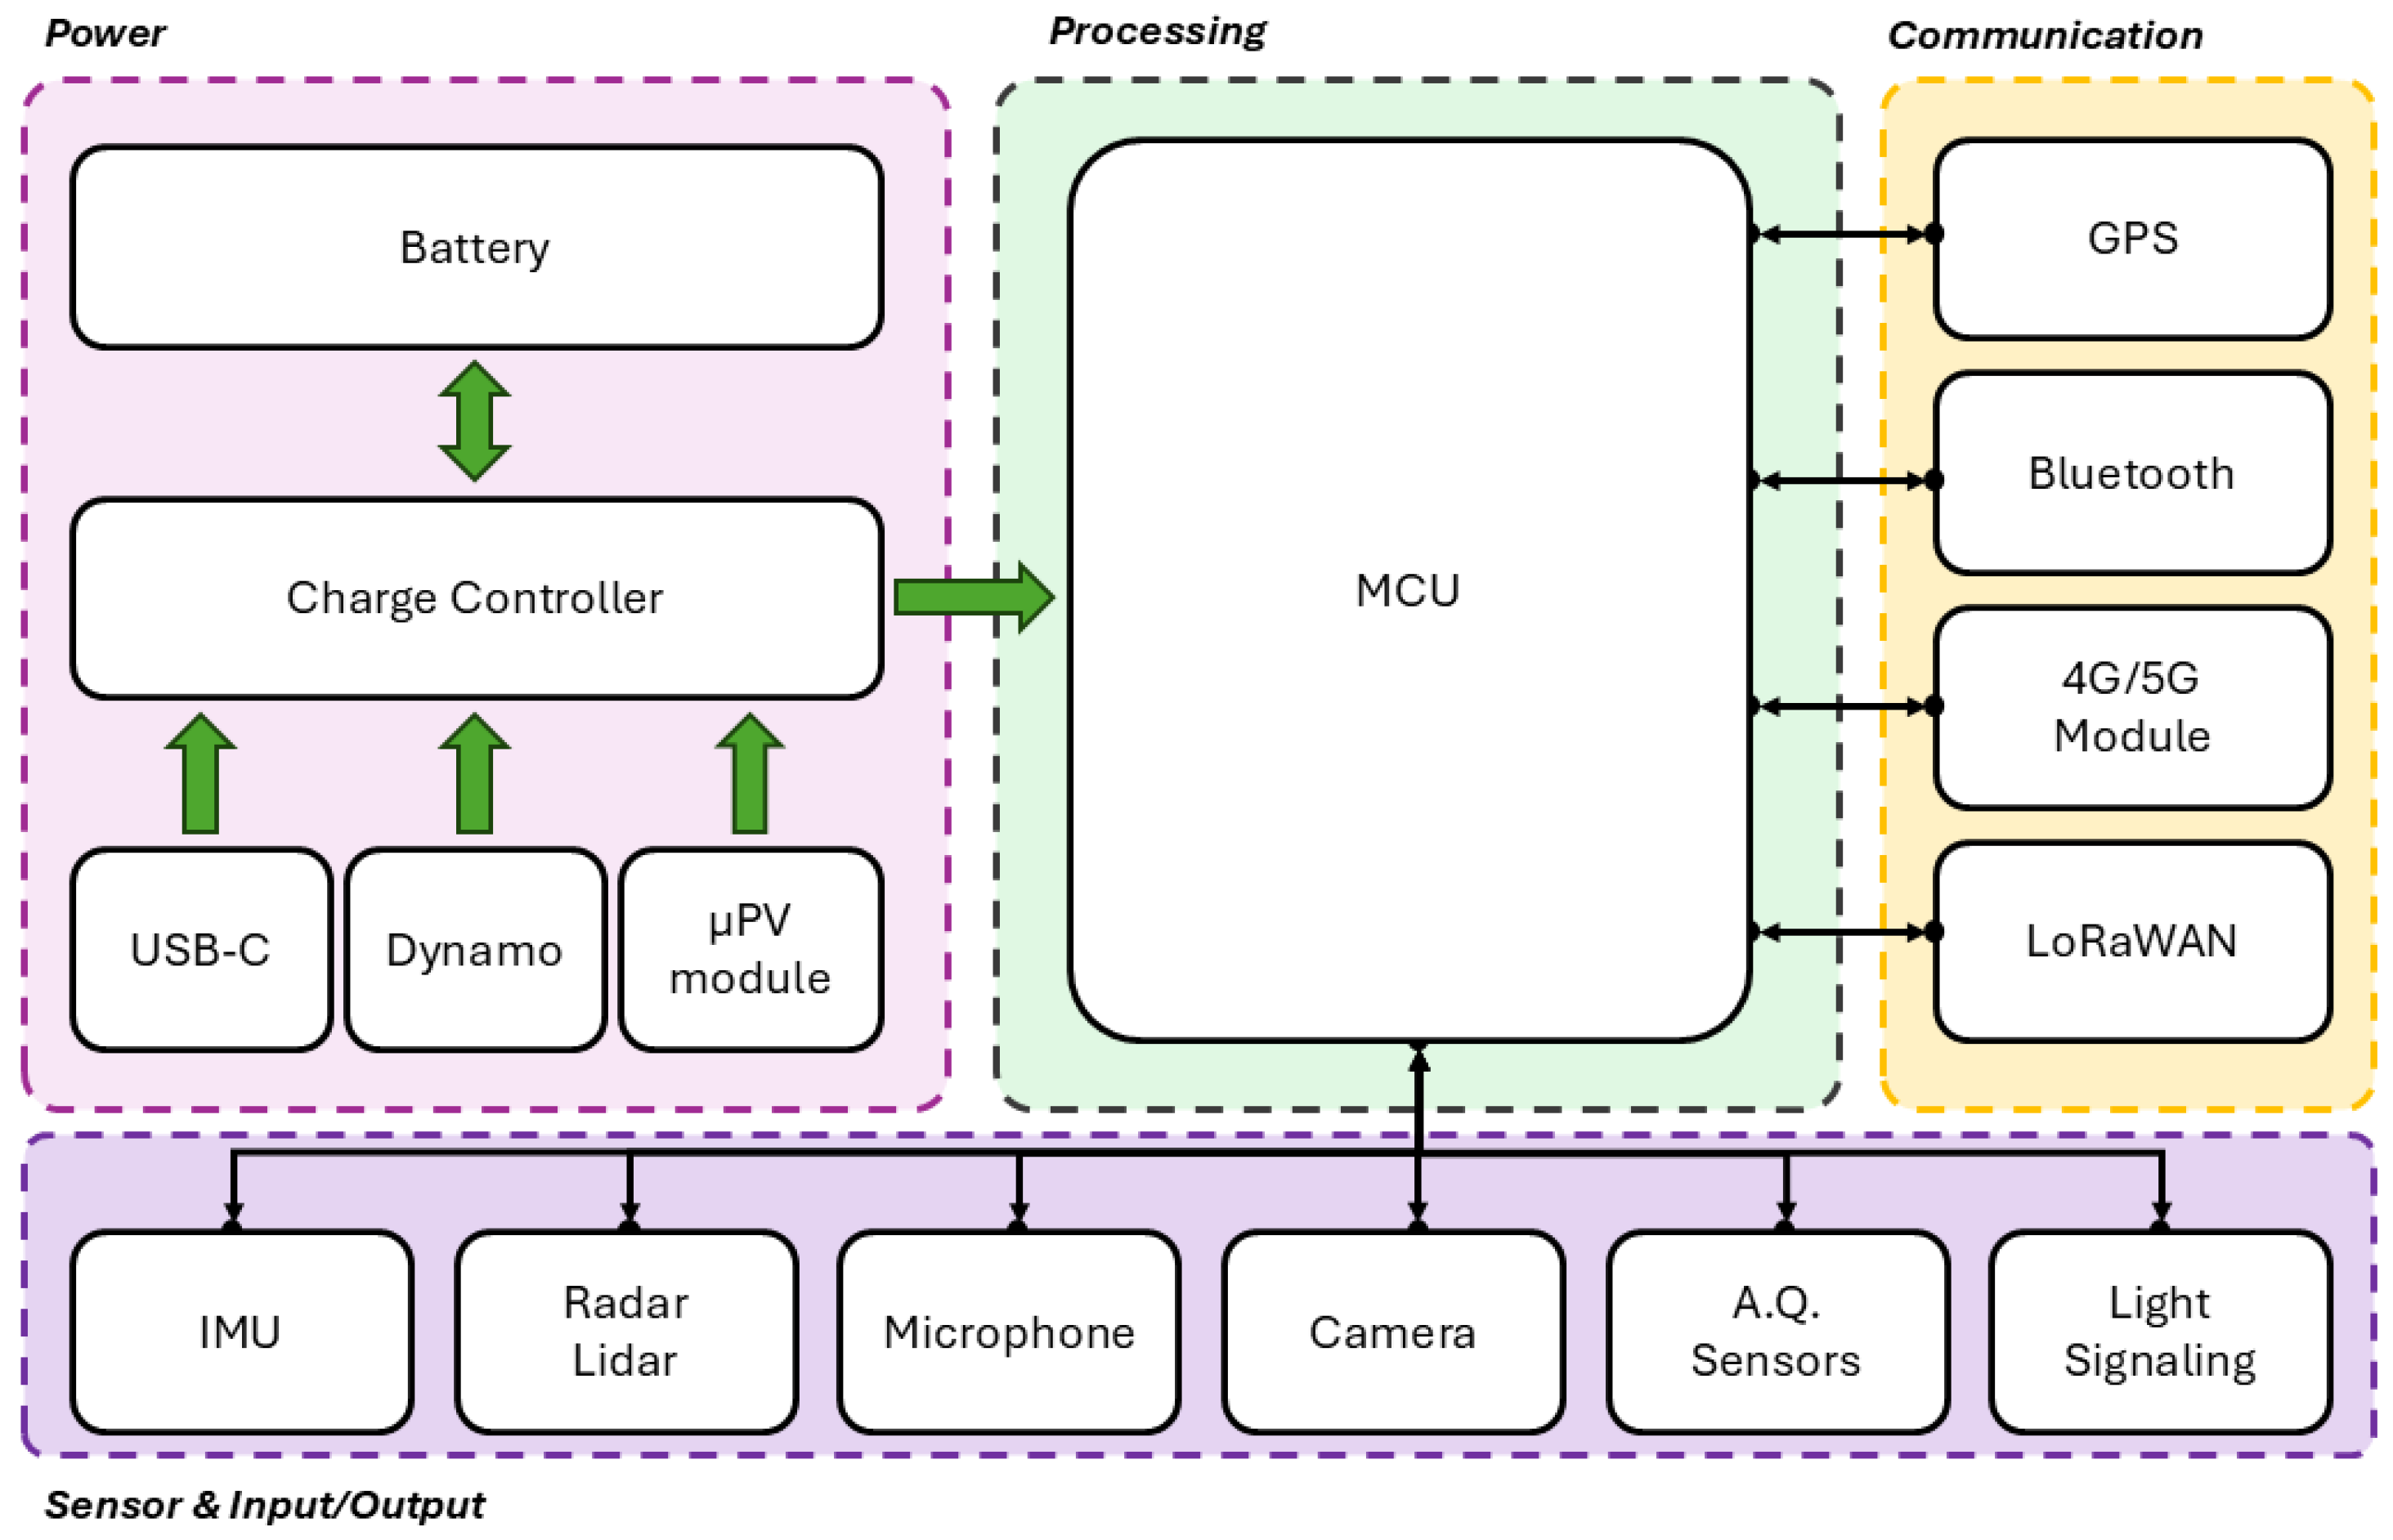
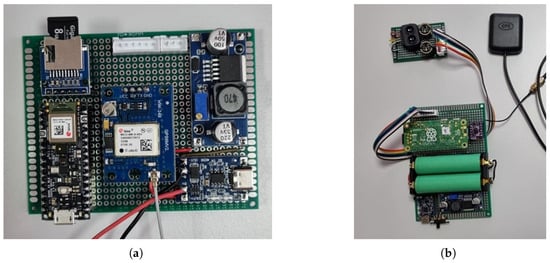
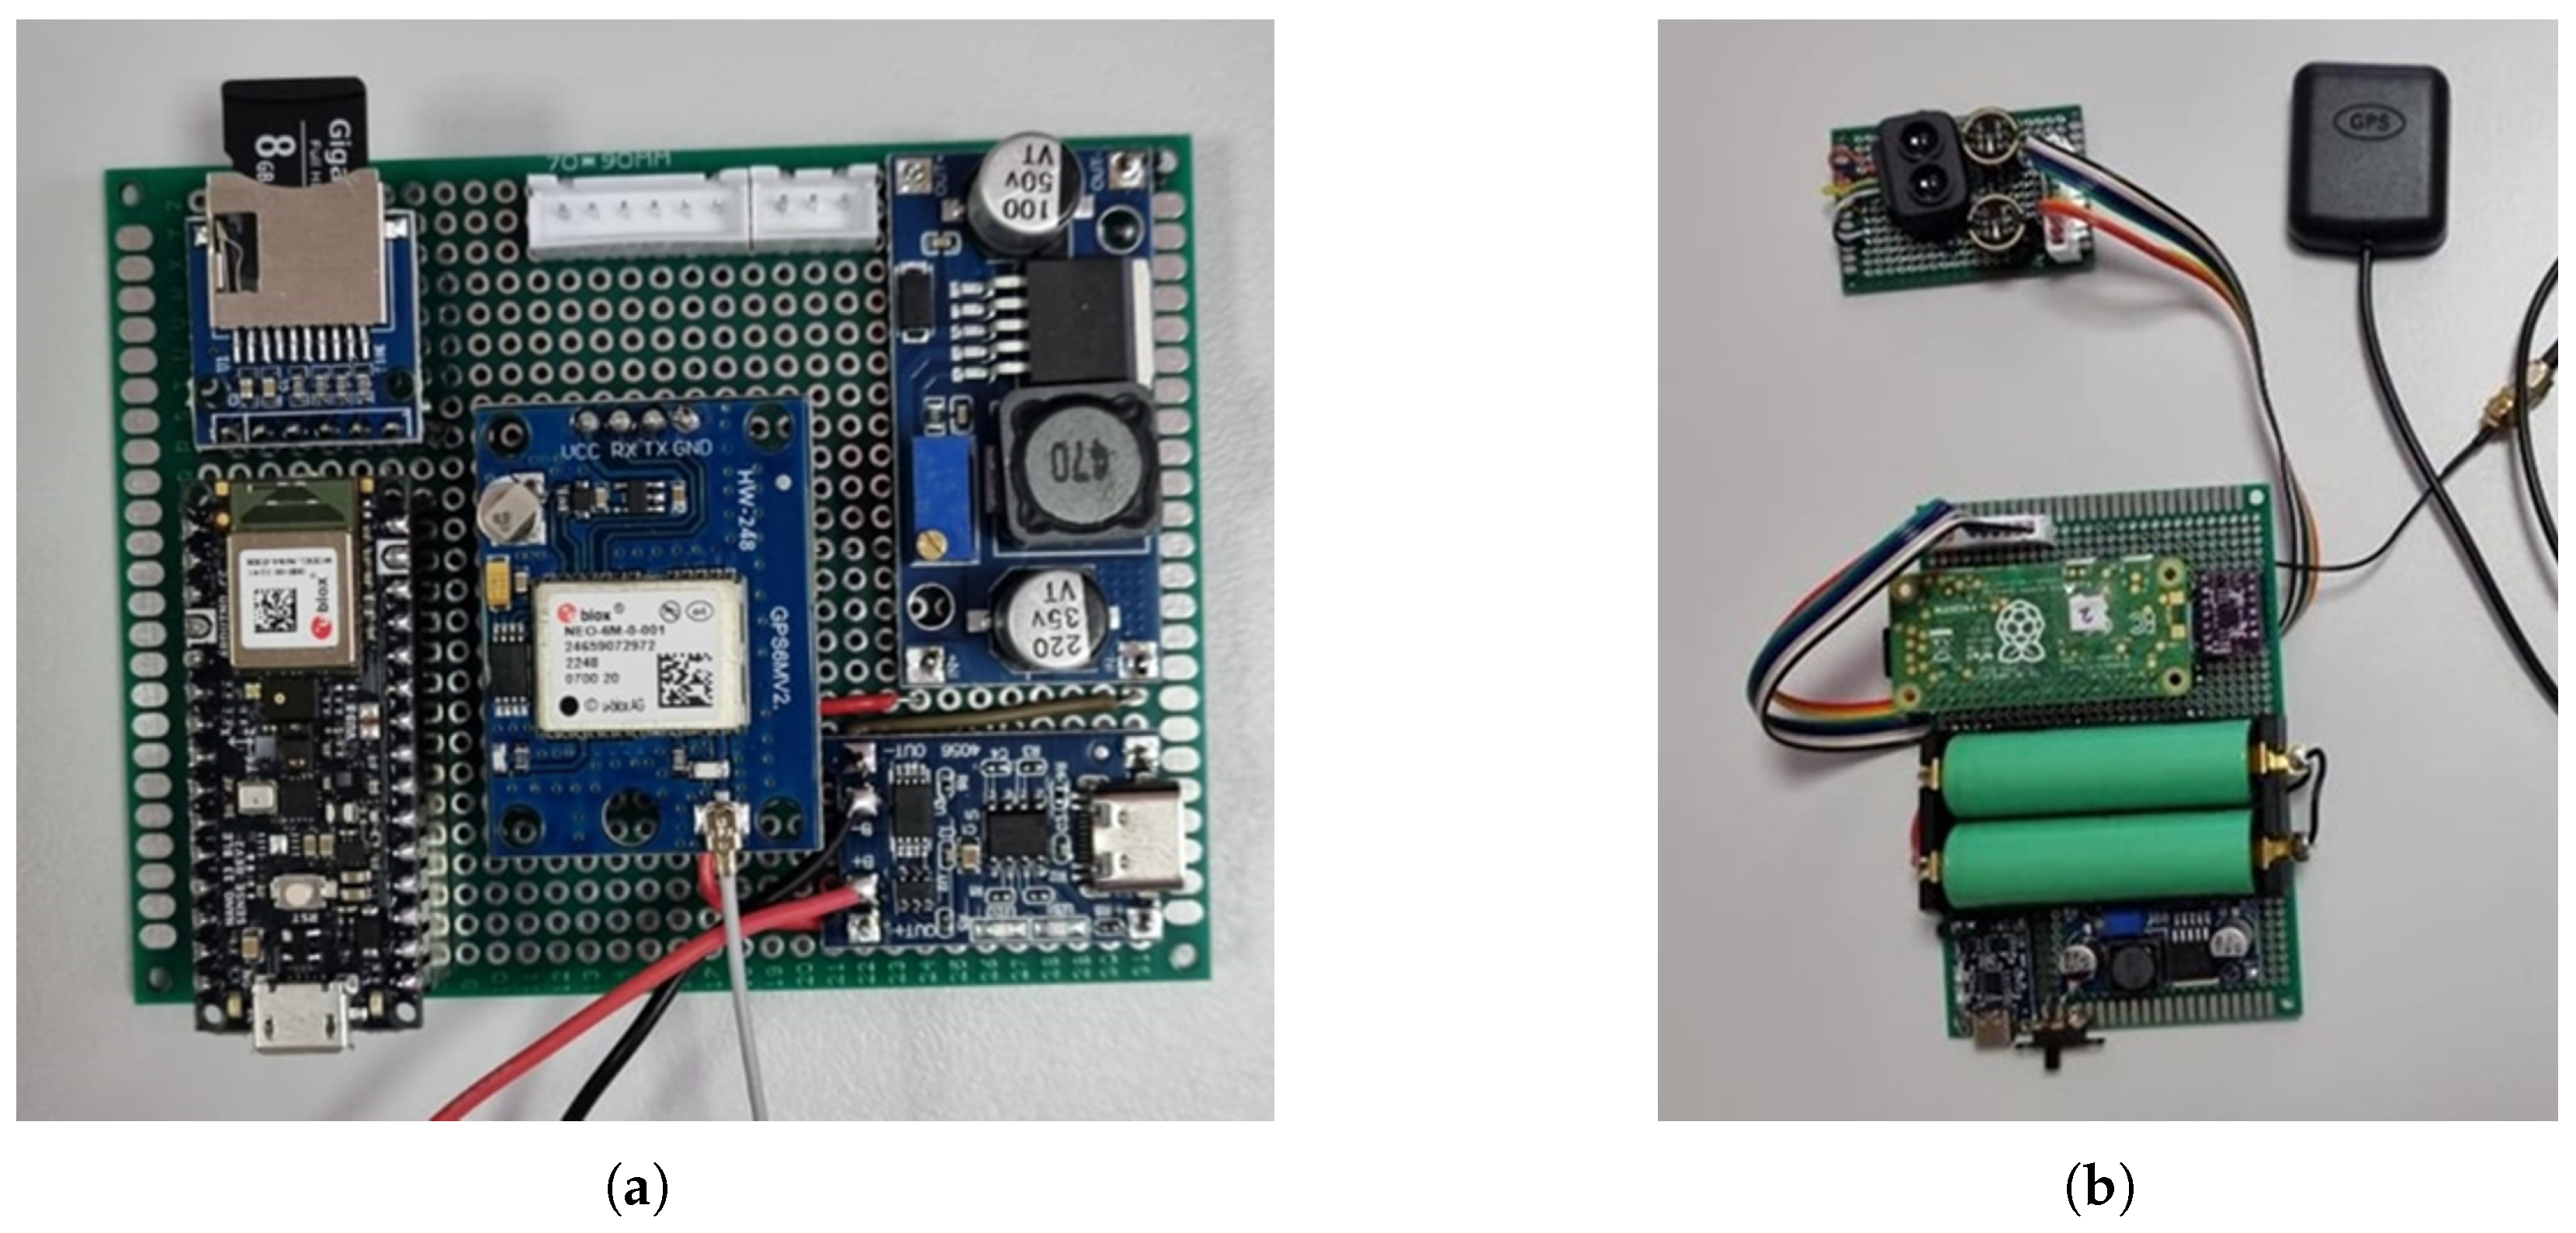
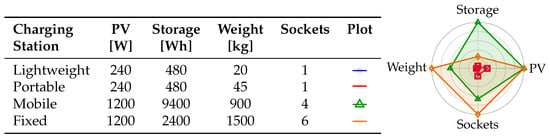
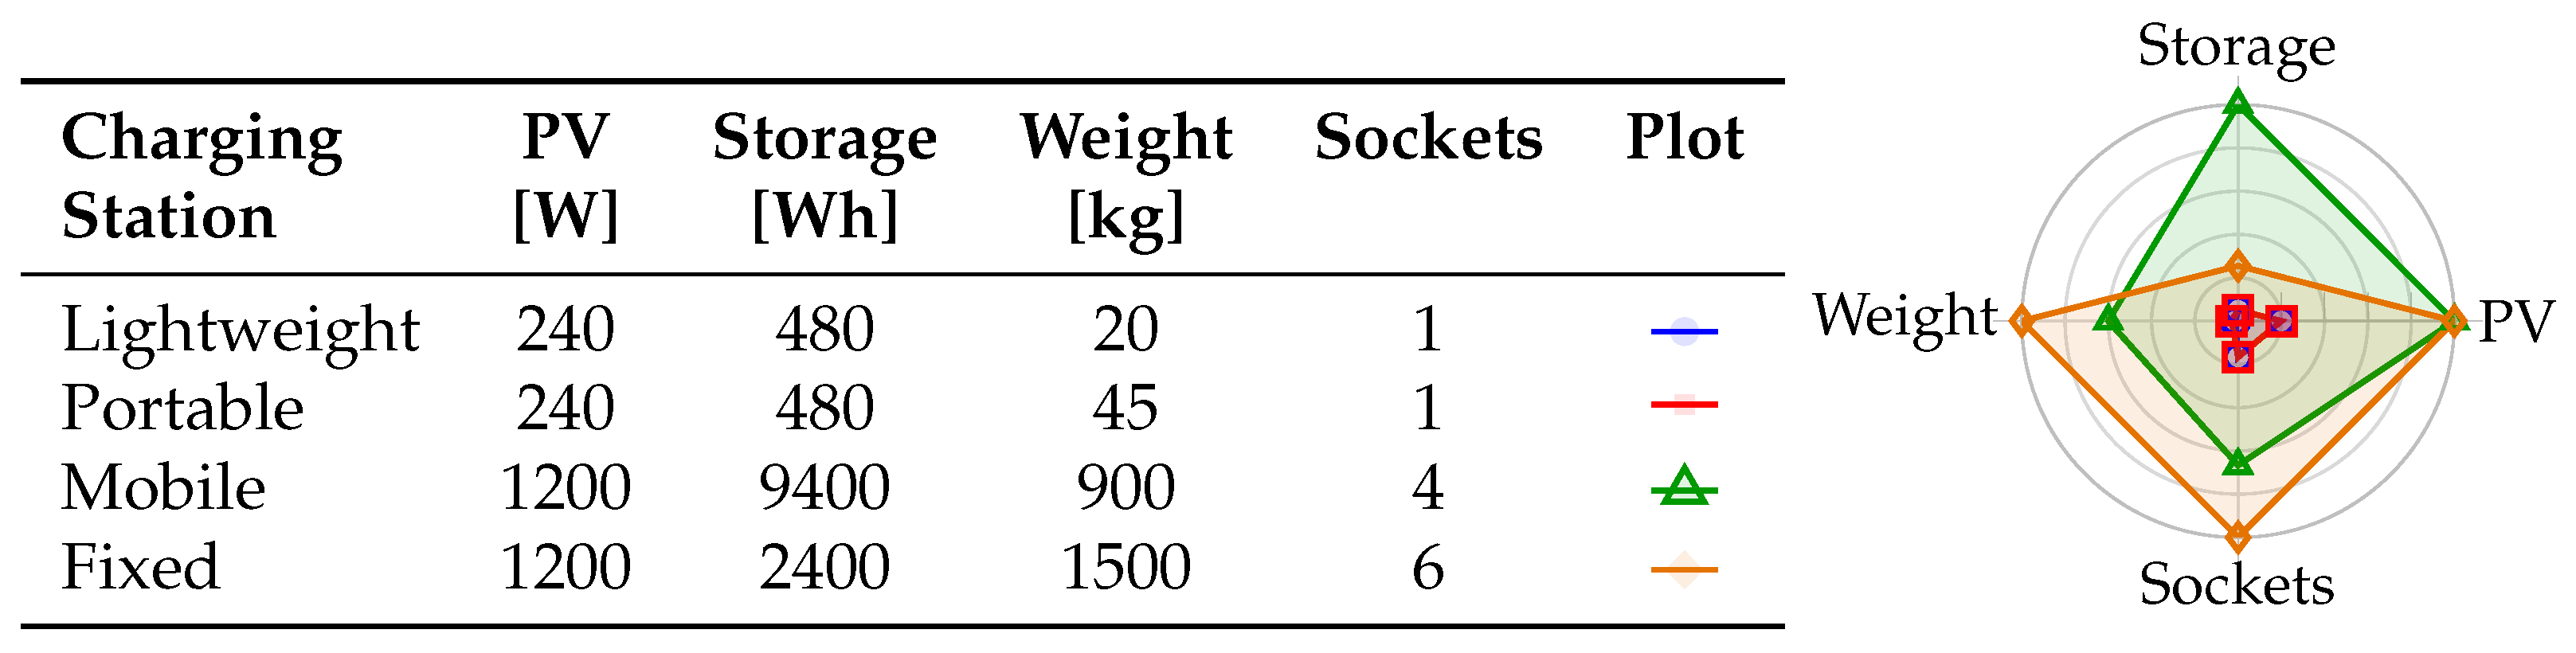
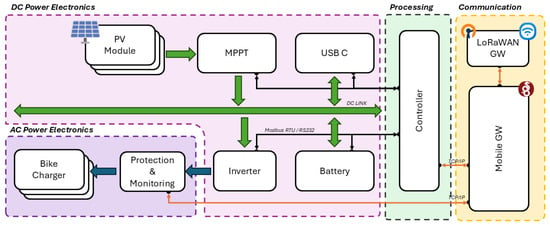
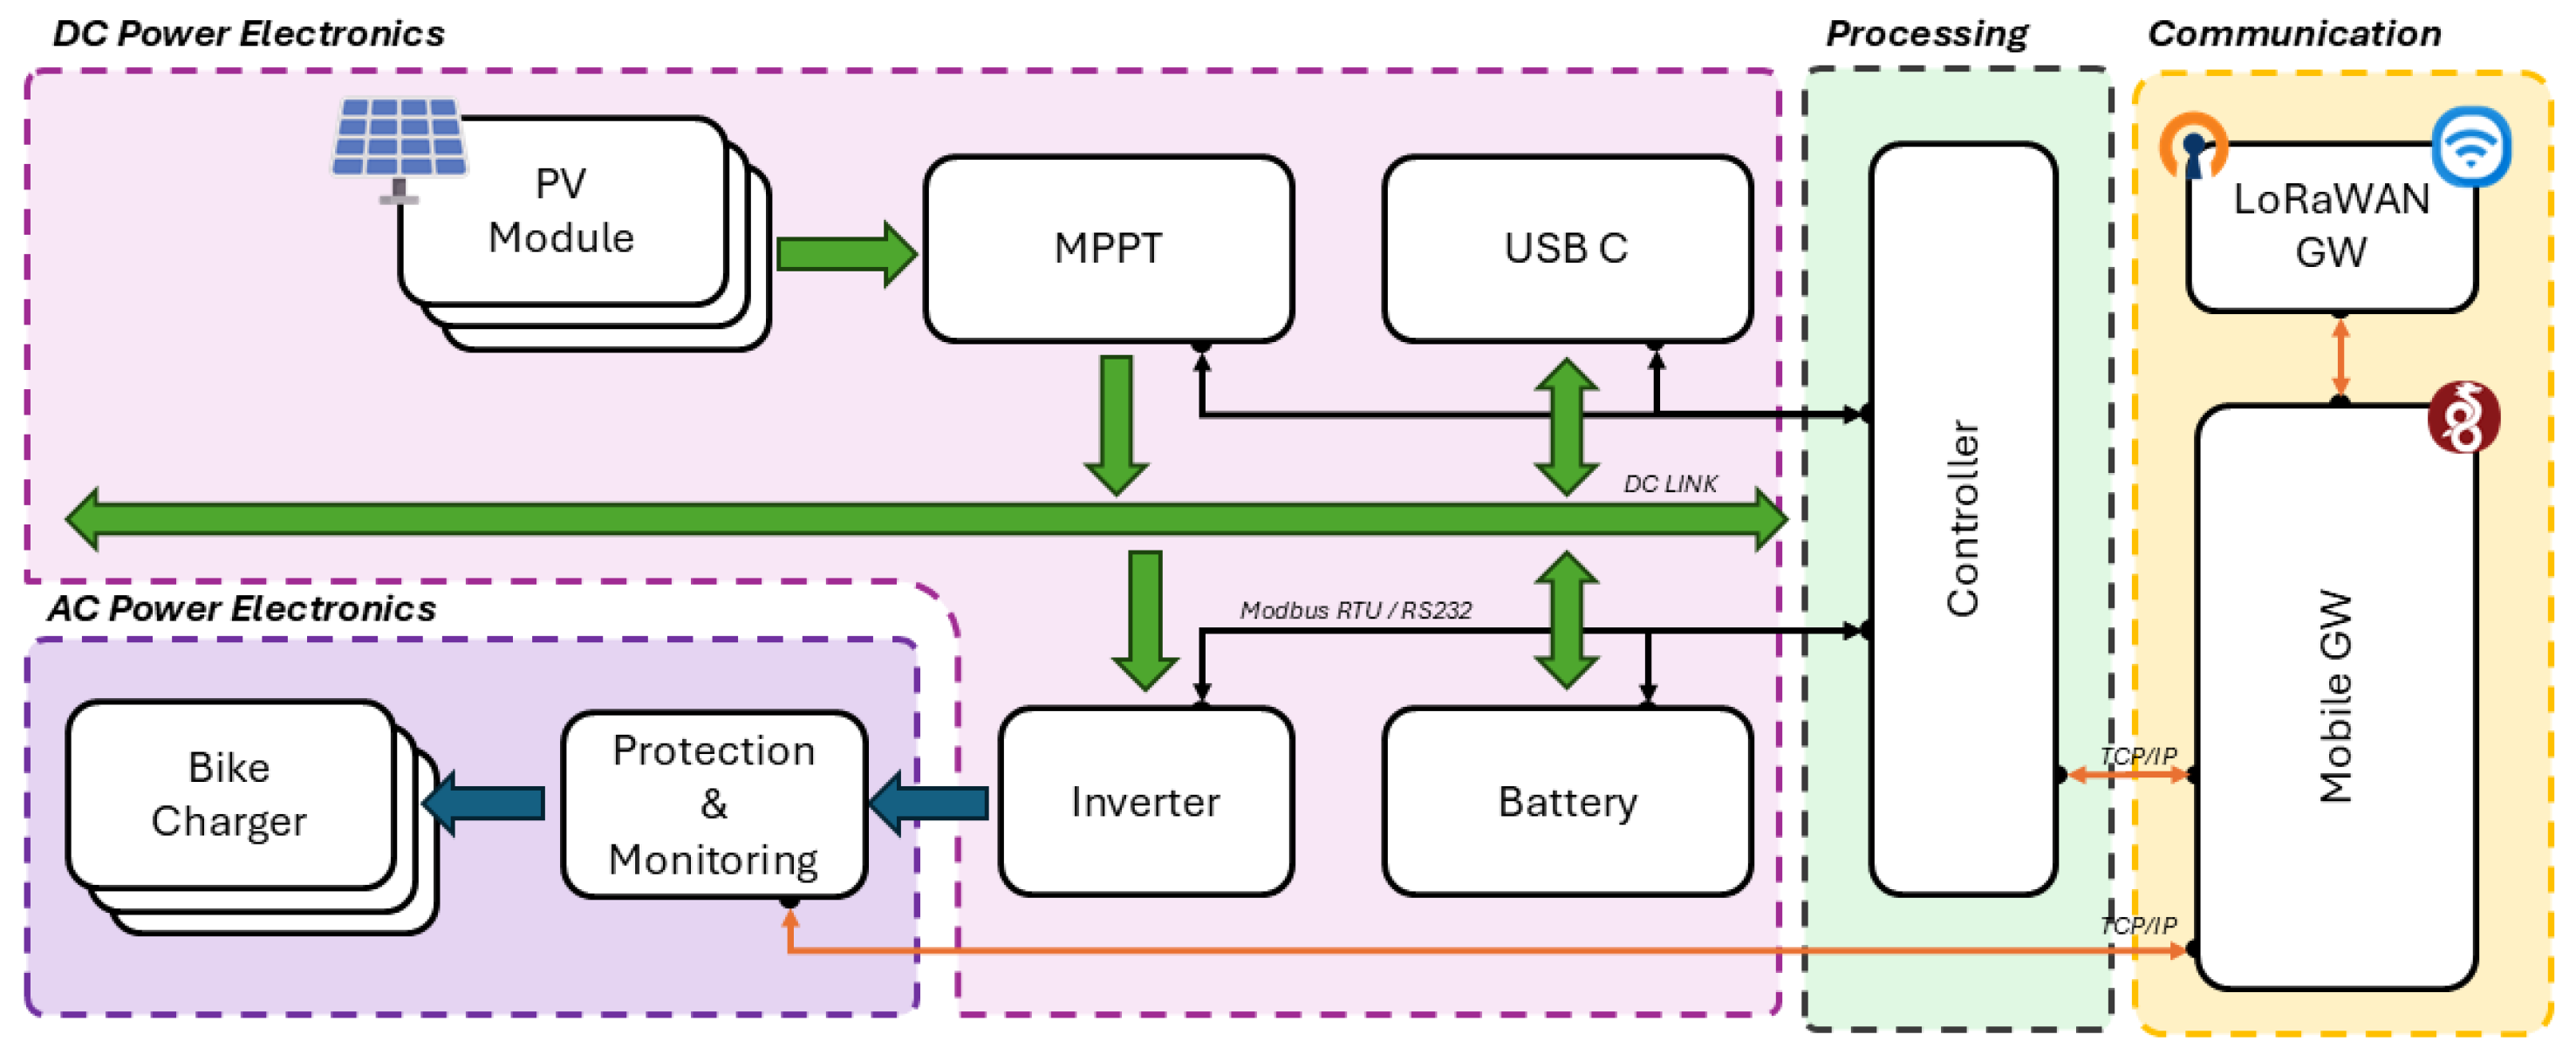
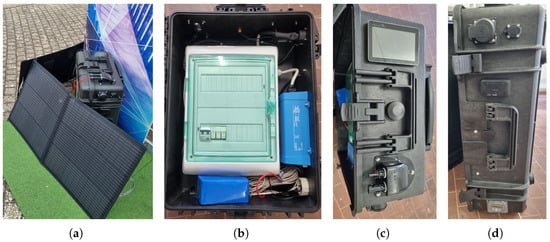
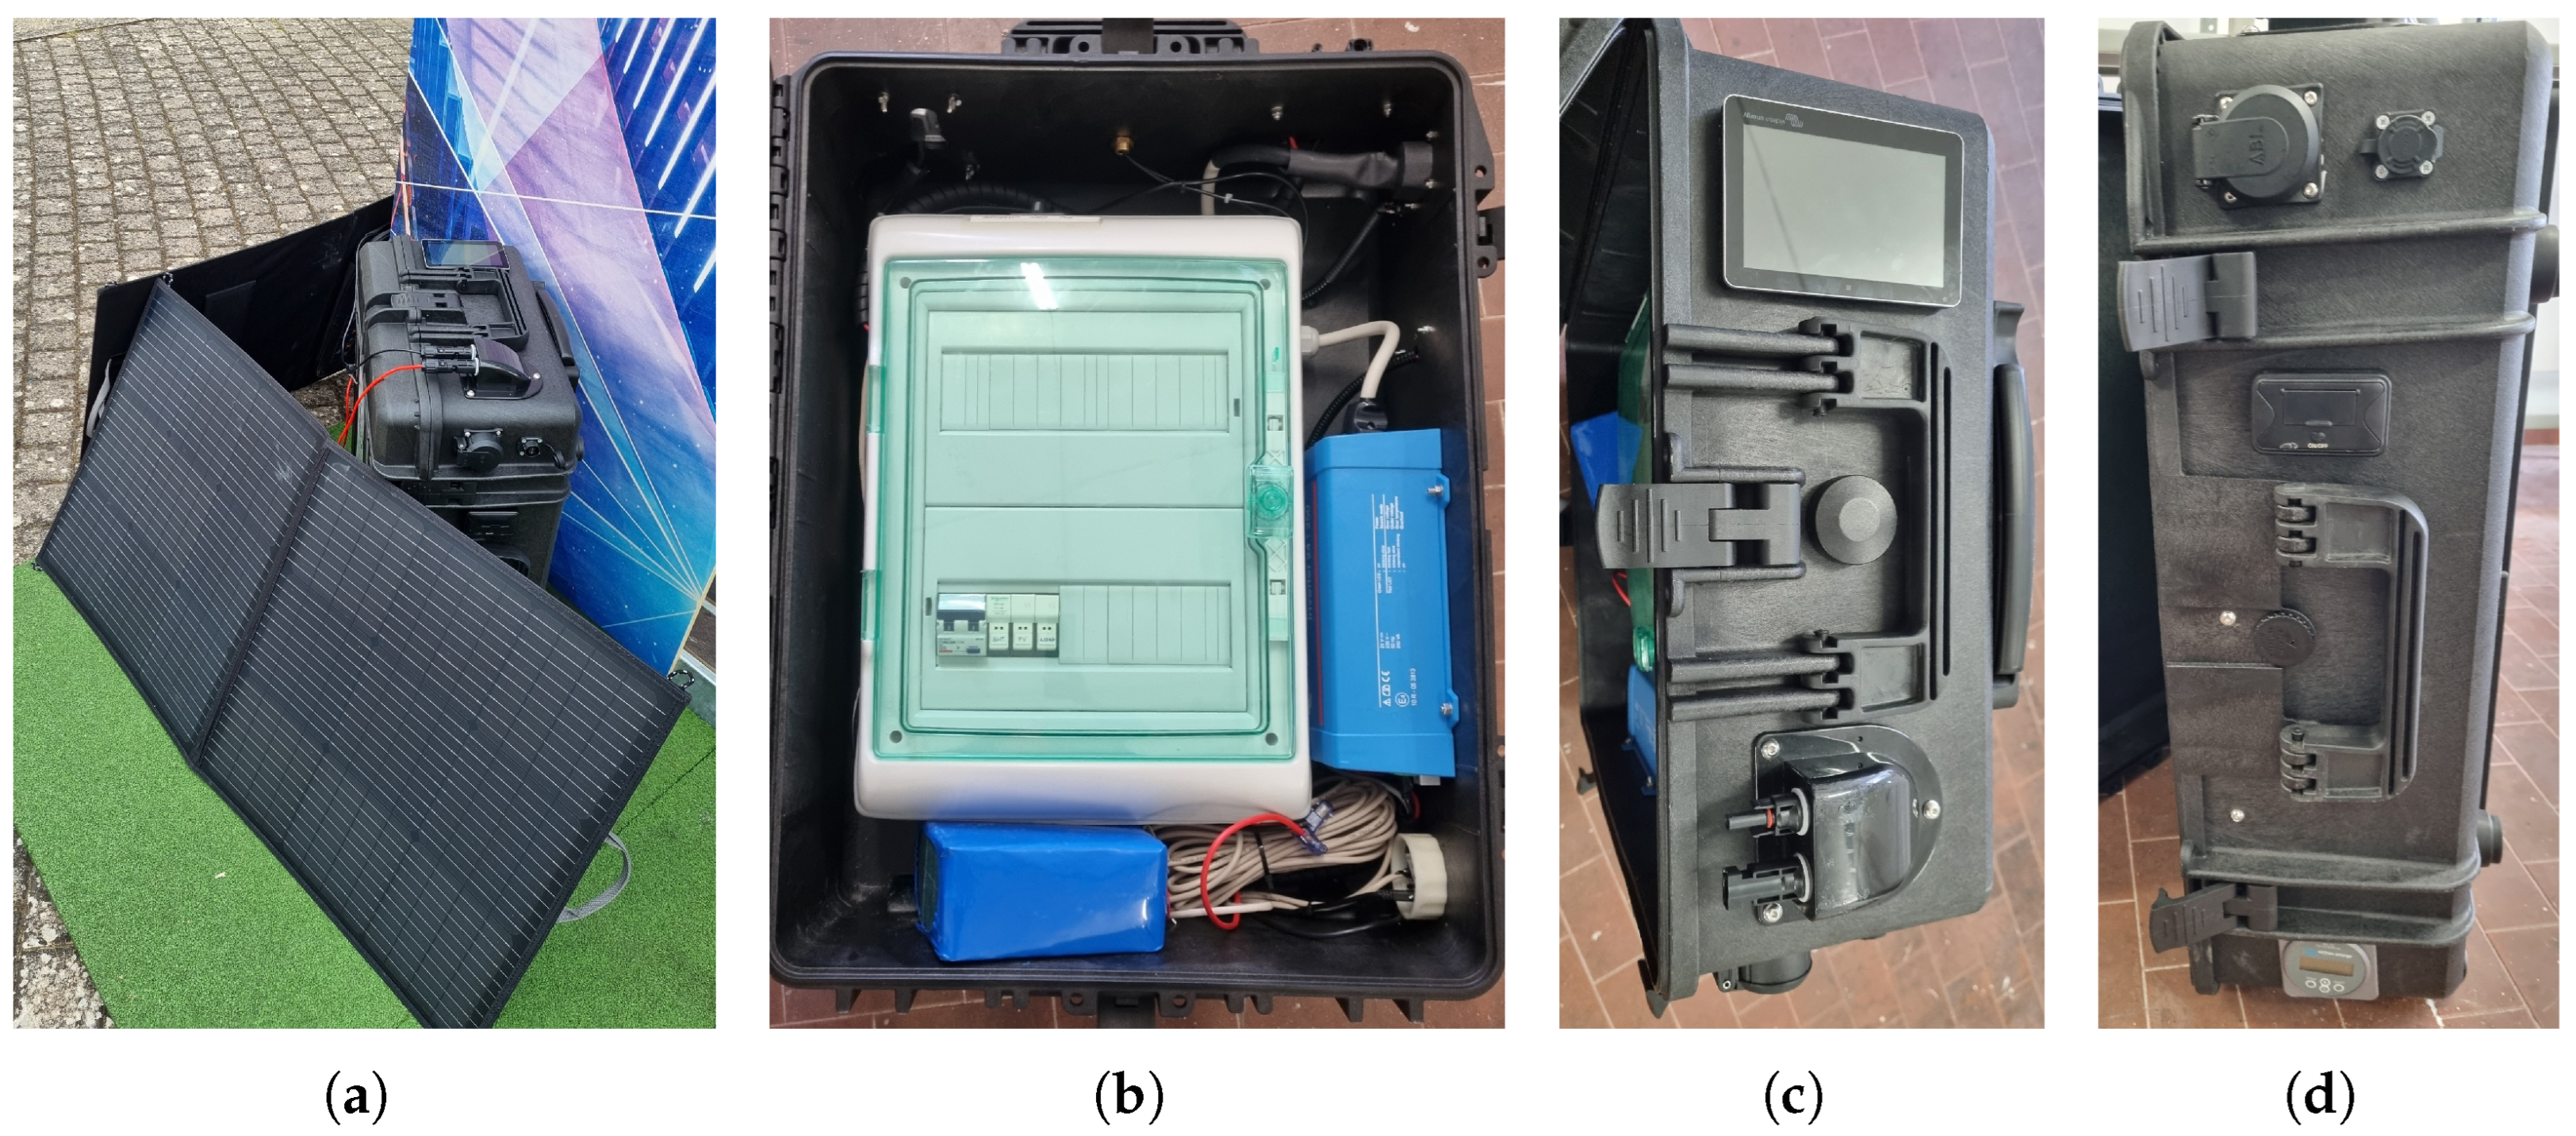
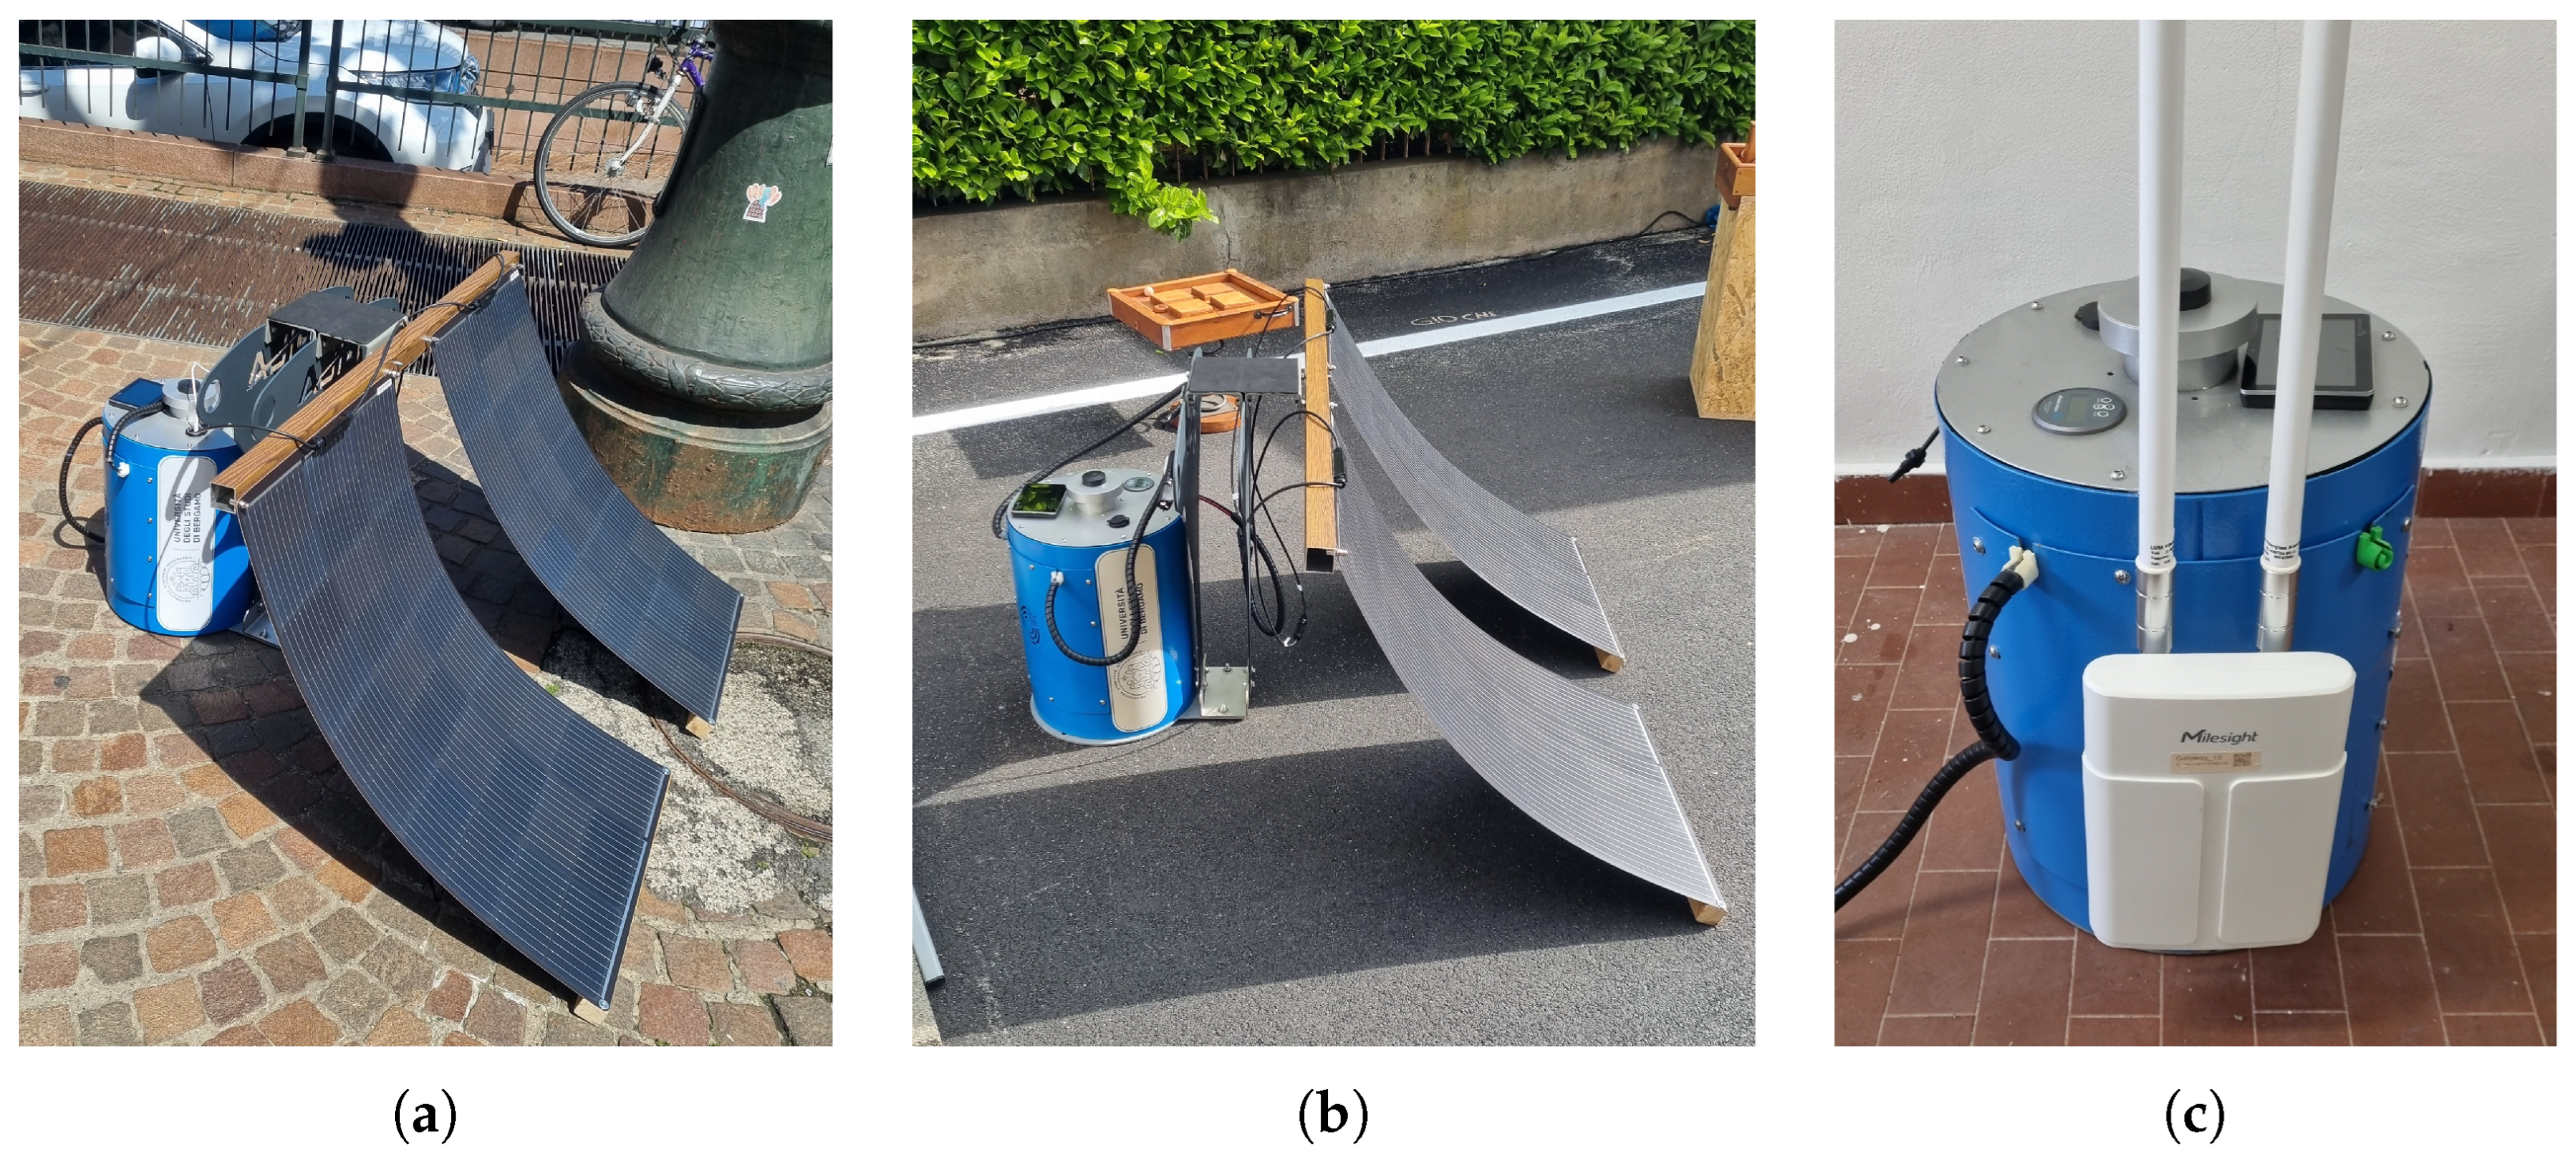
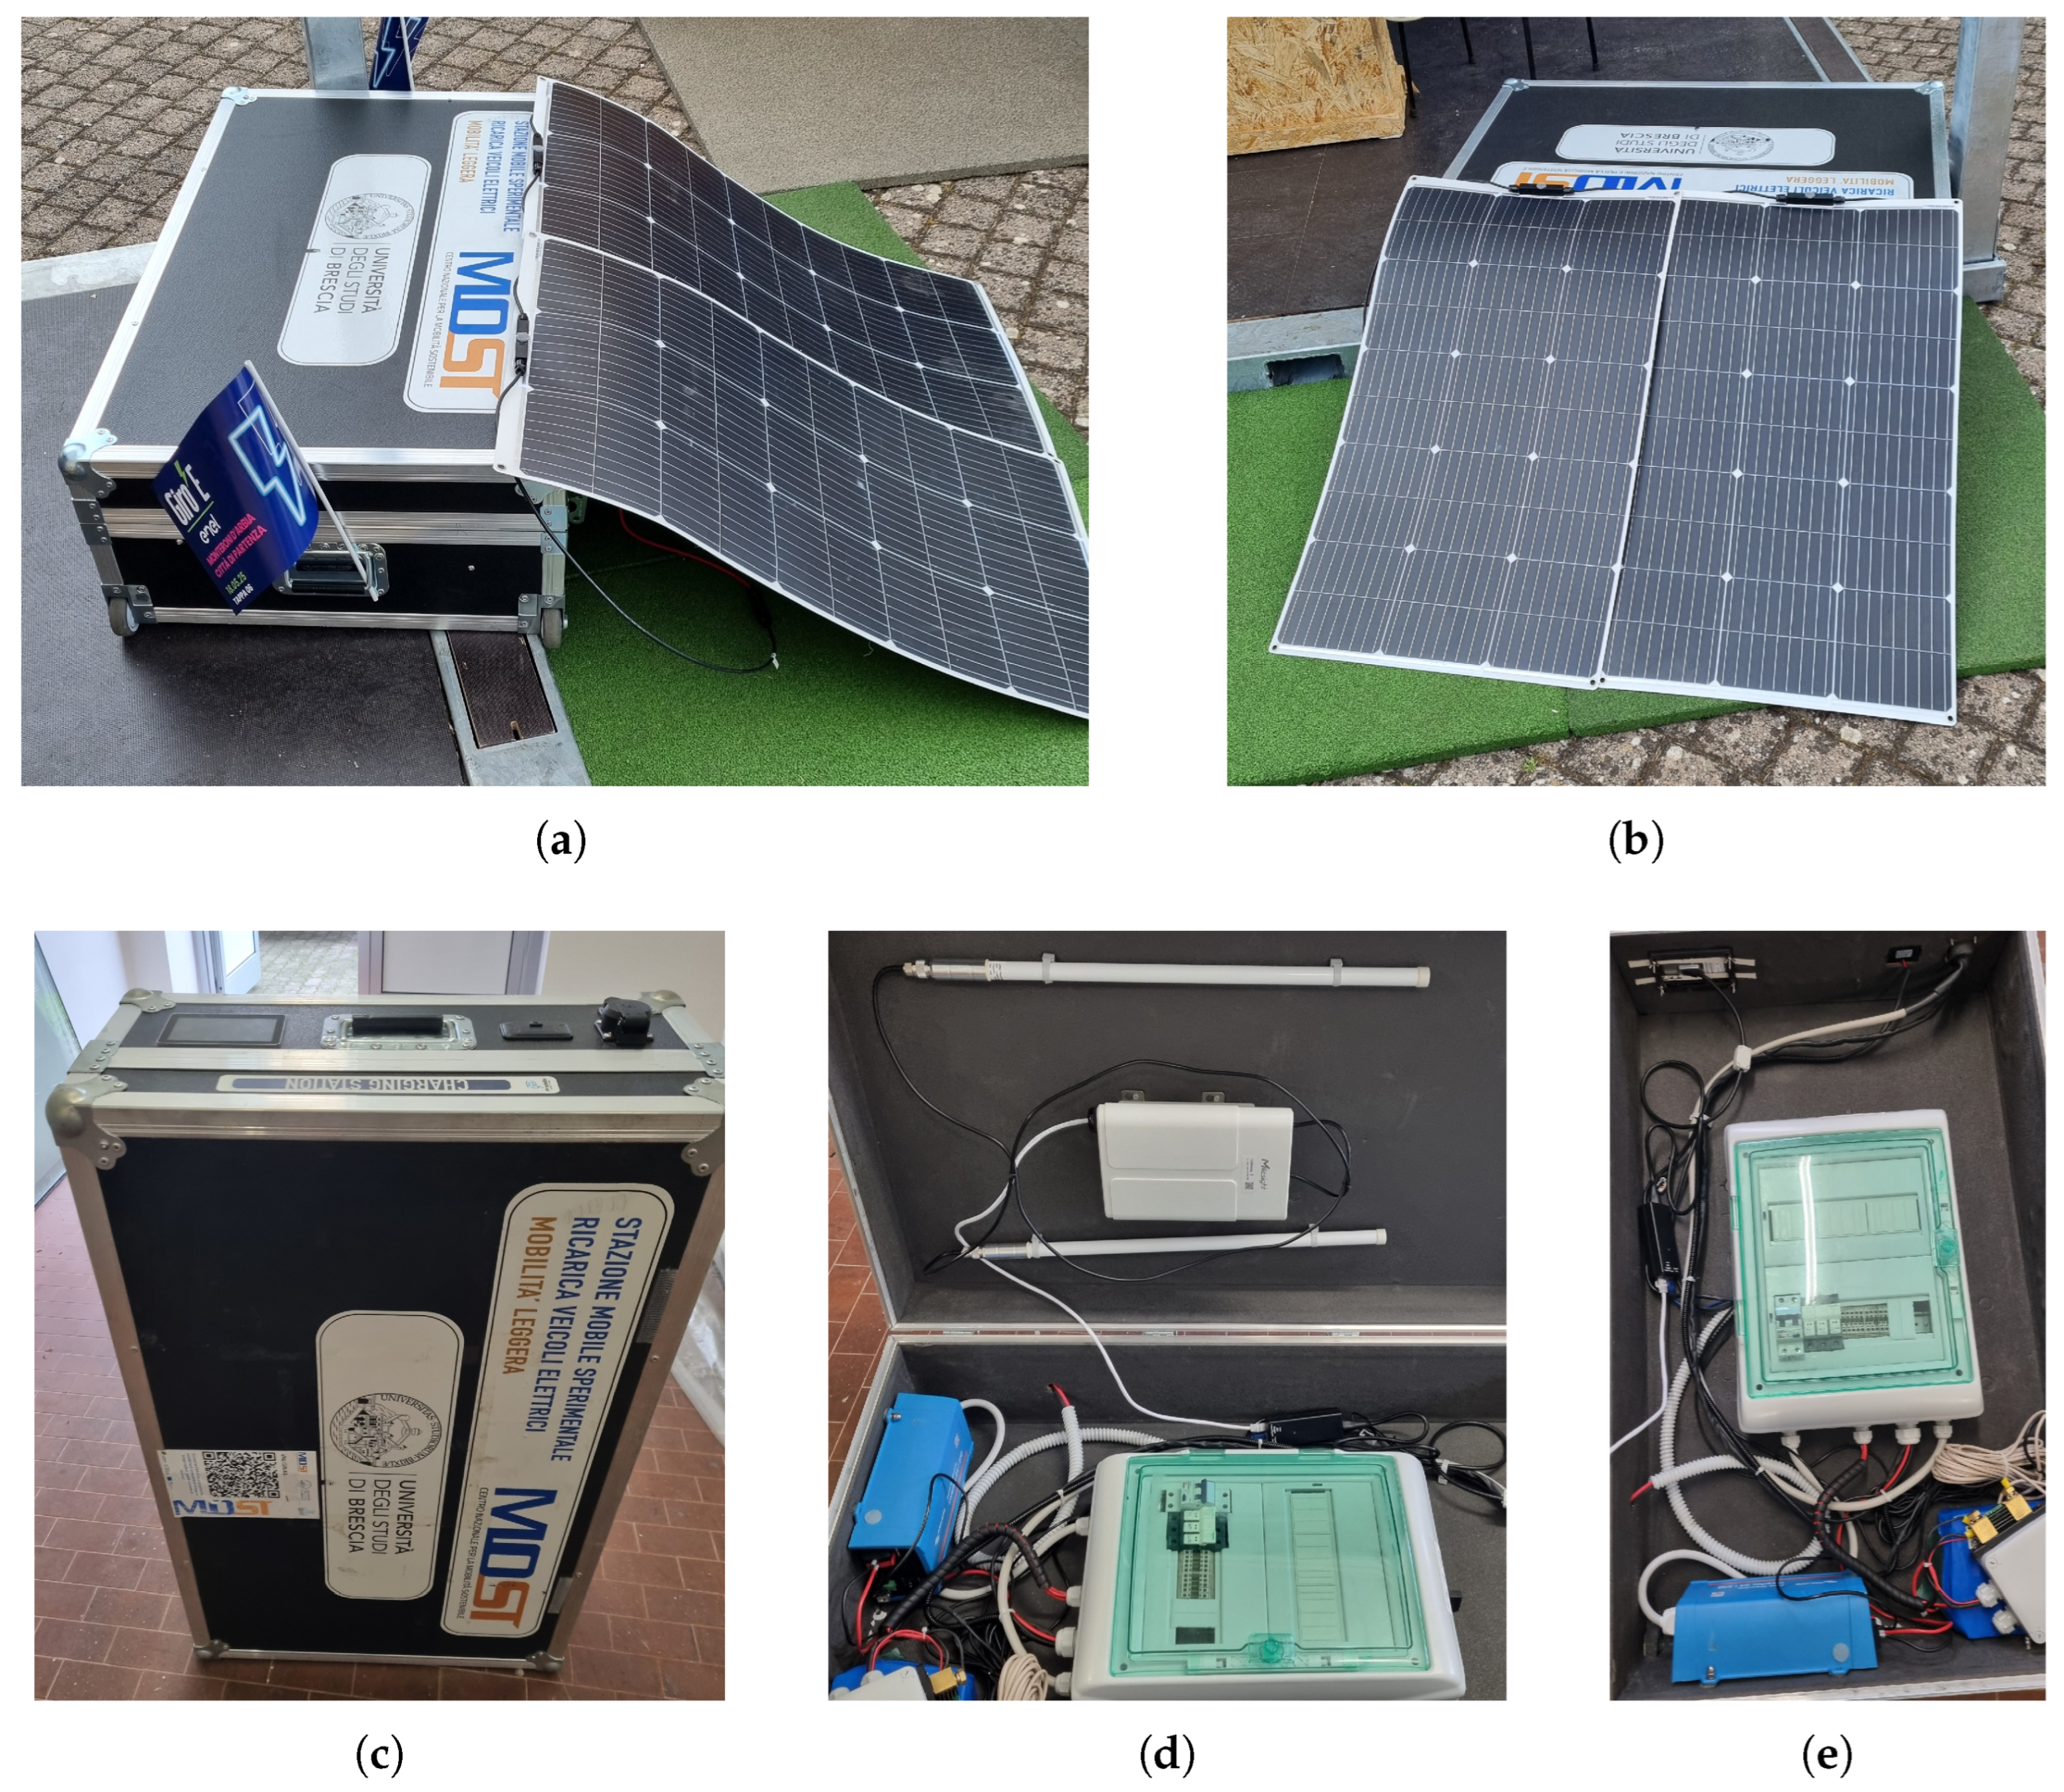
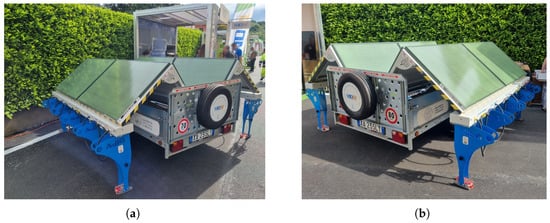
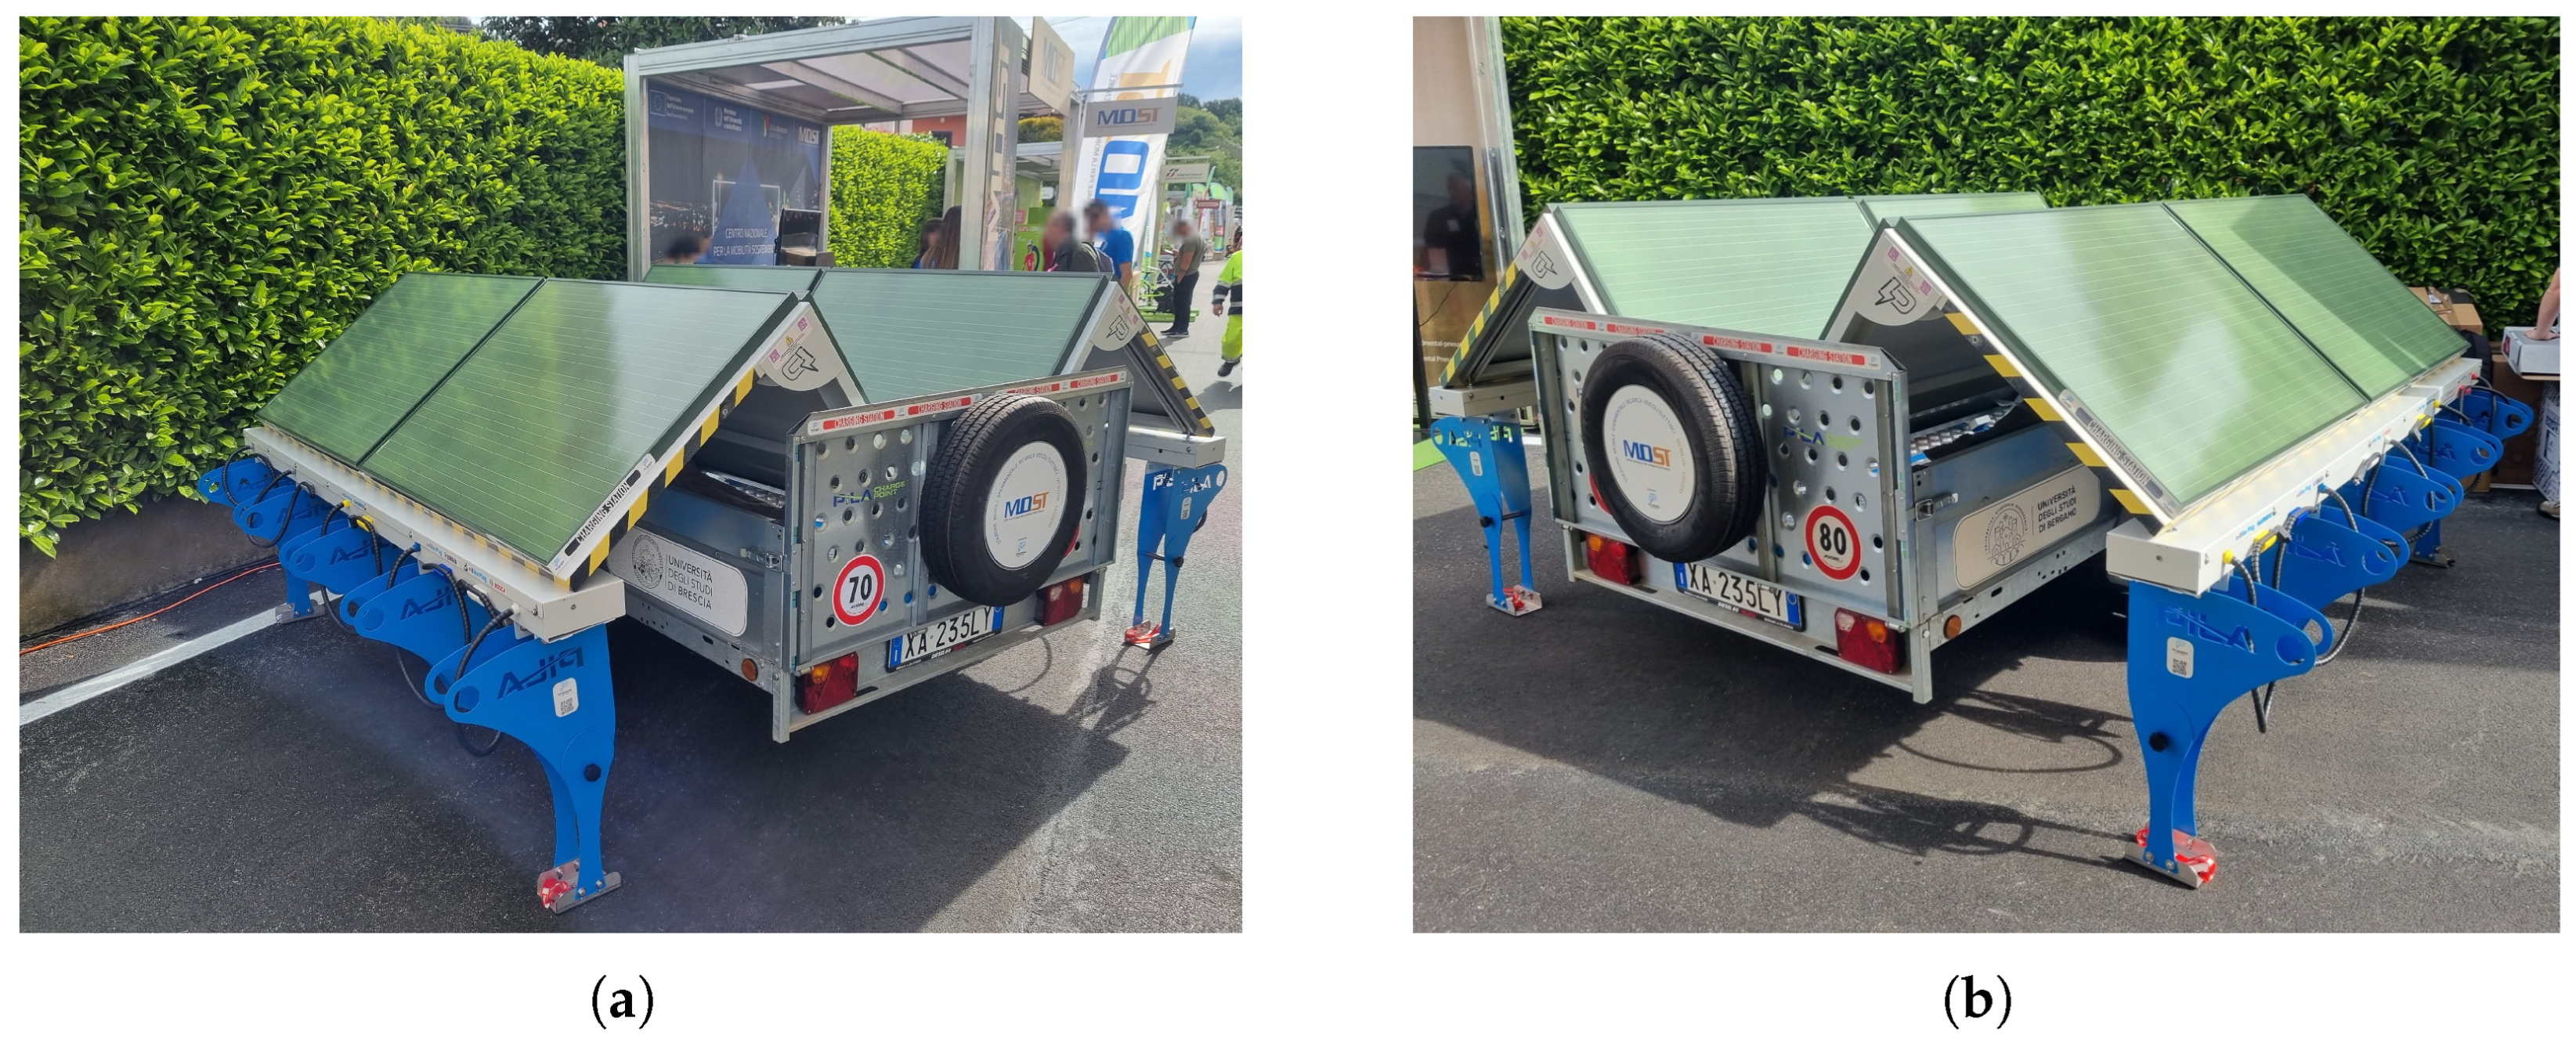
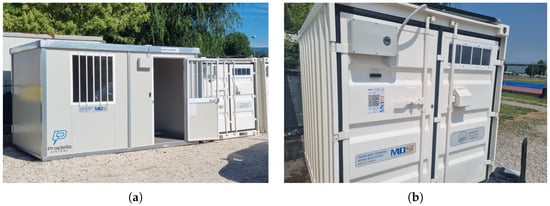
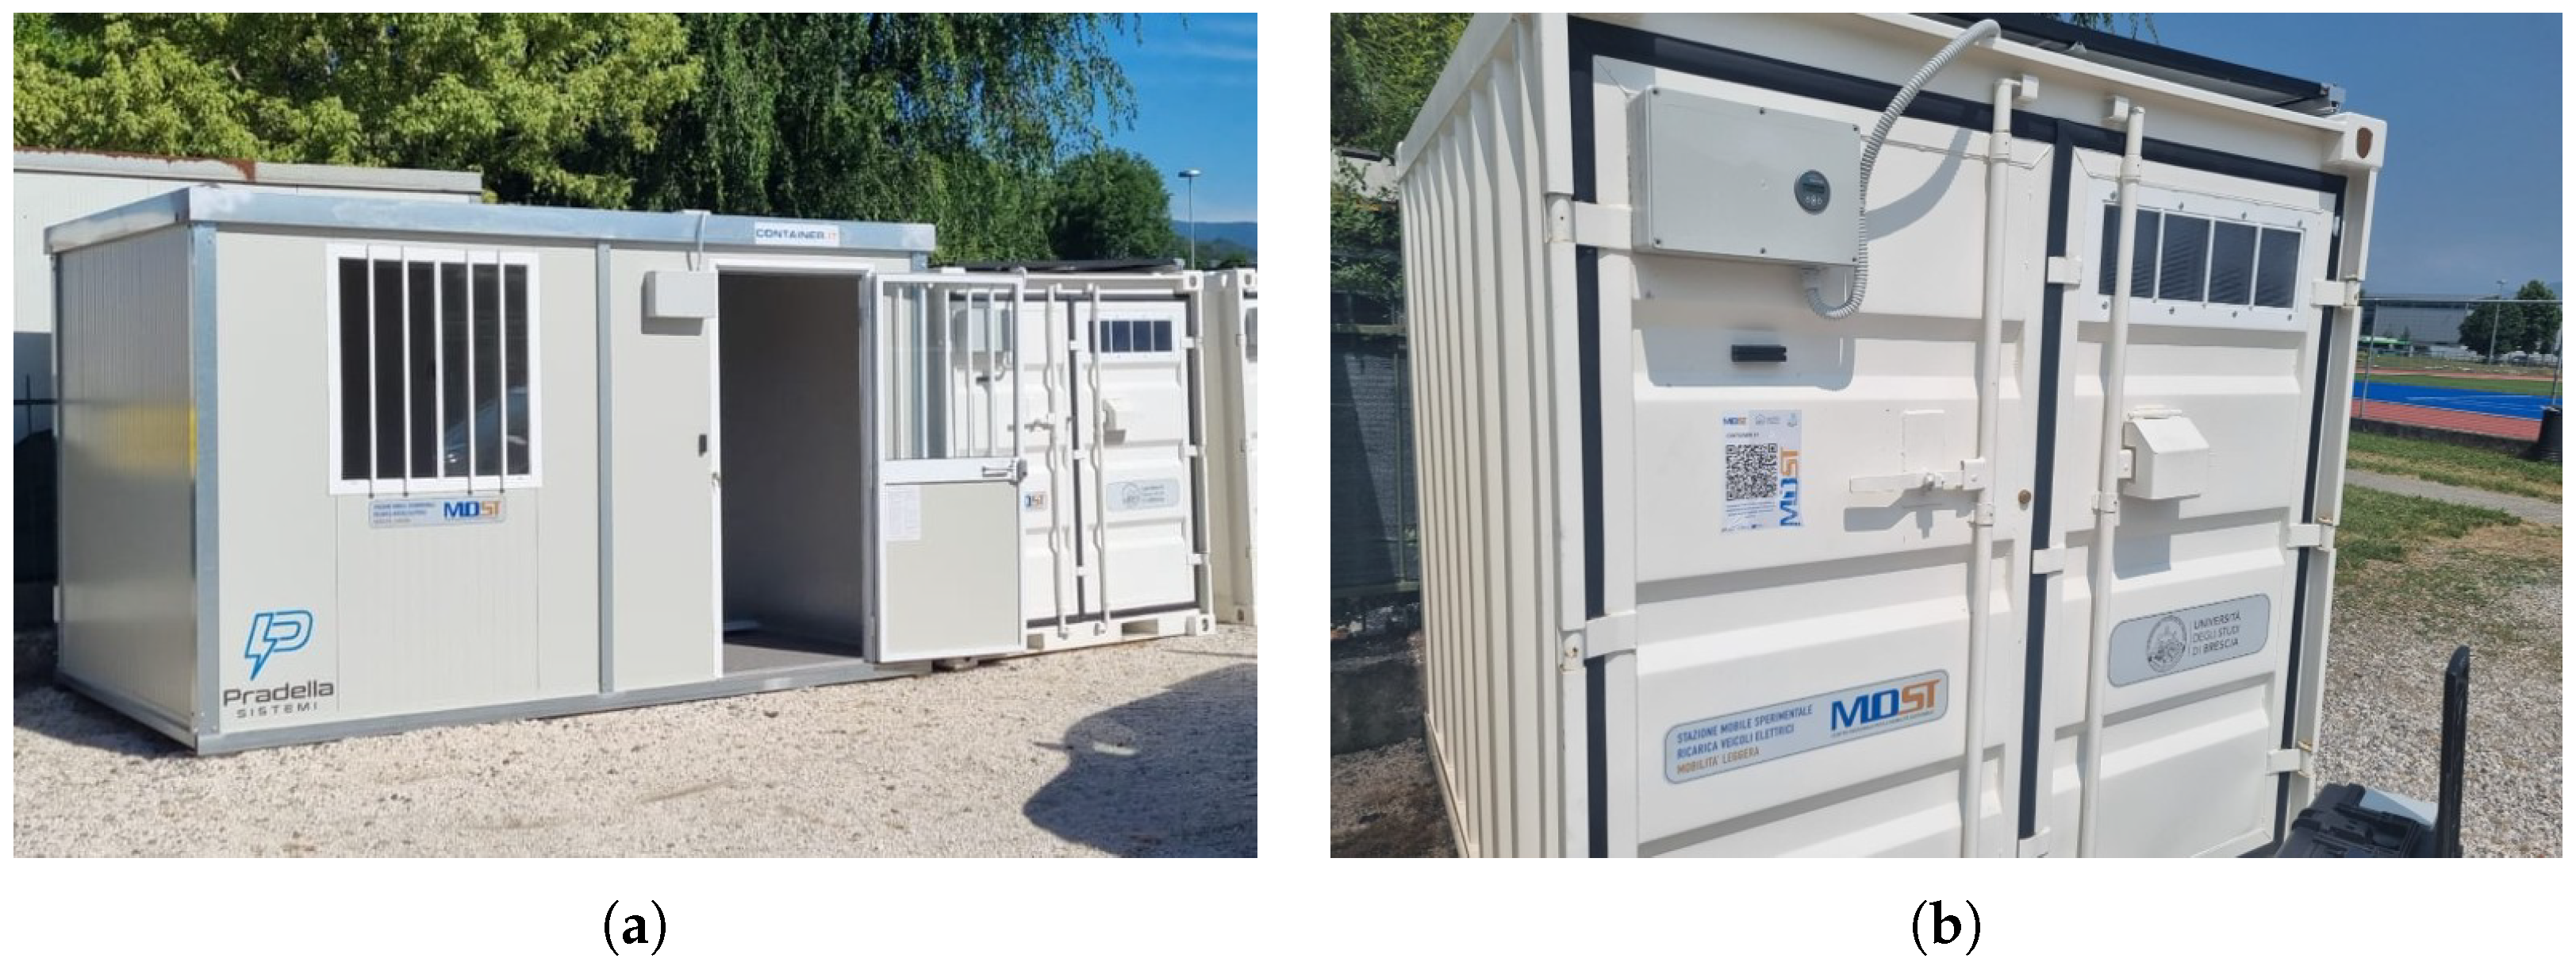
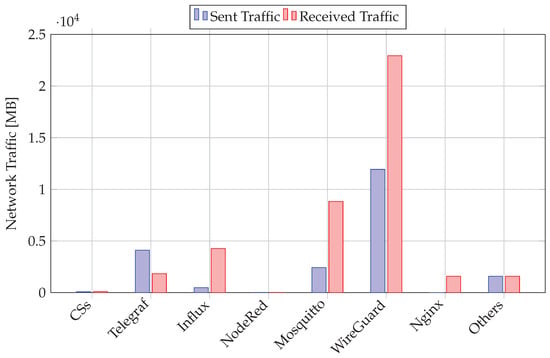
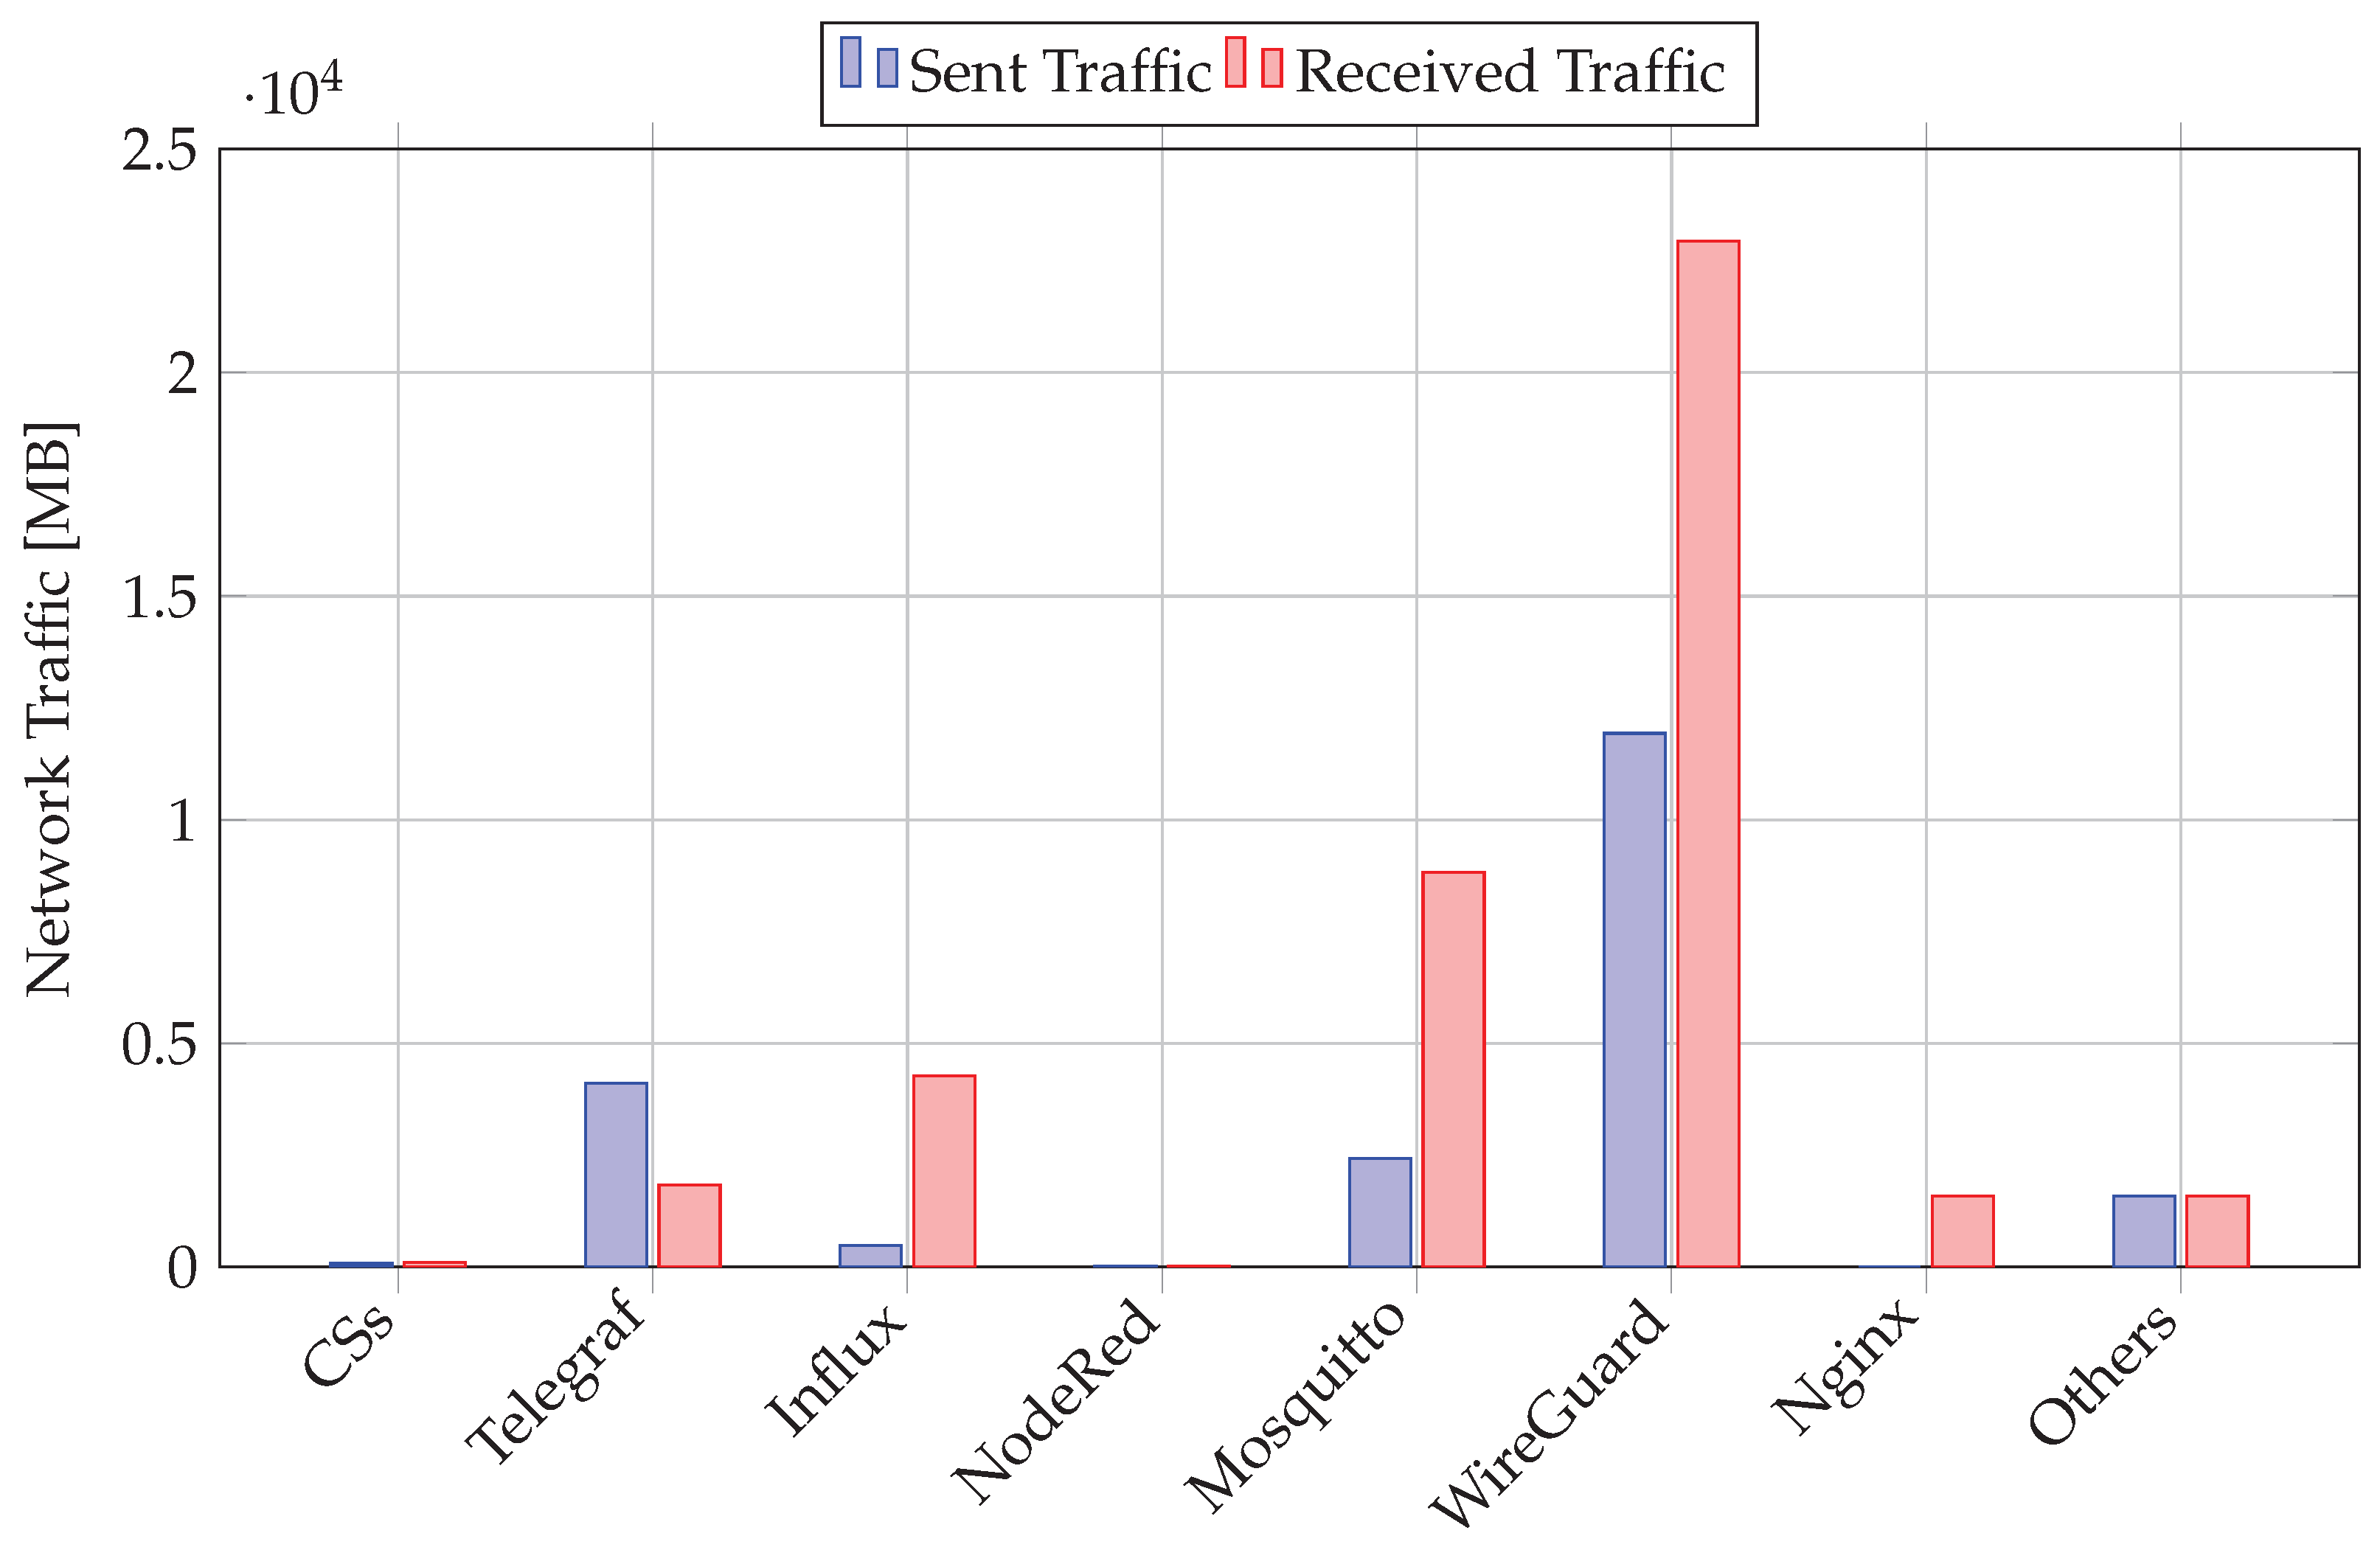
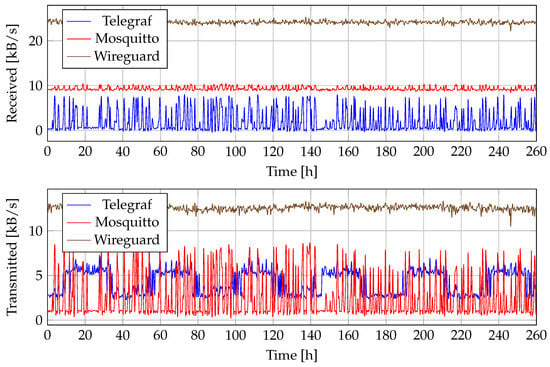
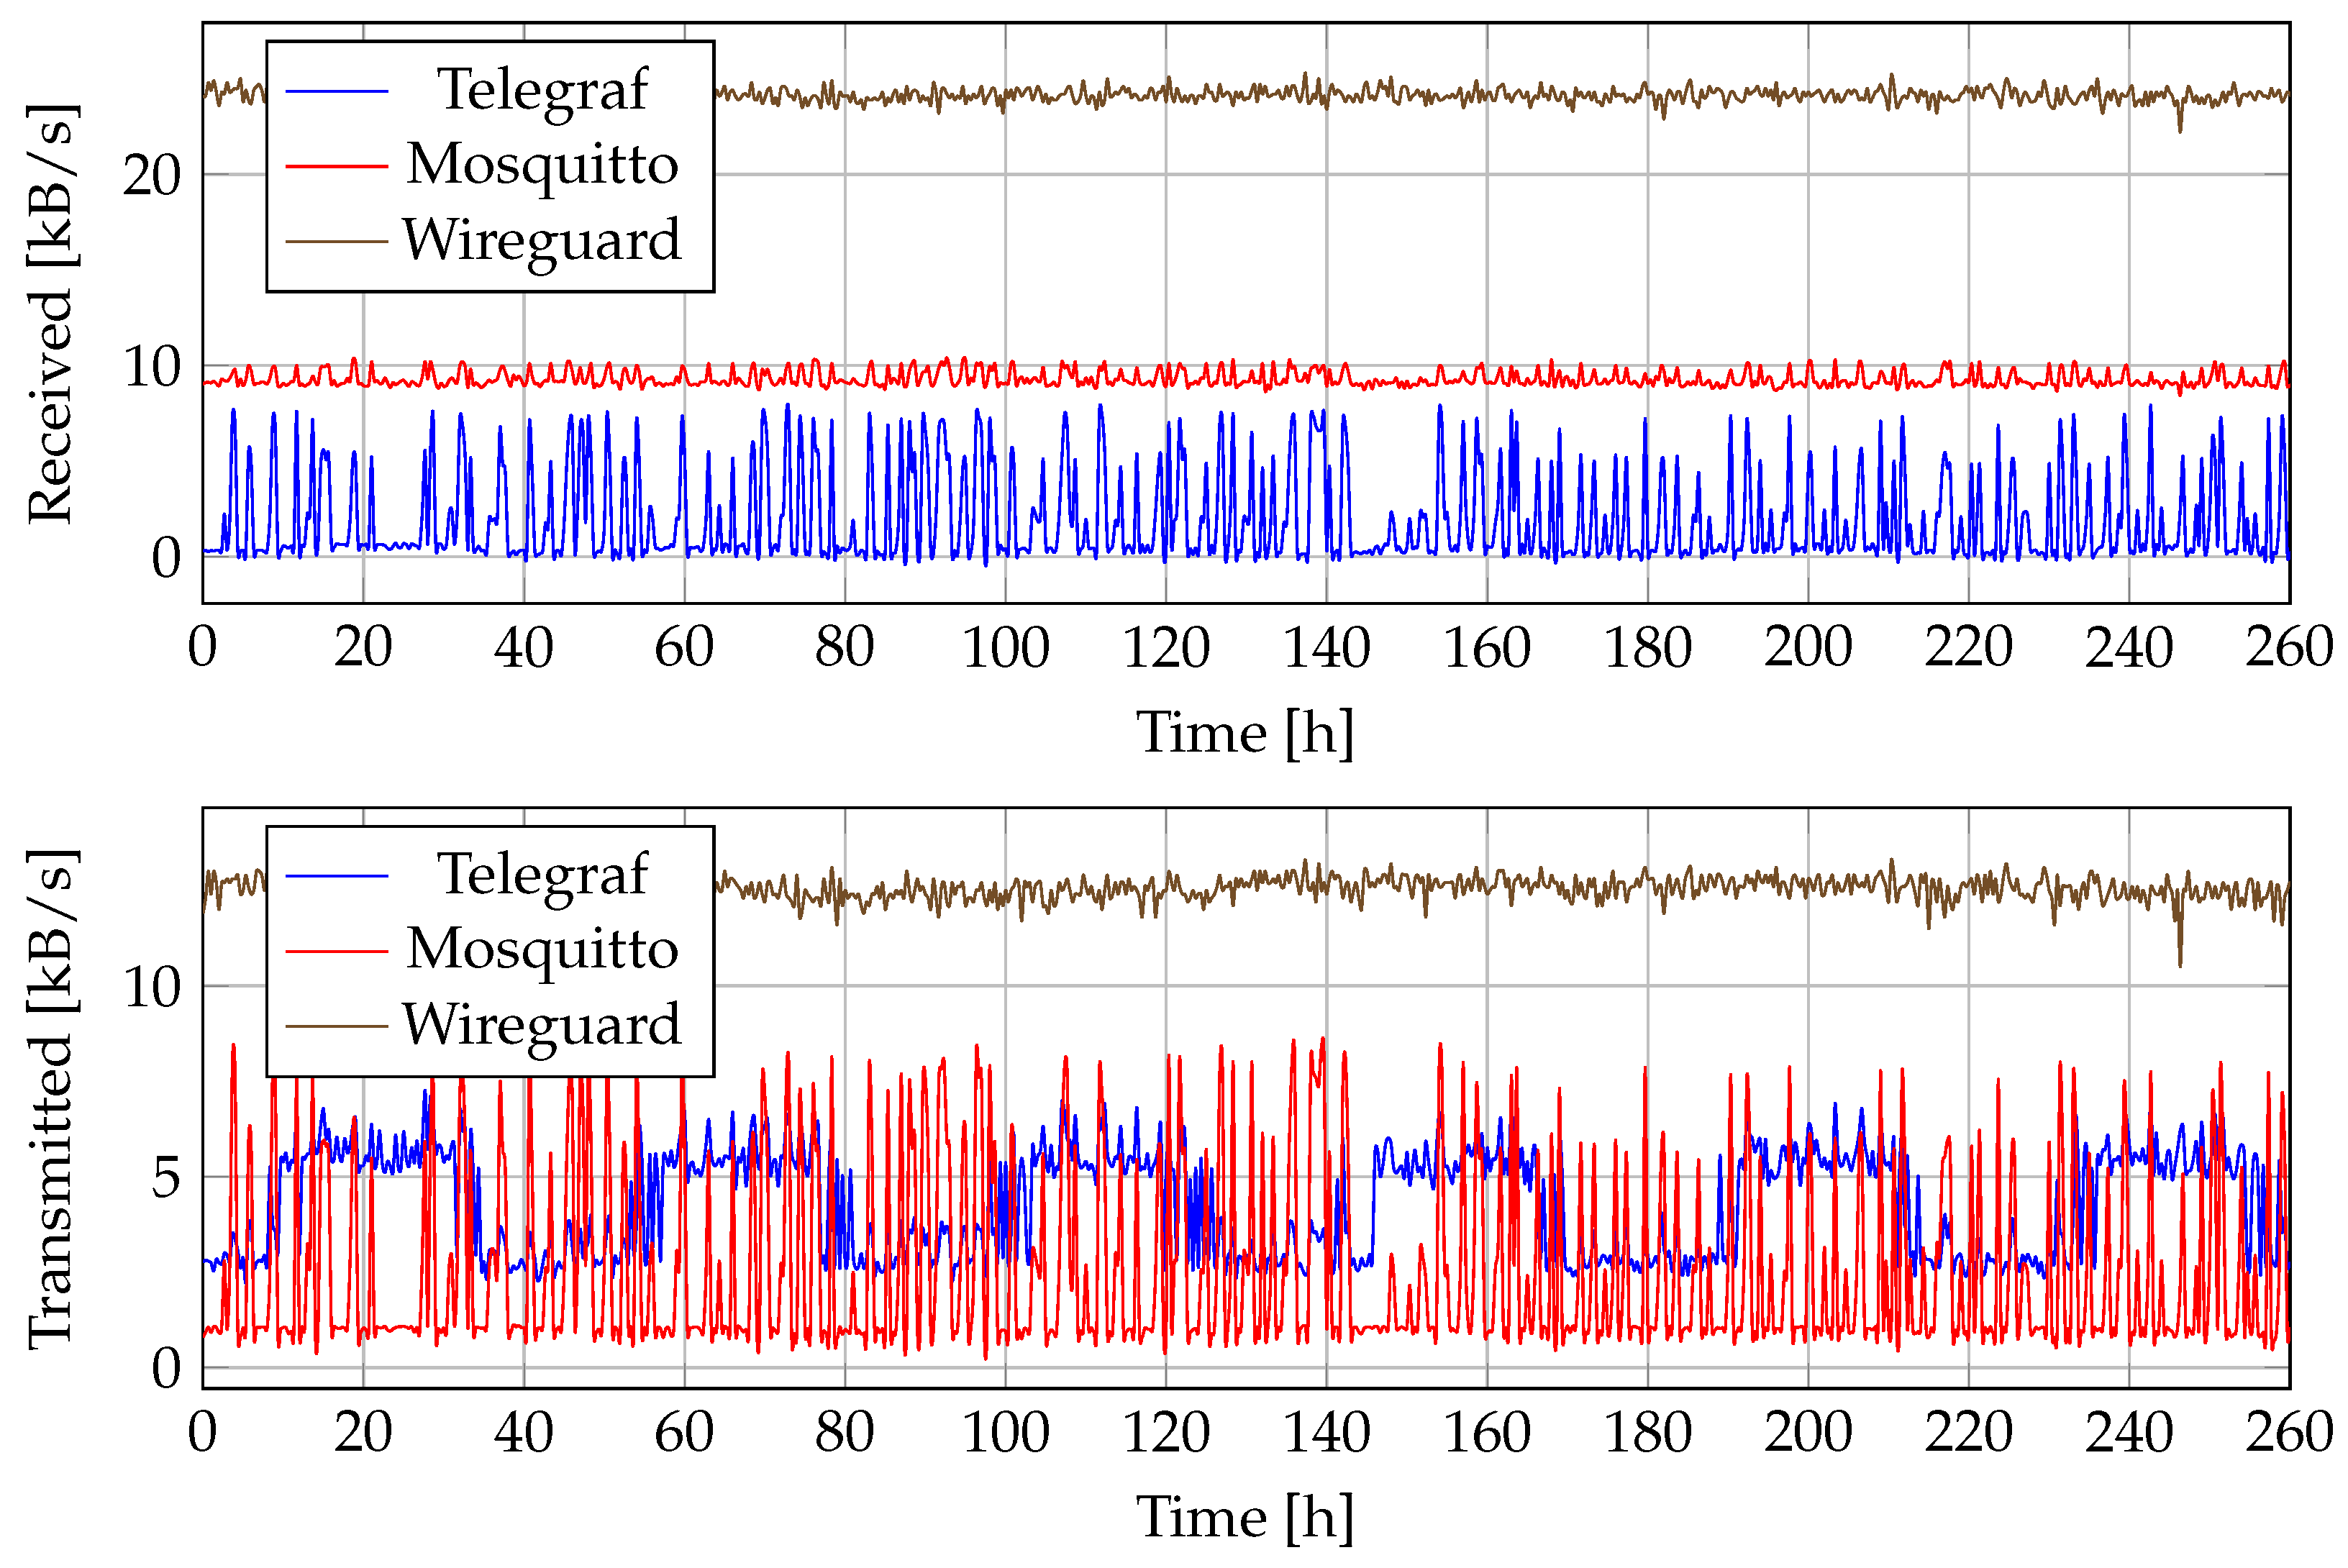
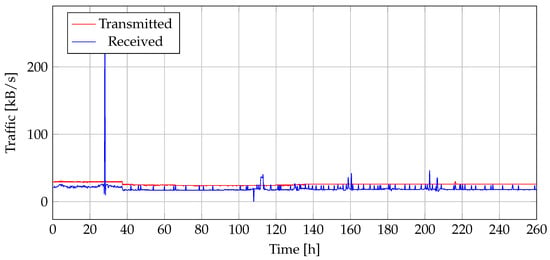
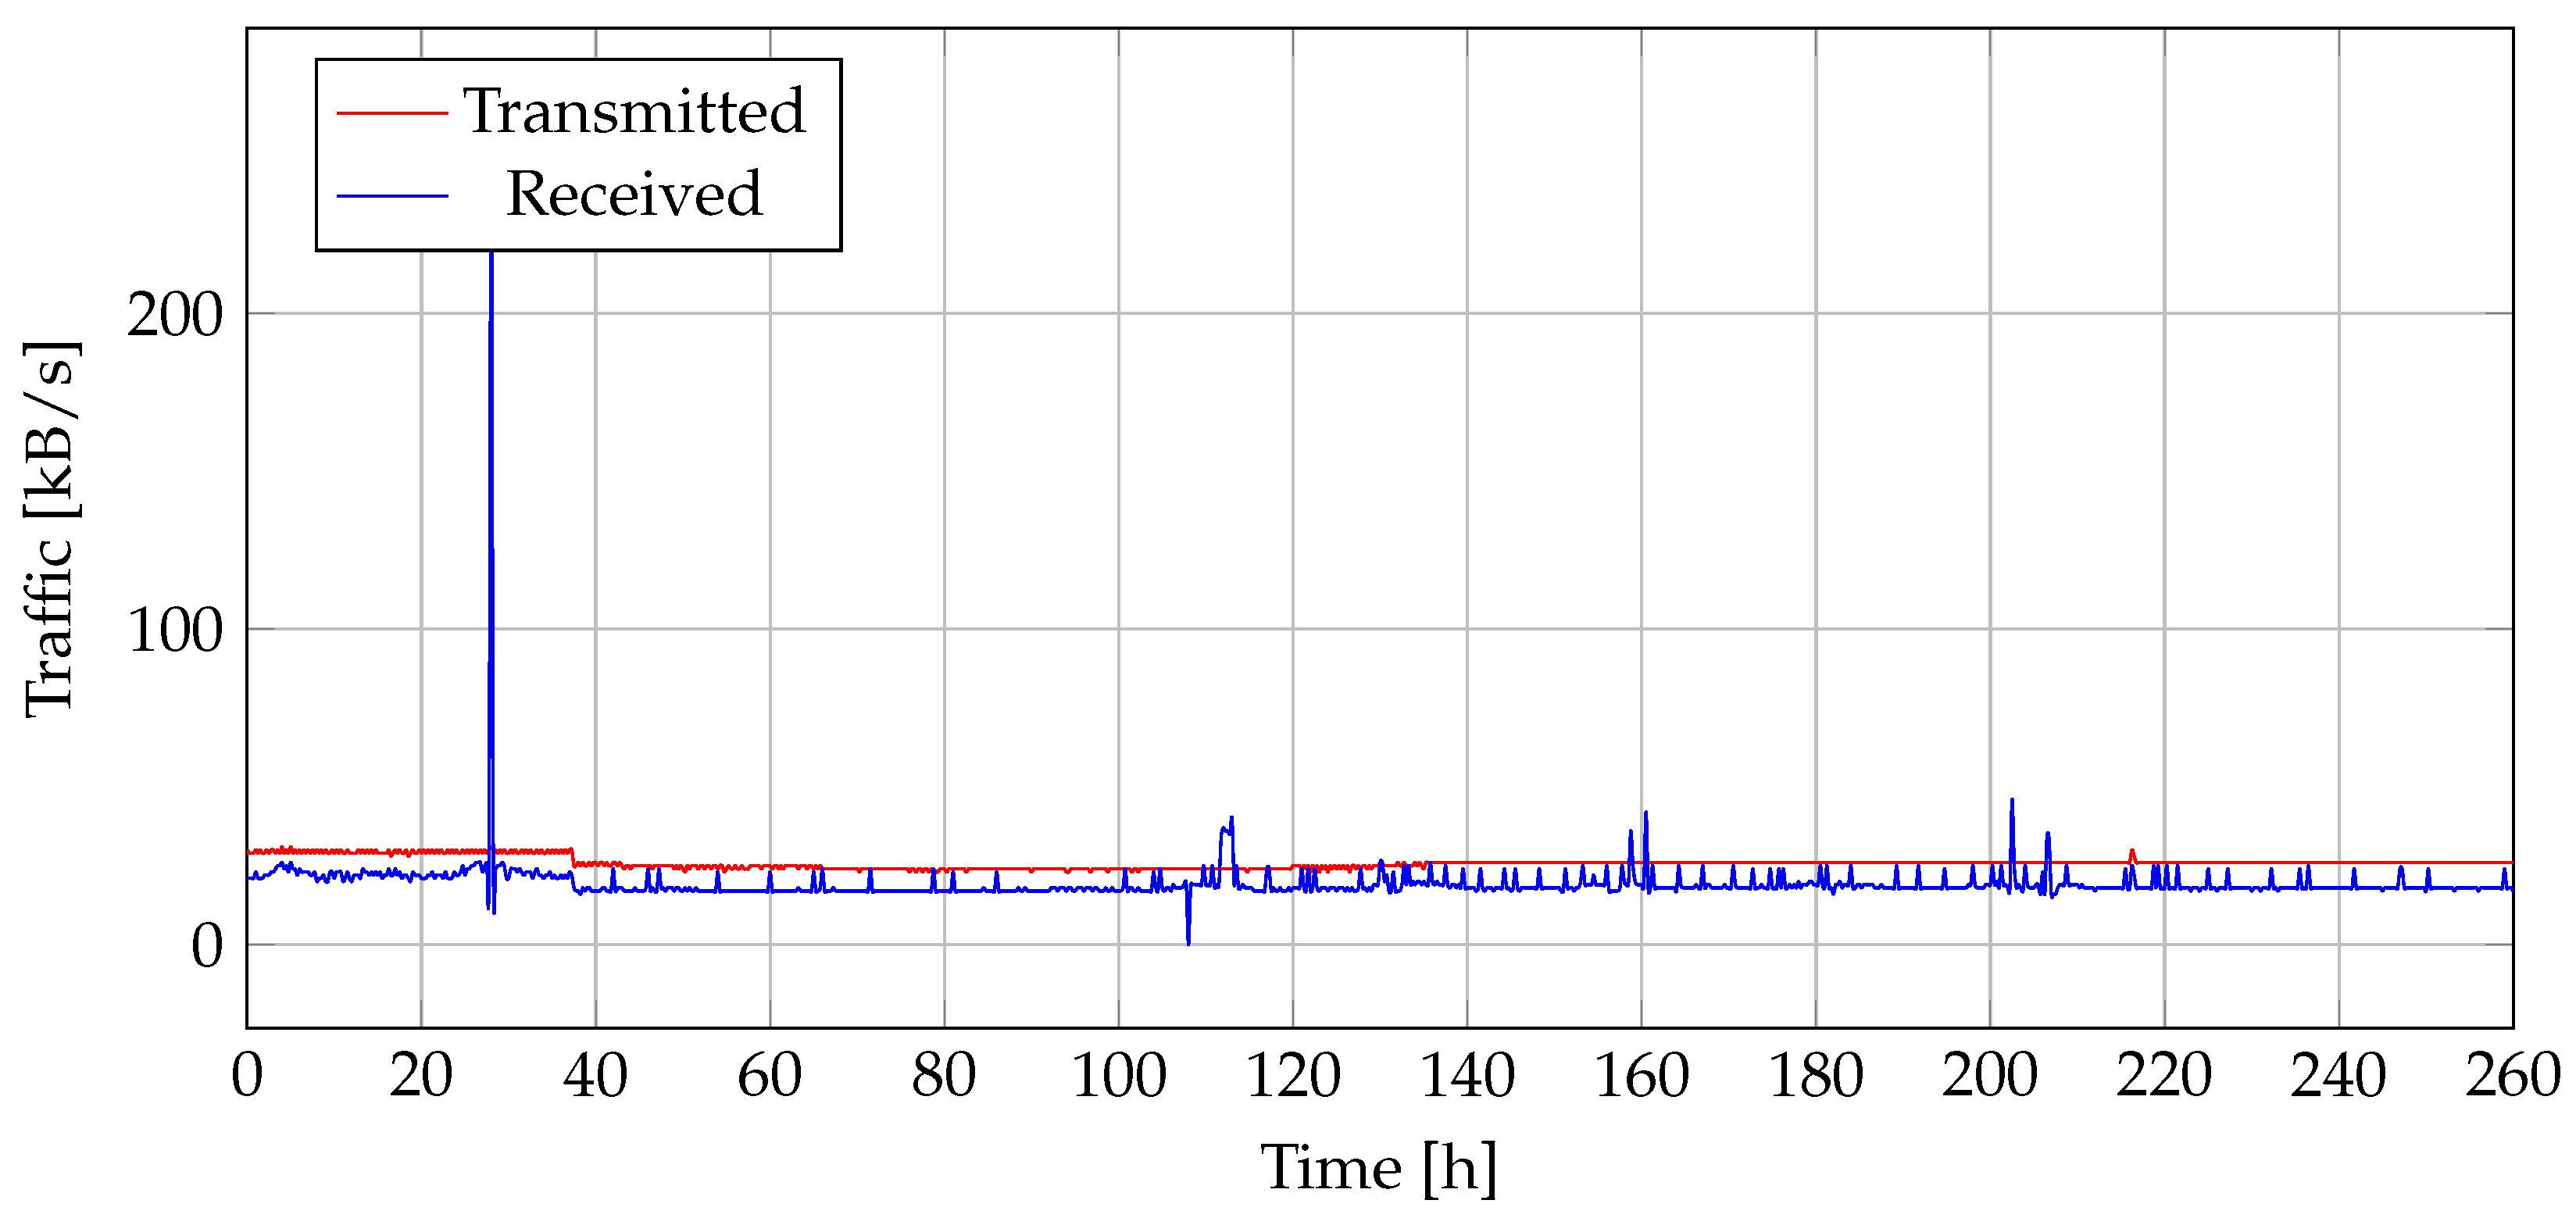

Disclaimer/Publisher’s Note: The statements, opinions and data contained in all publications are solely those of the individual author(s) and contributor(s) and not of MDPI and/or the editor(s). MDPI and/or the editor(s) disclaim responsibility for any injury to people or property resulting from any ideas, methods, instructions or products referred to in the content. |
© 2026 by the authors. Licensee MDPI, Basel, Switzerland. This article is an open access article distributed under the terms and conditions of the Creative Commons Attribution (CC BY) license.