


Abstract
We report the development of the first optical frequency comb (OFC) based on an in-house Ti:Sa femtosecond laser in Argentina, implemented at the National Metrology Institute (INTI). The system operates at a 1 GHz repetition rate with a broadband spectrum spanning from 500 to 1100 nm. The carrier-envelope offset frequency and the repetition rate are both phase-locked to a cesium atomic clock, establishing a direct link between the national frequency standard and the optical domain. This development represents a major step forward for national metrology and enables frequency-instability measurements of stable lasers within the country. To demonstrate its capabilities, the performance of a Nd:YAG Mephisto laser at 1064 nm was evaluated by measuring the beat note between its second harmonic and the OFC, allowing a direct assessment of its frequency noise and stability.
1. Introduction
Optical frequency combs (OFCs) have revolutionized time and frequency metrology since their development at the beginning of the century, establishing a phase-coherent link between the optical and radio-frequency domains with outstanding precision [1,2]. The OFC spectrum is composed of equally spaced and narrow spectral lines with frequencies fully determined by just two parameters: the repetition rate () and the carrier-envelope offset frequency (), following the comb equation [3]. Originally developed for the absolute measurement of optical frequencies, they are now used for applications including the realization of optical atomic clocks [4,5], high-resolution laser spectroscopy [6], precision ranging telemetry [7] and even the calibration of astronomical spectrographs for exoplanet searches [8]. In the area of time and frequency measurement, OFCs have become indispensable devices for the dissemination of time and frequency references over optical fiber networks [9,10], spectral purity transfer between optical wavelengths [11,12], the generation of ultra-stable microwave references [13], and the ultra-precise characterization of laser sources used in metrology and length calibration [14]. Beyond these already-established uses, OFCs find applications in fundamental physics, enabling tests of the fundamental constants and searches for dark matter through precision optical clock comparisons [15,16,17].
During the last two decades, there has been a tremendous evolution in the technology options available for OFC generation [18]. Solid-state lasers, particularly Ti:sapphire, were the first platforms on which self-referenced OFCs were demonstrated, taking advantage of their broad gain bandwidth and ultrashort pulse generation to produce spectra spanning from near-infrared to visible, with repetition rates reaching the GHz level [19]. Fiber-based combs emerged subsequently as low-cost, compact and robust alternatives, with erbium-doped fiber lasers centered around 1560 nm becoming the most widely developed platform, in part due to their compatibility with mature telecom infrastructure and components [20,21]. Ytterbium-doped fiber lasers, operating near 1040 nm, have also attracted significant interest for applications requiring spectral coverage extending into the visible range after nonlinear broadening. More recently, the state of the art microresonator-based frequency combs, or micro-combs [22,23], have opened an entirely new field by exploiting the Kerr nonlinearity at milliwatt power levels through resonant enhancement of light in whispering-gallery microresonators and integrated ring resonators, offering the prospect of fully chip-scale OFC systems compatible with the semiconductor industry [24].
In this context, Ti:sapphire-based OFCs occupy a privileged position for demanding metrological applications. Their broad gain bandwidth, low intrinsic noise, and high average output power make them particularly well suited for applications where stability and traceability to primary frequency standards are required [25]. The relatively high repetition rates achievable with Ti:Sa cavities, reaching 1 GHz and beyond, provide significantly more power per comb tooth than systems with lower repetition rates, an advantage for beat-note detection. Although Ti:Sa combs are bulkier than fiber-based alternatives, their remarkably low intrinsic noise makes them highly useful for noise characterizations of laser oscillators. Furthermore, the spectral coverage of the visible and near-infrared ranges by the Ti:Sa comb makes it an ideal tool for the calibration of laser sources commonly employed in length metrology, such as stabilized helium–neon lasers and iodine-stabilized sources operating in the red and green spectral regions.
In this paper, we present the design of an in-house solid-state comb based on a Ti:Sa femtosecond laser. With this development at Argentina’s National Metrology Institute (INTI), Argentina joins the ranks of Latin American countries with this type of facility [26,27]. The system has a repetition rate of 1 GHz and an octave spanning that covers a broad spectrum from 500 nm up to 1100 nm. By simultaneously locking and to a cesium clock reference, continuous running time up of several hours was demonstrated. The paper is organized as follows: Section 2 describes the optical setup of the optical frequency comb. Section 3 describes the phase locking systems and the actuators used for the comb self-referencing. Section 4 evaluates the performance achieved in the comb stabilization and the application of the comb to calibrate a laser.
2. Optical Comb Design
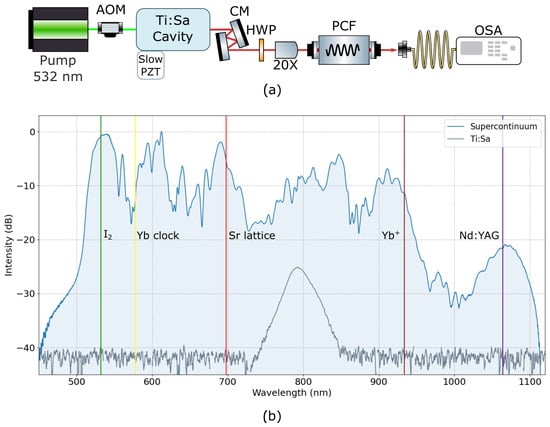
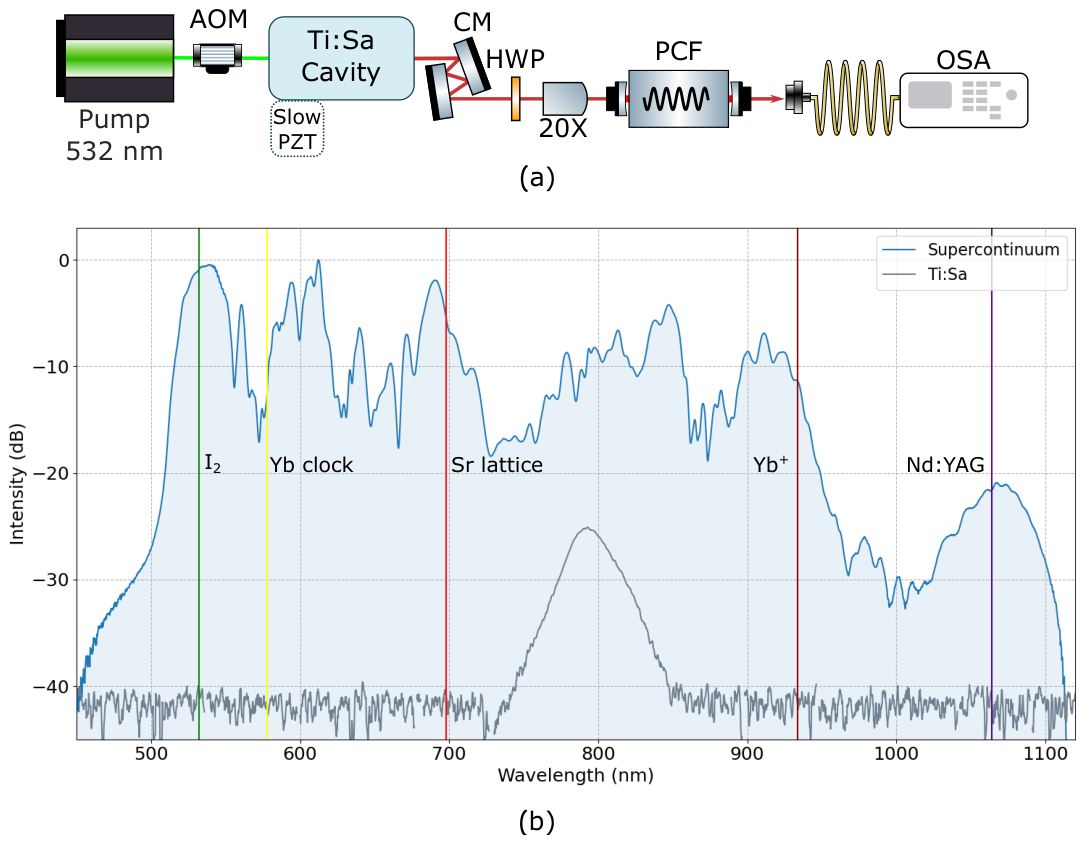
A schematic view of the Ti:Sa optical frequency comb is shown in Figure 1a. At the heart of the system lies a Kerr-lens mode-locked Ti:Sa laser, which generates the femtosecond pulses. The laser is pumped by a Verdi V6 (Coherent) continuous-wave laser at 532 nm with up to 6 W of output power, operated at 5.5 W during normal conditions with a 2.25 mm beam diameter. The Ti:Sa oscillator is based on a commercial prismless bow-tie cavity configuration with a total length of 30 cm from Gigaoptics, which directly sets the repetition rate to ≈ 1 GHz. The beam diameter is 2.2 mm, and the laser operates at the fundamental mode TEM00. The output spectrum is centered at 800 nm with a full width at half maximum of 11.6 THz, supporting transform-limited pulses of less than 30 fs duration. The total number of comb modes within the emission bandwidth is approximately 37,000, each separated by the . At the nominal pump power, the average output power is 900 mW. Inside the cavity is placed a Ti:Sa crystal with dimensions of 1.8 mm × 1.8 mm × 5 mm. Two concave mirrors and three flat mirrors conform to the cavity; all of them have a negative dispersive coating that transmits light at 532 nm and reflects light between 700 nm and 900 nm with a coefficient R > 99.9%.
Figure 1.
(a) General schematic of the optical setup of the optical frequency comb. The core of the system is a Kerr-lens mode-locked Ti:Sa oscillator pumped at 532 nm, with a 1 GHz repetition rate and pulses of 30 fs. To extend the spectrum to an octave span, the output is pre-compensated with a pair of chirped mirrors and focused into a photonic crystal fiber (PCF) through a 20X microscope objective. (b) shows the optical spectra before and after supercontinuum generation, spanning from 500 nm to 1100 nm and covering a full octave, recorded with an optical spectrum analyzer (OSA) at a resolution of 0.05 nm. Together with the supercontinuum, several clock transitions in the optical domain and the Nd:YAG laser emission line are indicated for reference.
The output of the femtosecond laser is coupled into a photonic crystal fiber (PCF, PSS 2620 MenloSystems) to extend the spectrum of the OFC to more than one octave span. To determine the best coupling conditions for conversion efficiency and spectral broadening, three microscope objectives (10X,20X, and 40X) were tested; the 20X objective, mounted on a three-axis translation stage for fine spatial alignment between the beam and the fiber core, gave the best coupling performance. Furthermore, the wavelength dispersion introduced by the objective is pre-compensated with two chirped mirrors (CMs) placed before the objective, preserving the peak power needed to efficiently drive the fiber nonlinearities. We also studied the optimum number of reflections between the pair of CMs. Eight reflections, combined with the 900 mW PCF input power reported above, gave the best compromise between total output power and the power available at the wavelengths used for the f-2f interferometer. The system exhibits low power degradation in the SC after several hours of operation and is realigned manually on a daily basis to maintain performance.
Figure 1b shows the optical spectra of the Ti:Sa emission and the supercontinuum (SC). The spectral extent is evaluated at the −30 dB level, per the standard convention in the field, and spans from 500 nm to 1100 nm, confirming full octave coverage with an output power of 450 mW, corresponding to a generation efficiency of nearly 50%. Furthermore, overlaid in the figure are the wavelengths of several relevant optical clock transitions, namely, the I2 line at 532 nm, the Yb clock, the Sr lattice, the Yb+ transition, and the Nd:YAG line at 1064 nm. The SC exhibits a broadly distributed spectral power density across all these regions, making the system suitable in principle for direct beat-note measurements at each reference wavelength without additional spectral enhancement. The measured power spectral density is 4 mW/nm at 532 nm, 0.8 mW/nm at the Yb clock transition, 1.42 mW/nm at the Sr lattice wavelength, 0.5 mW/nm at the Yb+ transition, and 0.05 mW/nm at 1064 nm.
3. Comb Stabilization: Referencing and
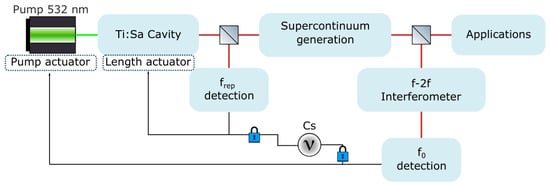
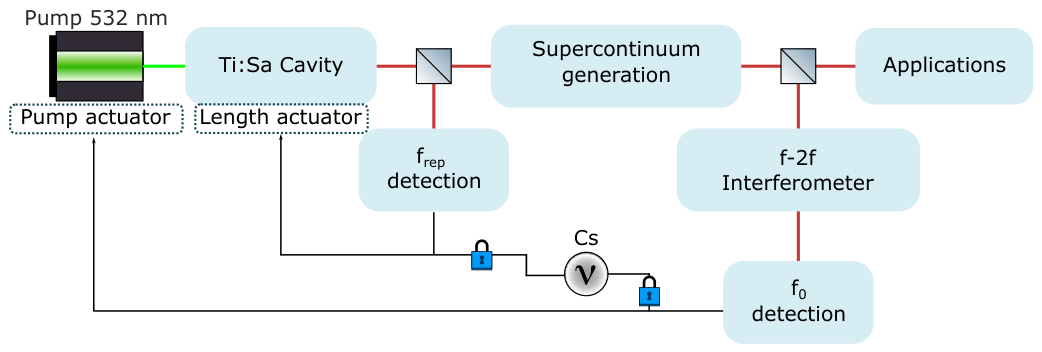
The OFC is fully self-referenced by phase-locking its two free parameters, and , to a stable RF reference. Figure 2 shows a block diagram of the complete stabilization scheme. A small fraction of the Ti:Sa output is used to detect , which is then locked to the reference by acting on the cavity length through a piezoelectric transducer (PZT) mounted inside the Ti:Sa cavity. The remaining radiation is directed to the supercontinuum generation stage, after which the broadened spectrum feeds an f-2f interferometer where the is detected and stabilized by controlling the pump intensity via an acousto-optic modulator (AOM) placed before the Ti:Sa cavity. Both and are referenced to a Microsemi 5071A cesium atomic clock, which serves as the national time reference of Argentina and provides traceability to the SI second. In addition, it can be seen that the stabilized comb output is then available for metrological applications, including the absolute frequency characterization of laser sources. The following subsections describe in detail the phase-locked loops (PLLs) developed for the independent stabilization of and .
Figure 2.
Block diagram of the optical frequency reference system. A small fraction of the Ti:Sa laser output is used to detect the repetition rate and stabilize it by controlling the cavity length. The remaining power is sent to a supercontinuum generation stage, followed by an f-to-2f interferometer for carrier-envelope offset frequency () detection and stabilization. The referenced light is used for metrological applications.
3.1. Stabilization of
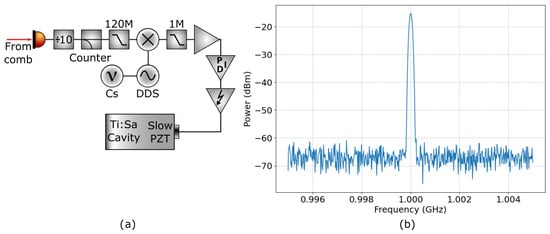
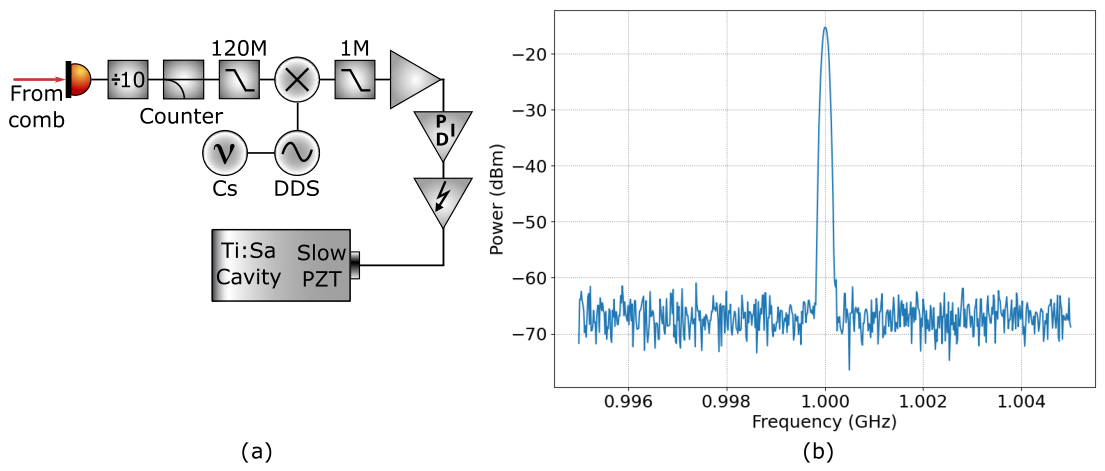
Figure 3a shows the phase-locked loop developed for the stabilization of the repetition rate. The signal is detected through a small fraction of the Ti:Sa light with a fast avalanche photodiode (APD210 Menlo Systems, Munich, Germany) that has a bandwidth of 1.5 GHz. The resulting RF signal, shown in Figure 3b, is centered at 1 GHz with a signal-to-noise ratio of nearly 50 dB in a 300 kHz resolution bandwidth. This high SNR is a key factor in achieving a robust and high-performance lock, as it ensures that the rate of phase slips is negligible [28].
Figure 3.
(a) Schematic of the phase-locked loop used to stabilize the repetition rate () of the frequency comb to the Cs reference signal. The feedback is applied to a piezoelectric transducer (PZT) mounted inside the Ti:Sa cavity, allowing control of the cavity length. (b) RF spectrum of the in-loop signal with a signal-to-noise ratio of 50 dB in a 100 kHz resolution bandwidth.
The detected signal is then amplified, divided by 10 with an SR625 prescaler (Stanford Research Systems, California, CA, USA) and low-pass filtered before being mixed with a 100 MHz signal generated by a direct digital synthesizer (DDS) locked to the Cs clock. The resulting error signal is fed into a proportional integrator (PI) module, whose output is amplified by a high-voltage driver and sent to the PZT mounted inside the bow-tie cavity. Since the dominant sources of cavity length fluctuations are mechanical vibrations and thermal dilation (characteristic frequencies lower than 100 Hz), the low actuation bandwidth of the PZT is well matched to the correction requirements, making it a suitable and effective actuator for long-term stabilization. In addition, the PZT provides a total displacement range of 100 µm, which is more than sufficient to compensate the typical cavity length fluctuations observed over a day. Its actuation bandwidth of up to 100 Hz is consistent with this correction range, as will be shown later in the phase noise analysis of the locked .
3.2. Stabilization of
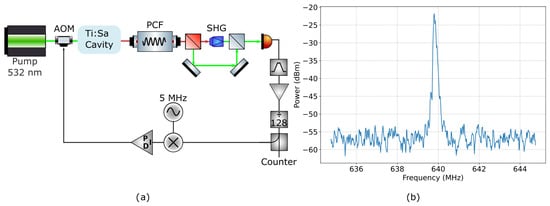
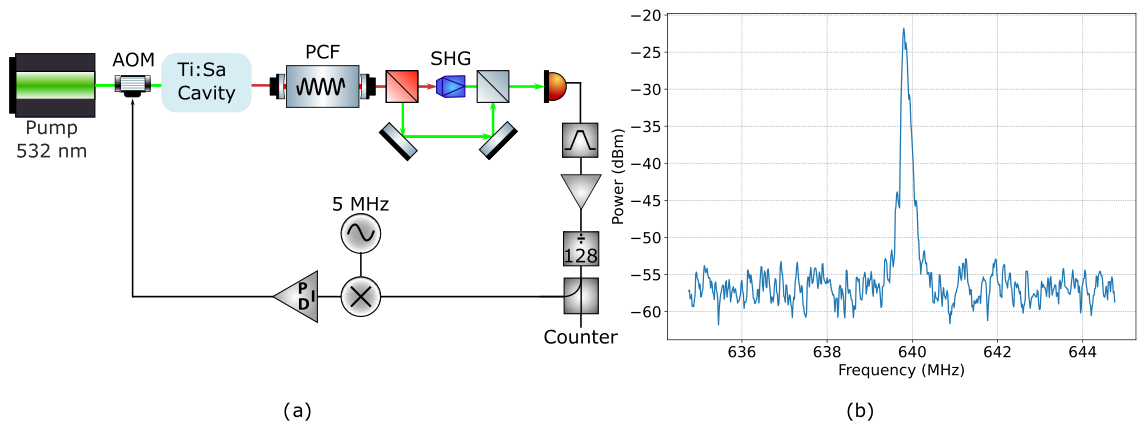
As described in the block diagram of Figure 2, the signal is measured by means of a standard f-2f interferometer. The output of the PCF is spectrally separated using a dichroic mirror, splitting the supercontinuum into its infrared and visible arms. In one of the arms, the infrared radiation has its frequency doubled with a second-harmonic generation (SHG) crystal, while the other arm is directed through a retroreflector to ensure temporal overlap between the two branches. The two arms are then recombined using a polarizing beam splitter, and the interference signal is detected with a fast avalanche photodiode (APD210, Menlo Systems). A typical detected signal is shown in Figure 4b, where, after appropriate filtering and amplification, a signal-to-noise ratio of almost 35 dB in a 100 kHz resolution bandwidth is achieved, with the beat note centered at approximately 640 MHz.
Figure 4.
(a) f-2f interferometer for detection and phase-lock loop for its stabilization. The light coming out of the PCF is split with a dichroic mirror. The infrared radiation has its frequency doubled and is then combined into a polarization beam splitter with the green part of the spectrum. The light is detected with a fast photodiode, and the signal is bandpass filtered and divided by 128 with an in-house prescaler (see text for details). One part is sent to a frequency counter, and the other part is mixed with a 5 MHz local oscillator. Then, it is sent to a PID module, and its output is used to drive an acousto-optic modulator (AOM) placed at the entrance of the Ti:Sa cavity for intensity control. (b) Frequency offset detection. The signal-to-noise ratio is 35 dB at 100 kHz.
After detection, the signal is bandpass filtered, amplified and divided by 128. In this case we used an in-house prescaler based on two UPB1509GV-E1 chips in cascade configuration. One part is sent to a counter for monitoring, and the other part to the PLL depicted on Figure 4a. The signal is mixed with a 5 MHz local oscillator and sent to a proportional plus double integral module (P2I). The output of the P2I is sent to an acousto-optic modulator (AOM) which allows us to correct the fast free-running fluctuations of (deviations of 50 kHz at timescales of 1 s) by acting on the pump intensity.
4. Stabilization Performance and Applications
The following section reports on the frequency stability and noise performance achieved in the phase-locked loops developed for and . Additionally, we present one of the first metrological applications of the comb, consisting of a characterization of the frequency instability of a Nd:YAG NPRO laser through a direct beat-note measurement with the stabilized OFC.
4.1. Stabilization
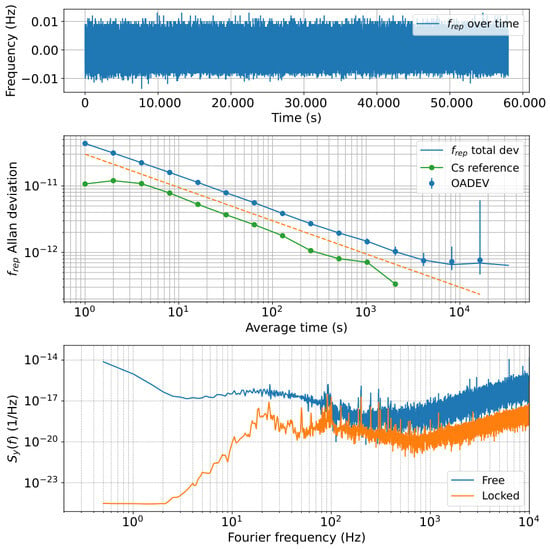
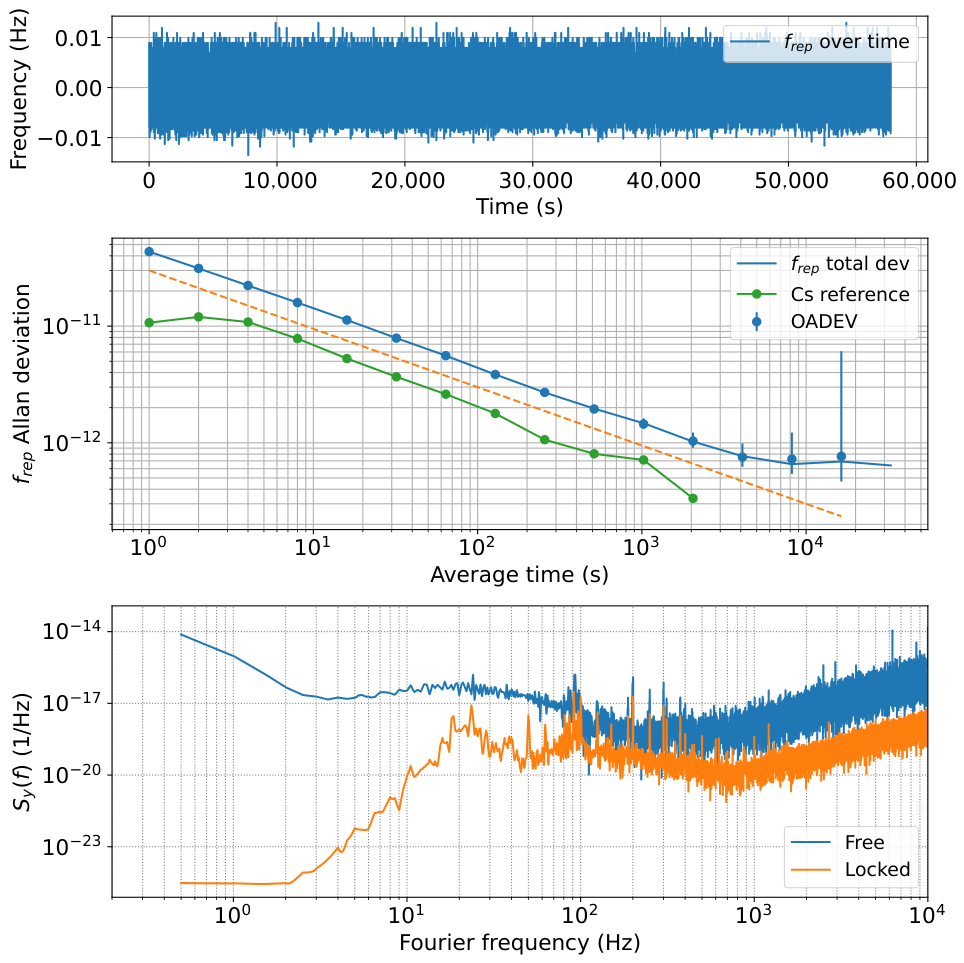
Figure 5 shows the result of a long-term in-loop measurement of the locked repetition rate. The signal, continuously measured with an SR-620 frequency counter operated at a 1 s gate time, is plotted as a frequency deviation from the nominal 1 GHz center frequency. The upper panel shows that the repetition rate remains well locked over the entire duration of more than 16 h, with fluctuations not exceeding 20 mHz throughout the measurement. The absence of phase slips over this extended period is a direct consequence of the high signal-to-noise ratio of the detection signal.
Figure 5.
Long-term stability of the lock. (Upper panel) Frequency offset of the repetition rate from the signal reference measured with a 1 s gate time. The lock remained uninterrupted for more than 16 h without cycle slips. (Middle panel) Allan deviation of the locked , showing an instability of at 1 s and a dependence (dashed orange line) consistent with white frequency noise. The green line represents the specified stability of the Cs reference. (Lower panel) Fractional frequency fluctuation for the repetition rate both in free-running and lock operation. The locking systems show a reduction in by several orders of magnitude at frequencies below 100 Hz.
The middle panel shows the Allan deviation calculated for the in-loop measurement. When average over a period of 1 s, the instability reaches and decreases following a dependence, indicated by the dashed orange line, which is characteristic of white frequency noise and is the expected behavior for measurements limited by the SR-620 counter. For reference, the green points show the specified frequency instability of the Microsemi 5071A Cs clock, which lies below the measured Allan deviation at all averaging times. This is consistent with the noise floor of the SR-620 counter, which imposes a minimum relative frequency uncertainty of approximately .
The lower panel of Figure 5 shows the fractional frequency fluctuation of the under free-running and locked conditions. The locking system, based on a PZT actuator, acts on the repetition rate at frequencies below 100 Hz, reducing by several orders of magnitude with respect to the free-running case within this bandwidth. At higher frequencies, beyond the actuator’s bandwidth, the loop can no longer suppress the noise and both traces converge to similar values. The spectral density is shown over the range from 0.2 Hz to 10 kHz, spanning the offset frequencies most relevant for the phase stabilization.
4.2. Stabilization
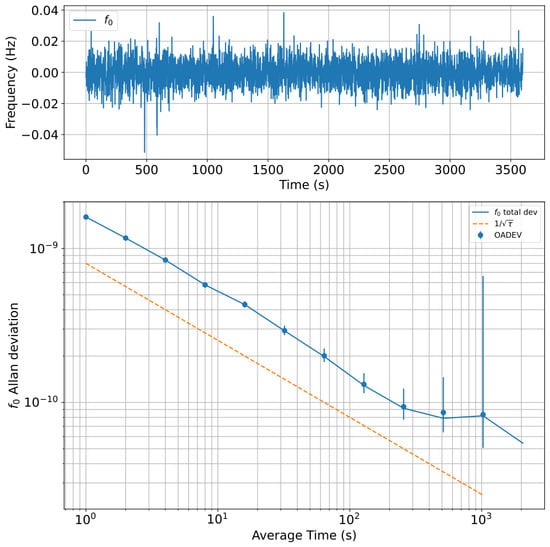
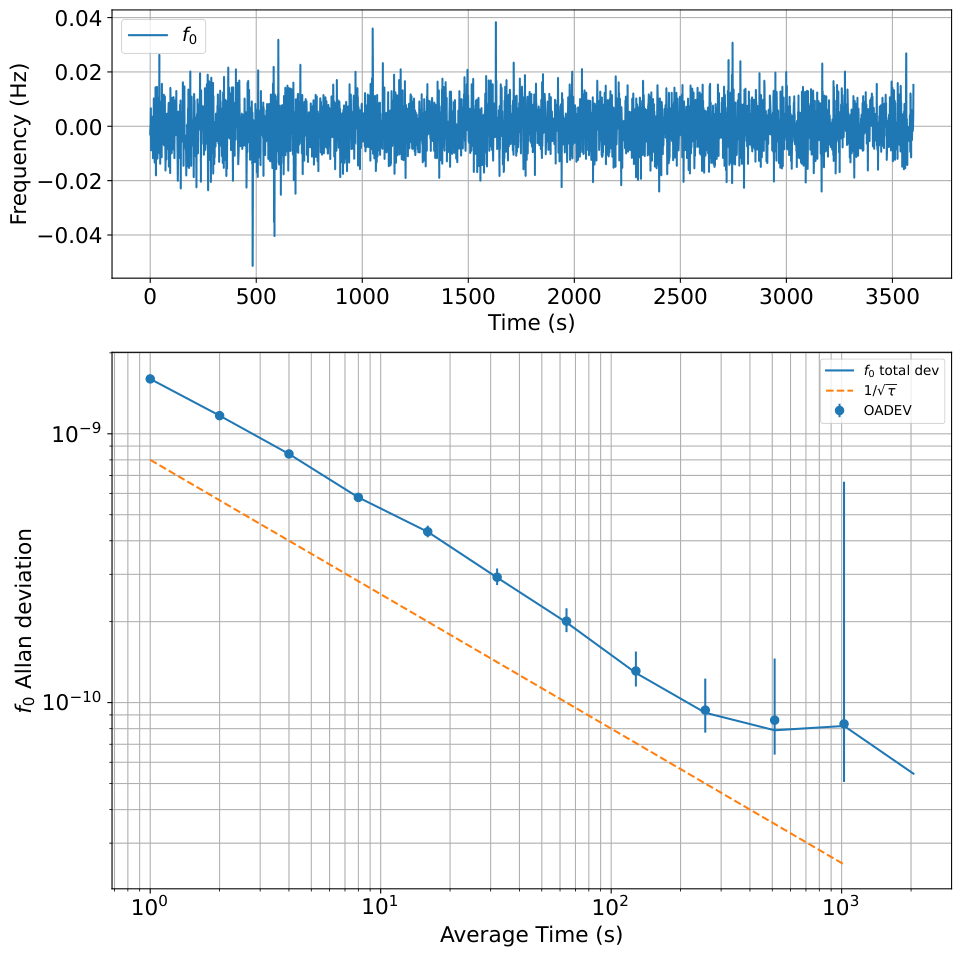
Figure 6 presents the stability performance of the locked carrier-envelope offset frequency. The upper panel shows the frequency deviation of the /128 signal from its reference value, measured with the SR-620 counter at a 1 s gate time. The remains locked for close to one hour, with deviations not exceeding 40 mHz over the duration of the measurement. The locking time is currently limited by the feedback signal eventually saturating due to the large free-running fluctuations of , which are attributable to temperature variations inside the Ti:Sa cavity. An improved thermal enclosure and active temperature stabilization of the cavity environment are expected to significantly extend the continuous locking time in future implementations. The lower panel shows the Allan deviation of the locked , which starts at at 1 s and decreases as , as indicated by the dashed orange line, consistent with white frequency noise and counter-limited behavior analogous to that observed for .
Figure 6.
Measurement and Allan deviation of the locked frequency offset for one hour. (Upper panel) Evolution of over an hour. The fluctuations of this measurement are less than 40 mHz. (Lower panel) Allan deviation of the locked frequency offset. At one second, its value is , after which it decreases as , showing the same behavior as the repetition rate.
The frequency instability of the OFC at the optical scale emphasizes that any optical frequency can be expressed in terms of the comb equation, . Since enters additively, its relative contribution to the optical frequency instability decreases with mode number n and becomes negligible for the large mode indices characteristic of near-infrared and visible comb teeth (). The fractional instability of the optical comb is therefore dominated by the relative instability of , which has been shown to reach approximately at 1 s in Figure 5. This sets the noise floor of the system when it is employed for laser frequency calibration and demonstrates that the OFC is capable of characterizing laser sources at an instability level well below at 1 s, a performance that is fully traceable to the national time reference through the Cs clock.
4.3. Laser Frequency Characterization
One of the metrological applications of an optical frequency comb is the characterization of the frequency instability of laser sources. Any laser frequency () can be expressed in terms of the comb parameters as
where is the mode index of the nearest comb tooth and is the RF beat-note frequency between the laser and that comb mode. Since and are both stabilized and referenced to the Cs clock, a measurement of with a frequency counter provides both the absolute optical frequency of the laser and a direct characterization of its frequency fluctuations. In this way, the OFC acts as a transfer oscillator, establishing a direct link between the RF reference and the optical domain.
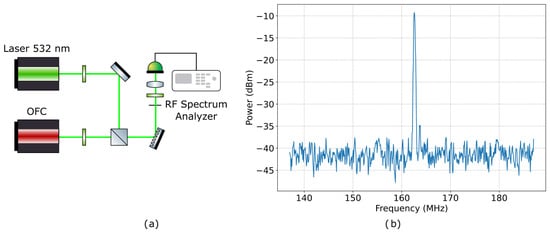
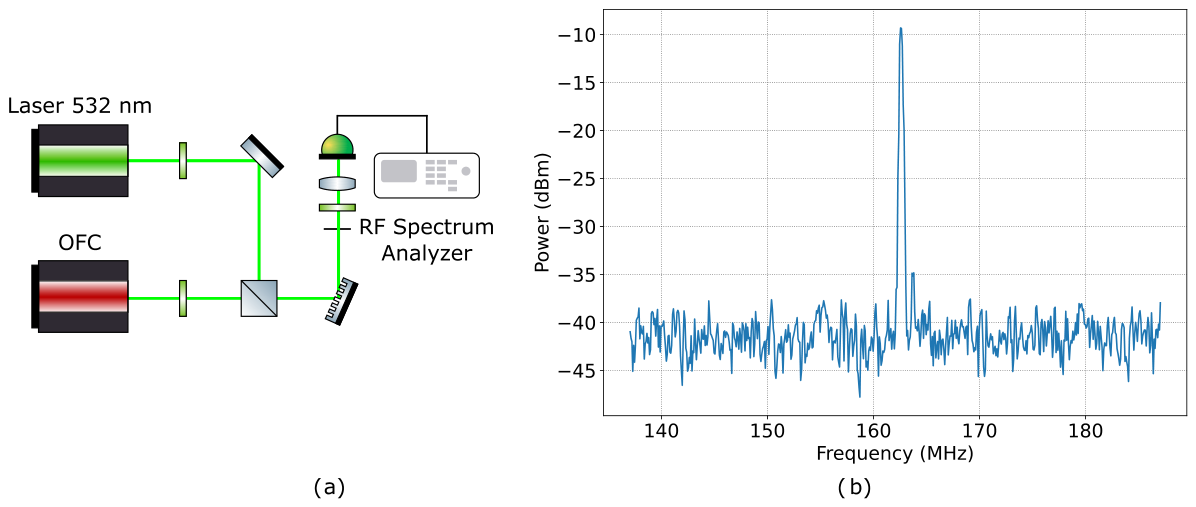
To demonstrate this capability, the frequency instability of the second harmonic of a Nd:YAG NPRO laser (Mephisto, Coherent, Pennsylvania, PA, USA) operating at 532 nm was characterized in free-running mode. An optical heterodyne interferometer was developed as shown in Figure 7a. As can be seen, the 532 nm output of the laser and the stabilized OFC are combined in a polarizing beam splitter cube. A diffraction grating disperses the comb’s radiation spatially along a free-space arm of approximately 2 m, and a pinhole is used downstream to select the spectral region of interest and to reduce the shot noise contribution from the remaining comb modes. Two waveplates are used to balance the power in both arms and optimize the signal-to-noise ratio of the detected beat note. Under these conditions, the beat note is detected with a 1.5 GHz bandwidth Si photodetector and is found at approximately 160 MHz with a signal-to-noise ratio of about 30 dB in a 100 kHz resolution bandwidth, as shown in Figure 7b. Given the large free-running frequency excursions of the laser, the beat note is counted using the frequency counter function of an RF spectrum analyzer with a gate time of 1.5 s.
Figure 7.
(a) Free-space interferometer setup for the detection of the beat note between the optical frequency comb and the second harmonic of the Mephisto laser at 532 nm. (b) RF spectrum of the detected beat note signal, exhibiting a signal-to-noise ratio of nearly 30 dB in a 100 kHz resolution bandwidth.
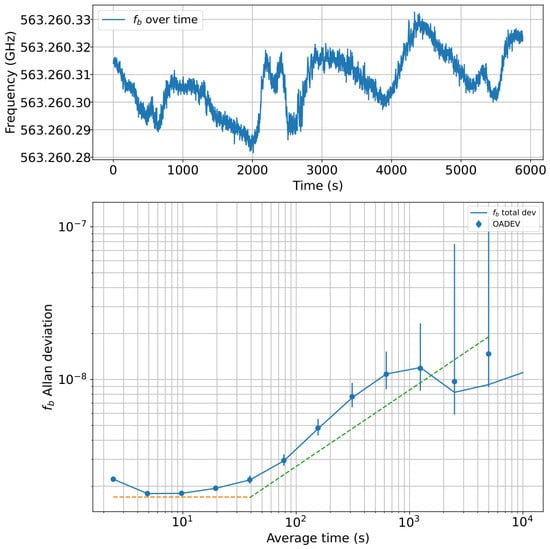
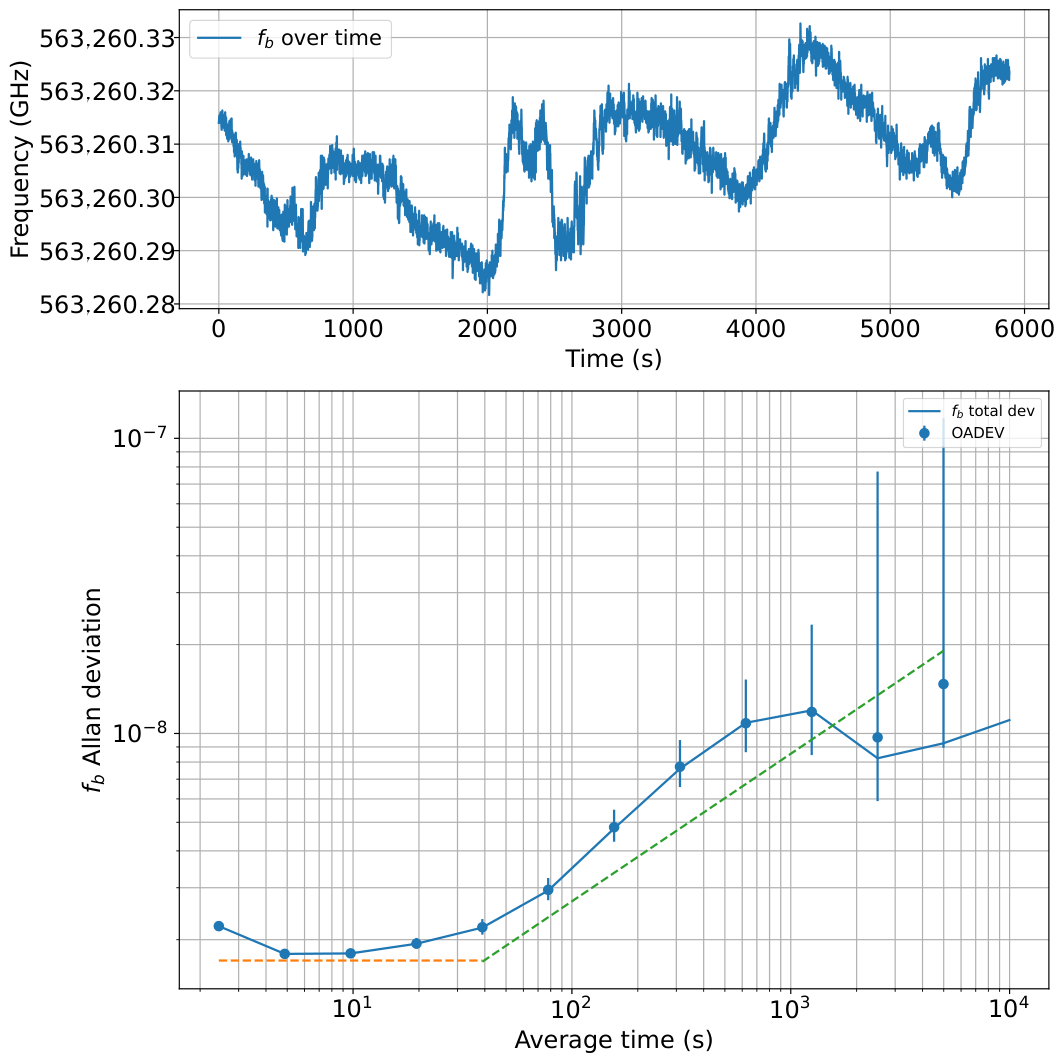
The upper panel of Figure 8 shows the fluctuations of the laser’s absolute optical frequency, obtained from the counted beat note via the comb equation, over approximately 6000 s. The free-running laser exhibits short-term fluctuations superimposed on a slow drift that grows at longer timescales, reflecting the absence of any long-term frequency stabilization. The measured absolute optical frequency of the 532 nm laser is centered at 563,260.31 GHz, with free-running fluctuations spanning a range of approximately 50 MHz. The corresponding Allan deviation, shown in the middle panel, reveals two distinct noise regimes. Between averaging times of 1 s and approximately 50 s, the Allan deviation is flat at a value of , which is characteristic of flicker frequency noise [29]. Beyond that timescale, the instability increases following a random walk dependence that can be estimated as . While a random walk contribution is expected for a free-running laser, the magnitude observed here is approximately one order of magnitude larger than the value of reported by the manufacturer. Two factors may account for this discrepancy. First, the use of the frequency counter function of the RF spectrum analyzer introduces a relatively long dead time between consecutive measurements, which can inflate the estimated instability, particularly at short averaging times where flicker noise dominates. Second, the thermal environment of the laboratory, with temperature fluctuations of approximately 0.5 K, may exceed the operating range over which the internal temperature controller of the Mephisto laser can maintain optimal frequency stabilization, leading to larger frequency drift at long timescales.
Figure 8.
(Upper panel) Frequency beat note between the optical frequency comb and the frequency-doubled Nd:YAG laser over one and one-half hours. (Lower panel) Allan deviation for this measurement. The plot also shows the noise tendencies of the measurement: flicker noise and random walk.
5. Conclusions
In this work, a femtosecond Ti:sapphire OFC was successfully constructed from the ground up, achieving a supercontinuum spectrum that spans over a full octave from 500 nm to 1100 nm with a highly homogeneous power distribution. This broad spectrum contains several atomic clock transitions, enabling direct optical frequency beat-note measurements across these wavelengths. Furthermore, simultaneous stabilization of the comb’s repetition rate () and carrier-envelope offset frequency () to a stable reference was demonstrated. Characterization of the locked parameters yielded a fractional frequency instability at 1 s of for and for , ensuring full traceability to the national time standard. Finally, the system’s utility for laser characterization was validated by measuring the frequency instability of a frequency-doubled Nd:YAG NPRO laser at 532 nm.
Despite these results, the current system exhibits a limitation in the duration over which the lock can be maintained, primarily attributable to thermal drift affecting the long-term stability of the locking loop. Future work consists of thermal isolation improvement of the system in order to achieve higher locking times for . Moreover, it is thought to implement more beat-note detections and characterization with different lasers and do it simultaneously.
The development and implementation of the optical frequency comb (OFC) presented in this work marks a milestone for Argentina’s National Metrology Institute (INTI). As the first operational OFC in the country, this system establishes direct traceability from the national time reference to the institute’s optical frequency standards, significantly enhancing local metrological capabilities.
Author Contributions
Methodology, F.Y., M.d.P.C.M. and M.R.; Software, F.Y., M.d.P.C.M. and M.R.; Validation, M.d.P.C.M. and M.R.; Formal analysis, F.Y. and M.d.P.C.M.; Investigation, M.R.; Resources, K.B. and M.R.; Data curation, F.Y. and M.d.P.C.M.; Writing – original draft, M.d.P.C.M. and M.R.; Writing—review and editing, M.d.P.C.M., K.B. and M.R.; Supervision, J.C., K.B. and M.R.; Project administration, H.L.; Funding acquisition, K.B. and H.L. All authors have read and agreed to the published version of the manuscript.
Funding
The Ti:Sa optical frequency comb developed in this work was made possible through a donation from the International Bureau of Weights and Measures (BIPM). The authors gratefully acknowledge this support. This work was also internally funded by the National Institute of Industrial Technology (INTI), Argentina’s National Metrology Institute.
Data Availability Statement
Unfortunately we do not have a share link point to provide but data can be provided if requested.
Acknowledgments
The authors want to acknowledge Massimo Zucco for fruitful and constructive discussions about the optical frequency comb stabilization and beatnote detection experimental setup.
Conflicts of Interest
The authors declare no conflicts of interest.
References
- Diddams, S.A.; Vahala, K.; Udem, T. Optical frequency combs: Coherently uniting the electromagnetic spectrum. Science 2020, 360, 142–149. [Google Scholar]
- Fortier, T.; Baumann, E. 20 Years of Developments in Optical Frequency Comb Technology and Applications. Commun. Phys. 2019, 2, 153, Correction in Commun. Phys. 2020, 3, 85. [Google Scholar] [CrossRef] [Scilit]
- Hänsch, T.W. Nobel Lecture: Passion for precision. Rev. Mod. Phys. 2006, 78, 1297–1309. [Google Scholar] [CrossRef] [Scilit]
- Ye, J.; Ma, L.S.; Hall, J.L. Molecular Iodine Clock. Phys. Rev. Lett. 2001, 87, 270801. [Google Scholar] [CrossRef] [Scilit] [PubMed]
- Diddams, S.A.; Udem, T.; Bergquist, J.C.; Curtis, E.A.; Drullinger, R.E.; Hollberg, L.; Itano, W.M.; Lee, W.D.; Oates, C.W.; Vogel, K.R.; et al. An Optical Clock Based on a Single Trapped 199Hg+ Ion. Science 2001, 293, 825–828. [Google Scholar] [CrossRef] [Scilit] [PubMed]
- Nathalie, P.; Hänsch, T.W. Frequency comb spectroscopy. Nat. Photonics 2019, 13, 146–157. [Google Scholar] [CrossRef] [Scilit]
- Coddington, I.; Swann, W.; Nenadovic, L.; Newbury, M. Rapid and precise absolute distance measurements at long range. Nat. Photonics 2009, 3, 351–356. [Google Scholar] [CrossRef] [Scilit]
- McCracken, R.A.; Charsley, J.M.; Reid, D.T. A decade of astrocombs: Recent advances in frequency combs for astronomy. Opt. Express 2017, 25, 146–157. [Google Scholar] [CrossRef] [Scilit] [PubMed]
- Schioppo, M.; Kronjäger, J.; Silva, A.; Ilieva, R.; Paterson, J.W.; Baynham, C.F.A.; Bowden, W.; Hill, I.R.; Hobson, R.; Vianello, A.; et al. Comparing Ultrastable Lasers 7×10⁻¹⁷ Fractional Frequency Instability Through a 2220 km Optical Fibre Network. Nat. Commun. 2022, 13, 212. [Google Scholar] [CrossRef] [Scilit] [PubMed]
- Lindvall, T.; Pizzocaro, M.; Godun, R.M.; Abgrall, M.; Akamatsu, D.; Amy-Klein, A.; Benkler, E.; Bhatt, N.M.; Calonico, D.; Cantin, E.; et al. Coordinated international comparisons between optical clocks connected via fiber and satellite links. Optica 2025, 12, 843–852. [Google Scholar] [CrossRef] [Scilit]
- Telle, H.R.; Lipphardt, B.; Stenger, J. Kerr-lens mode-locked lasers as transfer oscillators for optical frequency measurements. Appl. Phys. B Lasers Opt. 2002, 74, 1–6. [Google Scholar] [CrossRef] [Scilit]
- Nicolodi, D.; Argence, B.; Zhang, W.; Le Targat, R.; Santarelli, G.; Le Coq, Y. Spectral purity transfer between optical wavelengths at the 10−18 level. Nat. Photonics 2014, 8, 219–223. [Google Scholar] [CrossRef] [Scilit]
- Nakamura, T.; Davila-Rodriguez, J.; Leopardi, H.; Sherman, J.; Fortier, T.; Xie, X.; Campbell, J.; McGrew, W.; Zhang, X.; Hassan, Y.; et al. Coherent Optical Clock Down-Conversion for Microwave Frequencies with 10−18 Instability. Science 2020, 368, 889–892. [Google Scholar] [CrossRef] [Scilit] [PubMed]
- Blumröder, U.; Köchert, P.; Fröhlich, T.; Kissinger, T.; Ortlepp, I.; Flügge, J.; Bosse, H.; Manske, E. A GPS-Referenced Wavelength Standard for High-Precision Displacement Interferometry at λ=633 nm. Sensors 2023, 23, 1734. [Google Scholar] [CrossRef] [Scilit] [PubMed]
- Godun, R.M.; Nisbet-Jones, P.B.R.; Jones, J.M.; King, S.A.; Johnson, L.A.M.; Margolis, H.S.; Szymaniec, K.; Lea, S.N.; Bongs, K.; Gill, P. Frequency Ratio of Two Optical Clock Transitions in 171Yb+ and Constraints on the Time Variation of Fundamental Constants. Phys. Rev. Lett. 2014, 113, 210801. [Google Scholar] [CrossRef] [Scilit] [PubMed]
- Wcisło, P.; Ablewski, P.; Beloy, K.; Bilicki, S.; Bober, M.; Brown, R.; Fasano, R.; Ciuryło, R.; Hachisu, H.; Ido, T.; et al. New Bounds on Dark Matter Coupling from a Global Network of Optical Atomic Clocks. Sci. Adv. 2018, 4, eaau4869. [Google Scholar] [CrossRef] [Scilit] [PubMed]
- Morel, L.; Yao, Z.; Cladé, P.; Guellati-Khélifa, S. Determination of the Fine-Structure Constant with an Accuracy of 81 Parts per Trillion. Nature 2020, 588, 61–65. [Google Scholar] [CrossRef] [Scilit] [PubMed]
- Diddams, S.A. The evolving optical frequency comb [Invited]. J. Opt. Soc. Am. B 2010, 27, B51–B62. [Google Scholar] [CrossRef] [Scilit]
- Ramond, T.M.; Diddams, S.A.; Hollberg, L.; Bartels, A. Phase-coherent link from optical to microwave frequencies by means of the broadband continuum from a 1-GHz Ti:sapphire femtosecond oscillator. Opt. Lett. 2002, 27, 1842–1844. [Google Scholar] [CrossRef] [Scilit] [PubMed]
- Schibli, T.R.; Minoshima, K.; Hong, F.-L.; Inaba, H.; Onae, A.; Matsumoto, H.; Hartl, I.; Fermann, M.E. Frequency metrology with a turnkey all-fiber system. Opt. Lett. 2004, 29, 2467–2469. [Google Scholar] [CrossRef] [Scilit] [PubMed]
- Sinclair, L.; Deschenes, J.; Sonderhouse, L.; Swann, W.; Khader, I.; Baumann, E.; Newbury, N.; Coddington, I. A compact optically coherent fiber frequency comb. Rev. Sci. Instrum. 2017, 86, 081301. [Google Scholar]
- Kippenberg, T.J.; Gaeta, A.L.; Lipson, M.; Gorodetsky, M.L. Dissipative Kerr Solitons in Optical Microresonators. Science 2018, 361, eaan8083. [Google Scholar] [CrossRef] [Scilit] [PubMed]
- Pasquazi, A.; Peccianti, M.; Razzari, L.; Moss, D.J.; Coen, S.; Erkintalo, M.; Chembo, Y.K.; Hansson, T.; Wabnitz, S.; Del’Haye, P.; et al. Micro-Combs: A Novel Generation of Optical Sources. Phys. Rep. 2018, 729, 1–81. [Google Scholar] [CrossRef] [Scilit]
- Gaeta, A.L.; Lipson, M.; Kippenberg, T.J. Photonic-chip-based frequency combs. Nat. Photonics 2019, 13, 158–169. [Google Scholar] [CrossRef] [Scilit]
- Leopardi, H.; Beloy, K.; Bothwell, T.; Brewer, S.M.; Bromley, S.L.; Chen, J.-S.; Diddams, S.A.; Fasano, R.J.; Hassan, Y.S.; Hume, D.B.; et al. Measurement of the to the 27Alto the + and to the 87Sr Absolute Optical Frequencies. Metrologia 2021, 58, 015017. [Google Scholar] [CrossRef] [Scilit] [PubMed]
- Silva, I.; Couceiro, I.; Torres, M.; Costa, P.; Grieneisen, H. Traceability of laser frequency/wavelength calibration through the frequency comb at Inmetro. J. Phys. Conf. Ser. 2015, 733, 012058. [Google Scholar] [CrossRef] [Scilit]
- Villarreal-Wong, A.; Nieto-Peralta, V.; Vidal-Delgado, E.; López-Romero, J.M.; Gutiérrez-Gómez, R.; Ortiz, C.A.; de Carlos López, E. Towards Dual Comb Spectroscopy Using Squeezed States of Light. In Proceedings of the Joint Conference of the European Frequency and Time Forum and IEEE International Frequency Control Symposium (EFTF/IFCS), Querétaro, Mexico, 12–16 May 2025; pp. 1–2. [Google Scholar]
- Risaro, M.; Savio, P.; Pizzocaro, M.; Levi, F.; Calonico, D.; Clivati, C. Improving the Resolution of Comb-Based Frequency Measurements Using a Track-And-Hold Amplifier. Phys. Rev. Appl. 2022, 18, 064010. [Google Scholar] [CrossRef] [Scilit]
- Rubiola, E.; Vernote, F. The Companion of Enrico’s Chart for Phase Noise and Two-Sample Variances. IEEE Trans. Microw. Theory Tech. 2022, 71, 2996–3025. [Google Scholar] [CrossRef] [Scilit]
Disclaimer/Publisher’s Note: The statements, opinions and data contained in all publications are solely those of the individual author(s) and contributor(s) and not of MDPI and/or the editor(s). MDPI and/or the editor(s) disclaim responsibility for any injury to people or property resulting from any ideas, methods, instructions or products referred to in the content. |
© 2026 by the authors. Licensee MDPI, Basel, Switzerland. This article is an open access article distributed under the terms and conditions of the Creative Commons Attribution (CC BY) license.