


Abstract
Curvature-based descriptors are increasingly used in surface metrology for the characterization of complex geometries. However, their sensitivity to measurement uncertainty remains insufficiently understood, particularly in comparison with conventional deviation-based metrics. This study investigates the propagation of coordinate measurement noise into curvature estimation using a numerical framework combining differential geometry, local quadratic surface fitting, and Monte Carlo simulation. A set of nominal surfaces, including spherical, cylindrical, and free-form geometries, was analyzed under controlled stochastic perturbations. The results show that curvature uncertainty increases nonlinearly with coordinate noise and is significantly more sensitive to measurement errors than point-wise deviations. Even small perturbations in measured coordinates lead to amplified variability in curvature due to its dependence on second-order derivatives. The analysis further reveals the presence of systematic bias in curvature estimation and demonstrates that the resulting distributions deviate from normality, despite Gaussian input noise. This finding highlights the limitations of classical uncertainty evaluation approaches based on linear propagation and normality assumptions. In addition, the study shows that increasing sampling density does not necessarily improve estimation reliability, while the size of the local fitting window plays a key role in stabilizing curvature estimation, acting as an implicit regularization parameter. The comparison with conventional form deviation metrics confirms that curvature-based analysis provides complementary information about local geometric stability, which is not captured by global measures. The proposed simulation-based approach offers a practical framework for evaluating uncertainty in nonlinear geometric measurements and supports the integration of curvature-based descriptors into advanced metrological applications. The proposed framework can support uncertainty-aware evaluation of free-form surfaces in practical measurement tasks, including coordinate measurement of turbine blades and aerodynamic components in the aerospace industry, as well as optical scanning and verification of patient-specific biomedical implants, where accurate curvature characterization is essential for quality assessment.
1. Introduction
Surface form metrology plays a fundamental role in modern manufacturing, precision engineering, and quality assurance, where the geometric integrity of components directly affects functionality, reliability, and interchangeability. With the increasing demand for high-precision components in aerospace, biomedical engineering, and micro-mechanics, the need for accurate and traceable surface characterization has become critical [1,2,3,4]. Coordinate-measuring machines (CMMs), optical systems, and areal surface topography instruments are widely employed to capture discrete point data representing real surfaces [5,6,7,8]. However, the interpretation of these data in terms of form deviation and associated measurement uncertainty remains a challenging task.
In conventional form metrology, surface evaluation is typically based on distance-oriented criteria, such as least-squares fitting, minimum zone methods, or point-to-nominal deviations [9,10,11,12]. These approaches provide global measures of form error but often fail to capture local geometric features that are essential for understanding functional behavior. Moreover, the propagation of measurement uncertainty through these models is commonly treated in a simplified manner, assuming linear relationships and Gaussian error distributions [13,14,15]. Such assumptions may not hold in practice, particularly for complex surfaces or when measurement noise exhibits spatial correlation or systematic components.
An alternative perspective is provided by Differential Geometry, where surfaces are described as smooth manifolds embedded in three-dimensional space. In this framework, a surface can be represented by a parametric mapping
and its local geometric properties are characterized by quantities such as normal vectors and curvatures. In particular, curvature serves as a fundamental descriptor of surface form, providing intrinsic information about shape independently of coordinate representation [16,17,18,19]. The Gaussian curvature and mean curvature are defined through the first and second fundamental forms and capture local bending behavior of the surface [20,21,22]. Unlike distance-based metrics, curvature-based descriptors enable localized analysis of deviations and are therefore highly relevant for advanced form characterization.
Despite its theoretical advantages, the application of differential geometry in practical metrology has been limited. One of the main reasons is the sensitivity of curvature estimation to measurement noise and discretization effects. In real measurement systems, surfaces are not observed continuously but through discrete point clouds affected by measurement errors. A general measurement model can be expressed as
where represents stochastic measurement errors. These errors may arise from probe noise, optical distortions, calibration inaccuracies, or environmental influences [23,24,25,26]. As curvature involves second-order derivatives of the surface, even small perturbations in measured points can lead to significant deviations in estimated curvature values.
The evaluation of measurement uncertainty in such nonlinear and geometry-dependent quantities requires advanced methods beyond classical linear uncertainty propagation. According to the Guide to the Expression of Uncertainty in Measurement (GUM), the combined standard uncertainty is obtained using sensitivity coefficients and the law of propagation of uncertainty [27,28]:
where are sensitivity coefficients. However, for strongly nonlinear problems such as curvature estimation, analytical derivation of these coefficients is often impractical or inaccurate. In such cases, numerical approaches based on the Monte Carlo method provide a robust alternative for uncertainty propagation [29,30,31]. In this context, simulation-based approaches are increasingly recognized as an essential component of modern metrology, enabling the analysis of complex measurement systems and uncertainty propagation beyond analytical models [32]. These methods allow direct simulation of measurement variability and estimation of resulting distributions without restrictive assumptions about linearity or normality. Recent studies emphasize that the quality and reliability of measurement results strongly depend on the underlying measurement model and its ability to capture complex relationships between input quantities and the measurand [33].
Recent studies have highlighted the importance of uncertainty evaluation in surface metrology and coordinate measurements. Leach [1] and Haitjema [2] provided comprehensive frameworks for dimensional metrology and uncertainty analysis. Pavese [34] and Jiang et al. [35] investigated geometric fitting and error propagation in coordinate measurements. More recent works have focused on uncertainty in surface topography measurements, including optical systems and areal instruments [36,37,38,39]. However, most of these studies rely on traditional geometric descriptors and do not explicitly consider curvature-based metrics.
The estimation of curvature from discrete data has been extensively studied in computational geometry and computer vision, where various numerical techniques have been proposed, including polynomial fitting, moving least squares (MLS), and discrete differential operators [40,41,42,43]. While these methods provide practical tools for curvature estimation, their metrological interpretation in terms of uncertainty and traceability remains insufficiently addressed. In particular, the relationship between measurement noise, sampling density, reconstruction strategy, and curvature uncertainty has not been systematically quantified in the context of dimensional metrology.
Furthermore, standardization efforts such as ISO GPS and areal surface texture standards (e.g., ISO 25178) provide guidelines for surface measurement and parameter evaluation but primarily focus on amplitude-based and spatial parameters rather than intrinsic geometric quantities like curvature [5,44,45]. As a result, there is a gap between advanced geometric modeling techniques and their integration into metrological practice.
Given these limitations, there is a clear need for a unified framework that combines differential geometric surface representation with rigorous uncertainty evaluation methods. Such a framework should account for realistic measurement conditions, including stochastic noise, discrete sampling, and reconstruction errors, while providing physically meaningful descriptors of surface form.
Despite these developments, a systematic metrological analysis of uncertainty propagation in curvature-based surface evaluation remains largely missing. In particular, the combined influence of measurement noise, sampling density, and reconstruction strategy on curvature uncertainty has not been quantitatively established in dimensional metrology.
Based on the identified research gap, the following objectives are defined:
(1) To quantify the propagation of coordinate measurement noise into curvature estimation;
(2) To analyze the sensitivity of curvature-based descriptors to sampling density and reconstruction parameters;
(3) To compare curvature-based uncertainty with conventional deviation-based metrics;
(4) To evaluate the suitability of Monte Carlo methods for uncertainty assessment in nonlinear geometric models.
The study is based on a simulation framework implemented in MATLAB R2026a (MathWorks, Natick, MA, USA), where synthetic surfaces are generated and subjected to controlled perturbations. Several representative geometries, including spherical, cylindrical, and free-form surfaces, are considered to cover a wide range of practical scenarios.
Previous studies have extensively investigated uncertainty in coordinate measurements, optical surface metrology, and geometric reconstruction methods. However, most existing approaches primarily focus on uncertainties associated with directly measured quantities, such as distances, dimensions, or surface height parameters. The uncertainty behavior of higher-order geometric descriptors, particularly Gaussian curvature derived from second-order surface derivatives, remains significantly less explored.
Furthermore, existing studies typically evaluate measurement uncertainty under specific measurement conditions or for particular instruments, whereas a systematic investigation of how sampling density, measurement noise, local reconstruction parameters, and realistic measurement disturbances collectively influence curvature estimation has not been sufficiently addressed.
The present work addresses this gap by proposing a comprehensive numerical framework based on differential geometry and Monte Carlo uncertainty propagation. Unlike conventional uncertainty analyses, the proposed approach considers the nonlinear transformation from measured coordinates to Gaussian curvature and evaluates the influence of multiple metrological factors within a unified analysis framework.
Compared with conventional surface metrology studies, which mainly address uncertainty in primary measured quantities or surface texture parameters, the present study focuses on curvature as a derived geometric descriptor exhibiting fundamentally different uncertainty behavior. The results demonstrate that even small coordinate perturbations may lead to amplified errors in curvature estimation due to the nonlinear nature of differential geometric calculations.
Therefore, the proposed framework provides not only a numerical investigation of measurement uncertainty but also a methodological basis for uncertainty-aware interpretation of curvature-based parameters in future coordinate and optical measurement systems.
This work provides three main contributions:
(1) A metrology-oriented framework integrating differential geometry and uncertainty evaluation for surface form analysis;
(2) A systematic numerical investigation of nonlinear uncertainty propagation in curvature estimation;
(3) New insights into the limitations of conventional deviation-based metrics and the role of curvature as a higher-order descriptor.
The rest of the paper is organized as follows. Section 2 introduces the mathematical and measurement models used in the study. Section 3 describes the numerical simulation framework and curvature estimation methods. Section 4 presents the results of the uncertainty analysis and sensitivity studies. Section 5 discusses the implications of the findings for practical metrology. Finally, Section 6 concludes the paper and outlines directions for future research, including experimental validation.
2. Mathematical and Measurement Framework
2.1. Surface Representation and Geometric Description
In dimensional metrology, a real surface is typically represented by a finite set of measured points obtained from coordinate or optical measurement systems. However, for the purpose of geometric analysis, the surface can be modeled as a continuous two-dimensional manifold embedded in three-dimensional Euclidean space. Within the framework of Differential Geometry, a smooth surface is described by a parametric mapping
where and are local surface parameters [16,17,19,46,47].
The local geometric behavior of the surface is characterized by its tangent vectors:
and the corresponding unit normal vector:
The first fundamental form describes the local metric properties of the surface and is given by:
where
The curvature properties of the surface are derived from the second fundamental form:
The Gaussian curvature and mean curvature are then defined as [17,19]:
These quantities provide intrinsic and extrinsic measures of surface form, respectively, and are independent of rigid body transformations. In contrast to distance-based form deviations, curvature descriptors enable localized analysis of geometric features and are therefore particularly suitable for identifying small-scale form deviations [1,9,35].
2.2. Measurement Model and Error Representation
In practical metrology, the surface is not directly observed as a continuous function but through a discrete set of measured points:
where denotes the measured coordinates and represents the measurement error vector [2,8].
The measurement error can be modeled as a stochastic variable incorporating multiple sources of uncertainty, including sensor noise, calibration errors, environmental influences, and data acquisition limitations. In general, the error can be expressed as:
where represents random noise and denotes systematic effects [13,14,15].
For numerical analysis, the random component is often assumed to follow a normal distribution:
although deviations from Gaussian behavior may occur in practical systems due to filtering, edge detection, or sensor nonlinearities [29,30].
In addition to isotropic noise, anisotropic and spatially correlated error structures may be present, particularly in optical measurement systems. These effects can significantly influence the estimation of geometric quantities, especially those involving higher-order derivatives such as curvature [1,30,48].
2.3. Surface Reconstruction from Discrete Data
Since curvature cannot be directly computed from discrete point sets without additional assumptions, a reconstruction or approximation of the underlying surface is required. Several approaches are commonly used in practice, including polynomial fitting, spline interpolation, and moving least squares (MLS) methods [40,42].
In this work, the reconstructed surface is denoted as:
which approximates the true surface based on the measured data . The reconstruction process introduces an additional source of uncertainty, which depends on the chosen method, sampling density, and noise level.
Local polynomial approximation is particularly suitable for curvature estimation, as it enables direct computation of first and second derivatives. In a local neighborhood of each point, the surface can be approximated by a quadratic function:
from which curvature quantities can be analytically derived [11,49,50,51,52,53,54,55,56].
The accuracy of the reconstructed surface strongly depends on the spatial distribution of measurement points. Sparse sampling may lead to underfitting and loss of geometric detail, while dense sampling can amplify noise effects if no smoothing is applied [39,52]. The statistical behavior of surface-related parameters has been shown to be highly dependent on the underlying data processing and reconstruction methods [49].
2.4. Curvature Estimation from Measured Data
The estimation of curvature from reconstructed surfaces involves the evaluation of second-order derivatives, which makes it inherently sensitive to measurement noise. Let denote the estimated Gaussian curvature obtained from the reconstructed surface:
where represents the reconstruction and differentiation process.
Due to the nonlinear nature of this transformation, small perturbations in the input data may lead to significant variations in . This sensitivity is a well-known issue in discrete differential geometry and has been extensively studied in the context of point cloud processing and computer graphics [53,54].
To mitigate noise effects, various regularization and smoothing techniques can be applied during reconstruction. However, such methods introduce a trade-off between noise suppression and geometric fidelity, which must be carefully considered in metrological applications [57,58].
2.5. Uncertainty Propagation Framework
The propagation of measurement uncertainty from point coordinates to curvature estimates is a nonlinear problem that cannot be adequately addressed using classical linear uncertainty propagation methods. Therefore, a numerical approach based on the Monte Carlo method is adopted in this study [59,60].
Let denote the curvature estimate obtained in the -th simulation run, where random perturbations are applied to the measured points according to the assumed error model. The distribution of is then approximated by:
From this distribution, statistical quantities such as the mean value, standard deviation, and confidence intervals can be computed:
This approach allows direct estimation of uncertainty without requiring explicit analytical expressions for sensitivity coefficients. Moreover, it enables the analysis of non-Gaussian effects and nonlinear interactions between measurement errors and geometric transformations [60].
2.6. Summary of the Framework
The proposed framework combines geometric modeling, measurement error representation, surface reconstruction, and numerical uncertainty propagation into a unified methodology for curvature-based surface form evaluation. The key steps can be summarized as follows:
- Representation of the nominal surface using a parametric model.
- Generation of discrete measurement points with stochastic perturbations.
- Reconstruction of the surface from noisy data.
- Estimation of curvature quantities.
- Propagation of uncertainty using Monte Carlo simulation.
This framework provides the basis for the numerical investigations presented in the following sections.
From a metrological perspective, the presented framework allows the transformation of coordinate-level measurement uncertainty into higher-order geometric quantities. This transformation is essential for assessing the reliability of curvature-based descriptors in practical measurement systems.
3. Numerical Simulation Framework
To investigate the propagation of measurement uncertainty in curvature-based surface form evaluation, a numerical simulation framework was developed in MATLAB. The framework is designed to emulate realistic measurement conditions by generating discrete surface data, introducing controlled perturbations, reconstructing the surface, and estimating curvature quantities under repeated stochastic realizations.
Unlike purely analytical approaches, the adopted methodology enables the analysis of nonlinear effects and complex error interactions that arise during surface reconstruction and curvature estimation. The simulation framework follows a structure consistent with uncertainty evaluation principles described in the GUM Supplement 1 [13,14,15], where numerical sampling is used to propagate input uncertainties through a measurement model.
The overall workflow consists of the following stages:
- Generation of nominal surface geometry.
- Sampling of discrete measurement points.
- Introduction of stochastic measurement errors.
- Surface reconstruction.
- Curvature estimation.
- Repeated simulation for uncertainty propagation.
3.1. Nominal Surface Models
Three representative surface geometries were selected to cover different classes of form characteristics:
(i) Spherical surface. The sphere provides a reference geometry with constant positive Gaussian curvature:
where is the radius of the sphere.
This case serves as a baseline for evaluating the accuracy and bias of curvature estimation under ideal geometric conditions [16].
(ii) Cylindrical surface. The cylinder represents a surface with zero Gaussian curvature and non-zero mean curvature:
This geometry is particularly useful for analyzing anisotropic behavior in curvature estimation and sensitivity to directional sampling [47].
(iii) Free-form surface. To simulate realistic engineering components, a free-form surface was defined using a nonlinear parametric function:
where , , and control curvature variability.
This case introduces spatially varying curvature and provides a more challenging scenario for reconstruction and uncertainty analysis [40,41].
3.2. Sampling Strategy
Discrete measurement points were generated by sampling the parametric domain on a regular grid:
The sampling density was varied to investigate its influence on curvature estimation and uncertainty. Regular rectangular grids with different resolutions were considered, corresponding to 25 × 25, 40 × 40, 60 × 60, 80 × 80, and 100 × 100 measurement points. Therefore, the total number of points ranged from 625 to 10,000 points depending on the selected sampling configuration.
For the investigated surface domain of 10 mm × 10 mm, these sampling configurations correspond to approximate point spacings of 0.42 mm, 0.26 mm, 0.17 mm, 0.13 mm, and 0.10 mm, respectively. This range was selected to represent practical measurement conditions from coarse acquisition with limited spatial information to dense sampling suitable for detailed surface characterization.
The spatial resolution of the sampling directly affects the ability to capture local geometric features and influences numerical differentiation accuracy [42,54].
3.3. Measurement Noise Modeling
Measurement uncertainty was introduced by adding stochastic perturbations to the nominal surface points:
The error term was modeled as a three-dimensional random vector. The following noise models were considered:
(i) Isotropic Gaussian noise:
representing uniform sensor noise.
(ii) Anisotropic noise:
where is a diagonal covariance matrix with different variances along coordinate axes.
(iii) Systematic bias:
representing calibration or alignment errors.
The assumption of Gaussian noise is consistent with typical sensor behavior in coordinate and optical metrology; however, it should be noted that real measurement systems may exhibit non-Gaussian and spatially correlated errors.
These models reflect common uncertainty sources in coordinate and optical metrology systems [1,2,8]. The noise level was varied over a predefined range to simulate different measurement conditions.
3.4. Surface Reconstruction Method
The noisy point cloud was used to reconstruct the surface locally for curvature estimation. In this study, a quadratic polynomial approximation was employed due to its balance between computational efficiency and accuracy. Quadratic fitting was selected as a compromise between computational efficiency and the ability to capture second-order geometric behavior. Higher-order models may improve accuracy but increase sensitivity to noise and computational complexity.
For the reference simulations presented in this study, the surface geometry was represented by a regular grid consisting of 100 × 100 measurement points distributed over a 10 mm × 10 mm measurement area. Therefore, the original dataset contained a total of 10,000 discrete coordinate points with an approximate point spacing of 0.10 mm in both the x and y directions. This reference sampling configuration was selected to provide sufficient spatial resolution for accurate estimation of surface derivatives and curvature parameters.
The influence of lower sampling densities was investigated separately in Section 4.6, where the number of measurement points was systematically reduced to evaluate its effect on curvature uncertainty. The 100 × 100 grid was therefore considered as the reference configuration for all other numerical experiments.
For each point, a local neighborhood was defined, and the surface was approximated as (14).
The coefficients were estimated using least-squares fitting. This local approximation enables direct computation of first and second derivatives, which are required for curvature evaluation [11,55].
The size of the neighborhood was treated as a parameter influencing the trade-off between noise reduction and geometric fidelity.
3.5. Curvature Computation
Curvature values were computed from the reconstructed surface using standard differential geometric formulas. The Gaussian curvature and mean curvature were evaluated at each sampled point.
For numerical implementation, derivatives were obtained from the fitted polynomial coefficients, ensuring stability and consistency across simulation runs [53].
3.6. Monte Carlo Simulation Procedure
Uncertainty propagation was performed using repeated Monte Carlo simulations. The Monte Carlo method was selected due to the strongly nonlinear relationship between input variables (coordinates) and output quantities (curvature). Analytical uncertainty propagation is not feasible in this case, as the required sensitivity coefficients are difficult to derive and may not accurately represent the system behavior. For each configuration of surface type, noise level, and sampling density, the following procedure was executed:
- Generate nominal surface points.
- Add stochastic noise.
- Reconstruct the surface.
- Compute curvature values.
- Store results.
This procedure was repeated times (typically ) to obtain statistical distributions of curvature estimates as (17).
The number of Monte Carlo repetitions was selected based on a convergence analysis of the estimated statistical parameters. Preliminary simulations were performed with increasing numbers of realizations, and the evolution of the mean curvature estimate and the associated standard uncertainty was monitored. It was observed that for approximately 1000 iterations, further increasing the number of simulations produced only negligible changes in the estimated quantities. Therefore, M = 1000 was considered a suitable compromise between computational efficiency and statistical stability.
From these distributions, the following quantities were computed:
- Mean curvature estimate.
- Standard deviation (uncertainty).
- Bias relative to nominal curvature.
This approach is consistent with Monte Carlo uncertainty evaluation methods recommended in modern metrology [14,29].
It should be noted that the primary uncertainty propagation analysis was based on independent Gaussian coordinate perturbations applied to the nominal surface. For each simulation series, a fixed noise level was selected, and a new random realization of Gaussian noise was generated in each Monte Carlo iteration. The investigated noise levels ranged from 0 to 20 μm standard deviation, covering the typical uncertainty range of optical and coordinate measurement systems.
The realistic measurement scenario introduced in Section 4.8 (Application under Realistic Measurement Conditions) was treated separately. In this case, low-frequency form deviations, measurement drift, and spatially correlated disturbances were included as deterministic modifications of the nominal geometry. The Monte Carlo procedure was then performed by adding stochastic Gaussian perturbations to this realistic surface, allowing independent evaluation of random and systematic effects. The selected noise range was intended to represent measurement conditions from high-precision systems with sub-micrometer uncertainty to lower-accuracy optical or coordinate measurement scenarios where uncertainty may reach several tens of micrometers.
In addition to the standard uncertainty estimated from the Monte Carlo realizations, supplementary uncertainty descriptors were evaluated. These included the bias of the estimated curvature relative to the reference value, the root mean square error (RMSE), and the 95% coverage interval determined from the 2.5th and 97.5th percentiles of the simulated distribution. These additional metrics provide a more complete characterization of uncertainty, particularly when the resulting curvature distributions deviate from normality.
3.7. Performance Metrics
To quantify the accuracy and uncertainty of curvature estimation, the following metrics were used:
(i) Bias:
(ii) Standard uncertainty:
(iii) Root mean square error (RMSE):
These metrics allow simultaneous evaluation of systematic and random components of the estimation error [9,29].
3.8. Implementation Details
All simulations were implemented in MATLAB using custom scripts. Random number generation was controlled using fixed seeds to ensure reproducibility. Numerical differentiation and fitting procedures were validated against analytical curvature values for the nominal surfaces.
The computational framework was designed to allow flexible variation of parameters, including noise level, sampling density, and reconstruction settings. This flexibility enables systematic sensitivity analysis, which is presented in the following section.
4. Results and Analysis
4.1. Verification of Curvature Estimation Under Noise-Free Conditions
Prior to uncertainty analysis, the curvature estimation procedure was verified using noise-free data. A spherical surface patch was selected as a reference geometry due to its analytically known Gaussian curvature:
For the selected radius mm, the nominal Gaussian curvature is .
The curvature was estimated using local quadratic fitting, as described in Section 3. The objective of this step is to ensure that the numerical implementation correctly reproduces the theoretical curvature in the absence of measurement errors.
To illustrate the geometry used in the study, the nominal surfaces considered in the simulation are shown in Figure 1.
Figure 1.
Nominal surface geometries used in the numerical study: (a) spherical surface patch with constant positive Gaussian curvature, (b) cylindrical surface with zero Gaussian curvature and non-zero mean curvature, and (c) free-form surface with spatially varying curvature. The selected geometries represent different classes of surface form and provide a basis for evaluating the performance of curvature-based metrological analysis under controlled conditions.
The spherical surface (Figure 1a) serves as a reference case with constant positive Gaussian curvature, which allows direct comparison between analytical and estimated values. The cylindrical surface (Figure 1b) represents a special case with zero Gaussian curvature and non-zero mean curvature, providing a useful test for detecting anisotropic behavior in curvature estimation.
In contrast, the free-form surface (Figure 1c) exhibits spatially varying curvature, which better reflects real engineering components with complex geometry. This type of surface introduces additional challenges for curvature estimation, as both the magnitude and sign of curvature vary across the surface domain.
The combination of these three geometries enables a comprehensive evaluation of the proposed framework. Specifically, the spherical surface allows validation of accuracy under ideal conditions, the cylindrical surface highlights sensitivity to directional curvature properties, and the free-form surface provides a realistic scenario for assessing robustness under varying geometric conditions.
To further verify the correctness of the curvature estimation procedure, the Gaussian curvature map of the spherical surface was evaluated under noise-free conditions, as shown in Figure 2. The validation was performed using the nominal spherical surface shown in Figure 1a, since an ideal sphere provides a known analytical Gaussian curvature and therefore represents a suitable reference geometry for verifying the accuracy of the proposed numerical implementation.
Figure 2.
Gaussian curvature map obtained under ideal noise-free conditions for the nominal spherical surface presented in Figure 1a. The nearly uniform curvature distribution confirms the correctness of the proposed differential geometry-based curvature estimation algorithm in the absence of measurement disturbances.
The curvature values are nearly constant across the surface, which is consistent with the theoretical property of a sphere having uniform Gaussian curvature.
To quantitatively verify the accuracy of the proposed curvature estimation method under ideal conditions, the estimated Gaussian curvature values were compared with the analytical curvature of the nominal spherical surface. For a sphere with a radius of mm, the theoretical Gaussian curvature is mm−2.
The estimated mean Gaussian curvature was mm−2, resulting in a bias of only mm−2. The RMSE and maximum absolute error were mm−2 and mm−2, respectively, while the relative error remained below 0.05%. These results demonstrate that the local quadratic surface reconstruction and the implemented differential geometry-based curvature estimation algorithm provide highly accurate results in the absence of measurement disturbances.
The small residual errors can be attributed to numerical approximations associated with the finite sampling density and local polynomial fitting procedure rather than inaccuracies in the theoretical curvature model.
For the selected radius mm, the theoretical curvature is . The estimated curvature values shown in Figure 2 are in very good agreement with this value, confirming the correctness of the implemented curvature estimation procedure.
Small deviations from uniformity can be observed, particularly near the boundaries of the surface patch. These deviations are primarily caused by edge effects associated with the local quadratic fitting, where the neighborhood used for approximation becomes asymmetric. Such effects are expected and are commonly reported in discrete curvature estimation methods.
Overall, the results demonstrate that the proposed numerical framework is capable of accurately reproducing curvature values under ideal conditions. This verification step is essential, as it establishes a reliable baseline for subsequent analysis of uncertainty propagation under realistic measurement noise.
4.2. Influence of Measurement Noise on Curvature Estimation
After validation under ideal conditions, stochastic measurement noise was introduced into the surface coordinates to simulate realistic measurement scenarios. The noisy coordinates were generated according to:
where:
This step aims to analyze how coordinate-level uncertainty propagates to curvature estimates.
Following the verification under ideal conditions, the influence of measurement noise was investigated. To illustrate the effect of measurement noise on the surface geometry, Figure 3 shows a comparison between the nominal free-form surface and its noisy counterpart.
Figure 3.
Influence of simulated Gaussian coordinate noise ( for each coordinate direction) on the free-form surface geometry: (a) nominal surface; (b) perturbed surface. The introduced coordinate disturbances result in a three-dimensional RMS geometric deviation of .
The nominal surface (Figure 3a) exhibits a smooth spatial variation of height, while the noisy surface (Figure 3b) includes stochastic perturbations introduced independently in all coordinate directions.
To quantitatively evaluate the influence of simulated coordinate noise on the free-form surface geometry, the Euclidean distance between the nominal and perturbed coordinates was calculated. For the applied Gaussian coordinate noise with a standard deviation of in each coordinate direction, the root mean square (RMS) coordinate deviation was , while the mean and maximum deviations reached and , respectively.
The obtained RMS deviation corresponds well to the theoretical three-dimensional propagation of independent coordinate perturbations (), confirming the correctness of the implemented noise model. These results provide a quantitative description of the geometric disturbance introduced into the nominal free-form surface before the subsequent curvature estimation and uncertainty analysis.
At the selected noise level (), the overall shape of the surface remains visually almost unchanged. This observation is important, as it reflects a typical situation in dimensional metrology where measurement noise is small relative to the global geometry of the object. As a result, traditional visual inspection or global deviation metrics may suggest that the measurement quality is acceptable.
However, despite the minimal visual differences between the nominal and noisy surfaces, the introduced perturbations significantly affect local geometric properties. Since curvature estimation relies on second-order derivatives of the surface, even small coordinate fluctuations can lead to amplified variations in the estimated curvature values.
This behavior highlights a key limitation of conventional form evaluation approaches: small coordinate errors that appear negligible in terms of surface shape may still result in substantial uncertainty in curvature-based descriptors. Therefore, an explicit analysis of uncertainty propagation is necessary when curvature is used as a metrological parameter.
4.3. Monte Carlo-Based Uncertainty Propagation
To quantify the uncertainty associated with curvature estimation, a Monte Carlo simulation approach was employed. For each noise level, multiple realizations of the measurement process were generated, and curvature was estimated for each realization.
The mean curvature and its standard uncertainty were calculated as:
Additionally, the bias and root mean square error (RMSE) were evaluated:
To quantify the observed effects, a Monte Carlo-based uncertainty analysis was performed. The dependence of curvature uncertainty on the level of coordinate noise is presented in Figure 4.
Figure 4.
Standard uncertainty of Gaussian curvature as a function of coordinate noise standard deviation obtained from Monte Carlo simulation. The results demonstrate a nonlinear increase in curvature uncertainty with increasing measurement noise, highlighting the high sensitivity of curvature-based descriptors to coordinate perturbations.
The results were obtained using Monte Carlo simulation, where multiple realizations of noisy surface data were generated and processed through the curvature estimation procedure.
A clear increasing trend can be observed, indicating that the uncertainty of curvature estimation grows with the standard deviation of coordinate noise. Importantly, the relationship is not strictly linear, particularly at higher noise levels. This nonlinear behavior arises from the fact that curvature is computed from second-order derivatives of the surface, which amplify small perturbations in the input data.
The observed nonlinear increase in curvature error with increasing noise level can be explained by the mathematical nature of Gaussian curvature estimation. Unlike direct dimensional quantities, Gaussian curvature is derived from a nonlinear combination of first- and second-order surface derivatives. Consequently, small perturbations in the measured coordinates may be amplified during the numerical differentiation process, particularly in the estimation of second-order derivatives. As the noise level increases, the interaction between random coordinate perturbations and the nonlinear curvature formulation leads to a disproportionate growth of bias and uncertainty.
This behavior highlights a fundamental metrological difference between primary coordinate measurements and derived geometric descriptors. While coordinate uncertainty may increase approximately proportionally to measurement noise, curvature uncertainty exhibits a more complex nonlinear response due to the transformation of measured data into higher-order geometric quantities. The use of Monte Carlo simulation is therefore essential for capturing this nonlinear uncertainty propagation, since linear uncertainty propagation models based on sensitivity coefficients may not accurately describe the statistical behavior of curvature estimates at higher noise levels.
At low noise levels (below approximately 2 µm), the curvature uncertainty remains relatively small and increases gradually. However, as the noise level increases beyond this range, the uncertainty grows more rapidly, indicating reduced robustness of curvature estimation under higher measurement uncertainty.
These results confirm that curvature-based descriptors are significantly more sensitive to coordinate noise than primary measurements. This sensitivity must be carefully considered when using curvature as a metrological parameter, especially in applications requiring high precision.
The evolution of Gaussian curvature maps under increasing coordinate noise is illustrated in Figure 5. In the noise-free case (), the curvature distribution is uniform, as expected for a spherical surface.
Figure 5.
Gaussian curvature maps of the spherical surface for different levels of coordinate noise: , , , and . Increasing noise levels lead to progressive distortion of the curvature field, including loss of uniformity and emergence of local artifacts, demonstrating the high sensitivity of curvature estimation to measurement perturbations.
At low noise levels (), small fluctuations begin to appear in the curvature map. Although the overall structure remains recognizable, local variations become visible, indicating the onset of noise amplification through the curvature estimation process.
As the noise level increases to , the curvature map becomes significantly distorted. The originally uniform curvature field is replaced by irregular spatial variations, and localized peaks and depressions emerge. These artifacts do not correspond to the true geometry of the surface but are purely induced by measurement noise.
At higher noise levels (), the curvature map loses its physical interpretability. The distribution becomes highly irregular, and the underlying spherical geometry is no longer clearly identifiable. This indicates that curvature estimation becomes unstable when the measurement noise exceeds a certain threshold.
These results visually confirm the quantitative findings presented in Figure 4 and Figure 5. While coordinate noise may appear relatively small in absolute terms, its impact on curvature estimation is strongly amplified. The figure demonstrates that curvature-based descriptors can become unreliable even when the underlying surface geometry remains unchanged.
The corresponding bias and RMSE of curvature estimation are shown in Figure 6.
Figure 6.
Absolute bias and root mean square error (RMSE) of Gaussian curvature estimation as a function of coordinate noise standard deviation. Both systematic (bias) and total error (RMSE) increase with measurement noise, indicating the combined influence of random perturbations and nonlinear estimation effects.
Both quantities exhibit a clear increasing trend as the noise level rises, reflecting the growing impact of measurement uncertainty on curvature estimation accuracy.
At low noise levels, the bias remains relatively small, indicating that the estimation procedure is nearly unbiased under near-ideal conditions. However, as the noise increases, the bias becomes more pronounced, revealing the presence of systematic deviations introduced by the nonlinear nature of the curvature estimation process.
The RMSE follows a similar trend but consistently exceeds the absolute bias, as it incorporates both systematic and random components of the error. The close proximity of the RMSE and bias curves at higher noise levels suggests that systematic effects become dominant in this regime.
This behavior can be explained by the sensitivity of curvature estimation to higher-order variations in the surface geometry. The local quadratic fitting procedure, while effective under low-noise conditions, introduces smoothing and approximation effects that interact with measurement noise, leading to systematic distortion of the estimated curvature.
The results highlight that curvature estimation errors cannot be attributed solely to random measurement noise. Instead, they arise from a combination of stochastic perturbations and methodological limitations, emphasizing the importance of jointly analyzing bias and uncertainty when evaluating curvature-based metrological parameters.
4.4. Influence of Sampling Density
The influence of sampling density on curvature estimation was investigated by varying the number of points used to represent the surface. Several grid resolutions were considered, ranging from coarse to fine sampling.
In addition to noise level, the influence of data acquisition parameters was analyzed. The results of this analysis are presented in Figure 7.
Figure 7.
Influence of sampling density on the standard uncertainty of Gaussian curvature estimation for a fixed coordinate noise level (). Contrary to intuitive expectations, the results show an increase in curvature uncertainty with higher sampling density, indicating enhanced sensitivity to measurement noise.
For this analysis, the coordinate noise level was kept constant (), while the number of sampled points was varied.
Contrary to the typical expectation that increasing the number of measurement points improves accuracy, the results show that the standard uncertainty of Gaussian curvature increases with sampling density. This behavior can be explained by the nature of curvature estimation, which relies on second-order derivatives of the reconstructed surface.
As the sampling density increases, more measurement points are introduced within a fixed surface area. While this improves the geometric resolution, it also increases the number of noise-affected data points contributing to the local fitting process. Since curvature estimation amplifies high-frequency variations, the additional noisy points lead to increased variability in the estimated curvature.
Furthermore, the local quadratic fitting procedure operates on a fixed neighborhood size. As the point density increases, the spatial extent of the fitting window effectively decreases, making the estimation more sensitive to local noise fluctuations. This effect results in higher variance in curvature estimates despite the increased number of data points.
These results demonstrate that, in curvature-based metrology, increasing sampling density does not necessarily lead to improved measurement performance. Instead, an optimal balance between spatial resolution and noise sensitivity must be achieved.
4.5. Influence of Local Fitting Window Size
The size of the local fitting window plays a crucial role in curvature estimation. A smaller window preserves local geometric details but increases sensitivity to noise, whereas a larger window reduces noise effects but introduces smoothing bias.
The effect of the fitting window size on curvature estimation accuracy and uncertainty is illustrated in Figure 8.
Figure 8.
Influence of the local fitting window size ( neighboring points) used for local quadratic surface reconstruction on the absolute bias, standard uncertainty, and RMSE of Gaussian curvature estimation. Increasing the window size reduces both systematic and random errors, indicating improved stability of curvature estimation.
The analysis was performed for a fixed coordinate noise level of , while the size of the neighborhood used for local quadratic fitting was varied.
The results show a strong dependence of curvature estimation quality on the window size. For small window sizes, both the bias and RMSE are significantly higher, indicating poor stability of the estimation process. This behavior can be attributed to the insufficient number of points used in the local approximation, which makes the estimation highly sensitive to measurement noise.
As the window size increases, all error components—absolute bias, standard uncertainty, and RMSE—decrease substantially. This indicates that larger fitting neighborhoods effectively suppress the influence of random noise by averaging over a greater number of data points.
The fitting window size represents the number of neighboring points used for local quadratic reconstruction. For example, a window size of 5 corresponds to a 5 × 5 local neighborhood (25 points), whereas a window size of 13 corresponds to a 13 × 13 neighborhood (169 points).
However, the improvement is not unlimited. At larger window sizes, the rate of error reduction decreases, suggesting diminishing returns. In practical applications, excessively large windows may introduce smoothing effects that distort local geometric features, although this effect is not dominant in the present case.
The results demonstrate that the selection of the local fitting window size represents a critical trade-off between noise suppression and geometric fidelity. An appropriately chosen window size can significantly improve the robustness of curvature estimation without introducing excessive smoothing.
4.6. Comparison with Conventional Form Deviation
To assess the practical relevance of curvature-based analysis, the results were compared with a conventional form deviation metric based on point-to-nominal distances:
The comparison between mean point deviation and curvature uncertainty is shown in Figure 9.
Figure 9.
Comparison between conventional mean point deviation and standard uncertainty of Gaussian curvature as a function of coordinate noise standard deviation. While the mean point deviation increases approximately linearly with noise, the curvature uncertainty exhibits a more pronounced nonlinear growth, reflecting the higher sensitivity of curvature-based descriptors to measurement perturbations.
The mean point deviation represents a standard metric in dimensional metrology, describing the average geometric discrepancy between measured and nominal surfaces. In contrast, the standard uncertainty of Gaussian curvature reflects the stability of local geometric features derived from the measured data.
As shown in Figure 8, the mean point deviation increases approximately linearly with the coordinate noise standard deviation. This behavior is expected, as point-wise deviations directly reflect the magnitude of measurement noise.
In contrast, the uncertainty of Gaussian curvature exhibits a steeper and nonlinear increase. This difference arises from the fact that curvature estimation involves second-order derivatives of the surface, which amplify small variations in the input data. As a result, even moderate coordinate noise can lead to disproportionately large uncertainty in curvature.
This comparison highlights a fundamental limitation of conventional deviation-based metrics: while they effectively quantify global geometric errors, they do not capture the instability of higher-order geometric descriptors. In practical terms, a surface may exhibit acceptable deviation values while still having highly uncertain curvature estimates.
The results demonstrate that curvature-based analysis provides complementary information that is not accessible through standard deviation metrics. However, this additional sensitivity also requires careful treatment of uncertainty, particularly in high-precision applications.
4.7. Distribution of Curvature Estimates
Finally, the statistical distribution of curvature estimates obtained from Monte Carlo simulation was analyzed. This analysis is important because the nonlinear transformation from coordinates to curvature may result in non-Gaussian output distributions.
The visual evolution of curvature maps complements the quantitative analysis by illustrating the spatial manifestation of uncertainty. The probability distribution of estimated Gaussian curvature is shown in Figure 10.
Figure 10.
Monte Carlo distribution of estimated mean Gaussian curvature for the spherical surface at a coordinate noise level of . The dashed line indicates the nominal curvature value. The distribution exhibits noticeable asymmetry and deviation from normality, reflecting the nonlinear nature of curvature estimation.
The analysis was performed for a coordinate noise level of , where the effects of uncertainty propagation are more pronounced.
The distribution of curvature estimates is clearly centered away from the nominal value, indicating the presence of systematic bias. This observation is consistent with the results presented in Figure 5, where bias increases with noise level.
Moreover, the shape of the distribution deviates from ideal normality. A slight asymmetry and spread toward lower curvature values can be observed, suggesting that the transformation from coordinate space to curvature space introduces nonlinear effects. These effects distort the statistical properties of the output variable, even when the input noise is normally distributed.
This result has important implications for uncertainty evaluation. Standard approaches based on the assumption of normality, such as the conventional GUM framework with a fixed coverage factor, may not be fully adequate for curvature-based measurements. Instead, Monte Carlo simulation provides a more reliable representation of the uncertainty by directly capturing the actual distribution of the estimated parameter.
The results confirm that curvature estimation is not only sensitive to measurement noise but also alters the statistical structure of the measurement outcome. Therefore, distribution-based methods should be preferred when evaluating uncertainty in curvature-related metrological applications.
4.8. Summary of Results
The numerical analysis demonstrates that curvature-based surface form evaluation provides detailed information about local geometry but is highly sensitive to measurement noise. The main findings can be summarized as follows:
- Curvature uncertainty increases nonlinearly with coordinate measurement noise.
- Sampling density improves estimation stability but with diminishing returns.
- The size of the local fitting window significantly affects both bias and uncertainty.
- Curvature-based metrics capture local geometric features not reflected in conventional deviation measures.
- Monte Carlo simulation is an effective tool for uncertainty propagation in nonlinear geometric problems.
These results confirm that curvature-based approaches can enhance form metrology, provided that uncertainty is explicitly evaluated and controlled.
4.9. Application Under Realistic Measurement Conditions
To demonstrate the applicability of the proposed framework beyond idealized conditions, an extended simulation scenario representative of real measurement systems was considered.
In practical metrology, measured surface data are affected not only by random noise but also by systematic effects such as form deviations, drift, and spatially correlated disturbances. To account for these factors, the nominal surface was modified by introducing a combination of low-frequency form error and spatially varying perturbations, simulating typical behavior observed in coordinate and optical measurement systems.
The resulting dataset represents a realistic measurement scenario, where both random and systematic components of uncertainty are present. The same reconstruction and curvature estimation procedures described in Section 3 were applied to this dataset.
Figure 11 shows the resulting curvature map for the realistic measurement case. Compared to the idealized simulation, the curvature field exhibits increased variability and local distortions, reflecting the combined influence of measurement noise and systematic effects.
Figure 11.
Surface geometry and corresponding Gaussian curvature map under realistic measurement conditions: (a) realistic surface geometry with height expressed in mm; (b) Gaussian curvature map , where both the vertical axis and color scale represent curvature values in . The simulated data include low-frequency form deviation, measurement drift, and spatially correlated noise.
The left subplot shows the simulated surface geometry, which incorporates low-frequency form deviations, drift, and spatially correlated noise. Despite these perturbations, the surface remains smooth and visually consistent with typical measured geometries encountered in practice.
In contrast, the corresponding Gaussian curvature map (right subplot) exhibits significantly higher variability and pronounced local fluctuations. These variations do not directly reflect the underlying surface shape but are largely induced by the combined influence of measurement noise and systematic effects.
This behavior confirms that curvature estimation acts as a noise-amplifying transformation, where even moderate disturbances in the measured coordinates result in substantial variations in the estimated curvature field. The presence of spatially correlated noise further introduces structured patterns in the curvature map, which may be misinterpreted as actual geometric features.
The comparison between the surface geometry and the curvature map highlights a key metrological challenge: while the primary measurement data appear stable and physically meaningful, derived quantities such as curvature may become highly unstable and sensitive to measurement conditions.
These results are consistent with the trends observed in the idealized simulations and demonstrate that the proposed framework remains valid under realistic measurement conditions. The findings confirm that explicit uncertainty evaluation is essential when using curvature-based descriptors in practical metrology applications.
To evaluate uncertainty, Monte Carlo simulations were performed by superimposing stochastic perturbations consistent with expected measurement uncertainty levels. The resulting distribution of curvature values was used to estimate standard uncertainty and bias. The resulting distribution of mean Gaussian curvature is shown in Figure 12.
Figure 12.
Monte Carlo distribution of mean Gaussian curvature under realistic measurement conditions. The dataset includes low-frequency form deviation, measurement drift, spatially correlated disturbance, and stochastic coordinate noise. The distribution illustrates the variability of curvature estimation when both systematic and random effects are present.
The distribution exhibits a noticeable spread, reflecting the combined influence of both random and systematic measurement effects. The estimated mean curvature is −1.85 × 10⁻² mm−2, while the corresponding standard uncertainty is 1.57 × 10⁻³ mm−2.
The shape of the distribution is approximately unimodal but exhibits slight asymmetry, indicating that the transformation from coordinate space to curvature space introduces nonlinear effects. These effects lead to deviations from ideal Gaussian behavior, even when the input noise is assumed to be normally distributed.
The results confirm that curvature estimation under realistic measurement conditions remains highly sensitive to perturbations in the measured coordinates. In particular, the observed variability demonstrates that uncertainty in curvature cannot be reliably inferred from coordinate-level uncertainty alone.
This analysis further supports the use of Monte Carlo simulation for uncertainty evaluation in curvature-based measurements, as it provides a direct representation of the statistical behavior of the estimated parameter under realistic conditions. It is important to note that the magnitude of the uncertainty is not negligible compared to the estimated curvature value, which may significantly affect the interpretation of local geometric features.
The results confirm that the key trends identified in the idealized simulations remain valid under realistic conditions. Curvature estimation remains highly sensitive to measurement perturbations, and the uncertainty is significantly amplified compared to primary coordinate measurements.
This case study demonstrates that the proposed framework is applicable to realistic measurement scenarios and can be used as a practical tool for uncertainty evaluation in curvature-based surface metrology, even in the presence of complex measurement effects.
5. Discussion
The results presented in Section 4 provide a comprehensive view of how measurement uncertainty propagates in curvature-based surface form evaluation. In contrast to conventional distance-based metrological parameters, curvature represents a higher-order geometric descriptor, inherently linked to second-order derivatives of the surface. This fundamental difference explains the strong sensitivity of curvature estimation to measurement noise observed in the numerical analysis.
One of the key findings of this study is the nonlinear amplification of coordinate noise during curvature estimation. While coordinate perturbations remain relatively small in absolute terms, their impact on curvature uncertainty increases disproportionately (Figure 4). This behavior is consistent with theoretical expectations, as differentiation acts as a high-pass operator, amplifying high-frequency components of the signal, including noise. Similar observations have been reported in computational geometry and surface reconstruction literature, where curvature estimation from discrete data is known to be highly sensitive to noise and discretization effects [53,54].
The visual analysis of curvature maps (Figure 5) further demonstrates that even moderate levels of measurement noise can significantly distort the geometric interpretation of a surface. Importantly, these distortions are not easily detectable through conventional inspection methods, as the overall surface shape may still appear visually correct (Figure 3). This discrepancy highlights a critical limitation of traditional form metrology: global deviation metrics may fail to capture local geometric instability.
Another important observation is the presence of systematic bias in curvature estimation (Figure 6). The increase in bias with noise level indicates that curvature estimation is not only affected by random uncertainty but also by nonlinear transformation effects and reconstruction artifacts. This finding is particularly relevant for metrological traceability, as systematic deviations cannot be reduced by repeated measurements alone and must be explicitly modeled or compensated.
The influence of sampling density (Figure 7) reveals a counterintuitive effect: increasing the number of measurement points does not necessarily improve the reliability of curvature estimation. Instead, higher sampling density leads to increased sensitivity to noise, as more noisy points contribute to the estimation of second-order derivatives. This result contrasts with common assumptions in coordinate metrology, where denser sampling is typically associated with improved accuracy [7,11]. The discrepancy arises from the fundamentally different nature of curvature as a derived quantity.
In contrast, the size of the local fitting window (Figure 8) plays a stabilizing role in curvature estimation. Larger neighborhoods reduce both bias and variance by effectively averaging out noise. However, this improvement introduces a trade-off between noise suppression and geometric fidelity. From a metrological perspective, the fitting window size can be interpreted as a regularization parameter that controls the balance between variance reduction and bias introduction. This interpretation aligns with similar concepts in signal processing and statistical estimation.
The comparison with conventional deviation-based metrics (Figure 9) provides a key insight into the limitations of traditional form evaluation approaches. While point-wise deviations increase approximately linearly with noise, curvature uncertainty exhibits a significantly stronger and nonlinear response. This indicates that curvature-based descriptors capture aspects of geometric stability that are not reflected in standard deviation metrics. In practical terms, a surface may satisfy tolerance requirements based on deviation criteria while still exhibiting unreliable curvature estimates.
The analysis of Monte Carlo distributions (Figure 10) highlights another important aspect: the non-Gaussian nature of curvature uncertainty. Despite the assumption of Gaussian input noise, the resulting distribution of curvature estimates exhibits asymmetry and bias. This finding confirms that classical uncertainty evaluation methods based on linear propagation and normal distribution assumptions (GUM framework) may not be sufficient for curvature-based measurements. Instead, simulation-based approaches, such as those recommended in GUM Supplement 1, provide a more accurate representation of uncertainty in nonlinear measurement models [14,29].
The observed asymmetry of several curvature distributions further supports the use of percentile-based uncertainty intervals in addition to standard deviation. Such descriptors do not rely on the assumption of normality and therefore provide a more robust representation of uncertainty for nonlinear geometric quantities.
From a metrological standpoint, these results indicate that curvature cannot be treated as a simple extension of coordinate measurements. Instead, it must be considered as a derived quantity with fundamentally different uncertainty characteristics.
From a practical metrology perspective, this implies that curvature-based parameters cannot be used as standalone indicators without accompanying uncertainty information. In contrast to conventional geometric tolerancing, where measurement uncertainty is often small relative to tolerance limits, curvature uncertainty may represent a significant fraction of the measured value.
Therefore, decision-making processes based on curvature (e.g., defect detection, functional surface assessment, or quality control) must incorporate uncertainty-aware criteria. This requirement aligns with modern approaches in metrology, where uncertainty is treated as an integral part of the measurement result rather than an auxiliary parameter.
From a broader perspective, the results of this study emphasize the need for a paradigm shift in surface form metrology when curvature-based descriptors are used. Traditional approaches, which rely on linear models and global deviation metrics, are not adequate for capturing the complexity of uncertainty propagation in nonlinear geometric quantities. The integration of differential geometry with numerical uncertainty evaluation offers a more complete framework for analyzing surface form.
This observation is particularly relevant in the context of ISO GPS standards, where form evaluation is primarily based on distance-related criteria. The integration of curvature-based descriptors would require an extension of current uncertainty evaluation methodologies.
The findings are consistent with recent trends in advanced metrology, where increasing attention is being given to the characterization of complex geometries and the role of uncertainty in measurement interpretation [23,39]. However, the explicit combination of curvature-based analysis with Monte Carlo uncertainty propagation remains relatively unexplored, particularly in the context of dimensional metrology standards.
A key outcome of this study is the confirmation that the identified uncertainty propagation mechanisms remain valid under realistic measurement conditions. The extended case study presented in Section 4 demonstrates that even when the measured surface appears geometrically stable, curvature estimation exhibits significant variability and bias.
In particular, the Monte Carlo analysis performed under realistic conditions showed that the standard uncertainty of Gaussian curvature is not negligible compared to its estimated value. This indicates that curvature-based descriptors may lead to ambiguous or unreliable interpretation of local surface features if uncertainty is not explicitly evaluated.
These findings highlight that the practical application of curvature in dimensional metrology requires not only accurate measurement systems but also robust uncertainty evaluation frameworks capable of capturing nonlinear effects and systematic influences.
Several limitations of the present study should be acknowledged. First, the analysis is primarily based on simulated data, which, although designed to reflect realistic measurement conditions, cannot fully capture all complexities of real measurement systems. In particular, spatial correlation of measurement errors, probe–surface interaction effects, and instrument-specific characteristics were not explicitly modeled.
Second, the study focuses on quadratic surface reconstruction, which represents a compromise between accuracy and robustness. Alternative reconstruction methods, such as spline-based or moving least squares approaches, may exhibit different sensitivity to noise and should be investigated in future work.
Third, the realistic measurement scenario, while incorporating systematic and stochastic effects, remains a controlled simulation. Experimental validation using real measurement systems is therefore necessary to confirm the quantitative findings and assess their applicability in industrial practice.
Finally, it should be noted that the present study is based on numerical simulation. While the simulation framework allows controlled investigation of uncertainty propagation, real measurement systems may introduce additional complexities, such as spatially correlated noise, systematic calibration errors, and instrument-specific effects. Therefore, future work should focus on experimental validation of the proposed approach using real measurement data and different types of measurement systems.
Overall, the results of this study demonstrate that curvature-based surface characterization introduces a fundamentally different uncertainty behavior compared to conventional metrological parameters. This difference is not merely quantitative but structural, as it arises from the nonlinear transformation between measured coordinates and derived geometric quantities. As such, curvature should be treated as a high-sensitivity descriptor requiring dedicated uncertainty evaluation strategies.
6. Conclusions
This study investigated the propagation of measurement uncertainty in curvature-based surface form evaluation using a numerical simulation framework grounded in differential geometry and Monte Carlo methods. By combining geometric modeling, stochastic measurement simulation, and local surface reconstruction, the work provides a systematic analysis of how coordinate-level errors affect curvature estimation.
The results demonstrate that curvature-based descriptors are significantly more sensitive to measurement noise than conventional deviation-based metrics. In particular, curvature uncertainty increases nonlinearly with coordinate noise, and even small perturbations in measured points can lead to substantial variability in estimated curvature values. This behavior is a direct consequence of the second-order nature of curvature, which amplifies high-frequency components of measurement noise.
It was further shown that curvature estimation is affected not only by random uncertainty but also by systematic bias arising from nonlinear transformation and reconstruction procedures. The presence of non-Gaussian output distributions highlights the limitations of classical uncertainty evaluation methods based on linear propagation and normality assumptions.
The analysis of sampling strategies revealed that increasing point density does not necessarily improve estimation reliability, as higher sampling density can increase sensitivity to noise. In contrast, the size of the local fitting window plays a critical role in stabilizing curvature estimation, acting as an implicit regularization parameter that balances noise suppression and geometric fidelity.
The comparison with conventional form deviation metrics demonstrated that curvature-based analysis provides complementary information about local geometric stability, which is not captured by global deviation measures. This finding underscores the potential of curvature as an advanced descriptor in surface metrology, particularly for applications involving complex geometries and functional surface behavior.
Overall, the study highlights the necessity of explicit uncertainty evaluation when using curvature-based descriptors in metrology. The proposed simulation-based framework offers a practical approach for analyzing uncertainty propagation in nonlinear geometric measurements and can be extended to other surface characterization problems.
The presented results contribute to the development of more reliable and physically meaningful surface characterization methods and support the future integration of curvature-based descriptors into advanced metrological practice.
Although the proposed framework was validated through extensive numerical simulations covering various surface geometries, noise levels, sampling strategies, and realistic measurement scenarios, the present study remains a simulation-based investigation. Future research will focus on experimental validation using actual measurement data obtained from coordinate measuring machines (CMMs), optical 3D scanners, and other surface metrology systems. Such experimental studies will enable the evaluation of additional practical factors, including instrument-specific error sources, environmental influences, and measurement strategy effects, further extending the applicability of the proposed differential geometry-based uncertainty framework to industrial metrology.
Future work should focus on experimental validation of the presented methodology using real measurement systems, as well as the investigation of more complex error models, including spatially correlated noise and instrument-specific effects. In addition, the integration of curvature-based metrics into existing metrological standards represents an important direction for further research.
Author Contributions
Conceptualization, D.M.; Software, D.M.; Validation, D.M.; Formal analysis, D.M.; Investigation, D.M., T.K. and M.K.; Resources, T.K.; Data curation, T.K.; Writing—review and editing, M.K.; Supervision, T.K. and M.K.; Project administration, M.K. All authors have read and agreed to the published version of the manuscript.
Funding
The authors would like to thank the Slovak Grant Agency—project VEGA 1/0191/24, and project KEGA 004TUKE-4/2024.
Institutional Review Board Statement
Not applicable.
Informed Consent Statement
Not applicable.
Data Availability Statement
The original contributions presented in this study are included in the article. Further inquiries can be directed to the corresponding author.
Conflicts of Interest
The authors declare no conflicts of interest.
References
- Leach, R. Fundamental Principles of Engineering Nanometrology; Elsevier: Amsterdam, The Netherlands, 2010. [Google Scholar] [CrossRef] [Scilit] [PubMed]
- Haitjema, H. Task specific uncertainty estimation in dimensional metrology. Int. J. Precis. Technol. 2011, 2, 226. [Google Scholar] [CrossRef] [Scilit]
- ISO 10360-1:2000; Geometrical Product Specifications (GPS)—Acceptance and Reverification Tests for Coordinate Measuring Machines (CMM). ISO: Geneva, Switzerland, 2000.
- ISO 14253-1:2017; Geometrical Product Specifications (GPS)—Inspection by Measurement of Workpieces and Measuring Equipment Part 1: Decision Rules for Verifying Conformity or Nonconformity with Specifications. ISO: Geneva, Switzerland, 2017.
- ISO 25178-6:2010; Geometrical Product Specifications (GPS)—Surface Texture: Areal Part 6: Classification of Methods for Measuring Surface Texture. ISO: Geneva, Switzerland, 2010.
- ISO 1101:2017; Geometrical Product Specifications (GPS)—Geometrical Tolerancing. ISO: Geneva, Switzerland, 2017.
- Weckenmann, A.; Eitzert, H.; Garmer, M.; Weber, H. Functionality-oriented evaluation and sampling strategy in coordinate metrology. Precis. Eng. 1995, 17, 244–252. [Google Scholar] [CrossRef] [Scilit]
- Schwenke, H.; Knapp, W.; Haitjema, H.; Weckenmann, A.; Schmitt, R.; Delbressine, F. Geometric error measurement and compensation of machines—An update. CIRP Ann. 2008, 57, 660–675. [Google Scholar] [CrossRef] [Scilit]
- Forbes, A.B. Least squares best fit geometric elements. In NPL Report DITC 140/89; National Physical Laboratory: London, UK, 1990; pp. 311–319. [Google Scholar] [CrossRef] [Scilit]
- Mathia, T.G.; Pawlus, P.; Wieczorowski, M. Recent trends in surface metrology. Wear 2010, 271, 494–508. [Google Scholar] [CrossRef] [Scilit]
- Summerhays, K.D.; Henke, R.P.; Baldwin, J.M.; Cassou, R.M.; Brown, C.W. Optimizing discrete point sample patterns and measurement data analysis on internal cylindrical surfaces with systematic form deviations. Precis. Eng. 2002, 26, 105–121. [Google Scholar] [CrossRef] [Scilit]
- Franaszek, M.; Cheok, G.S. Orientation uncertainty characteristics of some pose measuring systems. Math. Probl. Eng. 2017, 2017, 2696108. [Google Scholar] [CrossRef] [Scilit] [PubMed]
- JCGM 100:2008; Evaluation of Measurement Data—Guide to the Expression of Uncertainty in Measurement. BIPM: Paris, France, 2008.
- JCGM 101:2008; Evaluation of Measurement Data—Supplement 1 to the “Guide to the Expression of Uncertainty in Measurement”—Propagation of Distributions Using a Monte Carlo Method. BIPM: Paris, France, 2008.
- JCGM 102:2011; Evaluation of Measurement Data—Supplement 2 to the “Guide to the Expression of Uncertainty in Measurement”—Extension to any Number of Output Quantities. BIPM: Paris, France, 2011.
- Carmo, M.P.D. Differential Geometry of Curves and Surfaces: Revised and Updated Second Edition; Courier Dover Publications: New York, NY, USA, 2016. [Google Scholar]
- O’Neill, B. Elementary Differential Geometry; Academic Press: Cambridge, MA, USA, 2006. [Google Scholar]
- Gray, A. Modern Differential Geometry of Curves and Surfaces; CRC Press: Boca Raton, FL, USA, 1993. [Google Scholar]
- Pressley, A. Elementary Differential Geometry; Springer Nature: Dordrecht, The Netherlands, 2010. [Google Scholar] [CrossRef] [Scilit] [PubMed]
- Walker, A.G.E. Kreyszig, Differential Geometry (Mathematical Expositions No. 11, Toronto, and Oxford University Press, 1959), pp. xiv + 352, 48s. Proc. Edinb. Math. Soc. 1961, 12, 164–165. [CrossRef] [Scilit]
- Spivak, M. A Comprehensive Introduction to Differential Geometry; Publish or Perish: Melbourne, Australia, 1999. [Google Scholar]
- Struik, D.J. Lectures on Classical Differential Geometry; Courier Corporation: North Chelmsford, MA, USA, 1961. [Google Scholar]
- Shen, Y.; Ren, J.; Huang, N.; Zhang, Y.; Zhang, X.; Zhu, L. Surface form inspection with contact coordinate measurement: A review. Int. J. Extrem. Manuf. 2023, 5, 022006. [Google Scholar] [CrossRef] [Scilit]
- Schmitt, R.H.; Peterek, M.; Morse, E.; Knapp, W.; Galetto, M.; Härtig, F.; Goch, G.; Hughes, B.; Forbes, A.; Estler, W.T. Advances in Large-Scale Metrology—Review and future trends. CIRP Ann. 2016, 65, 643–665. [Google Scholar] [CrossRef] [Scilit]
- Muralikrishnan, B.; Stone, J.A.; Stoup, J.R. Area measurement of knife-edge and cylindrical apertures using ultra-low force contact fibre probe on a CMM. Metrologia 2008, 45, 281–289. [Google Scholar] [CrossRef] [Scilit]
- Carmignato, S.; Savio, E. Metrological performance verification of coordinate measuring systems with optical distance sensors. Int. J. Precis. Technol. 2011, 2, 153. [Google Scholar] [CrossRef] [Scilit]
- Rajamohan, G.; Shunmugam, M.; Samuel, G.L. Effect of probe size and measurement strategies on assessment of freeform profile deviations using coordinate measuring machine. Measurement 2011, 44, 832–841. [Google Scholar] [CrossRef] [Scilit]
- Savio, E.; De Chiffre, L.; Schmitt, R. Metrology of freeform shaped parts. CIRP Ann. 2007, 56, 810–835. [Google Scholar] [CrossRef] [Scilit]
- Cox, M.; Harris, P.; Siebert, B.R.-l. Evaluation of measurement uncertainty based on the propagation of distributions using Monte Carlo simulation. Meas. Tech. 2003, 46, 824–833. [Google Scholar] [CrossRef] [Scilit]
- Willink, R. On using the Monte Carlo method to calculate uncertainty intervals. Metrologia 2006, 43, L39–L42. [Google Scholar] [CrossRef] [Scilit]
- Possolo, A. Measurement uncertainty redefined. Metrologia 2025, 62, 042101. [Google Scholar] [CrossRef] [Scilit]
- Schmelter, S.; Fortmeier, I.; Heißelmann, D. Metrology for Virtual Measuring Instruments Illustrated by Three Applications. Metrology 2025, 5, 54. [Google Scholar] [CrossRef] [Scilit]
- Ortlepp, I.; Eisele, S.; Treptow, K.; Rühle, J.; Pruß, C.; Haist, T.; Reichelt, S.; Sawodny, O.; Manske, E.; Kissinger, T. Enhanced Vectorial Measurement Uncertainty Model. Metrology 2025, 5, 19. [Google Scholar] [CrossRef] [Scilit]
- Pavese, F.; Forbes, A.B. Data Modeling for Metrology and Testing in Measurement Science; Springer Nature: Dordrecht, The Netherlands, 2008; p. 34. [Google Scholar] [CrossRef] [Scilit]
- Jiang, X.Q.; Blunt, L.; Stout, K.J. Development of a lifting wavelet representation for surface characterization. Proc. R. Soc. A Math. Phys. Eng. Sci. 2000, 456, 2283–2313. [Google Scholar] [CrossRef] [Scilit]
- Leach, R. Optical Measurement of Surface Topography; Springer Nature: Dordrecht, The Netherlands, 2011. [Google Scholar] [CrossRef] [Scilit]
- Wolf, G.W. Scale independent surface characterisation: Geography meets precision surface metrology. Precis. Eng. 2016, 49, 456–480. [Google Scholar] [CrossRef] [Scilit]
- Pawlus, P.; Reizer, R.; Wieczorowski, M. A review of methods of random surface topography modeling. Tribol. Int. 2020, 152, 106530. [Google Scholar] [CrossRef] [Scilit]
- Vorburger, T.V.; Hocken, R.J. Measurements of Roughness of very Smooth Surfaces 1 1Contribution of the U. S. National Bureau of Standards, not subject to copyright, except for Figures 2–10 and 15, reprinted with permission from other sources. CIRP Ann. 1987, 36, 503–509. [Google Scholar] [CrossRef] [Scilit]
- Taubin, G. Estimating the tensor of curvature of a surface from a polyhedral approximation. In Proceedings of the IEEE International Conference on Computer Vision, Cambridge, MA, USA, 20–23 June 1995; IEEE: Cambridge, MA, USA, 2002; pp. 902–907. [Google Scholar] [CrossRef] [Scilit]
- Meyer, M.; Desbrun, M.; Schröder, P.; Barr, A.H. Discrete Differential-Geometry Operators for triangulated 2-Manifolds. In Mathematics and Visualization; Springer: Berlin/Heidelberg, Germany, 2003; pp. 35–57. [Google Scholar] [CrossRef] [Scilit]
- Rusinkiewicz, S. Estimating curvatures and their derivatives on triangle meshes. In Proceedings of the 2nd International Symposium on 3D Data Processing, Visualization and Transmission, 2004. 3DPVT 2004, Thessaloniki, Greece, 9 September 2004; pp. 486–493. [Google Scholar] [CrossRef] [Scilit]
- Crosilla, F.; Visintini, D.; Sepic, F. Reliable automatic classification and segmentation of laser point clouds by statistical analysis of surface curvature values. Appl. Geomat. 2009, 1, 17–30. [Google Scholar] [CrossRef] [Scilit]
- ISO 25178-605:2025; Geometrical Product Specifications (GPS)—Surface Texture: Areal—Part 605: Design and Characteristics of Non-Contact (Point Autofocus Probe) Instruments. ISO: Geneva, Switzerland, 2025.
- ISO 21920-2021; Geometrical Product Specifications (GPS)—Surface Texture: Profile. ISO: Geneva, Switzerland, 2021.
- O’Neill, B. Elementary Differential Geometry; Academic Press: Cambridge, MA, USA, 2014. [Google Scholar]
- Kreyszig, E. Differential Geometry; Courier Corporation: North Chelmsford, MA, USA, 2013. [Google Scholar]
- Blateyron, F. Characterisation of Areal Surface Texture; Springer Nature: Dordrecht, The Netherlands, 2024. [Google Scholar] [CrossRef] [Scilit]
- Moreau, C.; Lemesle, J.; Páez Margarit, D.; Blateyron, F.; Bigerelle, M. A Statistical Approach for Characterizing the Behaviour of Roughness Parameters Measured by a Multi-Physics Instrument on Ground Surface Topographies: Four Novel Indicators. Metrology 2024, 4, 640–672. [Google Scholar] [CrossRef] [Scilit]
- Klein, J.; Zachmann, G. Point cloud surfaces using geometric proximity graphs. Comput. Graph. 2004, 28, 839–850. [Google Scholar] [CrossRef] [Scilit]
- Schöch, A.; Savio, E. High-Speed measurement of complex shaped parts by laser triangulation for In-Line inspection. In Precision Manufacturing; Springer: Singapore, 2019; pp. 307–328. [Google Scholar] [CrossRef] [Scilit]
- De Chiffre, L.; Lonardo, P.; Trumpold, H.; Lucca, D.A.; Goch, G.; Brown, C.A.; Raja, J.; Hansen, H.N. Quantitative characterisation of surface texture. CIRP Ann. 2000, 49, 635–652. [Google Scholar] [CrossRef] [Scilit]
- Cohen-Steiner, D.; Morvan, J. Approximation of the Curvature Measures of a Smooth Surface endowed with a Mesh; HAL (Le Centre Pour La Communication Scientifique Directe): Bangalore, India, 2003. [Google Scholar]
- Hoppe, H.; DeRose, T.; Duchamp, T. Surface Reconstruction from Unorganized Points. In Proceedings of the ACM SIGGRAPH’92, Chicago, IL, USA, 27–31 July 1992; pp. 71–78. [Google Scholar]
- Alexa, M.; Behr, J.; Cohen-Or, D.; Fleishman, S.; Levin, D.; Silva, C.T. Computing and rendering point set surfaces. IEEE Trans. Vis. Comput. Graph. 2003, 9, 3–15. [Google Scholar] [CrossRef] [Scilit]
- Levin, D. The approximation power of moving least-squares. Math. Comput. 1998, 67, 1517–1531. [Google Scholar] [CrossRef] [Scilit]
- Dey, T.K. Curve and Surface Reconstruction: Algorithms with Mathematical Analysis; Cambridge University Press (CUP): Cambridge, UK, 2006. [Google Scholar] [CrossRef] [Scilit]
- Kazhdan, M.; Bolitho, M.; Hoppe, H. Poisson Surface Reconstruction. In Eurographics Symposium on Geometry Processing; The Eurographics Association: Eindhoven, The Netherlands, 2006. [Google Scholar]
- Metropolis, N.; Ulam, S. The Monte Carlo method. J. Am. Stat. Assoc. 1949, 44, 335–341. [Google Scholar] [CrossRef] [PubMed]
- Fishman, G.S. Monte Carlo; Springer Nature: Dordrecht, The Netherlands, 1996. [Google Scholar] [CrossRef] [Scilit]
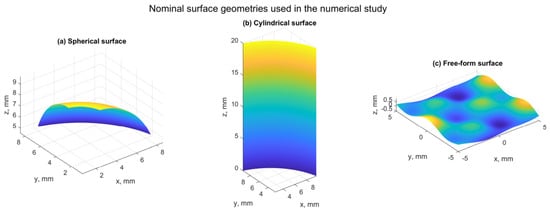
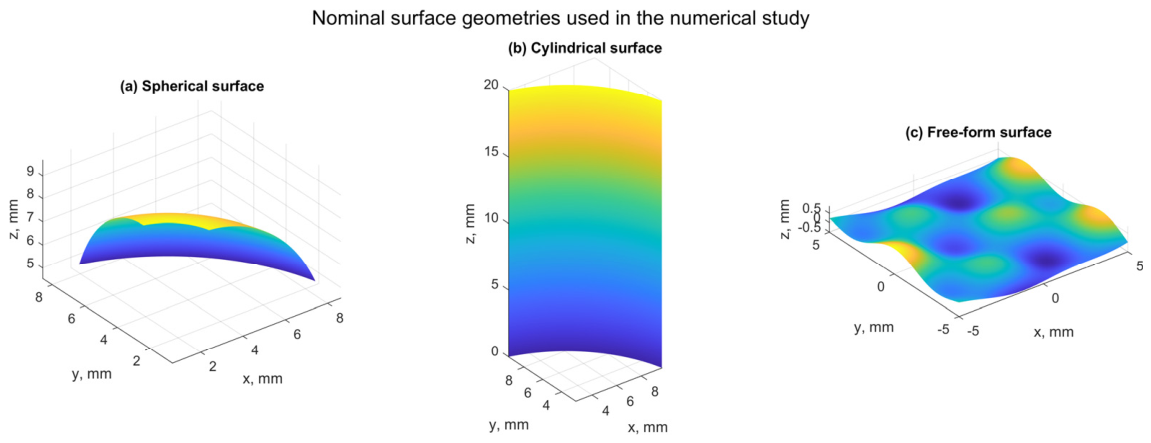
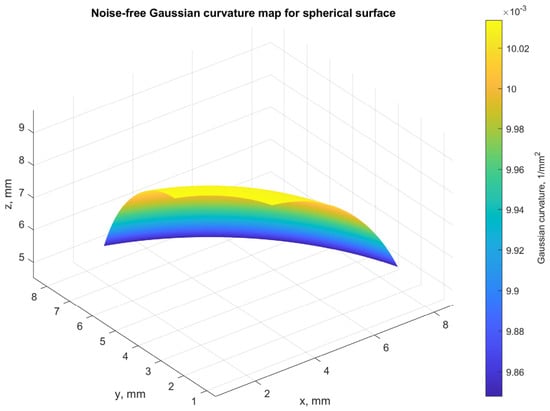
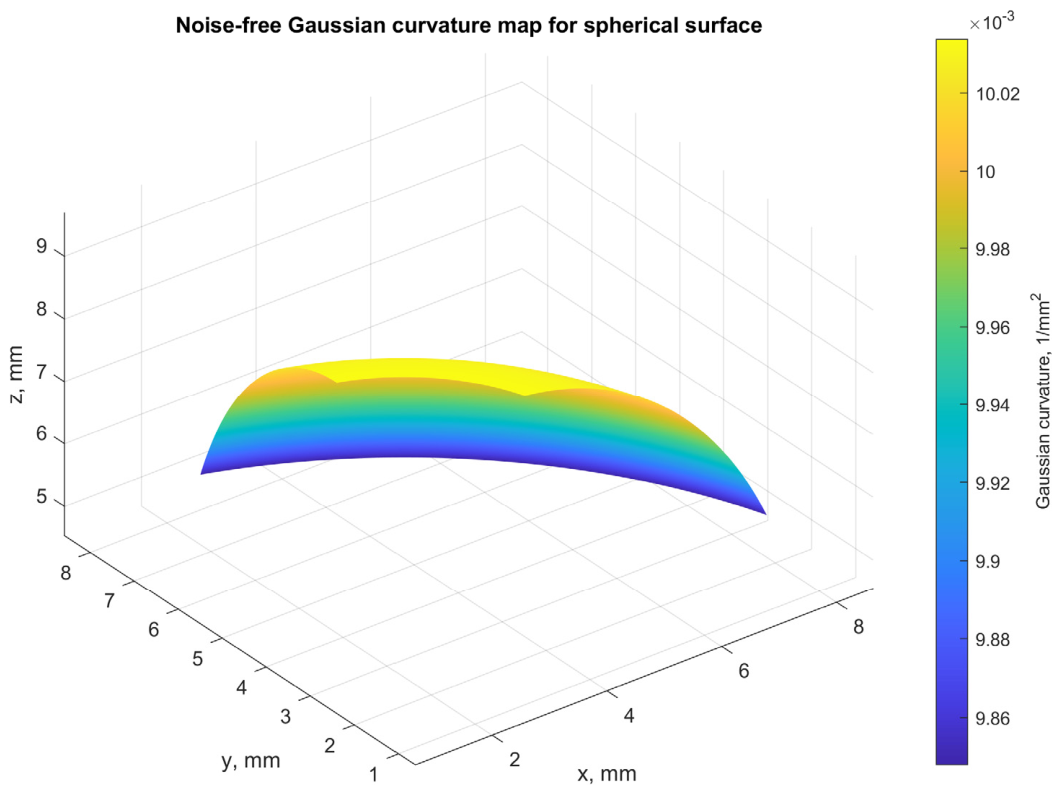
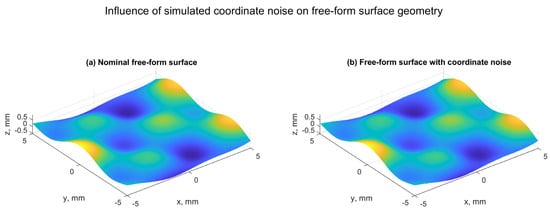
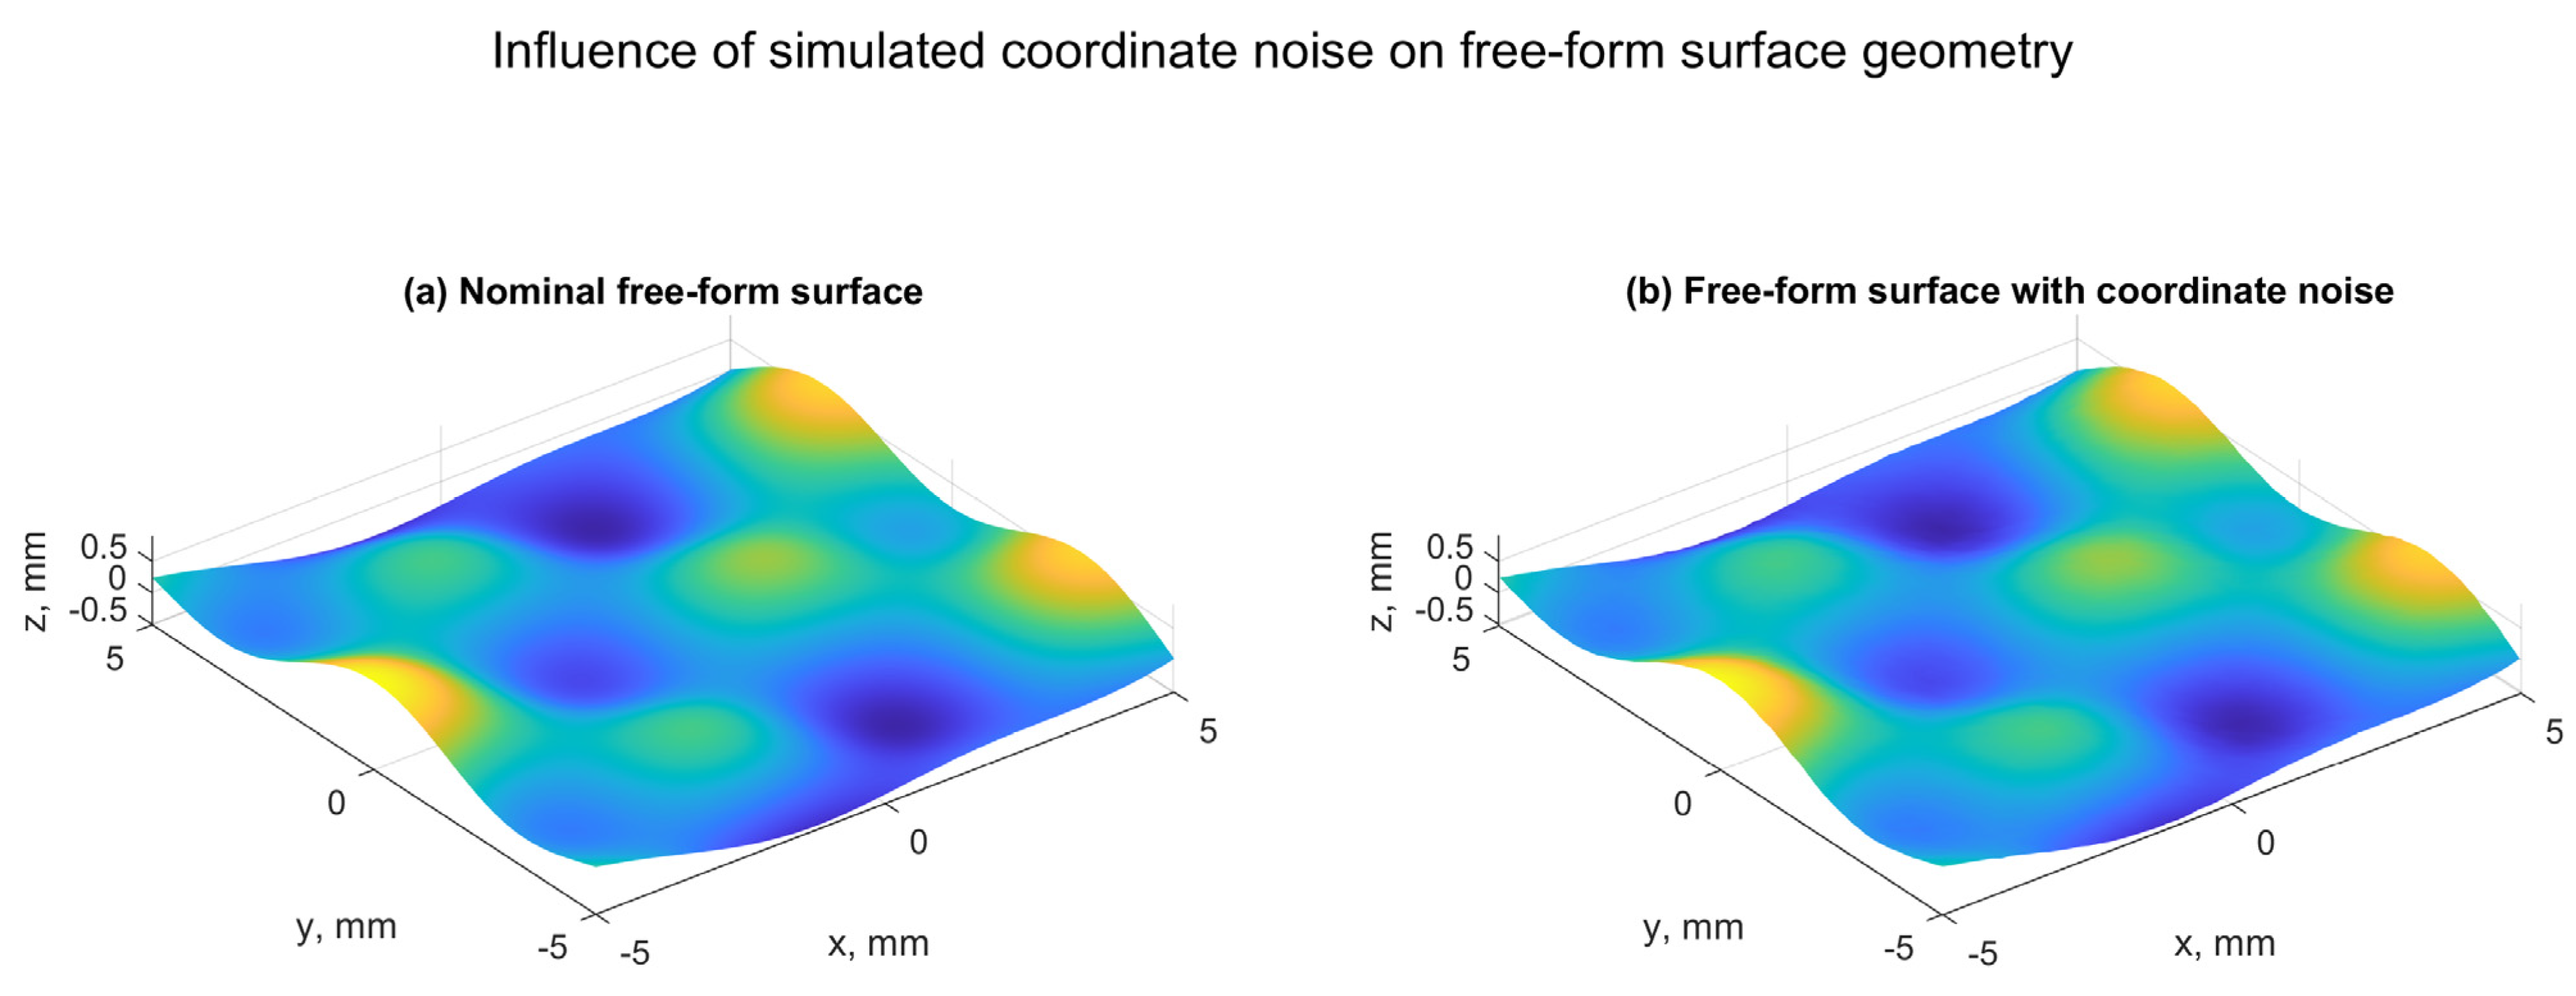
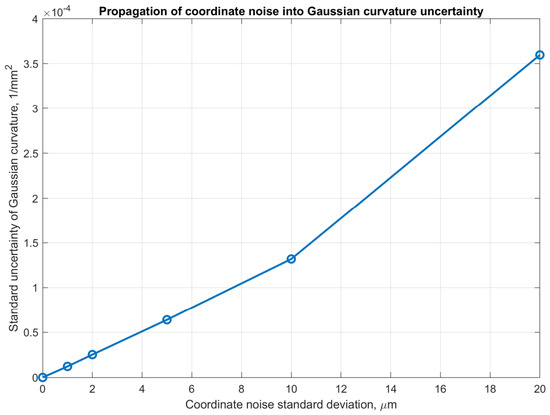
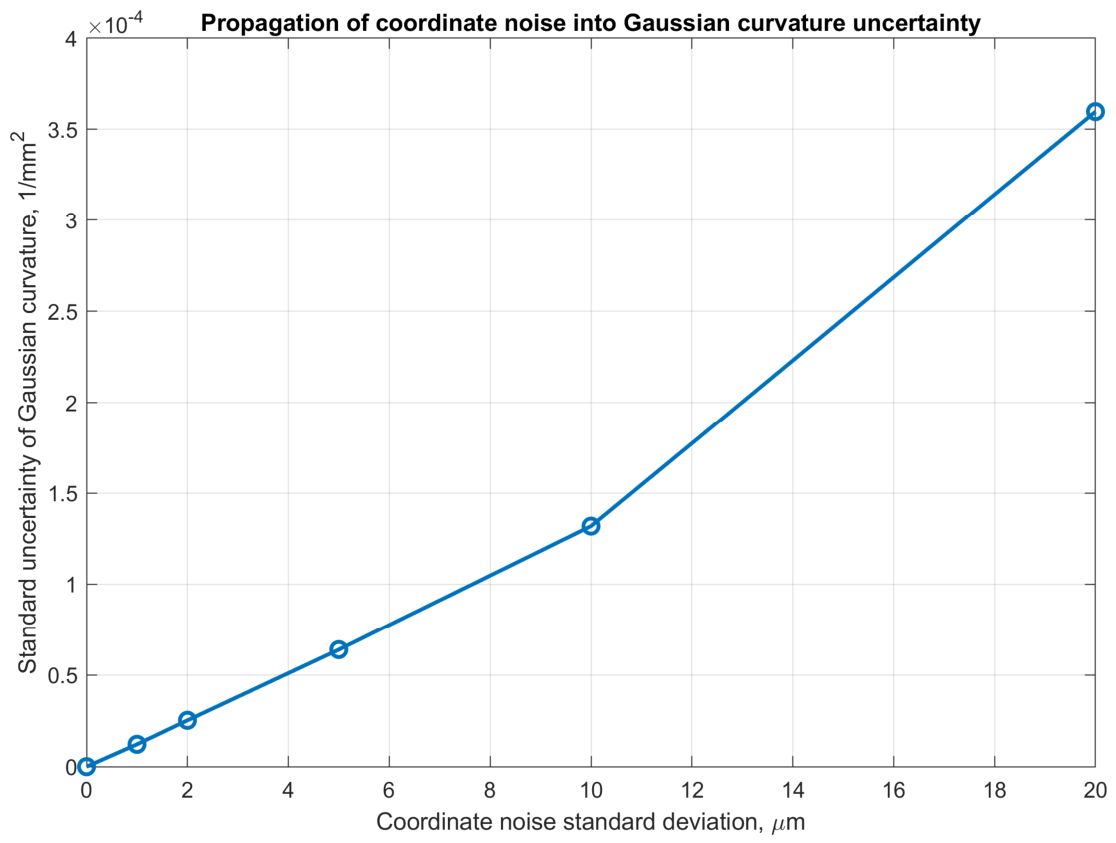
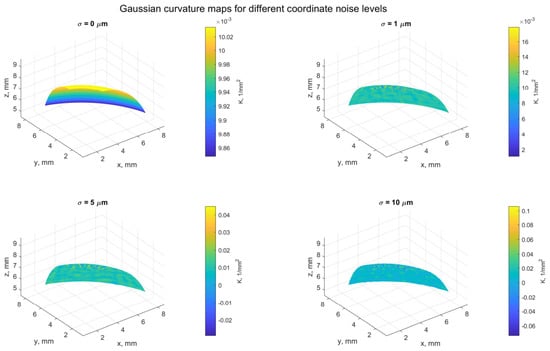
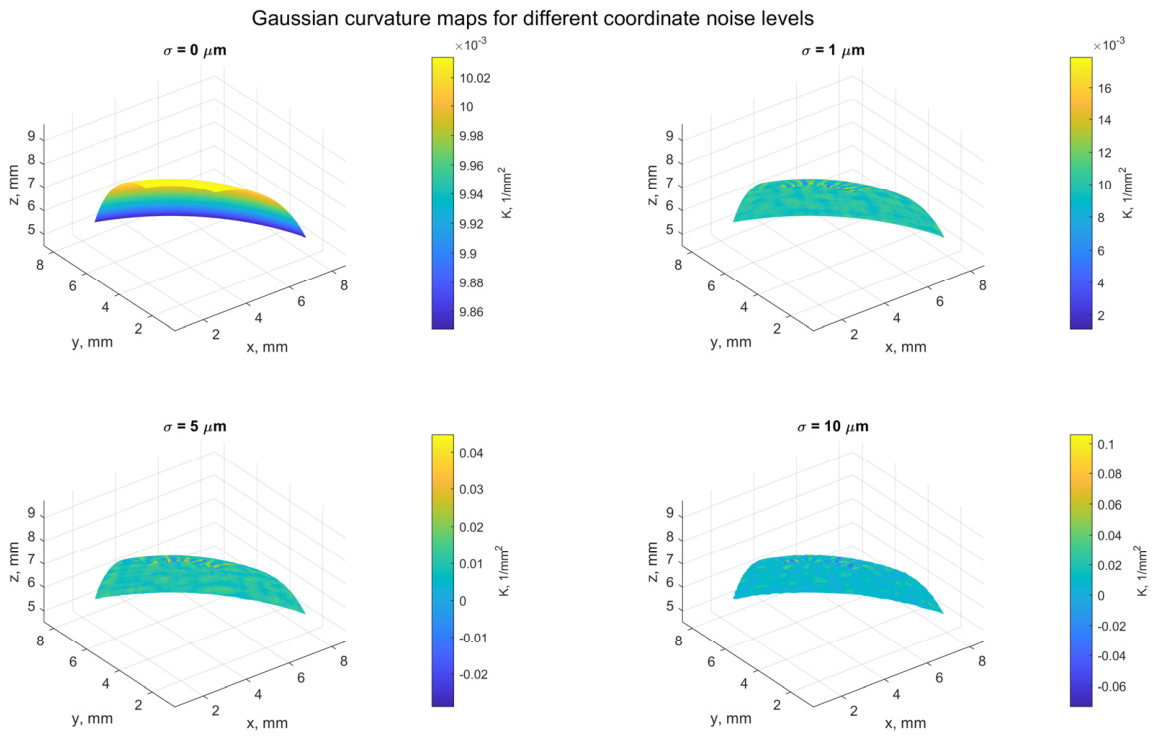
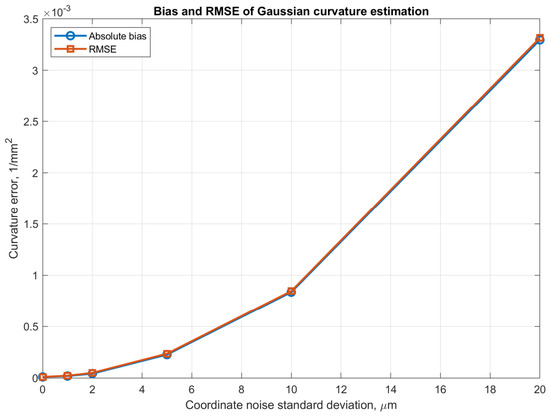
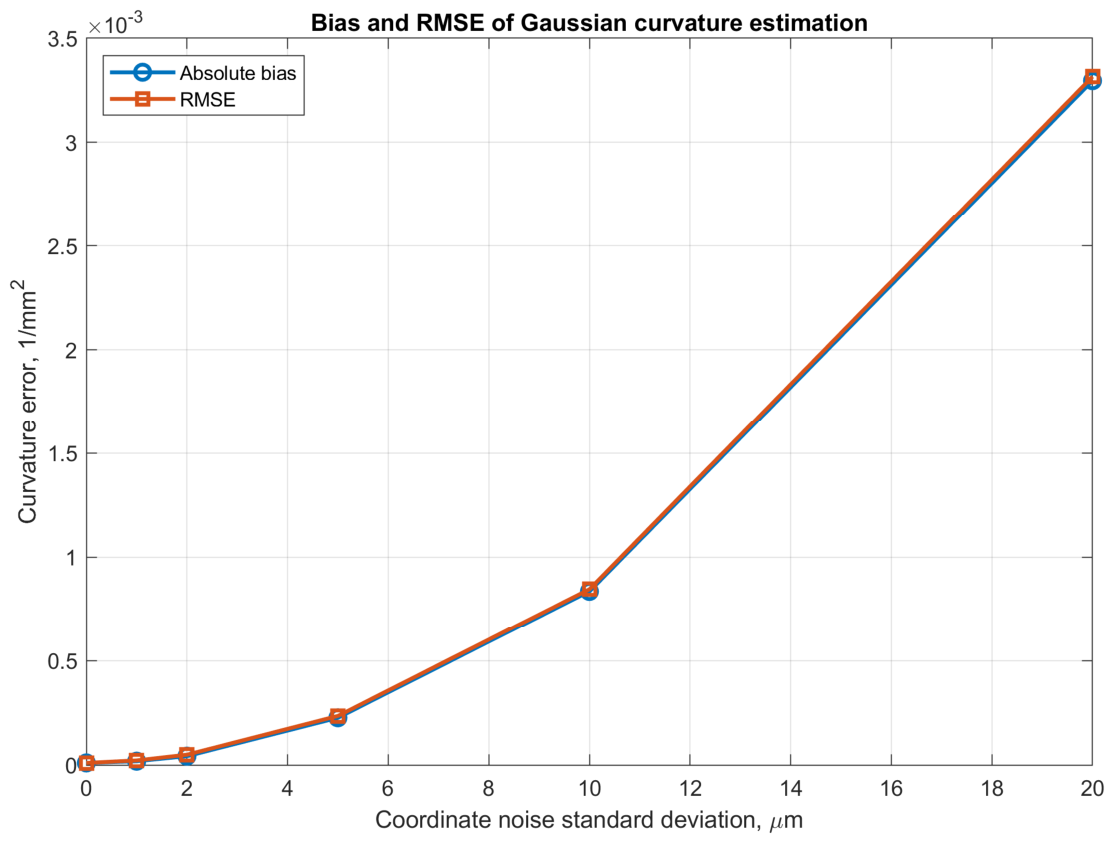
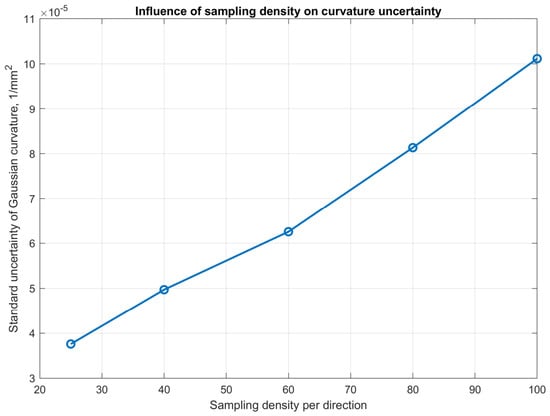
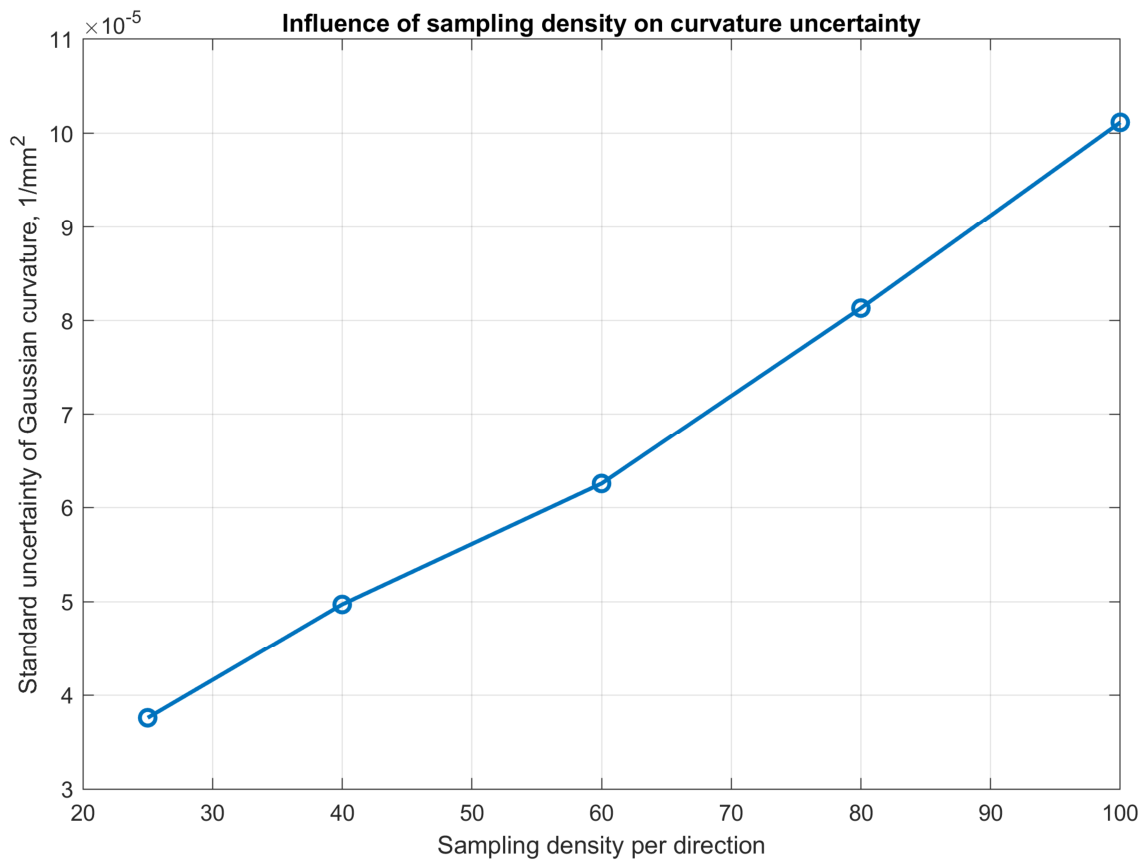
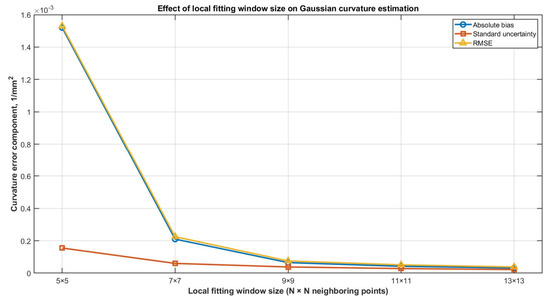
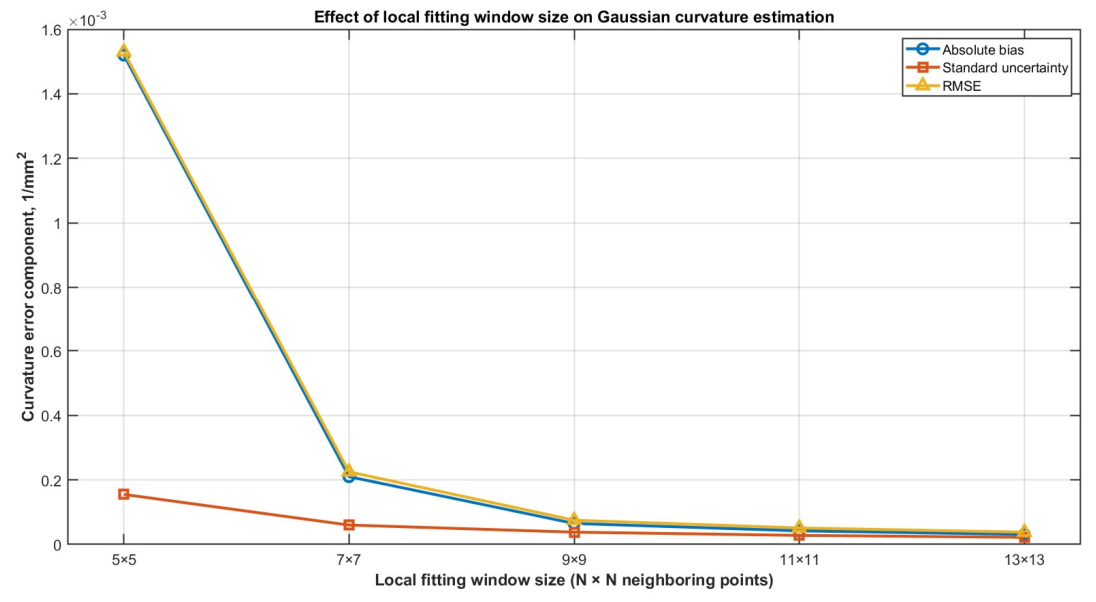
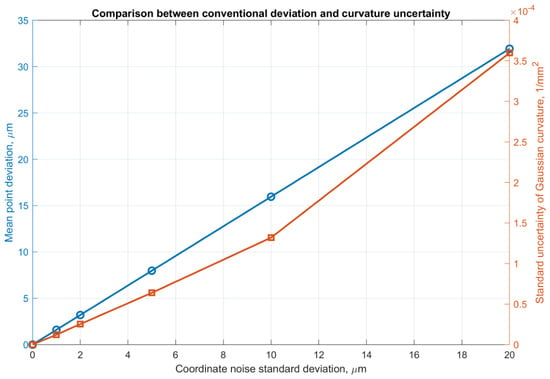
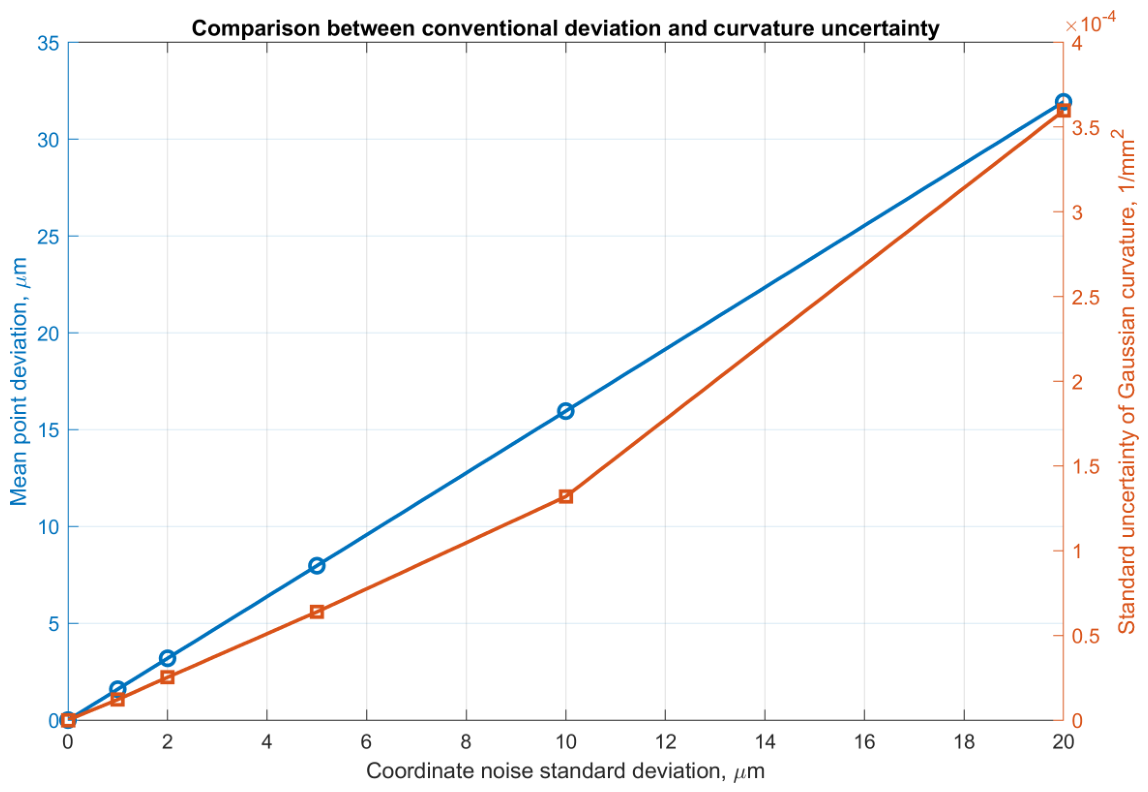
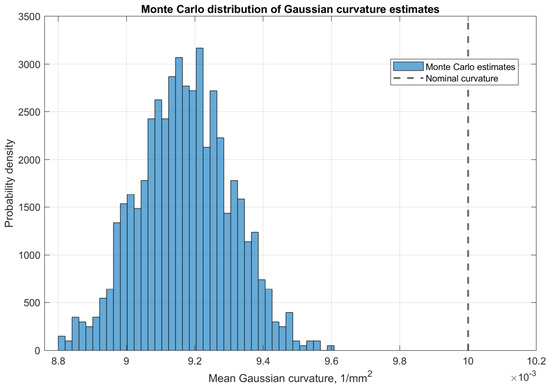
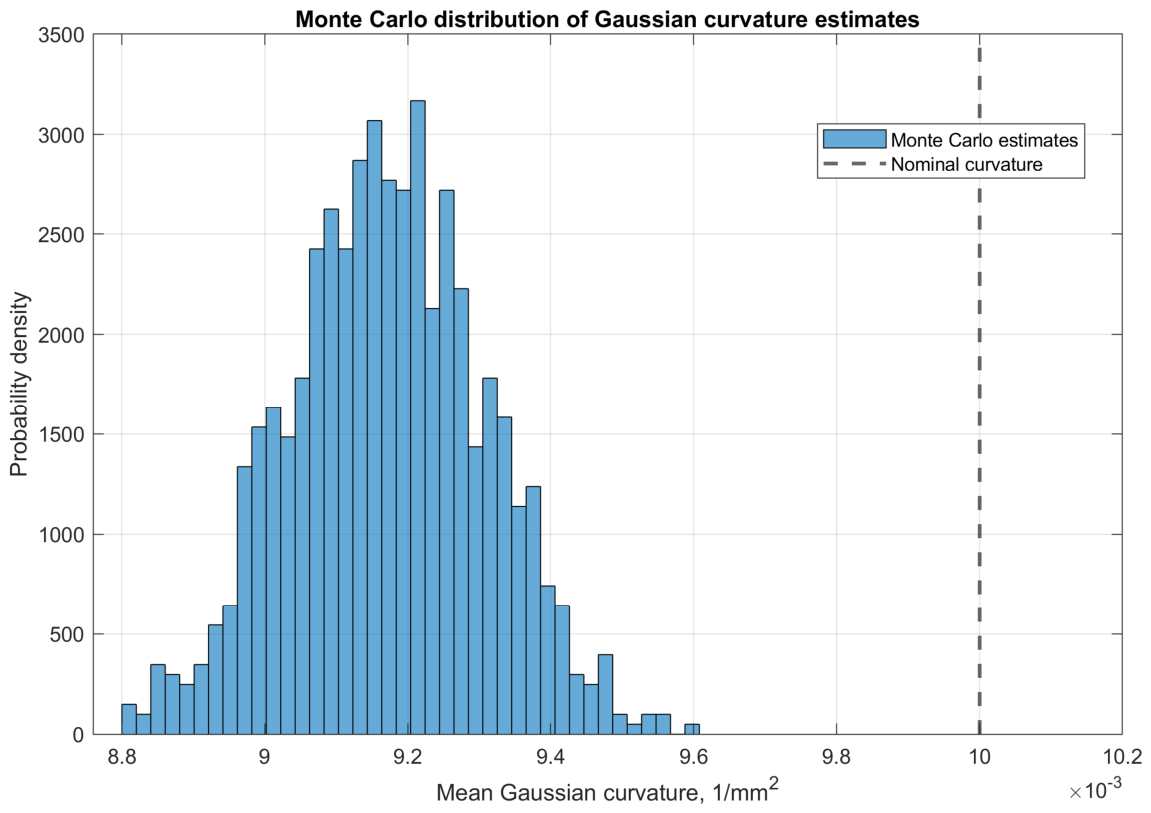
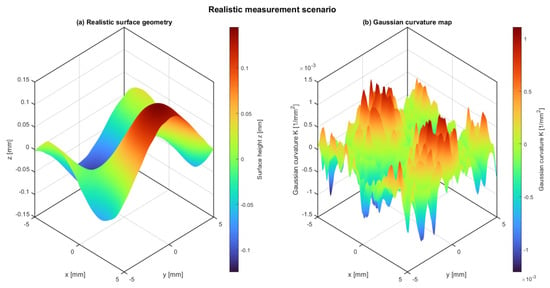
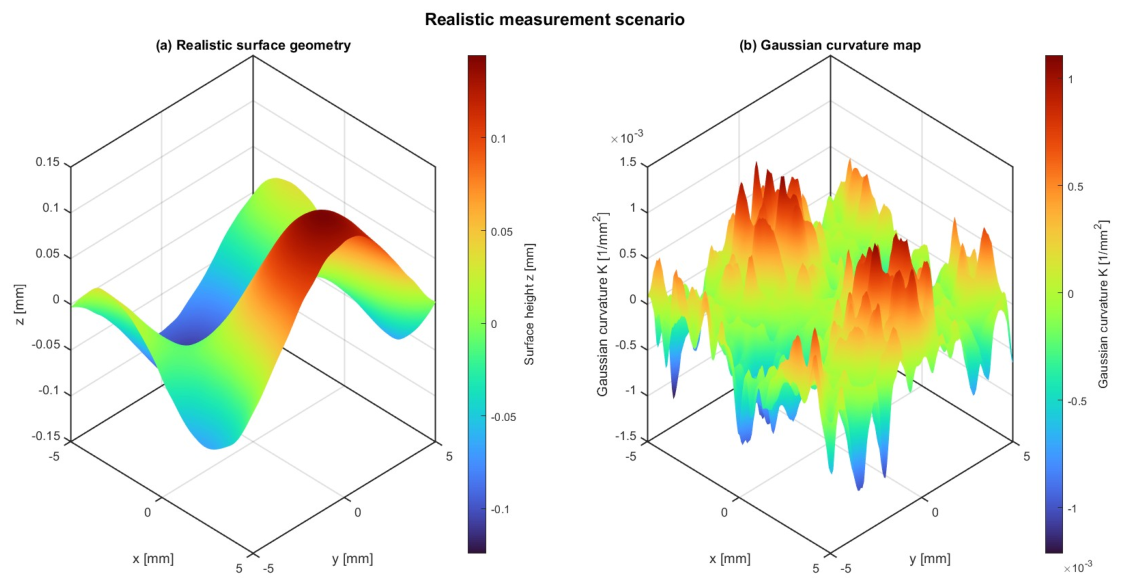
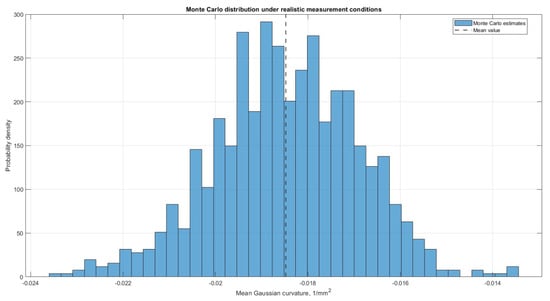
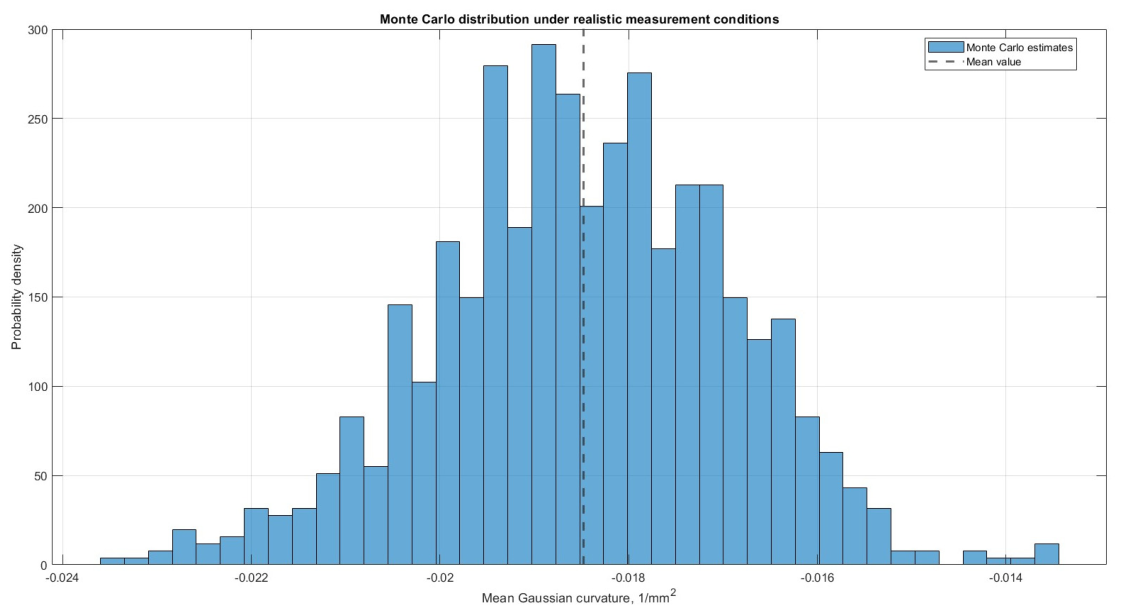
Disclaimer/Publisher’s Note: The statements, opinions and data contained in all publications are solely those of the individual author(s) and contributor(s) and not of MDPI and/or the editor(s). MDPI and/or the editor(s) disclaim responsibility for any injury to people or property resulting from any ideas, methods, instructions or products referred to in the content. |
© 2026 by the authors. Licensee MDPI, Basel, Switzerland. This article is an open access article distributed under the terms and conditions of the Creative Commons Attribution (CC BY) license.