


Abstract
With the rise of Industry 4.0, digital manufacturing and smart measuring technologies are enabling the development of zero-defect manufacturing strategies, which leads to less material waste and lower energy consumption, moving from off-line metrology and dedicated measuring equipment to in-line measurements and automated inspection systems. This is especially important for the production and manufacturing of large-scale parts, because of the high component cost and long delivery cycle. However, establishing traceability for measurement systems is often complicated due to both the measurement technology and the objects being measured. Traceability of measurement in the manufacturing environment is not ensured yet, and uncertainty evaluation for in-process measurement remains a complex and active research challenge. This work introduces a new uncertainty modelling and evaluation framework for traceable measurement of the large-scale components in ‘shop floor’ conditions. The framework is verified using real data obtained from various instruments for in situ measurement of a large artefact. Experimental results demonstrate that uncertainty evaluation for large-scale metrology is crucial for precision manufacturing on the production floor. The methods can be extended to the evaluation of measurement uncertainty of components with a smaller size and off-line inspection.
1. Introduction
Industry 4.0 promotes a concept for the future development of industrial production [1], which has already started to change the manufacturing industry. Under such circumstances, the shift toward digitization is revolutionizing high-value manufacturing sectors [2]. Digital manufacturing and smart measuring technologies are enabling the development of zero-defect manufacturing strategies, which leads to less material waste and reduces energy consumption, moving from off-line metrology and dedicated measuring equipment to in-line measurements and automated inspection systems. In addition to ‘in-line’, the terms ‘on-machine’, ‘in-process’, ‘in situ’ and ‘in-line/on-line’ are frequently used to describe the condition of a measurement activity in manufacturing metrology. A detailed classification of these terms for surface measurement was introduced by Gao et al. [3].
On-machine/in-process inspection [4,5,6,7,8] is one of the promising approaches that offer the potential for measurement and error compensation during a sequence of machining operations. It can enable workpiece geometrical verification against the design and manufacturing standards to guarantee the designated tolerance of finished parts in the manufacturing process. This is particularly beneficial to large-scale high-value manufacturing, such as aerospace, nuclear, shipbuilding, and heavy machinery, where it is highly desirable to measure in situ or in-process [9]. The integrated measurement process can significantly reduce manufacturing time and cost, mitigate the risk of the component being damaged during transportation or incorrectly manufactured in the manufacturing process (achieving so called ‘zero-defect manufacturing’) [10], lead to less material waste and reduced energy consumption for sustainable manufacturing, and prevent personal safety-associated issues during transportation. However, the traceability of the measurement process in shop floor conditions is not ensured yet and measurement results are still not fully trustworthy for the process control or product validation [11]. Furthermore, uncertainty in coordinate measurement remains a complex, open research question.
2. Measurement Uncertainty Contributors
Previously, measurement solutions were generally employed for post-manufacturing inspection of a manufactured workpiece, which is typically carried out in an environmentally well-controlled metrology room, e.g., using a coordinate measuring machine (CMM), to determine whether the dimension parameters of the workpiece meet the designed requirements for the purpose of quality control of the workpiece [12]. In recent decades, due to innovations of measurement technologies, the role of metrology inside the manufacturing flow has significantly changed [13]. In-process/on-machine tool measurement is expected to be integrated into a holistic manufacturing system [14], from fast workpiece setup, machine geometry error monitoring, and in-process measurement for flexible manufacturing to post-process measurement for product validation.
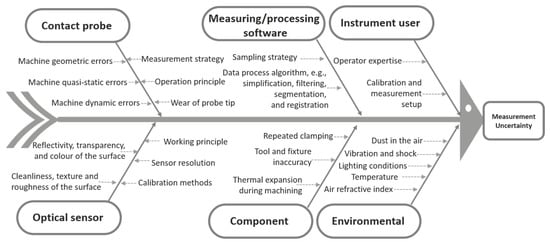
In general, there are two types of technologies that can be used for in-process/on-machine measurement: contact method and non-contact method [15]. The former is generally a contact probing system integrated into the machine tool head, while the latter generally refers to optical sensors which are usually independent measurement systems and offer non-contact, high-speed inspection, enabling real-time quality monitoring and faster production cycles. The measurement uncertainties on the shop floor are influenced by different factors, including measurement technologies, the objects being measured and the complex manufacturing environment, which can be displayed by an Ishikawa diagram [16] (Figure 1).
Figure 1.
Error contributors for the shop floor measurement.
For in-process measurement of large components, there are more factors to consider, such as the effect of inhomogeneous temperature distributions for large-scale parts, which could be more significant, and the part deformation caused by gravity, etc. The term large-scale metrology (LSM) or Large-Volume Metrology (LVM), as defined by Schmitt et al. [17], is the discipline concerned with the measurement of massive objects, typically ranging from one to hundreds of metres in linear dimension, in accordance with geometrical product specifications (GPSs).
For the tactile probing system on a machine tool, a key limitation is that the measuring system and machining processes suffer the same geometric errors, as both are performed using the same machine. Consequently, errors may not be detected by the measurement if the machine tool accuracy has not been verified [11]. As for LSM using optical technologies, multiple uncertainty contributors related to the shop floor conditions, such as temperature and humidity variation, the surface of the object being measured, vibrations, ambient light and air refractive index, are not fully understood yet [13,18,19]. In many cases, users choose instruments to measure features based on experience and parameters from brochures provided by the manufacturers. Therefore, such information does not give users enough confidence, especially when the measurements are performed in the harsh environmental conditions of the industrial shop floor.
3. Developments of LSM and Measurement Uncertainty Evaluation
The uncertainty evaluation approaches for coordinate measurements can be classified into two categories, based on whether the methods belong to published international standards or not.
3.1. International Standards
- (1)
- Calibrated artefact method
The first approach is based on ISO 15530-3 [20] and substitutes the workpiece with one or more calibrated reference artefacts, then evaluates the uncertainty by means of similarity between the dimension and shape of the workpiece and artefact. The manufacturing environment and measurement procedure shall be similar during calibration process and actual measurement in this case.
- (2)
- Numerical simulation method
The second approach introduced by ISO 15530-4 [21] to determine the task-specific uncertainty of coordinate measurements is based on a numerical simulation of the measurement process. This method considers uncertainty influences and assesses the influence quantities. The adaptive Monte Carlo method (MCM) [22] can be applied for the estimation of measurement uncertainty.
- (3)
- Uncertainty budget method
This type of method is based on the guide to the expression of uncertainty in measurement (GUM) [23] and VDI 2617-11 [24]. In this case, the evaluation is assessed using an uncertainty budget method where the budget comprises the uncertainty sources that affect the measurement process and the correlation between them.
The first approach is reliable for serial production and suitable for small- and medium-size components. However, it may be expensive and cumbersome for large components. The second and third methods require understanding of the significance of each uncertainty contributor, which is not guaranteed yet in shop floor conditions at present.
3.2. Other Research Work
Many researchers have worked towards measurement uncertainty evaluation and traceability. Estler et al. [25] reviewed developments in large-scale engineering metrology since the 1978 report of Puttock [26]. They described techniques for high-accuracy straightness measurement, precision levelling, and absolute distance metrology, together with approaches to compensate for the effects of atmospheric refraction. In addition, methods for uncertainty evaluation were also discussed and several illustrative examples were presented. Muelaner et al. [27] provided an overview of the important selection criteria for LSM. They introduced typical measurement processes and presented some novel selection strategies. And metrics that can be used to assess measurability were also discussed. Schmitt et al. [17] reviewed state-of-the-art technologies for LSM and the continuing evolution. They pointed out that measurements using a laser tracker for radial distances are usually much more accurate than angle measurements. This means that the uncertainties associated with distances cannot be summarized by a simple formula (as used for the case of CMMs), and the estimates of the target locations can exhibit strong statistical correlation. Wen et al. [28] established the mathematical model of flatness error minimum zone solution and proposed an improved genetic algorithm (IGA) to implement flatness error minimum zone evaluation. And flatness error uncertainty was evaluated using the GUM and MCM. Similarly, Wen et al. [29] introduced a method for the evaluation of measurement uncertainty of cylindricity error. The authors established the mathematical model of cylindricity error based on the minimum zone condition and proposed a quasi particle swarm optimization algorithm (QPSO) for finding the cylindricity error. Then, the MCM and GUM were exploited to estimate the uncertainty. Cuypers et al. [30] reviewed the development of optical measurement techniques for LSM. They concluded that three elements should be kept in mind—task requirements, part restrictions and environmental restrictions—when selecting the most suited measuring system for a specific measurement task. Galetto et al. [31] proposed a cooperative approach for data fusion of distributed multi-sensor LSM systems. Preliminary simulations and experimental results concerning the application were presented and discussed in their work. Gayton et al. [32] proposed a virtual-instrument calibration method for fringe projection systems based on Monte Carlo simulation. Their approach mirrors methods of uncertainty evaluation that are well established in contact coordinate metrology. Song et al. [33] performed an uncertainty analysis based on the binocular vision model of a digital fringe projection (DFP) system. And the uncertainty of DFP measurement caused by structural parameters was evaluated using the adaptive Monte Carlo method. Gąska et al. [34] presented a methodology for implementing a Virtual CMM model, which was capable of correct uncertainty determination for measurements performed in industrial conditions. And results obtained under varying ambient conditions were used to verify the correctness of the proposed methodology. Mutilba et al. [35] performed an on-machine tool measurement uncertainty assessment for a medium-size machine in shop floor conditions and presented the significance of each uncertainty contributor. The artefacts used in the experimental test were designed according to the ISO 15530-3:2011 standard. Zhao et al. [36] discussed the uncertainty sources for a structured blue-light scanner measurement system. An uncertainty evaluation was performed based on the black-box evaluation model. The experimental results show that the uncertainty components introduced by the point cloud stitching and point cloud registration are the main components of the entire measurement system. Muralikrishnan et al. [37] surveyed the literature in all areas of laser trackers as applied to large-scale dimensional metrology, with emphasis on error modelling, measurement uncertainty, performance evaluation and standardization. Hughes et al. [38] presented a novel coordinate measurement system based on a combination of frequency scanning interferometry and multilateration. Initial experimental comparison with a commercial laser tracker has shown that the proposed system can achieve coordinate uncertainties of the order of 40 μm within a measurement volume of 10 m × 5 m × 2.5 m. Their system is self-calibrating and computes rigorous coordinate measurement uncertainty estimates. Mutilba et al. [11] reviewed the existing technologies and methodologies for traceability assessment of machine tool measurement. In their work, uncertainty error sources that affect the measurement were analyzed in depth and a quantitative approach-based error budget was suggested for determining major error sources. Wiemann et al. [39] developed a novel involute gear measurement standard with a diameter of about two metres. After conducting the first calibration process of a large-scale gear worldwide, the measurement standard was used for an intercomparison between seven participants. The fundamental role of measurement standards and calibrated workpieces in the establishment of the traceability chain was presented by Carmignato et al. [40]. The paper examines dimensional artefacts, discussing their characteristics, availability and role in supporting production by establishing metrological traceability, and provides guidelines for their selection, use and development. In Icasio-Hernández et al.’s work [41], five National Metrology Institutes worked together to validate the assessment of a laser tracker’s uncertainty for large-scale dimensional metrology using the ‘network method’. More recently, Zhao et al. [42] reviewed optical metrology techniques from the perspective of precision manufacturing applications and highlighted its essential contribution to advanced manufacturing. Schmelter et al. [43] and Marschall et al. [44] discussed the possibility of determining the measurement uncertainty using virtual metrology, especially in cases where other methods of uncertainty determination were not applicable or were too cost-intensive.
Overall, the research for uncertainty evaluation methodologies for LSM is not abundant. In particular, there is a lack of a universal framework for uncertainty evaluation of LSM in shop floor conditions, and their importance in the manufacturing context is seriously overlooked. Additionally, many instruments for LSM today, such as advanced machine tools and optical measuring systems, are equipped with temperature sensors and even humidity sensors, but equipment manufacturers are reluctant to disclose their compensation mechanisms and algorithms. This further increases the difficulty for uncertainty evaluation, especially when evaluating different devices while using the same methodology or framework.
4. Our Proposed Methodologies
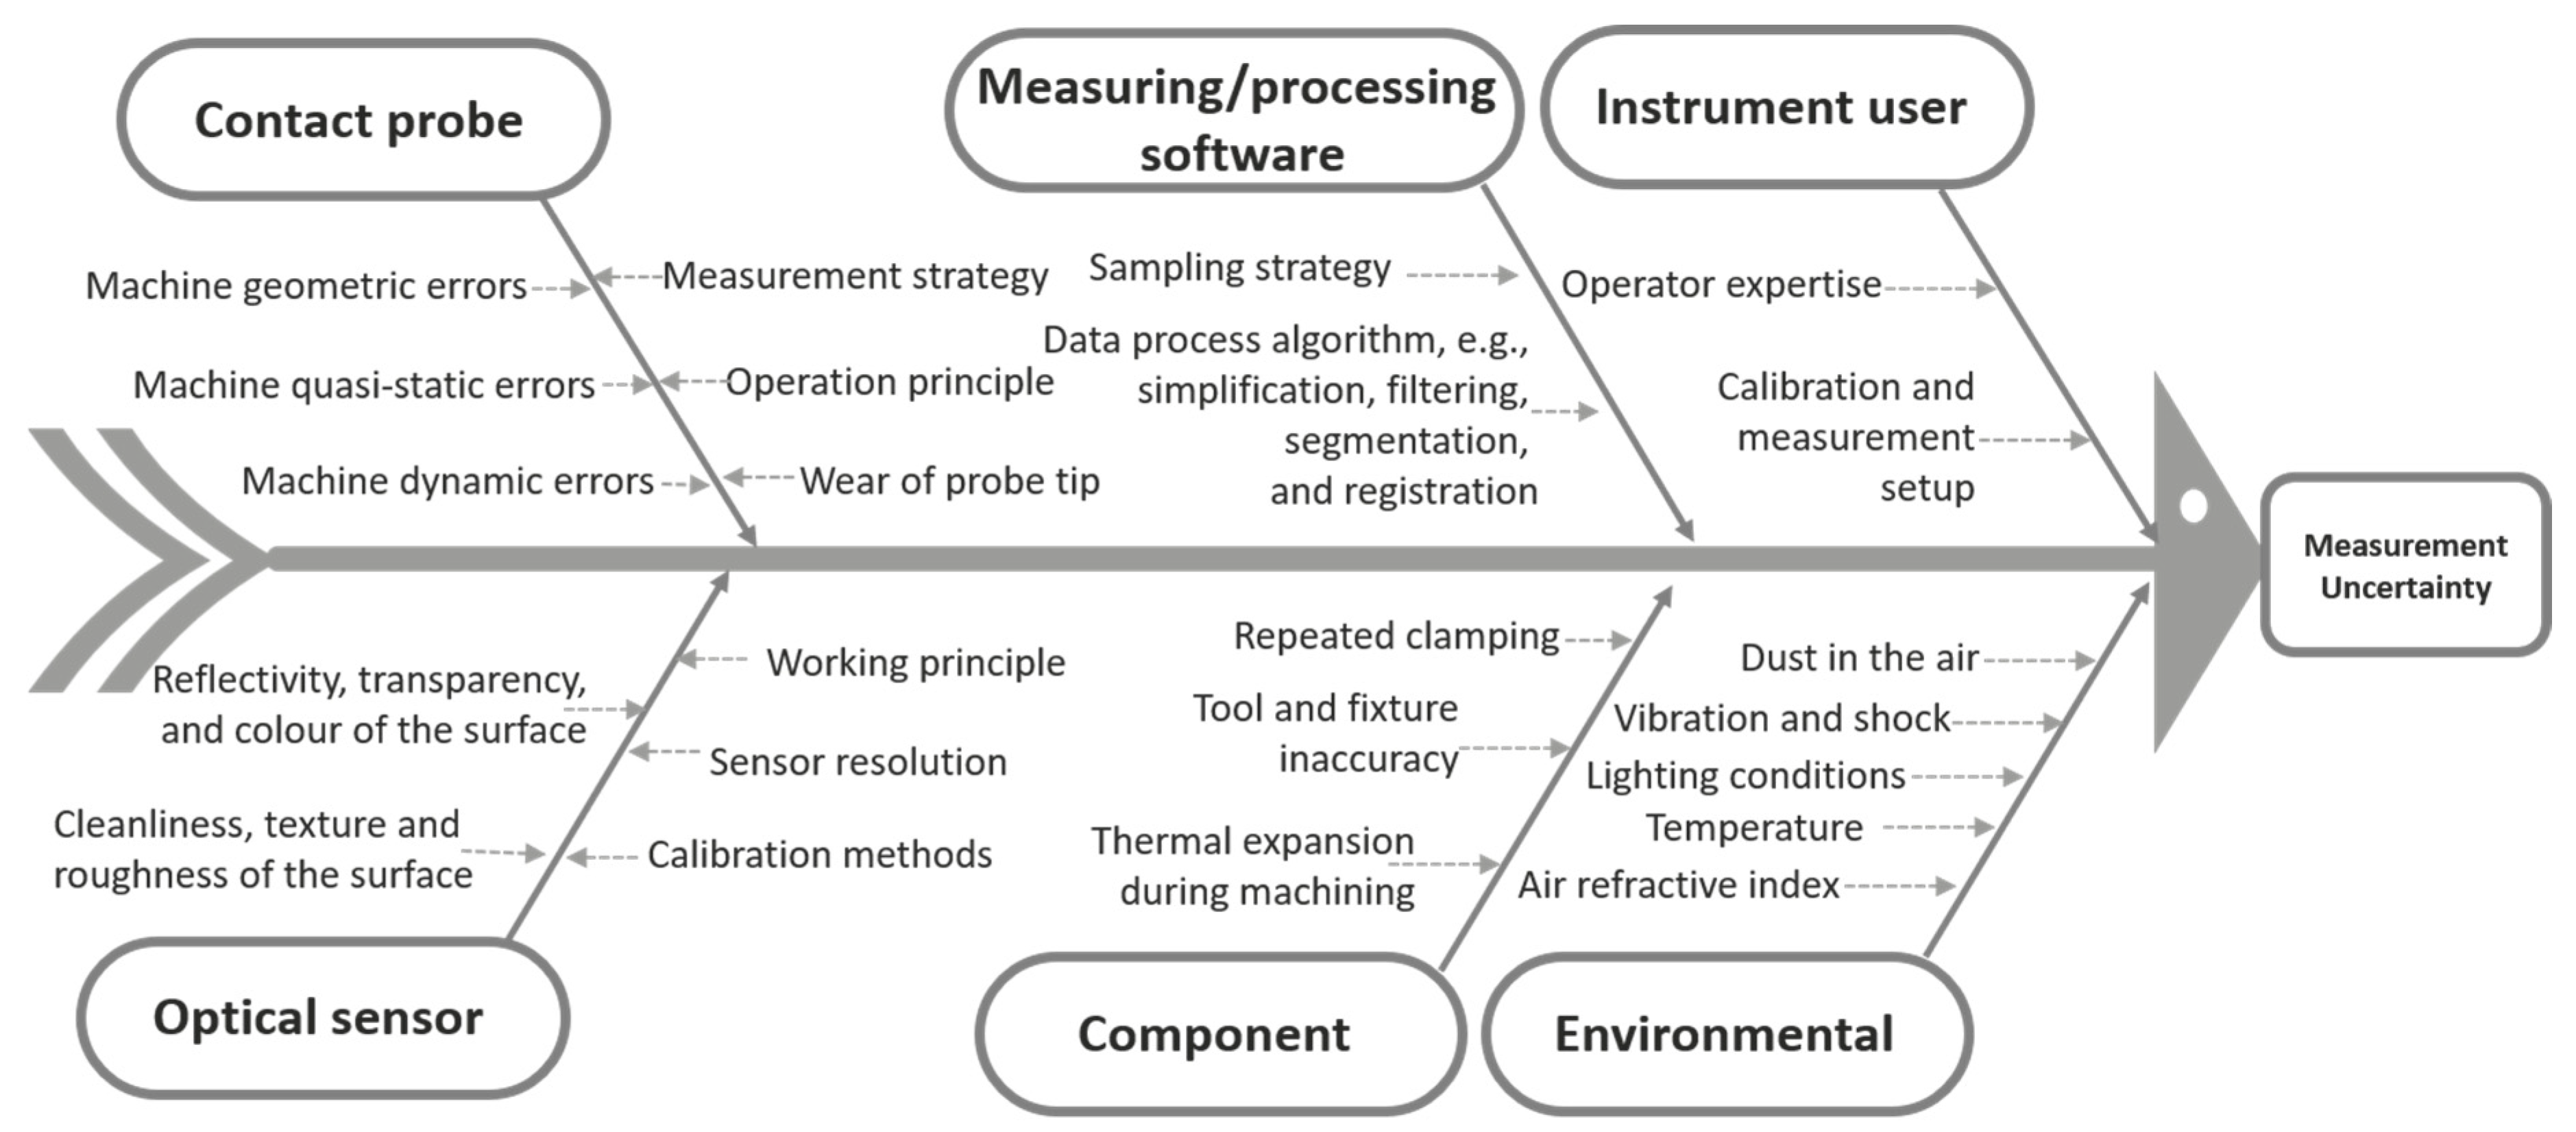
In this work, we propose a novel uncertainty modelling framework flow chart for LSM in shop floor conditions, which is based on the integration of the GUM [23], MCM [22] and ISO 14253-3:2011 [45]. The diagram can be described as follows (Figure 2).
Figure 2.
Uncertainty modelling framework diagram.
First, the workpiece is measured on the machine tool or on the shop floor, then the part is measured using traceable instruments, and the uncertainty of measurement can be evaluated using the GUM framework and MCM. By comparing the tolerances of the features and uncertainty, it can be determined whether the instrument meets the measurement requirements for this specific measurement task. If the instrument meets the accuracy requirement, then the measurement results can be used to assess whether the part meets the designed requirements, based on ISO 14253-3:2011 [45].
4.1. Measurement Uncertainty Characterization
Three types of major uncertainty contributors should be considered in the uncertainty budget for the on-machine tool measurement [20]:
- (1)
- —standard uncertainty associated with the systematic errors of the measurement process.
- (2)
- —standard uncertainty associated with the random errors of the measurement process.
- (3)
- —standard uncertainty associated with the uncertainty of the workpiece calibration.
Different approaches can be used to assess the systematic errors. In our work, systematic error is defined as the difference between the calibration value (the measurement results using a CMM) and the mean value of the measurement results using other instruments. Different error sources that affect these three types of major contributors are characterized in Table 1.
Table 1.
Uncertainty characterization for on-machine measurement.
4.2. Uncertainty Evaluation by GUM Framework
The GUM framework [23] estimates the overall uncertainty by identifying, quantifying and combining all the uncertainty sources associated with the measurement. In most cases, a measurand is not measured directly and is determined by other quantities through a functional relationship :
An estimate of the measurand , denoted by (its expectation), is obtained by substituting the input estimates for the values of quantities in Equation (1). Thus, the output estimate , which is the result of measurement, is given by
The first-order Taylor series approximation of for the small deviation of about in terms of small deviations of about is expressed as
where all higher-order terms of the Taylor series are assumed to be negligible. The square of the deviation is then given by
Equation (4) can be rewritten as
If the combined standard uncertainty of the estimate is denoted by , from Equation (5) we can have
where is the correlation coefficient between and .
If the input quantities are independent or uncorrelated, in this case and Equation (6) is expressed as
When the nonlinearity is significant, high-order Taylor series expansion approximation must be included, or other numerical methods (such as the MCM) may be required.
4.3. Uncertainty Evaluation by Adaptive MCM
The MCM [46] has been used to estimate the uncertainty of under complex assumptions about the relationships between and the input quantities , and the distributions of the quantities. This method provides a consistent Bayesian approach to evaluate the uncertainty. The MCM combines and propagates distributions rather than propagating uncertainties as in the GUM uncertainty framework. Uncertainty evaluation is calculated using the probabilistic distribution of the factors, rather than their means and standard deviations.
The core of the MCM approach is repeated sampling from the probability density function (PDF) for the and evaluating the model in each case, to obtain an approximate numerical representation . The MCM can be performed as follows [22]:
- (1)
- Select the number for the Monte Carlo trials to be carried out.
- (2)
- Generate vectors, by sampling from the assigned PDF of , as realizations of the input quantities .
- (3)
- For each such vector, form the corresponding model value of , yielding model values.
- (4)
- Sort these model values into strictly increasing order, using the sorted model values to form .
- (5)
- Use to form an appropriate coverage interval for for a given coverage probability .
If the trial is selected adaptively as the trial number, this procedure becomes a so-called adaptive MCM [22].
5. Uncertainty Assessment Experimental Exercise
5.1. Task-Specific Uncertainty Evaluation
The ‘task-specific uncertainty’ is the actual reliability statement for a particular measurement [47]. In coordinate measurement, it is the measurement uncertainty that is calculated according to the uncertainty evaluation methods (e.g., GUM, MCM, etc.), when a specific feature is measured using a specific inspection plan.
The presented research work is focused on assessing the measurement uncertainties in the shop floor condition, using different instruments and calibrated afterwards using a CMM. By evaluating fitness-for-purpose for dimensional measurements of workpieces, it will determine whether a metrology instrument meets tolerance specifications and is capable of inspecting features on a part with the required accuracy, enabling smarter, risk-based decisions in manufacturing and quality control. If the instruments meet the tolerance requirements, the decision of whether a workpiece feature meets its design criteria within the specified tolerance must be based on ISO 14253-3:2011 [45].
5.2. Experiment Setup
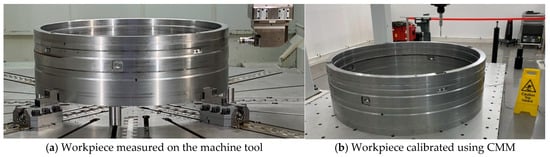
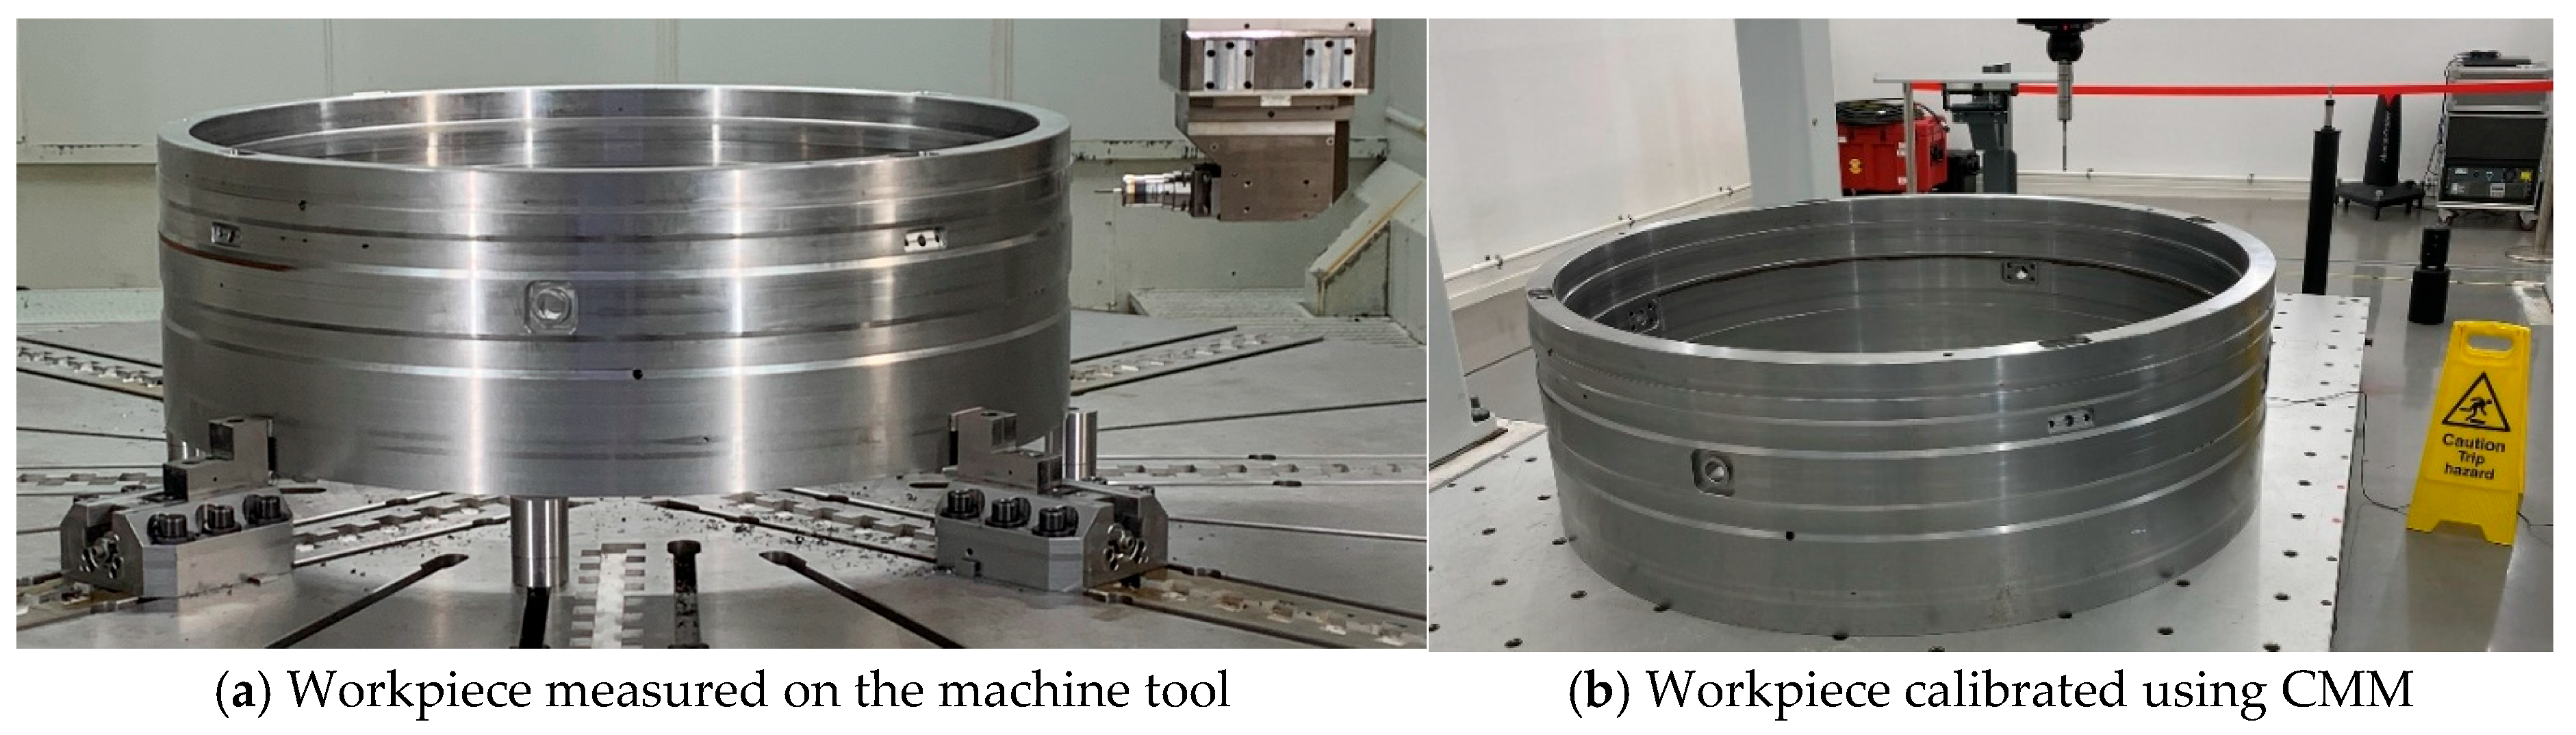
An artefact, made from low-alloy steel, with dimensions of 1779.8 mm in diameter and 577 mm in height, was selected for the trials. Figure 3, taken from a workshop of the AMRC, shows a real image of the workpiece (weight 2100 kg). The measured features and the specified tolerance of the workpiece are depicted in Table 2.
Figure 3.
Workpiece for the test.
Table 2.
Measurement features and specified tolerance for the workpiece.
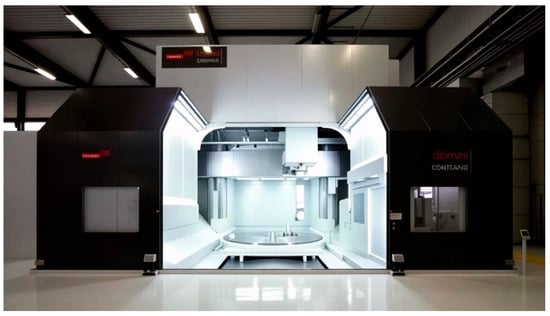
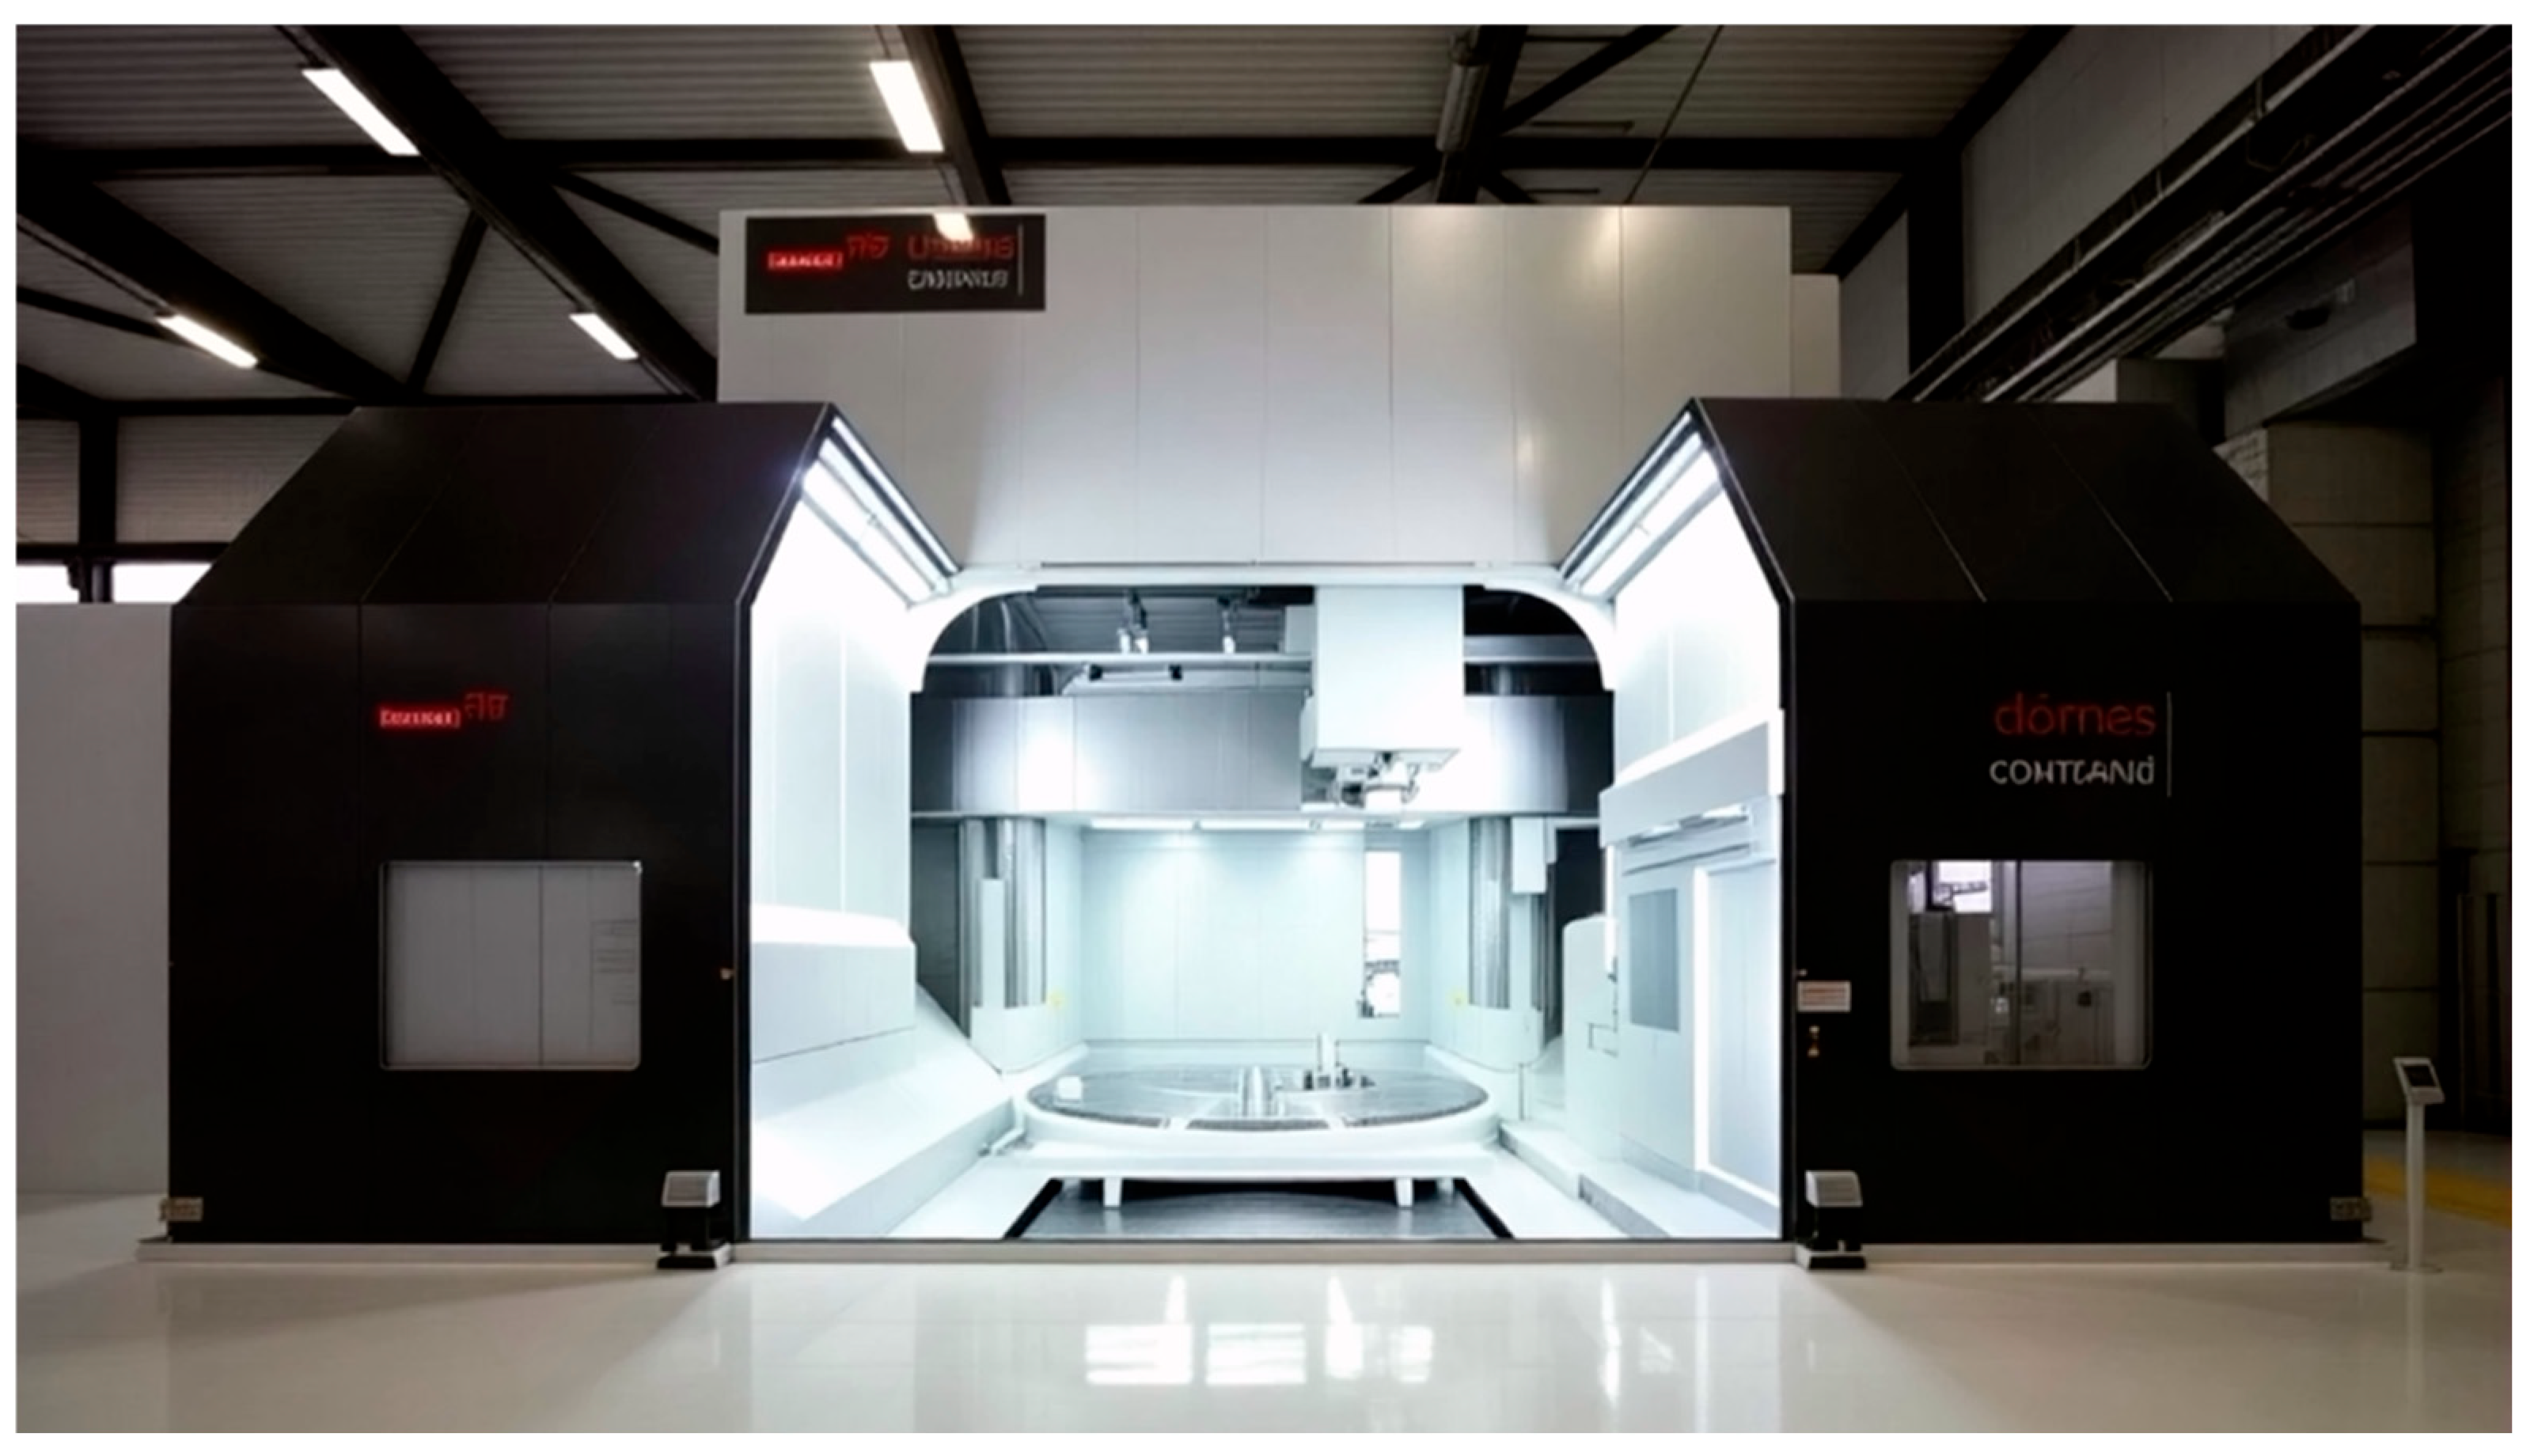
First, the machine tool selected to perform the experimental test was a Dörries Contumat 470 VTL large-scale machine tool manufactured by the Starrag Group (Figure 4), which is a very large vertical turning/milling lathe, and the specifications below provide a description of its capabilities:
Figure 4.
Dörries Contumat VTL turning/milling lathe in AMRC, University of Sheffield.
- Maximum workpiece of 5 m in diameter and 3 m in height;
- A 4/4.5 m rotary table;
- Max table load—350 tonnes;
- Max spindle speed—14,250 rpm.
The VTL is operated by a controller from Siemens AG (Munich, Germany). An OMP 600 tactile probe (Renishaw, Gloucestershire, UK) was employed on the VTL machine tool to execute the on-machine tool measurement. The probe was calibrated before measurement, and the temperature was compensated for during measurement process.
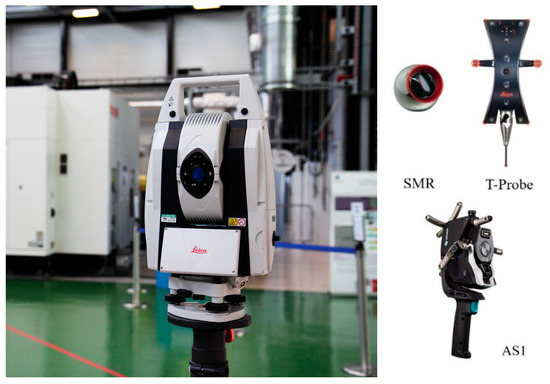
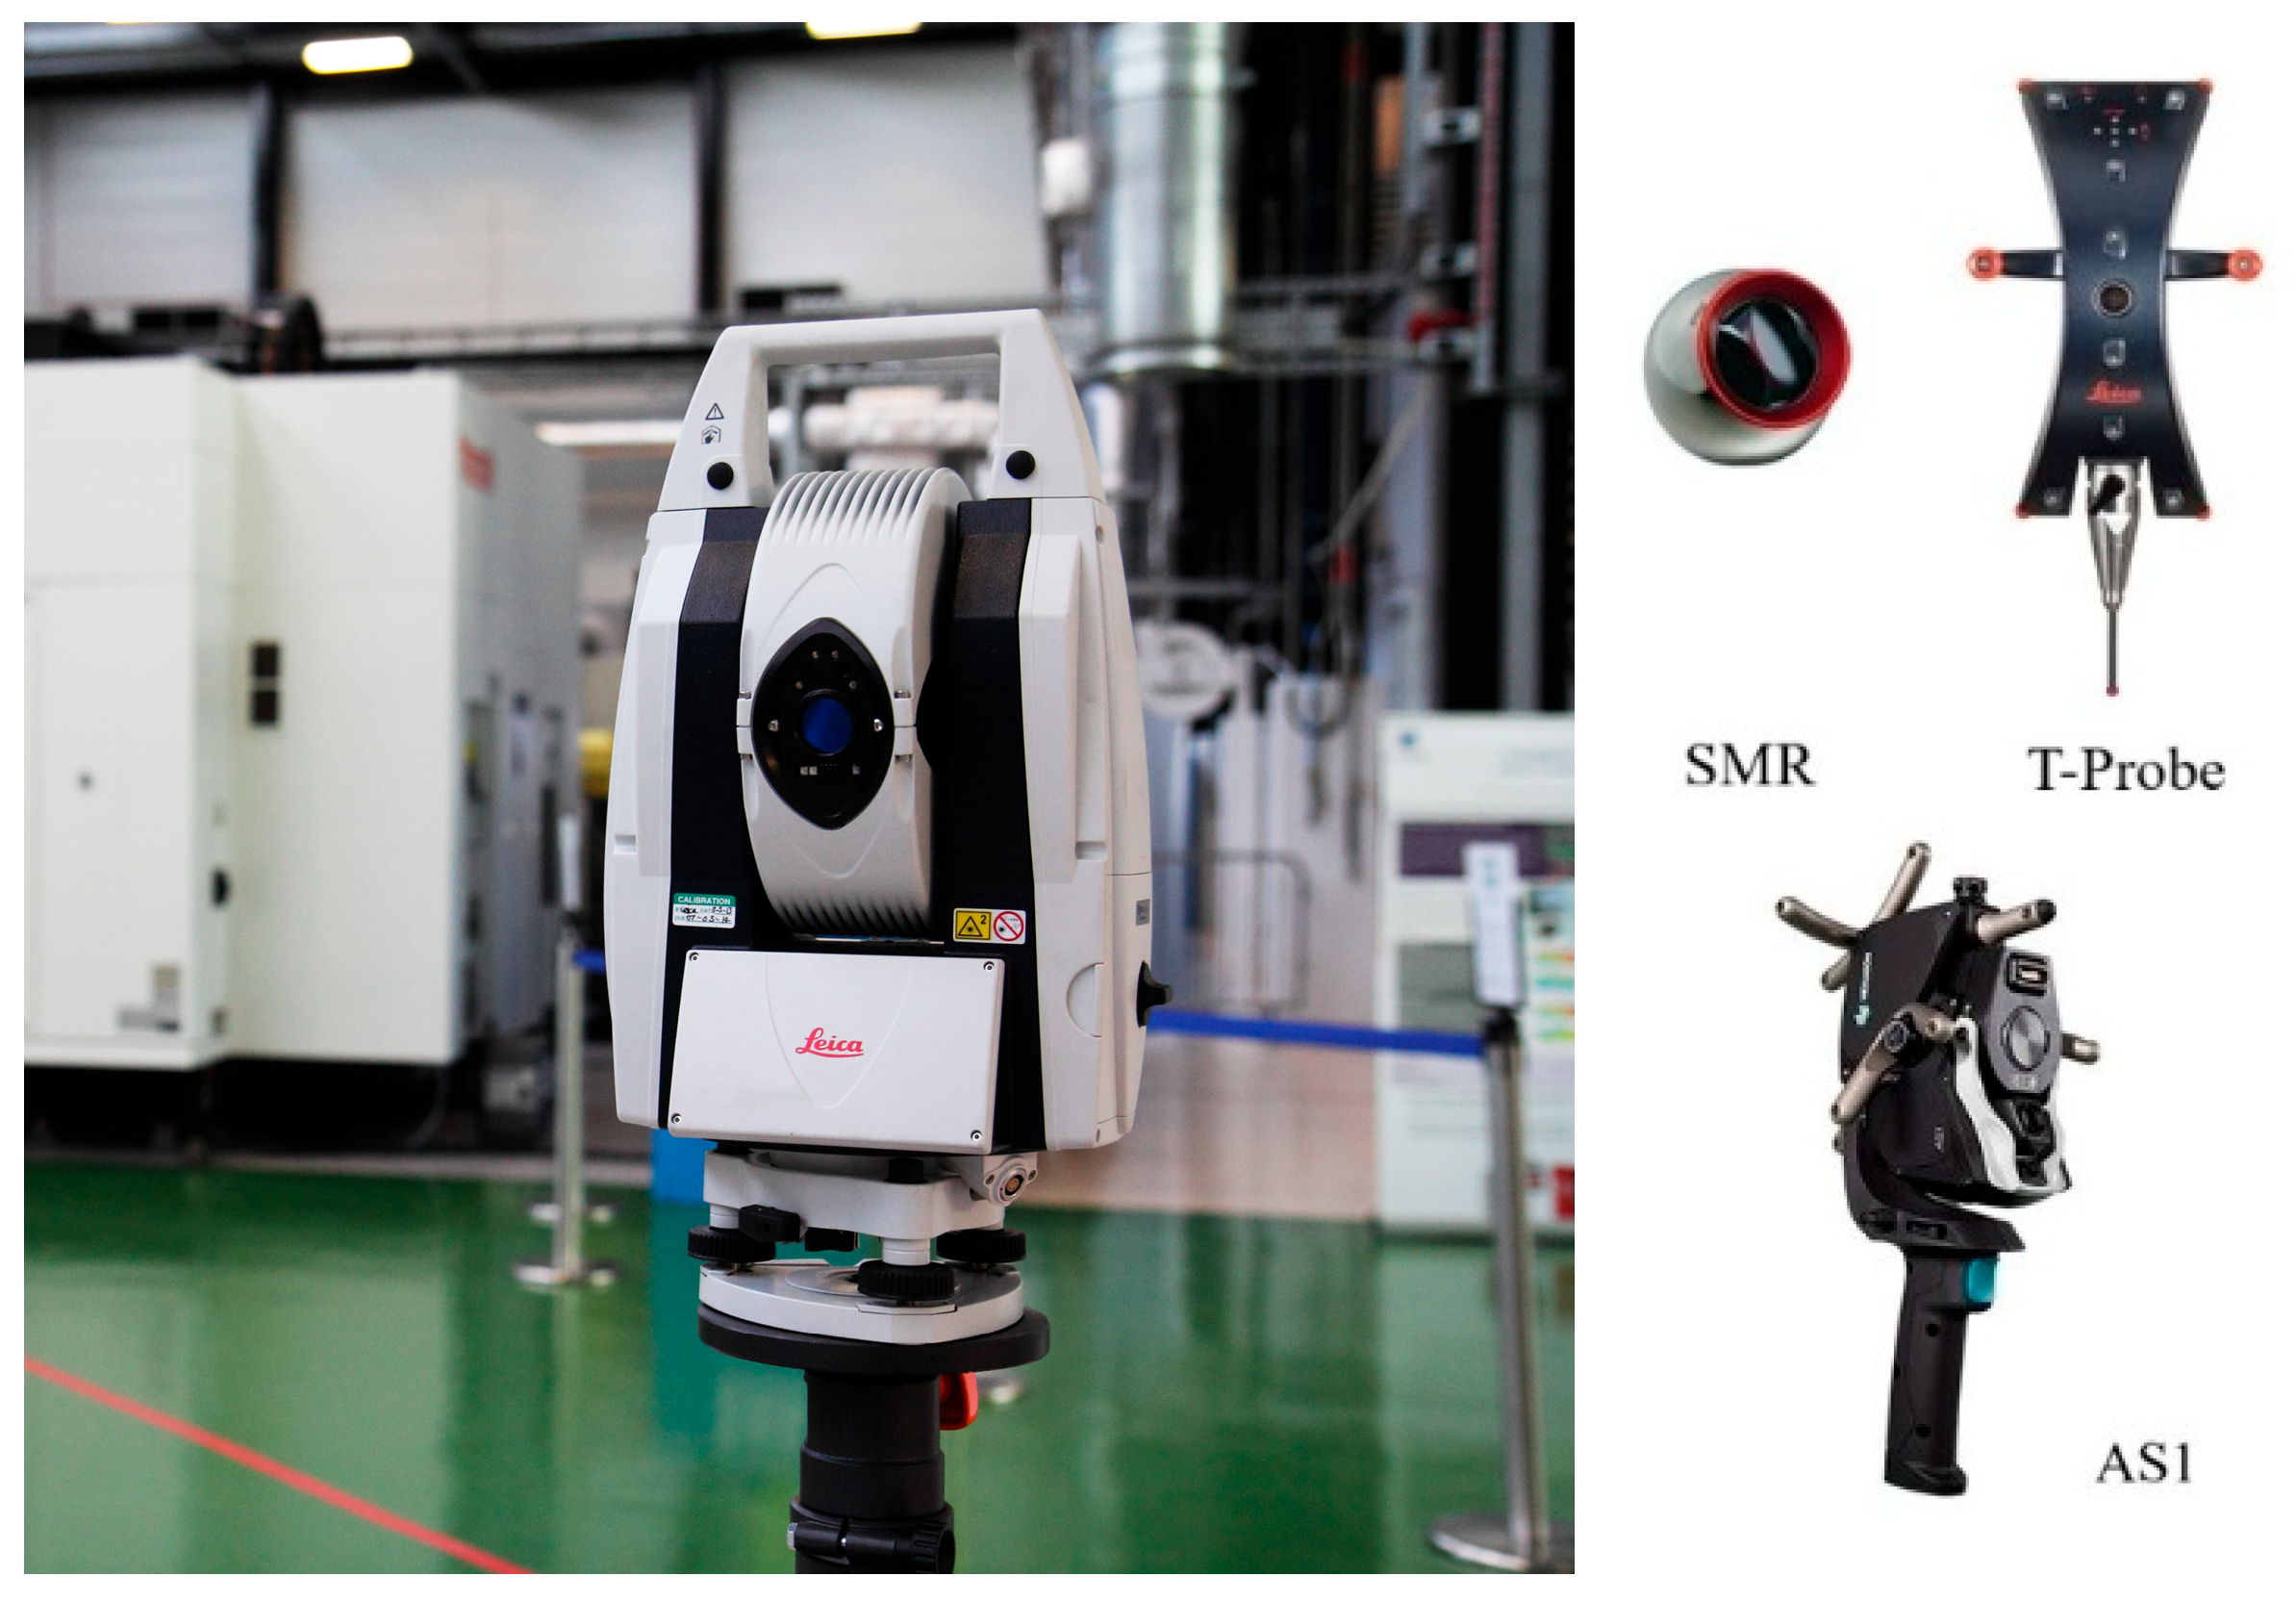
Then the Leica Absolute Laser Tracker AT960 (Hexagon, Cobham, UK, Figure 5), which enables the delivery of six-degrees-of-freedom (6 DoFs) measurement data with a measurement volume of up to 160 metres in diameter, was exploited to measure those features again. The laser tracker ran for 1.5 h for warm-up before measurement.
Figure 5.
Leica Absolute Tracker AT960 with SMR, T-probe and AS1 scanner.
Features (group A, B, C and D, No. 1–5) were measured by VTL, the Leica Absolute Laser Tracker AT960 with a spherically mounted retroreflector (SMR), and the Absolute Scanner AS1, separately. Due to the accessibility of the sensors, the holes (group E) were measured by VTL and Leica T-Probe (Hexagon, UK). The selected contact points on the part surface for measurement (using VTL, SMR and T-probe) were marked to ensure that each measurement was taken in approximately the same location. Based on the recommendations in the literature [35], all the measurements were repeated ten times and temperature was compensated for during the measurement process.
The types of sensors used in the work, their basic working principle and their operating mode are listed in Table 3.
Table 3.
Sensor types.
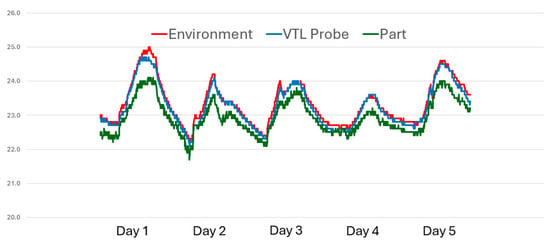
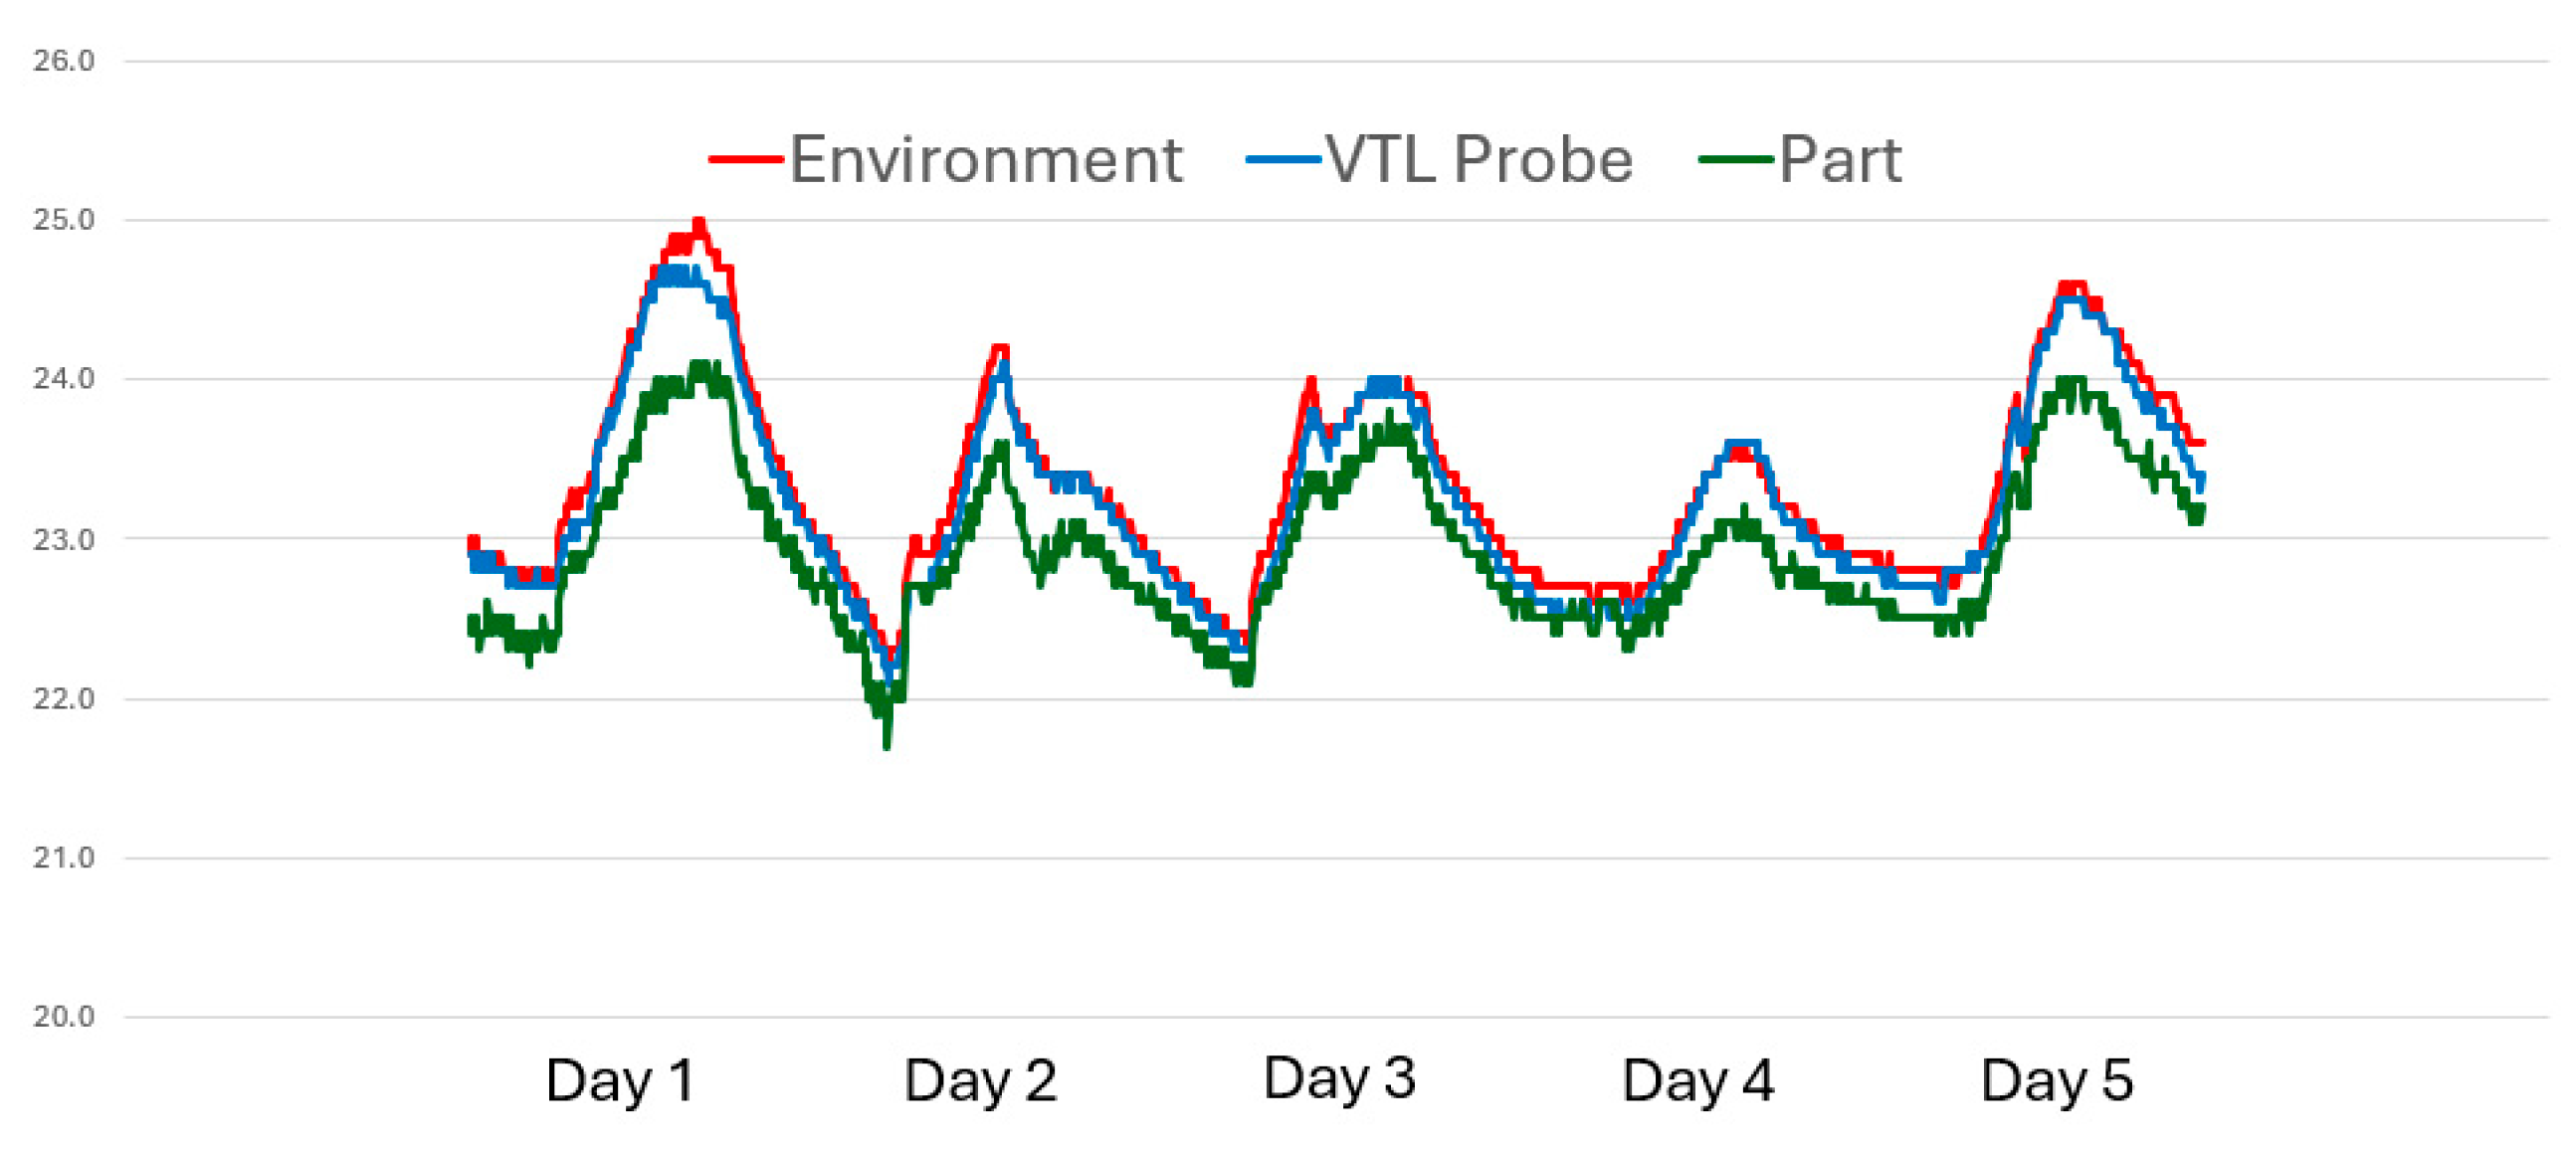
The machine tool was placed in the workshop with roughly controlled temperature, which mainly varied between 19 °C and 24 °C annually. To prevent double counting, we did not include the uncertainties introduced by temperature in the uncertainty modelling, since all measurement instruments (CMM, VTL and laser tracker) are equipped with temperature sensors for compensation. As recommended by [20], the environmental conditions during evaluation of measurement uncertainty and calibration process should be similar when conducting uncertainty assessments. Three temperature sensors were used to monitor the temperature: one was close to the part, one for the workshop ambient temperature, and one for the machine tool probe. The temperature was recorded at least 48 h before the test and covered the full measurement process (see Figure 6).
Figure 6.
Temperature records.
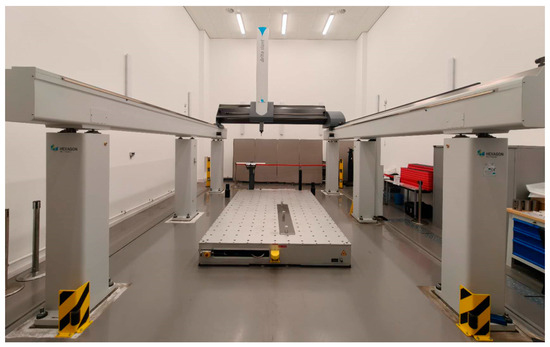
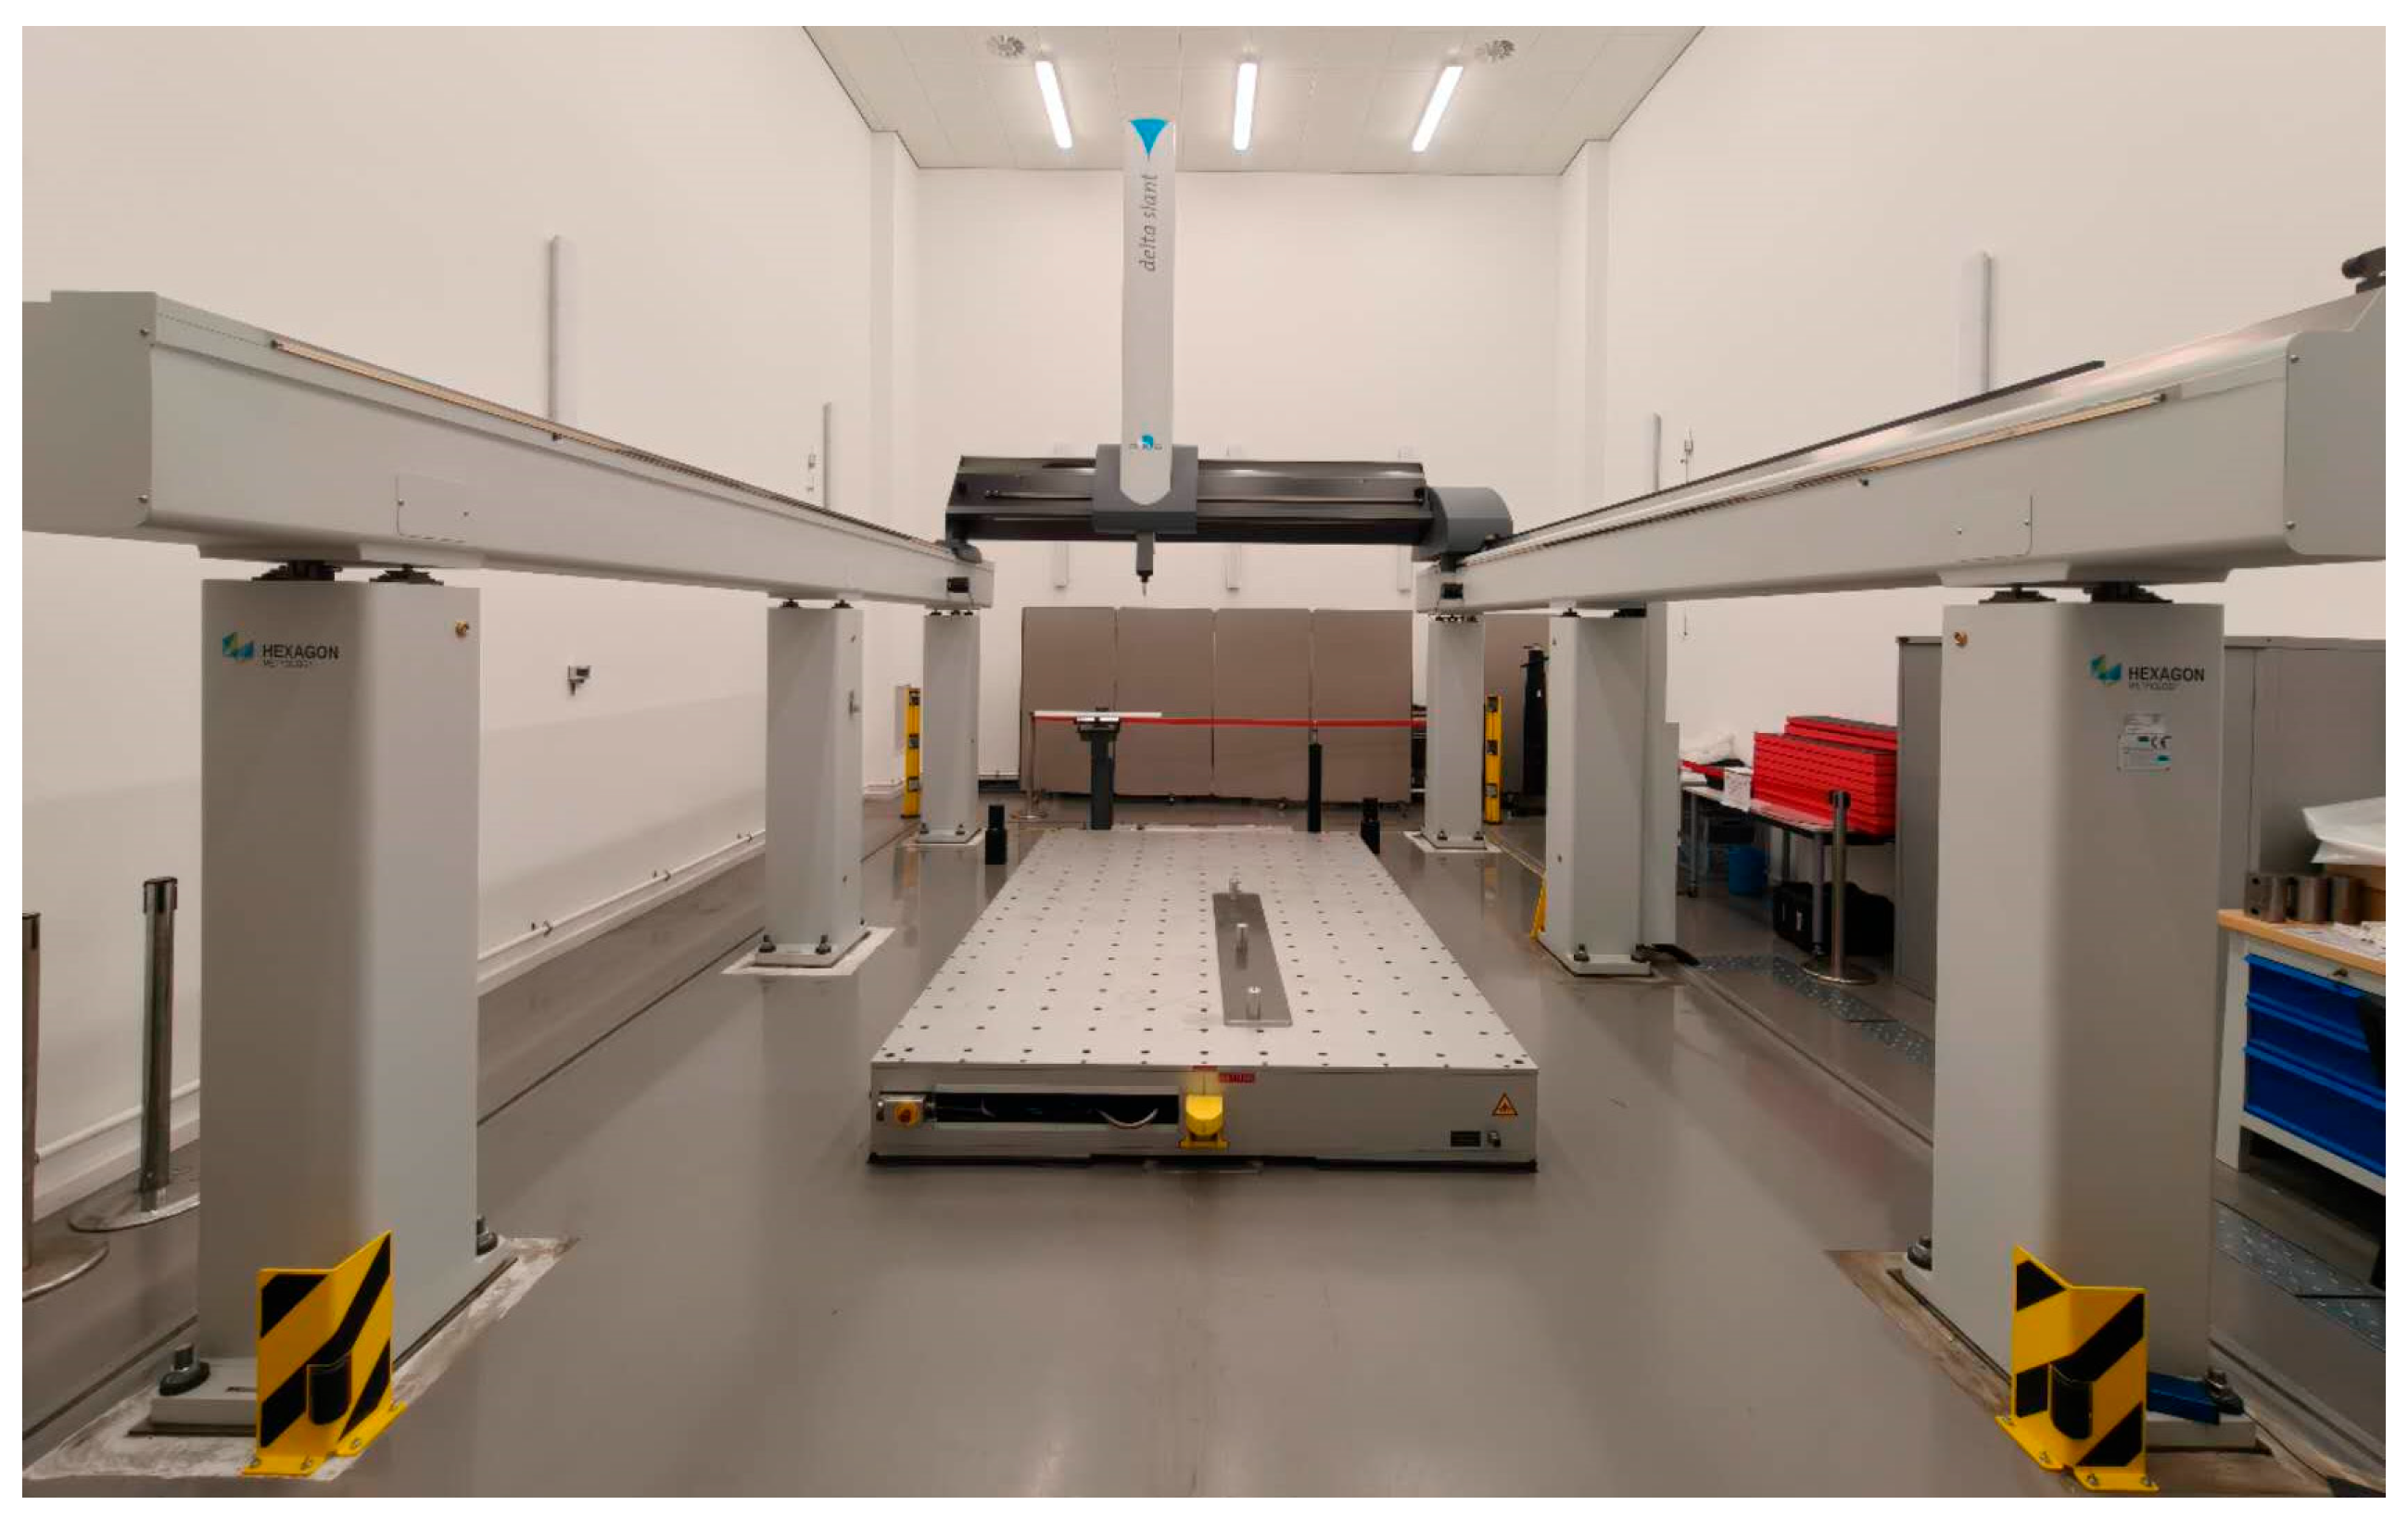
Then the Hexagon DEA Delta gantry CMM (working volume: X-axis 3000 mm, Y-axis 6000 mm, Z-axis 2000 mm; maximum load: 15,000 kg—see Figure 7), which was placed in a dedicated metrology room with standard reference temperature (20 °C), was used for the calibration of the workpiece.
Figure 7.
Hexagon DEA Delta gantry CMM setup in AMRC, University of Sheffield.
5.3. Experimental Uncertainty Contributors
The three major uncertainty contributors (see Section 4.1) are characterized in shop floor conditions and the uncertainty budget for the assessment is presented below.
5.3.1. Calibration Uncertainty ()
The CMM is well maintained and undergoes regular annual calibration and servicing. The Maximum Permissible Error (MPE) specification of the CMM is ±(4.70 µm + 3.50 µm/m). The measuring accuracy using the CMM is mainly determined by its MPE.
The indication uncertainty caused by CMM can be calculated:
where is the dimension of the feature in metres.
During the measurement of the part, the temperature difference between the CMM and the part is observed to be a maximum of 0.1 °C during the measurement process. The linear coefficient of thermal expansion α is assumed to be 1.2 µm/(100 mm × °C) for the CMM and the part. The influence can be calculated:
The U-distribution is assumed and the uncertainty component which is introduced by temperature difference is
Each feature is measured five times, and the estimated standard uncertainty can be calculated using
where is the measurement value and is the average value.
All the above components are considered as uncorrelated (), and the expanded calibration uncertainty for the measurement of each feature can be calculated [48]:
The artefact is measured five times using the CMM and the measurement results show excellent consistency, and the repeatability for measurement of all features is less than 1 µm. The measurement results using the CMM are shown in Table 4, which also lists the expanded calibration uncertainties for each feature (95.45% measurement confidence, ).
Table 4.
Expanded calibration uncertainty for features using CMM.
5.3.2. Systematic Error Uncertainty ()
Temperature variation was recorded for 48 h during the measurement process. The maximum variation in the ambient temperature during the measurement was 0.3 °C when using the VTL machine tool and 0.4 °C when using the SMR, AS1 and T-probe.
The averages of measurement results using the CMM, VTL machine tool, SMR, AS1 and T-probe are shown in Table 5; ‘N/A’ indicates the sensor is not applicable for the feature (feature group E because of the depth of the holes).
Table 5.
Measurement results using CMM, VTL, SMR, AS1 and T-probe.
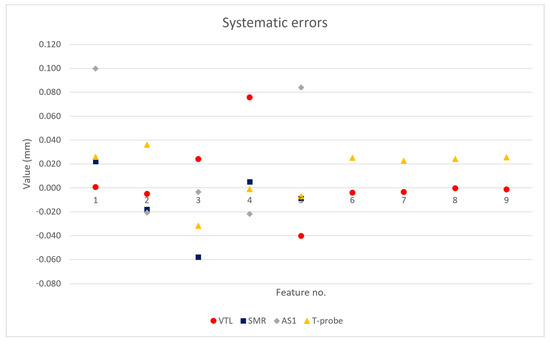
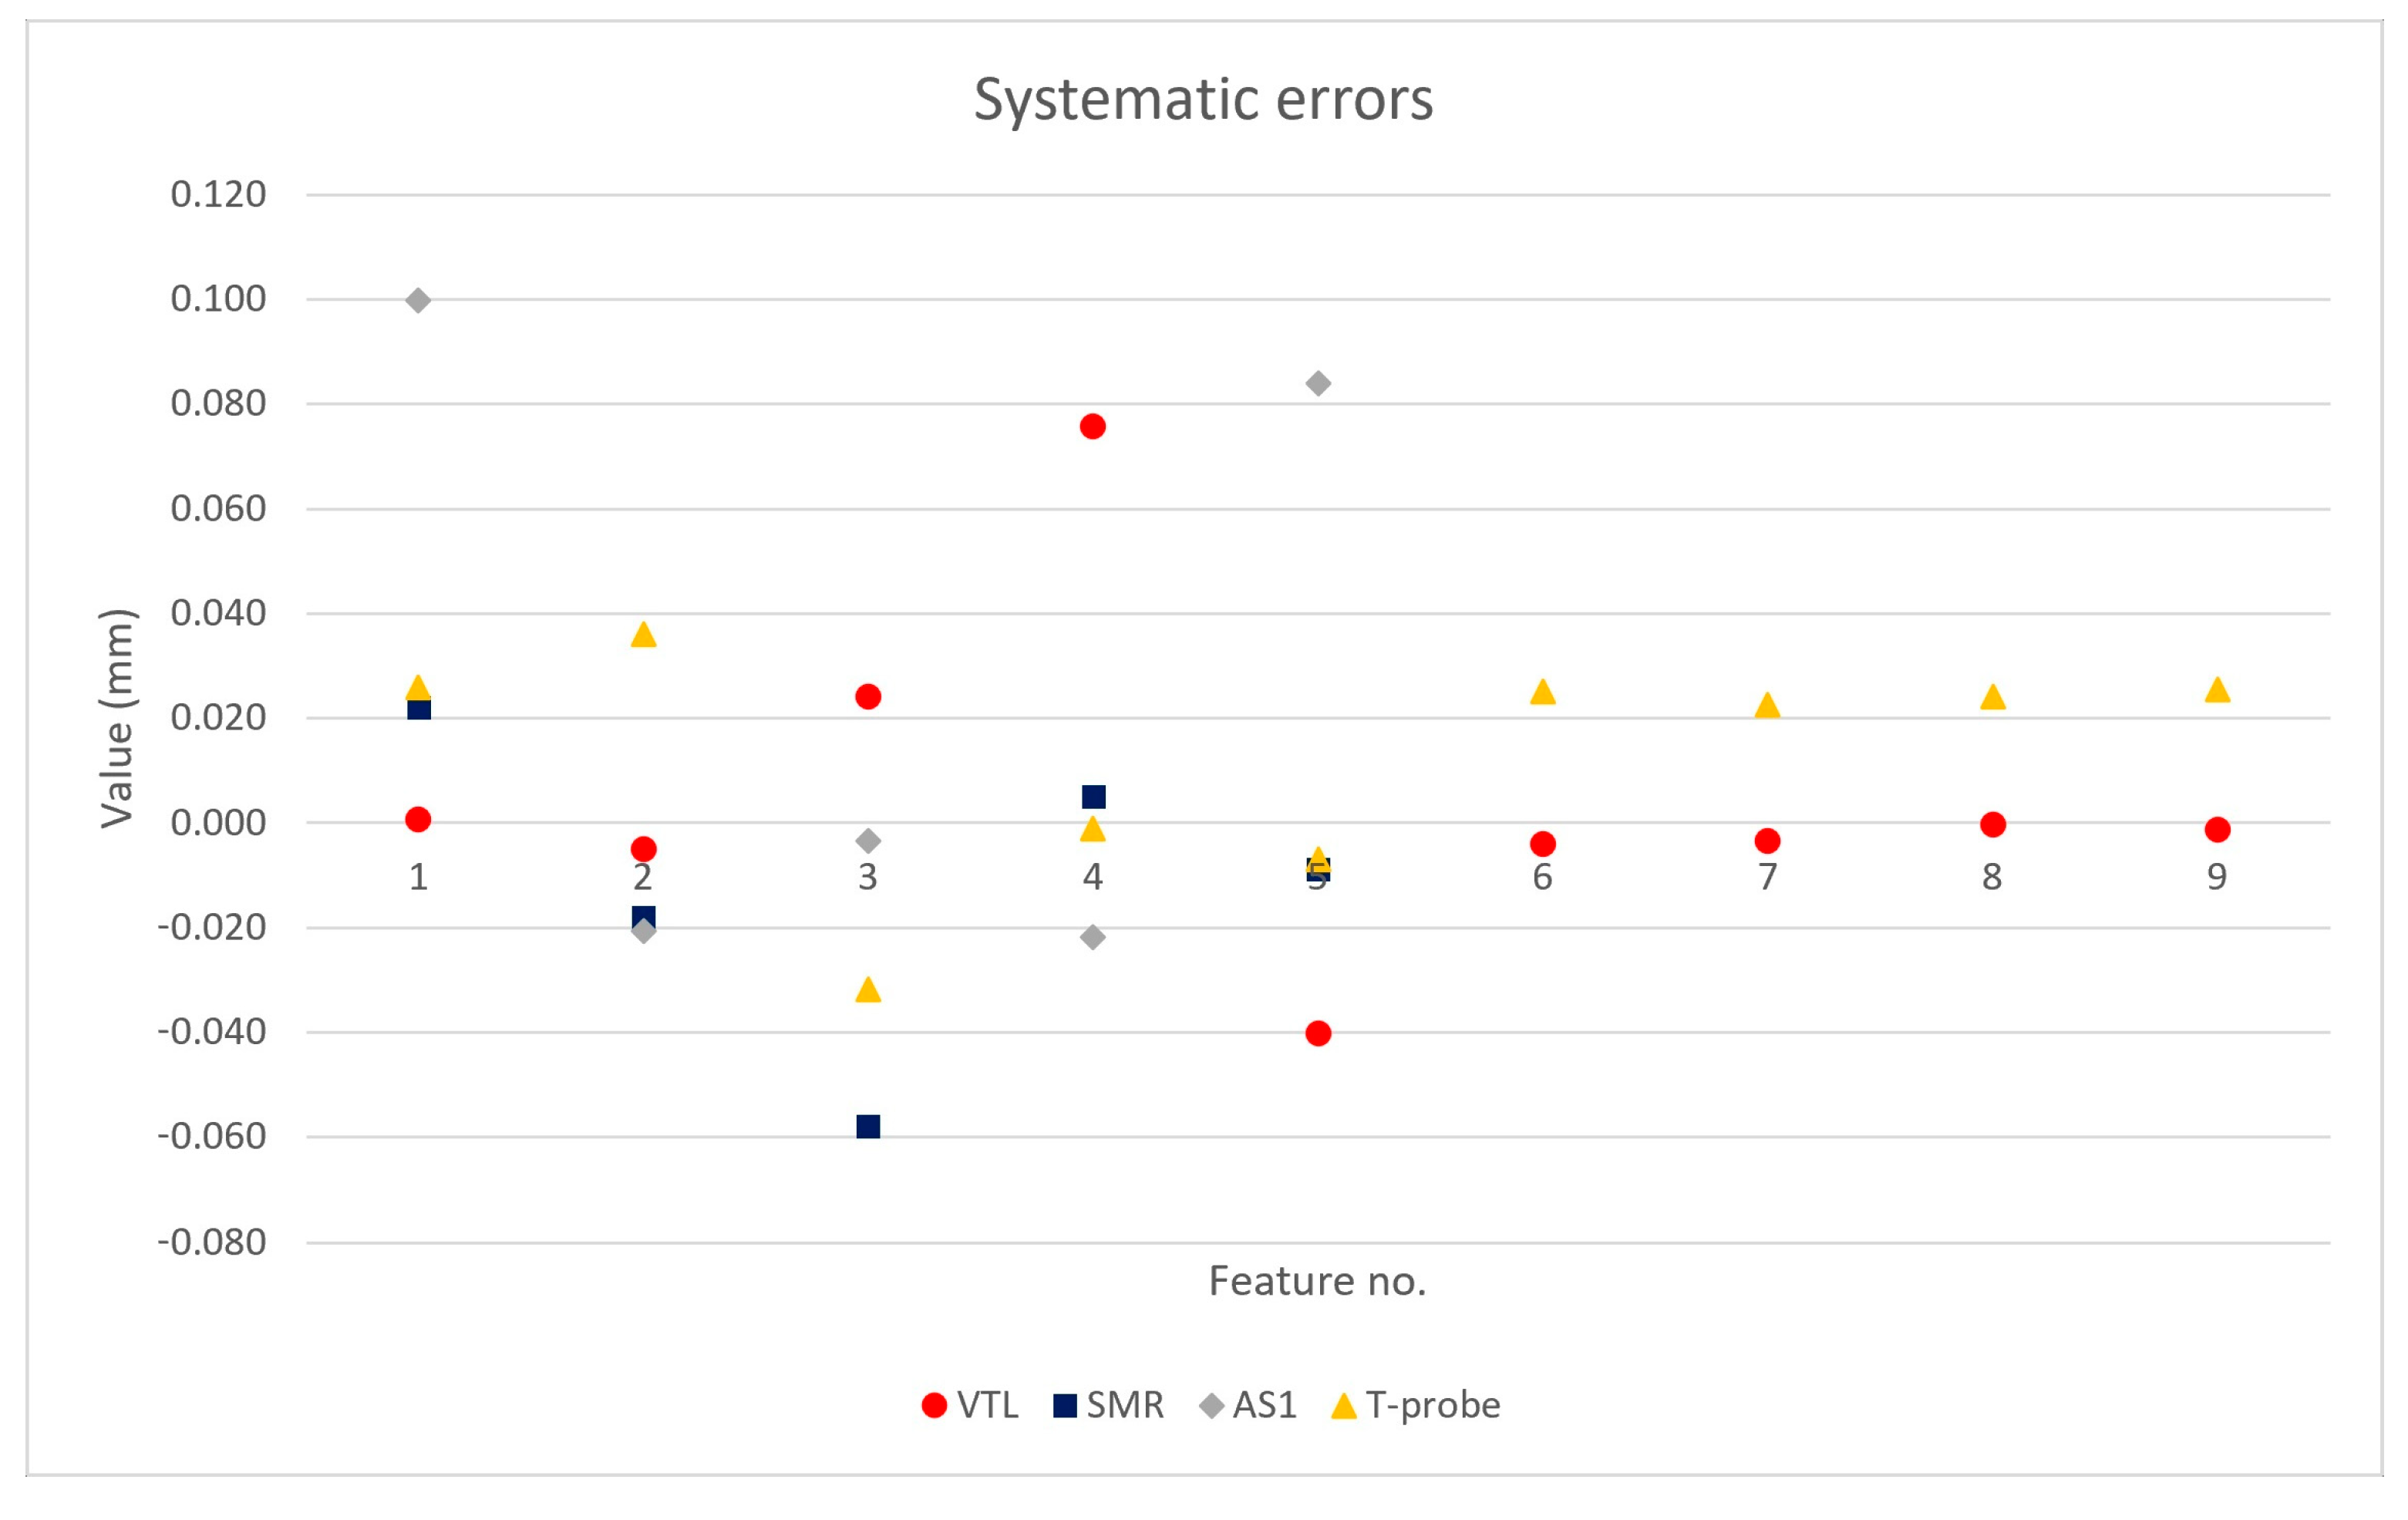
The results measured from the CMM are used as a datum, and the systematic errors () of the measurement results for the VTL machine tool, SMR, AS1 and T-probe are shown in Figure 8, showing the mean systematic error of each measured feature.
Figure 8.
Systematic errors of the measurements using different instruments.
The results indicate the measurement of dimensions (diameters of rings and holes) using VTL achieves good consistency with the CMM, but there are significant deviations in the positional measurements (positions and flatness). In addition, the functions of on-machine inspection software are far less rich than those of CMM software (PC-DMIS 2024.1). The position measurement results and flatness results cannot be obtained directly using software, which comes with the machine tool. And the inspection results were calculated using original data and our own developed software.
Meanwhile, the measurement results using SMR, AS1 and T-probe exhibit irregular properties; for example, the measurement for the outside diameter of the ring (Feature 1) using SMR is 22 µm larger than the measurement using the CMM, and the measurement for the inside diameter of the ring (Feature 2) is 18 µm smaller. A similar situation also occurs when using the AS1 scanner and T-probe. As pointed out by [17], the uncertainty behaviour can be very anisotropic for LSM. Our experimental results corroborate their conclusions.
5.3.3. Measurement Procedure Uncertainty ()
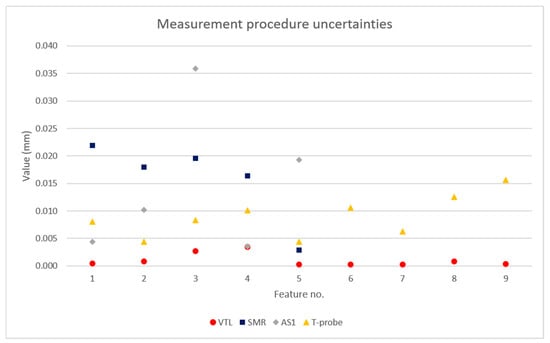
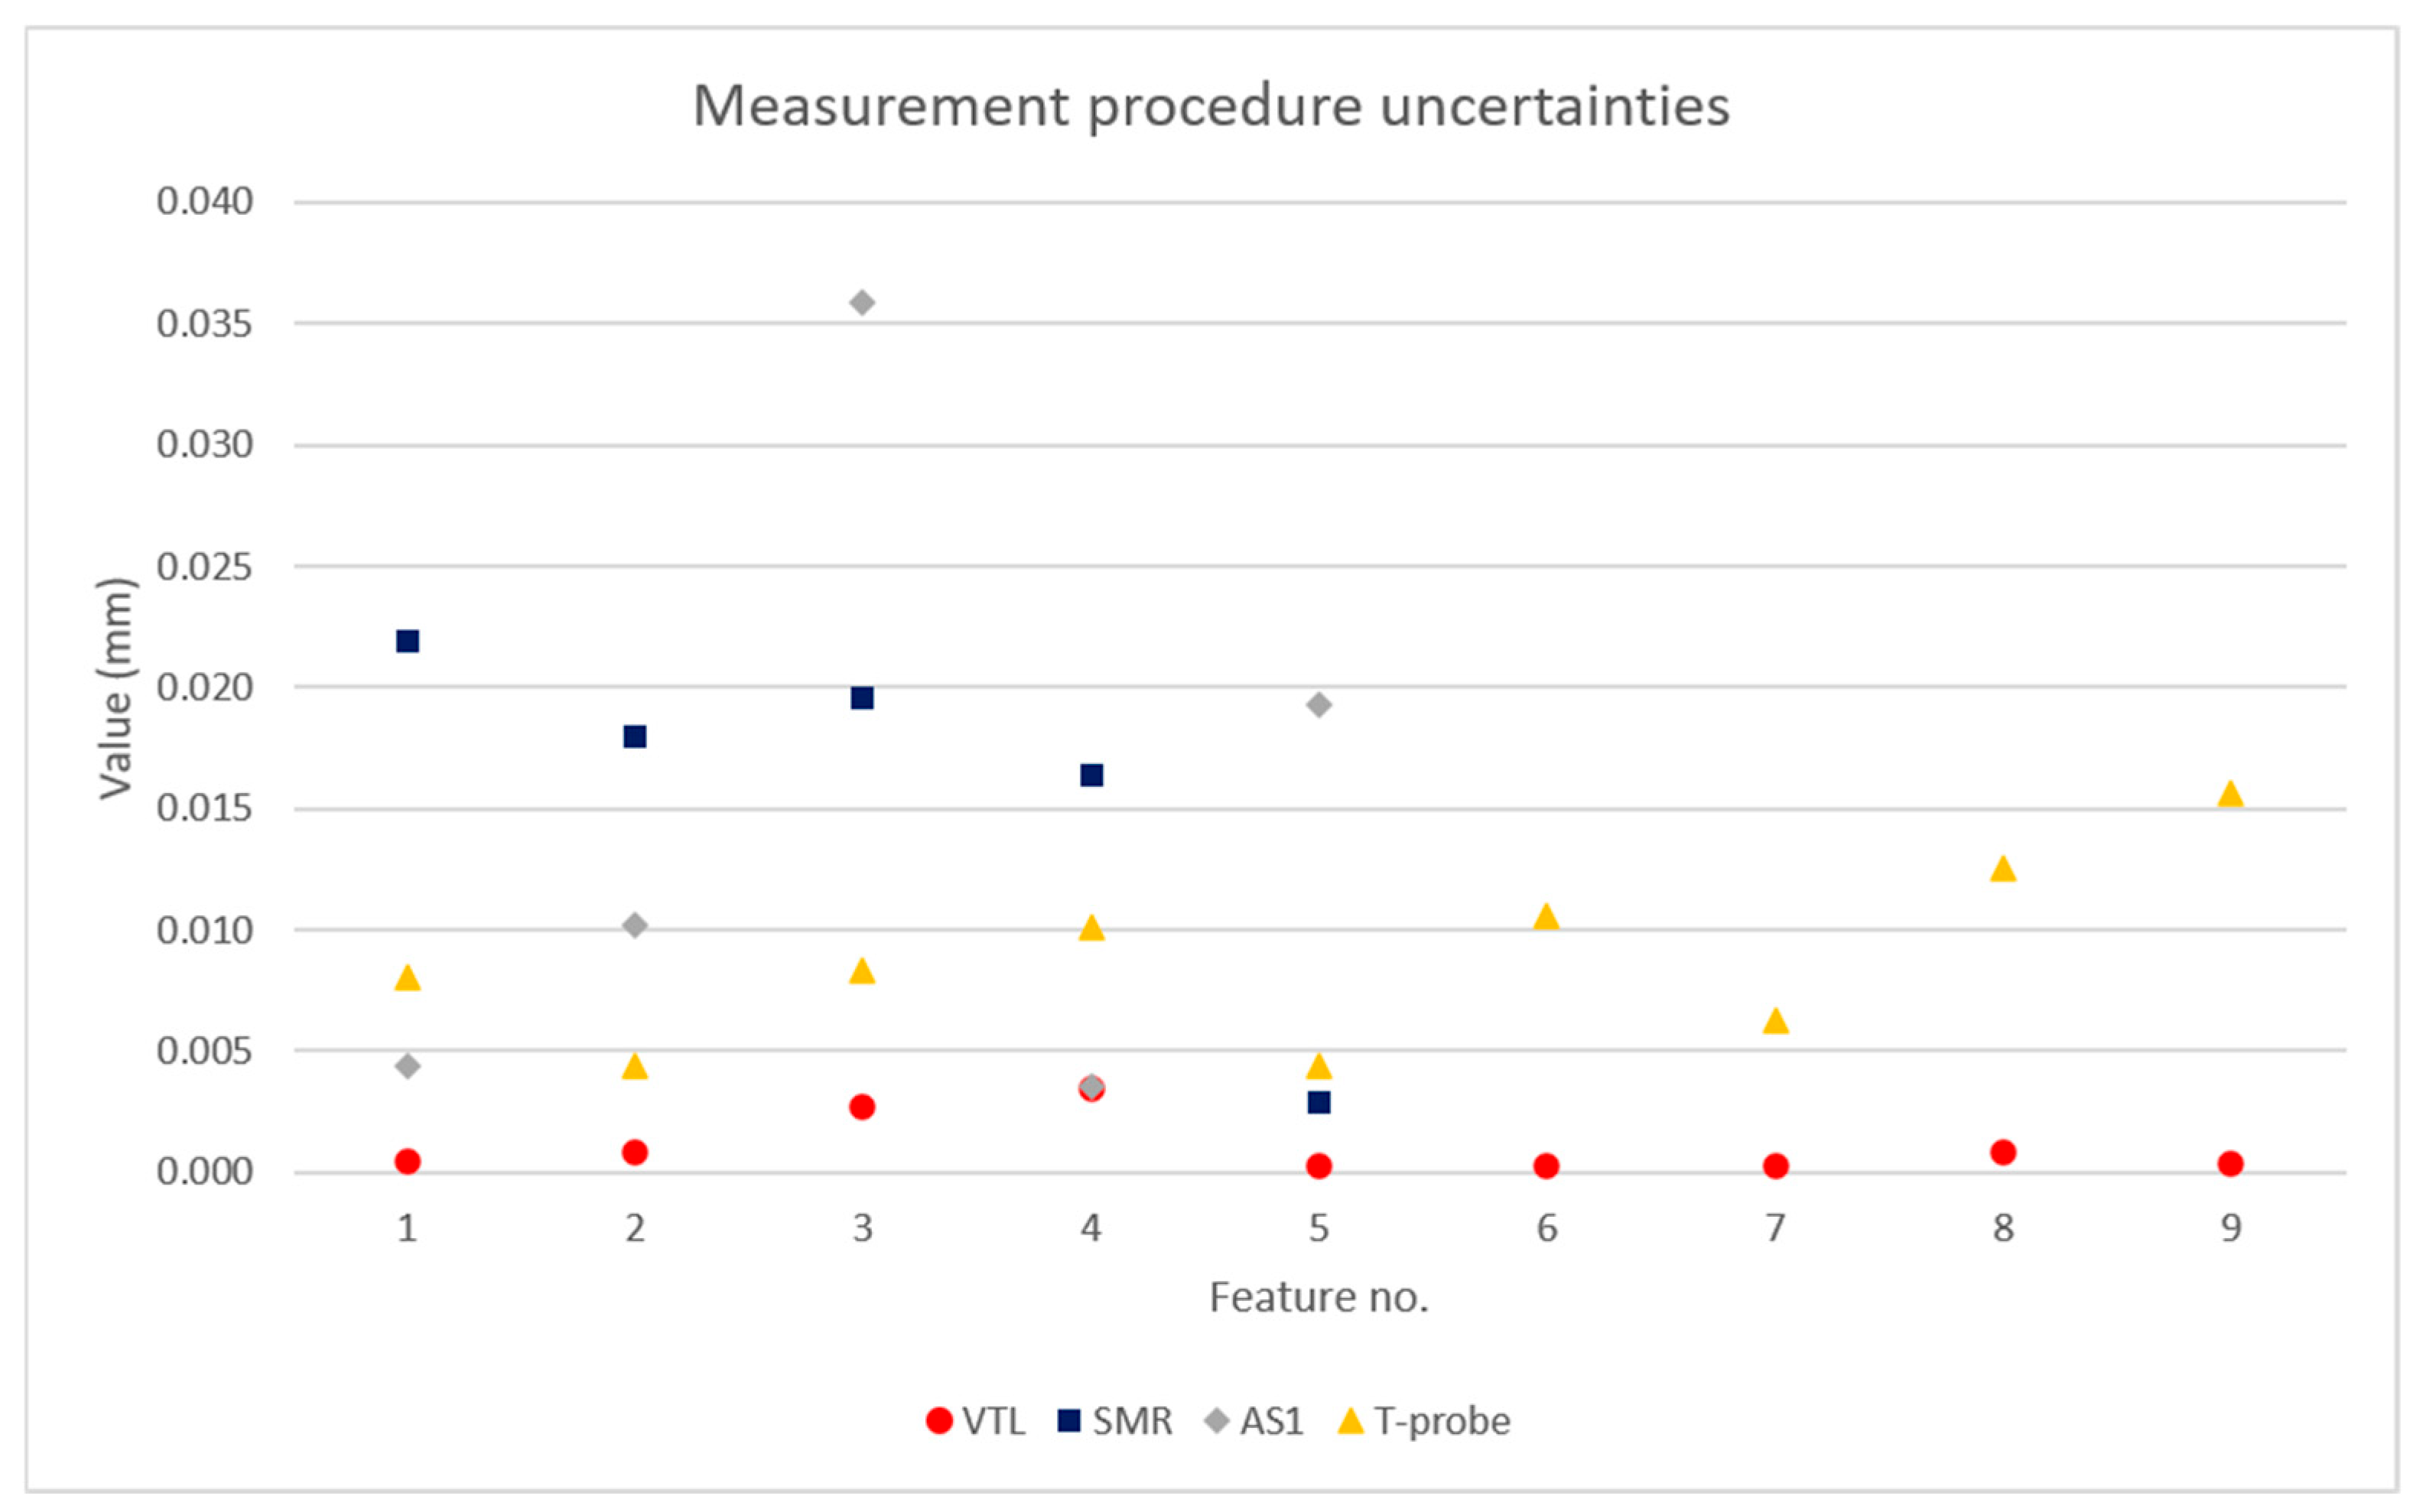
The measurement procedure uncertainties using the VTL, and SMR, AS1 and T-probe are shown in Figure 9.
Figure 9.
Measurement procedure uncertainties using different instruments.
In general, the results show a very good repeatability (less than 5 µm) when using the VTL machine tool but poor repeatability when using the SMR, AS1 and T-probe. In particular, when using the AS1 scanner to measure the X position of concentricity of the ring (Feature 3), the standard deviation exceeds 35 µm. Although the trials were carried out by the same skilled metrology engineer and all points on the workpiece were taken from the same positions (as far as possible), significant random errors are observed on the same feature after repeated measurements. Since the measurements were carried out the same day and the environment had not changed much, we reasonably assume manual operation errors caused large discrepancies in the results, when manually measuring features using the SMR and T-probe. Human manipulation, such as shaking caused by breathing and variations in the pressure applied when holding the T-probe, can affect the measurement repeatability. The measurement errors caused by manual operation are difficult to quantify and avoid. Our current approach is to mitigate this impact by having an experienced operator perform multiple measurements and then taking the average from the results to reduce the uncertainty. Therefore, when using the laser tracker SMR and T-probe, especially when measuring key features with tight tolerance, it is necessary to measure multiple times to mitigate the impact of random errors introduced by manual operations.
5.4. Uncertainty Evaluation Results Using GUM and Adaptive MCM
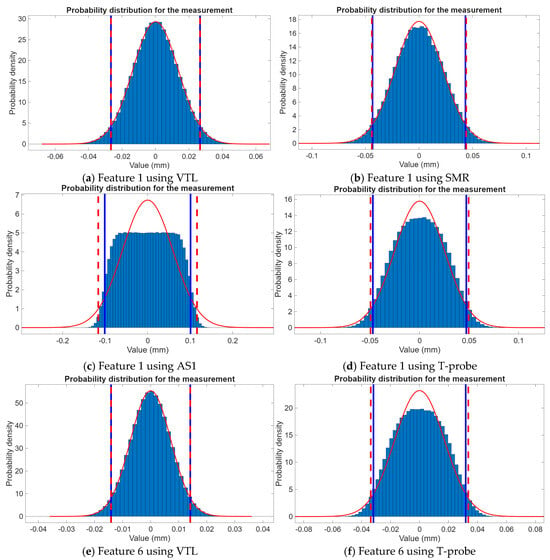
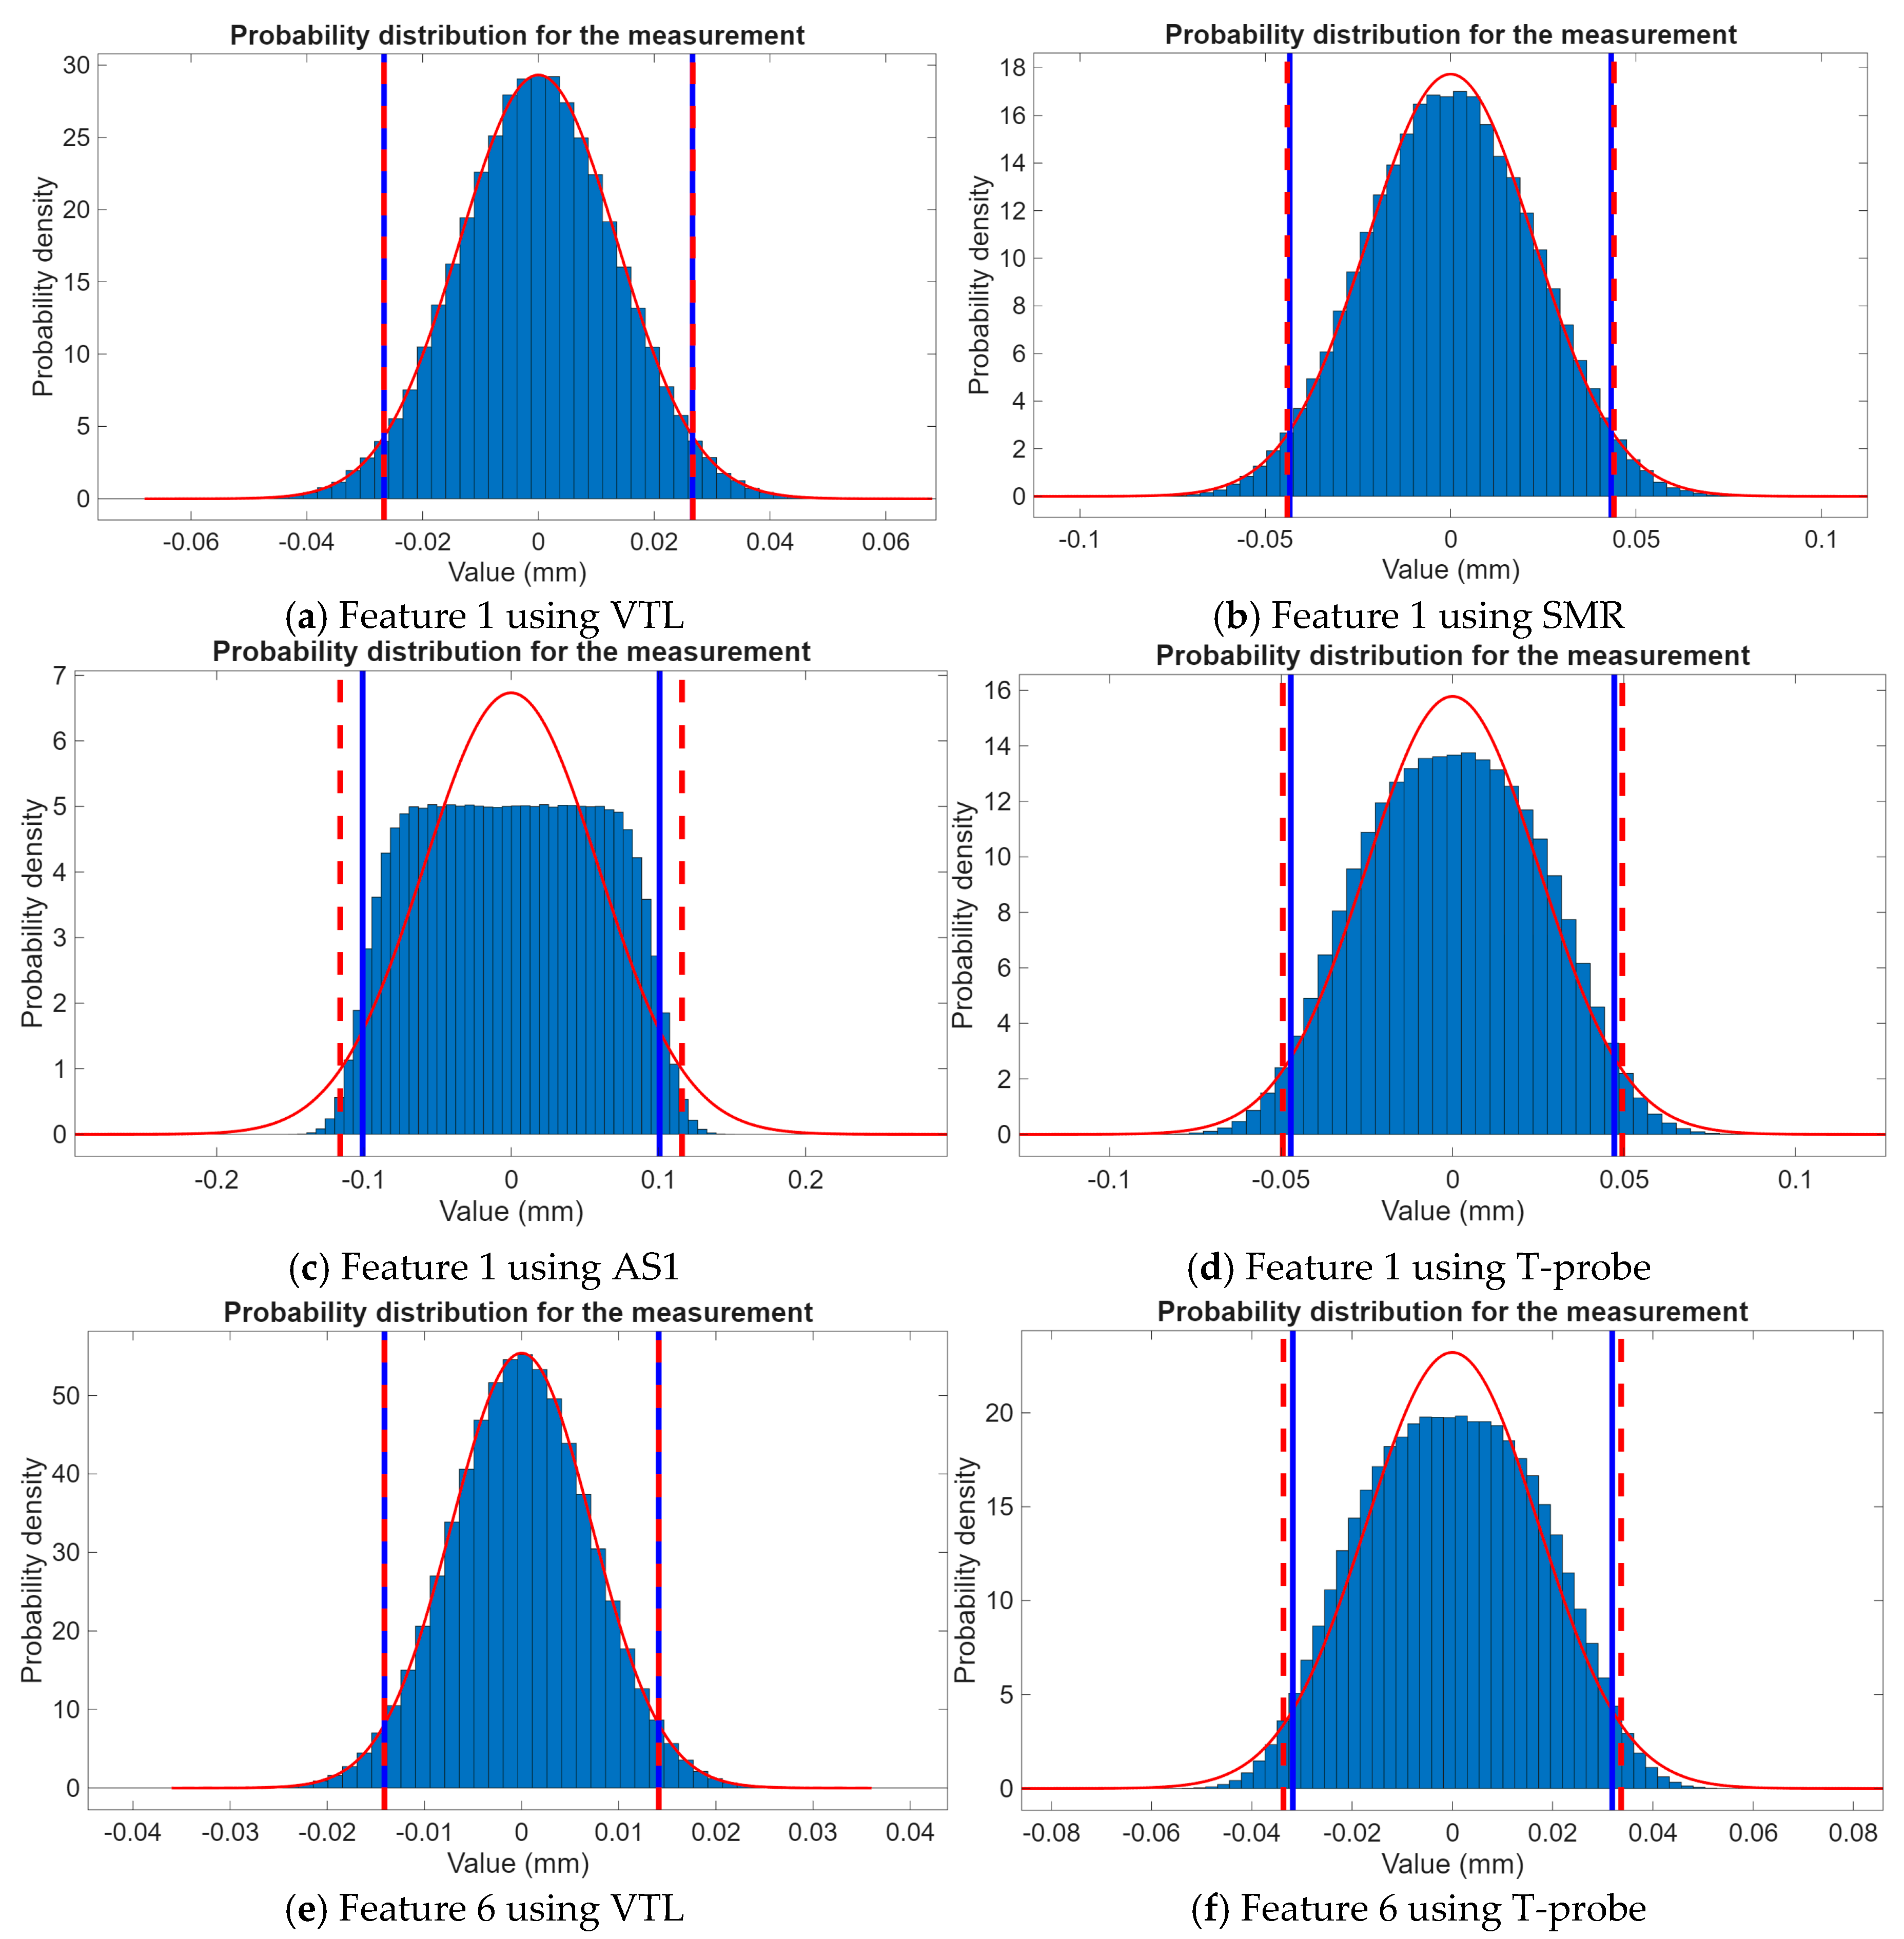
The measurement uncertainty contributors are used as input variables, and the measurement uncertainty can be evaluated using the GUM uncertainty framework and Monte Carlo method, separately. It is worth mentioning that, since the measuring instrument itself has already compensated for the measurement results introduced by the temperature variation, and instrument manufacturers are reluctant to disclose the compensation algorithms, we did not include the uncertainty caused by temperature variations in the calculation to avoid double counting. The measurement uncertainty evaluation and probability density distribution histogram (for Features 1 and 6, with coverage probability ) are shown in Figure 10 (the x-axis is the value for results and the y-axis is the number of iterations × 103). The approximation to the probability distribution obtained from the GUM is displayed as a red continuous curve. And that obtained from the MCM is displayed as a blue histogram (scaled frequency distribution). Between the dashed red lines is the confidence interval evaluated using the GUM and between the solid blue lines is that evaluated using the MCM.
Figure 10.
Probability density and distribution histogram—evaluation using GUM and MCM.
A common rule is that the uncertainty when measuring using the CMM should be at least five times smaller (more accurate) than the part’s tolerance (a 1:5 uncertainty-to-tolerance ratio), which is a widely recognized industrial practice. As stated by Knapp [49], the measurement uncertainty should be less than 10% to 20% of the tolerance. However, the above methods are not practical for large-scale measurements, especially in shop floor conditions. ISO 14253-1:2017 [50] and ISO 230-1:2012 [51] clearly state that any measurement uncertainty reduces the tolerance zone to the so-called zone of conformance, if the conformance with the specification has to be proved. In this work, this rule was used to decide whether the instruments can satisfy tolerance requirements. If this rule is not met, it means that the instrument cannot meet the tolerance requirements.
5.5. Part Conformance Assessment
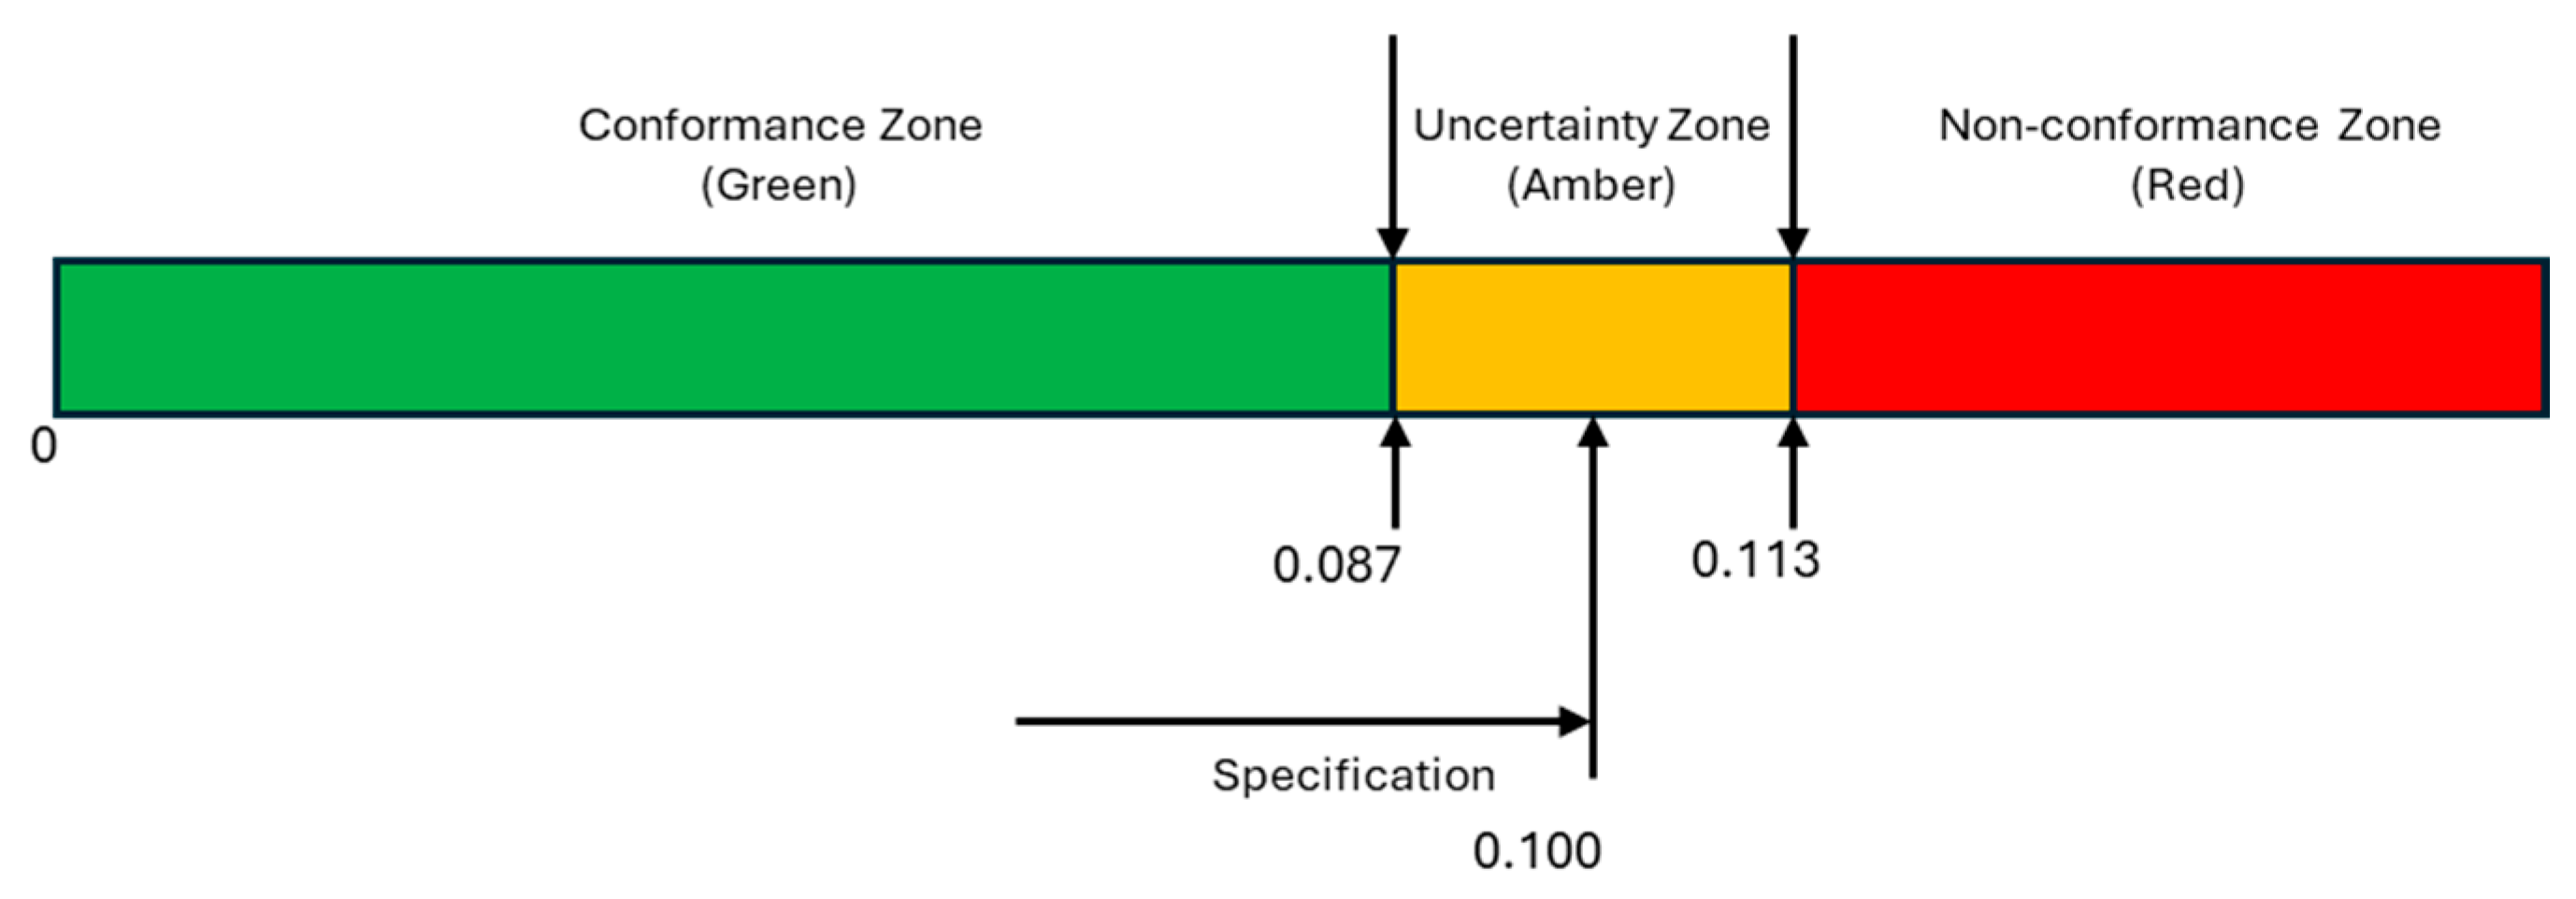
After uncertainty evaluation, a decision can be made on whether the measurements of parts are accepted or rejected, based on ISO 14253-3:2011 [45]. Figure 11 shows an example of the result of error verification. If the tolerance of the feature is 0.100 mm, and the uncertainty confidence interval is [−0.013 mm, 0.013 mm], then the green area is the conformance zone, red is for the non-conformance zone and amber is the uncertainty zone.
Figure 11.
Conformance assessment using ISO 14253-3:2011.
In other words, if the measurement results fall in the conformance zone (green), the feature of the part is accepted; if the measurement results fall in the red area, the feature of the part must be rejected; if the measurement results fall in the amber area, it must be negotiated between the manufacturer and the customer whether the part is accepted or rejected, according to ISO 14253-3:2011.
The final inspection results for all features are listed in Table 6. ‘G’ denotes that the result is evaluated using the GUM framework and ‘M’ for the MCM. ‘N’ indicates the instrument is not applicable for the measurement of the feature. Green represents that the feature of the part is accepted, red is used for rejection, and amber means the decision needs to be made between the supplier and the customer. If manufacturers encounter the ‘amber’ situation, they may have two choices: they can decide whether to accept the feature or not, or they can choose another sensor whose measuring results fall into the green area. Grey indicates the uncertainty is greater than the tolerance, which means the instrument does not meet tolerance requirements for the measurement.
Table 6.
Final inspection results after uncertainty evaluation.
In general, we can see the uncertainties and the coverage intervals are slightly different when using the GUM and MCM; overall, the two evaluation methods achieved good consistency. And the only exception is the evaluation of Feature 5 using the AS1 scanner; this is due to the different statistical and computational methods used by the GUM and MCM.
6. Discussions and Conclusions
With the increasing adoption of Industry 4.0, there has been a significant evolution in the manufacturing shop floor, and the role of metrology has changed accordingly. In recent years, zero-defect manufacturing strategies have been made possible because of the application of on-machine measurement and in-process monitoring. Reliable on-machine/in situ measurements for manufacturing of large-scale components are highly desired by the industry for effective process control and quality assurance. However, the traceability of the measurement process in shop floor conditions is not ensured yet. To meet this challenge, a novel generic uncertainty modelling and evaluation framework for the LSM is introduced for traceable measurement of large-scale parts in situ, and the framework is verified using real data obtained in the manufacturing environment. Experimental results demonstrate that uncertainty evaluation for LSM is crucial for precision manufacturing, and the following conclusions can be obtained:
- (1)
- This work presents a complete methodology for the uncertainty evaluation of LSM in the manufacturing environment. It can be used not only for uncertainty evaluation of large components, but also for parts with small and medium sizes. It can also be exploited for the evaluation of other types of technologies, such as structured light scanners, photogrammetry, etc. It can be used for in-process uncertainty evaluation, and of course, it can also be used for off-line inspection as well.
- (2)
- The methodology can not only assess the true performance of the instruments, but also help determine whether the instrument meets tolerance requirements and whether the final measurement results are accepted or rejected.
- (3)
- The methodology provides theoretical support for instrument selection in terms of specific features. The experimental data indicates that the instrument may meet the tolerance for certain features but may not meet them for another feature; therefore, task-specific uncertainty evaluation must be carried out, especially for key features with tight tolerances.
- (4)
- As recommended by [20], the manufacturing environment and measurement procedure should be similar to the calibration environment during actual measurements. And the uncertainty evaluation results can be considered consistent if the dimensional difference between the calibrated artefact and workpiece does not exceed (a) 10% if the feature is larger than 250 mm or (b) 25 mm if below 250 mm.
- (5)
- The calibration instrument should be traceable; if the calibration process is carried out on the shop floor (e.g., using a large micrometre), more complex factors need to be taken into account, e.g., thermal extension and vibrations in some cases.
- (6)
- The uncertainty results evaluated using the GUM and MCM show good consistency; therefore, users can decide which evaluation method to use or both.
- (7)
- Experimental results show that systematic error () is the main contributor to the VTL on-machine tool measurement, and size measurement results are more accurate than position measurements. Continuous improvements of machine tool software are very necessary, in order to provide more convenient operations and reliable measurement results. When using a laser tracker, especially when measuring large-scale components and features with tight tolerance, multiple repeated measurements are strongly recommended.
Within the next decade, there is an expectation that methods of traceability and calibration will be incorporated into on-machine or in-line measurement in manufacturing environments, which depends on continuous development in sensor technologies for traceable measurements, new calibration methods for the equipment, and standardized methods and procedures.
Author Contributions
Conceptualization, investigation, methodology, software, writing—original draft preparation, funding acquisition, F.L.; writing—review and editing, L.L.; visualization, Y.X.; project administration, S.C. All authors have read and agreed to the published version of the manuscript.
Funding
This research and the APC were funded by the High Value Manufacturing (HVM) Catapult, UK.
Institutional Review Board Statement
Not applicable.
Informed Consent Statement
Not applicable.
Data Availability Statement
The data that support the findings of this study are available from the corresponding author upon request.
Acknowledgments
The authors gratefully acknowledge the support and efforts of the following colleagues: Geoffrey Moreman, Kevin Monaghan and David Stoddart.
Conflicts of Interest
Author Li Li was employed by Rotex Technologies Ltd. The author declares no conflicts of interest. The company had no role in the design of the study; in the collection, analyses, or interpretation of data; in the writing of the manuscript; or in the decision to publish the results.
References
- Imkamp, D.; Berthold, J.; Heizmann, M.; Kniel, K.; Manske, E.; Peterek, M.; Schmitt, R.; Seidler, J.; Sommer, K.D. Challenges and trends in manufacturing measurement technology—The “Industrie 4.0” concept. J. Sens. Sens. Syst. 2016, 5, 325–335. [Google Scholar] [CrossRef] [Scilit]
- Simeone, A.; Caggiano, A.; Boun, L.; Deng, B. Intelligent cloud manufacturing platform for efficient resource sharing in smart manufacturing networks. Procedia CIRP 2019, 79, 233–238. [Google Scholar] [CrossRef] [Scilit]
- Gao, W.; Haitjema, H.; Fang, F.; Leach, R.; Cheung, C.; Savio, E.; Linares, J.-M. On-machine and in-process surface metrology for precision manufacturing. CIRP Ann. 2019, 68, 843–866. [Google Scholar] [CrossRef] [Scilit]
- Kiraci, E.; Palit, A.; Donnelly, M.; Attridge, A.; Williams, M.A. Comparison of in-line and off-line measurement systems using a calibrated industry representative artefact for automotive dimensional inspection. Measurement 2020, 163, 108027. [Google Scholar] [CrossRef] [Scilit]
- Tran, T.-T.; Ha, C. Non-contact gap and flush measurement using monocular structured multi-line light vision for vehicle assembly. Int. J. Control Autom. Syst. 2018, 16, 2432–2445. [Google Scholar]
- Long, K.; Xie, Q.; Lu, D.; Wu, Q.; Liu, Y.; Wang, J. Aircraft skin gap and flush measurement based on seam region extraction from 3D point cloud. Measurement 2021, 176, 109169. [Google Scholar] [CrossRef] [Scilit]
- Chen, Y.; Peng, X.; Kong, L.; Dong, G.; Remani, A.; Leach, R. Defect inspection technologies for additive manufacturing. Int. J. Extrem. Manuf. 2021, 3, 022002. [Google Scholar] [CrossRef] [Scilit]
- McKeown, P.; Wills-Moren, W.; Read, R. In-situ metrology and machine based interferometry for shape determination. In Proceedings of In-Process Optical Metrology for Precision Machining; SPIE: Bellingham, WA, USA, 1987; pp. 42–51. [Google Scholar]
- Takaya, Y. In-process and on-machine measurement of machining accuracy for process and product quality management: A review. Int. J. Autom. Technol. 2014, 8, 4–19. [Google Scholar]
- Goch, G.; Schmitt, R.; Patzelt, S.; Stürwald, S.; Tausendfreund, A. In-situ and in-process metrology for optical surfaces. In Fabrication of Complex Optical Components: From Mold Design to Product; Springer: Berlin/Heidelberg, Germany, 2013; pp. 161–178. [Google Scholar]
- Mutilba, U.; Gomez-Acedo, E.; Kortaberria, G.; Olarra, A.; Yagüe-Fabra, J.A. Traceability of on-machine tool measurement: A review. Sensors 2017, 17, 1605. [Google Scholar] [CrossRef] [Scilit] [PubMed]
- Flack, D. Measurement Good Practice Guide No. 43: CMM Probing; National Physical Laboratory: London, UK, 2001. [Google Scholar]
- Catalucci, S.; Thompson, A.; Piano, S.; Branson, D.T., III; Leach, R. Optical metrology for digital manufacturing: A review. Int. J. Adv. Manuf. Technol. 2022, 120, 4271–4290. [Google Scholar] [CrossRef] [Scilit]
- Papavasileiou, A.; Michalos, G.; Makris, S. Quality control in manufacturing—Review and challenges on robotic applications. Int. J. Comput. Integr. Manuf. 2025, 38, 79–115. [Google Scholar] [CrossRef] [Scilit]
- Li, F.; Longstaff, A.P.; Fletcher, S.; Myers, A. Rapid and accurate reverse engineering of geometry based on a multi-sensor system. Int. J. Adv. Manuf. Technol. 2014, 74, 369–382. [Google Scholar] [CrossRef] [Scilit]
- Liliana, L. A new model of Ishikawa diagram for quality assessment. In Proceedings of IOP Conference Series: Materials Science and Engineering; IOP Publishing: Bristol, UK, 2016. [Google Scholar]
- Schmitt, R.; Peterek, M.; Morse, E.; Knapp, W.; Galetto, M.; Härtig, F.; Goch, G.; Hughes, B.; Forbes, A.; Estler, W. Advances in large-scale metrology–review and future trends. CIRP Ann. 2016, 65, 643–665. [Google Scholar]
- Shimizu, Y.; Chen, L.-C.; Kim, D.W.; Chen, X.; Li, X.; Matsukuma, H. An insight into optical metrology in manufacturing. Meas. Sci. Technol. 2021, 32, 042003. [Google Scholar] [CrossRef] [Scilit]
- Martin, O.C.; Robson, S.; Kayani, A.; Muelaner, J.E.; Dhokia, V.; Maropoulos, P.G. Comparative Performance between Two Photogrammetric Systems and a Reference Laser Tracker Network for Large-Volume Industrial Measurement. Photogramm. Rec. 2016, 31, 348–360. [Google Scholar]
- BS EN ISO 15530-3:2011; Geometrical Product Specifications (GPS)–Coordinate Measuring Machines (CMM): Technique for Determining the Uncertainty of Measurement–Part 3: Use of Calibrated Workpieces or Measurement Standards. ISO: Geneva, Switzerland, 2011; p. 2011.
- BS EN ISO 15530-4:2008; Geometrical Product Specifications (GPS)—Coordinate Measuring Machines (CMM): Technique for Determining the Uncertainty of Measurement—Part 4: Evaluating Task-Specific Measurement Uncertainty Using Simulation Standards. ISO: Geneva, Switzerland, 2008.
- JCGM 101:2008; Evaluation of Measurement Data—Supplement 1 to the “Guide to the Expression of Uncertainty in Measurement”—Propagation of Distributions Using a Monte Carlo Method. Joint Committee for Guides in Metrology: Sèvres, France, 2008.
- JCGM 100:2008; Evaluation of Measurement Data—Guide to the Expression of Uncertainty in Measurement. Joint Committee for Guides in Metrology: Sèvres, France, 2008.
- VDI/VDE 2617–7; Accuracy of Coordinate Measuring Machines—Parameters and Their Checking. Estimation of Measurement Uncertainty of Coordinate Measuring Machines by Means of Simulation. VDI/VDE: Berlin, Germany, 2014.
- Estler, W.T.; Edmundson, K.; Peggs, G.; Parker, D. Large-scale metrology—An update. CIRP Ann. 2002, 51, 587–609. [Google Scholar] [CrossRef] [Scilit]
- Puttock, M. Large-scale metrology. Ann. CIRP 1978, 21, 351–356. [Google Scholar]
- Muelaner, J.E.; Cai, B.; Maropoulos, P.G. Large-volume metrology instrument selection and measurability analysis. Proc. Inst. Mech. Eng. Part B J. Eng. Manuf. 2010, 224, 853–868. [Google Scholar]
- Wen, X.L.; Zhu, X.C.; Zhao, Y.B.; Wang, D.X.; Wang, F.L. Flatness error evaluation and verification based on new generation geometrical product specification (GPS). Precis. Eng. 2012, 36, 70–76. [Google Scholar] [CrossRef] [Scilit]
- Wen, X.L.; Zhao, Y.B.; Wang, D.X.; Pan, J. Adaptive Monte Carlo and GUM methods for the evaluation of measurement uncertainty of cylindricity error. Precis. Eng. 2013, 37, 856–864. [Google Scholar] [CrossRef] [Scilit]
- Cuypers, W.; Van Gestel, N.; Voet, A.; Kruth, J.-P.; Mingneau, J.; Bleys, P. Optical measurement techniques for mobile and large-scale dimensional metrology. Opt. Lasers Eng. 2009, 47, 292–300. [Google Scholar] [CrossRef] [Scilit]
- Galetto, M.; Mastrogiacomo, L.; Maisano, D.; Franceschini, F. Cooperative fusion of distributed multi-sensor LVM (Large Volume Metrology) systems. CIRP Ann. 2015, 64, 483–486. [Google Scholar] [CrossRef] [Scilit]
- Gayton, G.; Su, R.; Leach, R. Model-based uncertainty estimation of uncertainty for fringe projection. In Proceedings of the 10th International Symposium on Measurement Technology and Intelligent Instruments, Niigata, Japan, 29 June–2 July 2019. [Google Scholar]
- Song, H.; Kong, L.; Tang, X.; An, H. Uncertainty of digital fringe projection measurement caused by structural parameters. Opt. Commun. 2024, 551, 130044. [Google Scholar]
- Gąska, A.; Harmatys, W.; Gąska, P.; Gruza, M.; Gromczak, K.; Ostrowska, K. Virtual CMM-based model for uncertainty estimation of coordinate measurements performed in industrial conditions. Measurement 2017, 98, 361–371. [Google Scholar] [CrossRef] [Scilit]
- Mutilba, U.; Sandá, A.; Vega, I.; Gomez-Acedo, E.; Bengoetxea, I.; Fabra, J.A.Y. Traceability of on-machine tool measurement: Uncertainty budget assessment on shop floor conditions. Measurement 2019, 135, 180–188. [Google Scholar] [CrossRef] [Scilit]
- Zhao, Y.; Cheng, Y.; Xu, Q.; Luo, Z.; Wang, X.; Li, H. Uncertainty modeling and evaluation of profile measurement by structured light scanner. Meas. Sci. Technol. 2022, 33, 095018. [Google Scholar] [CrossRef] [Scilit]
- Muralikrishnan, B.; Phillips, S.; Sawyer, D. Laser trackers for large-scale dimensional metrology: A review. Precis. Eng. 2016, 44, 13–28. [Google Scholar] [CrossRef] [Scilit]
- Hughes, B.; Campbell, M.A.; Lewis, A.J.; Lazzarini, G.M.; Kay, N. Development of a high-accuracy multi-sensor, multi-target coordinate metrology system using frequency scanning interferometry and multilateration. In Proceedings of SPIE Optical Metrology; SPIE: Bellingham, WA, USA, 2017. [Google Scholar]
- Wiemann, A.-K.; Stein, M.; Kniel, K. Traceable metrology for large involute gears. Precis. Eng. 2019, 55, 330–338. [Google Scholar] [CrossRef] [Scilit]
- Carmignato, S.; De Chiffre, L.; Bosse, H.; Leach, R.; Balsamo, A.; Estler, W. Dimensional artefacts to achieve metrological traceability in advanced manufacturing. CIRP Ann. 2020, 69, 693–716. [Google Scholar] [CrossRef] [Scilit]
- Icasio-Hernández, O.; Bellelli, D.A.; Vieira, L.H.B.; Cano, D.; Muralikrishnan, B. Validation of the network method for evaluating uncertainty and improvement of geometry error parameters of a laser tracker. Precis. Eng. 2021, 72, 664–679. [Google Scholar] [CrossRef] [Scilit] [PubMed]
- Zhao, F.; Tang, H.; Zou, X.; Li, X. A review of optical metrology techniques for advanced manufacturing applications. Micromachines 2025, 16, 1224. [Google Scholar] [CrossRef] [Scilit] [PubMed]
- Schmelter, S.; Fortmeier, I.; Heißelmann, D. Metrology for Virtual Measuring Instruments Illustrated by Three Applications. Metrology 2025, 5, 54. [Google Scholar] [CrossRef] [Scilit]
- Marschall, M.; Hughes, F.; Wübbeler, G.; Kok, G.; van Dijk, M.; Elster, C. Using a multivariate virtual experiment for uncertainty evaluation with unknown variance. Metrology 2024, 4, 534–546. [Google Scholar] [CrossRef] [Scilit]
- BS EN ISO 14253-3:2011; Geometrical Product Specifications (GPS)—Inspection by Measurement of Workpieces and Measuring Equipment—Part 3: Guidelines for Achieving Agreements on Measurement Uncertainty Statements. ISO: Geneva, Switzerland, 2011.
- Cox, M.G.; Siebert, B.R. The use of a Monte Carlo method for evaluating uncertainty and expanded uncertainty. Metrologia 2006, 43, S178. [Google Scholar] [CrossRef] [Scilit]
- Wilhelm, R.; Hocken, R.; Schwenke, H. Task specific uncertainty in coordinate measurement. CIRP Ann. 2001, 50, 553–563. [Google Scholar] [CrossRef] [Scilit]
- BS EN ISO 14253-2:2011; Geometrical Product Specifications (GPS)—Inspection by Measurement of Workpieces and Measuring Equipment. Part 2: Guidance for the Estimation of Uncertainty in GPS Measurement, in Calibration of Measuring Equipment and in Product Verification. ISO: Geneva, Switzerland, 2011.
- Knapp, W. Tolerance And Uncertainty. WIT Trans. Eng. Sci. 2001, 34. Available online: www.witpress.com (accessed on 12 June 2026).
- BS EN ISO 14253-1:2017; Geometrical Product Specifications (GPS)—Inspection by Measurement of Workpieces and Measuring Equipment. Part 1: Decision Rules for Verifying Conformity or Nonconformity with Specifications. ISO: Geneva, Switzerland, 2017.
- ISO 230-1; Test Code for Machine Tools Part 1: Geometric Accuracy of Machines Operating Under No-Load or Quasi-Static Conditions. ISO: Geneva, Switzerland, 2012.

Disclaimer/Publisher’s Note: The statements, opinions and data contained in all publications are solely those of the individual author(s) and contributor(s) and not of MDPI and/or the editor(s). MDPI and/or the editor(s) disclaim responsibility for any injury to people or property resulting from any ideas, methods, instructions or products referred to in the content. |
© 2026 by the authors. Licensee MDPI, Basel, Switzerland. This article is an open access article distributed under the terms and conditions of the Creative Commons Attribution (CC BY) license.