


Abstract
Two-dimensional transition metal dichalcogenides (TMDCs) require highly controllable and scalable synthesis methods for successful integration into next-generation optoelectronic technologies. This study presents a modified two-step thermally assisted conversion approach for synthesizing 2D tungsten diselenide (WSe2) by introducing an intermediate UV–ozone treatment. Magnetron-sputtered tungsten films are exposed to UV–ozone, converting the precursor into a uniform, dense layer of amorphous tungsten trioxide (WO3) prior to the selenization process via chemical vapor deposition. X-ray photoelectron spectroscopy and Raman spectroscopy confirm the complete phase transition from the oxidized precursor to the 2H-WSe2 crystal lattice. Morphological evaluations utilizing transmission electron microscopy and atomic force microscopy demonstrate that the ozonated precursors yield highly uniform, triangular flakes exceeding 5 µm in lateral size, effectively eliminating the unreacted WO3 phases observed in untreated samples. Furthermore, the intermediate oxidation step finetunes the electronic band structure; the resulting WSe2 exhibits an enhanced p-type character with a valence band maximum shift to 0.35 eV, a tuning attributed to residual oxygen doping. Optical characterizations reveal significantly improved transmittance in the visible spectrum, accompanied by excitonic absorption shifts indicative of reduced layer dimensionality. This intermediate ozonation strategy provides a highly effective pathway for producing high-quality WSe2 nanosheets with tailored structural and optoelectronic properties.
1. Introduction
Two-dimensional (2D) transition metal dichalcogenides (TMDCs) have attracted great attention due to their unique electronic, optical, and mechanical properties [1,2]. Unlike graphene, which is restricted by its lack of a natural bandgap, TMDCs can be engineered to have a highly functional bandgap. Most notably, they undergo a transition from an indirect bandgap in their bulk form to a direct bandgap when scaled down to a single monolayer [3]. This allows precise tuning of their electrical and optical behavior. TMDCs possess extremely strong light–matter interactions. They offer excellent photoluminescence and can efficiently absorb and convert light, making them vastly superior to traditional silicon-based structures for certain photonic applications [4]. TMDCs feature strong in-plane covalent bonds but weak out-of-plane van der Waals forces, allowing them to be exfoliated into incredibly thin, robust sheets. These sheets possess high mechanical strength, tremendous strain tolerance, and high conformability, meaning they can be bent and stretched without losing their structural integrity [5]. TMDCs naturally exhibit high charge carrier mobility and a high current on/off ratio, which are essential for creating fast, low-power electronics [6].
Tungsten diselenide (WSe2), a prominent TMDC, exhibits a layered hexagonal crystal structure, with each layer consisting of a plane of transition metal atoms (W) sandwiched between two planes of chalcogenide atoms (Se). Within each layer, atoms are held together by strong covalent bonds, while the adjacent layers are bound by weak van der Waals forces [7]. This unique arrangement enables easy exfoliation into two-dimensional (2D) forms, providing opportunities for tuning its properties and enabling device integration. WSe2 exhibits excellent semiconducting behavior, transitioning from an indirect bandgap of approximately 1.2–1.3 eV in its bulk (3D) form to a direct bandgap of around 1.6–1.8 eV in its monolayer (2D) form [8,9]. Additionally, it demonstrates high carrier mobility (>150 cm2 V−1 s−1) compared to the bulk WSe2 [10], alongside strong spin–orbit coupling and photoluminescence [11]. These properties make it highly suitable for applications in electronics, valleytronics [12], optoelectronics, energy conversion, and sensing technologies [13,14,15].
The integration of two-dimensional transition metal dichalcogenides into next-generation technologies requires highly controllable and scalable synthesis methods. While traditional bottom-up synthesis methods like chemical vapor deposition (CVD) [16,17,18,19], metal–organic CVD (MOCVD), and Molecular Beam Epitaxy (MBE) [20,21] can yield high-quality crystals, they frequently encounter challenges related to slow nucleation rates and complex mass-transport dynamics. To address these limitations, the two-step conversion (2SC) technique—also widely referred to in the literature as thermally assisted conversion (TAC) or two-step CVD [22,23]—has emerged as a highly versatile and scalable alternative for large-area thin film production. However, traditional TAC approaches often suffer from incomplete phase conversion, leaving unreacted precursor phases in the final material.
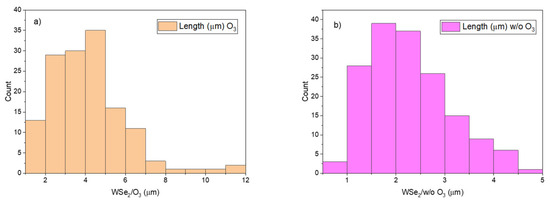
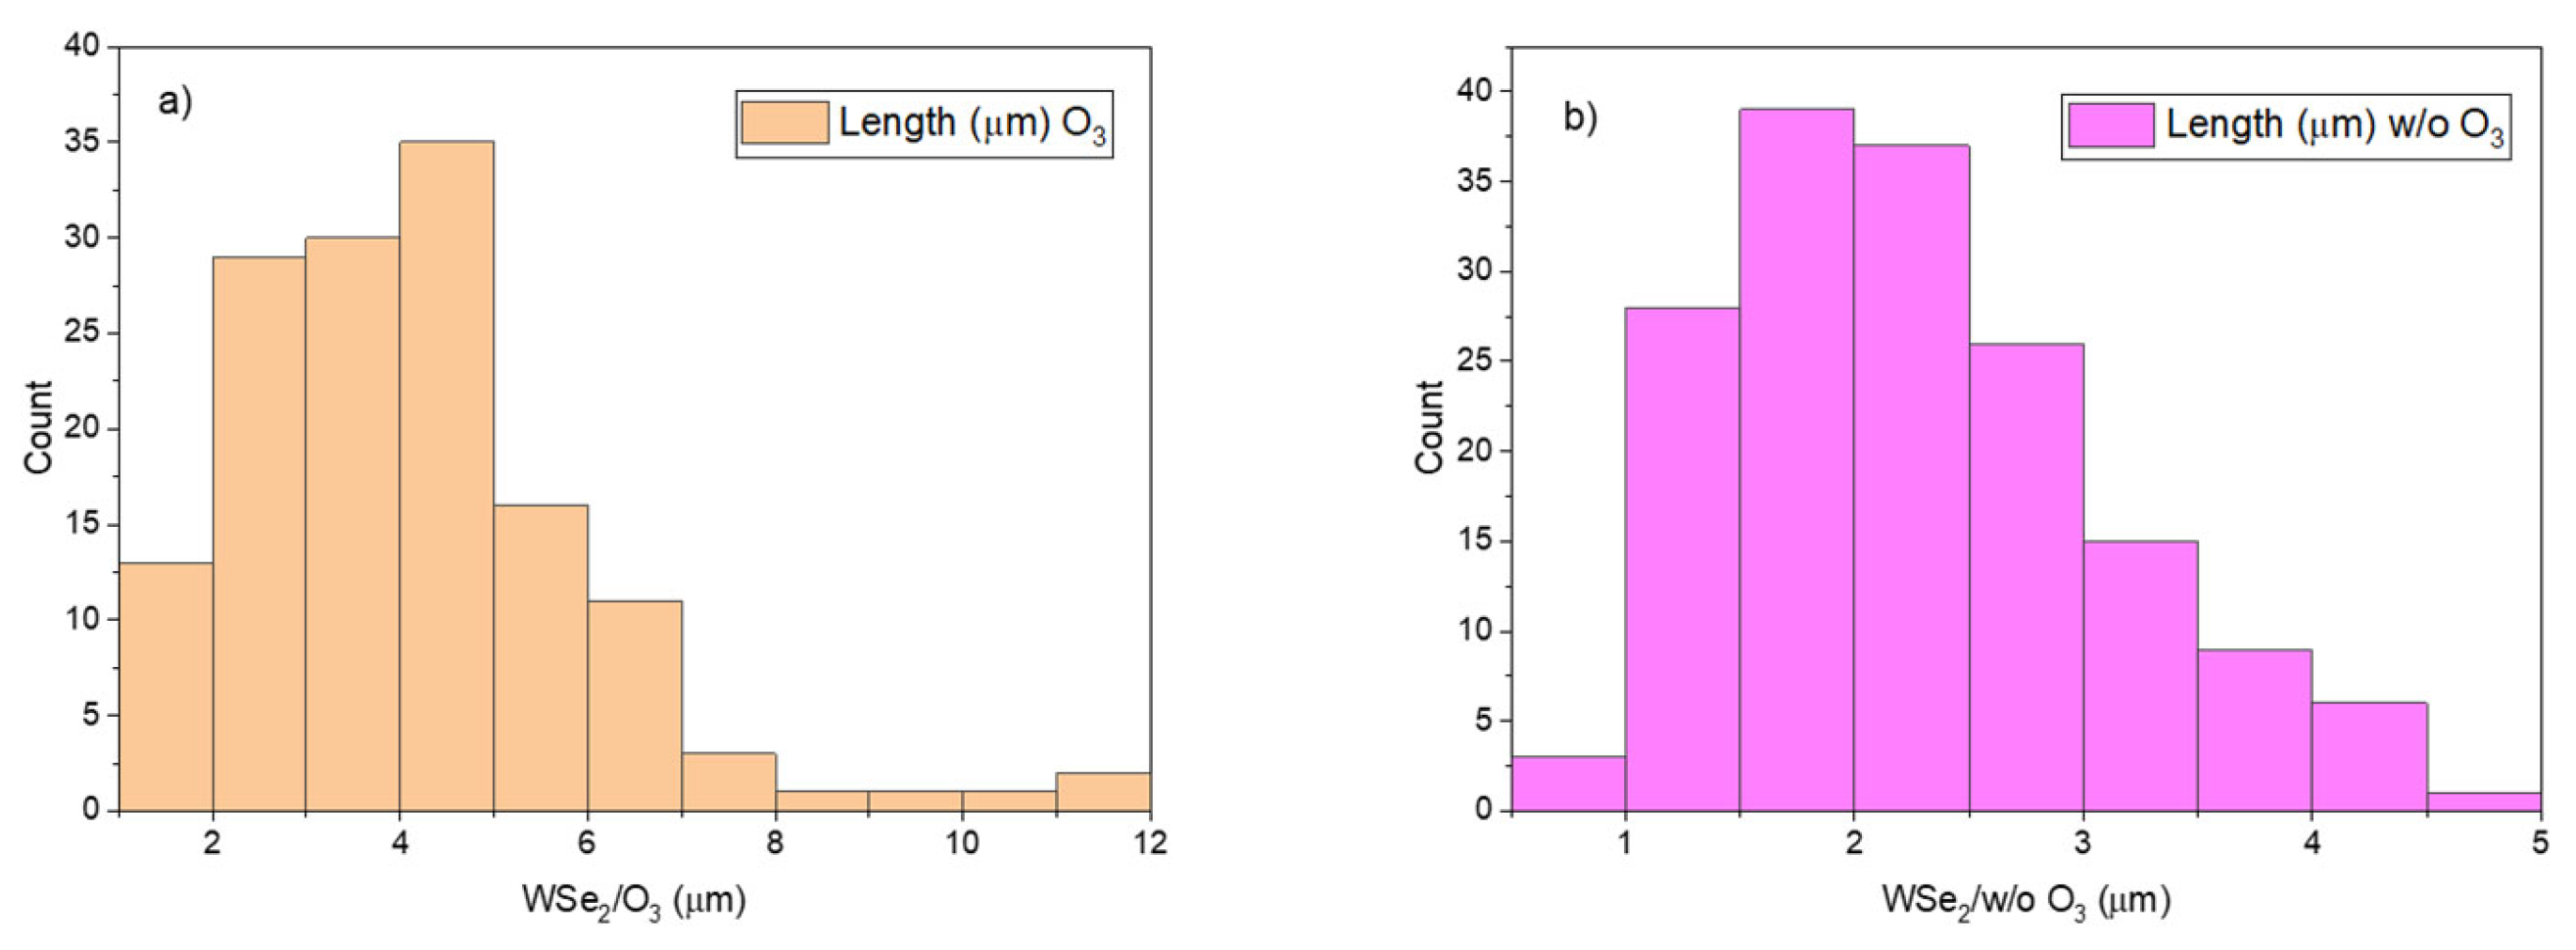
To overcome synthesis barriers, our approach introduces an intermediate UV–ozone treatment that converts the W layer into a dense, uniform amorphous WO3 layer prior to selenization. This effectively eliminates unreacted WOx phases and enables precise morphological control. Statistical analysis of flake lateral sizes quantitatively confirms the impact on WSe2 growth kinetics: while untreated samples exhibit lateral sizes predominantly between 1.5 µm and 3.5 µm (terminating near 5.0 µm), the UV–ozone treatment drastically shifts the distribution toward larger dimensions. Treated samples display a primary peak between 4.0 µm and 5.0 µm, with a substantial population of flakes reaching up to 12.0 µm. These findings substantiate that this modified precursor oxidation methodology effectively promotes the expansive two-dimensional lateral growth necessary for advanced optoelectronic integration.
Further, we employed various characterization techniques, including optical spectrophotometry, Raman spectroscopy, TEM, X-ray photoelectron spectroscopy (XPS), and atomic force microscopy (AFM), to analyze the synthesized WSe2 flakes. The primary goal is to evaluate the additional step during the TAC synthesis and to produce WSe2 nanosheets with tailored lateral sizes and thicknesses, which can enable further integration into advanced electronic and optoelectronic devices.
Here, we report details of 2D WSe2 flake synthesis—from W layer deposition through intermediate ozone treatment of the W precursor layer to selenization. Next, comparison analysis performed by transmission electron microscopy (TEM) and atomic force microscopy (AFM) reveals different flake sizes (in times). Analysis of XPS and Raman modes confirm the synthesized material quality in 2D form. Ultimately, the primary goal of this study is to evaluate the structural, morphological, and optical improvements imparted by this intermediate UV–ozone step, presenting a robust pathway for producing high-quality WSe2 nanosheets tailored for next-generation devices.
Positioning Relative to Existing Synthetic Frameworks
The novelty of our synthesis approach is that the UV–ozone step is applied to the tungsten precursor before selenization, to set the oxidation state of a uniform amorphous WO3 conversion layer, rather than being applied to an already-formed WSe2 for surface p-doping/layer-thinning. To clarify the novelty of the present route, Table 1 contrasts it with the principal established methods for producing WSe2 and with prior uses of UV/ozone oxidation in WSe2 processing.
Table 1.
Comparison of WSe2 synthesis/oxidation strategies.
2. Materials and Methods
2.1. Synthesis Method
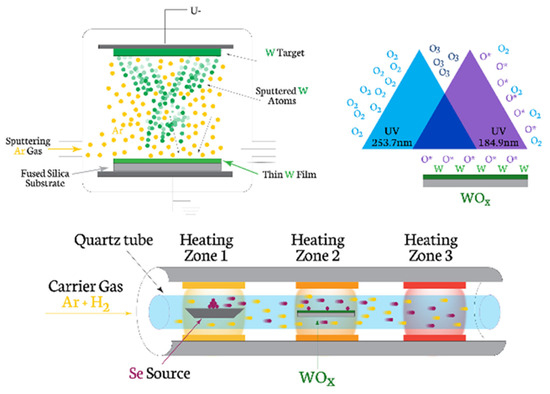
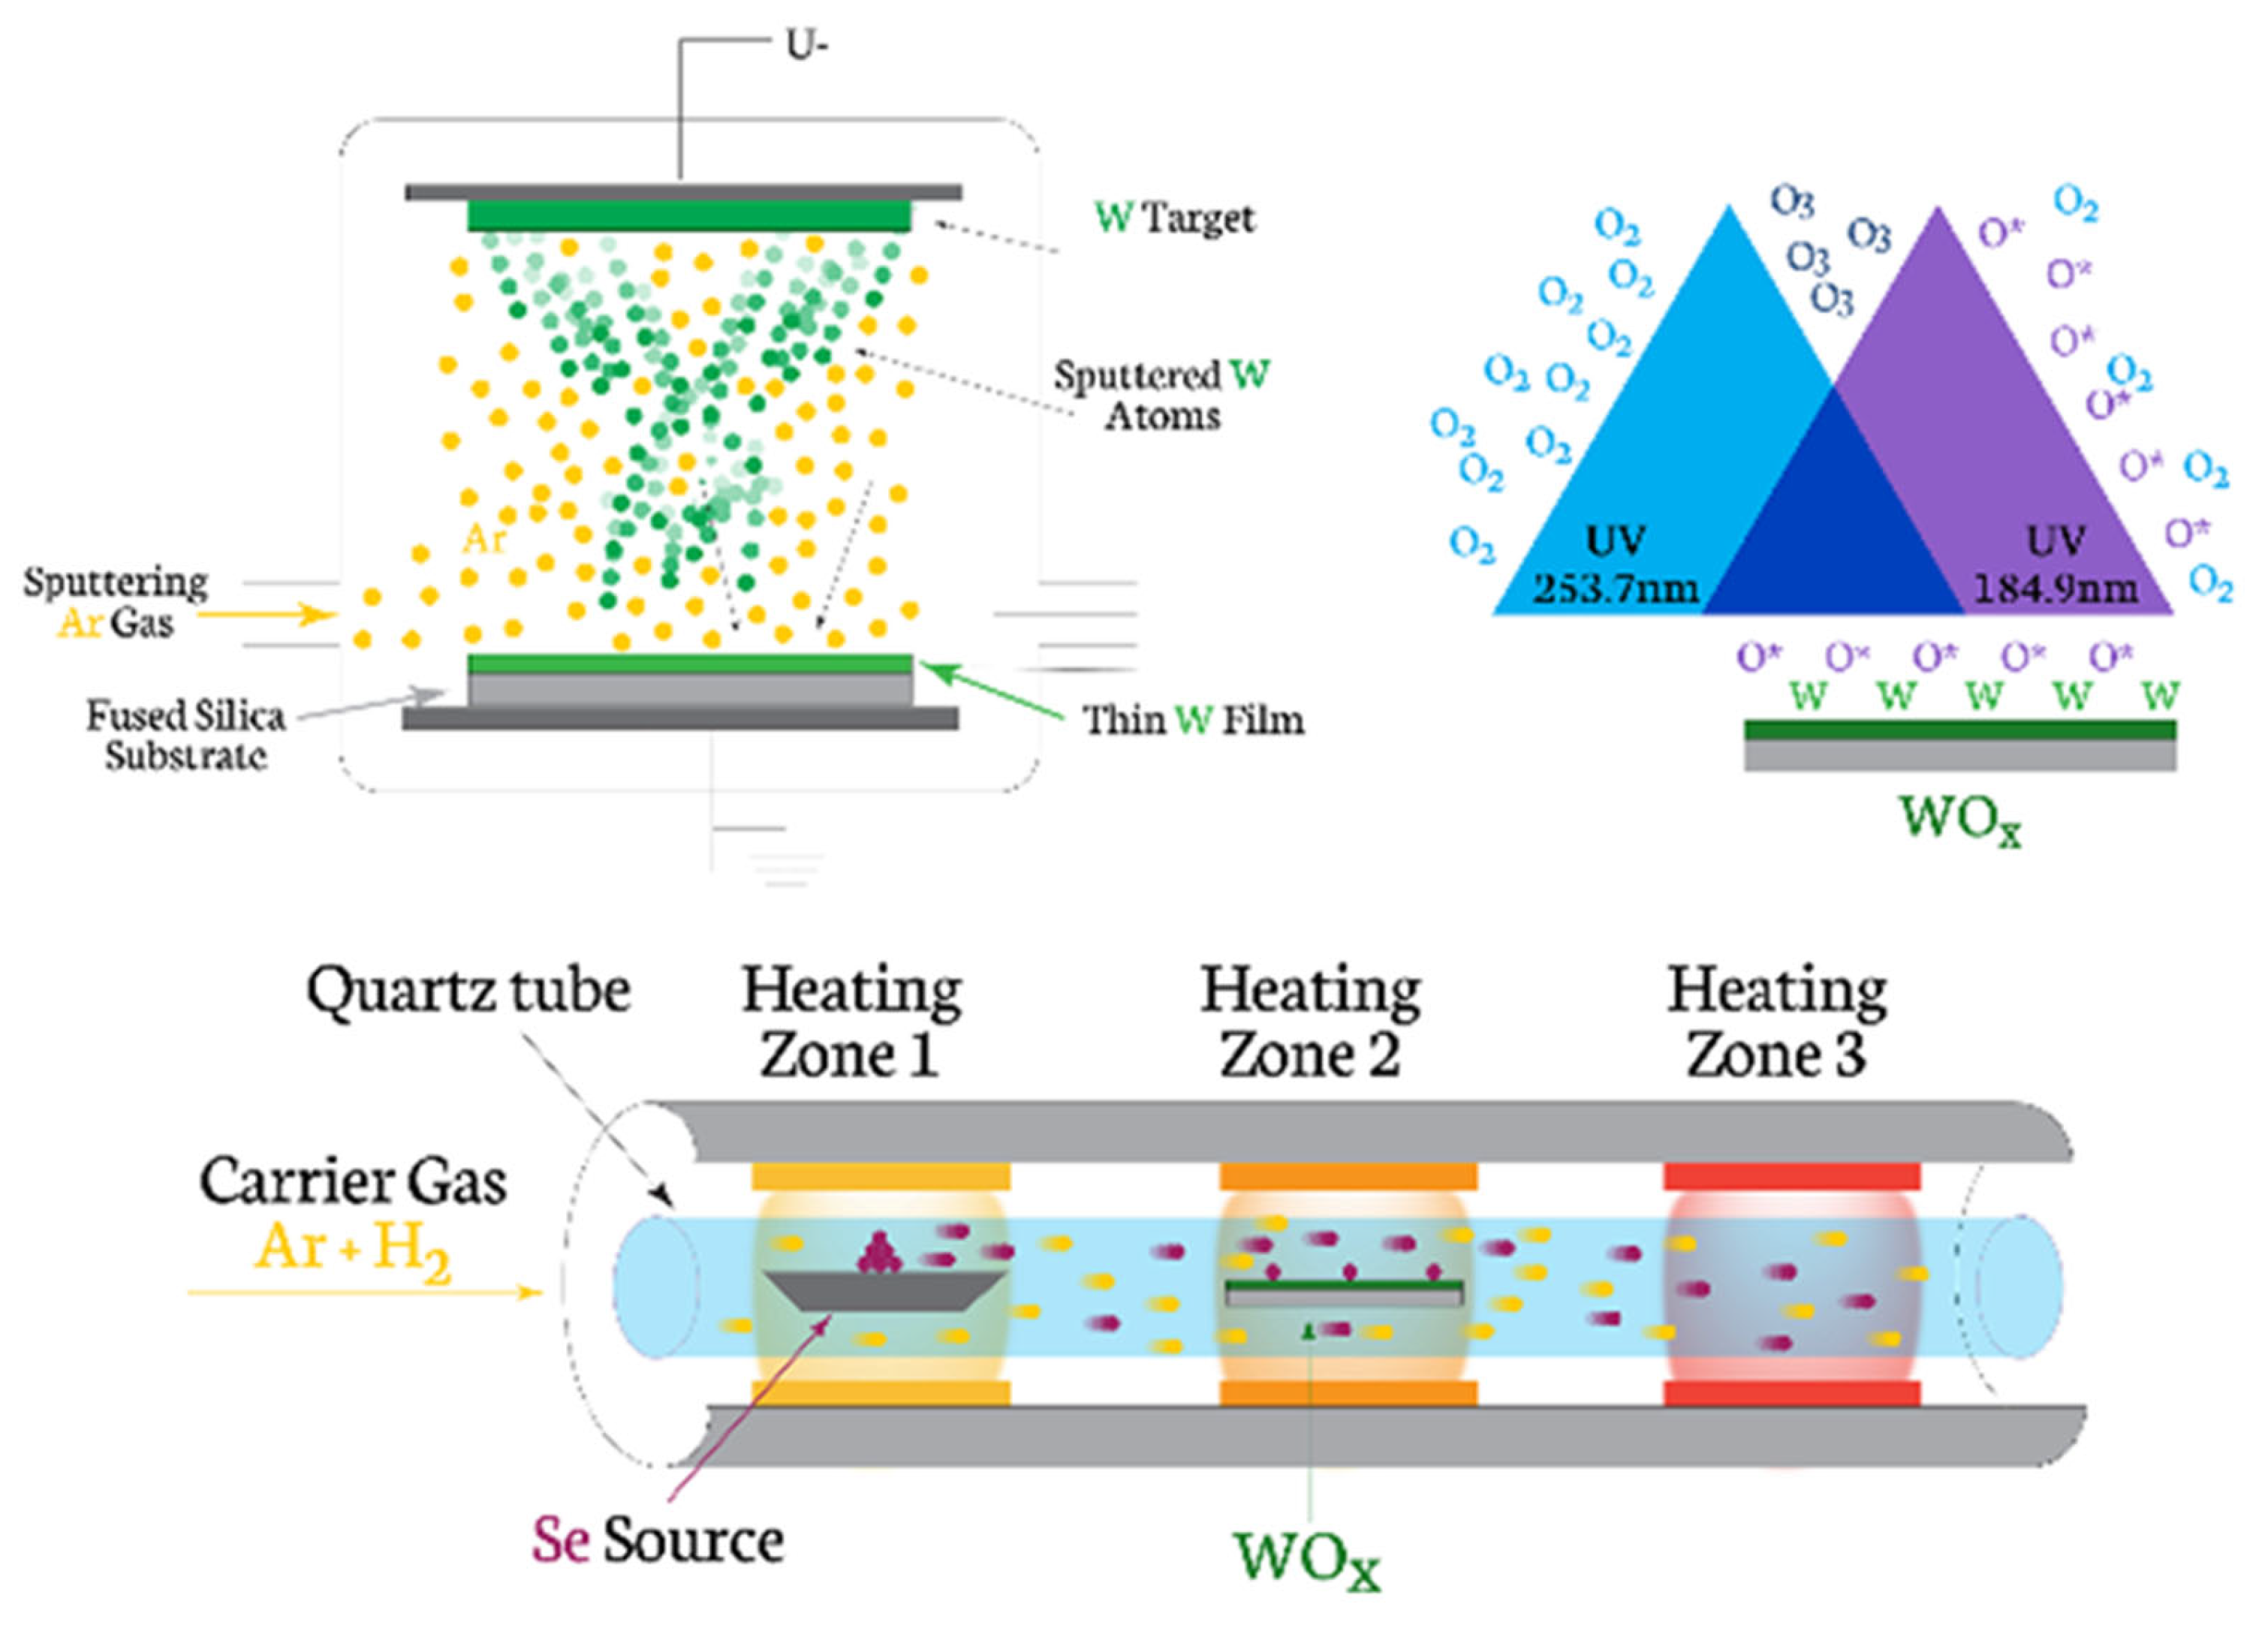
The synthesis approach (Figure 1) follows the two-step conversion/thermally assisted conversion (TAC) method [21]: First the tungsten layer has been deposited on quartz/fused silica substrates by magnetron sputtering. The sputtering process used an applied power of up to 300 W in a vacuum chamber at a pressure of 6 × 10⁻¹ torr providing the sputtering deposition time of 8 s. The deposited tungsten films were then converted to WO3 by an intermediate ozonation step for 20 min. The UV–ozone treatment was performed in a closed chamber with atmospheric pressure and at room temperature. The UV source emits UV radiation with a wavelength of 184.9 nm, which is absorbed by oxygen (O2) to produce ozone (O3), and UV radiation with a wavelength of 253.7 nm, which is absorbed by the O3 product, causing it to decompose into O2 and a free oxide ion (O*). Freshly deposited or air-exposed tungsten is often hydrophobic due to airborne hydrocarbon adsorption. UV–ozone breaks these carbon bonds, replacing them with polar hydroxyl (-OH) groups. Metallic tungsten naturally forms a native oxide layer (WOx) in air. UV–ozone strips away the loose, non-uniform native oxide and replaces it with a highly dense, uniform, and amorphous tungsten trioxide WO3 surface layer. The reaction is diffusion-limited. At room temperature, the growth of the oxide layer typically saturates at a thickness of 1 to 3 nanometers, even with extended exposure times.
Figure 1.
Synthesis steps of WSe2 flakes using intermediate ozonation treatment.
The selenization was performed in a three-heating-zone CVD system with a Ø 5.5 cm horizontal quartz tube reactor in order to convert ozonated tungsten (WOx) film or W film to WSe2. Inside the reactor, one gram of selenium (Se) powder with a purity of 99.999% was placed in the first zone. No more than 5% of it evaporates during the experiment. The tungsten oxide (WOx)-layered sample was placed in the middle heating zone, whereas the final zone was left empty. While maintaining one atmosphere of pressure, a mixture of Ar/H2 (9:1 ratio) at a flow rate of 150 sccm is set to pass through the tube during the synthesis process. In the first 30 min, the gas flow is left running to ensure a pure environment within the chamber. Only then is the heating process initiated with the following target temperatures for each zone, 280 °C, 660 °C and 680 °C, respectively. The final zone is also heated even though it remains empty in order to preclude any interference due to a temperature differential with others. The three zones are aligned so that they reach the set peak temperatures simultaneously in 15 min. The sample zone and the empty one are kept at peak temperature for 30 min, after which they are left to cool down to the temperature of the Se zone, which is maintained at peak temperature throughout synthesis. The synthesis takes an additional 90 min, so the selenium vaporization runs for 2 h in total. Finally, all three zones were cooled down to room temperature.
2.2. Characterization Methods
The visualization of the morphology and phase composition of WSe2 films were performed using a JEOL JEM 2100 Transmission Electron Microscope (Tokyo, Japan). For this purpose, the films were transferred onto a standard copper TEM grid by using thermal release tape. Three microscope modes were applied for the analysis—bright-field transmission electron microscopy (BF-TEM), selected area electron diffraction (SAED) and high-resolution transmission electron microscopy (HR TEM). For TEM analysis, an additional sample preparation step was added—using adhesive tape, the layer was mechanically exfoliated and transferred over carbon-coated copper TEM grid substrate. The X-ray photoelectron spectroscopy (XPS) studies were performed in a VG Escalab MKII electron spectrometer (East Grinstead, UK) using achromatic AlKα radiation with energy of 1486.6 eV under base pressure 10−8 Pa and a total instrumental resolution 1 eV. The binding energies (BEs) were determined utilizing the C1s line as a reference with energy of 285.0 eV. The accuracy of the measured BE was 0.2 eV.
Raman spectra were collected at a HORIBA Jobin Yvon Labram HR visible spectrometer (Kyoto, Japan) in backscattering geometry, using 632.8 nm excitation laser light.
An MFD—3D Asylum Research (Oxford Instruments, High Wycombe, United Kingdom) was used to measure the topography, with a chosen mode—non-contact and environmental conditions. Cantilevers used were standard silicon probes (AC160TS-R3) operating at frequency 300 kHz with spring constant of 26 N/m. AFM was used to analyze the thicknesses and the corresponding height profiles of synthesized WSe2 flakes.
The optical transmittance spectra were measured at room temperature using an Ultraviolet–Visible–Near-infrared (UV-VIS-NIR) spectrophotometer Cary 5E (Cary, NC, USA) in the wavelength range of 200 nm to 1000 nm.
3. Results
3.1. Raman Analysis
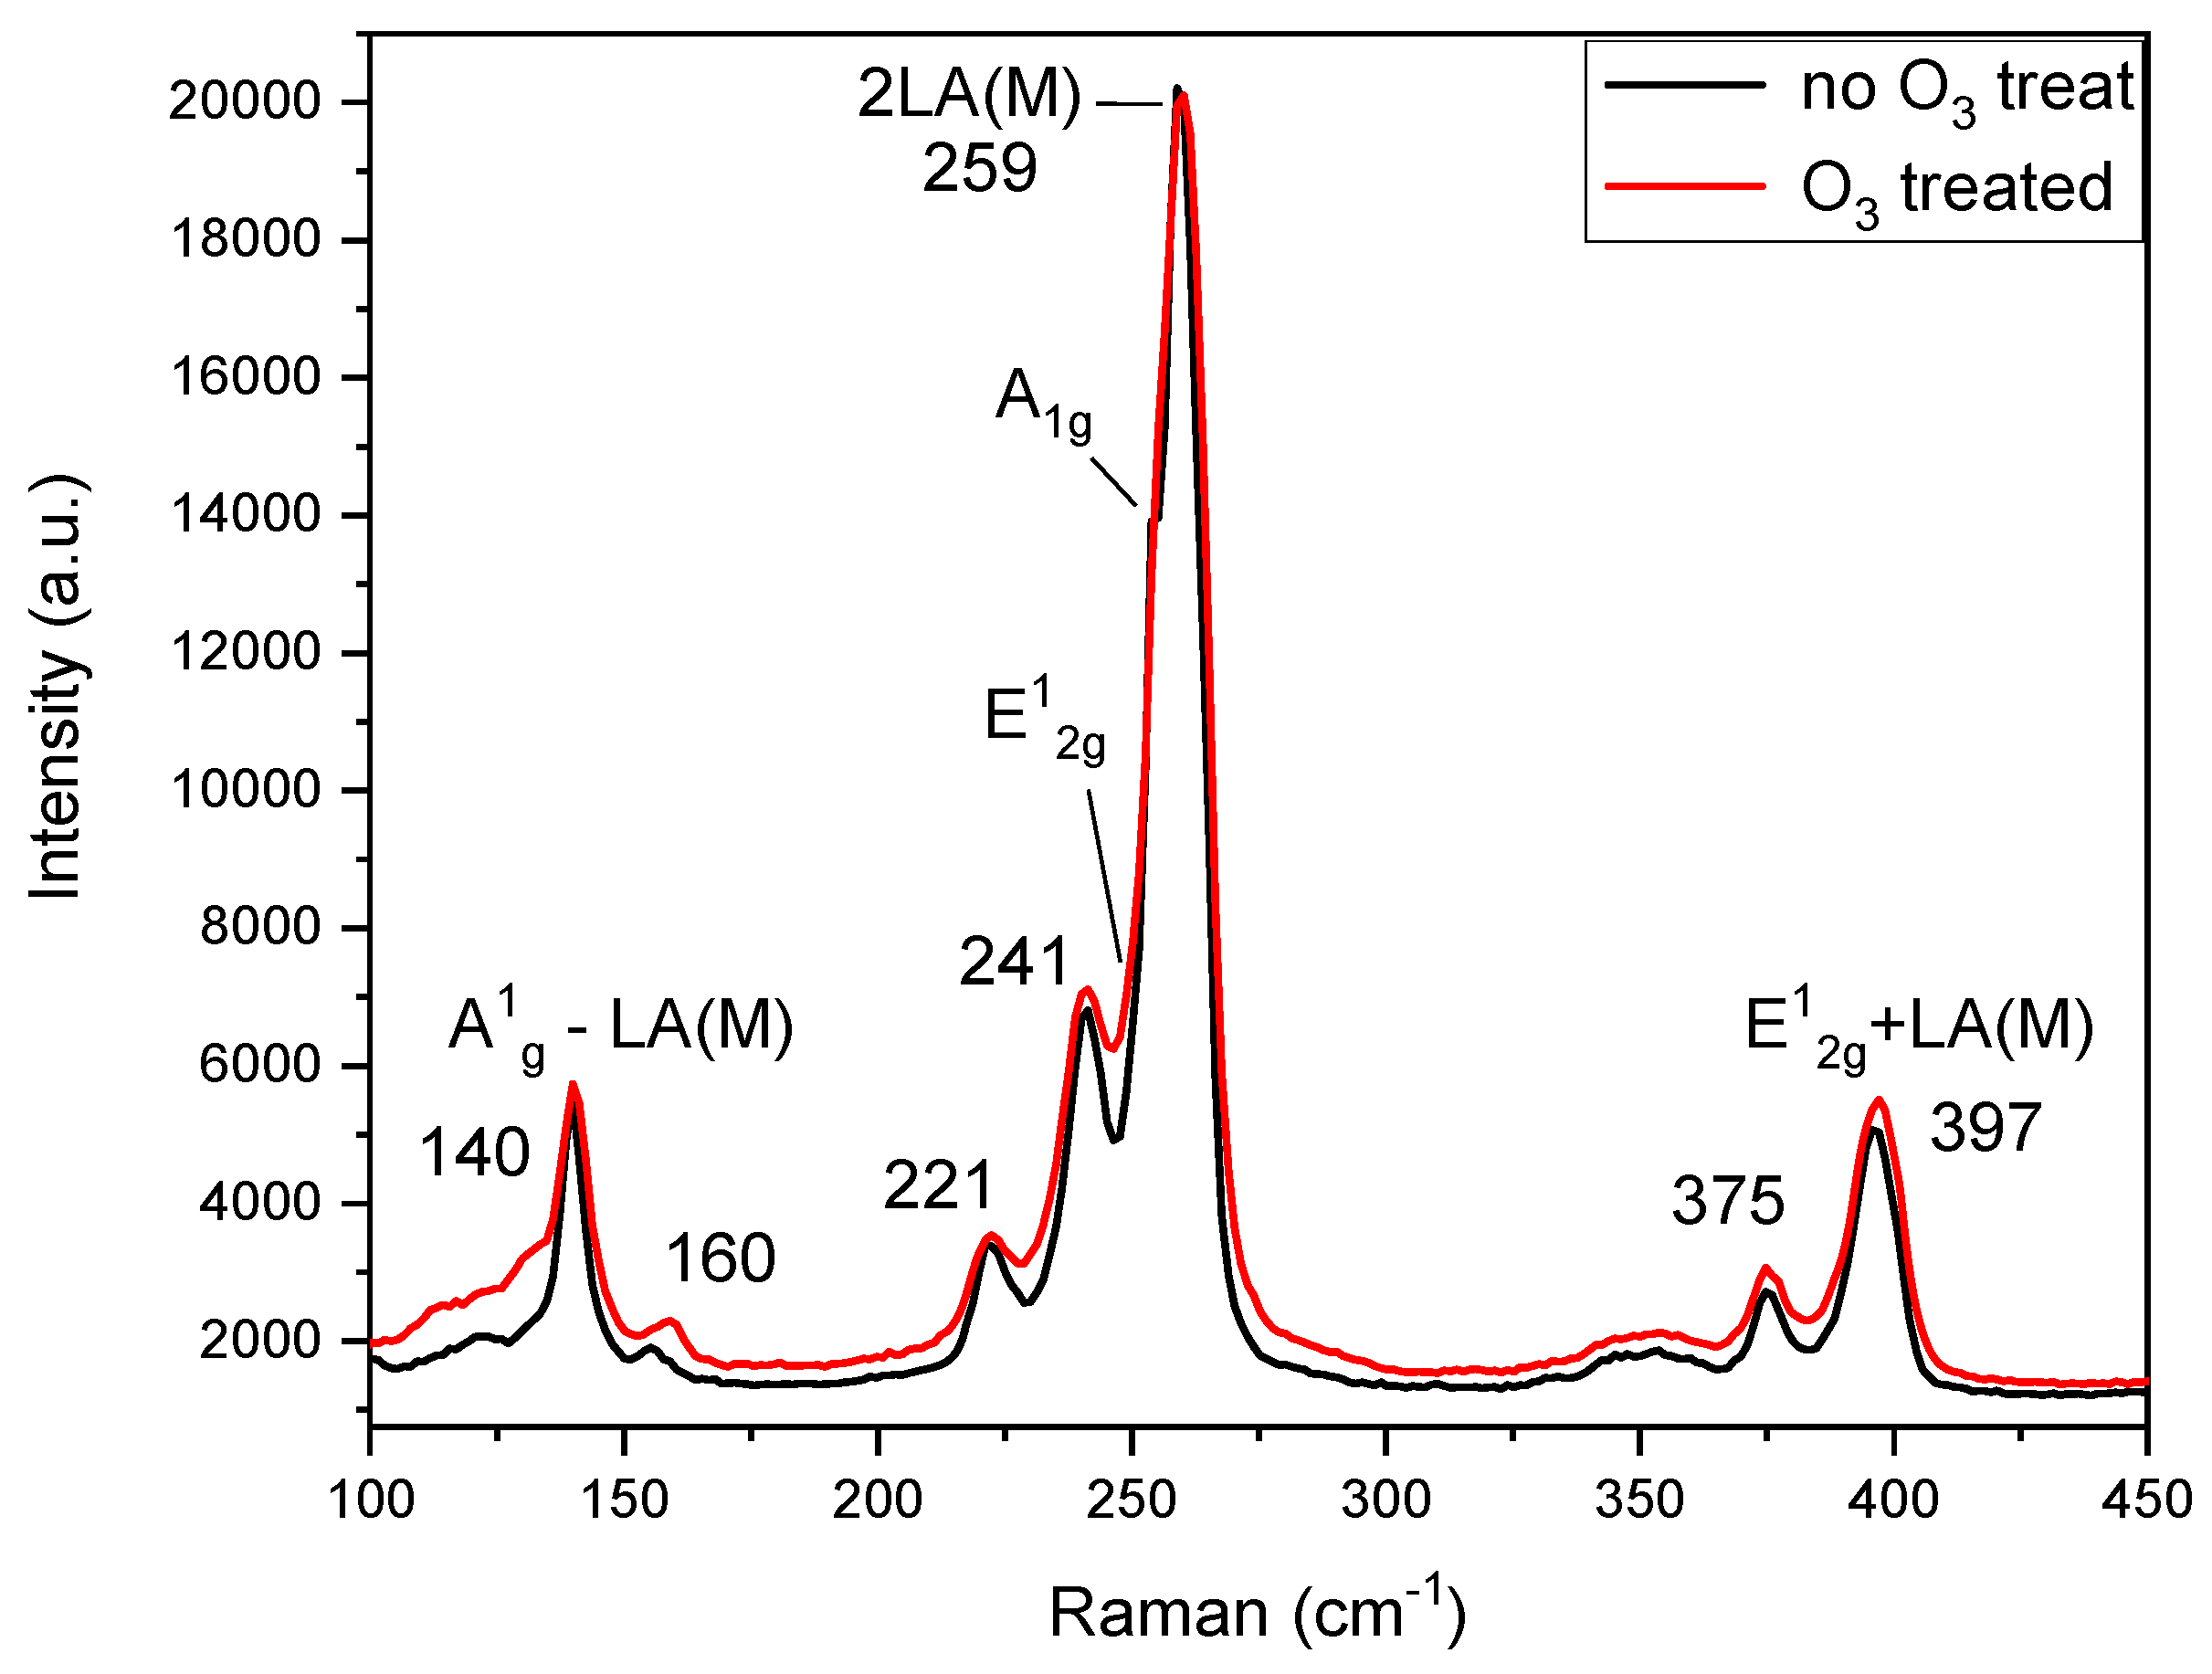
A Raman spectrum of WSe2 (with and without intermediate precursor treatment) is shown in Figure 2. The Raman modes of WSe2’s 2H structure feature two peaks E12g (in-plane vibration of W and Se atoms) and A1g (out-of-plane vibration of Se atoms). They both have rather similar frequencies resulting in two almost overlapping peaks [20,24]. Due to the resonance effect with excitonic origin, WSe2 spectrum contains a very-intense second-order feature: the 2LA(M) at 255–260 cm−1 which has strong layer dependence. The 2LA(M) band is considered as a signature of 2H-WSe2. In addition, several second-order peaks are located at ~140 cm−1, ~241 cm−1 and ~375 cm−1. The shoulder at ~251 cm−1 corresponds to the A1g mode, while the E12g mode is distinguishable as a faint shoulder at ~249 cm−1. Van der Waals forces are expected to result in the activation of an additional peak around 304–310 cm−1 (corresponding to the forbidden B2g mode). The presence of such a Raman peak has been reported to be related to the interlayer interaction, but none was detected in this measurement, confirming that the investigated flakes consist of monolayers. The peaks observed at 141 and 375 cm−1 have been assigned to the combination modes A1g − LA(M) and E12g + LA(M), respectively [25]. Comparing the Raman spectra of the two samples (with and without intermediate treatment), all the characteristic peaks match, confirming there is no microstructural difference between them.
Figure 2.
Raman spectra comparison of WSe2 (with and without intermediate (UV–ozone) treatment of the precursor W layer).
3.2. XPS Analysis
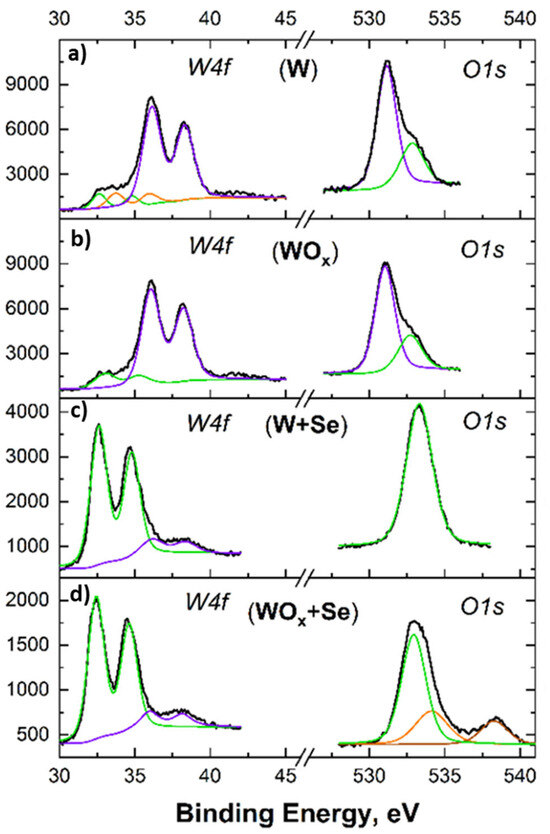
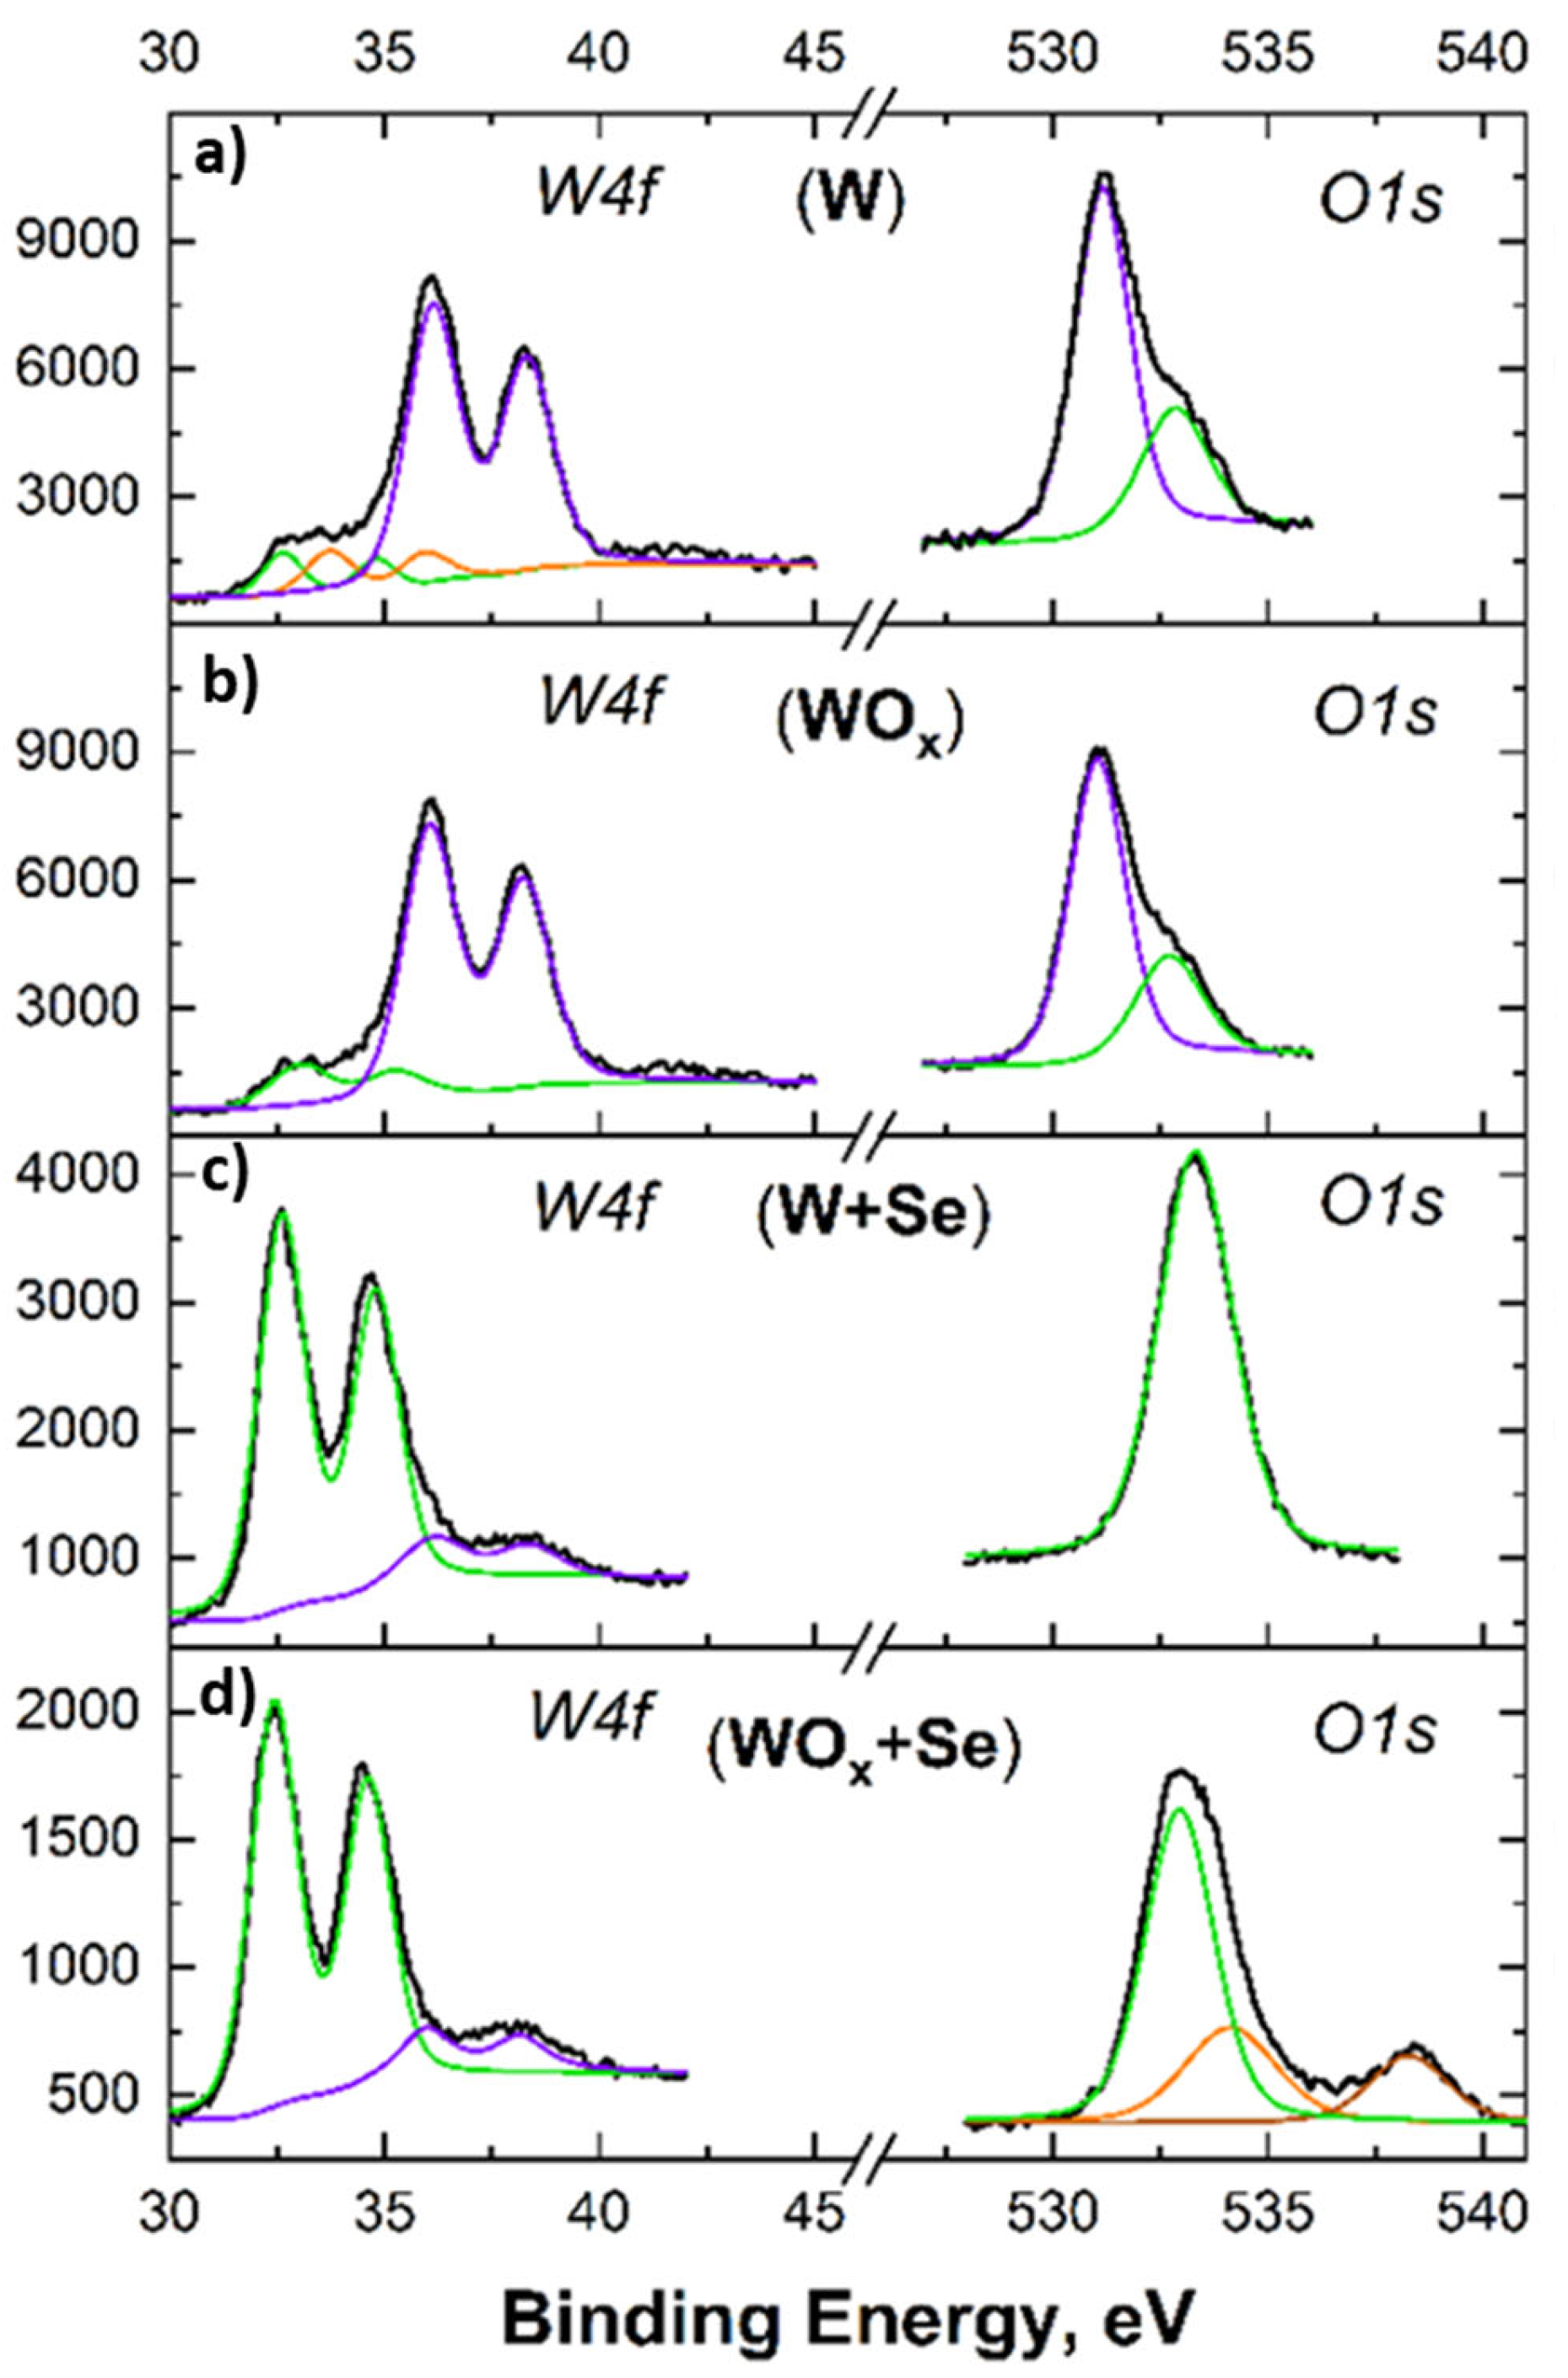
The high-resolution XPS spectra for the Tungsten (W4f) and Oxygen (O1s) core levels across four distinct material states were deconvoluted, and the results are shown in Figure 3. This figure provides step-by-step visual confirmation of the chemical transformations that thin films undergo during synthesis. For the W precursor film (W/FS), the W4f core spectrum even before intentional oxidation, the dominant doublet (the two large purple peaks around 35–38 eV) is characteristic of a highly oxidized state (W6+), indicating that the surface is heavily composed of WO3. The smaller fitted peaks at lower binding energies (orange and green lines) show that trace amounts of sub-oxides (like WO2) and metallic tungsten are still present. A strong O1s peak confirms this native surface oxidation. The asymmetric shoulder (fitted in green) typically corresponds to surface hydroxyl groups (-OH) or adsorbed water agglomerates [26]. For the UV–ozone-treated W precursor layer (WOx) following the ozone treatment, the W 4f lower-binding-energy shoulders representing metallic W and sub-oxides have nearly vanished. The spectrum is clearly dominated by the W6+ doublet. This proves the ozonation process was successful in fully oxidizing the previously unreacted tungsten into WO3. The O1s profile remains consistent with the initial layer, reflecting the established WO3 lattice and standard surface adsorbates. Ozone treatment leads to the oxidation of the previously unoxidized W. There is a dramatic shift of the primary W4f doublet to lower binding energies (around 32–35 eV) for WSe2 synthesized from W precursor layer (W + Se). This sharp, prominent doublet is the classic signature of the W4+ state, confirming the successful formation of the WSe2 crystal lattice. A small, broad background feature (purple line) indicates that only trace amounts of residual WO3 remain. While oxygen is still detected, the O1s peak shape has narrowed significantly. This suggests that the chemical environment has changed and the dominant surface chemistry is now governed by W-Se bonds rather than W-O bonds. For WSe2 synthesized from the ozonated W precursor layer (WOx + Se), the W4f spectrum displays the strong, characteristic WSe2 doublet. This is an important result—it demonstrates that even a fully oxidized WO3 precursor layer can be successfully converted into 2D WSe2 under our selenization conditions. The O1s oxygen spectrum here is more complex, requiring multiple fitted peaks (green, orange, and brown). This points to a diverse residual oxygen environment, which could include trapped unreacted WO3, surface water, or possibly intermediate transition states, though the W4f spectra confirm the bulk of the material has successfully converted to the dichalcogenide.
Figure 3.
Photoelectron spectra of W4f (left) and O1s (right) for (top to bottom): (a) bare W layer, (b) ozonated W layer (WO3), (c) W after selenization (WSe2), and (d) ozonated W(WO3) after selenization (WSe2) (ordered from top to bottom). Raw data (black lines) were deconvoluted and plotted (colored lines) in an intensity (a.u.) vs. binding energy (eV) diagram.
The figure effectively proves two main points: first, that the ozone treatment successfully unifies the precursor into pure WO3, and second, that our selenization process is highly effective at driving the phase transition to WSe2, regardless of whether the starting material is natively oxidized W or fully ozonated to WO3.
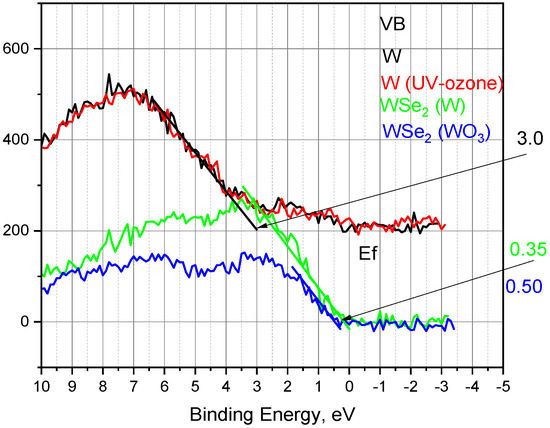
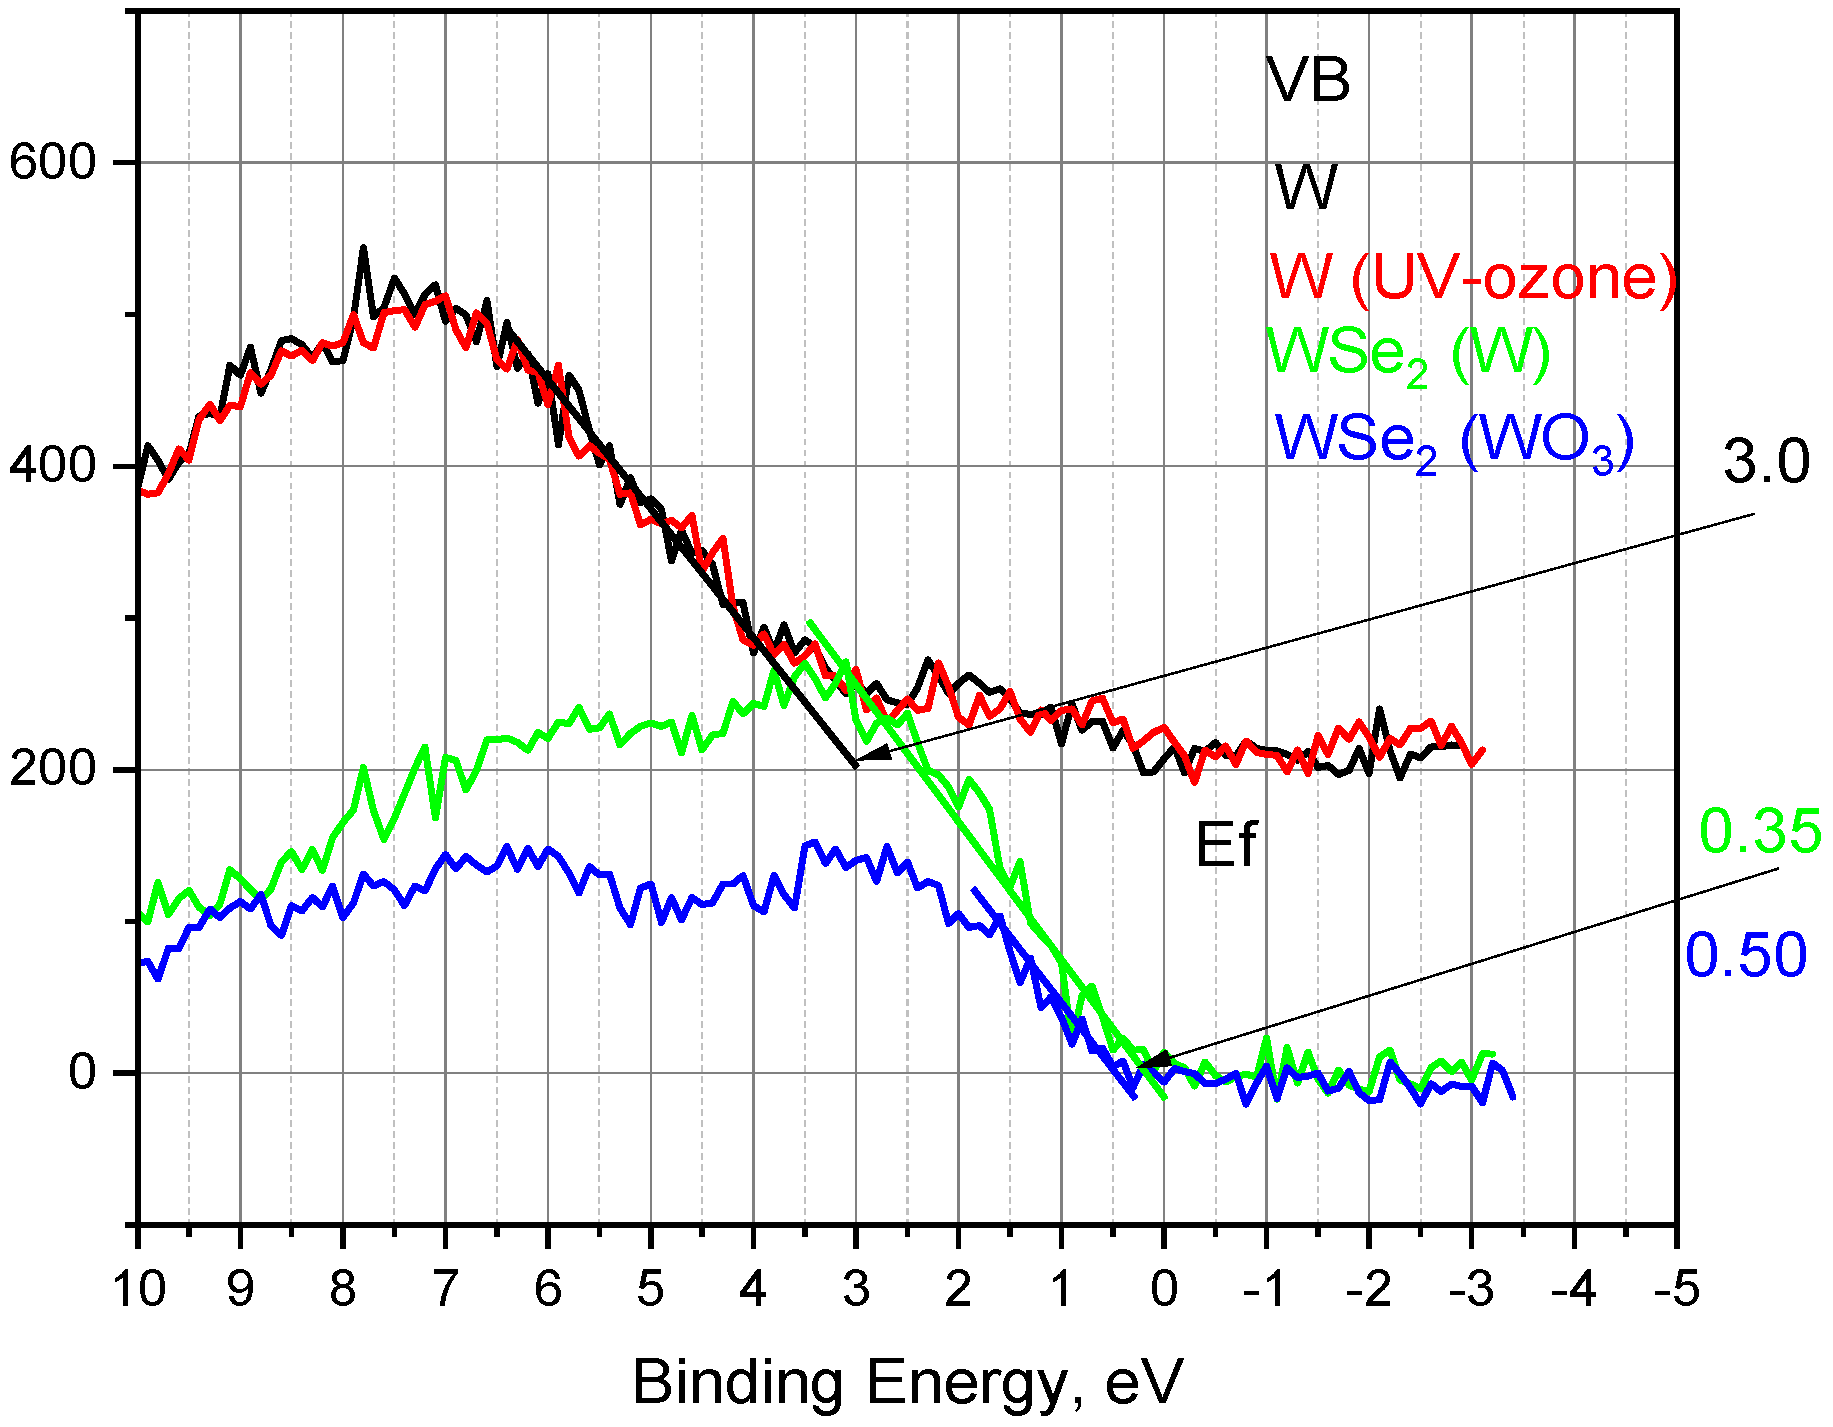
XPS is highly sensitive to interface details and is a preferred method for determining band offsets. Following the Kraut approach [27], where core-level shifts act as a proxy for the valence band maximum (VBM), we estimated the VBM by linearly extrapolating the leading edge of the valence band spectra to the zero-level background. As shown in Figure 4, the initial W and W(O3) samples exhibited a deep VBM of 3.00 eV, confirming the highly oxidized, wide-bandgap nature of the precursors.
Figure 4.
High-resolution XPS valence band spectra near the Fermi level (0 eV) for the initial precursors and the synthesized WSe2 films. The VBM for each sample was estimated using the linear extrapolation of the leading edge of the spectrum to the baseline. Both the initial native W (black line) and UV–ozone-treated W (red line) precursor layers exhibit a deep VBM at approximately 3.0 eV, typical of heavily oxidized surfaces. Following the selenization process, the VBM shifts significantly toward the Fermi level, evaluating to 0.50 eV for the WSe2 grown from the native W layer and 0.35 eV for the WSe2 grown from the ozonated WO3 layer.
Following selenization, the VBM shifted significantly to 0.50 eV for the WSe2 sample and 0.35 eV for the W(O3)Se2 sample. This pronounced shift confirms the phase transition to the transition metal dichalcogenide lattice. Because both values are close to the Fermi level, both films behave as strong p-type semiconductors. Notably, the W(O3)Se2 sample exhibits a stronger p-type character (0.35 eV), which is likely driven by the higher retention of residual oxygen acting as a p-type dopant within the lattice.
This precursor-dependent tunability of the electronic band structure is highly advantageous for specialized device integration. The stronger p-type character achieved via the WO3 pathway lowers the energy barrier for hole transport, optimizing hole extraction for photovoltaic and optoelectronic applications. Conversely, the localized defect states introduced by the residual oxygen serve as active surface adsorption sites, which can enhance the sensitivity and response times of gas and humidity sensor platforms.
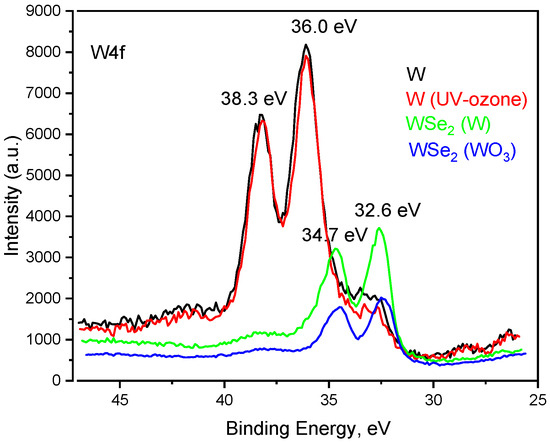
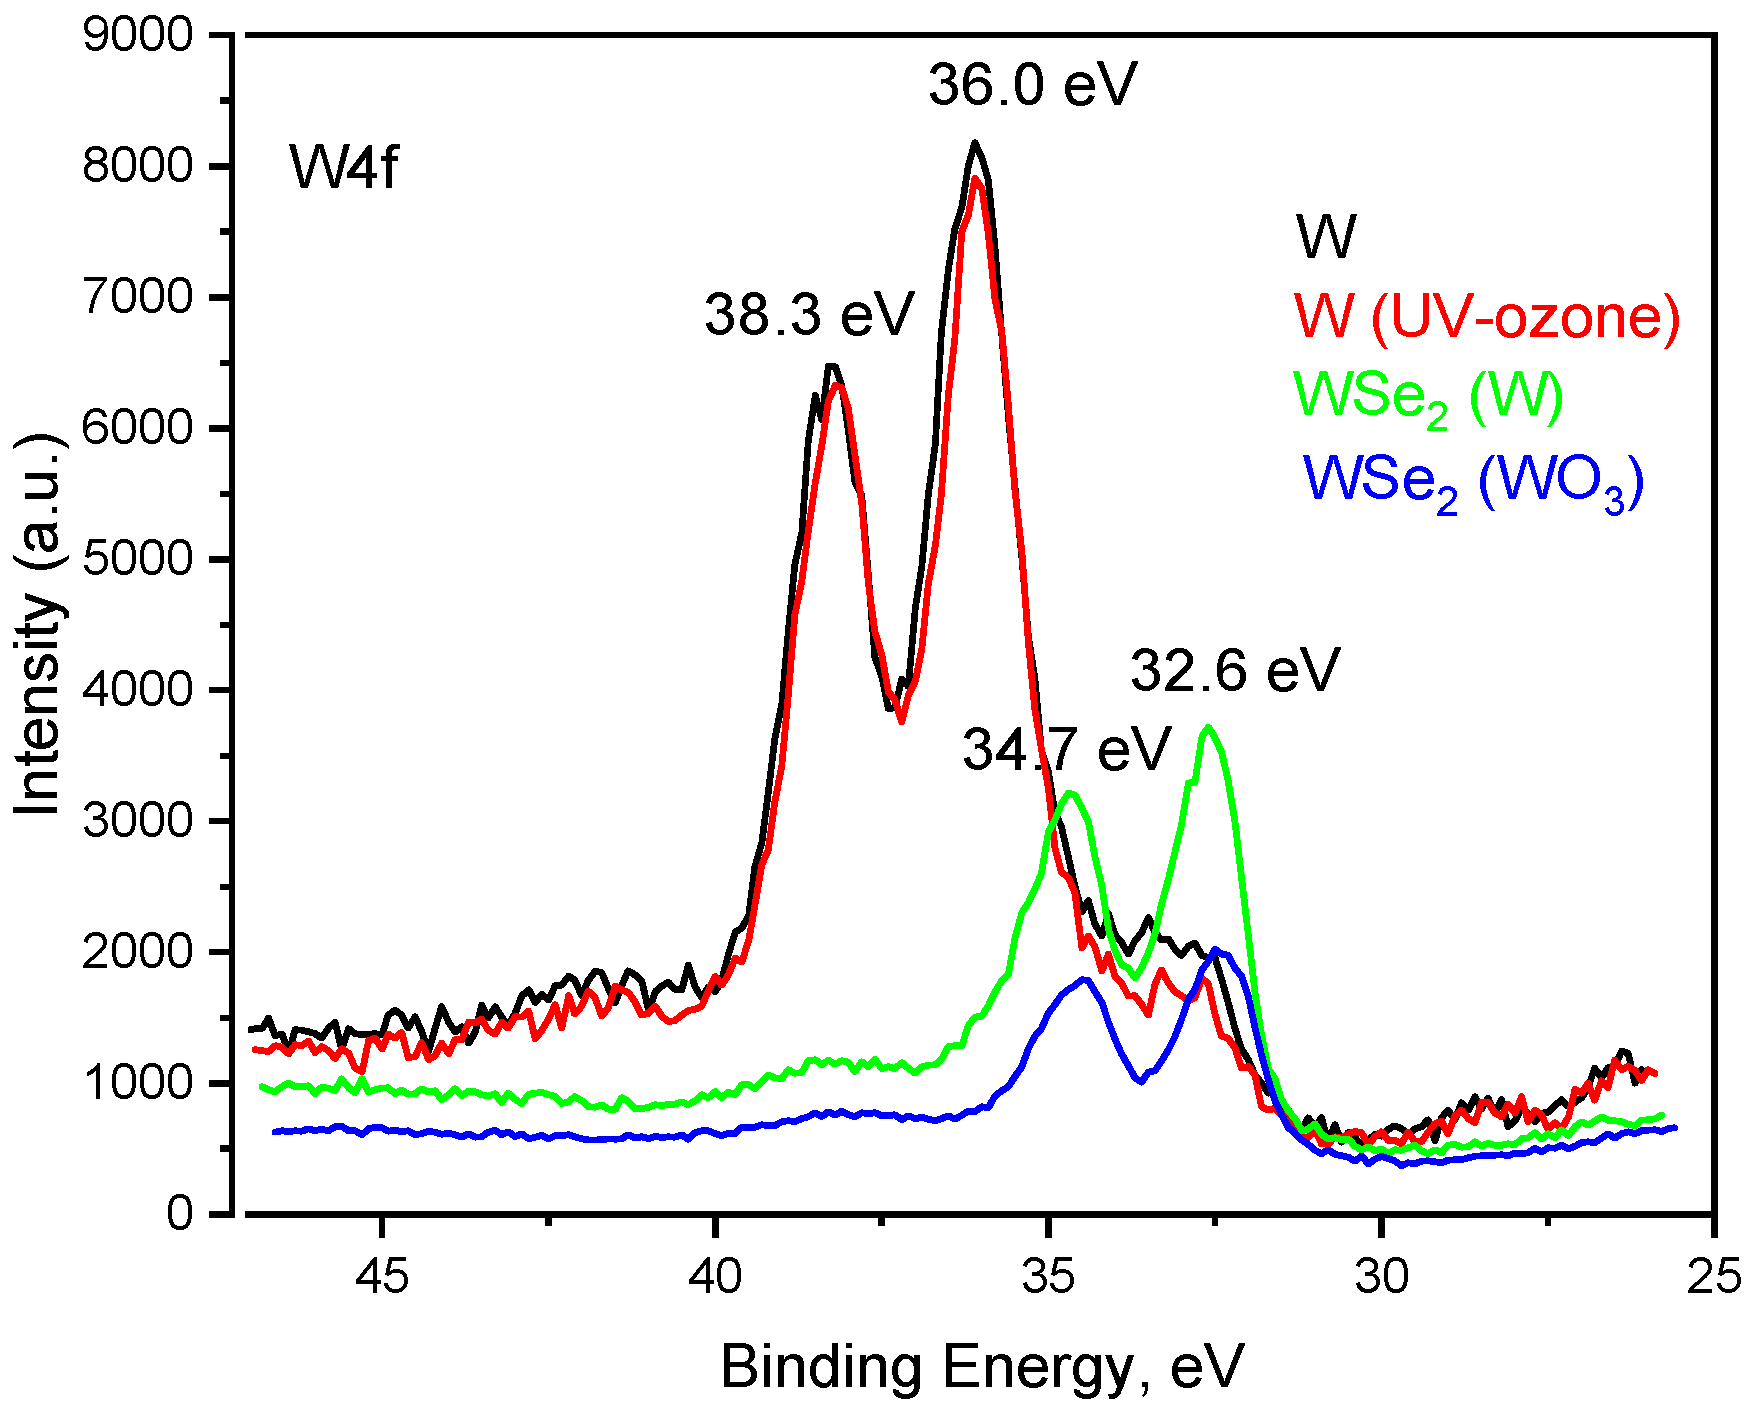
Figure 5 shows a comparative visualization of the W4f core level, clearly illustrating the chemical shifts that occur when converting precursor layers into the final two-dimensional transition metal dichalcogenide WSe2. The native W and UV–ozone-treated W exhibit nearly identical spectral profiles. The dominant peaks are located at 36.0 eV and 38.3 eV. These correspond to the 4f7/2 and 4f5/2 spin–orbit doublet of the W6+ oxidation state. This confirms that, at the probing depth of the XPS, both the initial native tungsten layer and the UV–ozone-treated layer are heavily oxidized, functioning essentially as WO3 precursors prior to the synthesis step.
Figure 5.
High-resolution XPS spectra of the W4f core level for the initial precursors and the final synthesized layers.
The WSe2 selenized from W and those selenized from WO3 show a dramatic shift to lower binding energies. The new primary doublet emerges at 32.6 eV and 34.7 eV. These values are the characteristic 4f7/2 and 4f5/2 binding energies for the W4+ state. This shift provides definitive proof of the successful phase transition and formation of the WSe2 crystal lattice. The chemical reduction from W6+ to W4+ is clearly visible.
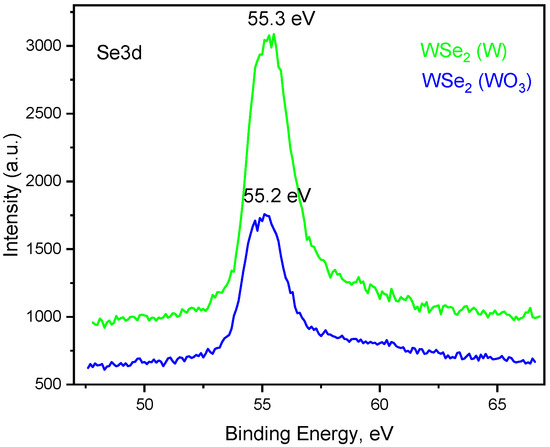
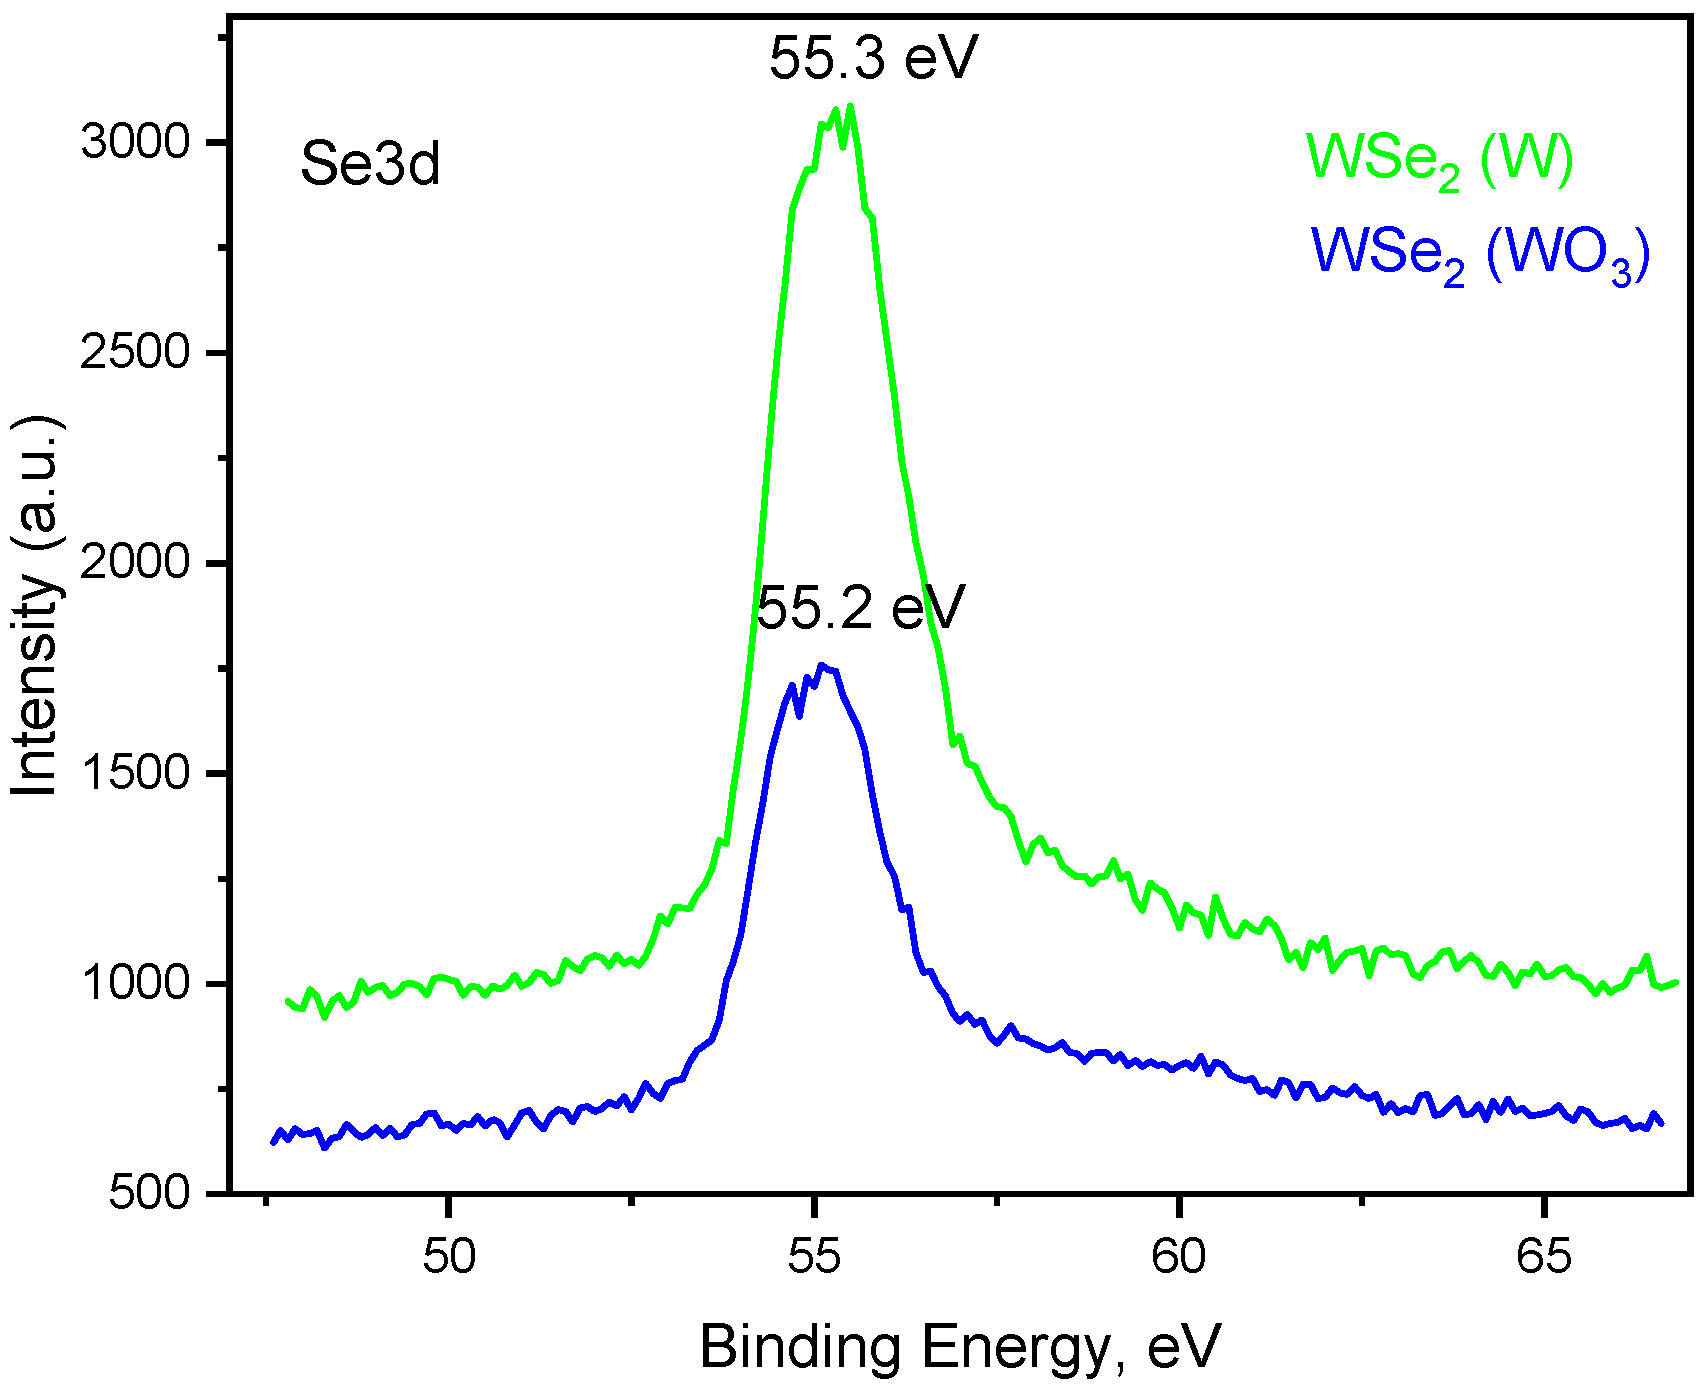
As shown in Figure 6 both WSe2 grown from native W and WSe2 grown from ozonated WO3 precursor exhibit a prominent, sharp peak centered at 55.2 eV to 55.3 eV. This specific binding energy is the definitive signature of the Se2− oxidation state, confirming that the selenium atoms are appropriately bonded to tungsten within the WSe2 crystal lattice. The Se 3d core level consists of closely spaced spin–orbit components (3d5/2 and 3d3/2), which often appear as a single broad or partially resolved peak. The symmetrical, narrow, and clean shape of the peaks here suggests a highly uniform chemical environment for the incorporated selenium atoms in both synthesis conditions. The baseline remains flat at higher binding energies (e.g., in the 58–60 eV range). This indicates that the surfaces of the synthesized films are completely free of oxidized selenium phases (such as SeO2). The selenium is entirely present in the desired Se2− state.
Figure 6.
High-resolution XPS spectra of the W4f core level for the WSe2 synthesized with W and UV–ozone-treated W (WO3) precursors respectively.
The W4f and Se3d photoelectron spectra of both 2D WSe2 are in accordance with previously reported results [28].
The quantitative XPS analysis presented in Table 2 details the surface elemental composition (W, Se, and O atomic percentages) and structural ratios of the films before and after the selenization process. The data reveals three primary findings:
- (i)
- Precursor Oxidation State: The initial films—both the native W/FS (Sample 1) and the UV–ozone-treated W(O3)/FS (Sample 2)—exhibit very-high oxygen concentrations (~68–72 at.%) and nearly identical W/O ratios (0.27 and 0.30). This confirms that both precursor surfaces are heavily oxidized prior to the synthesis step.
- (ii)
- Successful WSe2 Stoichiometry: Following selenization, Samples 3 and 4 show successful integration of selenium and a sharp decrease in the W/O ratio. The atomic W/Se ratios for the resulting WSe2/FS (44.7 ± 0.1%) and W(O3)Se2/FS (45.6 ± 0.2%) films are highly consistent. These values are in agreement with the theoretical 1:2 stoichiometric ratio expected for crystalline WSe2, confirming the robustness of the synthesis method across different starting materials.
- (iii)
- Precursor-Dependent Residual Oxygen: While the selenization is structurally successful for both pathways, the choice of precursor affects the residual composition. The sample derived from the ozonated precursor (Sample 4) exhibits a significantly lower W/O ratio (0.04) compared to the native-W-derived sample (0.10). This indicates a higher relative retention of residual oxygen in the W(O3)Se2 film, which correlates directly with the p-type defect doping and VBM shifts observed in the valence band spectra.
Table 2.
Elemental composition (at. %) and atomic ratios of the precursor films and synthesized WSe2 layers on fused silica (FS) substrates, determined via XPS analysis.
Oxygen acts as an acceptor in WSe2 through two physically distinct channels, and the present data allow them to be at least partially decoupled. (i) Surface-adsorbed oxygen, physisorbed O2/H2O and loosely bound surface oxide withdraws electrons from the WSe2 surface by charge transfer, producing a reversible, self-limiting surface p-doping. This is the mechanism exploited in UV/ozone and O2-plasma treatments of finished WSe2, where the oxide forms a self-limiting acceptor overlayer and the doping saturates with the oxide thickness [3,9,11,20,22]. (ii) Lattice-incorporated oxygen—oxygen substituting for selenium or occupying interstitial/vacancy sites, i.e., forming W–O bonds within the chalcogenide framework—introduces deeper, spatially fixed acceptor states and shifts the Fermi level toward the valence band in a manner that is not removed by desorption. Our XPS data point to a contribution from the second, lattice channel in the WO3-derived film. First, the W(O3)Se2 sample retains substantially more oxygen than the native-W-derived film (W/O ratio 0.04 vs. 0.10; Table 2) while both reach the correct W:Se » 1:2 stoichiometry and the W4+ chemical state, so the extra oxygen is accommodated in a WSe2-dominated matrix rather than as bulk unreacted WO3 (which the W4f spectra do not support). Second, the O1s envelope of W(O3)Se2 requires multiple components (Figure 3d), consistent with a distribution of oxygen environments—trapped oxide, surface adsorbates, and W–O bonding within the lattice—rather than a single physisorbed species. Third, the valence band maximum shift is larger for the ozonated route (0.35 eV vs. 0.50 eV; Figure 4), i.e., the additional, more strongly bound oxygen correlates with a stronger, more persistent p-type character than surface adsorption alone would give. This is consistent with reports that controlled surface/lattice oxidation converts WSe2 into a robust p-type semiconductor with low-resistance hole contacts [9,11,22]. Density-functional-theory calculations of substitutional O for Se and interstitial O in a 2H-WSe2 supercell—reporting the defect formation energy and the position of the induced acceptor level relative to the valence-band edge, and contrasting them with a physisorbed-O2 configuration—would quantitatively separate the lattice and surface contributions to the observed VBM shift.
Such a calculation is identified in a further work as the direct computational validation of the proposed mechanism.
In summary, high-resolution XPS analysis confirms that high-quality 2D WSe2 can be successfully synthesized using both native W and UV–ozone-treated WO3 precursor layers. While both pathways yield the expected stoichiometry and characteristic W4+ and Se2− chemical states, the initial precursor composition provides a critical mechanism for tuning the electronic properties of the final 2D layer. Specifically, synthesizing WSe2 from the fully oxidized WO3 precursor introduces a distinct shift in the valence band maximum (VBM) from 0.50 eV to 0.35 eV, alongside a higher relative retention of residual oxygen. This precursor-dependent tunability of the electronic band structure and defect density is highly advantageous for integrating these transition metal dichalcogenides into specialized device architectures. The stronger p-type character and modulated band alignment achieved via the WO3 pathway are directly beneficial for optimizing hole extraction in photovoltaic and advanced optoelectronic devices. Furthermore, the localized defect states introduced by the residual oxygen can serve as active adsorption sites, offering a viable route to enhance the response and sensitivity of gas and humidity sensor platforms.
3.3. TEM Analysis
To analyze the morphology, microstructure, and the phase composition of the synthesized WSe2 samples, transmission electron microscopy (TEM) studies were conducted using a JEOL JEM 2100 microscope operating at an accelerating voltage of 200 kV. Three TEM modes were employed: bright-field transmission electron microscopy (BF-TEM), selected area electron diffraction (SAED), and high-resolution TEM (HRTEM).
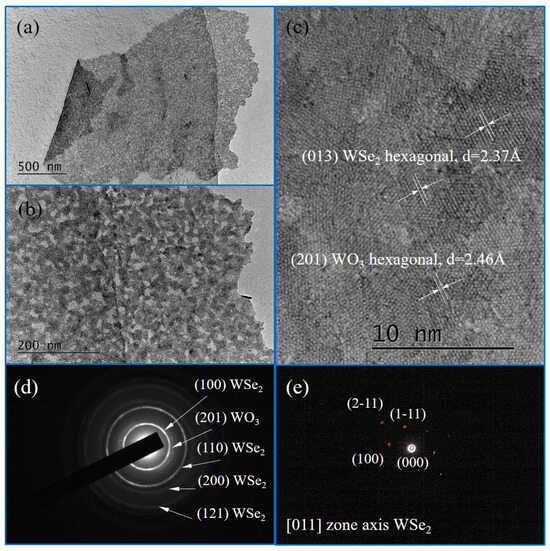
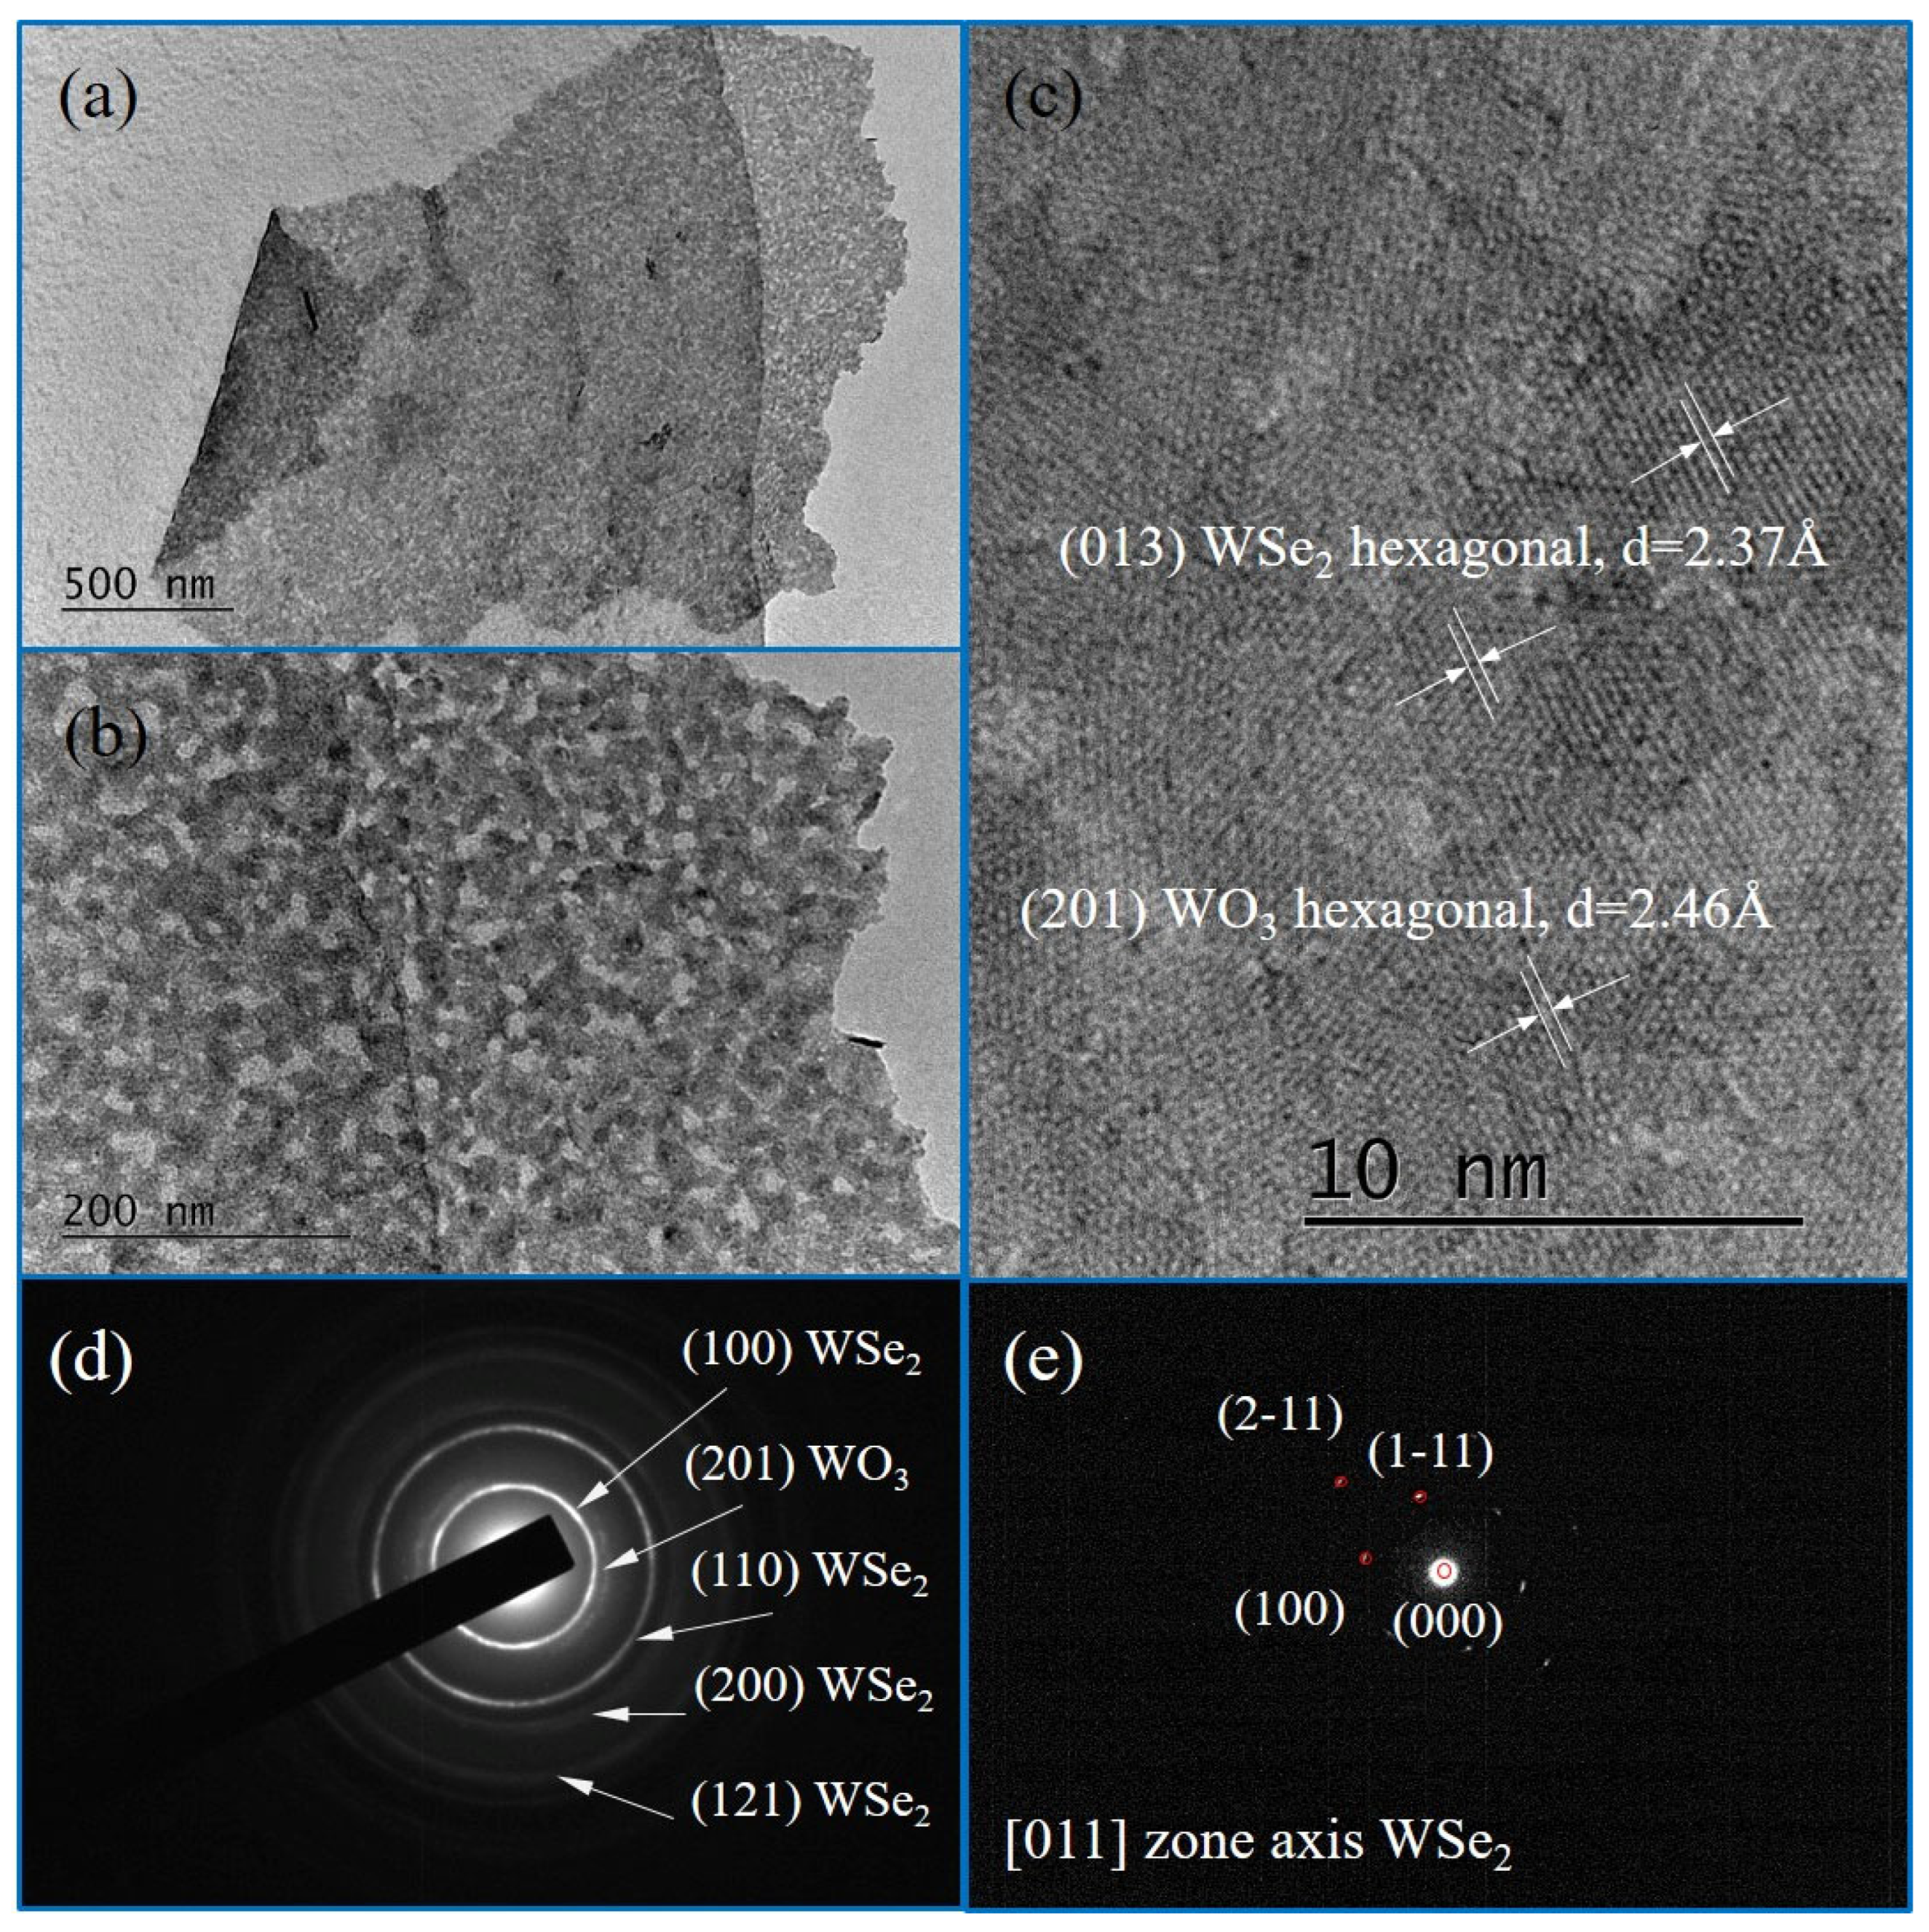
Figure 7 illustrates the morphology of untreated WSe2 samples at different magnifications. At 10 k magnification scale (Figure 7a), the image reveals a vaguely shaped flake attached to the carbon layer of the grid, attributed to the manual exfoliation of the selenized W layers and transfer onto the TEM grid. At higher magnification of 40 k the flake morphology is highlighted in more details in Figure 7b. HR-TEM analysis at 600 k magnification (Figure 7c) provides interplanar distances value 2.37 Å, consistent with (013) crystal planes of hexagonal WSe2 (space group P63/mmc), according to the Crystallography Open Database (COD) entry #96-900-9147.
Figure 7.
BF-TEM images of untreated sample (WSe2) at magnification of (a) 10 k, (b) 40 k and (c) 600 k (HR-TEM). SAED patterns of the same sample from multilayer region (d) and from single layer (e).
SAED patterns further confirmed the crystalline nature of the flakes. The single crystalline diffraction pattern (Figure 7e) indexed to the [011] zone axis demonstrates the integrity of the hexagonal WSe2 structure. However, the diffraction pattern from multilayer region (Figure 7d) revealed a co-existence of WSe2 and WO3 phases, with rings corresponding to WSe2 (COD #96-900-9147), as well as to WO3 (COD #96-100-4058). This indicates the partial presence of tungsten oxides in untreated samples. The HR-TEM data corroborated this observation, with certain interplanar distances corresponding to WO3, underscoring incomplete conversion during the synthesis process.
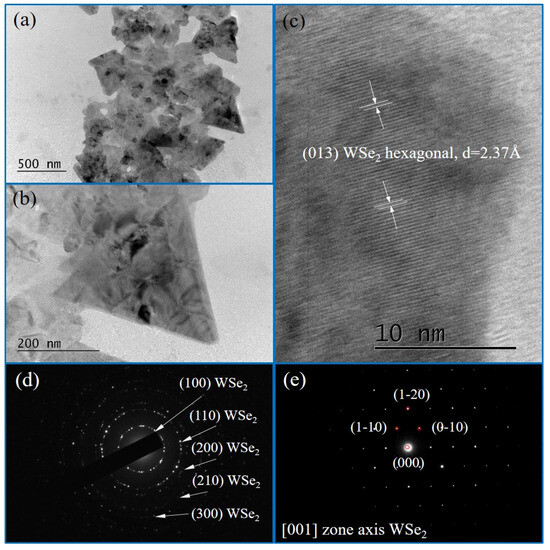
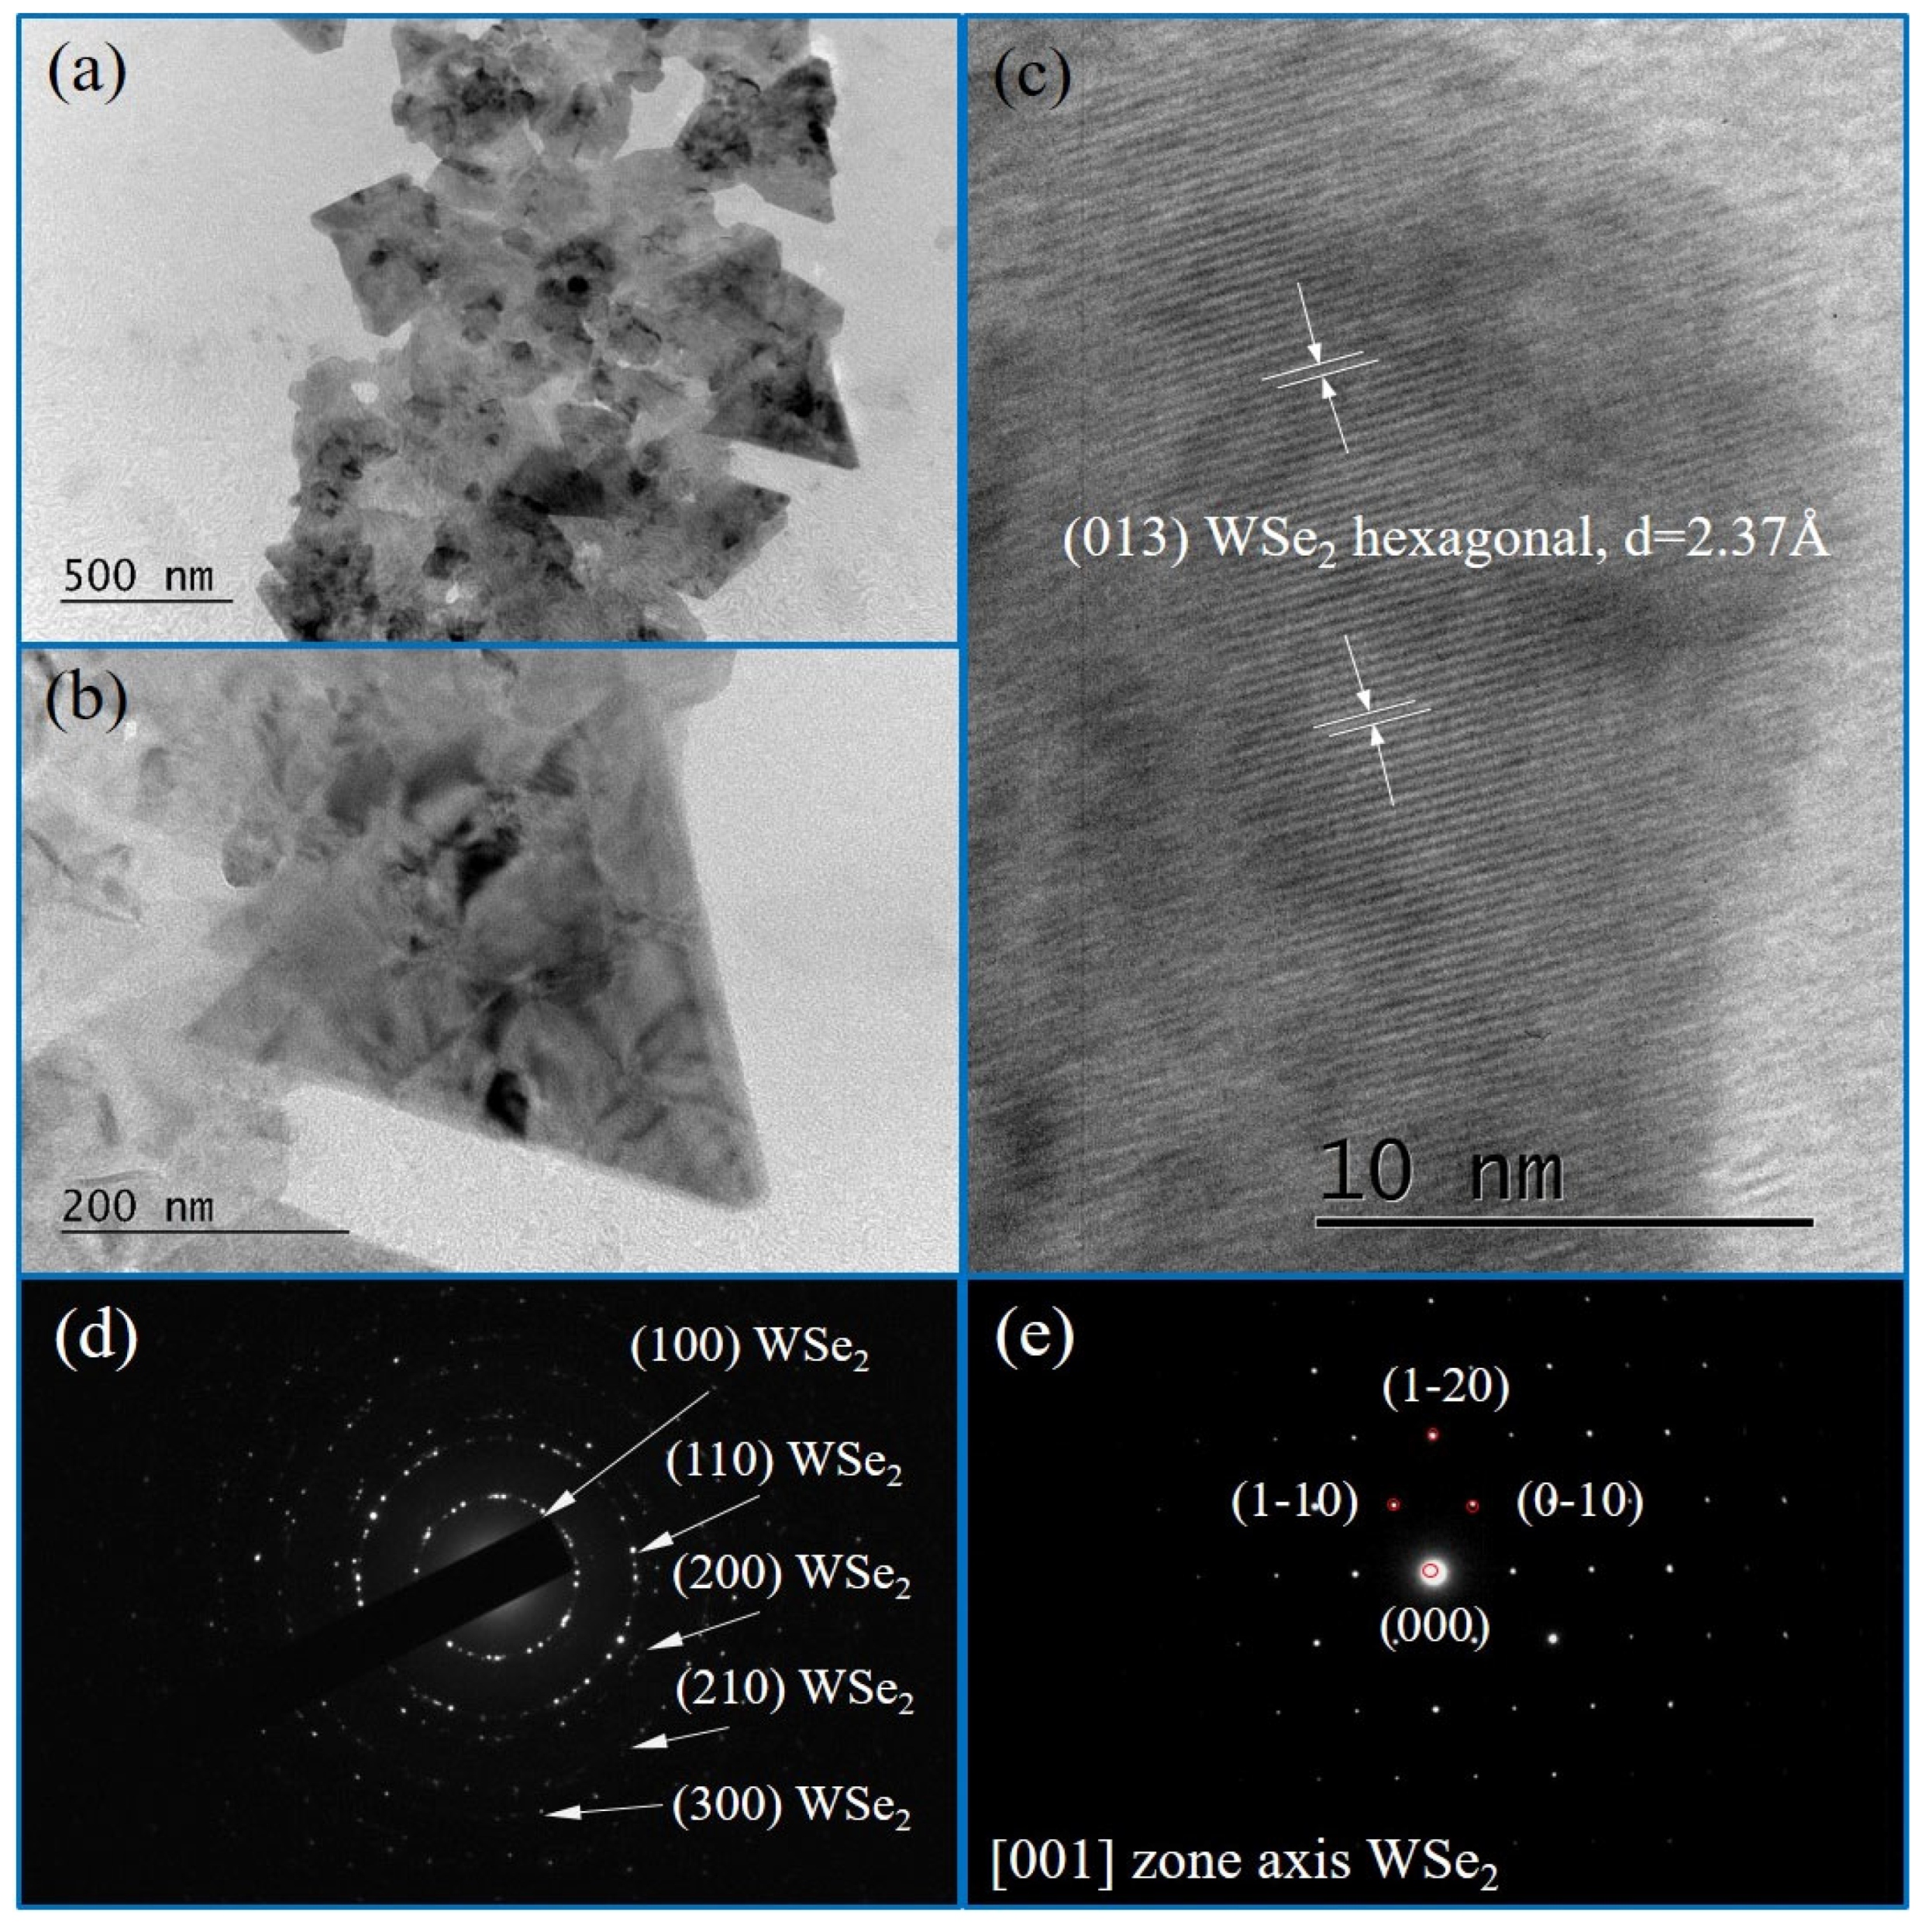
TEM analysis of ozone-treated samples, shown in Figure 8, highlights significant change in flake morphology and single compound predominance. At 10 k and 40 k magnifications (Figure 8a,b), the images depict well-defined, uniform triangular crystalline islands. HR-TEM analysis at the 600 k scale (Figure 8c) confirms the presence of WSe2 with interplanar distances precisely matching the data from COD #96-900-9147. Importantly, no WOX-related spacings were observed, indicating the efficacy of the ozone treatment in reducing tungsten oxides before selenization.
Figure 8.
BF TEM images of ozonated sample (WSe2 + O3) at magnifications of (a) 10 k, (b) 40 k and (c) 600 k (HRTEM). SAED patterns of the same sample from multilayer region (d) and from single layer (e).
SAED patterns of the treated samples (Figure 8d,e) reaffirmed the hexagonal structure of WSe2, with single crystalline diffraction pattern indexed to the [001] zone axis. The absence of phases other than WSe2 associated ones further corroborates the improvement in structural quality due to ozone treatment.
The TEM characterization underscores the critical role of ozone treatment in improving the synthesis of WSe2 flakes. Ozone-treated samples exhibit larger, more uniform flakes with single compound predominance in the phase composition, as evidenced by the absence of WOX-related phases. These findings suggest that the intermediate ozonation step effectively mitigates incomplete reactions and enhances the interaction between tungsten and selenium atoms during the selenization stage. This advancement in synthesis methodology provides a pathway for producing high-quality WSe2 crystallites suitable for applications in optoelectronics and nanoelectronics.
3.4. AFM Analysis
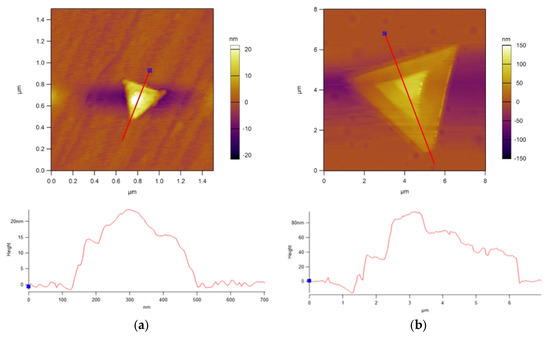
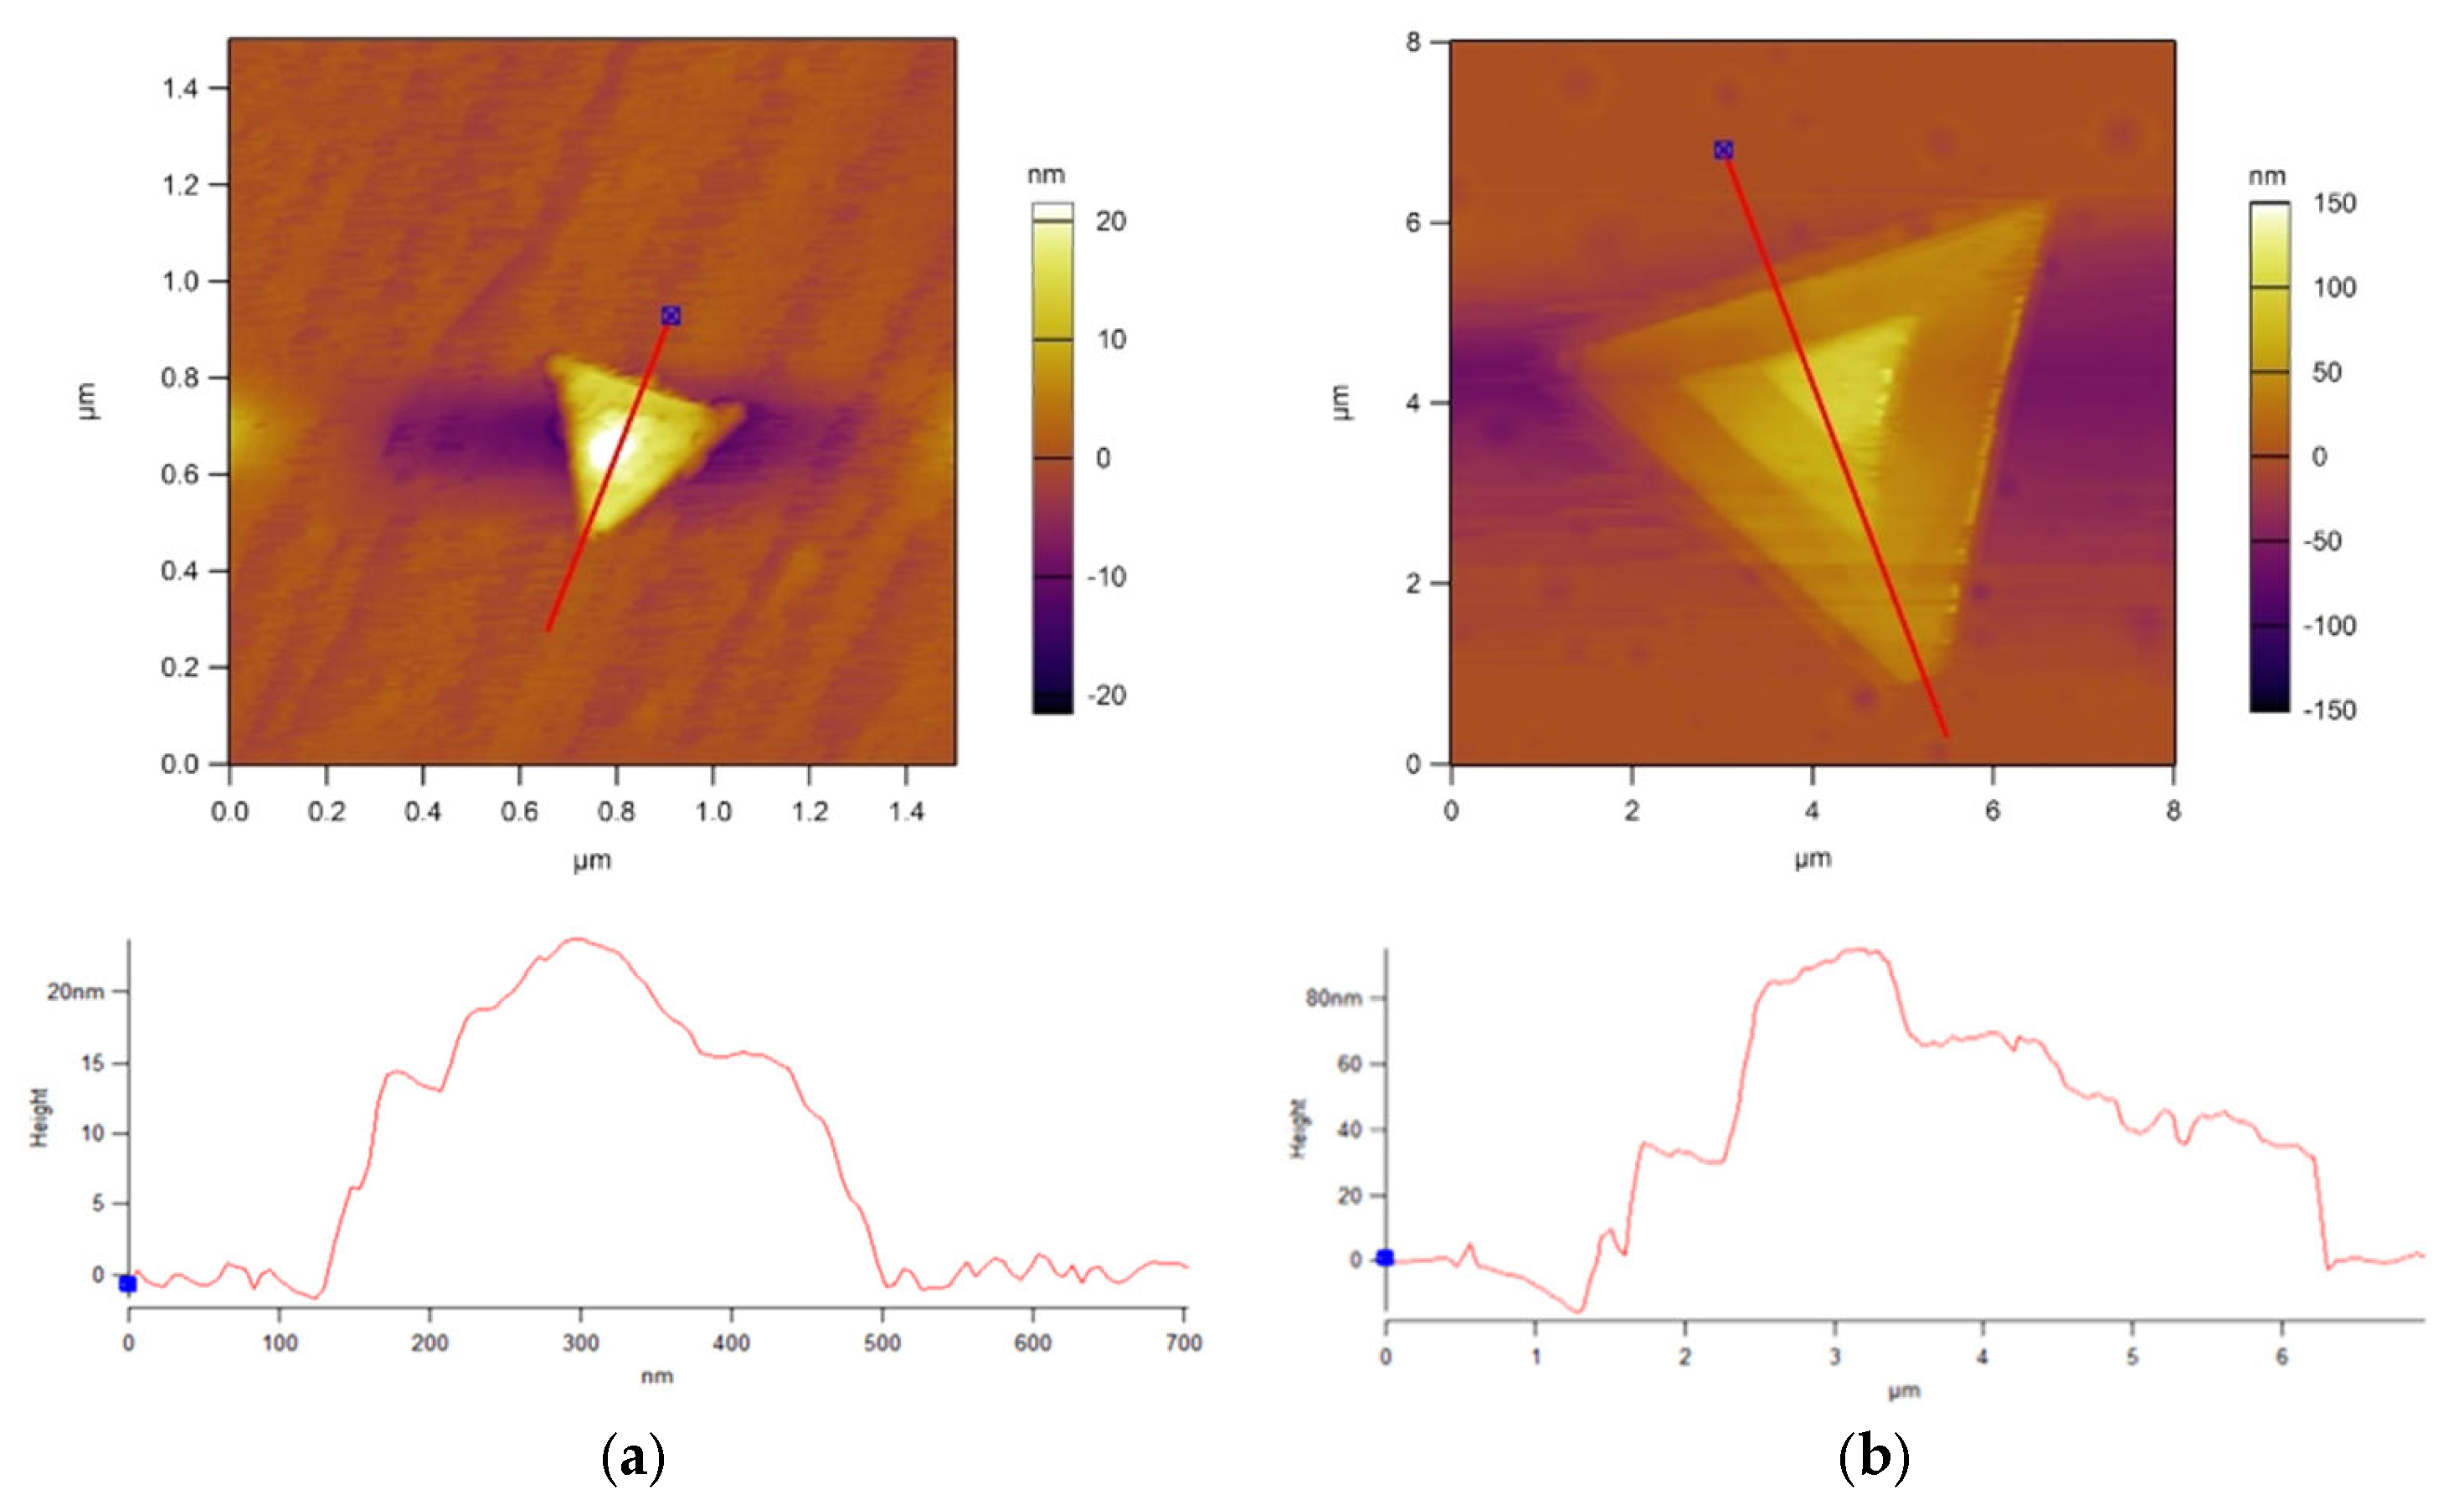
To evaluate the morphological changes induced by the tungsten precursor treatment, flakes from both WSe2 samples synthesized from ozonated W precursor (i.e., WO3) and nontreated W precursor were analyzed using atomic force microscopy (AFM). Representative flakes of average size and typical triangular morphology were selected from the main size distribution for accurate comparison. Figure 9 illustrates the topographical differences between the samples. The representative WSe2 flake from nontreated W precursor (Figure 9a) exhibits a lateral dimension of less than 400 nm along the cross-sectional slice, with a corresponding peak height of approximately 20 nm. In contrast, the WSe2 flake synthesized from the ozonated (WO3) precursor (Figure 9b) demonstrates significantly larger dimensions: a lateral span exceeding 5 µm and a maximum height of roughly 100 nm along the measured profile.
Figure 9.
Comparison of AFM topography images of WSe2 flakes, (a) from nontreated W precursor layer and (b) following an ozonation step (WO3 precursor layer), displaying characteristic triangular morphologies. The corresponding height profiles extracted along the indicated red lines are presented below each respective image.
To quantitatively evaluate the effect of the intermediate UV–ozone treatment on the growth kinetics of WSe2, a statistical analysis of the flake lateral sizes was conducted (Figure 10). The resulting size distribution histograms reveal a distinct enhancement in lateral dimensions for the treated samples. For the standard synthesis route without ozone treatment, the lateral sizes are predominantly concentrated between 1.5 µm and 3.5 µm, with the maximum observed flake size terminating near 5.0 µm. In stark contrast, incorporating the intermediate UV–ozone step significantly shifts and broadens the size distribution toward larger dimensions. The WSe2 flakes with intermediate ozone-treatment exhibit a primary peak distribution between 4.0 µm and 5.0 µm, alongside a substantial population of monocrystalline flakes exceeding 5.0 µm and reaching up to 12.0 µm. These statistical findings substantiate that the modified precursor oxidation methodology effectively promotes two-dimensional lateral growth, successfully yielding the larger WSe2 domains required for subsequent optoelectronic integration.
Figure 10.
(a) Statistical histogram illustrating the lateral size distribution of WSe2 flakes synthesized with the intermediate UV–ozone treatment. (b) Statistical histogram illustrating the lateral size distribution of WSe2 flakes synthesized without the intermediate UV–ozone treatment.
3.5. Optical Characterizations
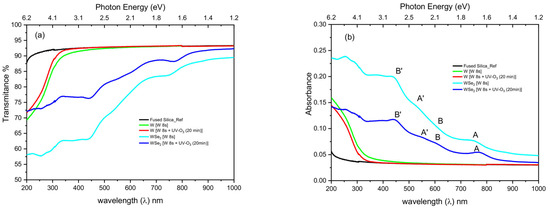
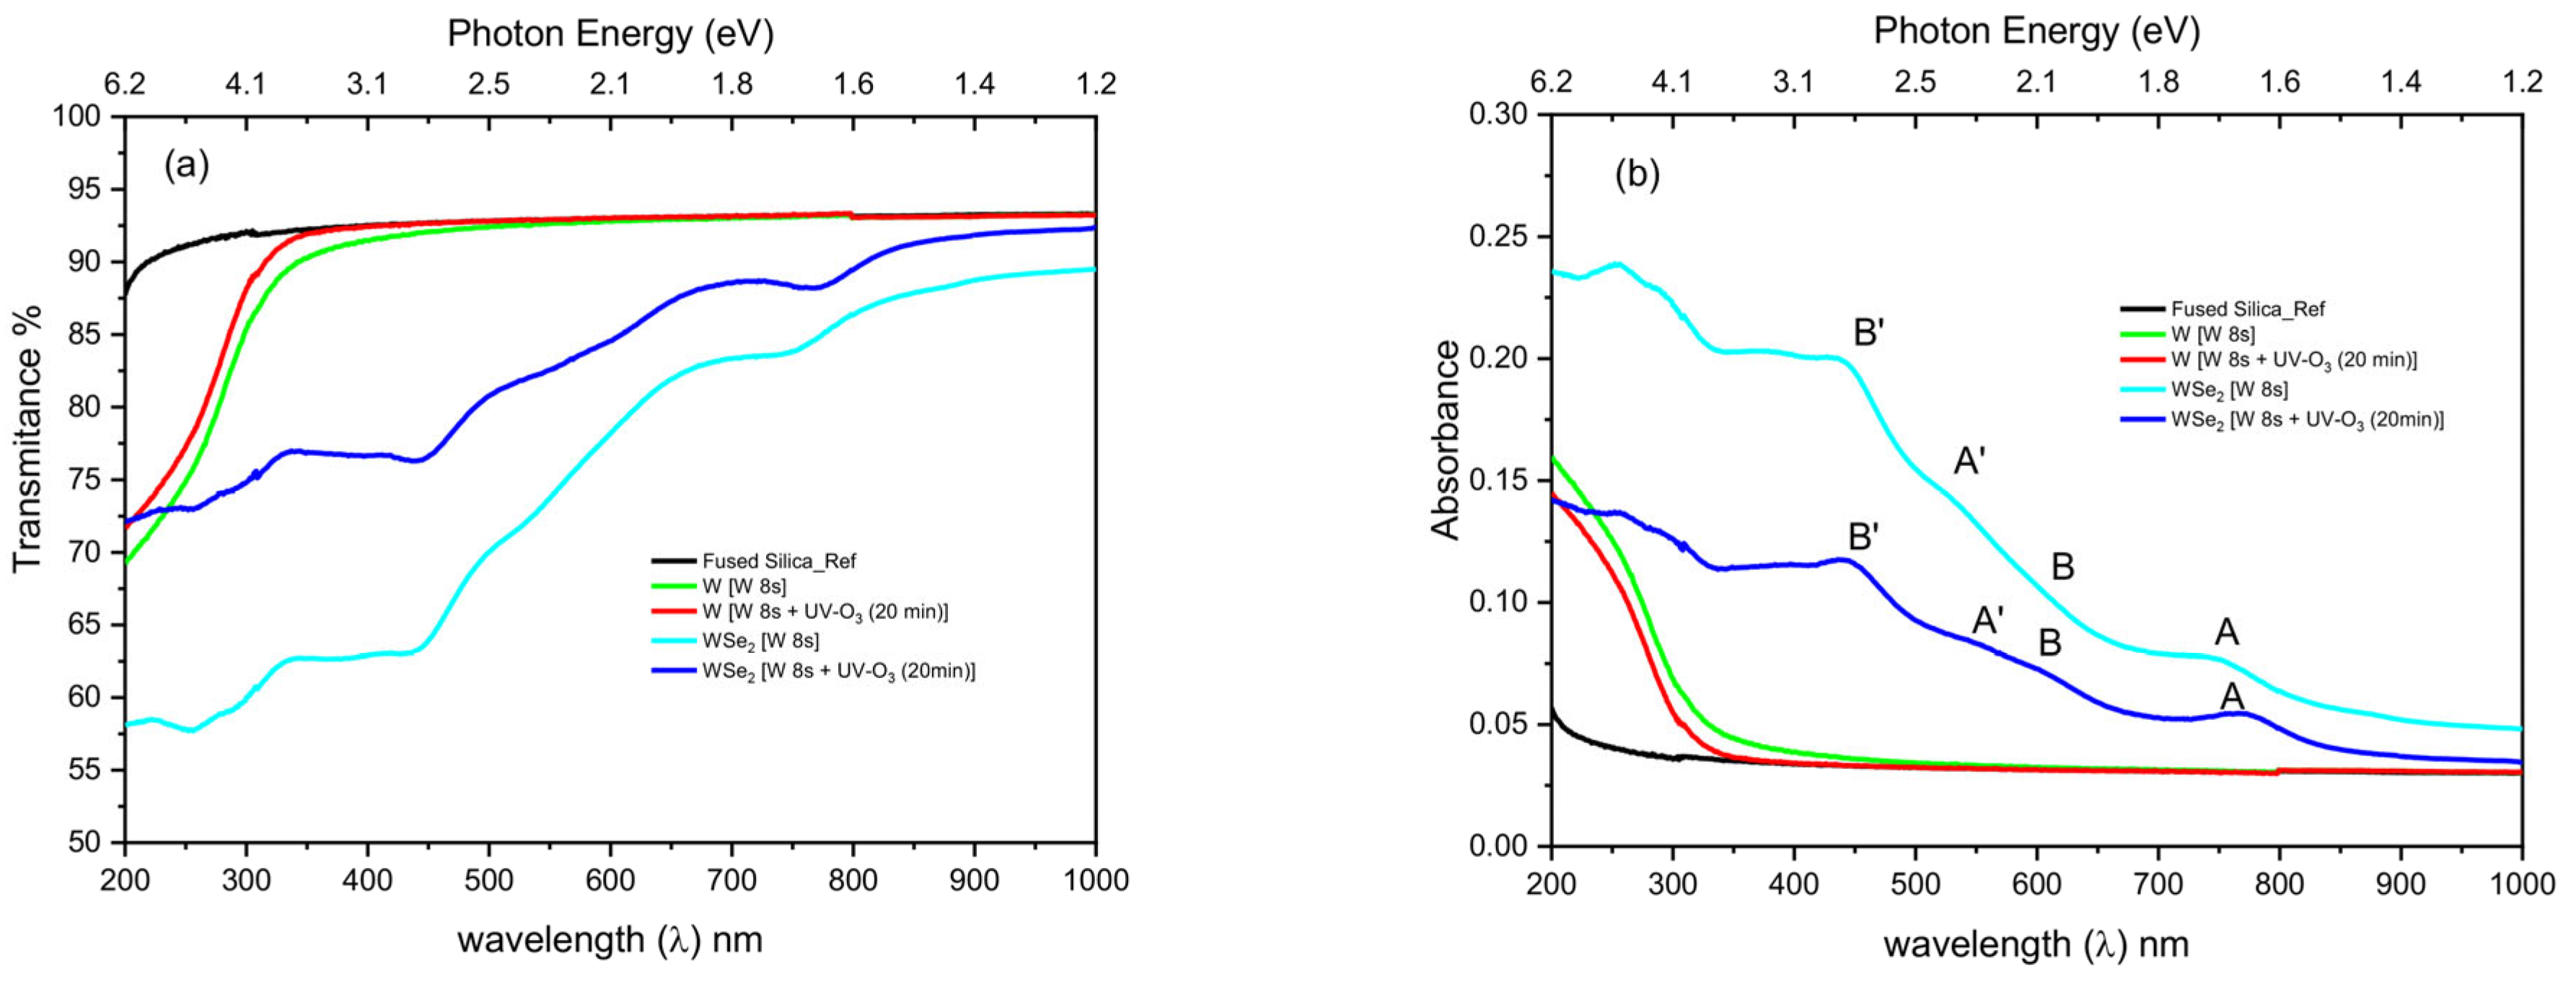
To evaluate the impact of the UV–ozone treatment on the optical properties and layer thickness of the synthesized WSe2 films, UV-Vis-NIR transmittance and absorbance spectra (200–1000 nm) were recorded using a Cary 5E spectrophotometer (Figure 11).
Figure 11.
(a) UV-Vis-NIR transmittance spectra and (b) corresponding absorbance spectra of the fused silica (FS) substrate, the initial W precursor layer, the UV–ozone-treated W layer (W + O3), and the WSe2 layers synthesized via selenization from both the nontreated (WSe2 [W]) and ozone-treated (WSe2 [W + O3]) precursors.
As shown in the transmittance spectra (Figure 11a), the bare fused silica substrate and the initial ultra-thin precursors exhibit high transparency. Notably, the UV–ozone treatment of the tungsten precursor (W + O3) enhances transmittance in the 200–450 nm UV range, indicating the partial oxidation of metallic tungsten into a wider-bandgap, highly transparent tungsten oxide (WOx) phase. Following selenization, the WSe2 layer synthesized from this ozonated precursor (WSe2 [W + O3]) demonstrates a distinctly higher transmittance profile across the visible spectrum compared to the film grown from the pristine precursor (WSe2 [W]). This increased transparency is highly consistent with the pronounced morphological expansion and structural changes observed during the AFM analysis.
These structural modifications also profoundly influence the fine absorption characteristics of the WSe2 layers. As depicted in the absorbance spectra (Figure 11b), interlayer coupling effects and layer thickness can be effectively investigated by examining specific excitonic features. In the nontreated WSe2 samples, the primary excitonic absorption peaks A and B, which originate from direct bandgap transitions at the K point of the Brillouin zone, are located at approximately 749 nm and 600 nm, respectively [29]. The energy separation between these peaks reflects the magnitude of the spin–orbit interaction within the lattice [30]. Upon introducing the UV-O3 treatment to the precursor, these peaks undergo a distinct wavelength shift to 773 nm and 613 nm.
Furthermore, the spectra reveal higher-energy absorption peaks A′ and B′ at 529 nm and 440 nm (shifting to 552 nm and 444 nm post treatment). These features are excitonic in nature and arise from the splitting of the ground and excited states of the A and B transitions. This splitting is driven by both inter- and intralayer perturbations to the tungsten d-electron band by the extensive overlap with adjacent selenium p-orbitals. The persistence of the A′ and B′ peaks, characteristic even in monolayer regimes, suggests that this splitting is predominantly governed by intralayer effects [31,32].
In the WSe2 sample synthesized from the pre-ozonated W layer, a distinct tendency for peaks B and A′ to converge is observed. This convergence, alongside the broader spectral shifts governed by geometrical confinement and potential localized strain of the excitons [33,34], serves as a strong indicator of a reduced number of layers. Overall, the combined optical data confirms that the pre-ozonation of the W precursor facilitates the fine-tuning of the final WSe2 thickness, yielding highly transparent layers with distinctly shifted excitonic absorption profiles [35].
3.6. Photoluminescence Spectroscopy Analysis
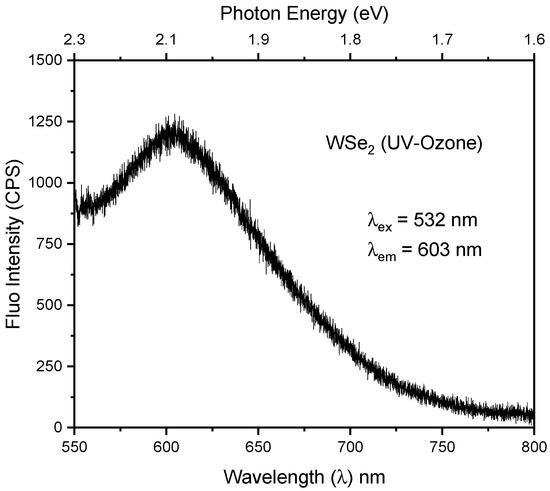
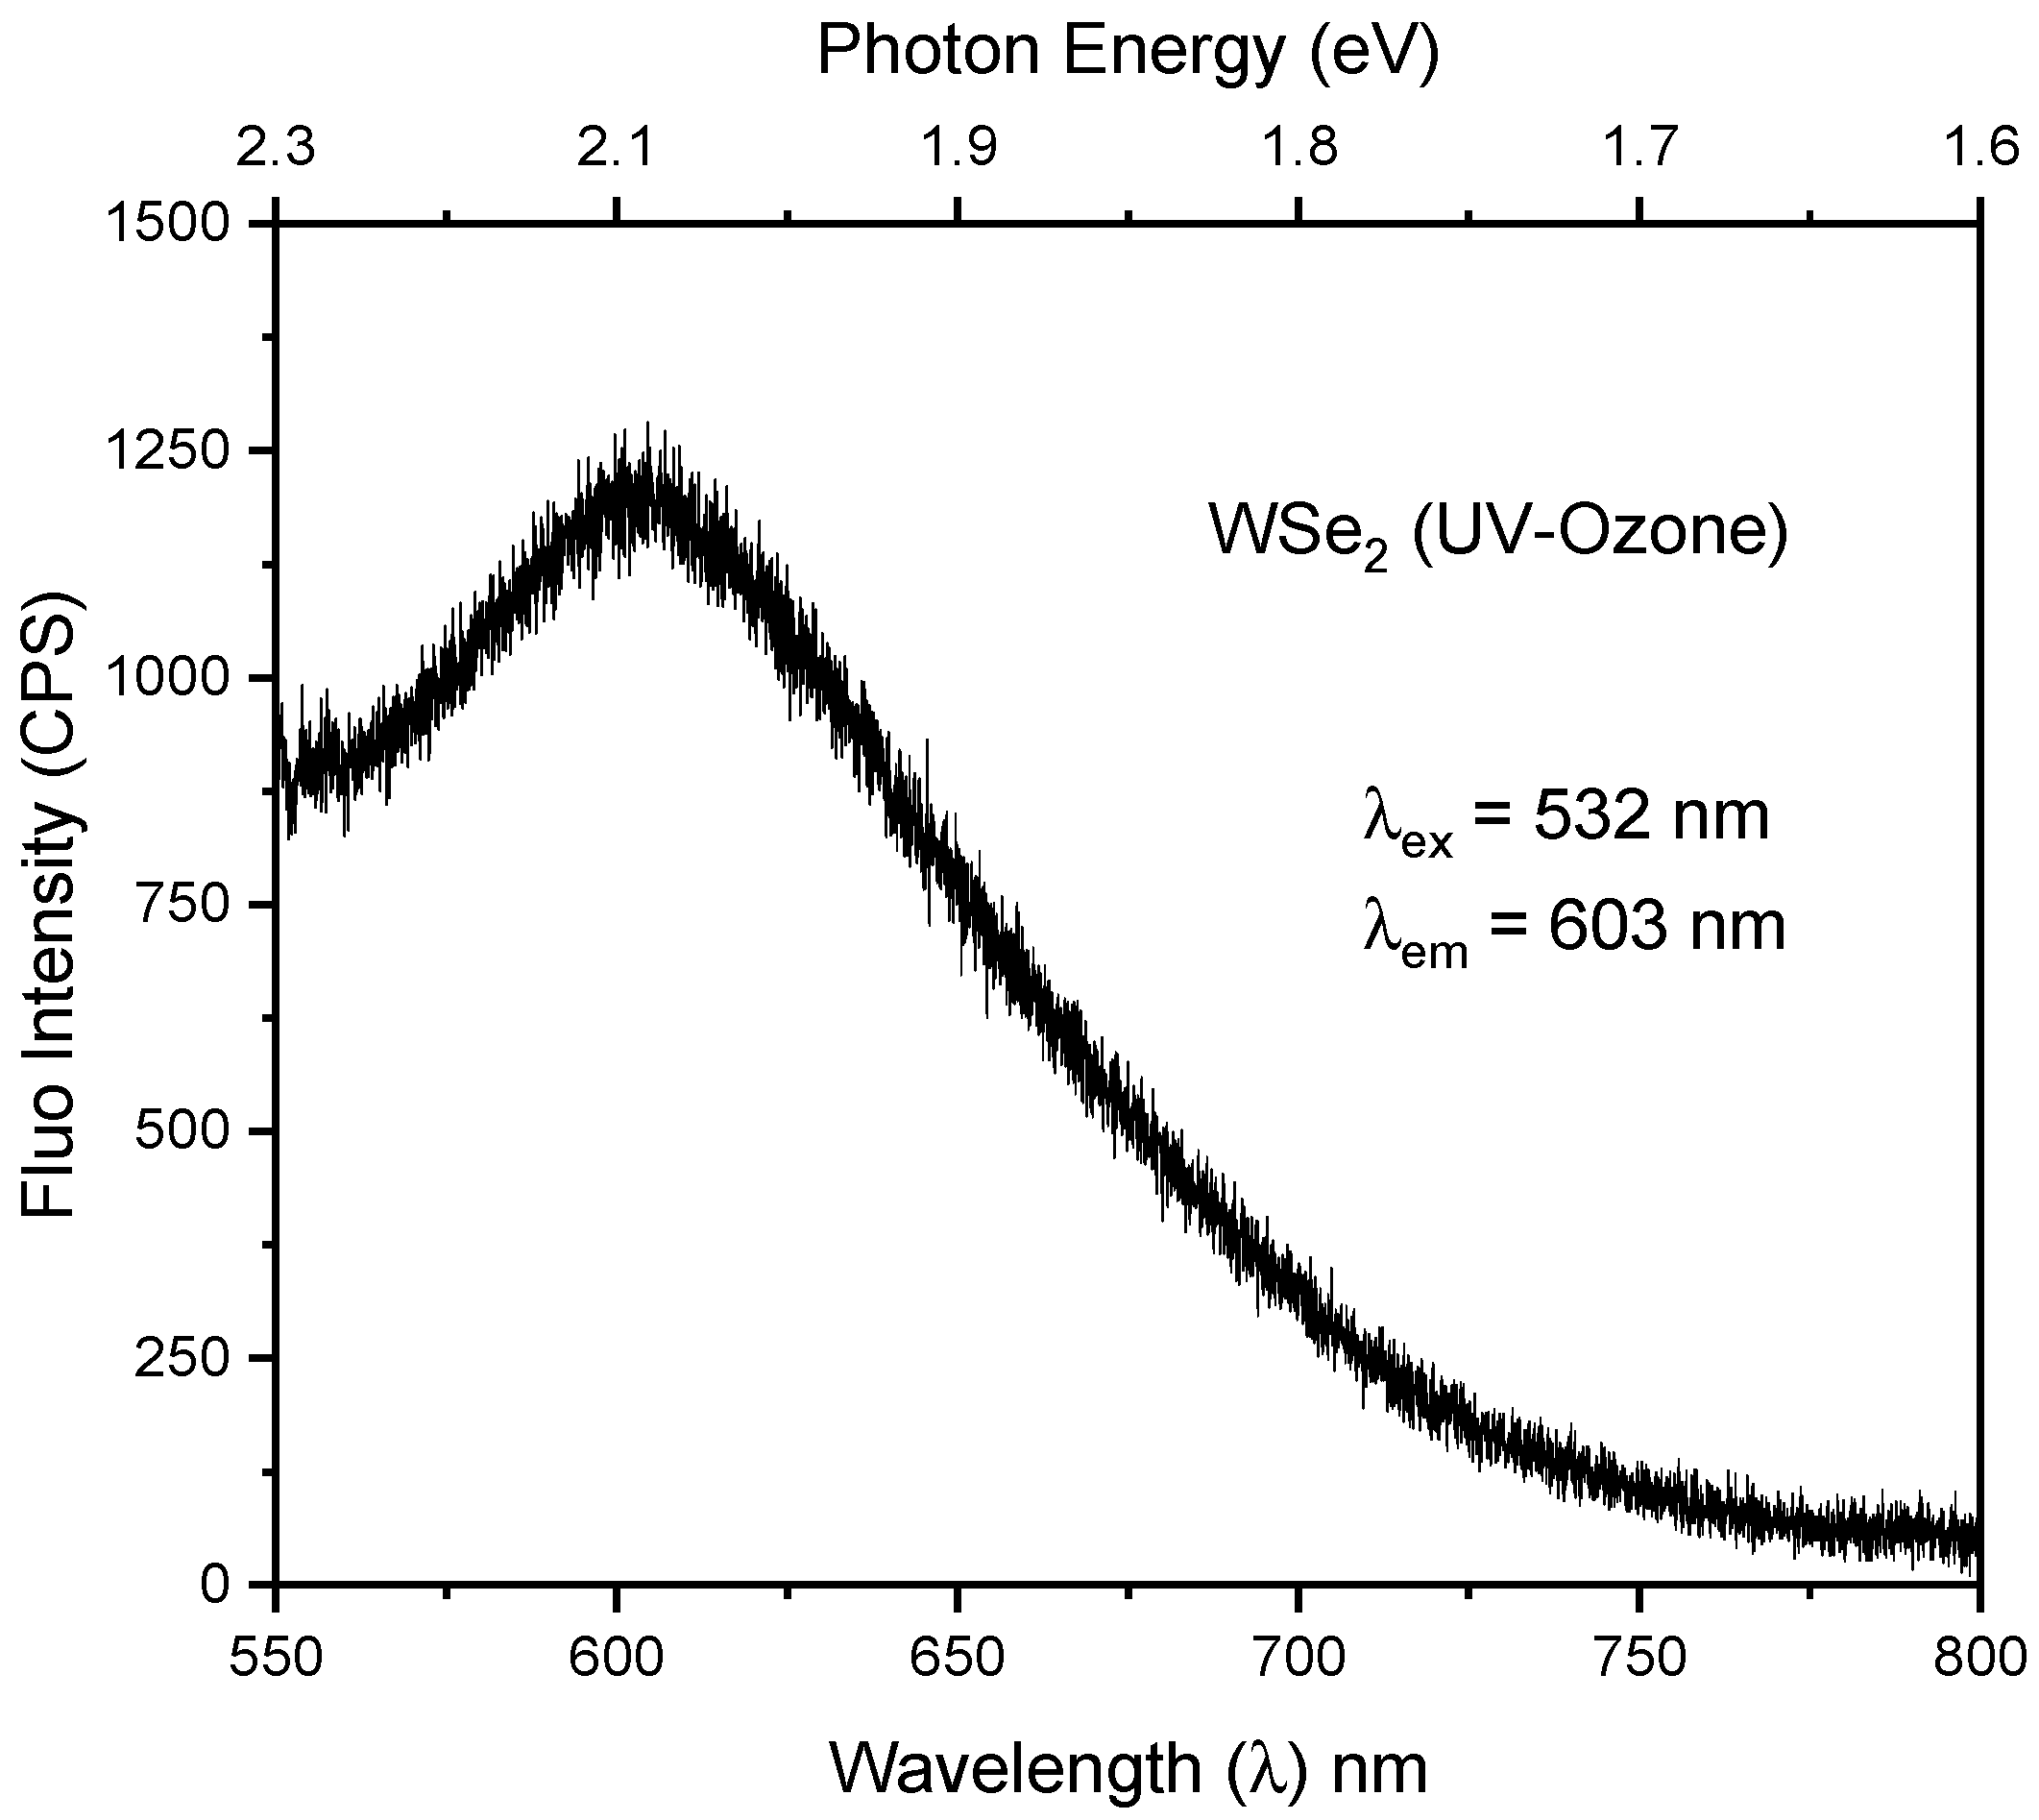
To further evaluate the excitonic properties and optical quality of the synthesized films, photoluminescence (PL) spectroscopy was conducted on the UV–ozone-treated WSe2 layers using a 532 nm excitation source. The PL spectrum (Figure 12) exhibits a prominent emission peak centered at 603 nm. This emission corresponds to the B-exciton radiative recombination, which originates from the direct transition between the conduction band and the deeper, spin–orbit split valence band at the K point of the Brillouin zone. The spectral position of this PL peak is in excellent agreement with the excitonic absorption feature B (~613 nm) previously identified in the UV-Vis-NIR absorbance spectra. The presence of distinct B-exciton emission corroborates the high crystalline integrity, the strong spin–orbit coupling, and the robust excitonic nature of the 2D WSe2 synthesized via the intermediate UV–ozone precursor modification approach.
Figure 12.
Room-temperature photoluminescence spectrum of the WSe2 synthesized via the intermediate UV–ozone route, measured under 532 nm excitation. The emission maximum at λem ~603 nm (~2.06 eV) coincides with the B/A′ excitonic window resolved in the absorbance spectra (Figure 11b).
4. Conclusions
We have successfully demonstrated a modified two-step thermally assisted conversion method for the synthesis of 2D WSe2, highlighting the critical role of an intermediate UV–ozone treatment of tungsten precursor. The conversion of the initial metallic tungsten film into a dense WO3 precursor layer prior to selenization significantly improves the structural, morphological, and electronic quality of the final 2D material. Microstructural analyses confirm that pre-ozonation promotes the growth of large, highly uniform triangular WSe2 flakes with average lateral dimensions exceeding 5 µm. This step successfully resolves the issue of incomplete phase conversion and mixed WO3/WSe2 phases that frequently occur in untreated samples. Spectroscopic measurements definitively show the formation of a pure WSe2 lattice. The intermediate oxidation strategy enables the fine-tuning of the material’s electronic band structure, which directly benefits specific downstream applications. The resulting WSe2 synthesized via the WO3 pathway exhibits an enhanced p-type character with a valence band maximum shift to 0.35 eV, a tuning attributed to residual oxygen doping. This stronger p-type character lowers the energy barrier for hole transport, optimizing hole extraction for advanced photovoltaic and optoelectronic architectures. Conversely, the localized defect states introduced by the residual oxygen serve as active surface adsorption sites. This provides a highly viable route to enhance the sensitivity and response times of gas and humidity sensor platforms. Optical studies corroborate these structural improvements, displaying enhanced visible transmittance and distinct excitonic peak shifts consistent with reduced layer thickness. Ultimately, this intermediate oxidation approach provides a robust, scalable method for fine-tuning the dimensions and electronic properties of WSe2, facilitating its future integration into advanced optoelectronic, photovoltaic, and nanoelectronic devices.
Author Contributions
Conceptualization, I.A. and V.V.; methodology, I.D., P.R.,D.K., I.A., V.S. and V.V.; validation, D.K., I.A., V.S. and V.V.; formal analysis, I.A., D.K., I.A., V.S. and V.V.; investigation, I.A. and V.V.; resources, V.M. and D.D.; writing—original draft preparation, I.A., D.K., I.A., V.V., V.M. and D.D.; writing—review and editing, V.M. and D.D.; visualization V.M.; supervision, D.K., V.V., V.M. and D.D.; project administration, V.M. and D.D.; funding acquisition, V.M. and D.D. All authors have read and agreed to the published version of the manuscript.
Funding
We acknowledge the Bulgarian Science Fund support under the projects number KΠ-06-H-58/12 and KΠ-06-KOCT/24.
Institutional Review Board Statement
Not applicable.
Informed Consent Statement
Not applicable.
Data Availability Statement
Data will be available under reliable request.
Acknowledgments
Research equipment of distributed research infrastructure INFRAMAT (part of the Bulgarian National Roadmap for Research Infrastructures) supported by the Bulgarian Ministry of Education and Science acknowledged. Research equipment of the project № BG16RFPR002-1.014-0006 “National Centre of Excellence Mechatronics and Clean Technologies” was used for experimental work financially supported by the European Regional Development Fund under the “Research Innovation and Digitization for Smart Transformation” program 2021–2027.
Conflicts of Interest
The authors declare no conflicts of interest.
References
- Xue, G.; Qin, B.; Ma, C.; Yin, P.; Liu, C.; Liu, K. Large-Area Epitaxial Growth of Transition Metal Dichalcogenides. Chem. Rev. 2024, 124, 9785–9865. [Google Scholar] [CrossRef] [Scilit] [PubMed]
- Paidi, H.K.; Varghese, L.; Shruthi, S.; Babu, D.J. Progress in the chemical vapor deposition of 2D transition metal dichalcogenides: Toward structural and morphological engineering. J. Phys. D Appl. Phys. 2025, 58, 413001. [Google Scholar]
- Shearer, M.J.; Li, W.; Foster, J.G.; Stolt, M.J.; Hamers, R.J.; Jin, S. Removing Defects in WSe2 via Surface Oxidation and Etching to Improve Solar Conversion Performance. ACS Energy Lett. 2018, 4, 102–109. [Google Scholar] [CrossRef] [Scilit]
- Sun, H.; Li, D.; Yue, X.; Hong, R.; Yang, W.; Liu, C.; Xu, H.; Lu, J.; Dong, L.; Wang, G.; et al. A Review of transition metal dichalcogenides based biosensors. Front. Bioeng. Biotechnol. Sec. Biosens. Biomol. Electron. 2022, 10, 941135. [Google Scholar] [CrossRef] [Scilit] [PubMed]
- Rani, A.; Verma, A.; Yadav, B.C. Advancements in transition metal dichalcogenides (TMDCs) for self-powered photodetectors: Challenges, properties, and functionalization strategies. Mater. Adv. 2024, 5, 3535–3562. [Google Scholar] [CrossRef] [Scilit]
- Kumar, V.P.; Raut, P.; Panda, D.K.; Rashed, A.N.Z. Exploring Next-Generation TMDC Materials: A Comprehensive Review of Their Classifications, Properties, and Applications. Silicon 2025, 17, 1199–1221. [Google Scholar] [CrossRef] [Scilit]
- Piacentini, A.; Daus, A.; Wang, Z.; Lemme, M.C.; Neumaier, D. Potential of Transition Metal Dichalcogenide Transistors for Flexible Electronics Applications. Adv. Electron. Mater. 2023, 9, 2300181. [Google Scholar] [CrossRef] [Scilit]
- Cheng, Q.; Pang, J.; Sun, D.; Wang, J.; Zhang, S.; Liu, F.; Chen, Y.; Yang, R.; Liang, N.; Lu, X.; et al. WSe2 2D p-type semiconductor-based electronic devices for information technology: Design, preparation, and applications. InfoMat 2020, 2, 656–697. [Google Scholar] [CrossRef] [Scilit]
- Yamamoto, M.; Nakaharai, S.; Ueno, K.; Tsukagoshi, K. Self-Limiting Oxides on WSe2 as Controlled Surface Acceptors and Low-Resistance Hole Contacts. Nano Lett. 2016, 16, 2720–2727. [Google Scholar] [CrossRef] [Scilit] [PubMed]
- Zhou, H.; Wang, C.; Shaw, J.C.; Cheng, R.; Chen, Y.; Huang, X.; Liu, Y.; Weiss, N.O.; Lin, Z.; Huang, Y.; et al. Large Area Growth and Electrical Properties of p-Type WSe2 Atomic Layers. Nano Lett. 2015, 15, 709–713. [Google Scholar] [PubMed]
- Li, Z.; Yang, S.; Dhall, R.; Kosmowska, E.; Shi, H.; Chatzakis, I.; Cronin, S.B. Layer Control of WSe2 via Selective Surface Layer Oxidation. ACS Nano 2016, 10, 6836–6842. [Google Scholar] [CrossRef] [Scilit] [PubMed]
- Park, K.; Kim, Y.; Song, J.-G.; Kim, S.J.; Lee, C.W.; Ryu, G.H.; Lee, Z.; Park, J.; Kim, H. Uniform, large-area self-limiting layer synthesis of tungsten diselenide. 2D Mater. 2016, 3, 014004. [Google Scholar] [CrossRef] [Scilit]
- Zhang, S.; Pang, J.; Cheng, Q.; Yang, F.; Chen, Y.; Liu, Y.; Li, Y.; Gemming, T.; Liu, X.; Ibarlucea, B.; et al. High-performance electronics and optoelectronics of monolayer tungsten diselenide full film from pre-seeding strategy. InfoMat 2021, 12, 1311–1469. [Google Scholar]
- Buchkov, K.; Rafailov, P.; Minev, N.; Videva, V.; Avramova, I.; Strijkova, V.; Lukanov, T.; Dimitrov, D.; Marinova, V. Liquid-Precursor-Mediated CVD Synthesis of WSe2. Condens. Matter 2026, 11, 14. [Google Scholar] [CrossRef] [Scilit]
- Buchkov, K.; Rafailov, P.; Minev, N.; Videva, V.; Strijkova, V.; Lukanov, J.; Dimitrov, D.; Marinova, V. Metatungstate Chemical Vapor Deposition of WSe2: Substrate Effects, Shapes, and Morphologies. Crystals 2024, 14, 184. [Google Scholar] [CrossRef] [Scilit]
- Marinova, V.; Buchkov, K.; Videva, V.; Dionisiev, I.; Minev, N.; Strijkova, V.; Dimov, D.; Dikov, H.; Avramova, I.; Rafailov, P.; et al. Evolution of WSe2 Flakes Synthesized by Thermally Assisted Conversion Method. Coatings 2022, 12, 353. [Google Scholar] [CrossRef] [Scilit]
- Altvater, M.; Muratore, C.; Snure, M.; Glavin, N.R. Two-Step Conversion of Metal and Metal Oxide Precursor Films to 2D Transition Metal Dichalcogenides and Heterostructures. Small 2025, 21, 2400463. [Google Scholar]
- Hao, S.; Hao, Y.; Li, J.; Wang, K.; Fan, C.; Zhang, S.; Wei, Y.; Hao, G. Controllable growth of two-dimensional wrinkled WSe2 nanostructures via chemical vapor deposition based on thermal mismatch strategy. Appl. Phys. Lett. 2024, 125, 072102. [Google Scholar] [CrossRef] [Scilit]
- Hao, Y.; Zhang, S.; Fan, C.; Liu, J.; Hao, S.; Lu, X.; Zhou, J.; Qiu, M.; Li, J.; Hao, G. Te nanomesh-monolayer WSe2 vertical van der Waals heterostructure for high-performance photodetector. Appl. Phys. Lett. 2025, 126, 031904. [Google Scholar] [CrossRef] [Scilit]
- Hoffman, A.N.; Stanford, M.G.; Sales, M.G.; Zhang, C.; Ivanov, I.N.; McDonnell, S.J.; Mandrus, D.G.; Rack, P.D. Tuning the electrical properties of WSe2 via O2 plasma oxidation: Towards lateral homojunctions. 2D Mater. 2019, 6, 045024. [Google Scholar] [CrossRef] [Scilit]
- Mittal, H.; Raza, M.; Khanuja, M. Liquid phase exfoliation of MoSe2: Effect of solvent on morphology, edge confinement, bandgap and number of layers study. Methods X 2023, 11, 102409. [Google Scholar] [CrossRef] [Scilit] [PubMed]
- Yang, S.; Lee, G.; Kim, J. Selective p-Doping of 2D WSe2 via UV/Ozone Treatments and Its Application in Field-Effect Transistors. ACS Appl. Mater. Interfaces 2021, 13, 955–961. [Google Scholar] [CrossRef] [Scilit] [PubMed]
- Nakano, M.; Wang, Y.; Kashiwabara, Y.; Matsuoka, H.; Iwasa, Y. Layer-by-Layer Epitaxial Growth of Scalable WSe2 on Sapphire by Molecular Beam Epitaxy. Nano Lett. 2017, 17, 5595–5599. [Google Scholar] [CrossRef] [Scilit] [PubMed]
- Terrones, H.; Del Corro, E.; Feng, S.; Poumirol, J.M.; Rhodes, D.; Smirnov, D.; Pradhan, N.R.; Lin, Z.; Nguyen, M.A.T.; Elías, A.L.; et al. New First Order Raman-active Modes in Few Layered Transition Metal Dichalcogenides. Sci. Rep. 2014, 4, 4215. [Google Scholar] [CrossRef] [Scilit] [PubMed]
- Wang, Q.H.; Kalantar-Zadeh, K.; Kis, A.; Coleman, J.N.; Strano, M.S. Electronics and optoelectronics of two-dimensional transition metal dichalcogenides. Nat. Nanotechnol. 2012, 7, 699–712. [Google Scholar] [CrossRef] [Scilit] [PubMed]
- Pospischil, A.; Furchi, M.M.; Mueller, T. Solar-energy conversion and light emission in an atomic monolayer p–n diode. Nat. Nanotechnol. 2014, 9, 257–261. [Google Scholar] [CrossRef] [Scilit] [PubMed]
- Kraut, E.A.; Grant, R.W.; Waldrop, J.R.; Kowalczyk, S.P. Semiconductor core-level to valence-band maximum binding-energy differences: Precise determination by x-ray photoelectron spectroscopy. Phys. Rev. B 1983, 28, 1965. [Google Scholar] [CrossRef] [Scilit]
- Shallenberger, J.R. 2D tungsten diselenide analyzed by XPS. Surf. Sci. Spectra 2018, 25, 014001. [Google Scholar] [CrossRef] [Scilit]
- Yan, T.; Xiaofen Qiao, X.; Liu, X.; Tan, P.; Zhang, X. Photoluminescence properties and exciton dynamics in monolayer WSe2. Appl. Phys. Lett. 2014, 105, 101901. [Google Scholar] [CrossRef] [Scilit]
- Wu, M.; Xiao, Y.; Zeng, Y.; Zhou, Y.; Zeng, X.; Zhang, L.; Liao, W. Synthesis of two-dimensional transition metal dichalcogenides for electronics and optoelectronics. InfoMat 2020, 3, 362–396. [Google Scholar] [CrossRef] [Scilit]
- Zhao, W.; Ghorannevis, Z.; Amara, K.K.; Pang, J.R.; Toh, M.; Zhang, X.; Kloc, C.; Tan, P.H.; Eda, G. Lattice dynamics in mono- and few-layer sheets of WS2 and WSe2. Nanoscale 2013, 5, 9677–9683. [Google Scholar] [CrossRef] [Scilit] [PubMed]
- Zhao, W.; Ghorannevis, Z.; Chu, L.; Toh, M.; Kloc, C.; Tan, P.H.; Eda, G. Evolution of electronic structure in atomically thin sheets of WS2 and WSe2. ACS Nano 2012, 7, 791–797. [Google Scholar] [CrossRef] [Scilit] [PubMed]
- Huang, J.; Hoang, T.B.; Mikkelsen, M.H. Probing the origin of excitonic states in monolayer WSe2. Sci. Rep. 2016, 3, 22414. [Google Scholar] [CrossRef] [Scilit] [PubMed]
- He, K.; Kumar, N.; Zhao, L.; Wang, Z.; Kin Fai Mak, K.F.; Zhao, H.; Shan, J. Tightly bound excitons in monolayer WSe2. Phys. Rev. Lett. 2014, 113, 026803. [Google Scholar] [CrossRef] [Scilit] [PubMed]
- Tonndorf, P.; Schmidt, R.; Böttger, P.; Zhang, X.; Börner, J.; Liebig, A.; Albrecht, M.; Kloc, C.; Gordan, O.; Zahn, D.R.T.; et al. Photoluminescence emission and Raman response of monolayer MoS2, MoSe2, and WSe2. Opt. Express 2013, 21, 4908–4916. [Google Scholar] [PubMed]

Disclaimer/Publisher’s Note: The statements, opinions and data contained in all publications are solely those of the individual author(s) and contributor(s) and not of MDPI and/or the editor(s). MDPI and/or the editor(s) disclaim responsibility for any injury to people or property resulting from any ideas, methods, instructions or products referred to in the content. |
© 2026 by the authors. Licensee MDPI, Basel, Switzerland. This article is an open access article distributed under the terms and conditions of the Creative Commons Attribution (CC BY) license.