


Abstract
High-fidelity simulation testing is a critical component in ensuring the safety and reliability of autonomous driving systems. However, traditional methods for constructing simulation scenarios face two major bottlenecks. First, acquiring realistic road network topologies that adhere to physical and traffic rules is expensive. Second, the manual placement of scenario elements (e.g., vehicles and pedestrians) is a time-consuming and labor-intensive process, which struggles to meet the demands of large-scale and diverse testing. To address these challenges, this paper proposes an efficient and automated simulation scenario generation method and toolchain. The proposed approach begins by extracting road network topologies from real-world data sources (e.g., open map datasets) and then uses specialized tools, such as RoadRunner, to automatically assign traffic semantics and rules. The key innovation lies in leveraging the powerful image-text understanding capabilities of large multimodal models (LMMs) to analyze road network images and textual descriptions, generating a semantic heatmap that represents the spatial distribution probabilities of scenario elements. This heatmap guides the procedural content generation (PCG) process, enabling the intelligent and scalable deployment of traffic participants. Experimental results demonstrate that the proposed method can efficiently generate large-scale, high-fidelity, and cost-effective simulation scenarios. The generated scenarios not only maintain realism in topology and traffic rules but also feature rich perception and interaction capabilities. Furthermore, based on this method, we have constructed and released a novel simulation dataset tailored for training perception algorithms, further validating the practical value and advancement of the toolchain.
1. Introduction
With the rapid advancement of artificial intelligence and sensor technologies, autonomous driving has transitioned from a conceptual vision to a tangible reality [1], heralded as a revolutionary transformation in future transportation [2,3]. Level 2 (L2) and Level 3 (L3) assisted driving systems have already been widely deployed in mass-produced vehicles, while higher-level autonomous driving technologies, such as Level 4 (L4) and Level 5 (L5), are undergoing intensive research and testing [4]. However, achieving the commercial deployment of fully autonomous driving requires overcoming a critical barrier: ensuring its safety and reliability across a wide range of complex and even extreme traffic scenarios [5].
Traditional on-road testing remains an indispensable approach for validating the performance of autonomous driving systems [6]. However, its limitations are becoming increasingly apparent. Real-world road testing is not only costly and time-intensive but also struggles to efficiently and safely reproduce “edge cases”—those rare but critical scenarios that are essential for ensuring system safety. These edge cases include sudden traffic accidents, adverse weather conditions, or pedestrian violations. As a result, high-fidelity simulation testing has emerged as a parallel and indispensable paradigm for the development and validation of autonomous driving systems. Simulation enables developers to conduct large-scale, repeatable regression and stress tests on autonomous driving algorithms in a virtual environment with significantly lower costs and higher efficiency.
Although the importance of simulation testing is widely recognized across the industry, current mainstream methods for constructing simulation scenarios face significant challenges, severely limiting the speed of algorithm iteration and the breadth of test coverage. Specifically, these challenges can be summarized in the following two aspects:
- Costs and Realism Challenges in Road Network Construction: The foundation of simulation lies in the digital representation of road networks [7]. A high-fidelity road network not only requires an accurate geometric topology but must also include rich traffic semantic information, such as lane types, speed limits, traffic signs, and signal rules. Traditional methods for road network construction, such as manual modeling or creating networks from scratch using specialized software, are extremely labor-intensive and struggle to ensure consistency with the real world [8,9]. While it is possible to derive road networks from the real world using high-definition map collection, this process involves costly fleet operations and complex data processing workflows, making it prohibitively expensive and difficult to scale.
- Inefficient Manual Deployment of Scenario Elements: Beyond static road networks, dynamic traffic participants (e.g., background vehicles, pedestrians, and non-motorized vehicles) are essential to create a complete and interactive scenario. Currently, most scenarios still rely on simulation engineers to manually place and script each participant’s behavior [10]. This “handcrafted” development approach is not only time-consuming and labor-intensive but also heavily dependent on the expertise of individual engineers. Consequently, the generated scenarios often suffer from significant limitations in diversity and complexity, failing to meet the growing demand for large-scale, diverse test cases required by autonomous driving algorithms [11].
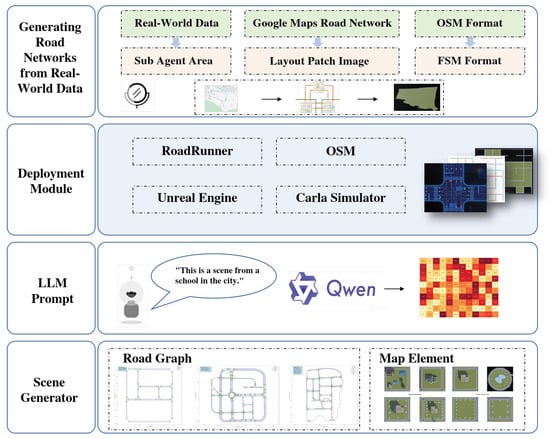
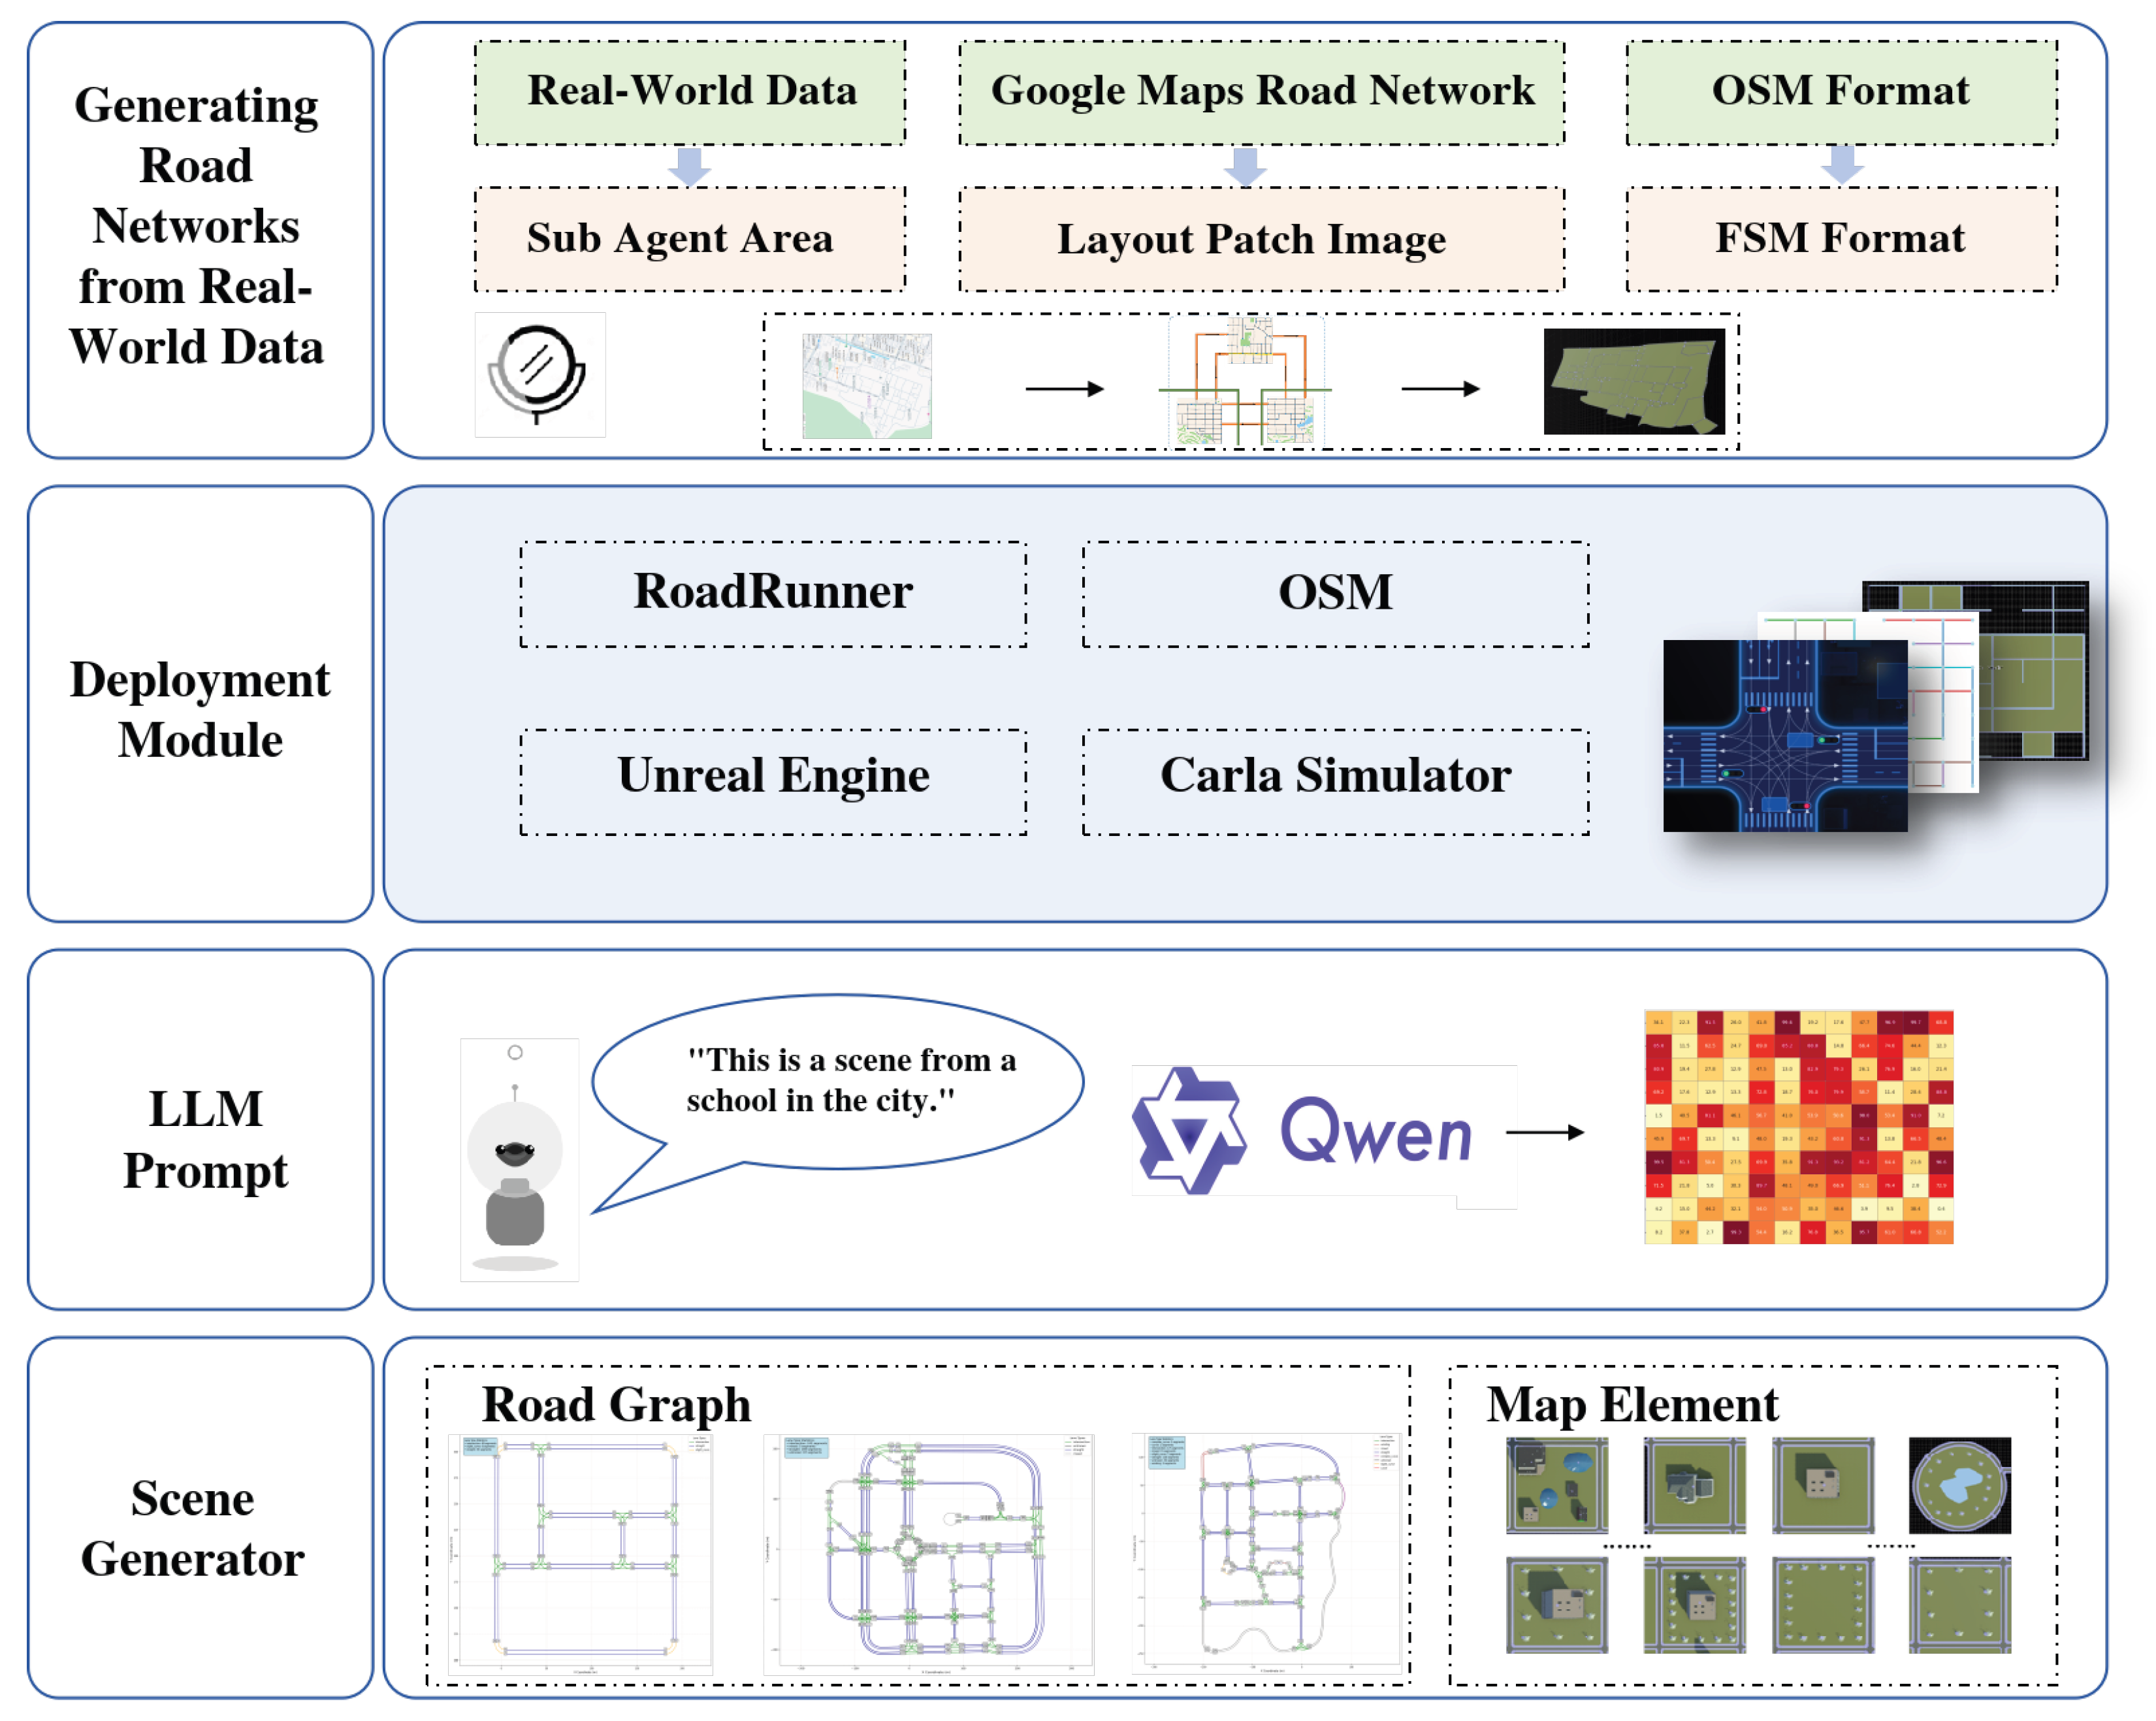
To systematically address the aforementioned challenges and break through the efficiency bottleneck of current simulation scenario generation, this paper proposes an efficient simulation scenario generation method and toolchain, SceneGen-LLM, which integrates real-world road network topologies with priors from large-scale models. The core innovation of our approach lies in leveraging the powerful semantic understanding capabilities of large multimodal models (LMMs) [12,13] to provide spatial priors for the automated deployment of scenario elements, as illustrated in Figure 1. Specifically, by inputting a bird’s-eye view of the road network along with a textual description of the scenario context (e.g., “school dismissal”), the model generates a “semantic heatmap” that accurately predicts the spatial probability distribution of various traffic participants (e.g., students, vehicles) [14,15]. This semantic heatmap replaces the need for tedious manual planning and provides intelligent spatial layout guidance for subsequent procedural content generation (PCG).
Figure 1.
Illustration of the Semantic Heatmap Generation Process Based on Large Multimodal Models. This figure demonstrates the core innovation of our method: by inputting a bird’s-eye view of the road network combined with textual prompts describing the scenario context (e.g., “an afternoon school dismissal scene in an urban school area”) into a large multimodal model (LMM), the model generates a semantic heatmap. This heatmap represents, in the form of probability distributions, the regions where different traffic participants (e.g., “students,” “waiting parents,” and “passing vehicles”) are most likely to appear. Warmer colors indicate higher probabilities, whereas cooler colors indicate lower probabilities. The heatmap subsequently guides the automated and intelligent deployment of elements in the simulation scenario, addressing the core limitations of traditional methods, such as low efficiency and insufficient logical consistency in manual placement.
The core idea of our method is to seamlessly combine the automated construction of road networks with the intelligent deployment of scenario content, forming an efficient and fully automated pipeline. The workflow consists of the following three main components:
Extraction and Semantic Enrichment of Real-World Road Networks [16]: We first extract road network topologies from publicly available geographic information datasets. Using specialized tools such as RoadRunner, we enrich these networks with traffic-related semantic information, such as lane markings, traffic signs, and signals, based on standardized traffic rule databases.
Semantic Heatmap Generation Driven by Large Multimodal Models: This is the key innovation of our approach. By leveraging large multimodal models, we input a bird’s-eye view [17,18] of the road network along with relevant textual descriptions (e.g., “This is a school area in the city”). The model, with its powerful image-text understanding capabilities, outputs a “semantic heatmap.” This heatmap visually represents the spatial probability distribution of different types of traffic participants, such as students, passengers waiting for buses, or passing vehicles, within the road network.
Automated Scenario Deployment: Finally, the semantic heatmap is fed into a procedural content generation (PCG) engine to guide the automated and intelligent deployment of traffic participants. This approach ensures that the distribution of scenario elements is both logical and diverse, meeting the requirements for large-scale, complex simulation testing.
Although recent studies have explored the application of large language models (LLMs) and vision–language models in autonomous driving, most existing approaches focus on high-level reasoning tasks such as decision-making, behavior prediction, or natural language interaction. These methods typically generate symbolic descriptions or policies rather than explicit spatial layouts required for simulation environments.
Furthermore, existing LLM/LMM-based approaches lack the capability to model fine-grained spatial distributions of traffic participants in continuous environments. As a result, scenario construction still relies on handcrafted rules or heuristic sampling.
In contrast, SceneGen-LLM explicitly models spatial distributions by transforming multimodal semantic understanding into probabilistic heatmaps. This design enables a direct coupling between semantic reasoning and spatial deployment, bridging the gap between high-level cognition and low-level simulation generation.
In addition, existing procedural scenario generation pipelines lack semantic understanding of traffic context. Without high-level semantic reasoning, generated scenes may violate realistic spatial distributions of traffic participants. For example, pedestrians may be placed in unrealistic areas or vehicles may be deployed without considering contextual traffic density.
To address this gap, we propose SceneGen-LLM, a multimodal semantic scenario generation framework that integrates large multimodal models (LMMs) with procedural content generation. Instead of directly generating scenes, the LMM predicts semantic spatial priors in the form of probability heatmaps. These heatmaps guide the procedural deployment of traffic participants while preserving spatial consistency with the road topology and scenario context.
Illustration of the Semantic Heatmap Generation Process Based on Large Multimodal Models This figure highlights the core innovation of our method: by inputting a bird’s-eye view of a road network and a textual prompt describing the scenario context (e.g., “an afternoon school dismissal scene in an urban school area”) into a large multimodal model (LMM), the model generates a semantic heatmap. This heatmap visually represents, in the form of probability distributions, the areas where different types of traffic participants (e.g., “students,” “waiting parents,” “passing vehicles”) are most likely to appear. The heatmap then guides the automated and intelligent deployment of elements in the simulation scenario, addressing the core challenges of traditional methods, such as low efficiency and lack of logical consistency in manual placement.
The main contributions of this work can be summarized as follows:
- We propose a multimodal semantic heatmap generation mechanism that predicts spatial probability distributions of traffic participants based on map images and scenario descriptions.
- We design a hybrid simulation scenario generation pipeline that integrates large multimodal model reasoning with procedural content generation.
- We develop an automated toolchain that converts real-world geographic data into executable simulation scenarios compatible with autonomous driving simulators.
- We construct a simulation dataset generated by the proposed pipeline and evaluate the generated scenarios using both structural metrics and simulation-based indicators.
2. Related Works
To clearly position the contributions of this paper, this section reviews and analyzes existing technologies from two perspectives: first, autonomous driving simulation platforms that serve as the foundation for virtual testing [19], and second, urban scenario generation techniques that form the core content of virtual environments.
2.1. Autonomous Driving Simulation Platforms and Engines
Autonomous driving simulation platforms act as virtual testing grounds for algorithm validation, offering core capabilities such as rendering, physical simulation, and sensor emulation. Current mainstream simulation platforms can be broadly categorized into three types [20]:
2.1.1. Open-Source Platforms Based on Game Engines
These platforms are widely favored for their outstanding graphical rendering capabilities and vibrant community ecosystems. For instance, CARLA [21] is built on Unreal Engine and provides realistic visual effects and a rich suite of sensor models (e.g., cameras, LiDAR). It has become the de facto standard for perception and planning algorithm research in academia. Similarly, the SVL Simulator (formerly LGSVL), based on the Unity engine, also emphasizes high-fidelity rendering and sensor simulation, while supporting integration with major autonomous driving software stacks, such as Autoware and Apollo. Despite their powerful features, these platforms primarily function as “runtime environments,” where the creation of scenario content still heavily relies on manual editing or importing external resources. As a result, the “content bottleneck” in scenario generation remains a significant limitation.
2.1.2. Professional Commercial Simulation Software
Commercial tools such as CarMaker, VISSIM/VISUM, and PreScan focus more on the precision of vehicle dynamics models, macroscopic traffic flow simulation, and standardized regulatory testing. For example, VISSIM excels in modeling and analyzing large-scale urban traffic flows, while CarMaker offers significant advantages in full-vehicle dynamics simulation. These tools are widely adopted in the industry but are typically expensive and lack flexibility in scenario customization and automated generation. Consequently, they are less suitable for cutting-edge research, which demands rapid iterations of large-scale, diverse scenarios.
2.1.3. Lightweight Traffic Flow Simulators
Tools like SUMO (Simulation of Urban Mobility) specialize in the rapid simulation of microscopic traffic flows. They can efficiently handle large-scale road networks and tens of thousands of traffic participants. However, these tools are not designed for high-fidelity rendering or sensor simulation, limiting their direct applicability for end-to-end perception-to-decision algorithm testing.
In summary, existing simulation platforms provide powerful “execution engines” for autonomous driving testing. However, they generally lack efficient “content creation engines.” The construction of scenarios—particularly large-scale, high-fidelity scenarios enriched with semantic information—remains a critical bottleneck that limits the efficiency of simulation testing.
2.2. Virtual Urban Scenario Generation Techniques
In recent years, several scenario generation frameworks such as PGDrive and Scenic have been proposed to support large-scale autonomous driving simulation. The automated generation of virtual urban scenarios is key to addressing the aforementioned bottlenecks. Among the various aspects of urban scenario generation, the generation of building layouts, which form the backbone of urban scenarios, has been a particularly representative area of development.
Traditionally, building layouts have been considered the core element of urban generation, leading researchers to focus heavily on this aspect. Conventional procedural modeling methods generally generate building layouts on designated parcels after road networks have been created and plots divided [22]. These methods rely on predefined rules and parameters, which, while enabling the rapid generation of large-scale cities, require substantial domain expertise for parameter design and tuning. Additionally, the realism and diversity of the generated results are often limited.
In recent years, the advent of generative artificial intelligence models has brought significant advancements [23,24]. Compared to traditional methods, deep generative approaches eliminate the need for extensive domain expertise by learning hidden patterns of building design from real-world examples. This allows for the synthesis of visually realistic and semantically meaningful building layouts [25]. These methods can be broadly categorized into two types:
2.2.1. Image-Based Generative Methods
These algorithms leverage existing image generation models (e.g., GANs) to learn the pixel-level distribution of buildings in images and generate new building layout images by sampling from the learned distribution. For example, Fedorova et al. [22] used GANs to generate building layouts for cities such as Milan. Subsequent works like ESGAN [26] and CAIN-GAN [27] further improved generation quality and user-controllable diversity. However, in practical applications, image-based methods often require additional vector contour extraction steps, and because they learn pixel-level distributions, the generated building boundaries are often blurry.
2.2.2. Graph-Based Generative Methods
To address the issue of boundary blurriness, graph-based methods directly generate vectorized building layouts. For example, BlockPlanner [28] assumes that most city blocks are rectangular and uses graph neural networks (GNNs) to model and generate building layouts. However, this method struggles with more complex block shapes and irregular buildings. To address this limitation, He et al. [29] proposed a graph attention network-based model for generating building layouts, improving the handling of complex shapes.
2.2.3. Large Model-Based Scenario Generation
Recent research has explored the use of large language models (LLMs) and vision–language models for autonomous driving tasks [30]. For example, DriveGPT and DriveVLM employ large models to interpret driving environments and generate driving policies through natural language reasoning. Similarly, other studies utilize LLMs to describe driving scenarios or assist in decision-making processes.
However, these approaches primarily focus on behavioral reasoning or decision support rather than the spatial generation of simulation environments. The generation of realistic traffic participant layouts remains largely dependent on rule-based methods or handcrafted scenario design.
In contrast, the proposed SceneGen-LLM framework focuses on spatial scenario generation. By leveraging multimodal reasoning capabilities, the model predicts semantic spatial distributions of traffic participants from map images and scenario descriptions. These predictions are transformed into probability heatmaps that guide procedural content generation, enabling scalable and semantically consistent simulation scene construction.
Despite the progress in generative modeling, most existing scenario generation methods for autonomous driving still rely on either rule-based placement or low-level distribution modeling. For example, PGDrive and similar procedural generation frameworks generate traffic participants based on predefined rules and stochastic sampling, lacking high-level semantic understanding of traffic context.
Recent LLM-based approaches such as Linguasim attempt to generate scenarios via natural language instructions. However, these methods typically focus on symbolic or textual representations rather than explicit spatial distributions in continuous environments.
In contrast, our proposed SceneGen-LLM introduces a fundamentally different paradigm: instead of directly generating scenes or rules, we leverage large multimodal models to infer semantic spatial priors in the form of probability heatmaps. This allows the model to bridge high-level semantic reasoning and low-level spatial deployment, which is not explicitly addressed in existing works.
2.3. Our Approach: Large Model-Driven Scenario Generation
Our method leverages large multimodal models to generate semantic distribution models for scenario elements. Compared to purely generative approaches, our approach achieves higher accuracy and greater alignment with real-world spatial distributions [31].
Compared with existing scenario generation methods, our approach differs in three key aspects: (1) it introduces multimodal semantic reasoning instead of purely rule-based or data-driven generation, (2) it models spatial distributions explicitly via probabilistic heatmaps rather than implicit representations, and (3) it decouples semantic inference from procedural generation, improving scalability and flexibility.
3. Method
This chapter provides a detailed introduction to the proposed simulation scenario generation method, SceneGen-LLM, which is based on extracted road network topologies and large model-driven approaches. The method integrates geographic information data, large multimodal models (LMMs), and procedural constraint optimization to achieve high-fidelity traffic scenario generation through a three-stage process: “data semanticization–intelligent generation–procedural construction.” The overall workflow is illustrated in Figure 1 and consists of the following four core modules:
- Road Network Topology Extraction and Semantic Reconstruction
- Large Model Input Design and Semantic Heatmap Generation Mechanism
- Procedural Content Generation and Constraint Optimization
- Toolchain Implementation and Data Export Workflow
3.1. Road Network Topology Extraction and Semantic Reconstruction
3.1.1. Topology Data Extraction
We first construct the base road network structure using open geographic information sources such as OpenStreetMap (OSM). The following elements are extracted from OSM data [32]:
- Node set , which represents road intersections;
- Edge set , which represents road connections;
- Attribute set , which contains metadata such as the number of lanes, speed limits, and road direction.
Based on these elements, the foundational topology graph is constructed as follows:
This topology network serves as the geometric and logical backbone for scenario generation [33,34].
3.1.2. Semantic Layer Completion
To enrich the traffic semantic information (e.g., traffic lights, speed limit signs, lane attributes, and traffic instructions) embedded in various road elements, we employ a combined approach of rule-based matching and tool-assisted generation to achieve semantic reconstruction [35]. Semantic attributes for different road elements are inferred based on road classifications, geographic attributes, and traffic rule templates [36]:
- Deduce lane count, width, and travel direction based on road types;
- Automatically insert traffic signs, signal controls, and speed limit logic;
- Supplement driving rules and behavior patterns based on road function templates;
- Export the final output in ASAM OpenDRIVE format to ensure compatibility with mainstream simulation platforms.
The semantic road types and typical behavior modeling are outlined as follows:
Straight Road
Features: Designed for stable, straight driving, typically single or dual carriageways with clear lane markings. Driving Rules:
- Maintain lane center alignment during driving;
- Adjust speed according to speed limit information;
- Prohibit lane-crossing and tailgating.
Motion Model
where P is the vehicle position, v is longitudinal speed, is the heading angle, and is the simulation timestep (defaulted to 1/20 s).
Turning Road
Features: Roads designed for left turns, right turns, and U-turns, requiring vehicles to pass through at low speeds.
Driving Rules:
- Confirm priority based on signals and scheduling;
- Decelerate during turns and adhere to path constraints;
- Adjust to a new direction after completing the turn.
Motion Model:
Intersection Area
Features: High-complexity areas with traffic convergence and conflict, including traffic lights, stop lines, and pedestrian crossings. Rules and Constraints:
- Obey signal scheduling or priority rules;
- Avoid stopping within the intersection;
- Decelerate proactively for pedestrians or obstacles.
Dynamic Modeling:
Light Change to Green: Gradually accelerate into the next road segment.
Station Interaction
Features: Includes static interaction areas such as bus stops, charging stations, and parking zones. Rules and Constraints:
- During entry: Gradually decelerate and dock;
- During exit: Accelerate and merge into the main road after checking traffic.
Model:
3.1.3. Quality Evaluation Metrics
To quantitatively evaluate the quality of the generated road network, we define the following metrics:
- Geometric Connectivity (Average Node Degree):Standard: , indicating a well-connected network with no isolated nodes.
- Semantic Integrity (S_int):Standard: , representing high semantic completion.
- GIS Alignment Error (Err_align):Standard: , ensuring geometric alignment accuracy.
Road networks meeting these criteria are imported into Unreal Engine for baking and validation, achieving a realistic and consistent mapping between virtual and physical simulation environments.
3.2. Large Model Input Design and Semantic Heatmap Generation
3.2.1. Problem Definition
The goal is to generate a semantic heatmap , which represents the probability of the occurrence of category at coordinate . Here, and .
3.2.2. Input Design
The multimodal semantic inference module is implemented using the Qwen-VL model (Qwen-VL-Chat version). Qwen-VL is a transformer-based vision–language model capable of jointly processing visual and textual information. In this study, we employ the publicly available pre-trained model without additional fine-tuning.
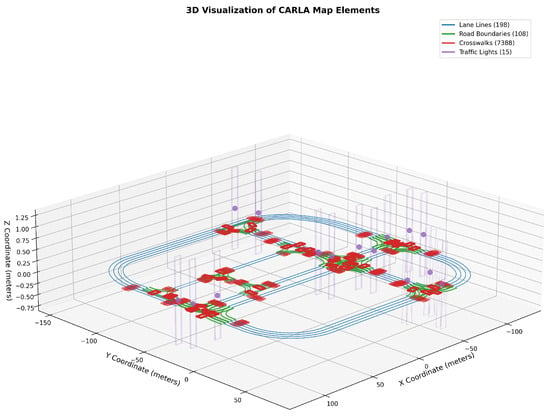
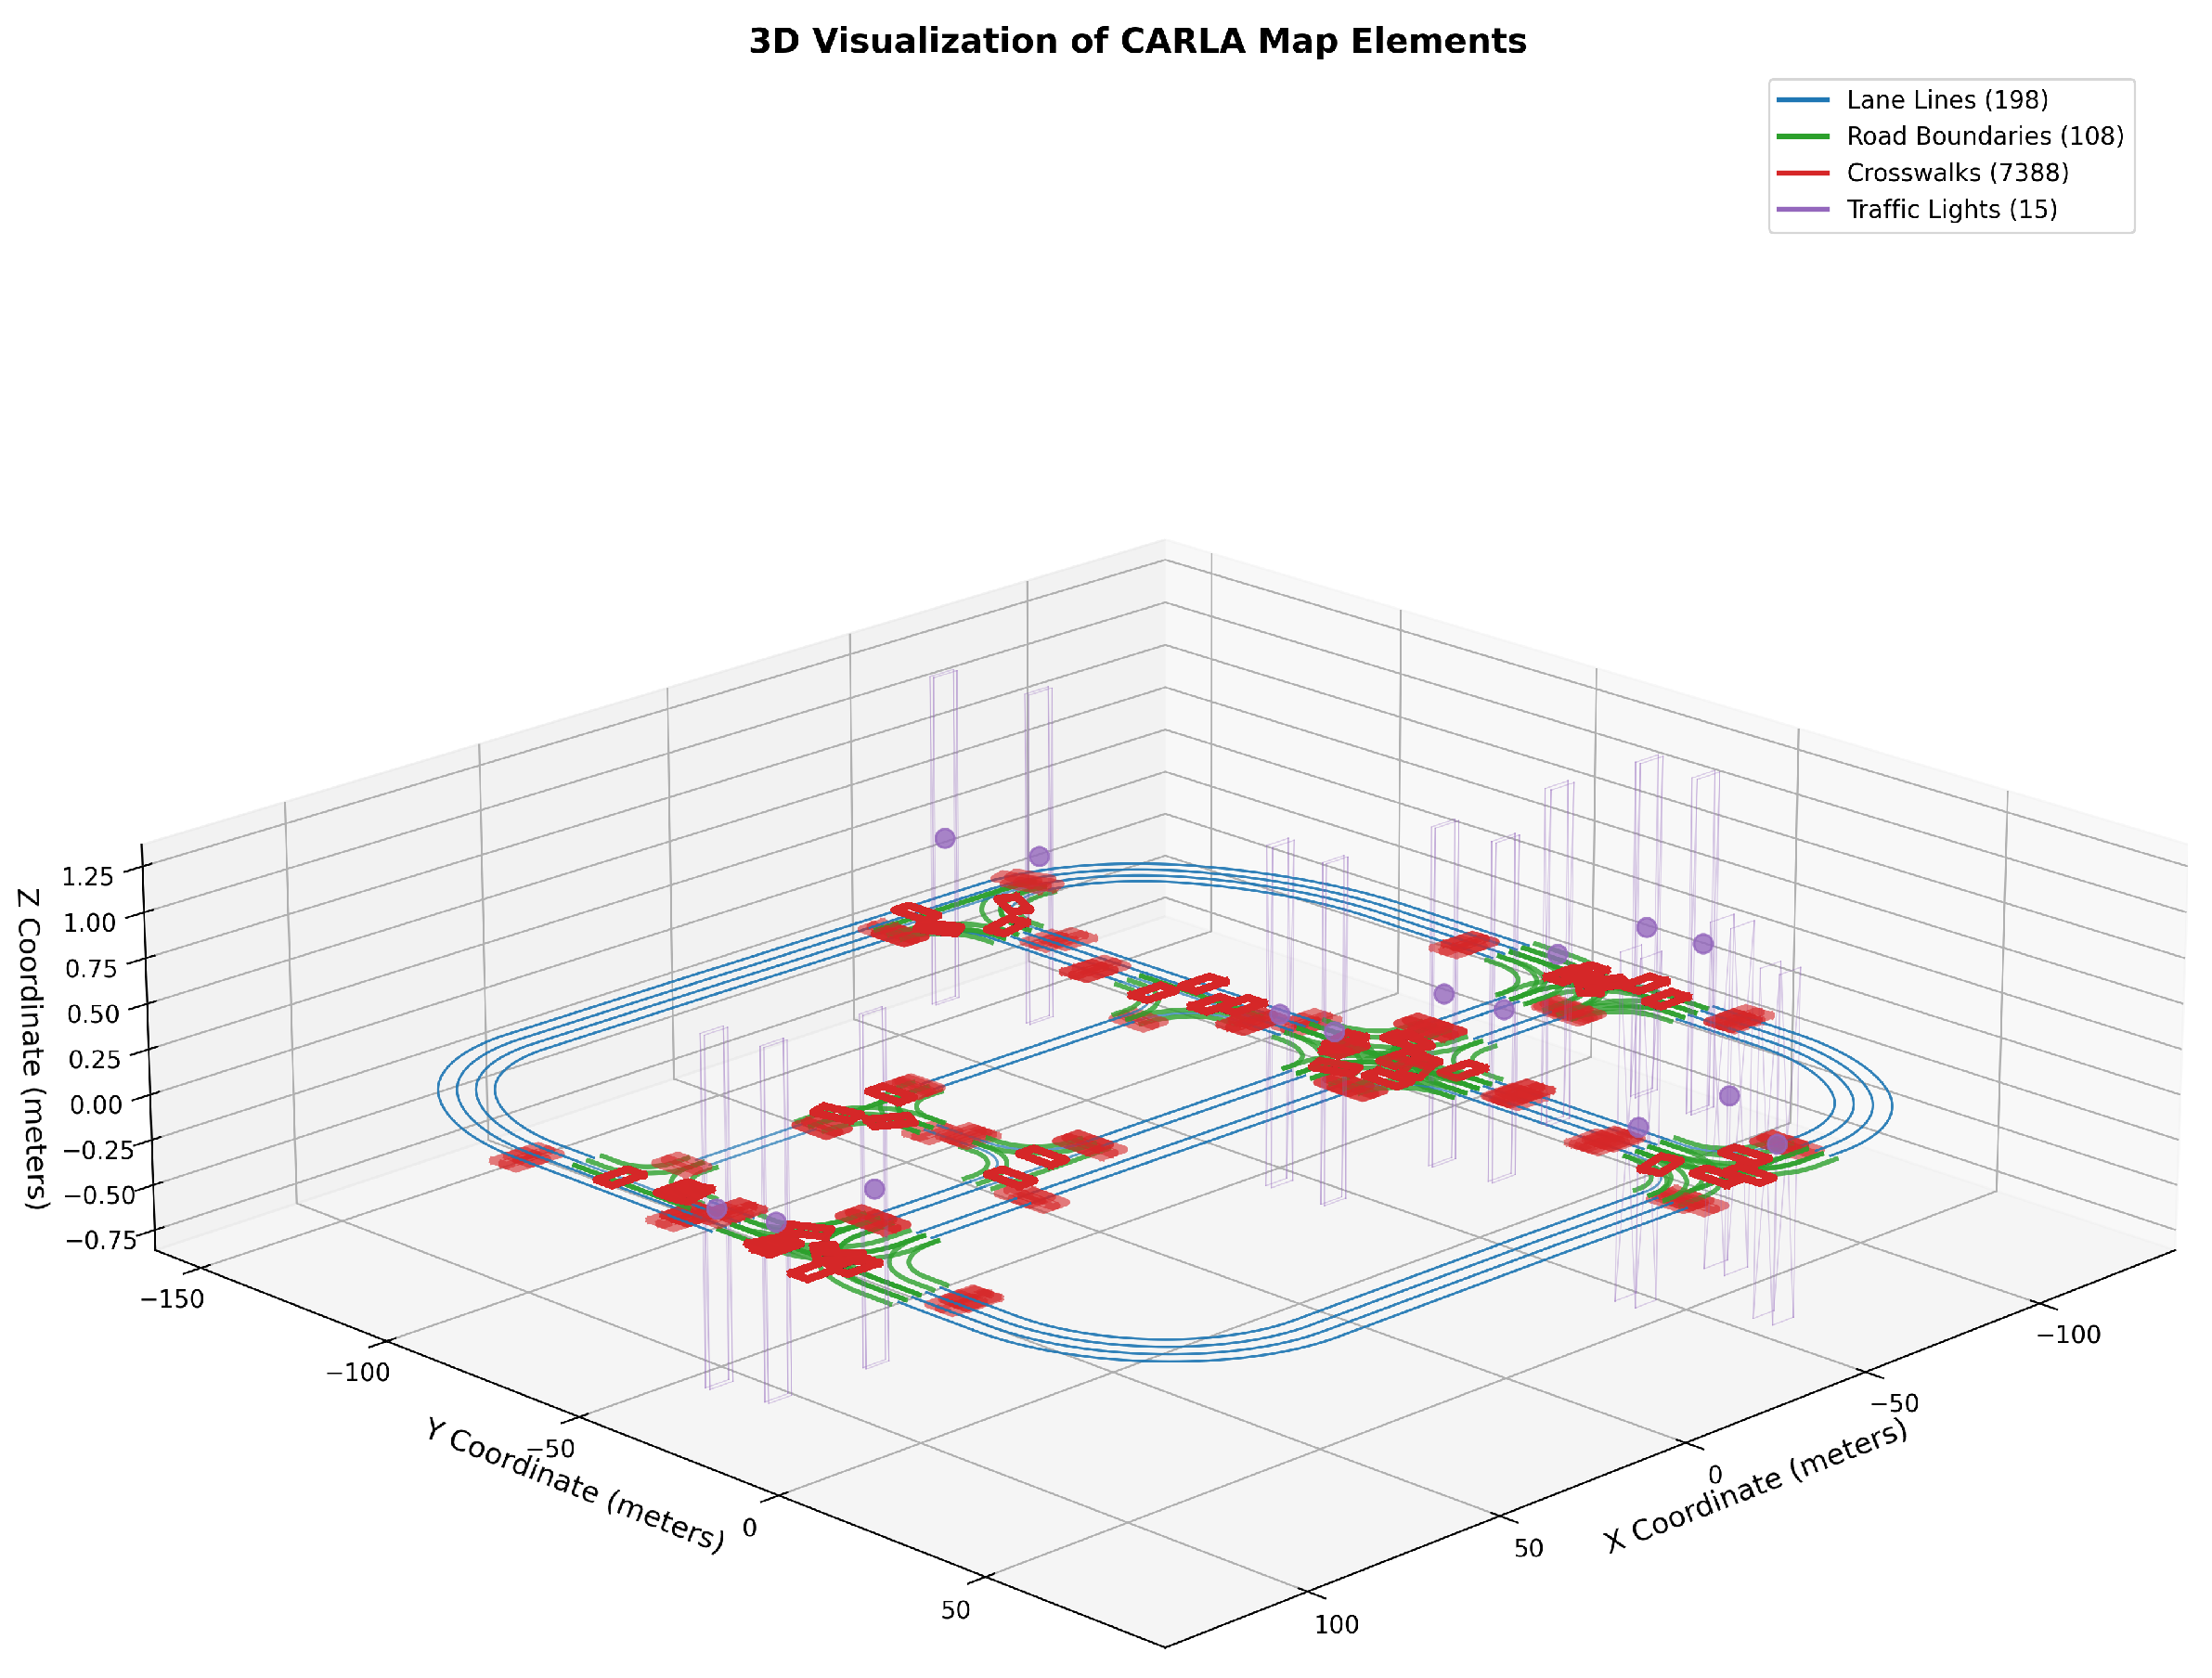
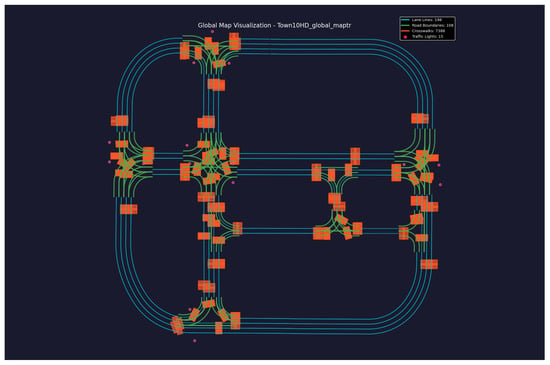
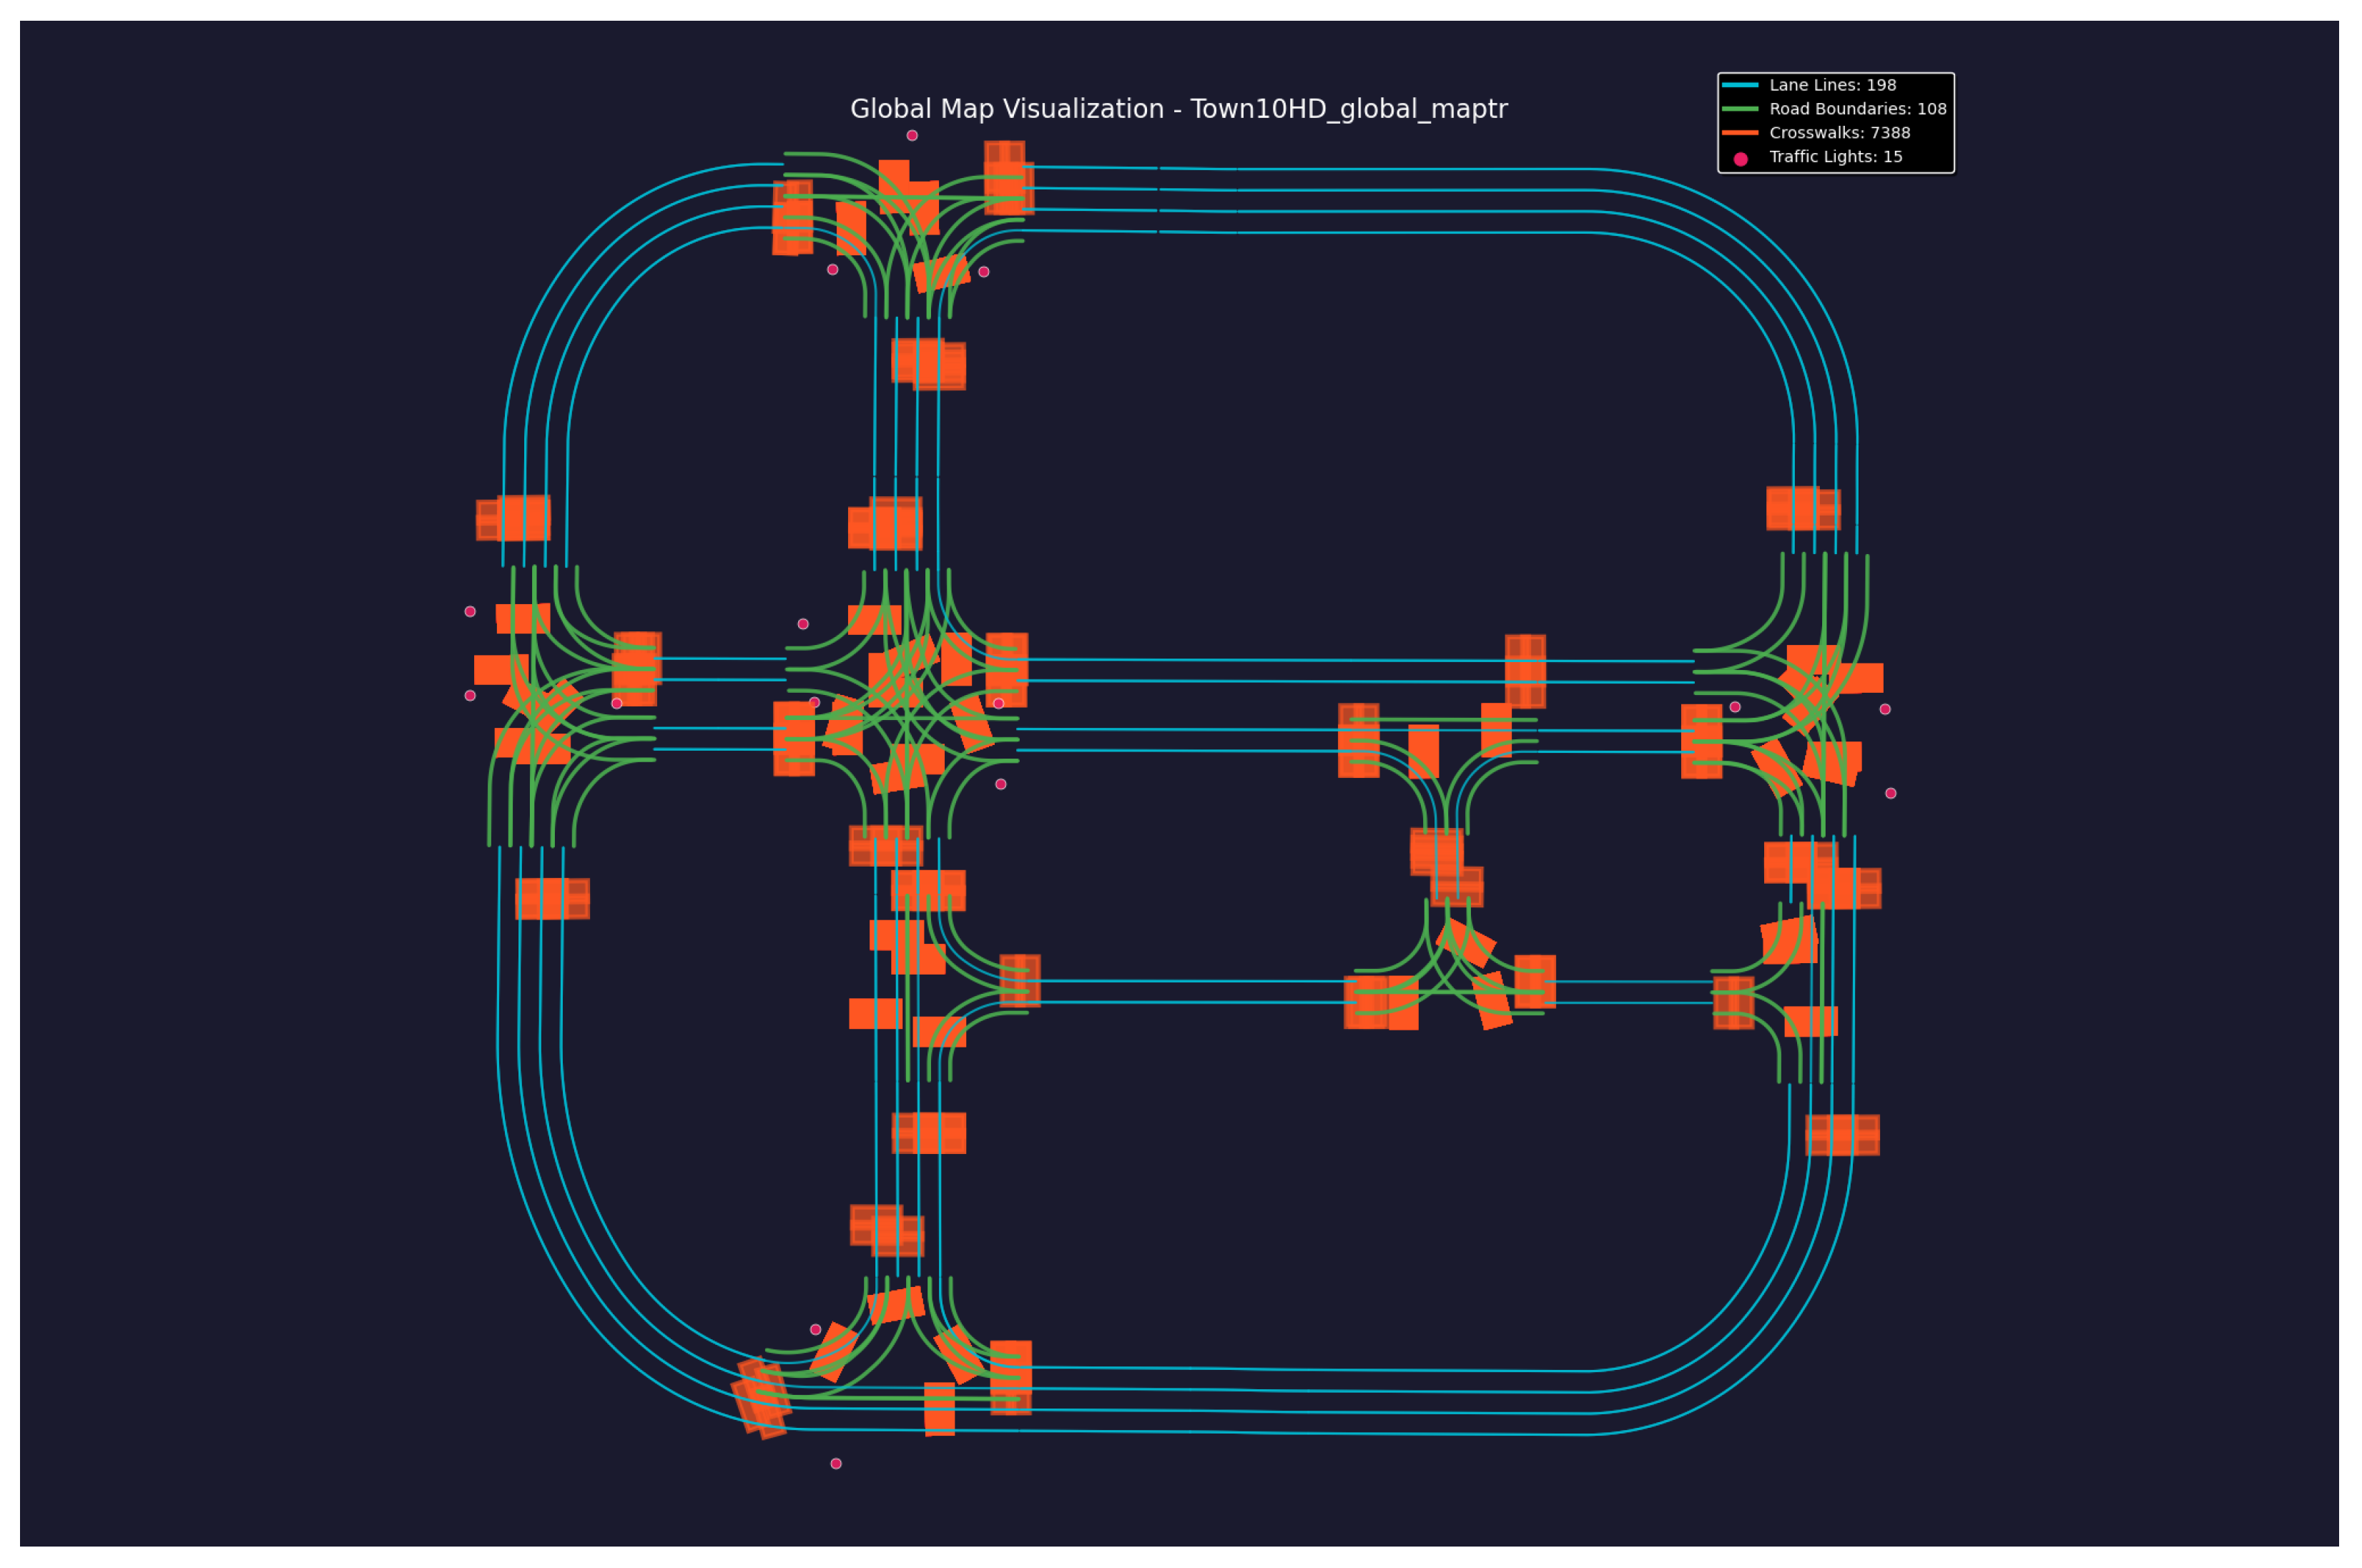
As shown in Figure 2, the extracted CARLA map elements can be visualized in 3D to illustrate the spatial distribution of lane lines, road boundaries, crosswalks, and traffic lights.The model is accessed through an API interface. The visual input consists of the bird’s-eye view map generated from the road topology graph, while the textual input provides a scenario description. The model outputs semantic spatial likelihoods of different traffic participants, which are subsequently converted into probability heatmaps.
Figure 2.
3D visualization of CARLA map elements, illustrating key components of the simulated environment. The elements include lane lines (198), road boundaries (108), crosswalks (7388), and traffic lights (15). The 3D plot demonstrates the spatial distribution and organization of these elements in the simulation, providing a comprehensive view of the road network structure and associated features.
Prompt design plays an important role in guiding the multimodal reasoning process. The prompt template used in this work follows the structure:
“Given the bird’s-eye view map of an urban road network, estimate the spatial probability distribution of traffic participants in the following scenario: <scenario description>. Return the likelihood of vehicles, pedestrians, and bicycles appearing in different regions.”
During inference, the temperature parameter is set to 0.2 to ensure stable predictions. Each inference is repeated three times, and the average probability distribution is used to construct the final semantic heatmap.
The input to the Large Multimodal Model (LMM) consists of two modalities: visual and textual [1,30].
- Visual Input : Derived from G (the road topology graph) to generate a bird’s-eye view map, rendered in layers and normalized to resolution.
- Textual Input T: Descriptive text such as “an urban road scene near a school during dismissal time,” which is parsed into a semantic vector .
The model’s inference function is defined as:
where represents the multimodal inference network.
3.2.3. Heatmap Post-Processing
To ensure smoothness and semantic correctness of the heatmap, the following three optimization steps are applied:
- Gaussian Smoothing: Reduces noise and enhances structural continuity.
- Semantic Masking: Retains probabilities only within traversable areas.
- Boundary Attenuation:
where is the distance to the road center, and is the attenuation coefficient.
After processing, a smooth and logically consistent heatmap is produced for scene layout generation. If overlaps or incorrect placements occur, a post-processing filtering mechanism is applied to remove invalid samples, ensuring high-quality generation at a low cost.
3.3. Procedural Content Generation and Constraint Optimization
Figure 3 presents the global map of the simulation environment (Town10HD), showing the connectivity and organization of the major road network elements. This module uses the semantic heatmap as guidance to generate consistent traffic scenarios through candidate point sampling and constraint optimization.
Figure 3.
Visualization of the global map for the simulation environment (Town10HD). The map illustrates key road network elements, including lane lines (200), road boundaries (100), crosswalks (7388), and traffic lights (15). The layout highlights the connectivity and organization of the road infrastructure, providing a detailed overview of the urban scenario used in the simulation.
3.3.1. Candidate Point Sampling
Although Poisson disk sampling enforces a minimum spatial distance between entities, the sampling probability remains proportional to the heatmap intensity. Regions with higher semantic probability values generate more candidate points before the Poisson filtering stage. As a result, the overall spatial density gradient encoded in the heatmap is preserved while avoiding unrealistic object overlap.
Based on the heatmap, a set of candidate points is generated for each traffic participant category :
where is the category-specific threshold. To prevent object overlap, Poisson Disk Sampling is employed to ensure a minimum spatial distance , resulting in a uniform spatial distribution [37].
3.3.2. Multi-Level Constraint Optimization
Three types of constraints—topological, physical, and semantic—are introduced to jointly optimize the overall layout: [38]
- Topological Constraints: Entities’ paths must follow the road topology E.
- Physical Constraints: Ensures that entity density and safety radius .
- Semantic Constraints: Ensures that .
The final optimization objective function is defined as:
By iteratively minimizing , a scene structure that adheres to traffic rules, physical rationality, and semantic consistency is generated.
3.3.3. Procedural Construction and Simulation Dataset Output
Based on the results of constraint optimization, the procedural pipeline completes the following steps [39]:
- Entity Instantiation and Attribute Assignment: Candidate points are instantiated as corresponding simulation objects with assigned properties such as size, speed, acceleration, and behavior labels.
- Temporal and Behavioral Logic Embedding: State machine control sequences are generated based on traffic signals to ensure consistent dynamic behavior.
- Dataset Export: The output is formatted into standard formats (e.g., OpenSCENARIO or USD) and paired with OpenDRIVE topology, enabling batch generation of diverse scenarios.
3.4. Toolchain Implementation and Data Export
This study develops a fully automated toolchain based on Python 3.10 and Unreal Engine 4 (UE4), enabling efficient simulation scenario generation. The toolchain incorporates the following functional modules:
- Topology Parsing Module: Automatically imports OSM road networks and generates OpenDRIVE files.
- Heatmap Inference Module: Wraps the large model API, supporting multi-scene textual descriptions as input.
- Procedural Generation Module: Generates dynamic entities through iterative constraint optimization.
- Visualization and Validation Module: Supports real-time rendering and metric evaluation within Unreal Engine.
- Data Export Module: Enables batch scenario generation and unified formatted storage.
The proposed toolchain significantly reduces the manual cost of scenario modeling and achieves a self-driven generation workflow, transforming geographic data into simulation-ready scenarios.
4. Experiment
This chapter presents the experimental validation of the proposed simulation scenario generation method. First, the experimental environment and runtime configurations are introduced. Next, the quantitative evaluation metrics for road network extraction and generation quality are provided. The richness and structural rationality of generated multi-scenario layouts are further analyzed. Finally, the applicability of the generated scenarios in autonomous driving simulation is validated through dataset usability and vehicle dynamics testing.
4.1. Experiment Settings
Road topology data used in this study are extracted from OpenStreetMap (OSM), which provides openly available geographic information under the Open Database License (ODbL). Satellite imagery obtained through Google Maps is used only as a visual reference for texture alignment and does not contribute to topology extraction or scenario generation.
The experiments were conducted on a high-performance graphical workstation, with the hardware and software environment configured as follows:
- GPU: NVIDIA GeForce RTX 3090 Ti (24 GB VRAM)
- Operating System: Ubuntu 18.04 LTS
- Simulation Engine: Unreal Engine 4.26
- Simulation Framework: CARLA 0.9.15
- Supporting Tools: RoadRunner (r2020b); OpenStreetMap (OSM, online map data service); Google Maps (online map service)
To ensure statistical reliability, each experiment is repeated five times with different random seeds. The reported results correspond to the mean values across runs. Standard deviations are also computed to evaluate the stability of the proposed generation pipeline.
4.1.1. Primary Software Toolchain
The primary software toolchain used in the experiments is summarized in Table 1.
Table 1.
Primary software toolchain used in the experiments.
4.1.2. Workflow Description
The combination of the above tools enables the system to achieve a complete closed-loop process:
4.2. Road Network Generation and Quality Evaluation
To quantitatively evaluate the quality and geometric rationality of the scenarios generated by SceneGen-LLM, five categories of metrics are used for experimental comparisons:
- FID (Fréchet Inception Distance): Measures the difference between the distributions of generated images and real images in a high-dimensional feature space. FID calculates the Fréchet distance based on feature statistics (mean and covariance) extracted from a pre-trained Inception network. A smaller FID value indicates that the generated samples are closer to real samples in perceptual consistency.
- KID (Kernel Inception Distance): Similar to FID but based on the Maximum Mean Discrepancy (MMD) with polynomial kernel functions, making it more suitable for small-sample estimation. A smaller KID value indicates higher visual distribution similarity.
- DIV (Diversity Score): Evaluates the diversity of generated scenes in terms of semantic and spatial structure by computing the average distance or feature entropy among generated samples. A larger DIV value indicates greater variation and richness in the results.
- Bden (Building Density, Wasserstein Distance): Describes the difference in building density distribution between generated and real scenes, measured using the Wasserstein distance. A smaller value indicates better alignment with real-world urban distributions.
- Bhgt (Building Height, Wasserstein Distance): Measures the difference in building height distribution between generated and real 3D models, also using the Wasserstein (Earth Mover’s) Distance. A smaller value indicates higher consistency in spatial scale (3D structural realism).
- Validity (Scene Validity Ratio): Represents the proportion of “valid scenes” in the generated samples, defined as scenarios without collisions, overlaps, and violations of physical or topological constraints. A lower value indicates fewer errors and higher generation stability.
Although FID and KID were originally proposed for evaluating image generation models, they can also measure the structural similarity between generated layouts and real-world map distributions when the layouts are rasterized into images. In this work, these metrics quantify the similarity between generated road scene layouts and reference spatial distributions.
To complement these image-based metrics, we also introduce domain-specific evaluation indicators including scene validity ratio, object diversity, and spatial distribution alignment. These metrics evaluate whether generated scenarios satisfy traffic rules and maintain realistic spatial structures.
4.2.1. Comparison of Results
Table 2 summarizes the performance of SceneGen-LLM against various baseline methods across multiple evaluation metrics. In the table, “↓” indicates that smaller values are better, “↑” indicates that larger values are better, and “*” denotes calculations based on 3D models.
Table 2.
Quantitative results and comparisons with existing methods. ‘*’ indicates metrics calculated based on 3D models. In Table 2, the symbol “–” indicates that the corresponding metric is not applicable to that baseline method. Some baseline methods generate only 2D layouts or do not include 3D structural information, making certain metrics such as building height distribution unavailable. The downward arrow indicates that a lower value is better, while the upward arrow indicates that a higher value is better.
4.2.2. Baseline Comparison with Scenario Generation Methods
To further validate the effectiveness of the proposed SceneGen-LLM framework, we compare it with several baseline scenario generation strategies commonly used in simulation in Table 3. These baselines are designed to represent different levels of prior knowledge and automation. The results demonstrate that the proposed SceneGen-LLM framework significantly outperforms traditional rule-based and random placement strategies across all evaluation metrics. In particular, the FID and KID scores show that the generated spatial layouts are closer to real-world distributions. The improvement in scene validity also indicates that the semantic heatmap guidance effectively reduces unrealistic placements and collision events.
Table 3.
Quantitative comparison including autonomous-driving-oriented baselines (mean ± std over 5 seeds). The downward arrow indicates that a lower value is better, while the upward arrow indicates that a higher value is better.
Compared with the heuristic heatmap baseline, the LMM-generated semantic heatmaps provide richer contextual reasoning and better capture spatial patterns of traffic participants. This confirms that multimodal semantic inference can provide more accurate spatial priors than manually designed distributions.
4.3. Ablation Study
To analyze the contribution of each component in the semantic heatmap generation pipeline, we conduct an ablation study by progressively removing individual modules in Table 4. The evaluated components include Gaussian smoothing, semantic masking, boundary attenuation, and Poisson disk sampling.
Table 4.
Ablation study on semantic heatmap components. The downward arrow indicates that a lower value is better, while the upward arrow indicates that a higher value is better.
All variants are tested using the same experimental settings and road networks. Each configuration generates 100 scenes per random seed across five seeds. We evaluate scene quality using FID, KID, spatial alignment score, and collision rate.
The ablation results indicate that each component contributes to the stability and realism of the generated scenarios. Removing semantic masking leads to the largest performance degradation because traffic participants may be sampled in invalid regions such as buildings or sidewalks.
The Poisson disk sampling module plays a crucial role in preventing object overlap. Although removing this constraint slightly improves alignment with the heatmap, it significantly increases collision rates. Overall, the full model achieves the best balance between spatial realism and physical feasibility.
4.4. Sensitivity to LMM Inference Settings
The performance of the semantic heatmap generation module may be affected by the inference configuration of the large multimodal model. In this experiment, we evaluate the influence of temperature and sampling strategies on scenario generation quality in Table 5.
Table 5.
Sensitivity analysis for LMM inference parameters. The downward arrow indicates that a lower value is better, while the upward arrow indicates that a higher value is better.
We test several configurations including deterministic inference, high-temperature sampling, and multi-sample averaging. The same road network inputs and scene constraints are used across all settings.
The results show that the default inference configuration achieves a good balance between stability and diversity. Higher temperature values introduce additional randomness in the semantic heatmap predictions, which slightly reduces scene realism.
Increasing the number of averaged samples improves robustness and slightly reduces the FID score, indicating that ensemble-style inference can help stabilize multimodal reasoning outputs.
- Random-valid placement: traffic participants are randomly sampled within valid drivable regions and filtered using collision and rule constraints.
- Rule-based placement: entities are placed according to predefined rules based on lane centers, crosswalk locations, and traffic heuristics.
- Heuristic heatmap: spatial probability distributions are manually constructed using Gaussian kernels centered around semantic regions (e.g., intersections, crosswalks).
For fair comparison, all methods share the same road topology inputs and constraint optimization module. Each method generates 100 scenes under five random seeds, and the reported results correspond to the mean and standard deviation across runs.
4.5. Scene Diversity Analysis
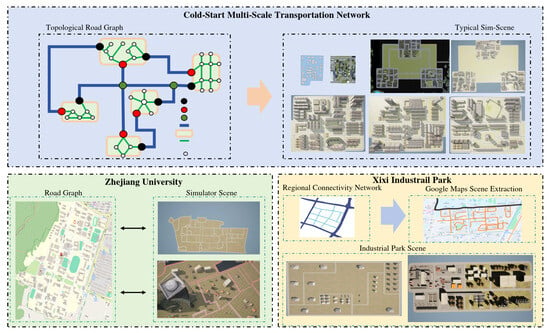
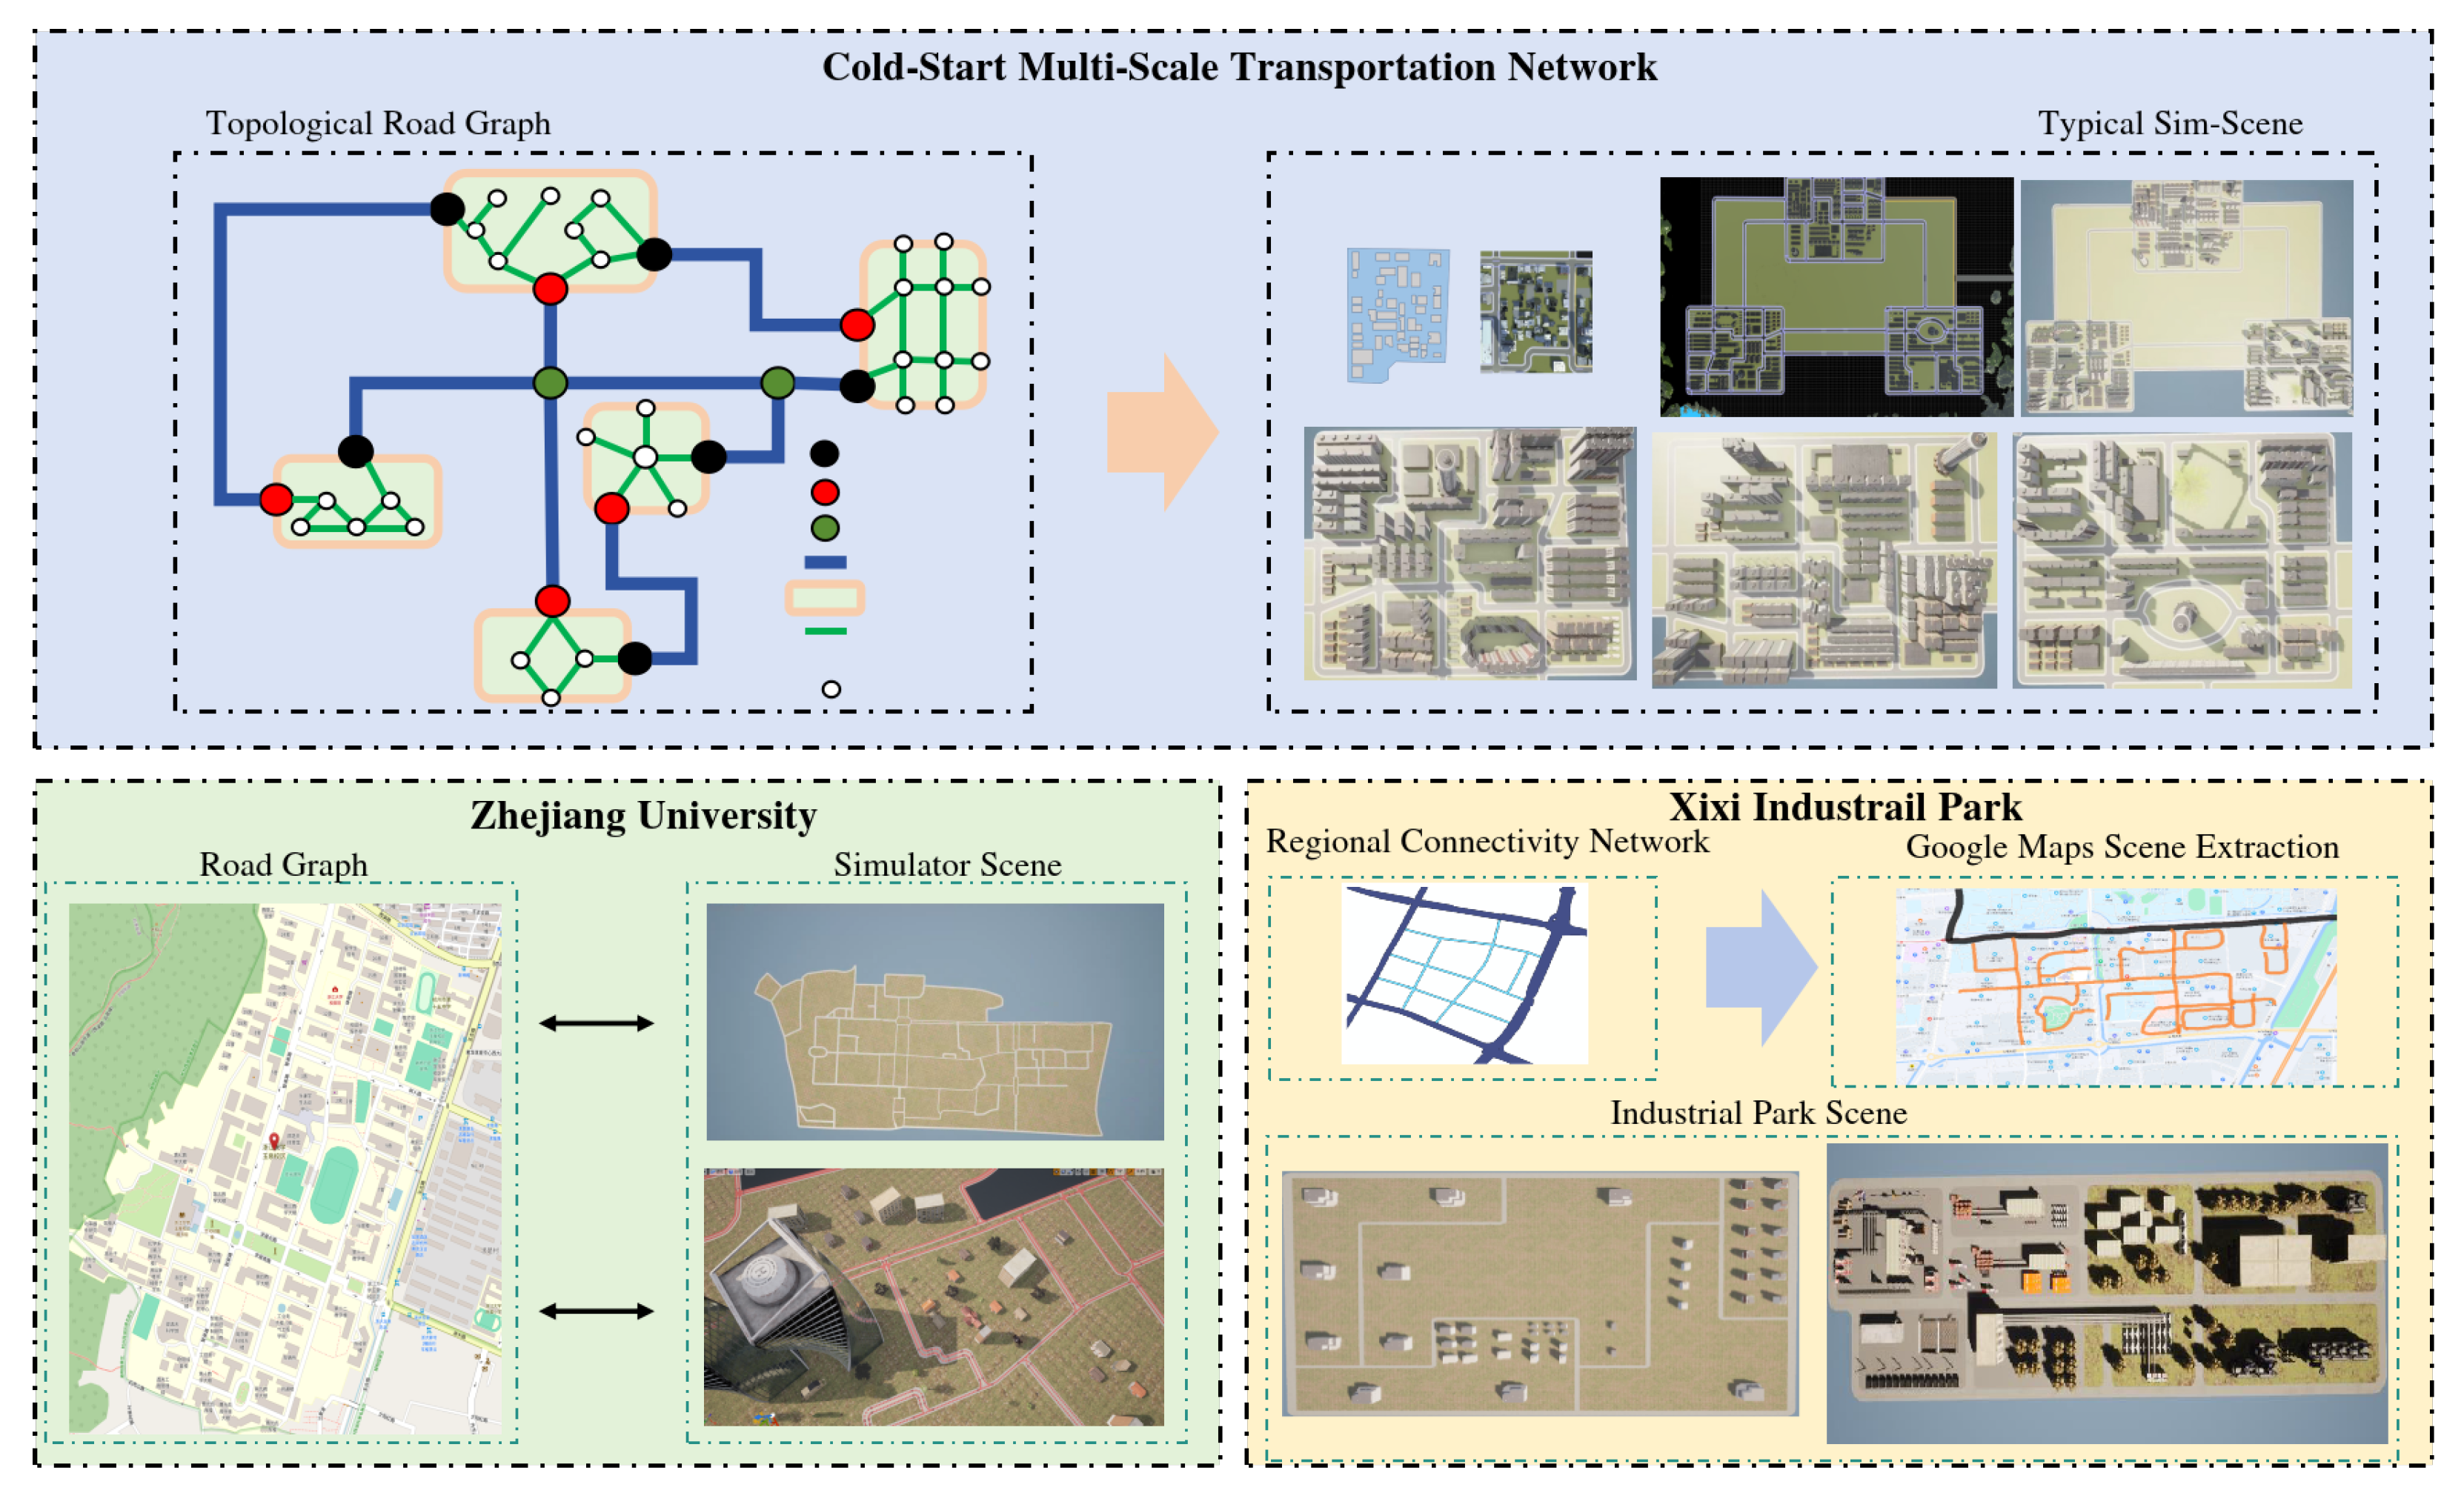
To comprehensively validate the generation capabilities of the proposed method across different geographic regions and scenario types, three representative experimental scenarios were constructed (Figure 4):
Figure 4.
Multi-scale transportation network and scenario generation process. The top section illustrates the cold-start multi-scale transportation network, including a topological road graph and its conversion into typical simulation scenes. The bottom section showcases two case studies: Zhejiang University and Xixi Industrial Park. The Zhejiang University example demonstrates the transformation of the road graph into detailed simulator scenes, while the Xixi Industrial Park example highlights the extraction of regional connectivity networks and Google Maps data to create industrial park simulation scenes. Colored dots denote different network elements and their spatial roles in the generation process.
- ZJU—Yuquan Campus Urban Road Scenario: Focused on the main roads of a campus area, featuring medium traffic flow and rich semantic categories.
- Hangzhou Xixi Wetland Park Scenario: A complex natural environment including lakes, vegetation, and pedestrian pathways.
- Multi-Scale Autonomous Driving Test Scenario: An abstract road network template generated by the proposed method, extended with diverse road configurations.
For these scenarios, the following evaluation metrics were defined:
- Total Road Count: Represents the scale of the scenario.
- Road Density: The ratio of road count to area size, reflecting topological complexity.
- Scene Object Diversity: Counts the number of semantic entities such as vehicles, pedestrians, traffic facilities, and buildings.
- Spatial Distribution Rationality: Evaluates the alignment of entity layouts with semantic heatmaps and traffic rules.
- Rendering Texture Richness: Measured by pixel distribution entropy and texture diversity to assess visual detail.
- Generation Efficiency (roads/min): The number of valid roads generated per unit of time.
- Maximum Traffic Throughput: The maximum number of vehicles that can run simultaneously in the simulation.
Analysis Results
The analysis results indicate that SceneGen-LLM can automatically generate structurally complete, object-rich, and visually high-quality simulation scenarios across different region types. In particular, the multi-scale scenarios achieve a Compared with a rule-based scenario construction pipeline, the proposed SceneGen-LLM method improves the maximum traffic throughput by approximately 35%. This improvement is mainly attributed to the more realistic spatial distribution of traffic participants generated by the semantic heatmap guidance. while maintaining high generation efficiency.
4.6. Evaluation of Typical Scenarios
We constructed three representative scenarios using the road networks from ZJU Yuquan Campus, Hangzhou Xixi Wetland Park, and a custom multi-scale autonomous driving road network. These scenarios are described as follows. For the quantitative evaluation, the following metrics were used:
- Total Road Count: Represents the overall scale of the road network.
- Road Network Density: Measured as the ratio of road length to area size (), reflecting the topological complexity.
- Object Diversity: An index (0–1) that evaluates the richness of objects (e.g., vehicles, pedestrians, traffic facilities) in the scene.
- Spatial Distribution Score: Measures the alignment of object placement with semantic heatmaps and traffic rules (higher values indicate better alignment).
- Texture Richness: An index (0–1) that evaluates the variety and detail of rendered textures in the scene.
- Generation Speed: The number of roads generated per minute.
- Maximum Traffic Throughput: The maximum number of vehicles that can run simultaneously in the traffic network.
Quantitative Evaluation Results
Table 6 summarizes the quantitative evaluation results for the three scenarios.
Table 6.
Quantitative Evaluation of Typical Scenarios. The upward arrow indicates that a higher value is better.
5. Conclusions
This paper presents SceneGen-LLM, a multimodal scenario generation framework that integrates large multimodal model reasoning with procedural content generation.
The key contribution lies in introducing semantic heatmaps as an intermediate representation, enabling the transformation of high-level semantic understanding into spatially consistent scenario layouts. This approach effectively bridges the gap between semantic reasoning and simulation-level deployment.
Experimental results demonstrate that the proposed method significantly improves spatial realism, diversity, and validity compared to rule-based and heuristic baselines.
However, the current framework relies on pre-trained multimodal models without task-specific adaptation, which may limit performance in complex or rare scenarios. Future work will focus on improving multimodal reasoning accuracy, incorporating dynamic behavior modeling, and extending the framework to interactive and closed-loop simulation environments.
Author Contributions
Conceptualization, S.L.; methodology, R.L., S.L. and Z.P.; software, H.Z., J.W., H.L. and P.L.; validation, K.X., H.L. and P.L.; resources, J.W.; writing—original draft preparation, Z.Y.; writing—review and editing, K.W. and W.G.; visualization, R.L.; supervision, Z.P.; funding acquisition, S.L. and Z.P. All authors have read and agreed to the published version of the manuscript.
Funding
This research was funded by the Natural Science Foundation of Zhejiang Province, grant number LD24F030002; the “Pioneer” and “Leading Goose” + X R&D Program of Zhejiang, grant number 2025C02246(SD2); and the “Pioneer” and “Leading Goose” R&D Program of Zhejiang, grant number 2024C01016.
Institutional Review Board Statement
Not applicable.
Informed Consent Statement
Not applicable.
Data Availability Statement
The original contributions presented in this study are included in the article. Further inquiries can be directed to the corresponding author.
Conflicts of Interest
Author Jian Wang was employed by the company Zhejiang Yangtze River Delta Internet of Vehicles Security Technology Co., Ltd. The remaining authors declare that the research was conducted in the absence of any commercial or financial relationships that could be construed as a potential conflict of interest.
References
- Xu, Z.; Zhang, Y.; Xie, E.; Zhao, Z.; Guo, Y.; Wong, K.Y.K.; Li, Z.; Zhao, H. Drivegpt4: Interpretable end-to-end autonomous driving via large language model. IEEE Robot. Autom. Lett. 2024, 9, 8186–8193. [Google Scholar]
- Gao, J.; Sun, C.; Zhao, H.; Shen, Y.; Anguelov, D.; Li, C.; Schmid, C. Vectornet: Encoding hd maps and agent dynamics from vectorized representation. In Proceedings of the IEEE/CVF Conference on Computer Vision and Pattern Recognition, Seattle, WA, USA, 14–19 June 2020; pp. 11525–11533. [Google Scholar]
- Hu, Y.; Yang, J.; Chen, L.; Li, K.; Sima, C.; Zhu, X.; Chai, S.; Du, S.; Lin, T.; Wang, W.; et al. Planning-oriented autonomous driving. In Proceedings of the IEEE/CVF Conference on Computer Vision and Pattern Recognition, Vancouver, BC, Canada, 17–24 June 2023; pp. 17853–17862. [Google Scholar]
- Liao, Z.; Wei, P.; Zhang, R.; Chen, S.; Wang, H.; Ren, Z. I2-world: Intra-inter tokenization for efficient dynamic 4d scene forecasting. In Proceedings of the IEEE/CVF International Conference on Computer Vision, Honolulu, HI, USA, 19–25 October 2025; pp. 25810–25819. [Google Scholar]
- Li, J.; Li, J.; Yang, G.; Yang, L.; Chi, H.; Yang, L. Applications of large language models and multimodal large models in autonomous driving: A comprehensive review. Drones 2025, 9, 238. [Google Scholar] [CrossRef] [Scilit]
- Li, Q.; Wang, Y.; Wang, Y.; Zhao, H. Hdmapnet: An online HD map construction and evaluation framework. In Proceedings of the 2022 International Conference on Robotics and Automation (ICRA); IEEE: New York, NY, USA, 2022; pp. 4628–4634. [Google Scholar]
- Zhang, D.; Chen, D.; Zhi, P.; Chen, Y.; Yuan, Z.; Li, C.; Zhou, R.; Zhou, Q. Mapexpert: Online hd map construction with simple and efficient sparse map element expert. In Proceedings of the AAAI Conference on Artificial Intelligence, Philadelphia, PA, USA, 27 April–1 May 2025; Volume 39, pp. 14745–14753. [Google Scholar]
- Zeng, S.; Chang, X.; Liu, X.; Pan, Z.; Wei, X. Driving with prior maps: Unified vector prior encoding for autonomous vehicle mapping. arXiv 2024, arXiv:2409.05352. [Google Scholar] [CrossRef] [Scilit]
- Liao, B.; Chen, S.; Wang, X.; Cheng, T.; Zhang, Q.; Liu, W.; Huang, C. Maptr: Structured modeling and learning for online vectorized hd map construction. arXiv 2022, arXiv:2208.14437. [Google Scholar]
- Li, J.; Jia, P.; Chen, J.; Liu, J.; He, L.; Li, K. Local Map Construction with SDMap: A Comprehensive Survey. arXiv 2024, arXiv:2409.02415. [Google Scholar]
- Yang, Z.; He, J.; Fan, J.; Cinzia, C. TransportAgents: A multi-agents LLM framework for traffic accident severity prediction. arXiv 2026, arXiv:2601.15519. [Google Scholar]
- Shao, H.; Hu, Y.; Wang, L.; Song, G.; Waslander, S.L.; Liu, Y.; Li, H. Lmdrive: Closed-loop end-to-end driving with large language models. In Proceedings of the IEEE/CVF Conference on Computer Vision and Pattern Recognition, Seattle, WA, USA, 16–22 June 2024; pp. 15120–15130. [Google Scholar]
- Tian, X.; Gu, J.; Li, B.; Liu, Y.; Wang, Y.; Zhao, Z.; Zhan, K.; Jia, P.; Lang, X.; Zhao, H. Drivevlm: The convergence of autonomous driving and large vision-language models. arXiv 2024, arXiv:2402.12289. [Google Scholar]
- Zhang, X.; Liu, G.; Liu, Z.; Xu, N.; Liu, Y.; Zhao, J. Enhancing vectorized map perception with historical rasterized maps. In Proceedings of the European Conference on Computer Vision; Springer: Berlin/Heidelberg, Germany, 2024; pp. 422–439. [Google Scholar]
- Wang, S.; Jia, F.; Mao, W.; Liu, Y.; Zhao, Y.; Chen, Z.; Wang, T.; Zhang, C.; Zhang, X.; Zhao, F. Stream query denoising for vectorized hd-map construction. In Proceedings of the European Conference on Computer Vision; Springer: Berlin/Heidelberg, Germany, 2024; pp. 203–220. [Google Scholar]
- Da, F.; Zhang, Y. Path-aware graph attention for HD maps in motion prediction. In Proceedings of the 2022 International Conference on Robotics and Automation (ICRA); IEEE: New York, NY, USA, 2022; pp. 6430–6436. [Google Scholar]
- Cai, Y.; Zhang, W.; Wu, Y.; Jin, C. Fusionformer: A concise unified feature fusion transformer for 3D pose estimation. In Proceedings of the AAAI Conference on Artificial Intelligence, Vancouver, BC, Canada, 20–27 February 2024; Volume 38, pp. 900–908. [Google Scholar]
- Huang, Y.; Zheng, W.; Zhang, Y.; Zhou, J.; Lu, J. Tri-perspective view for vision-based 3D semantic occupancy prediction. In Proceedings of the IEEE/CVF Conference on Computer Vsion and Pattern Recognition, Vancouver, BC, Canada, 17–24 June 2023; pp. 9223–9232. [Google Scholar]
- Cao, L.; Feng, X.; Liu, J.; Zhou, G. Automatic Generation System for Autonomous Driving Simulation Scenarios Based on PreScan. Appl. Sci. 2024, 14, 1354. [Google Scholar] [CrossRef] [Scilit]
- Yang, J.; Chitta, K.; Gao, S.; Chen, L.; Shao, Y.; Jia, X.; Li, H.; Geiger, A.; Yue, X.; Chen, L. ReSim: Reliable World Simulation for Autonomous Driving. arXiv 2025, arXiv:2506.09981. [Google Scholar] [CrossRef] [Scilit]
- Dosovitskiy, A.; Ros, G.; Codevilla, F.; Lopez, A.; Koltun, V. CARLA: An open urban driving simulator. In Proceedings of the Conference on Robot Learning; PMLR: Cambridge, MA, USA, 2017; pp. 1–16. [Google Scholar]
- Vanegas, C.A.; Kelly, T.; Weber, B.; Halatsch, J.; Aliaga, D.G.; Müller, P. Procedural generation of parcels in urban modeling. In Proceedings of the Computer Graphics Forum; Wiley Online Library: Hoboken, NJ, USA, 2012; Volume 31, pp. 681–690. [Google Scholar]
- Chu, C.; Zhmoginov, A.; Sandler, M. Cyclegan, a master of steganography. arXiv 2017, arXiv:1712.02950. [Google Scholar] [CrossRef] [Scilit]
- Melnik, A.; Miasayedzenkau, M.; Makaravets, D.; Pirshtuk, D.; Akbulut, E.; Holzmann, D.; Renusch, T.; Reichert, G.; Ritter, H. Face generation and editing with stylegan: A survey. IEEE Trans. Pattern Anal. Mach. Intell. 2024, 46, 3557–3576. [Google Scholar] [CrossRef] [Scilit]
- Zhou, J.; Wang, L.; Meng, Q.; Wang, X. DiffRoad: Realistic and Diverse Road Scenario Generation for Autonomous Vehicle Testing. arXiv 2024, arXiv:2411.09451. [Google Scholar] [CrossRef] [Scilit]
- Lin, L.; Chen, Y.; Chen, G.; Zeng, X. ESGAN: Edge loss and spatial convolution generative adversarial network for image inpainting. In Proceedings of the 2020 IEEE 15th International Conference on Solid-State & Integrated Circuit Technology (ICSICT); IEEE: New York, NY, USA, 2020; pp. 1–4. [Google Scholar]
- Jiang, F.; Ma, J.; Webster, C.J.; Wang, W.; Cheng, J.C. Automated site planning using CAIN-GAN model. Autom. Constr. 2024, 159, 105286. [Google Scholar] [CrossRef] [Scilit]
- Xu, L.; Xiangli, Y.; Rao, A.; Zhao, N.; Dai, B.; Liu, Z.; Lin, D. Blockplanner: City block generation with vectorized graph representation. In Proceedings of the IEEE/CVF International Conference on Computer Vision, Online, 11–17 October 2021; pp. 5077–5086. [Google Scholar]
- Zheng, L.; Lu, W. Urban micro-scale street thermal comfort prediction using a ‘graph attention network’model. Build. Environ. 2024, 262, 111780. [Google Scholar]
- Shi, Q.; Meng, Q.; Cheng, H.; Xu, Q.; Wang, J. LinguaSim: Interactive Multi-Vehicle Testing Scenario Generation via Natural Language Instruction Based on Large Language Models. arXiv 2025, arXiv:2510.08046. [Google Scholar]
- Zhao, Y.; Zhou, J.; Bi, D.; Mihalj, T.; Hu, J.; Eichberger, A. A survey on the application of large language models in scenario-based testing of automated driving systems. arXiv 2025, arXiv:2505.16587. [Google Scholar] [CrossRef] [Scilit]
- Feng, Y.; Ye, Q.; Angeloudis, P. Rapid Procedural Generation of Real World Environments for Autonomous Vehicle Testing. In Proceedings of the ICRA 2023 Workshop on Bridging the Lab-to-Real Gap: Conversations with Academia, Industry, and Government, London, UK, 2 June 2023; Volume 29. [Google Scholar]
- Zhang, Z.; Zhang, Y.; Ding, X.; Jin, F.; Yue, X. Online vectorized hd map construction using geometry. In Proceedings of the European Conference on Computer Vision; Springer: Berlin/Heidelberg, Germany, 2024; pp. 73–90. [Google Scholar]
- Shin, J.; Jeong, H.; Rameau, F.; Kum, D. Instagram: Instance-level graph modeling for vectorized hd map learning. IEEE Trans. Intell. Transp. Syst. 2025, 26, 1889–1899. [Google Scholar]
- Zheng, W.; Chen, W.; Huang, Y.; Zhang, B.; Duan, Y.; Lu, J. Occworld: Learning a 3D occupancy world model for autonomous driving. In Proceedings of the European Conference on Computer Vision; Springer: Berlin/Heidelberg, Germany, 2024; pp. 55–72. [Google Scholar]
- Muktadir, G.M.; Jawad, A.; Paranjape, I.; Whitehead, J.; Shepelev, A. Procedural generation of high-definition road networks for autonomous vehicle testing and traffic simulations. SAE Int. J. Connect. Autom. Veh. 2022, 6, 99–120. [Google Scholar] [CrossRef] [Scilit]
- Li, Q.; Peng, Z.; Zhang, Q.; Liu, C.; Zhou, B. Pgdrive: Procedural generation of driving environments for generalization. arXiv 2020, arXiv:2012.13681. [Google Scholar]
- Liu, J.; Guo, Y.; Zhong, F.; Zhang, T.; Jing, Z.; Liang, S.; Wang, J.; Zhang, M.; Liu, A.; Liu, X. Adversarial generation and collaborative evolution of safety-critical scenarios for autonomous vehicles. arXiv 2025, arXiv:2508.14527. [Google Scholar] [CrossRef] [Scilit]
- Yang, Y.; Shao, J.; Li, X.; Shen, Y.; Geiger, A.; Liao, Y. Prometheus: 3D-aware latent diffusion models for feed-forward text-to-3D scene generation. In Proceedings of the Computer Vision and Pattern Recognition Conference, Nashville, TN, USA, 11–15 June 2025; pp. 2857–2869. [Google Scholar]
- Jyothi, A.A.; Durand, T.; He, J.; Sigal, L.; Mori, G. Layoutvae: Stochastic scene layout generation from a label set. In Proceedings of the IEEE/CVF International Conference on Computer Vision, Seoul, Republic of Korea, 27 October–2 November 2019; pp. 9895–9904. [Google Scholar]
- Henry, J.; Natalie, T.; Madsen, D. Pix2pix GAN for image-to-image translation. Res. Gate Publ. 2021, 1–5. [Google Scholar] [CrossRef]
- Lin, C.H.; Lee, H.Y.; Menapace, W.; Chai, M.; Siarohin, A.; Yang, M.H.; Tulyakov, S. Infinicity: Infinite-scale city synthesis. In Proceedings of the IEEE/CVF International Conference on Computer Vision, Paris, France, 2–6 October 2023; pp. 22808–22818. [Google Scholar]

Disclaimer/Publisher’s Note: The statements, opinions and data contained in all publications are solely those of the individual author(s) and contributor(s) and not of MDPI and/or the editor(s). MDPI and/or the editor(s) disclaim responsibility for any injury to people or property resulting from any ideas, methods, instructions or products referred to in the content. |
© 2026 by the authors. Licensee MDPI, Basel, Switzerland. This article is an open access article distributed under the terms and conditions of the Creative Commons Attribution (CC BY) license.