5.2. Object Detection and Tracking Results
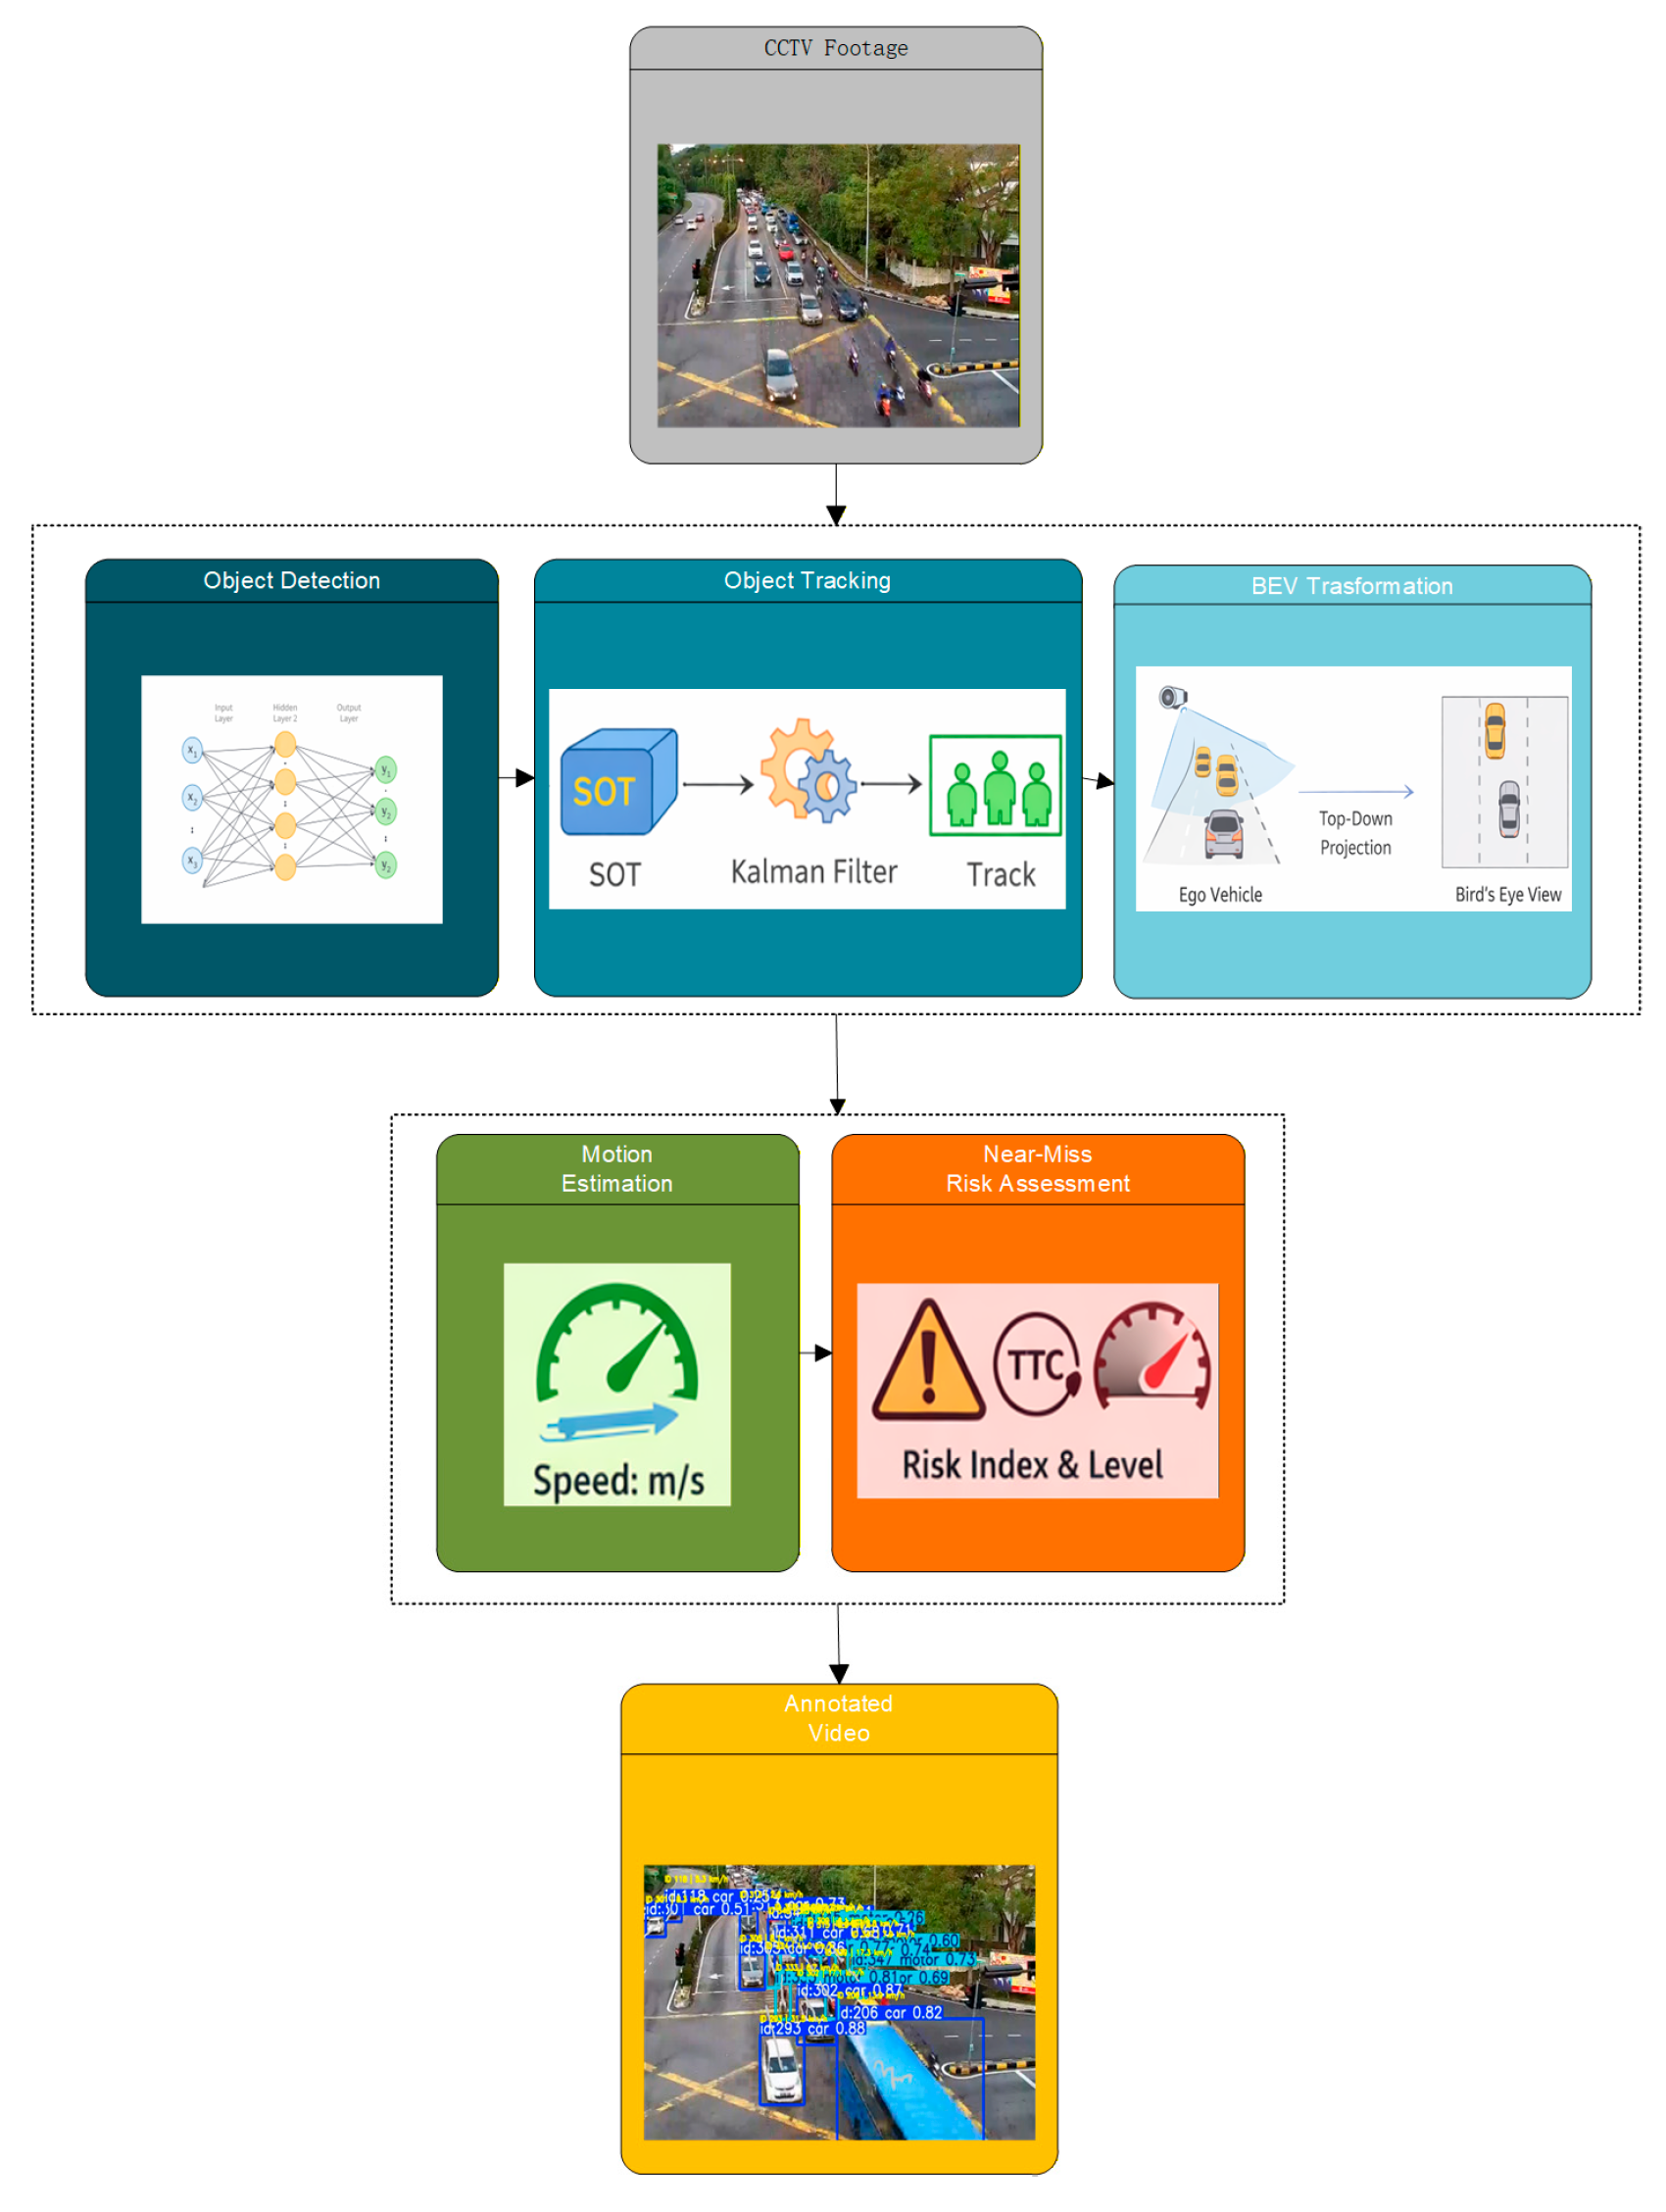
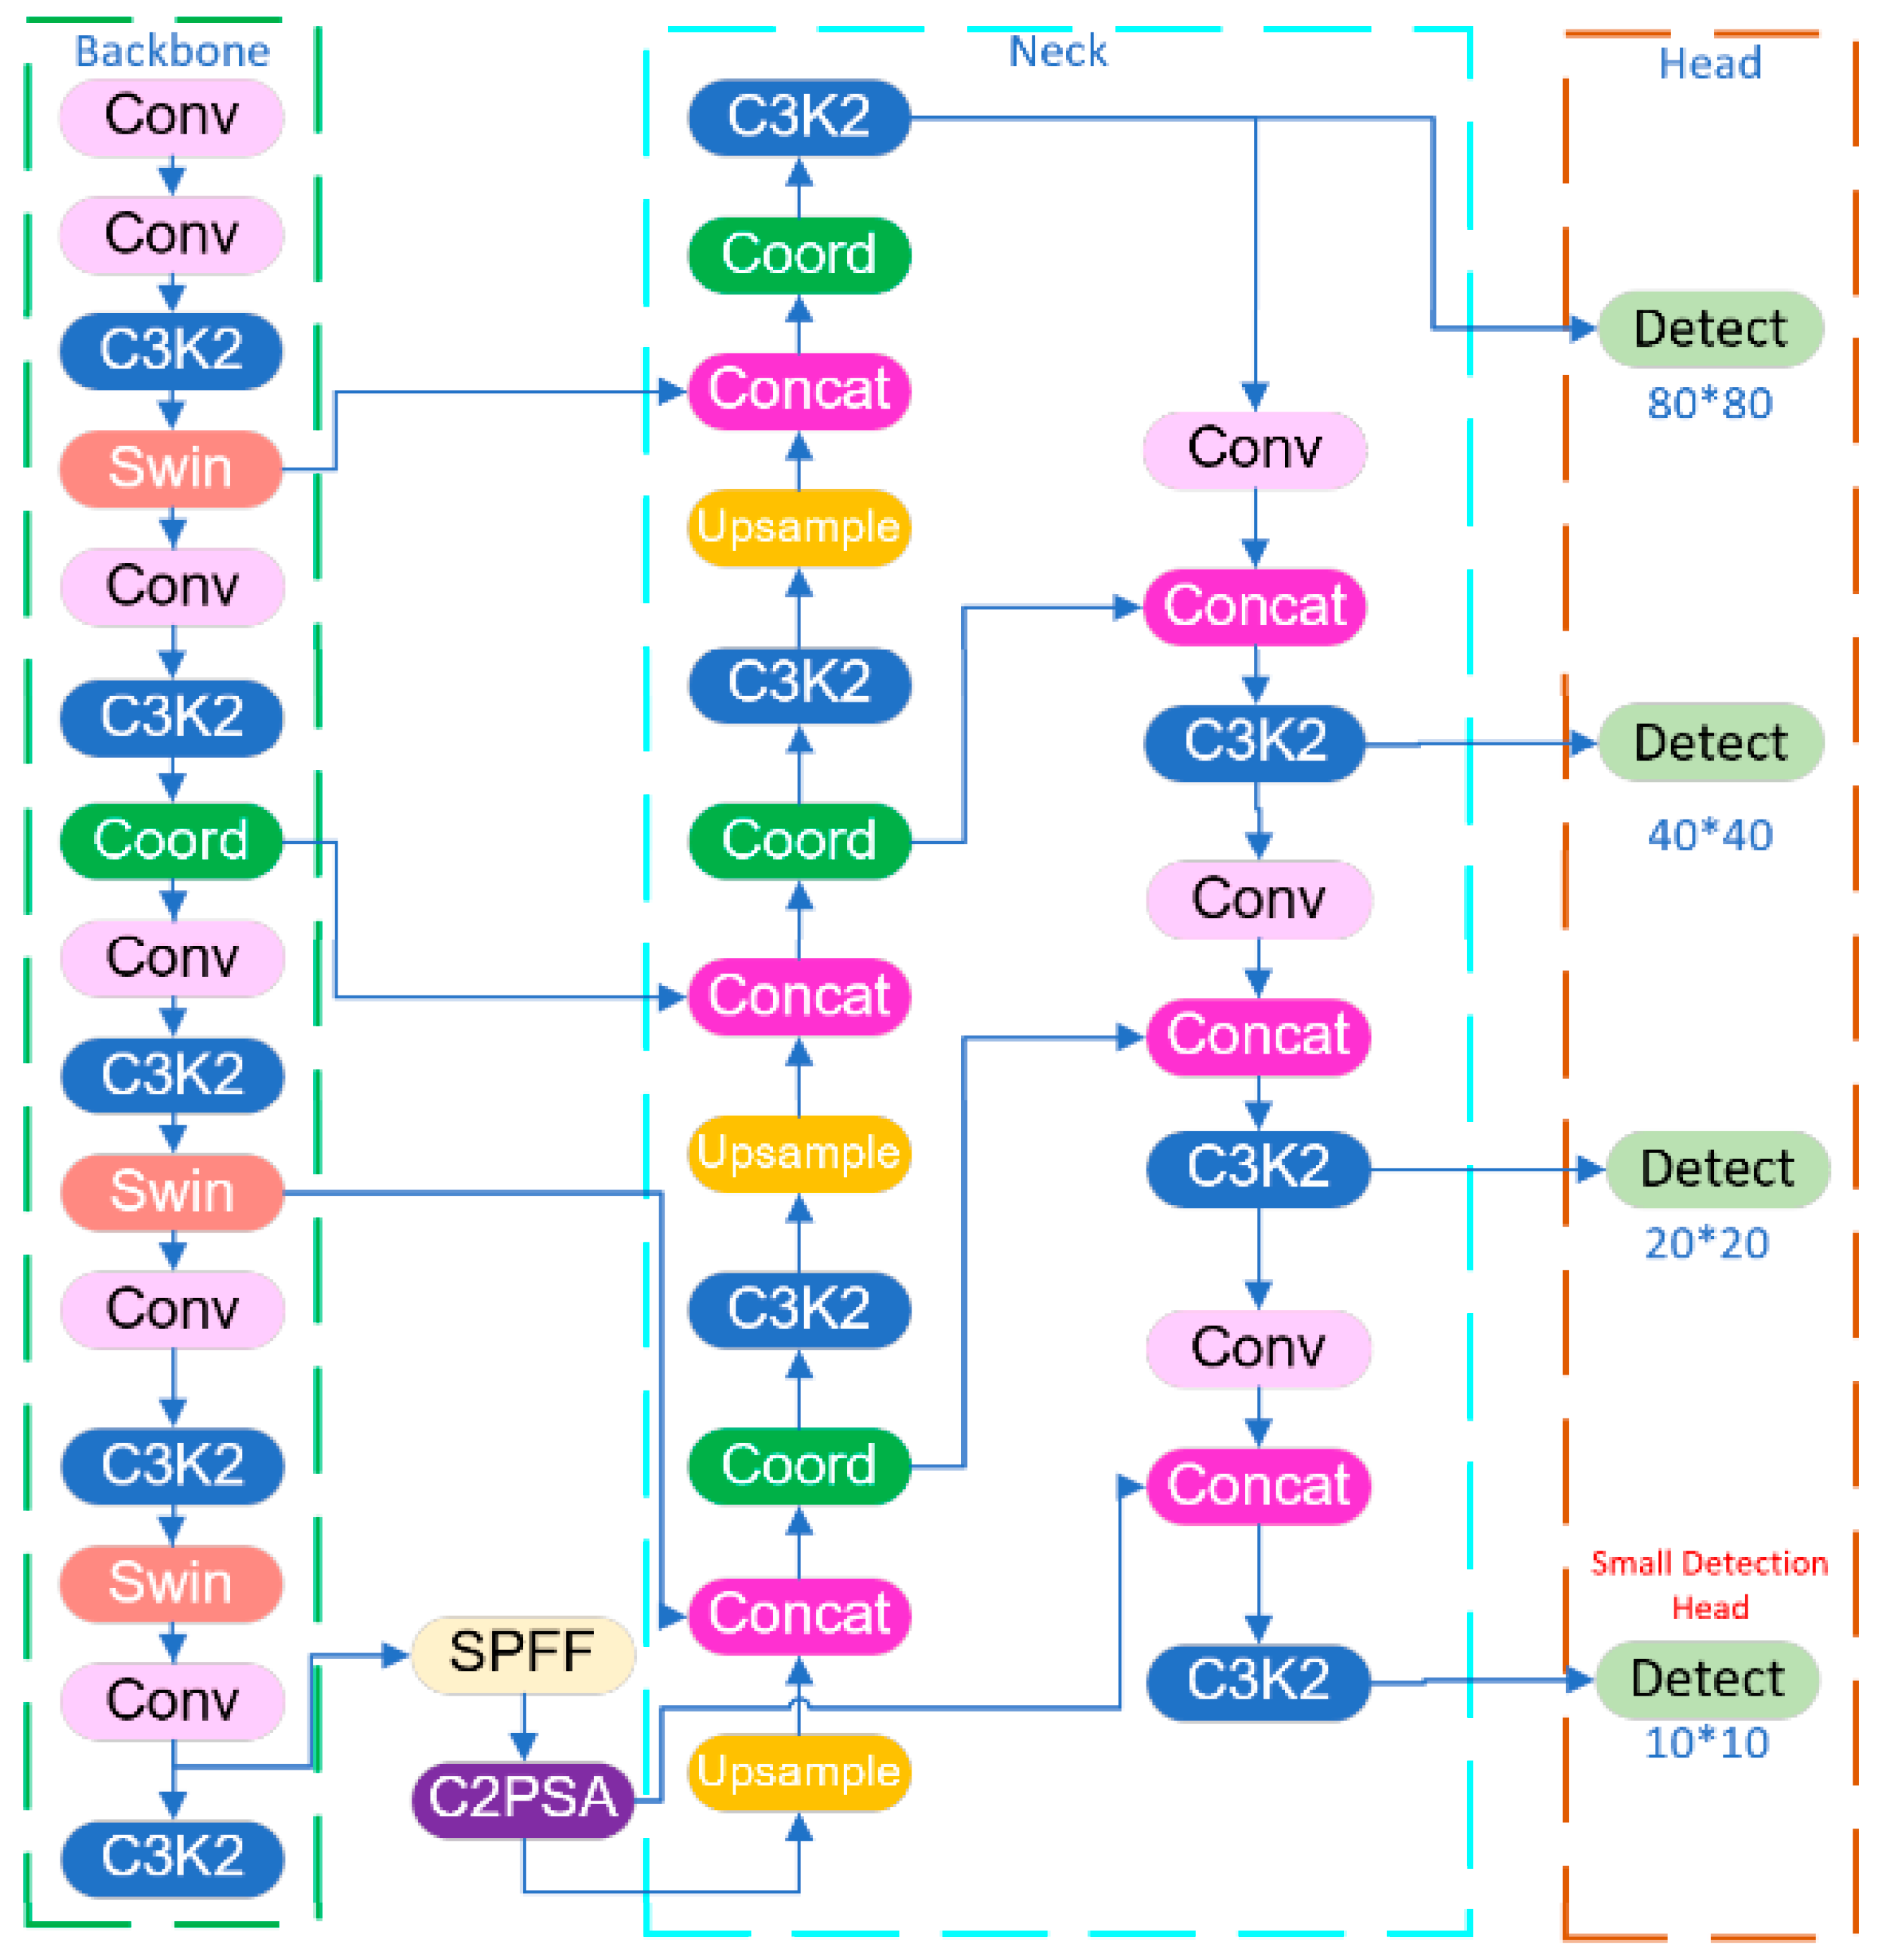
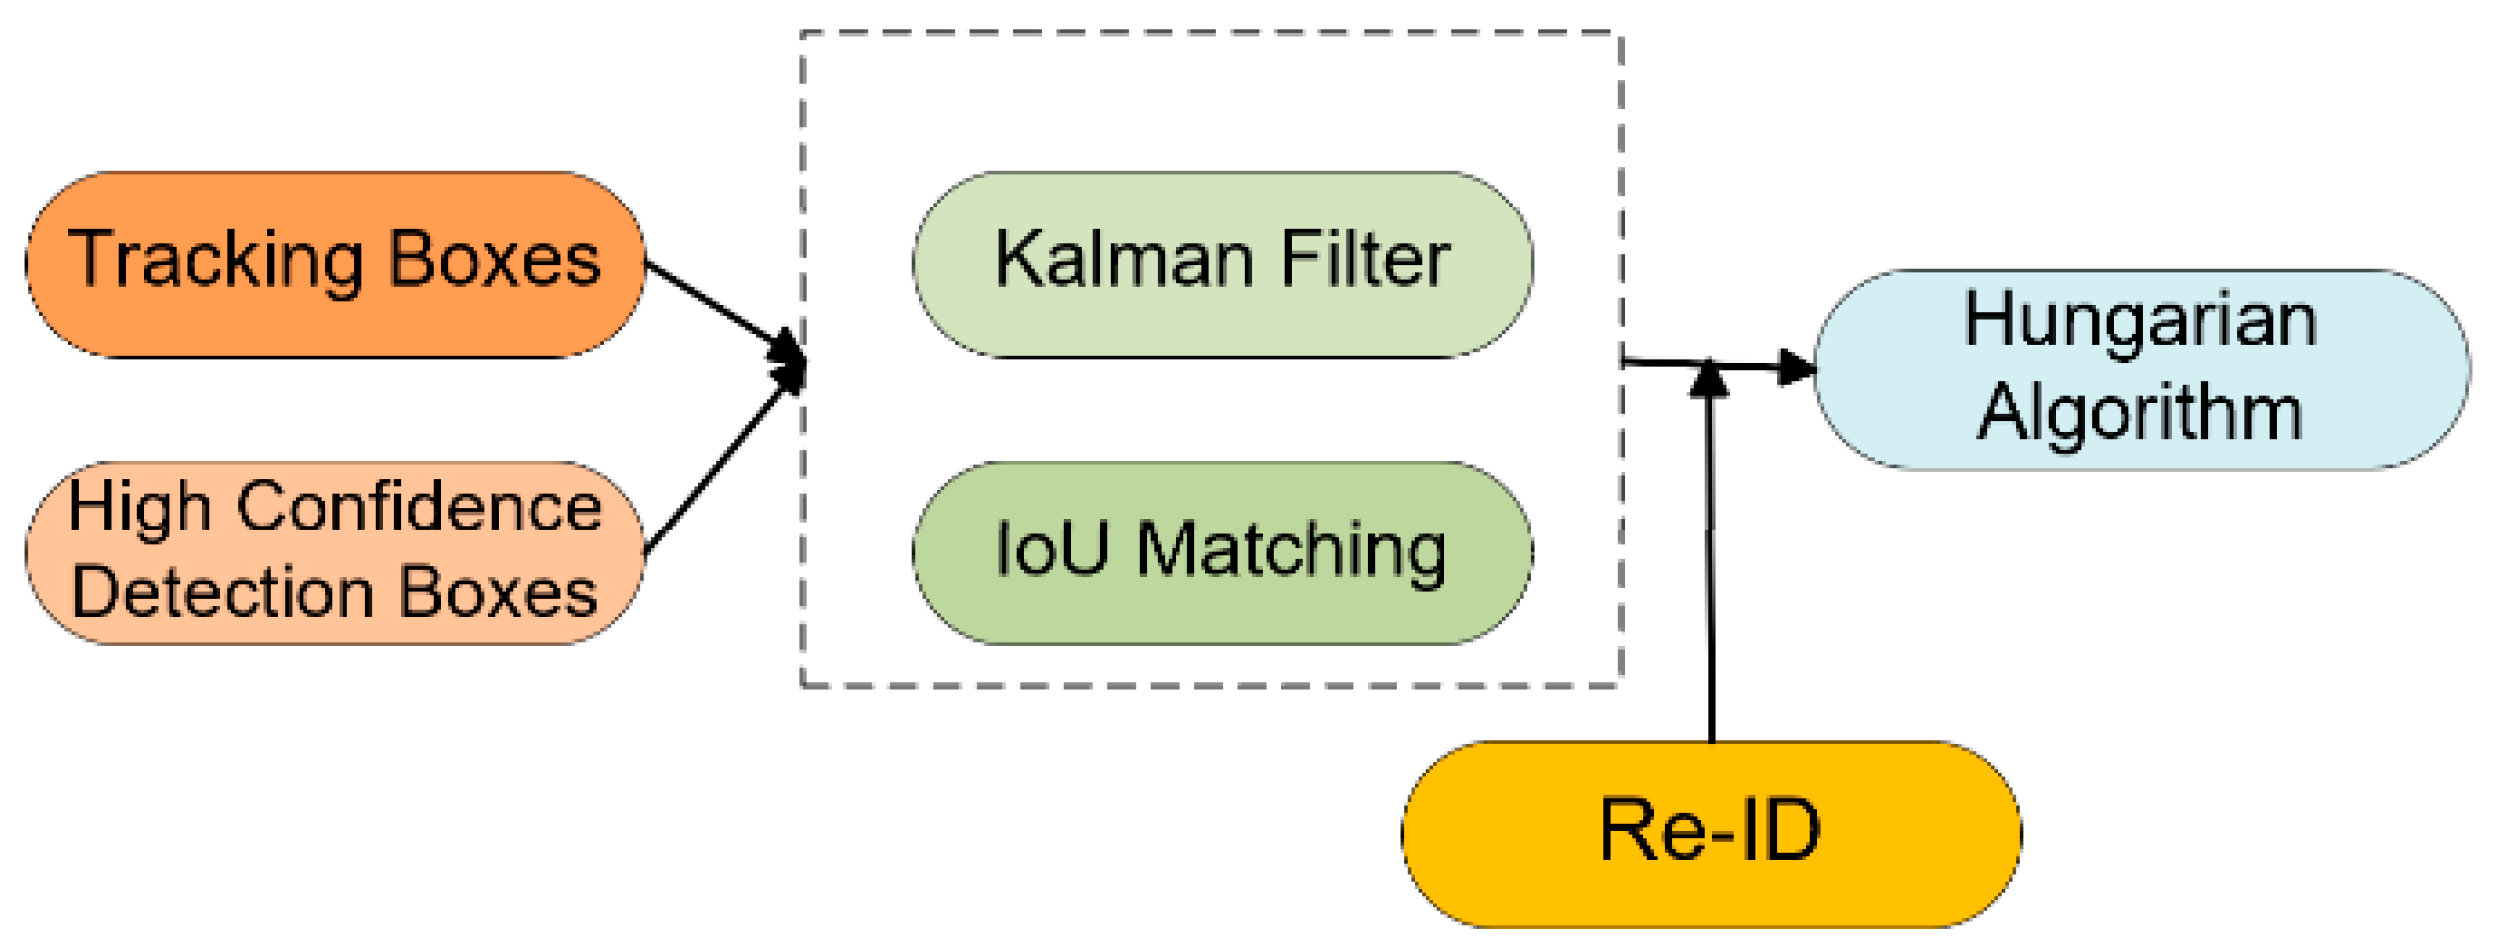
This section presents the experimental results of object detection and multi-object tracking in real-world traffic scenarios. In this experiment, the enhanced YOLOv11 detector with an additional small-object detection head is employed to identify heterogeneous traffic participants, while the BoT-SORT algorithm is used to maintain consistent identities and extract continuous trajectories across video frames. The model was trained for 100 epochs on an ASUS TUF Gaming Air laptop, providing sufficient computational power for efficient training and evaluation.
The performance of the proposed detection framework is evaluated on the POL37 urban intersection dataset, which contains complex traffic conditions including dense vehicle flow, frequent motorcycle interactions, and pedestrian crossings. Both mean Average Precision (mAP) and qualitative visual results are analyzed to assess detection accuracy, tracking stability, and robustness under challenging environments. The experimental results demonstrate that the proposed framework provides reliable perception outputs, forming a foundation for subsequent near-miss event detection and severity assessment.
Average Precision (AP) and mean Average Precision (mAP) [
25] are used as evaluation metrics. AP is defined as the area under the Precision–Recall (P–R) curve for a specific class, while mAP is the mean of the AP values over all object classes. They are widely used to evaluate the detection performance of object detection models. The definitions can be expressed as follows:
where
is the precision as a function of recall
,
is the total number of object classes, and
is the average precision of class
.
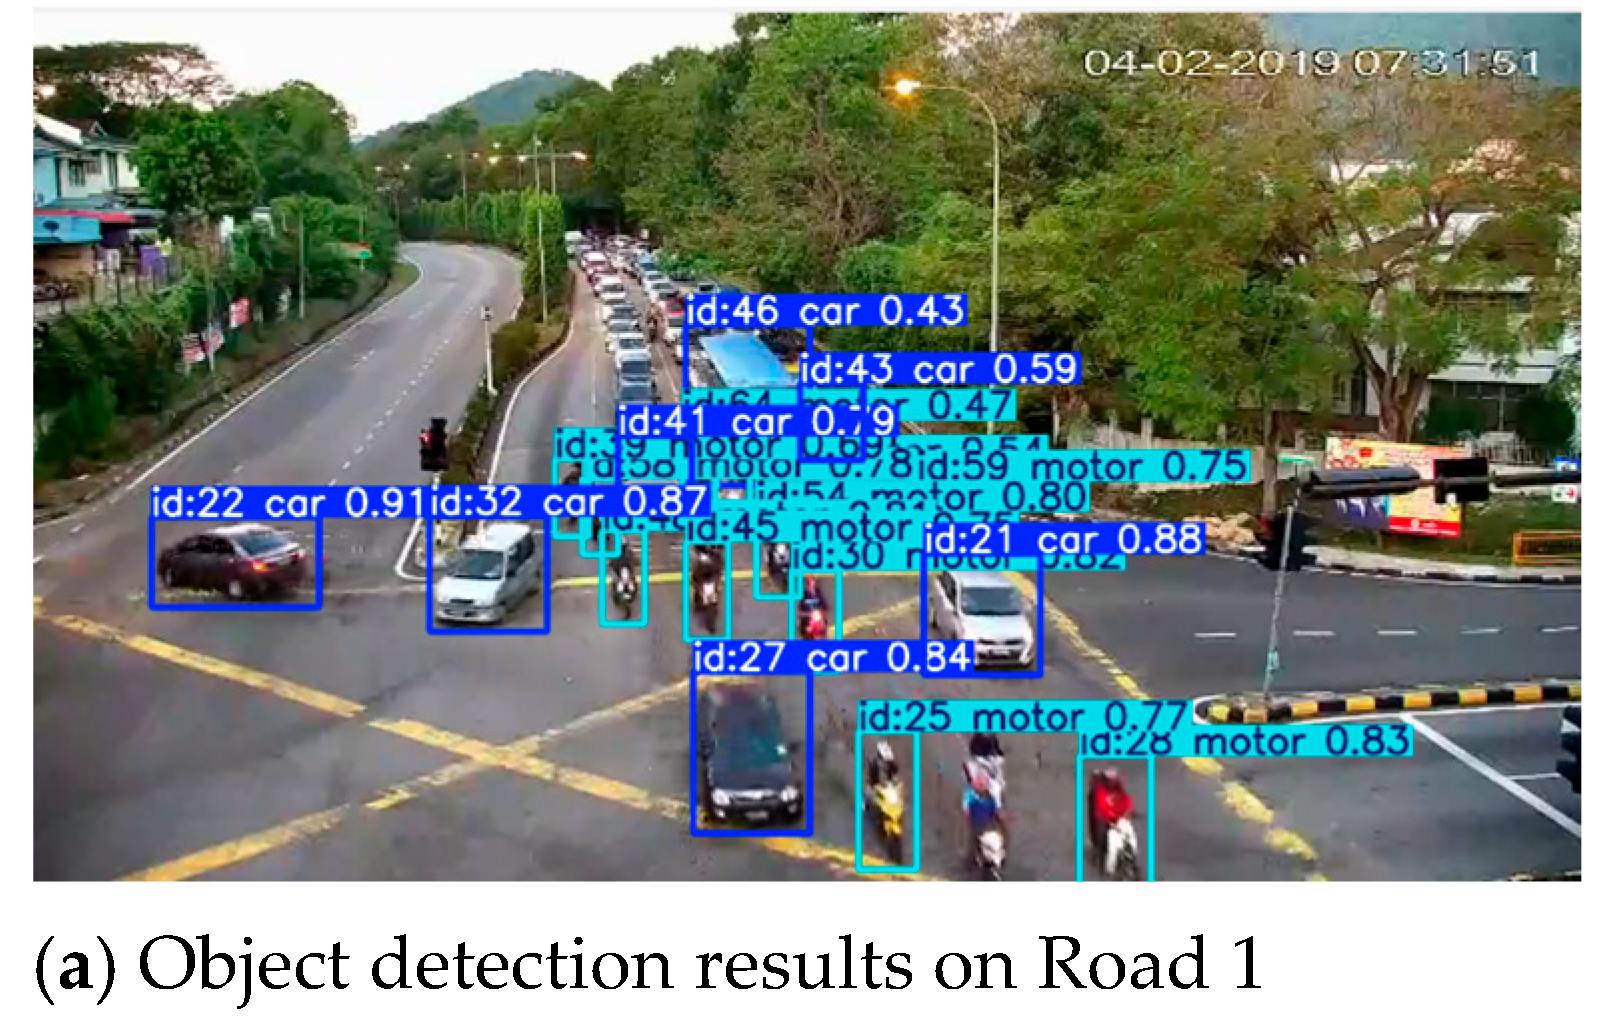
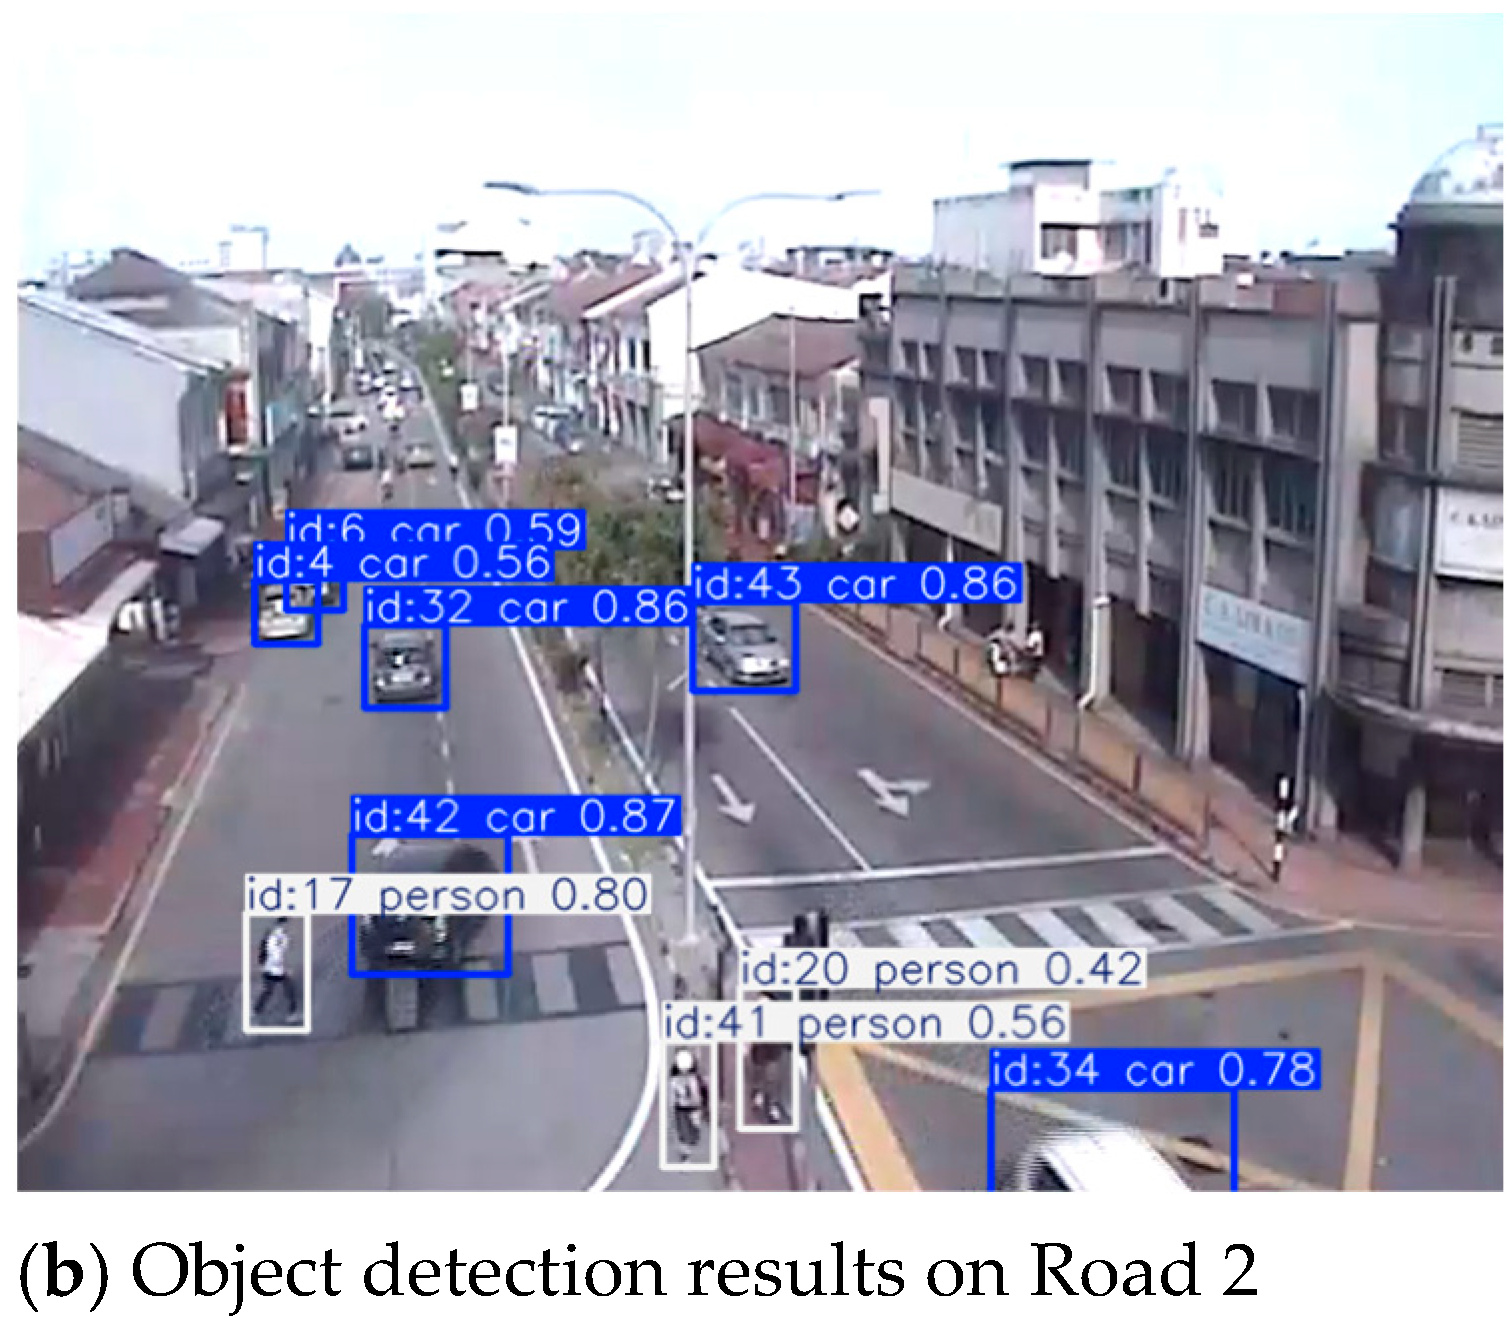
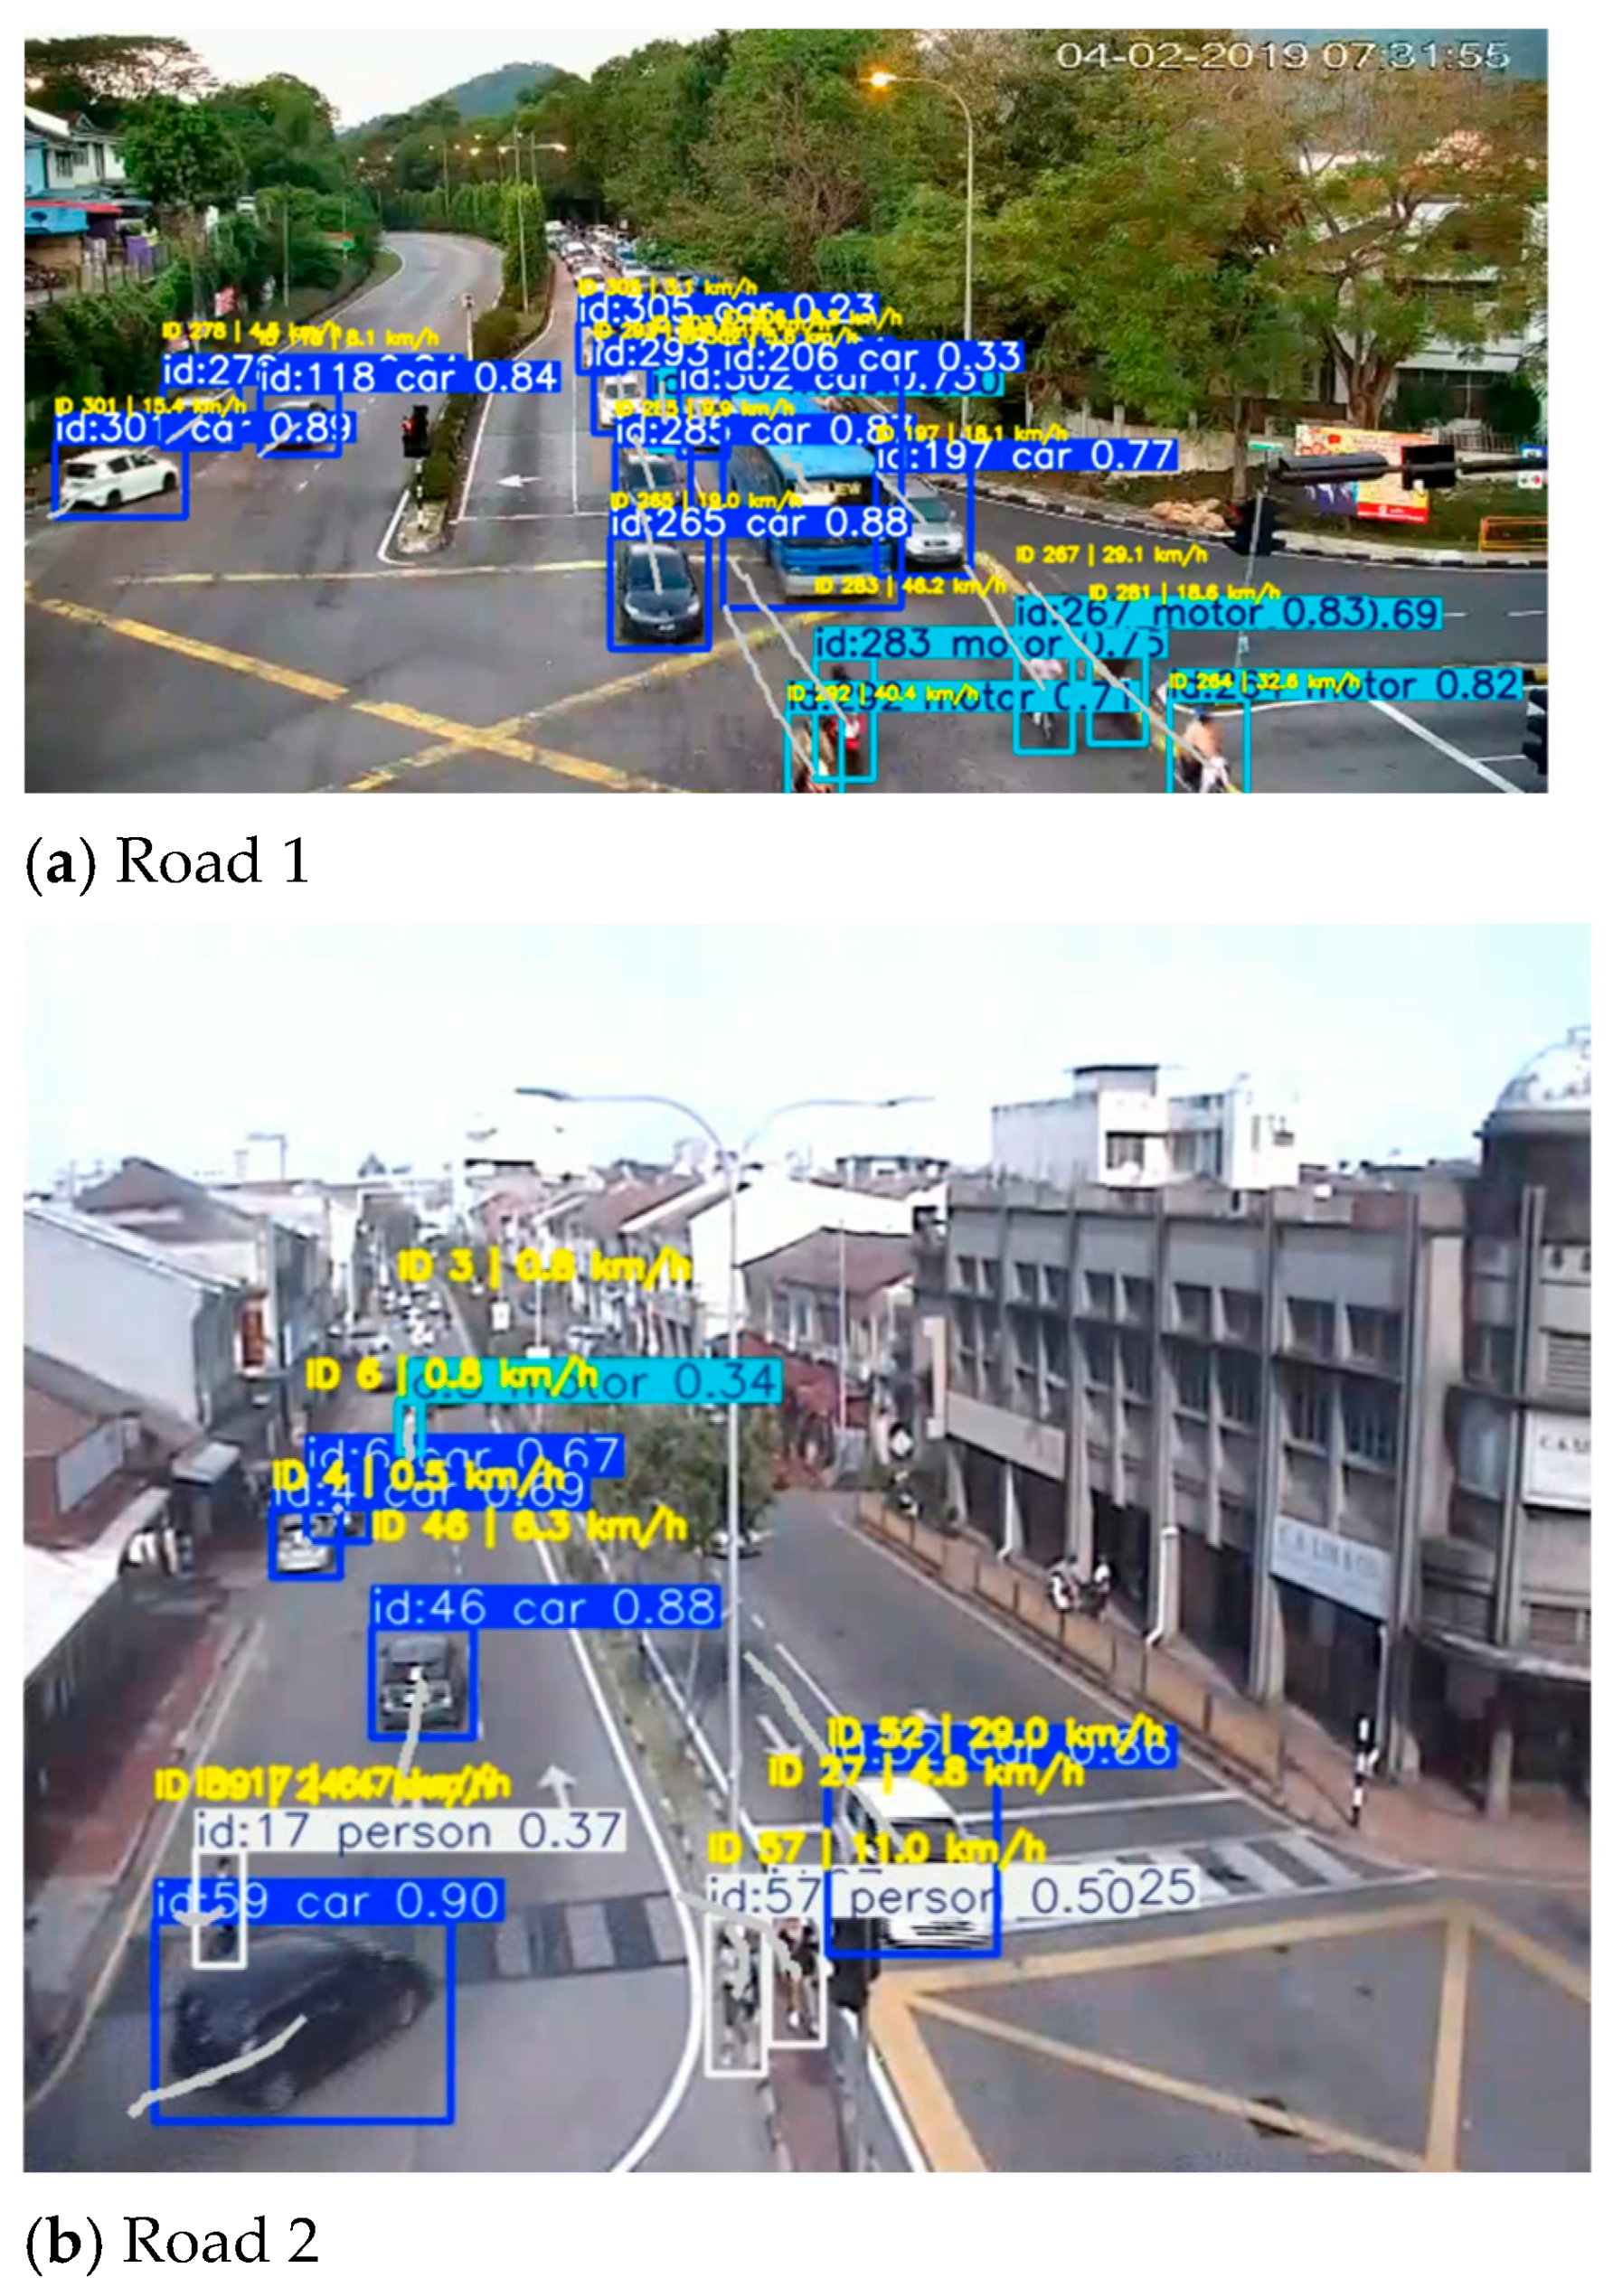
For experimental evaluation, 30-s video segments from two representative road sections were selected as test data. The object detection results are shown in
Figure 5.
Figure 5 and
Table 3 show the object detection results in different road scenarios and the evaluation metrics during training. (a) presents the detection results on Road 1, while (b) shows the results on Road 2. The model accurately detects cars, motorcycles, and pedestrians, even in complex or crowded scenes. The dark blue boxes indicate detected cars, the light blue boxes indicate detected motorcycles, and the white boxes indicate detected pedestrians.
Table 3 displays the mAP curve during training, indicating stable convergence. The AP values for each category are: car 96.9%, motor 98.1%, and person 92.7%, with an overall mAP of 95.9%, demonstrating that the model achieves high accuracy and reliability in multi-class object detection, suitable for practical road monitoring applications.
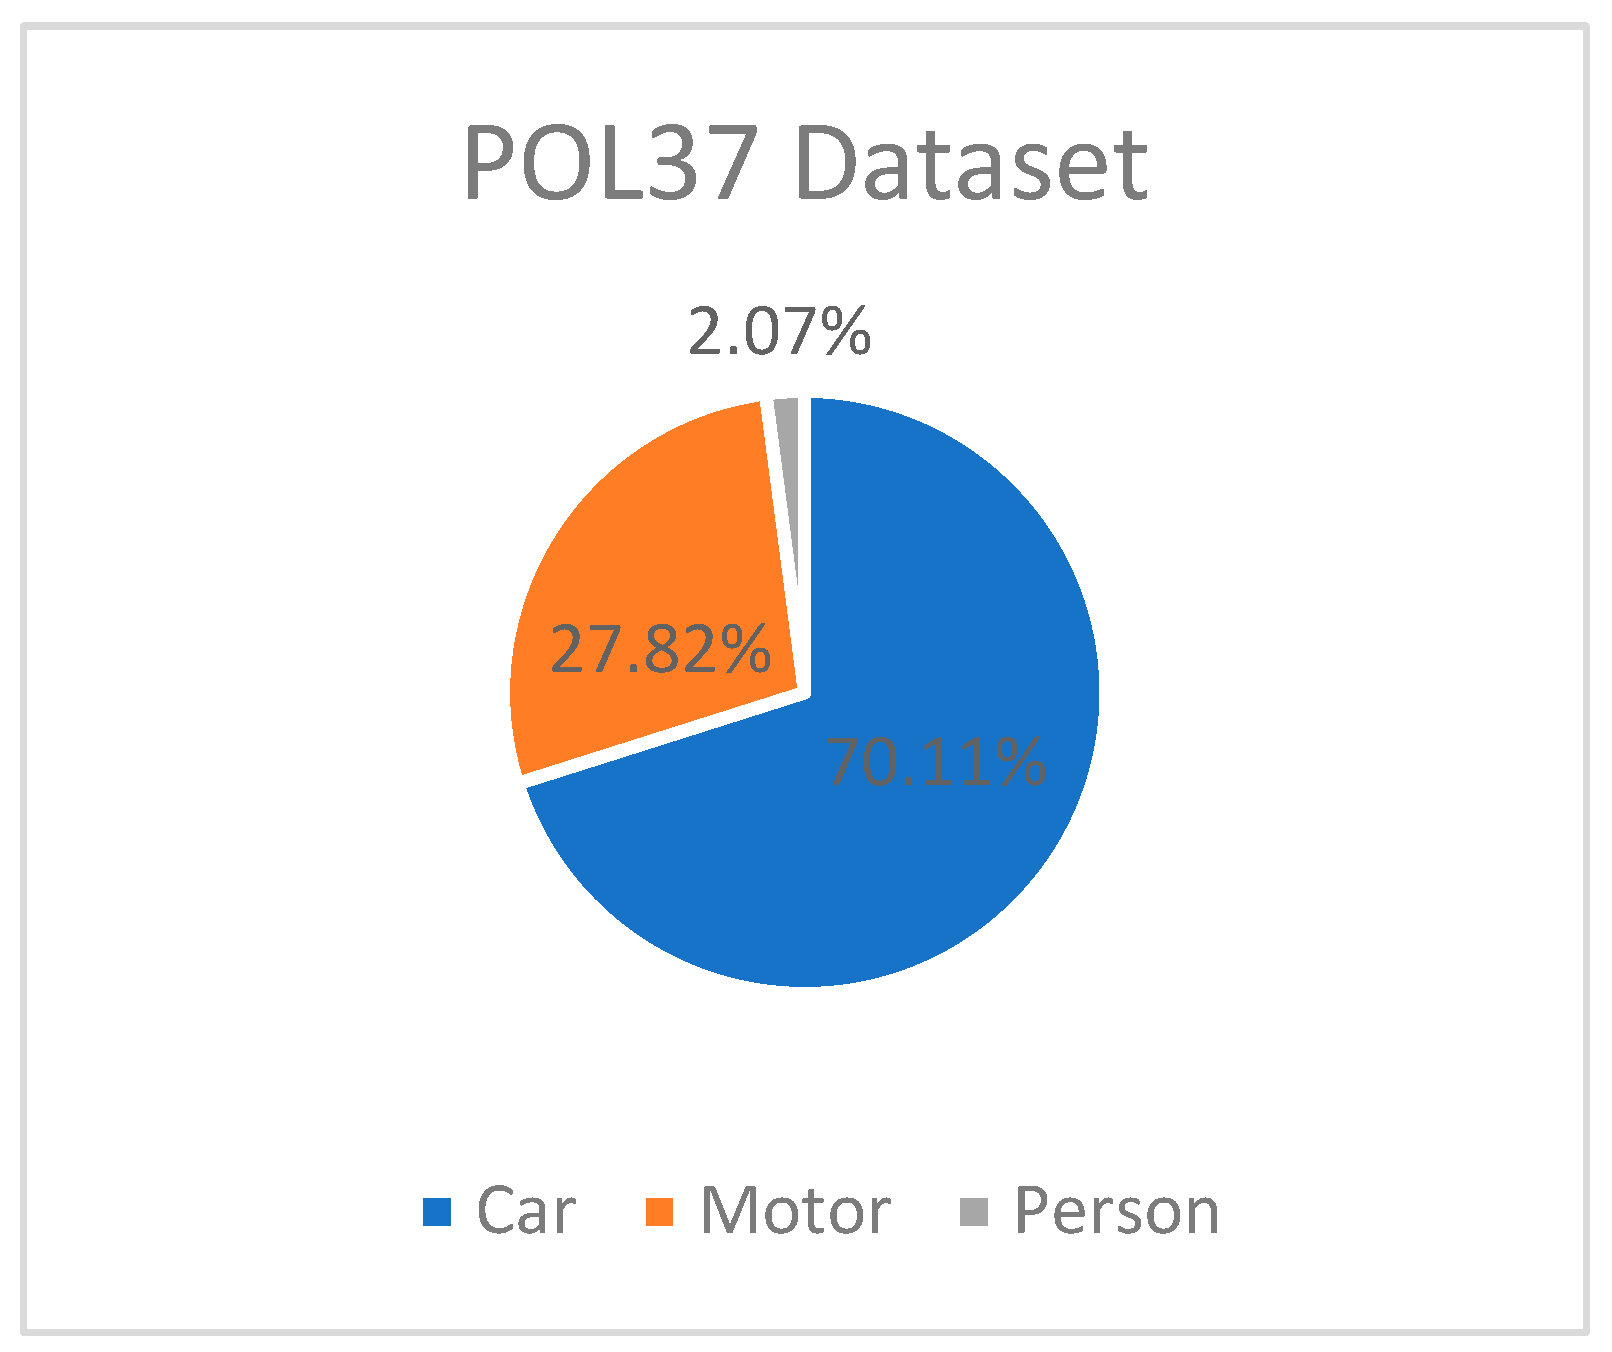
The lower number of pedestrians in
Table 3 reflects the urban traffic conditions in Penang, Malaysia, where sidewalks are often missing and pedestrian signals at intersections are rare. As a result, motorcycles, which have a high incidence of traffic accidents in the region, are the main focus of this study. This is also reflected in the results, with motorcycle detection achieving a precision of 98.1%, demonstrating the effectiveness of the proposed method for the most relevant road users in this context.
Since three key modifications are introduced to YOLOv11 in this study, ablation experiments are conducted to evaluate the effectiveness of each individual component, as shown in
Table 4. The results demonstrate that each module contributes differently to the overall performance improvement. Starting from the baseline model with an mAP@50 of 93.10%, incorporating the Swin Transformer into the backbone yields a modest gain of +0.40%, indicating that enhanced global feature modeling provides limited but consistent improvement in object representation. When Coordinate Attention is further introduced into the neck, the performance increases to 93.80%, achieving an additional gain of +0.30%. This suggests that embedding positional information into channel attention improves feature fusion, although the contribution remains incremental. In contrast, the introduction of the small-object detection head leads to a significant performance boost, increasing the mAP@50 to 94.90% (+1.10%). This clearly indicates that the small-object detection head is the dominant contributor among all proposed components, highlighting its effectiveness in handling small-scale targets in complex traffic scenes. Finally, by integrating all three components, the proposed model achieves the highest mAP@50 of 95.90%, resulting in an overall improvement of 2.80% over the baseline. The results suggest that while the Swin Transformer and Coordinate Attention provide complementary enhancements, the primary performance gain is driven by the small-object detection head.
From a practical perspective, although the additional modules introduce some computational overhead, the performance gains—especially those contributed by the small-object detection head—justify the increased complexity. Therefore, the proposed design achieves a favorable trade-off between accuracy and efficiency, making it suitable for real-world traffic monitoring applications.
Table 5 further compares the proposed method with several mainstream object detection algorithms on the POL37 dataset. Traditional two-stage detectors such as SSD (75.4%), R-CNN (60.4%), and Fast R-CNN (73.2%) show relatively lower performance due to their limitations in handling complex traffic scenarios. One-stage detectors, including YOLOv5 (93.2%) and YOLOv7 (93.4%), achieve competitive results; however, they still fall short of the proposed method. In contrast, the improved model achieves the best performance with mAP@50 of 95.90%, outperforming all compared methods.
These results demonstrate that the proposed enhancements not only improve detection accuracy but also provide stronger robustness and better adaptability to small objects and complex traffic environments. This makes the model more suitable for practical applications such as near-miss event detection and traffic risk assessment.
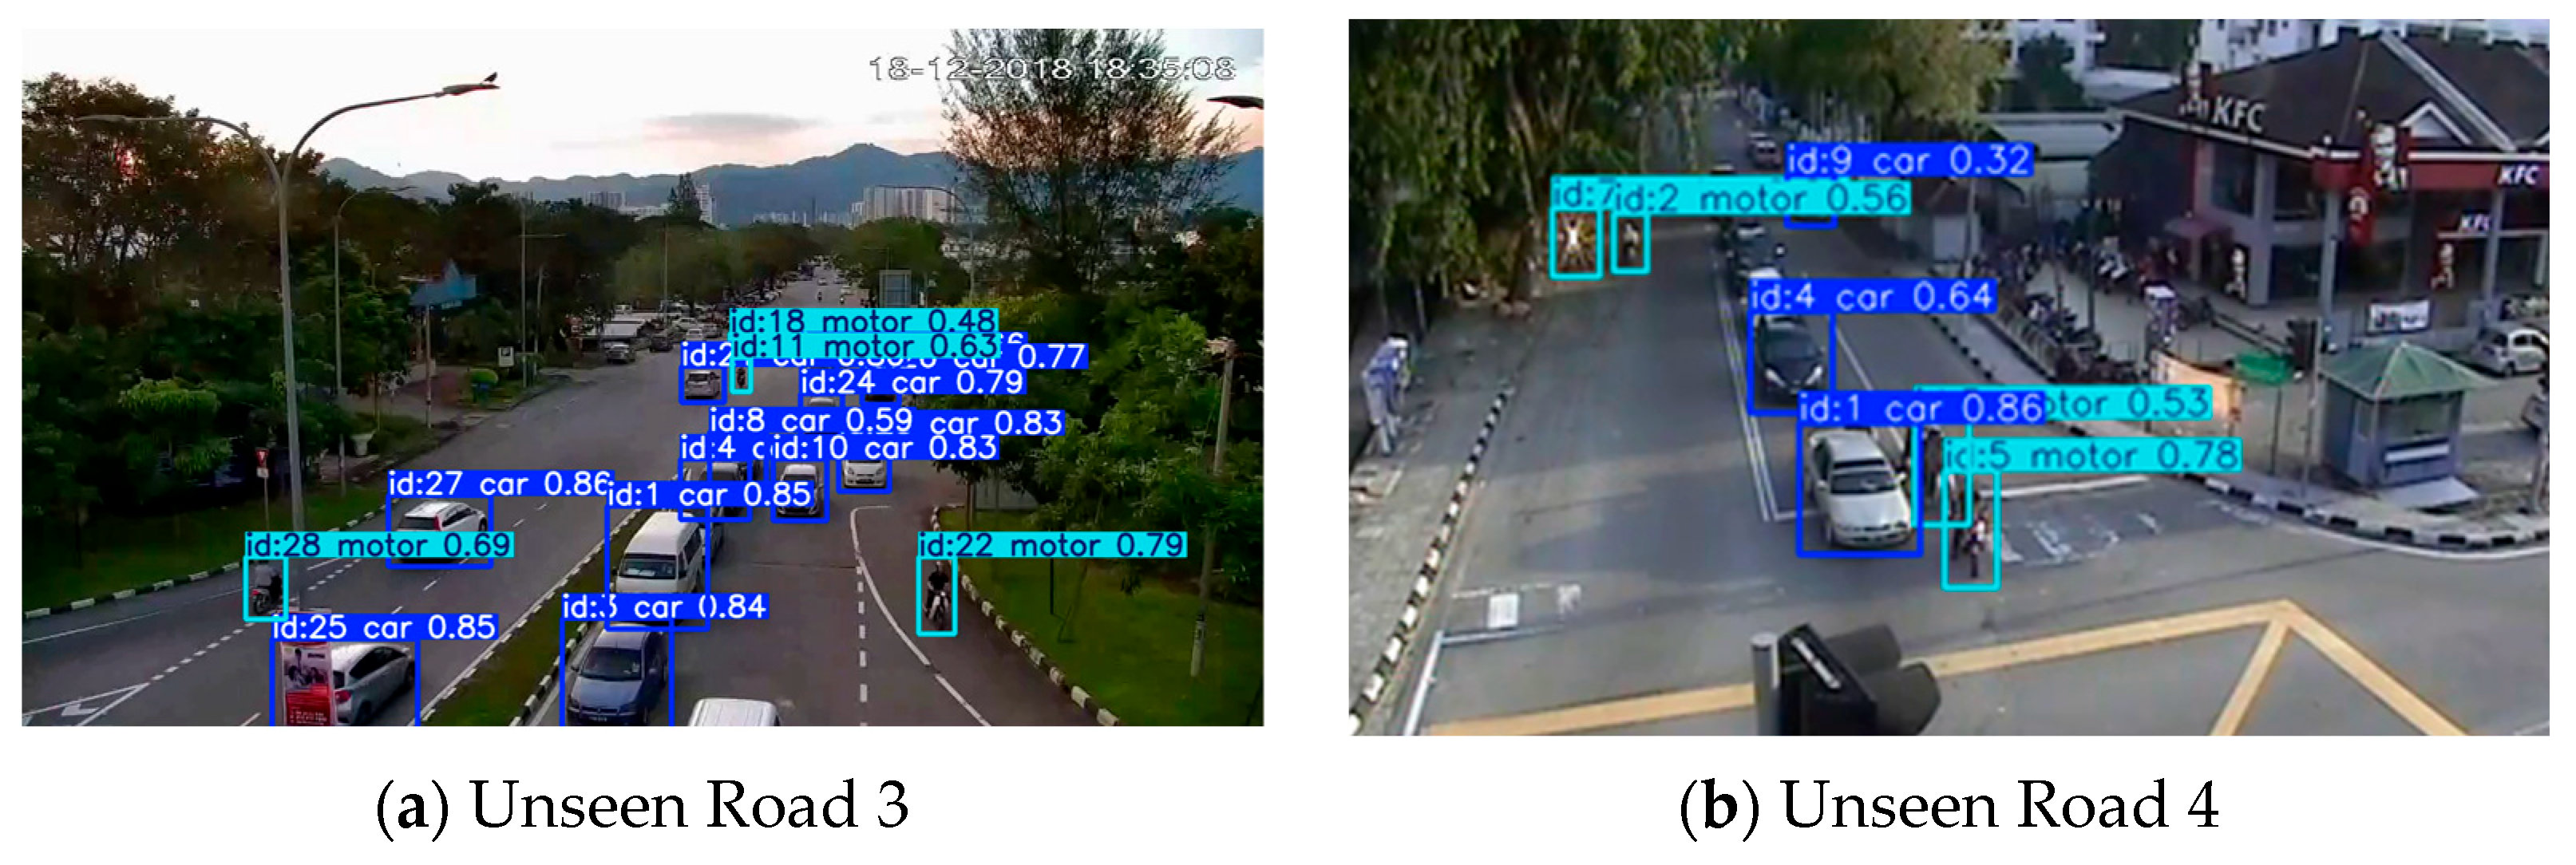
To further evaluate the robustness of the proposed algorithm, additional testing was conducted on data from road segments of POL37 that were not included in the training set. The detection results are presented in
Figure 6. As shown, the algorithm consistently detects various traffic participants under different road conditions, indicating strong generalization capability and stable performance across unseen scenarios.
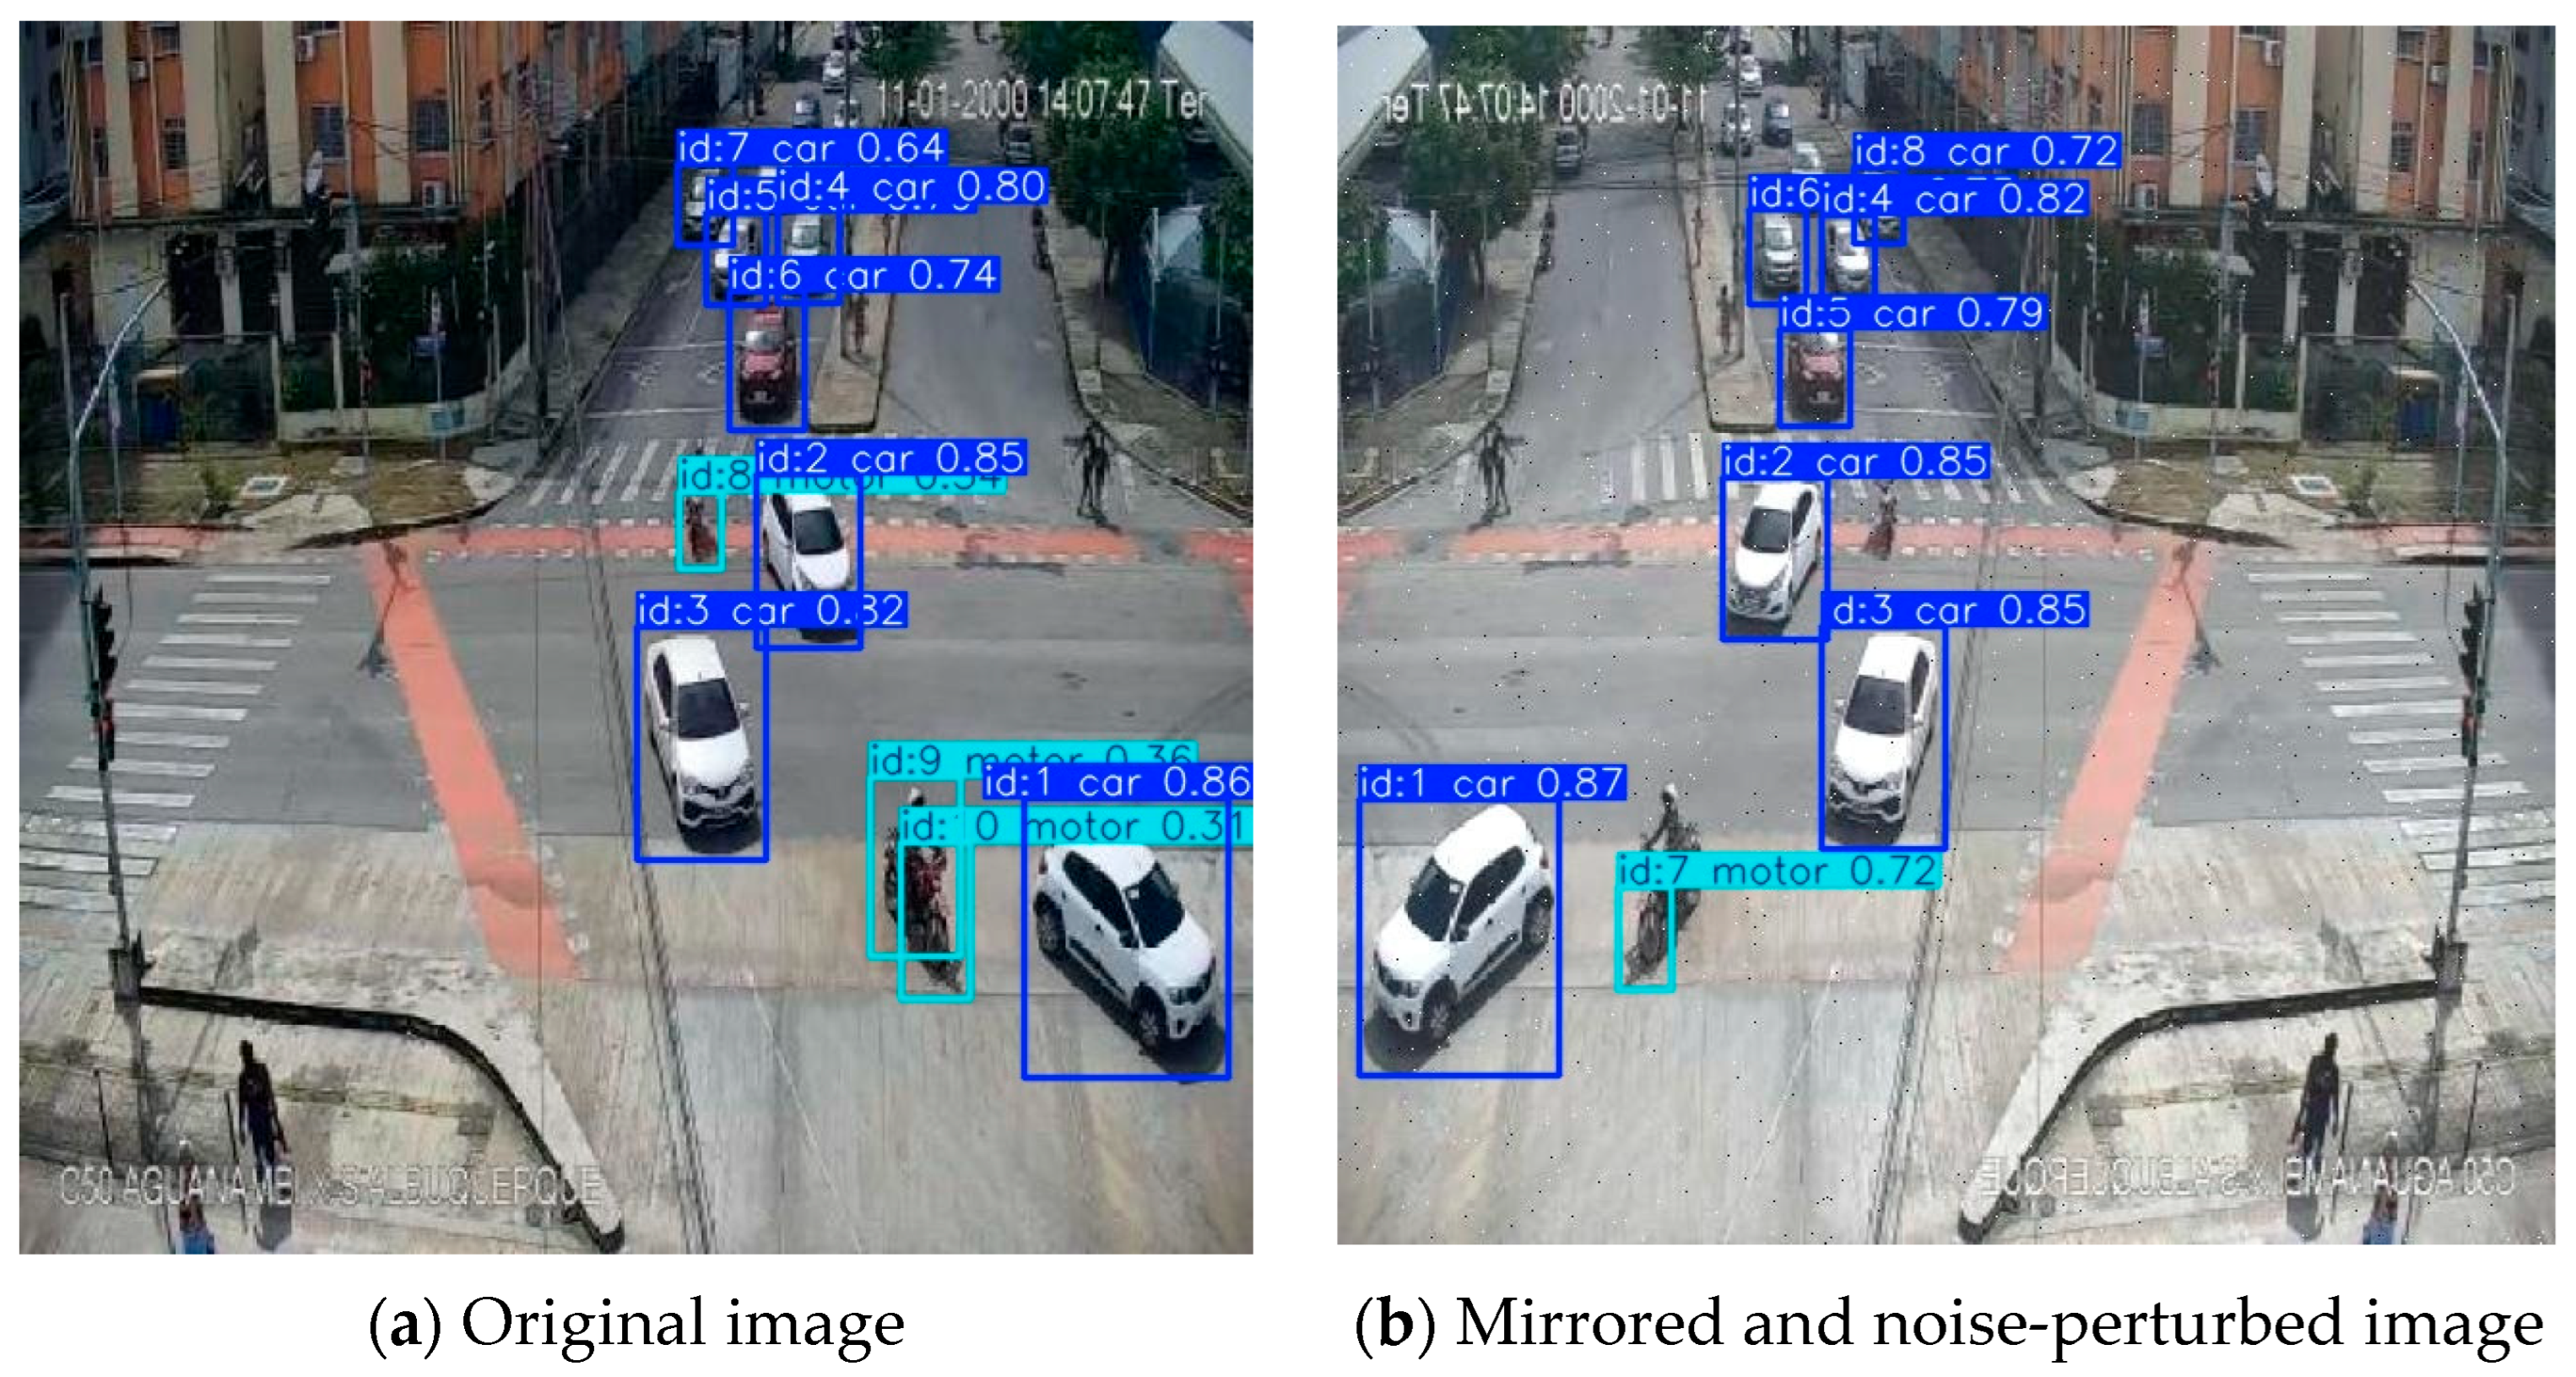
The dataset used in
Figure 7 is obtained from a publicly available source on Roboflow, which exhibits substantial differences from the training dataset in terms of camera height, viewing angle, and scene composition. Such discrepancies introduce a clear domain shift, making it suitable for evaluating the cross-dataset generalization capability of the proposed model. As shown in
Figure 7a, the model achieves a high detection rate for cars, while the performance on motorcycles is comparatively lower. Nevertheless, no false positives are observed, indicating strong detection reliability. The limited detection performance for pedestrians can be attributed to the insufficient representation of this class in the training data, which restricts the model’s ability to generalize to underrepresented categories. In
Figure 7b, despite the application of mirroring transformation and noise perturbation, the model consistently maintains high detection accuracy for vehicles and motorcycles. This demonstrates that the proposed approach is robust to common image perturbations and exhibits strong resilience under challenging visual conditions. Overall, these results validate the effectiveness of the model in handling domain shifts and confirm its robust generalization performance in unseen traffic environments.
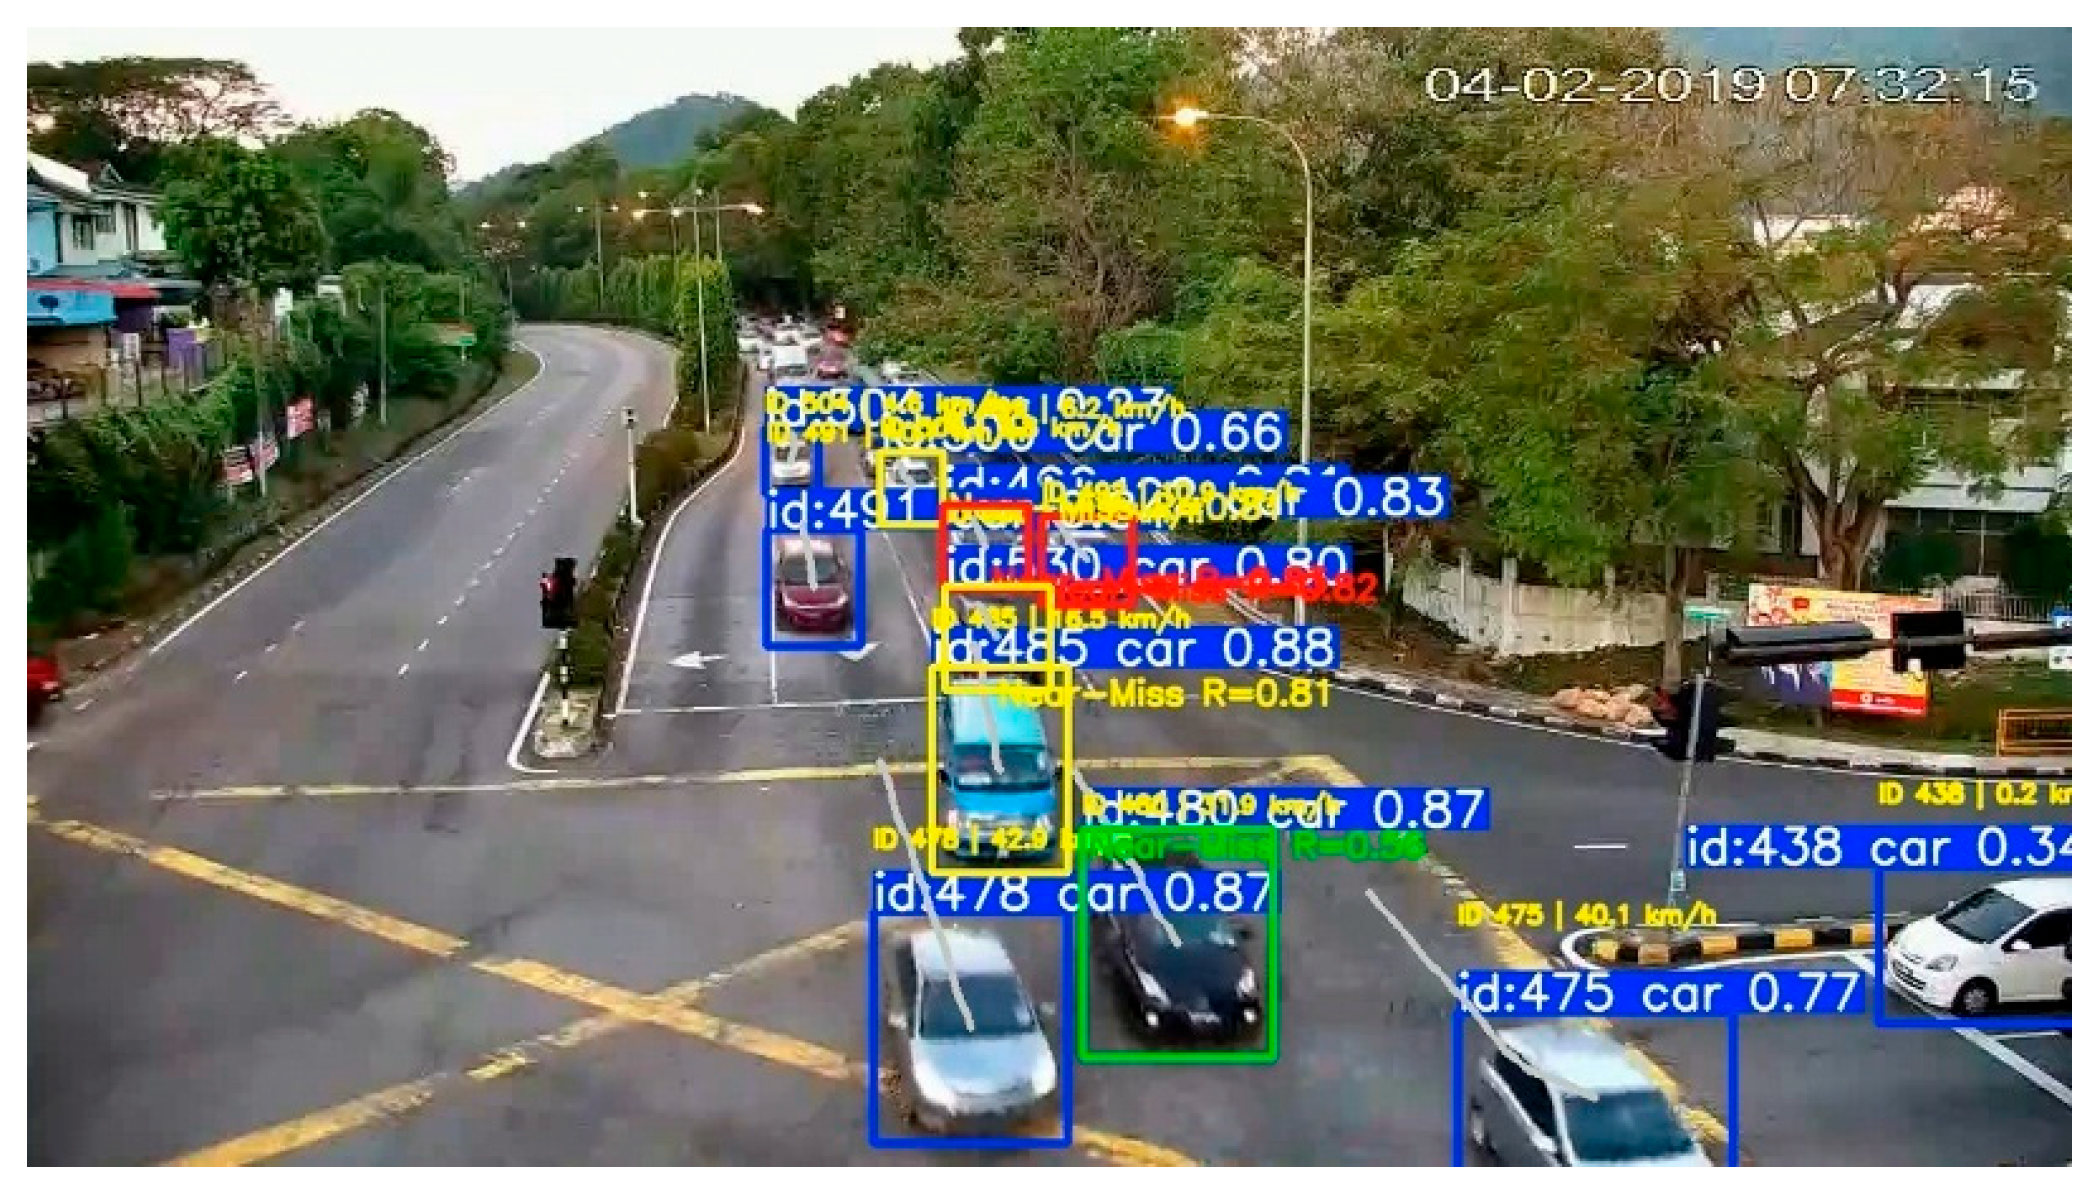
The corresponding tracking results, matching the object detection in
Figure 5, are shown in
Figure 8. It illustrates the multi-object tracking results combined with BEV-based velocity estimation. Each detected road user is assigned a unique identity (ID), which is consistently maintained across consecutive frames by the BoT-SORT tracking algorithm. The trajectories visualize the historical motion paths of vehicles, motorcycles, and pedestrians, demonstrating stable identity preservation even in dense traffic conditions.
Based on the BEV transformation, the image-plane detections are projected onto the ground-plane coordinate system, enabling accurate estimation of motion direction and speed. The velocity vectors shown in the figure represent the real-world movement trends of road users, which are difficult to obtain directly from perspective images due to geometric distortion. By integrating object tracking with BEV-based motion analysis, the proposed framework provides reliable trajectory and velocity information.
To evaluate the accuracy of the tracking module, this study conducted an analysis using the standard metrics MOTA (Multiple Object Tracking Accuracy) and MOTP (Multiple Object Tracking Precision). These metrics quantitatively assess the tracking performance, with MOTA measuring the overall accuracy in maintaining correct object identities and MOTP evaluating the precision of object localization across frames. The results are shown in
Table 6, where the MOTA value is 0.79 on Road 1 and 0.68 on Road 2, the MOTP value is 0.22 on Road 1 and 0.21 on Road 2. A MOTA of 0.79 indicates that the tracking module correctly maintains the identities of the majority of targets, demonstrating reliable multi-object association. The MOTP of 0.22 reflects a relatively high spatial precision in estimating object positions, indicating that the module can accurately localize targets even in complex traffic scenes.
Since the proposed system relies on tracking outputs for near-miss detection and risk quantification, tracking errors can propagate to the final risk indicators in different ways and with varying levels of impact. Among these, identity switches are particularly critical, as they disrupt trajectory continuity and may lead to incorrect velocity estimation, which directly affects time-to-collision (TTC) calculations. Compared to localization errors, such identity-related errors tend to have a more significant impact on risk assessment because TTC is highly sensitive to motion consistency over time. In contrast, localization errors reflected by MOTP primarily influence the spatial accuracy of detected objects, thereby affecting distance estimation. Although such errors may introduce deviations in risk metrics, their impact is relatively moderate compared to identity switches, especially when the positional deviation remains small. Additionally, missed detections can result in fragmented trajectories, potentially causing underestimation of near-miss events, while false positives may introduce artificial interactions and lead to risk overestimation.
Overall, the relatively high MOTA values indicate that identity switches and missed detections are effectively controlled, while the low MOTP values suggest that localization errors remain within an acceptable range. Therefore, the error propagation from tracking to near-miss indicators is limited, ensuring that the computed risk metrics are sufficiently reliable for practical traffic safety analysis.
5.3. Visualization of Near-Miss Events
In this study, the analysis was carried out under standard urban traffic conditions, with moderate vehicle density, clear weather, and daylight illumination. The near-miss events captured in the POL37 dataset represent situations in which road users come into close proximity, but they do not encompass all types of emergency or accident-prone scenarios. The evolution of each interaction depends on road users’ actions, such as braking, lane changes, and evasive maneuvers, which are only partially reflected in the observed data.
Several factors may limit the generalizability of the results. Partially occluded objects are more difficult to detect, which can lead to underestimation of near-miss severity. Environmental conditions, including rain, fog, nighttime, and varying road surfaces, have not been fully tested and could affect detection and tracking performance. Variations in traffic density and driver behavior also influence near-miss occurrences and the measured Risk Index, meaning the results may differ in regions with more heterogeneous traffic patterns.
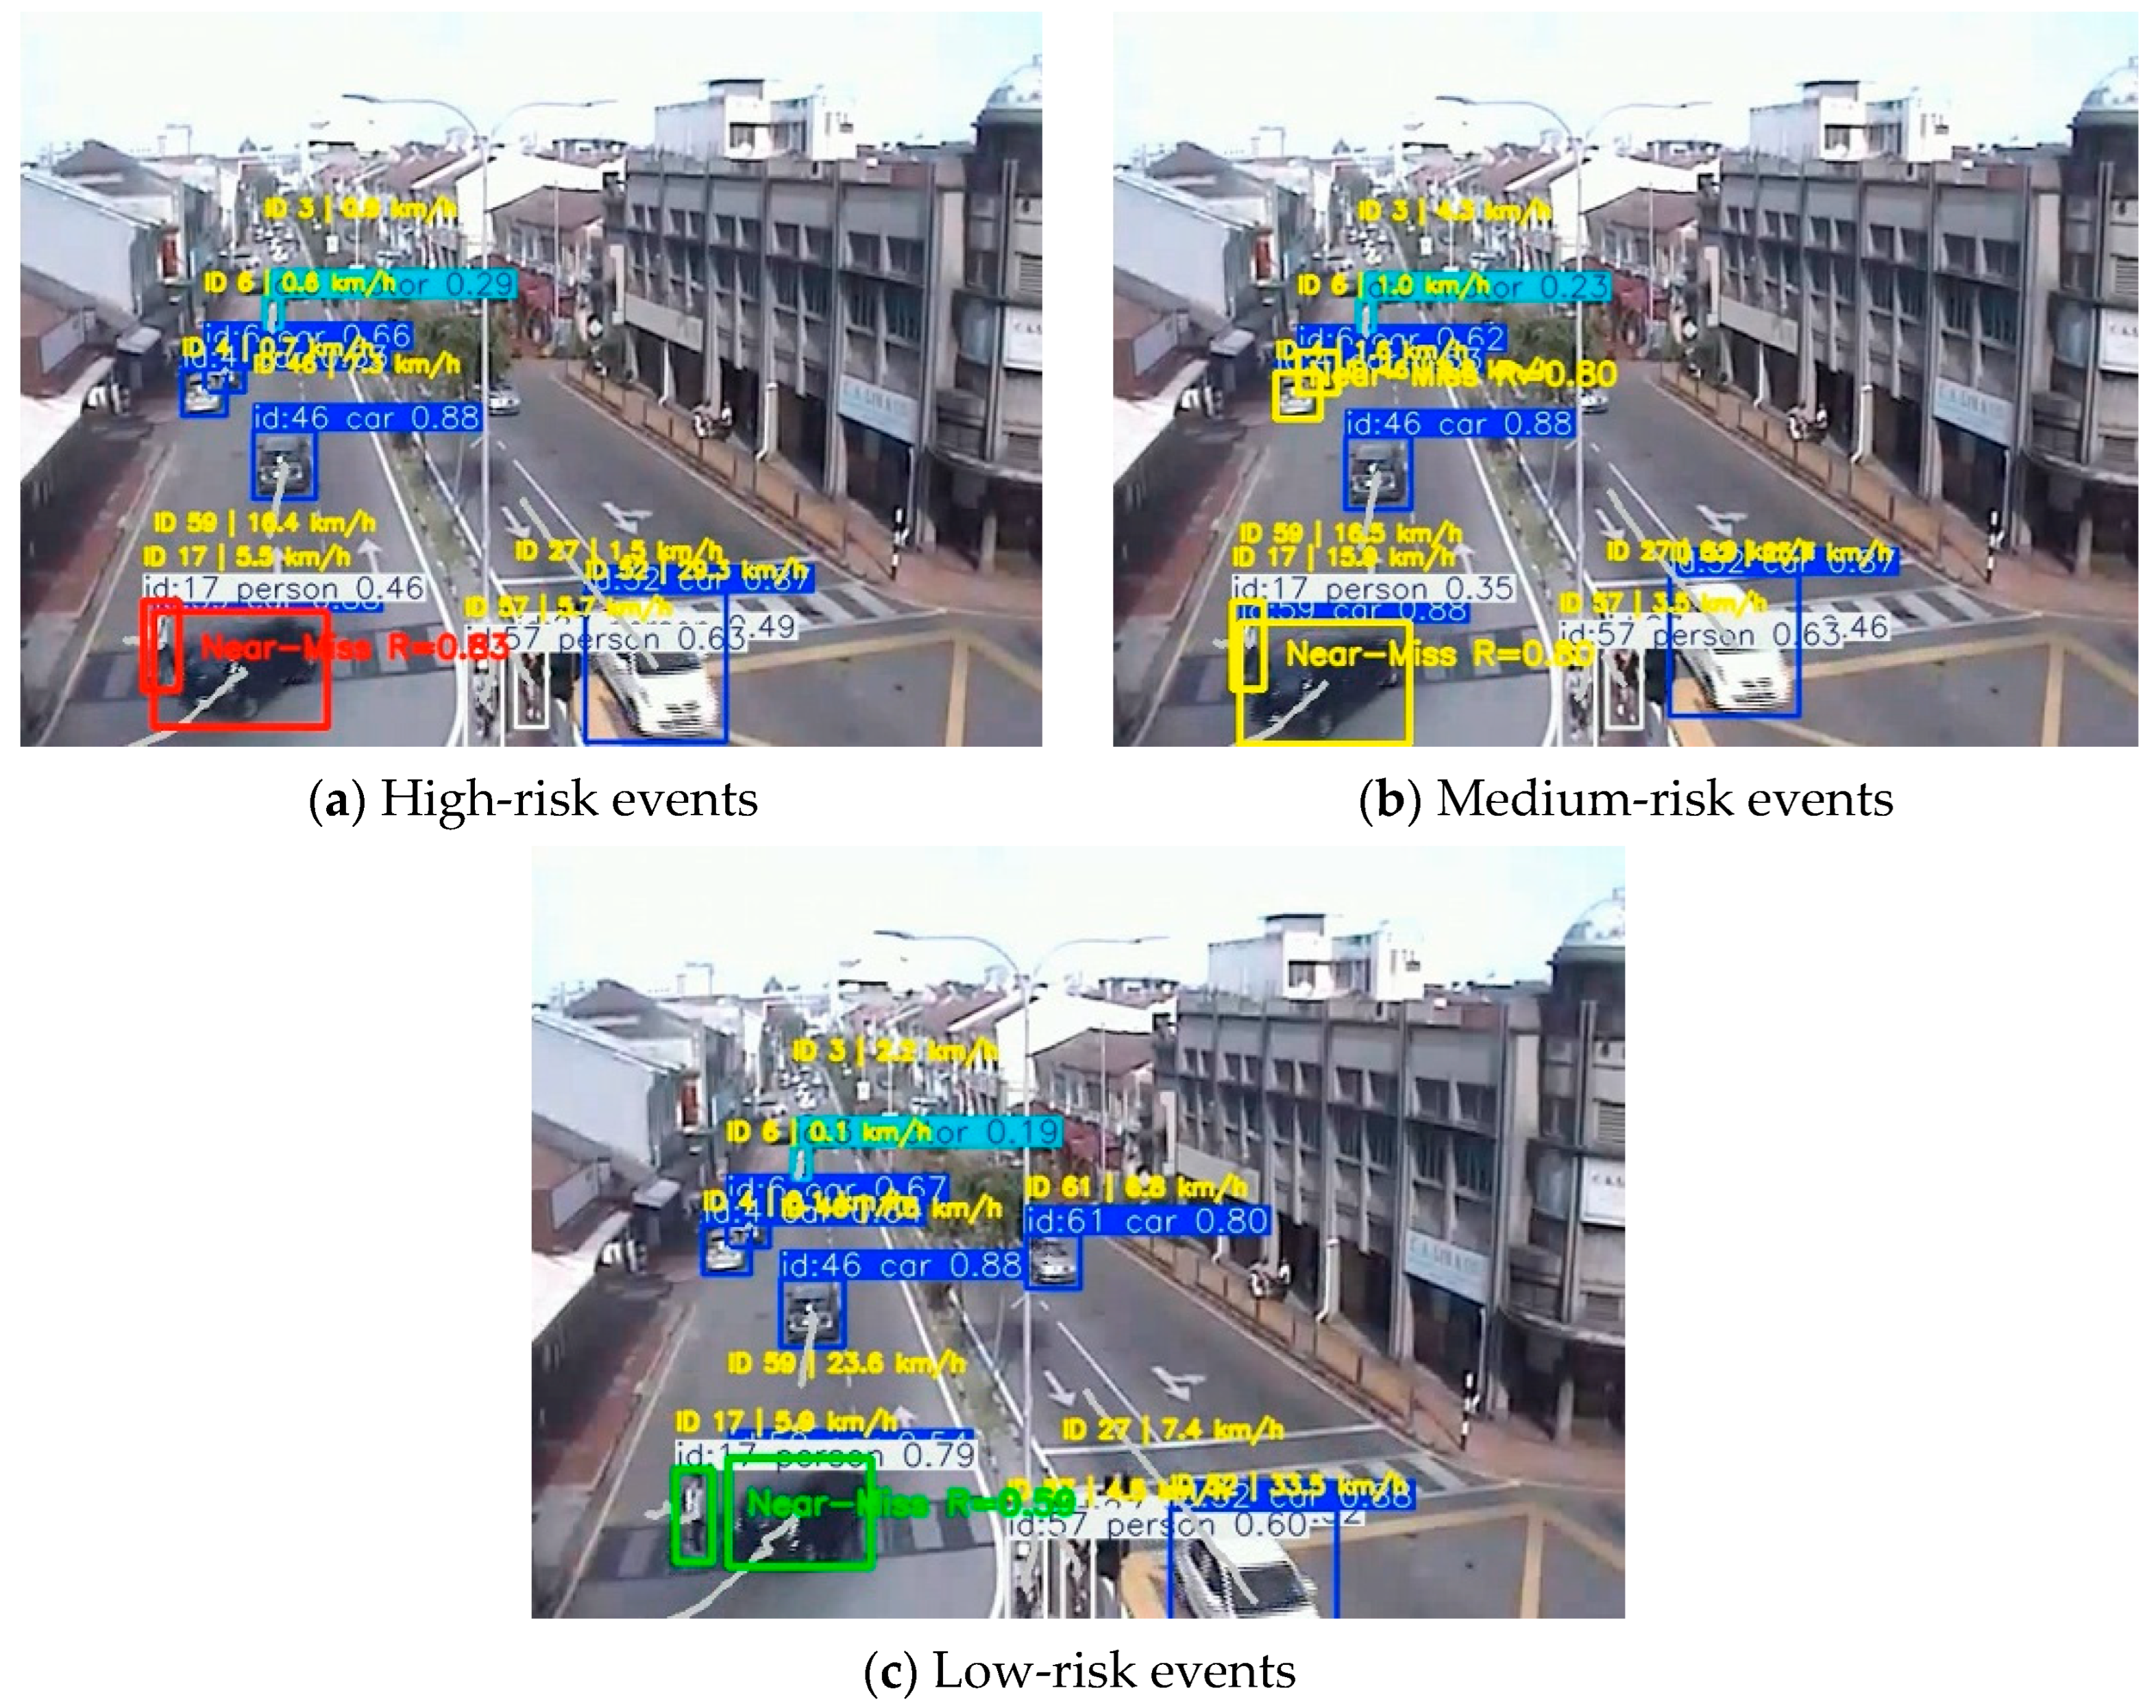
Despite these limitations, the proposed Near-Miss Risk Index offers advantages over classic Time-to-Collision measures by integrating spatial proximity, temporal urgency, and motion intensity into a continuous, interpretable risk score. Unlike TTC, which only estimates the imminence of a potential collision, NM-RI accounts for interactions among vehicles, motorcycles, and pedestrians, enabling finer prioritization of high-risk events. This makes the framework particularly useful for intelligent transportation systems and urban traffic safety monitoring, while also pointing to future improvements, such as validation under extreme conditions, enhanced small-object detection, and the integration of predictive trajectory modeling. Instead of center-to-center distance, the minimum edge-to-edge distance between bounding boxes is adopted to more accurately reflect the physical proximity of road users. This definition avoids false negatives when objects are spatially close but have distant centers, which is common in heterogeneous traffic scenarios. The experimental results are shown in
Figure 9 and
Figure 10.
Figure 9 and
Figure 10 illustrates representative near-miss events detected under different risk levels. In
Figure 10a, the red bounding boxes denote high-risk near-miss events, where road users are in extremely close proximity and exhibit very short time-to-collision (TTC). These scenarios typically correspond to sudden braking, rapid approach, or abrupt trajectory convergence, indicating an imminent collision risk.
Figure 10b presents medium-risk near-miss events, highlighted by yellow bounding boxes. In these cases, although no immediate collision is observed, the spatial distance between road users is relatively small and the TTC values indicate limited reaction time. Such interactions often occur during lane changes, merging behaviors, or motorcycle filtering, representing potentially dangerous but avoidable situations.
Figure 10c shows low-risk near-miss events, marked by green bounding boxes. These interactions are characterized by larger inter-object distances and longer TTC values, suggesting sufficient reaction time for road users. While these events do not pose immediate danger, they still reflect frequent traffic interactions and provide valuable information for traffic flow analysis and safety monitoring.
Overall,
Figure 10 demonstrates the effectiveness of the proposed risk assessment framework in distinguishing near-miss severity levels. The visual consistency between bounding-box colors and interaction intensity confirms that the proposed Risk Index can reliably reflect real-world traffic risk conditions.
5.4. Near-Miss Severity Level Analysis Results
Table 7 lists the predefined TTC thresholds used to classify near-miss risk levels for various types of road users, including vehicles, motorcycles, and pedestrians. The thresholds represent the critical time remaining before a potential collision, with smaller values indicating higher risk. These values provide a quantitative basis for the calculation of the Risk Index and support systematic near-miss event detection and severity assessment.
The TTC thresholds used in this study are chosen based on the reaction and braking characteristics of different road users as well as local traffic conditions in Penang, Malaysia. Specifically, a TTC threshold of 1.0 s is applied for interactions between motorcycles, 1.5 s for vehicle–vehicle interactions, 2.0 s for vehicle–motorcycle interactions, and 2.5 s for vehicle–pedestrian interactions. Motorcycles are highly maneuverable but have shorter stopping distances, so a lower threshold allows sensitive detection of high-risk near-miss events. Vehicles, in contrast, require longer stopping distances, and pedestrian safety requires earlier risk assessment due to their vulnerability, justifying higher thresholds. This tiered approach ensures that the TTC-based evaluation reflects the actual risk levels for different road-user interactions, balancing timely detection with the avoidance of excessive false alarms.
As shown in
Table 8 and
Table 9, high-risk near-miss events are characterized by extremely small spatial and temporal margins. For example, on Road 1, high-risk events have an average edge distance of only 0.28 px and a mean TTC of 0.0023 s, indicating almost immediate collision risk. In contrast, low-risk events on the same road present a much larger mean edge distance of 6.72 px and a TTC of 2.15 s, providing sufficient reaction time for road users. This clear difference across risk levels demonstrates that the proposed Risk Index effectively captures the severity of near-miss interactions.
Table 10 presents the number of near-miss events detected per 1800 frames, corresponding to one minute of 30 fps video. It should be noted that these counts represent detected instances within the video frames, rather than the actual number of events occurring per minute in real traffic. The results reveal distinct patterns of near-miss occurrences across roads and interaction types.
On Road 1, vehicle-related interactions dominate the detected near-miss events, particularly car–car and car–motor scenarios. For example, car–car interactions register 1594 high-risk and 1719 medium-risk instances per 1800 frames, indicating dense traffic and frequent close encounters. Car–motor interactions similarly show high counts, with 1801 high-risk and 1801 medium-risk instances, reflecting strong interactions between cars and motorcycles in mixed-traffic environments.
In contrast, Road 2 exhibits a different risk distribution. Car–motor interactions include 90 high-risk, 474 medium-risk, and 60 low-risk instances per 1800 frames, suggesting that while conflicts occur, most remain at moderate risk. Pedestrian-related near-miss events are less frequent overall; however, car–person interactions still show 43 high-risk instances per 1800 frames, highlighting potential safety concerns for vulnerable road users.
These findings demonstrate that the proposed near-miss detection framework effectively captures the characteristics of road-user interactions and the heterogeneity of risk across different traffic environments. Moreover, by leveraging high-frame-rate video, the method can detect transient or subtle near-miss events that might be missed at lower sampling rates, which underscores the robustness and practical applicability of the algorithm in complex, dynamic traffic scenarios.
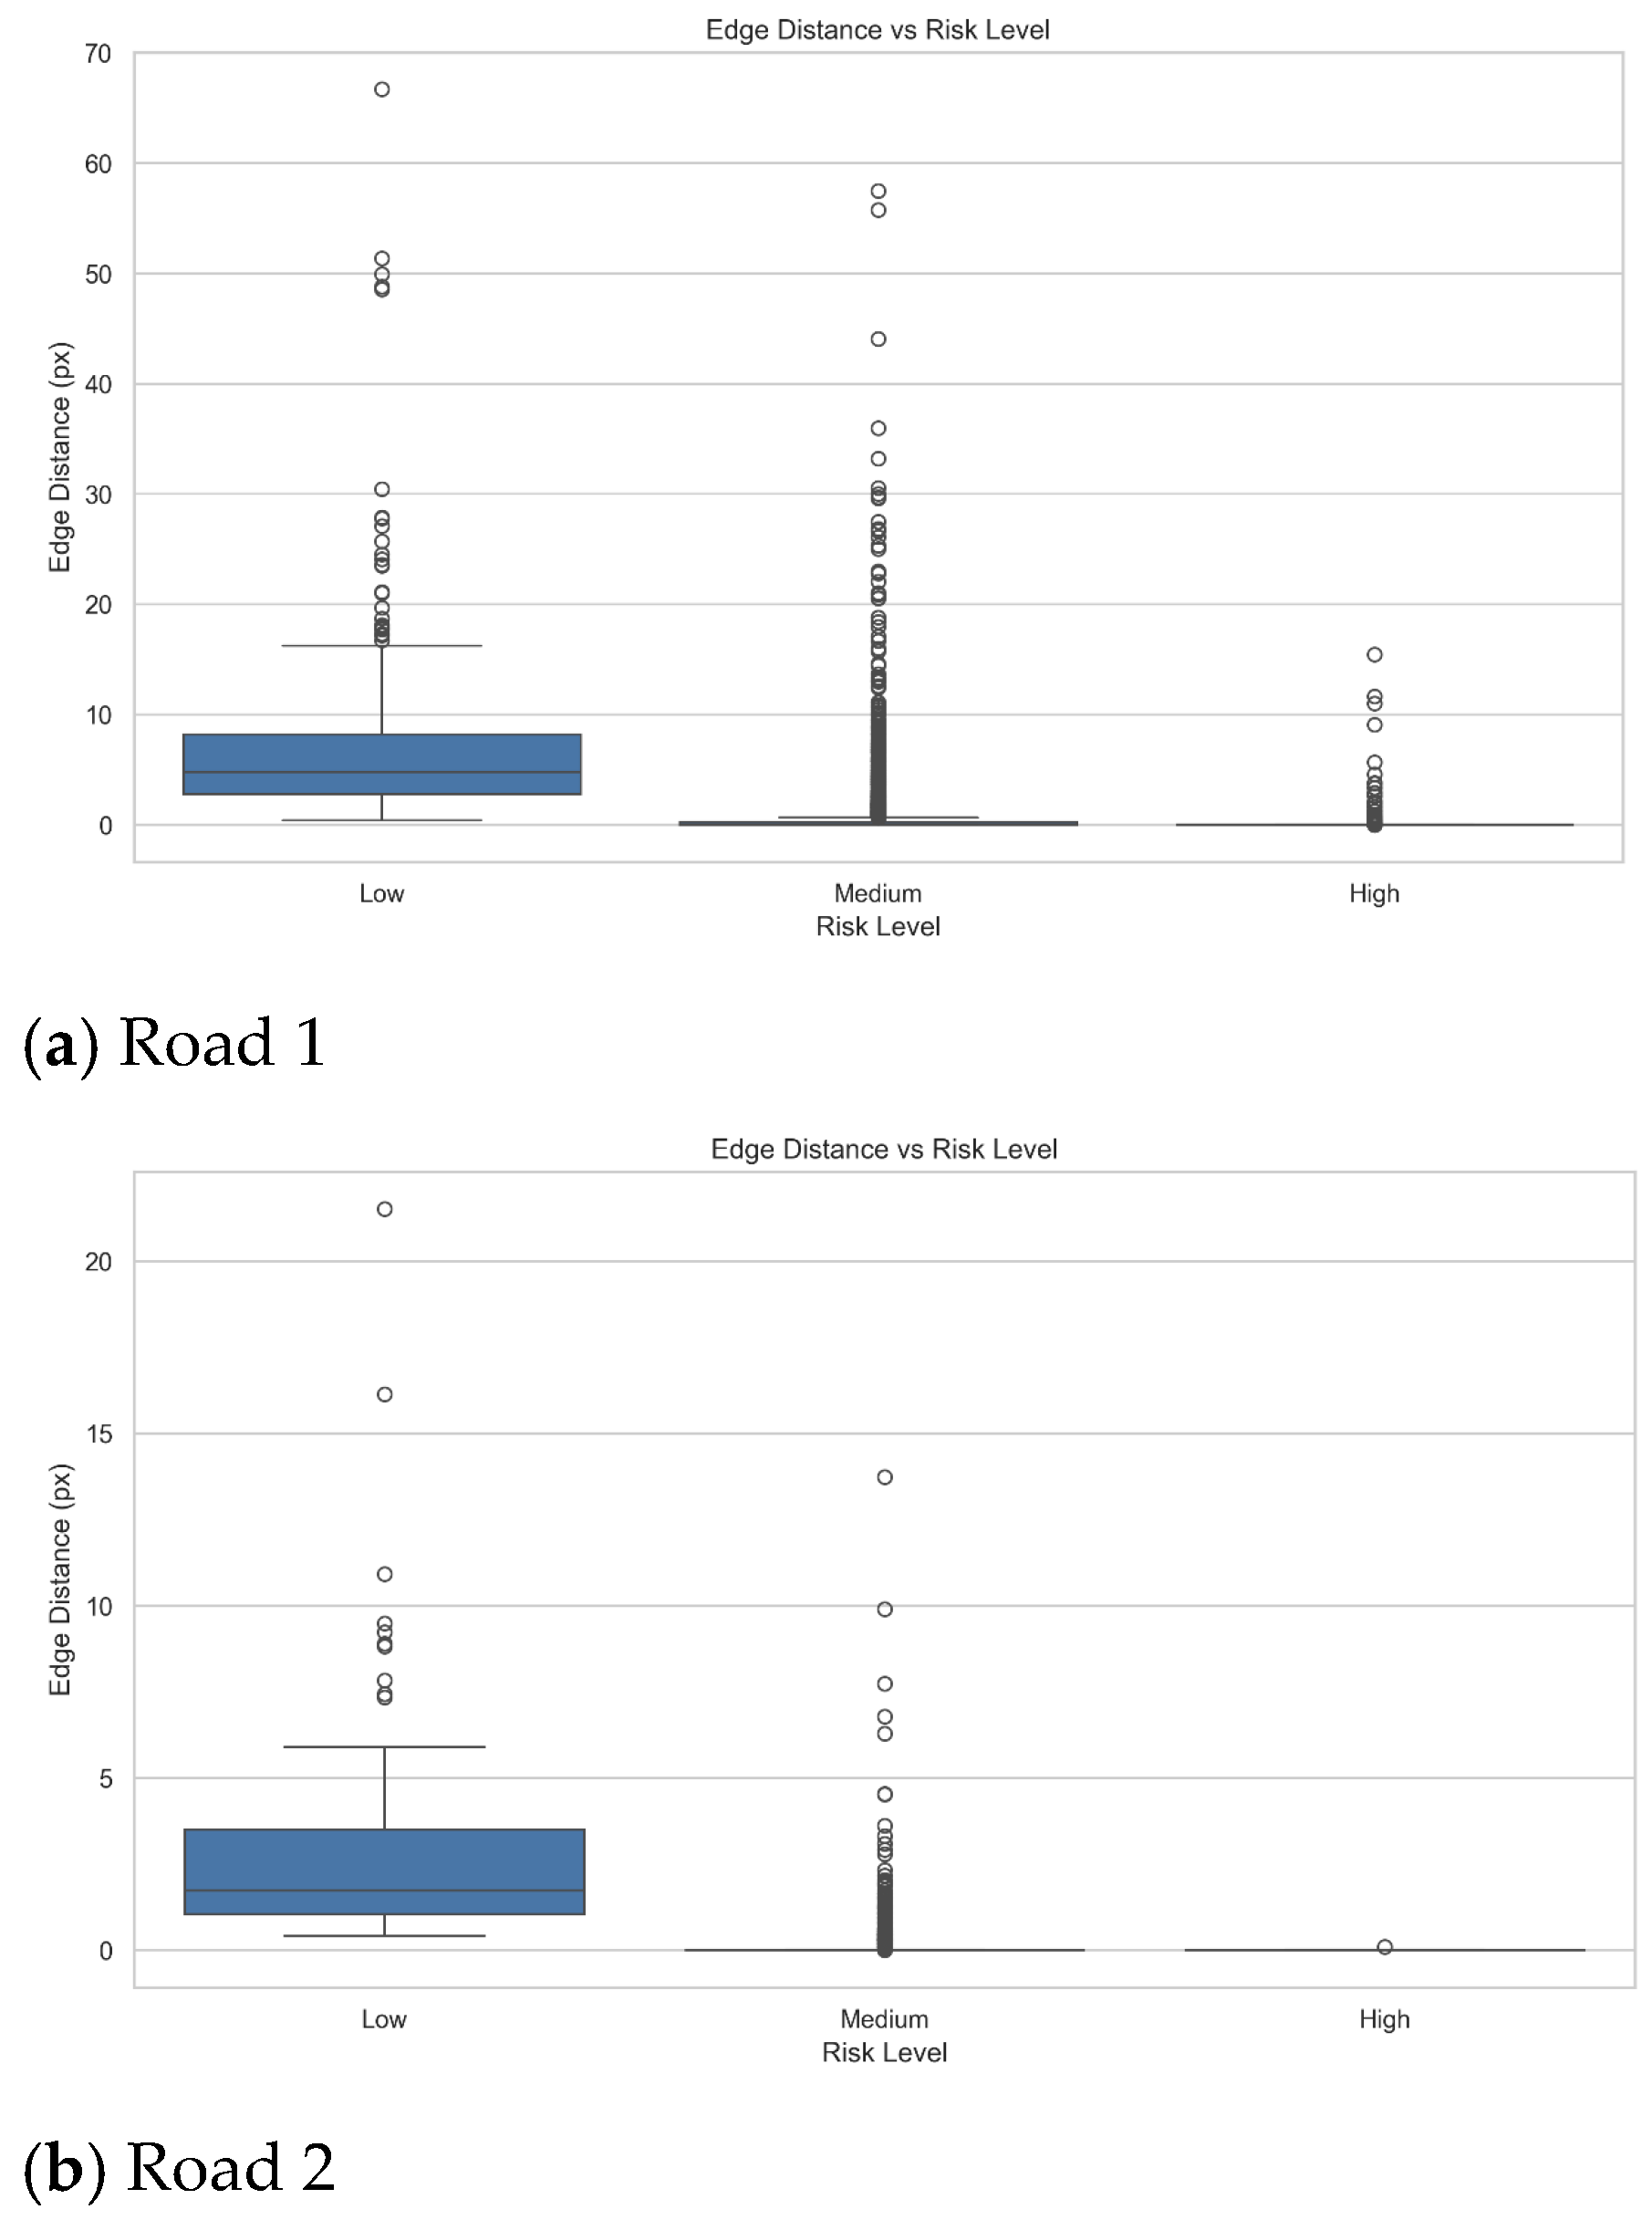
Figure 11 illustrates the distribution of edge distances—the minimum distances between vehicles, pedestrians, and motorcycles—corresponding to different near-miss risk levels (Low, Medium, High). The horizontal axis represents the risk levels, which are typically determined by combining Time-To-Collision (TTC) and edge distance into a Risk Index, while the vertical axis shows the edge distance in pixels, reflecting the closest approach between road users during each event. As expected, high-risk events exhibit smaller edge distances compared with low- and medium-risk events, indicating greater proximity and a higher potential for collision. Medium-risk events show edge distance distributions between the low- and high-risk levels. Overall, this figure provides a visual validation of the Risk Index and demonstrates its effectiveness in capturing the severity of near-miss interactions, offering valuable insights for traffic safety analysis and proactive risk warning.
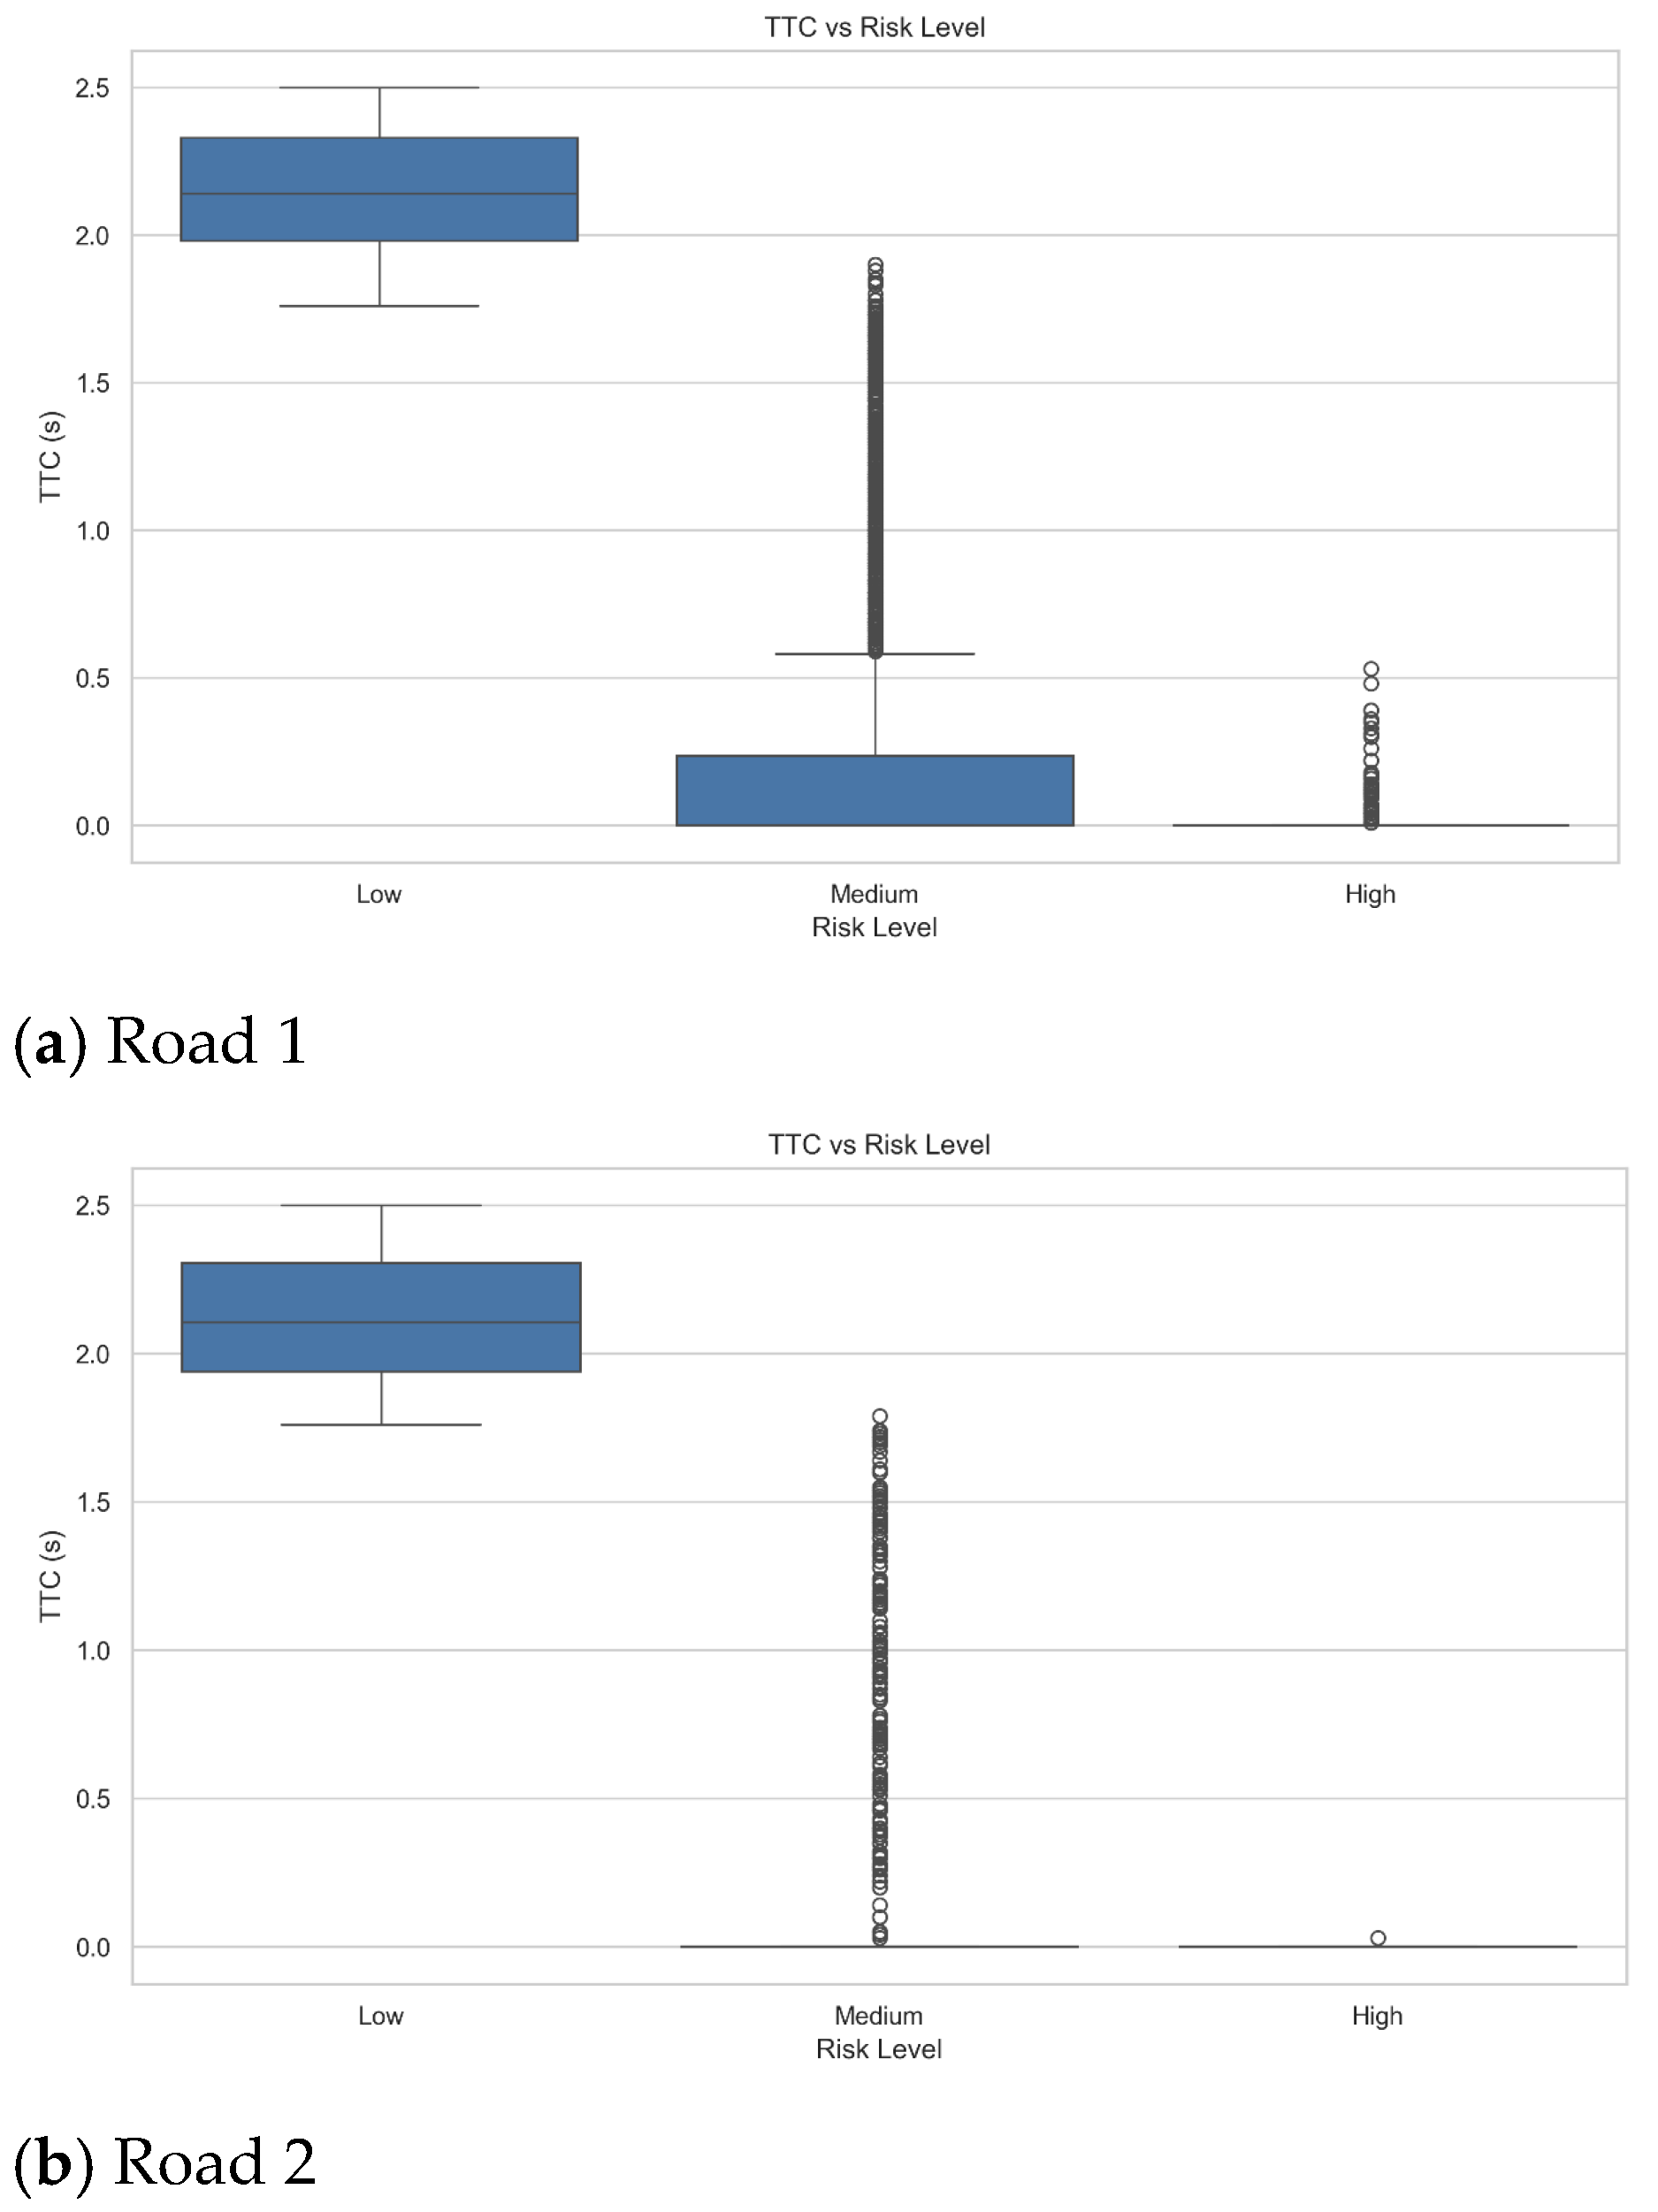
Figure 12 illustrates the distribution of Time-to-Collision (TTC) for near-miss events across different risk levels (Low, Medium, High). The horizontal axis represents the risk levels, while the vertical axis shows TTC in seconds, where smaller values indicate higher potential collision risk. The boxplot visualizes the median, range, and outliers of TTC for each risk category. As expected, high-risk events exhibit lower TTC values than medium- and low-risk events, indicating that collisions could occur within a very short time, representing highly hazardous scenarios. Conversely, low-risk events generally have larger TTC, suggesting that even when road users come close, there is sufficient time to react, resulting in lower accident potential. This figure provides a visual validation of the Risk Index and demonstrates its correlation with potential collision time, supporting the effectiveness of proactive warning and near-miss assessment.
In summary, the analysis of edge distance and Time-to-Collision (TTC) indicates that high-risk near-miss events are characterized by smaller spatial separations and shorter potential collision times, while low-risk events exhibit larger distances and longer TTC. These consistent trends across both indicators confirm that the proposed Risk Index effectively captures the severity of near-miss interactions. The results demonstrate that the algorithm can reliably differentiate between risk levels, providing a quantitative foundation for proactive traffic safety management and intelligent transportation interventions.