


Abstract
Urban traffic signal control heavily impacts vehicle emissions, yet most reinforcement learning models falsely assume flat terrain, ignoring the energy penalties of uphill stop-and-go driving. This omission creates a structural misalignment between generic, delay-focused rewards and the energetic realities of hilly corridors. In this work, we propose a topography-aware deep reinforcement learning framework that mitigates this hidden ecological cost. Our Context-Specific Reward Design procedure selects, normalizes, and calibrates reward terms based on physical conditions and traffic composition. The controller was trained using a microscopic simulation calibrated from video-derived traffic data, featuring a 3.8-degree uphill approach, 14,800 vehicles over 9 h, and a 20% heavy-vehicle fleet. In the uphill setting, the specialized controller reduced total CO2 emissions to 256.97 million milligrams, corresponding to 8.6% and 4.7% reductions relative to a pressure-based and a standard deep Q-learning controller, respectively. The proposed method also achieved the lowest mean trip duration of 72.09 s and a queue length of 1.31 vehicles. Welch’s t-tests confirmed that these CO2, duration, and queue improvements were significant. Overall, treating topography as a foundational design variable is crucial for sustainable urban mobility.
1. Introduction
Reducing CO2 emissions from urban traffic operations is essential for advancing sustainable mobility and meeting global sustainability targets [1]. Traffic signal control (TSC) is a highly effective intervention for city planners, mitigating local emissions and preventing queue spillbacks without expensive physical infrastructure modifications. However, the environmental impact of a signal timing plan depends not solely on traffic flow intensity, but heavily on the longitudinal road profile. The interaction between road gradients, speed regulation, and vehicle energy consumption demonstrates that slope-aware control logic can materially alter overall fuel use and emissions [2]. Recent studies similarly indicate that ascents and descents substantially affect microscopic vehicle behavior and emission formation in urban environments [3,4]. These investigations prove that ignoring topography leads to fundamentally incomplete transportation models [5,6].
Despite this physical reality, most deep reinforcement learning (DRL) controllers for signalized intersections erroneously assume a perfectly flat road network. This assumption is mathematically convenient but suppresses a source of environmental heterogeneity: uphill stop-and-go cycles impose a disproportionately high-energy penalty on heavy vehicles. Consequently, a controller optimized for flat-terrain proxies can remain throughput-efficient while silently producing avoidable emissions in hilly corridors. This omission is especially noticeable for intersections beneath an ascent, where a short red phase forces heavy trucks to restart under maximum powertrain load. Therefore, the problem under consideration in this research is the pronounced structural misalignment between generic delay-focused DRL rewards and the genuine energetic realities of non-flat urban geographies.
Highlighting the importance of presenting novel scientific contributions to address the raised problem is necessary, as relying strictly on traditional throughput metrics completely masks the asymmetric environmental damage caused by uphill restarts. Current literature suggests this gap is methodological. Recent surveys report substantial progress in DRL-based TSC but consistently note that precise reward engineering remains the primary determinant of robustness [7,8]. Furthermore, comparative studies confirm that a neural controller’s operational performance varies markedly depending on how well the reward reflects the genuine physical cost of traffic congestion [9,10]. To thoroughly mitigate these hidden ecological costs, it is crucial to introduce context-aware frameworks that naturally align the algorithmic learning objective with the physical mechanisms that generate emissions.
The goal of this study is to improve reinforcement-learning-based TSC in complex urban terrain by explicitly incorporating dynamic topography into the foundational reward design. To achieve the goal of the study, three major contributions are proposed:
- We formalize a topography-aware control model that systematically separates static geometric information from dynamic traffic flow descriptors, ensuring that the approach slope is actively available to state construction and reward selection.
- We propose a Context-Specific Reward Design (CSRD) procedure that intelligently selects appropriate reward components, rescales them to comparable numeric ranges, and precisely calibrates their weights under explicit performance constraints.
- We validate the specialized controller through an extensive simulation study that compares flat and uphill configurations, quantifies slope sensitivity, and executes robust statistical significance tests to confirm core performance gains.
To guarantee practical relevance, the simulated fleet features a realistic composition of passenger cars and heavy trucks instantiated through the urban mobility simulation package called Simulation of Urban MObility (SUMO) [11] and its integrated Handbook Emission Factors for Road Transport (HBEFA) emission profiles [12]. The target intersection is a four-way junction with a dedicated uphill approach, driven by dynamic traffic demand built from empirical, video-derived movement patterns. SUMO was strategically chosen because its high-fidelity microscopic vehicle dynamics can be directly coupled through Traffic Control Interface (TraCI) to a continuous DRL loop [13,14]. This combination is essential: the controller must be trained within a digital model in which topography materially alters the energetic consequences of congestion [15]. This study is therefore a targeted, mechanistic investigation of whether terrain-aware reward engineering yields measurable and statistically defensible CO2 reductions.
The remainder of this paper is organized as follows. Section 2 reviews TSC, DRL-based control, and machine-learning studies concerned with environmental performance. Section 3 presents the topography-aware model, the CSRD procedure, the calibration data, and the simulation setup. Section 4 reports the main simulation results, including slope-sensitivity and statistical tests. Section 5 discusses scalability, heterogeneity, and deployment issues. Section 6 concludes the study.
2. Related Works
2.1. Traffic Signal Control at Intersections
The classical signal control problem for urban intersections has been comprehensively reviewed over recent years, covering fixed-time timing plans, standard traffic-actuated logic, fully adaptive control mechanisms, and modern data-driven strategies [16]. Among the varied classical approaches, researchers have successfully developed interpretable fuzzy-rule controllers to manage localized uncertainties gracefully [17]. Additionally, game-theoretic formulations have been actively applied to resolve conflicting phase demands effectively [18]. Other advanced methodologies have heavily utilized evolutionary strategies and heuristic optimization techniques to efficiently navigate complex, high-dimensional signal search spaces [19,20]. Similar mathematical control designs have further expanded these robust baselines to ensure strict real-time adaptability [21,22]. Intelligent rule-based frameworks continue to be utilized prominently because they remain highly transparent and relatively simple to deploy in practice [23]. However, they fundamentally depend on rigid, predetermined relationships between measured traffic variables and executed control actions, substantially limiting their operational adaptability under highly volatile, nonstationary traffic states.
Among adaptive heuristic baselines, Max-Pressure (MP) control has become particularly dominant and significant in recent benchmark evaluations. As extensively summarized by Levin, this distinct signal-timing approach provides mathematically proven network-throughput guarantees and has evolved from idealised store-and-forward paradigms to realistic formulations incorporating cyclic operations [24]. By strictly selecting the specific phase that aggressively relieves the largest accumulated queue imbalance between upstream incoming and downstream outgoing movements, it seamlessly prevents cascading network gridlocks [25]. Because of its remarkably robust theoretical foundations and incredibly modest computational execution cost, it naturally serves as an excellent benchmark for subsequent reinforcement-learning evaluations. Yet, this approach remains intentionally agnostic to exact vehicle mass, complex terrain features, and the highly asymmetric restart costs forcefully created by steep topographical inclines.
2.2. Deep Reinforcement Learning for Traffic Signal Control
DRL has rapidly become the dominant technological paradigm for creating adaptive TSC models, primarily because it seamlessly learns sophisticated control policies directly from continuous state-action interactions [7,8]. The rapidly expanding literature covers distinct value-based methods, advanced actor-critic architectures, and robust multi-agent coordination schemes [26,27]. Single-intersection applications frequently utilize deep Q-learning setups to optimize basic phase selections securely [9,28]. Meanwhile, decentralized approaches have creatively utilized pressure-inspired reward formulations to scale seamlessly across massive road networks without overwhelming central servers [29,30]. To further push boundaries, researchers have jointly optimized both the phase sequence and corresponding green timing duration using multi-faceted DRL frameworks [10,31].
The fundamental theoretical underpinnings of these advanced controllers rely rigorously upon the standard mathematics of sequential decision-making. The traffic controller fundamentally interacts with its surrounding urban environment as a Partially Observable Markov decision process (POMDP), a seminal concept deeply rooted in Bellman’s original dynamic programming formulations [32]. Modern deep value approximations universally follow the breakthrough deep Q-learning paradigm initially popularized by Mnih et al. [33]. Recent studies have diversified these foundational models by heavily modifying their core algorithmic structures. For instance, sophisticated multi-agent communication networks allow adjacent intersections to organically exchange hidden states [34,35]. Other compelling approaches employ mean-field theories or complex fairness-aware perception logic to precisely balance massive grid operations gracefully [36,37]. Additionally, recent transit investigations independently verify that explicitly engineered physical rewards dramatically improve overall learning stability and operational safety margins [38,39].
2.3. Machine Learning for Emission-Aware Urban Control
A highly parallel line of research has strategically focused on embedding carbon or energy objectives directly into dynamic transport control frameworks. Commonly, standard queue-based and wait-time penalty rewards indirectly attempt to reduce atmospheric emissions by suppressing prolonged vehicle idling periods [40,41]. Conversely, multi-objective formulations explicitly blend throughput efficiency, intersection safety, and active decarbonization into unified algorithmic penalty signals [42,43]. Outside of direct signal control algorithms, detailed infrastructure-aware eco-driving methodologies conclusively prove that road slope and speed limits interact to heavily dictate aggregate energy demand profiles [2]. Despite these notable advances, recent comprehensive evaluations explicitly report that simple stop counts and delay structures frequently serve as significantly more stable proxies than attempting to perfectly measure highly volatile raw emissions alone [44,45]. Table 1 precisely summarizes representative DRL studies elegantly implemented in SUMO, distinctly highlighting the incredibly common omission of explicit gradient-aware reward engineering.
Table 1.
Representative DRL studies implemented in SUMO for TSC. D3QN stands for Dueling Double Deep Q-Network, DTSE means Distance To Stop-line Estimation, PG denotes Policy Gradient, and PER represents Prioritized Experience Replay.
2.4. Research Gap and Study Motivation
The thoroughly surveyed literature firmly highlights several unresolved gaps that strongly motivate this study. First, the vast majority of DRL-TSC formulations still universally treat the entire physical terrain as perfectly flat. Second, complex algorithmic reward functions are frequently described at the final overarching formula level, tragically leaving the underlying selection and numeric calibration processes thoroughly underspecified. Third, video-derived empirical calibration data are repeatedly mentioned in recent studies but are rarely meticulously summarized for external reproducibility. Finally, numerous studies simply report raw outcome means and standard deviations, but conspicuously omit the necessary formal statistical significance tests. Thus, the objective of this study is to formulate and implement an environmentally focused, topography-aware DRL approach to urban TSC.
To properly fulfill this objective, the research methodology is decomposed into four main tasks: (i) design the foundational state-action space to physically capture and reflect localized terrain descriptors; (ii) develop the CSRD procedure to dynamically select and rigorously calibrate designated penalty terms based exclusively on observed slope variations and heavy-vehicle traffic volumes; (iii) establish a phenomenally robust, functionally stable SUMO-based microscopic simulation model utilizing exact empirical, video-derived traffic demand data streams; (iv) evaluate the finalized operational framework against well-established adaptive controllers through slope-sensitivity modeling and exact mathematical statistical analyses. Overall, this strategic, holistic approach ensures that the localized physical mechanisms driving excessive vehicle emissions are mitigated without simultaneously degrading the overarching intersection mobility factors.
3. Materials and Methods
3.1. Conceptual Architecture of the Approach
The proposed method relies on two distinct input streams: static and dynamic. Static inputs, including lane geometry, permitted maneuvers, and approach slope derived from topographic surveys, establish the structural context. They are utilized to generate the SUMO network, define the action space, augment state observations, and guide reward selection through the CSRD module. Dynamic inputs, such as video-derived lane demand, turning proportions, vehicle-class shares, and approach speeds, provide time-varying signals that drive route generation and build the scenario library.
Distinguishing between these inputs is crucial, as their roles are often conflated in learning-based traffic-control workflows. While dynamic variables, such as queue lengths and class shares, change continuously across episodes, static inputs operate as a constant structural foundation throughout the entire training process. They establish the physical conditions, such as the presence of uphill segments, ensuring the policy understands site-specific constraints rather than just generic congestion patterns, as outlined in Figure 1.
Figure 1.
Schematic overview of the proposed approach. Within this procedure, a DQN agent interacts with a SUMO simulation environment and a CSRD module that evaluates physics-based uphill penalties. The agent ultimately leverages these structured observations and calibrated rewards to select optimal discrete traffic signal phases.
This fundamental separation extends naturally to real-world deployment. Static descriptors require updates only following physical infrastructure or regulatory changes, whereas dynamic descriptors refresh continuously via real-time sensors. By bridging long-term context with short-term states, the controller recognizes that identical queues yield vastly different environmental impacts depending entirely on the physical approach gradient. Topography-aware control successfully exemplifies this essential principle.
Furthermore, as depicted in Figure 1, the approach constitutes a fully integrated pipeline rather than an isolated model component. It systematically combines empirical data calibration for realistic traffic generation, consistent mathematical formalization to link the physical context with specific reward terms, and the CSRD module to perfectly align the learning objective with local environmental mechanisms. Removing any of these core components would obscure the slope-specific effects and significantly diminish the practical value of the trained policy.
3.2. Formalization of the Model
This subsection introduces a single, consistent notation for the controller, the environment, and the validation metrics. The intent is to remove symbol overload and to ensure that every quantity appearing later in the reward, algorithms, and evaluation section can be traced back to a clearly defined object. The formulation follows the standard sequential-decision perspective of reinforcement learning [32,33], but adapts it to the partially observed and lane-structured nature of the intersection problem. Table A1 in Appendix A summarizes the most important symbols before the state, action, and reward components are defined in Equations (1)–(9).
The control problem is modeled as a POMDP and formalized as follows
where is the latent traffic state space, is the observation space, is the discrete action space of feasible signal phases, P is the state-transition kernel induced by traffic dynamics in SUMO, maps the latent state to an observation, and r is the immediate reward.
Formalization in Equation (1) resolves prior symbol overloading by assigning a unique symbol to each concept throughout this paper.
3.2.1. Observation Space
At decision step t, the latent state is represented in Equation (2) as
where contains time-invariant intersection descriptors, contains time-varying traffic descriptors, and is the currently active signal phase.
The static descriptor is
where is the signed longitudinal slope of incoming lane ℓ and is the set of admissible outgoing movements from that lane.
Positive denotes an ascent, negative a descent, and a flat approach. The dynamic descriptor of lane ℓ is
with the queue length, the cumulative waiting time, the mean speed, the instantaneous CO2 emission (calculated as the sum of emissions of all individual vehicles currently on that lane, i.e., ), and and the numbers of start and stop events observed on uphill segments.
The observation delivered to the agent is then written in Equation (5) as
The simulated vehicle set contains two classes in the present study: passenger cars and heavy trucks. This deliberately simple fleet composition makes the interaction between slope and vehicle mass easy to identify, while the mathematical formulation itself remains agnostic to the number of vehicle classes. Additional classes can be inserted by extending the route file and the HBEFA profile list.
The distinction between the static descriptor in Equation (3) and the dynamic descriptor in Equation (4) is important for later sections. Static variables do not change during a run and can therefore be computed once when the network is instantiated. Dynamic variables evolve every simulation step and are the quantities on which the reward in Equation (7) is ultimately evaluated. Figure 2a visualizes the lane-level mapping between geometry and dynamic measurements, whereas Figure 2b shows the instantiated four-way site used in the experiments.
Figure 2.
Schematic representation of the observation model: (a) lane-level mapping between slope, queue, and admissible movements; (b) four-way intersection layout used in the simulation study.
This separation makes the topography term operationally efficient: slope information is always available to the agent and to the reward logic, but it does not increase online estimation noise.
3.2.2. Action Space
The action is the index of the next feasible signal phase and is defined in Equation (6) as
where K is the number of admissible phases for the intersection.
For the four-way junction considered here, and the phases correspond to the protected straight/right and left-turn movements shown in Figure 3. Yellow and all-red intervals are handled by the simulator as fixed safety transitions and are therefore not optimized directly.
Figure 3.
Illustrative example of typical discrete traffic signal phase configurations allocated to a standard four-way intersection: (a) primary straight and right-turn; (b) primary protected left-turn; (c) secondary straight and right-turn; and (d) secondary protected left-turn. Green and red arrows indicate permitted and prohibited vehicle movements, respectively.
Restricting the action space to admissible green phases keeps the policy aligned with engineering practice. The controller decides which movement group should receive service next, while minimum-green, yellow, and clearance intervals remain encoded as safety logic in the simulator. This separation is useful because it prevents the learning agent from exploiting unrealistic timing shortcuts and ensures that the learned policy can be interpreted directly as a signal-phase sequencing strategy.
The reward is formulated as a weighted sum of normalized penalties:
where represents a raw traffic or emission metric, is a scaling divisor, denotes the specific weight, and is the set of active reward components.
Unlike standard discount factors, these coefficients are calibrated, nonnegative penalties explicitly selected by the CSRD procedure. Normalization via prevents large-magnitude values, such as emissions, from overshadowing smaller metrics like waiting time.
For flat or weakly sloped environments, the universal reward utilized in Scenarios 1 and 2 is:
where and .
Thus, the uphill-specialized controller employs a topography-aware reward:
where is the queue length, and and count uphill starts and stops.
Equation (9) excludes direct CO2 penalties because pilot tests revealed they cause numerical instability. Instead, it targets the specific mechanical events driving emissions on ascents.
The rationale behind Equations (8) and (9) is deeply mechanistic. On flat terrain, prolonged idling primarily drives emissions, making wait times and queues acceptable proxies. On uphill approaches, however, overcoming inertia and grade resistance makes vehicle restarts vastly more expensive than minor waiting delays. Consequently, Equation (9) prioritizes smoother service profiles to minimize these discrete high-cost events, particularly for heavy vehicles.
Furthermore, the coefficient values in Equation (9) reflect a balanced ecological objective. Waiting time is heavily penalized to ensure operational efficiency and prevent endless red lights that trivially avoid restarts. Queue length serves as a secondary stabilizer against spillbacks. The symmetric penalties for uphill stops and starts reflect their coupled undesirability: stopping forces a high-cost restart, and restarting directly incurs it.
Finally, this dual-reward design offers excellent portability. The universal configuration in Equation (8) seamlessly handles flat sites. In contrast, the specialized form in Equation (9) is conditionally activated by the CSRD module only when a significant uphill grade and sufficient heavy-vehicle traffic demand its use, successfully preventing unnecessary over-specialization.
3.2.3. Architecture of the Deep Learning Model
The controller uses a DQN trained independently for the target intersection. The observation is encoded as a tensor whose height equals the number of incoming lanes and whose width equals the number of lane-level dynamic indicators. A convolutional layer with 64 filters of size extracts local spatial interactions across approaches, followed by flattening and two fully connected layers of width 64 with rectified linear unit activation. The output layer returns one Q-value per feasible signal phase. Action selection follows an -greedy policy during training and a greedy policy during evaluation.
This architecture was selected because the controlled site is small enough that a compact convolutional encoder can capture the most relevant spatial dependencies without the additional overhead of graph neural networks or recurrent sequence models. The lane ordering is fixed by the intersection geometry, so local convolution is sufficient to learn how queues and uphill events on one approach interact with competing movements on the others. In larger corridor or network settings, the same local encoder could be nested within a hierarchical or graph-based controller, but for the present single-node case the compact DQN offers a transparent baseline for isolating the effect of the reward design itself.
3.3. Implementation Methods
3.3.1. Method for Determining the Static Configuration of an Intersection
Only the empirical pipeline was used in the present simulation study. It assigns a unique identifier to the intersection, enumerates incoming and outgoing lanes, extracts the permitted maneuvers from signs and markings, and records the longitudinal slope of each approach from topographic data. The automatically inferred branch shown in Figure 4 is included only as a future deployment extension and is therefore displayed as a dashed block rather than a core processing stage. This change separates the implemented workflow from the automation pathway.
Figure 4.
Static-configuration pipeline used in this study, with future automation shown as a dashed extension.
3.3.2. Method for Generating Dynamic Movement Patterns
We generated dynamic traffic patterns from video-derived empirical descriptors. Instead of using fully random demand, the calibration process recorded traffic intensity, turning proportions, vehicle-class composition, and approach speeds over set time windows. These variables then defined the SUMO route-generation rules. Table A2 in Appendix A summarizes this calibration link, with detailed data provided in Table A7 and Table A8 of Appendix B.
Figure 5 illustrates a data-reduction pipeline. Raw visual observations are heterogeneous, containing both discrete (e.g., class labels) and continuous, noisy variables (e.g., speed estimates). To be useful for DRL, these data must become stable, reproducible descriptors. Rather than reconstructing exact trajectories, our conservative approach extracted lane-level intensity, turning proportions, vehicle shares, and speeds. These descriptors formed route-file rules that produced comparable, non-identical SUMO realizations.
Figure 5.
Dynamic-pattern generation from video-derived calibration variables.
This methodology prevents the controller from overfitting to a single recorded traffic day. Instead, it learns from a family of realizations that retain the site’s structural properties. The descriptors in Table A2 (Appendix A) maintain demand directionality and heavy-vehicle exposure (important for analyzing the uphill lane), while allowing stochasticity in arrival times. This ensures the simulation remains empirically grounded yet sufficiently variable for robust policy learning and statistical comparison.
To ensure reproducibility, Table A2 outlines the variable types, and Table A3 in Appendix A details the specific quantities transferred to the simulator. Unlike studies that omit intermediate data, this mapping transparently connects the static configuration from Section 3.3.1 with the dynamic calibration described in Section 3.3.2.
This clearly links the empirical data with the static configuration workflow. Site surveys provide structural features such as slope and lane identity, while video descriptors provide the route-generation rules. Both elements are strictly necessary: a topography-aware reward requires a calibrated traffic mix, and the effect of heavy vehicles only emerges when the network includes uphill geometry.
3.3.3. Method of Simulation and Training of a DRL Agent in the SUMO Environment
Training involves iterative interactions with the SUMO microscopic simulator via TraCI v1.24.0 [13]. Once the network and route files are initialized, the agent cycles through phase selection, simulation advancement, reward evaluation, and replay-based optimization. Static slope descriptors directly influence both the network physics and the reward terms selected by CSRD.
Algorithm 1 explicitly details the static descriptor’s role, which is visually complemented by Figure 6. Although the slope is integrated only during network construction, its impact persists throughout training by altering microscopic vehicle dynamics. These dynamics directly determine the observed , , and uphill event counts. Therefore, terrain must not be treated as a mere auxiliary annotation; it fundamentally dictates both the generative environmental dynamics and the interpretation of observed traffic states.
| Algorithm 1 Simulation and training procedure for the DRL agent |
| Require: : static intersection descriptor; : scenario library; : reward weights; : numbers of episodes and simulation steps. |
| 1: Build the SUMO network from and assign the edge slopes . |
| 2: Generate one route file for each scenario using the calibrated demand descriptors. |
| 3: Initialize the Q-network parameters , target network parameters , and replay buffer B. |
| 4: for episode to E do |
| 5: Start SUMO and sample one scenario from . |
| 6: Observe . |
| 7: for step to T do |
| 8: Select using an -greedy policy derived from . |
| 9: Apply and advance the simulator for internal time steps. |
| 10: Read the updated observation and compute the reward . |
| 11: Store in B. |
| 12: Sample a minibatch from B and minimize the Bellman mean-squared error. |
| 13: Periodically update the target network . |
| 14: Set . |
| 15: end for |
| 16: Stop SUMO. |
| 17: end for |
| Ensure: Trained controller for the target intersection and reward configuration. |
Figure 6.
Training loop connecting the SUMO simulator, the reward module, and replay-based Q-learning.
While localized to a single intersection, this training loop easily adapts to larger deployment architectures. Offline Q-network training is computationally intensive, but online action selection requires only a single forward pass through a compact, lane-structured state tensor. Consequently, adding static terrain channels does not noticeably increase the controller’s inference burden. This computational efficiency ensures scalability for multi-intersection settings, as further discussed in Section 5.
3.3.4. Context-Specific Reward Design Algorithm
CSRD was introduced because direct multi-objective rewards can become numerically unbalanced. In pilot runs, raw emission values were several orders of magnitude larger than waiting-time values; consequently, an unnormalized reward caused the controller either to ignore the secondary terms or to oscillate. CSRD addresses this in three stages, which are summarized graphically in Figure 7 and procedurally in Algorithm 2.
Figure 7.
CSRD workflow for component selection, normalization, and constrained weight calibration.
First, it selects candidate reward terms from the physical context. If a meaningful uphill approach is present and truck share is elevated, the algorithm promotes uphill start and stop events to first-order terms. Second, it assigns divisors so that normalized components fall into comparable numeric ranges during dry runs. Third, it calibrates the weights against explicit traffic-efficiency constraints rather than by unconstrained trial and error.
| Algorithm 2 Context-Specific Reward Design and Calibration |
| Require: Static descriptor ; scenario library ; candidate metrics ; constraint tolerances . |
| 1: Identify the dominant environmental mechanism from the site context. |
| 2: if uphill approaches are present and truck exposure is non-negligible then |
| 3: Activate terrain-sensitive penalties for uphill starts and stops. |
| 4: else |
| 5: Retain a universal reward composed of emission and delay surrogates. |
| 6: end if |
| 7: Run dry simulations and estimate the order of magnitude of each active metric. |
| 8: Assign divisors to map all normalized components to comparable ranges. |
| 9: Build a candidate set of weight vectors . |
| 10: for each candidate vector do |
| 11: Train and validate the controller on the scenario library. |
| 12: Compute and check the duration and queue constraints. |
| 13: end for |
| 14: Select the feasible candidate with minimum and refine locally if needed. |
| Ensure: Calibrated reward . |
The weight-selection stage can be written as the constrained search in Equation (10) over candidate vectors ,
subject to and .
In Equation (10), , , and denote normalized validation metrics for emissions, duration, and queue length, respectively. The baseline values and represent the average duration and queue length obtained from the baseline MP controller or the uncalibrated dry-runs. Furthermore, and are penalty weights for the operational constraints, set to and , respectively, during calibration. In practice, was explored by a coarse-to-fine grid guided by the dry-run orders of magnitude. The accepted sequence of candidates is documented in Table A9 and Table A10 in Appendix B. This formulation makes explicit why the final coefficients were chosen and how the same procedure can be transferred to a different intersection.
3.4. Simulation Framework and Evaluation Setup
3.4.1. Baseline Approaches
The proposed method is compared against three baselines. The first is MP, a pressure-based adaptive controller with strong throughput guarantees and a long methodological development history [24,25]. As recognized in recent literature reviews, MP control refers to a mathematically proven signal-timing strategy that aggressively relieves the largest accumulated queue imbalance between upstream and downstream movements without requiring a learning phase [24]. For visual brevity in the subsequent data tables, this method is abbreviated as MP. The second is MPLight, which extends pressure-based ideas to a decentralized multi-intersection DRL setting [29]. The third is a standard DQN agent using a universal reward and no explicit terrain terms [28]. This baseline isolates the contribution of the contextual reward design from the contribution of deep Q-learning itself, utilizing the standard reinforcement-learning architecture initially popularized by Mnih et al. [33].
These baselines were chosen to span three distinct control philosophies. MP represents a strong non-learning adaptive rule with known throughput properties; MPLight represents a modern DRL design rooted in pressure ideas and is included because it is often used as a reference point in the literature even when the present study is local rather than network-wide; and the standard DQN provides the cleanest ablation for the question of interest, namely whether contextual reward engineering adds value beyond a conventional deep Q-learning controller. This combination makes the comparative study interpretable because each baseline removes a different element of the proposed pipeline.
3.4.2. Evaluation Metrics and Statistical Analysis
Four primary metrics are reported. Total CO2 emissions, the environmental objective, are
where V is the vehicle set and is the instantaneous CO2 emission of vehicle v at time t.
Mean trip duration is
mean waiting time is defined in Equation (13) as
where represents the instantaneous speed of vehicle v at time step t, and average total intersection queue is
All reported values are means and standard deviations over five independent random seeds. In addition to descriptive statistics, Scenario 3 includes two-sided Welch tests for the main pairwise comparisons with the standard DQN baseline. The environmental metric is treated as the primary endpoint; significance tests for the remaining metrics are interpreted as secondary evidence and are used to characterize the trade-off induced by the terrain-aware reward.
For two controllers with sample means and , standard deviations and , and sample sizes , the Welch statistic is given in Equation (15) as
with approximate degrees of freedom computed by Equation (16)
These equations are used to populate the Welch tests for Scenario 3. In addition, the requested terrain sensitivity is quantified as a relative response to the change from a flat site to the 3.8° uphill site while keeping the controller configuration fixed,
where is the metric under zero slope and is the same metric under grade .
3.4.3. Simulation Parameters, Vehicle Classes, and Scenarios
The test environment is a four-way intersection with one incoming and one outgoing lane per approach, matching Figure 2b. The northern incoming approach contains a 3.8° uphill segment, with a corresponding downhill segment on the opposing outgoing arm. Each 9-h (32,400 s) simulation processes 14,800 vehicles. The fleet comprises passenger cars and heavy trucks defined by HBEFA profiles, detailed in Table A4 (Appendix A). Table A7 and Table A8 (Appendix B) outline the route-generation logic and calibration variables linking these scenarios to the empirical data from Section 3.3.2.
The fleet characterization in Table A4 ensures reproducibility, as different HBEFA classes yield varying emission totals for identical trajectories. It also clarifies how this study isolates terrain effects: passenger cars form the background demand, whereas heavy trucks generate the high-load restart events that necessitate the specialized reward. Although a more diverse fleet could benefit future research, this two-class model sufficiently tests the controller’s response to the explicit environmental costs of uphill stop-and-go traffic.
Table A5 summarizes variations in volume asymmetry and truck exposure, while Table A6 specifies fixed operational constants, including time horizons, run counts, and geometric conditions. Together, Table A4, Table A5, Table A6 in Appendix A establish the complete traffic characterization for this study.
Three configurations evaluate the Context-Specific Reward Design Deep Q-Network (CSRD-DQN). Here, DQN refers to the action-value approximation backbone [33], and CSRD denotes the overarching reward-engineering framework. The controller uses two modes based on the selected reward function. The first, universal CSRD (abbreviated CSRD-U), is context-agnostic and ignores physical terrain. Under CSRD-U, Scenario 1 serves as a flat-intersection reference trained with Equation (8). Scenario 2 applies this same universal reward to the 3.8° uphill geometry, exposing the context-agnostic controller’s sensitivity to physical slopes. The second mode, topography-aware CSRD (abbreviated CSRD-T), explicitly incorporates topographical context. Scenario 3 retains the uphill terrain of Scenario 2 but employs the specialized CSRD-T reward in Equation (9).
This scenario sequence is deliberate. Scenario 1 provides a flat reference baseline. Scenario 2 isolates the geometric change, establishing the foundation for the slope sensitivity calculation in Equation (17). Scenario 3 fixes the geometry and modifies only the reward, differentiating CSRD’s environmental recovery from the slope’s inherent degradation. This decomposition prevents conflating the physical impacts of terrain with the algorithmic benefits of contextual reward engineering.
4. Results
This section reports simulation results for the proposed approach and the baselines across the three scenarios introduced above. All line plots show the mean and standard deviation over five independent runs. The plotted trajectories are reconstructed from the reporting checkpoints listed in Appendix B Table A11, Table A12, Table A13, with linear interpolation between checkpoints for readability. Numerical comparisons are reported as mean ± standard deviation.
4.1. Scenario 1: Flat Terrain
Scenario 1 provides a flat-terrain baseline with zero slope on all approaches. This demonstrates that the CSRD procedure remains highly competitive even without terrain-specific adaptations.
Figure A1a–c in Appendix C provide complementary plots for waiting time, trip duration, and queue length.
Figure 8 and Table 2 show that contextual calibration maintains strong performance on flat terrain. CSRD-U achieves the lowest total CO2 emissions—5.9% below the standard DQN and 7.3% below MP. It also yields the shortest mean trip duration and smallest queue. Waiting times remain comparable to the standard DQN and slightly exceed MP, which inherently prioritizes rapid queue discharge.
Figure 8.
Total CO2 emissions during training in Scenario 1 (flat terrain).
Table 2.
Performance comparison in Scenario 1. Lower values (in bold) are better for all metrics.
The training trajectories in Figure A1a–c (Appendix C) highlight two key findings. First, the universal CSRD controller converges quickly, realizing its largest gains before the training midpoint. This indicates a numerically stable reward structure even without terrain-specific terms. Second, its queue and duration curves are smoother than those of MPLight across the 200-episode horizon, ensuring that emission reductions do not compromise service stability. Additional datain Table A11 (Appendix B) reinforce this: while most CO2 reductions occur by the 100th episode, queue metrics steadily improve thereafter.
4.2. Scenario 2: Uphill Terrain with a Universal Reward
Scenario 2 introduces a 3.8° uphill approach while retaining the universal reward from Scenario 1. Although the simulator accurately models the road physics, the reward function ignores the terrain-specific costs of stop-and-go events. Figure 9 illustrates the training trajectory, and Table 3 summarizes the final performance.
Figure 9.
Total CO2 emissions during training in Scenario 2 (uphill terrain with the universal reward).
Table 3.
Performance comparison in Scenario 2. Lower values (in bold) are better for all metrics.
Table 4 presents the slope-sensitivity analysis underlined by Equation (17). Transitioning to the 3.8° uphill setting increases CO2 emissions across all controllers. However, CSRD-U and the standard DQN suffer the largest relative degradations. This confirms that a universal reward is highly sensitive to road grade because it fails to penalize environmentally costly uphill events. Comparing Scenarios 2 and 3 subsequently isolates the benefits of the specialized terrain-aware reward under identical slope conditions.
Table 4.
Slope-sensitivity summary from Scenario 1 (flat) to Scenario 2 (3.8° uphill). Values report the relative increase caused by the slope while keeping each controller unchanged.
This degradation extends beyond CO2 emissions. Figure A2a–c (Appendix C) and Table A12 (Appendix B) reveal that trip duration, waiting time, and queue length all increase when the universal controller operates on the uphill site. These substantial increases indicate that the controller makes suboptimal service decisions, rather than just incurring a direct energy penalty, because the reward structure misaligns with the site’s physical costs. This provides compelling evidence that topography fundamentally alters the optimal signal policy, rather than acting as a mere nuisance variable.
4.3. Scenario 3: Uphill Terrain with the Topography-Aware Reward
Scenario 3 retains the uphill geometry from Scenario 2 but activates the specialized reward in Equation (9). Figure 10 shows the training trajectory, while Table 5 summarizes the final performance. This decisively tests the core hypothesis: an informative topography-aware reward should reduce uphill stop-and-go behavior, thereby recovering some of the environmental losses observed in Scenario 2.
Figure 10.
Total CO2 emissions during training in Scenario 3 (uphill terrain with the topography-aware reward).
Table 5.
Performance comparison in Scenario 3. Lower values (in bold) are better for all metrics.
Compared to Scenario 2, the topography-aware reward operating on the same uphill geometry reduces CO2 emissions by 2.5%, mean trip duration by 2.9%, and queue length by 21.1%. Against the standard DQN baseline, the controller achieves statistically significant improvements in the primary endpoint and two of the three secondary metrics. Waiting time increases significantly, reflecting an intentional trade-off: the controller sacrifices short-term wait times to prevent energy-intensive uphill restarts. Notably, this trade-off does not prolong overall trips, as the mean duration still decreases significantly.
This performance aligns perfectly with the intended reward mechanism. By penalizing uphill stops and starts, CSRD-T promotes longer, more continuous service phases. This suppresses the repeated acceleration events that sharply inflate heavy vehicle emissions. This stabilizing behavior is also evident in the queue metric, proving the controller maintains intersection stability without directly minimizing waiting times.
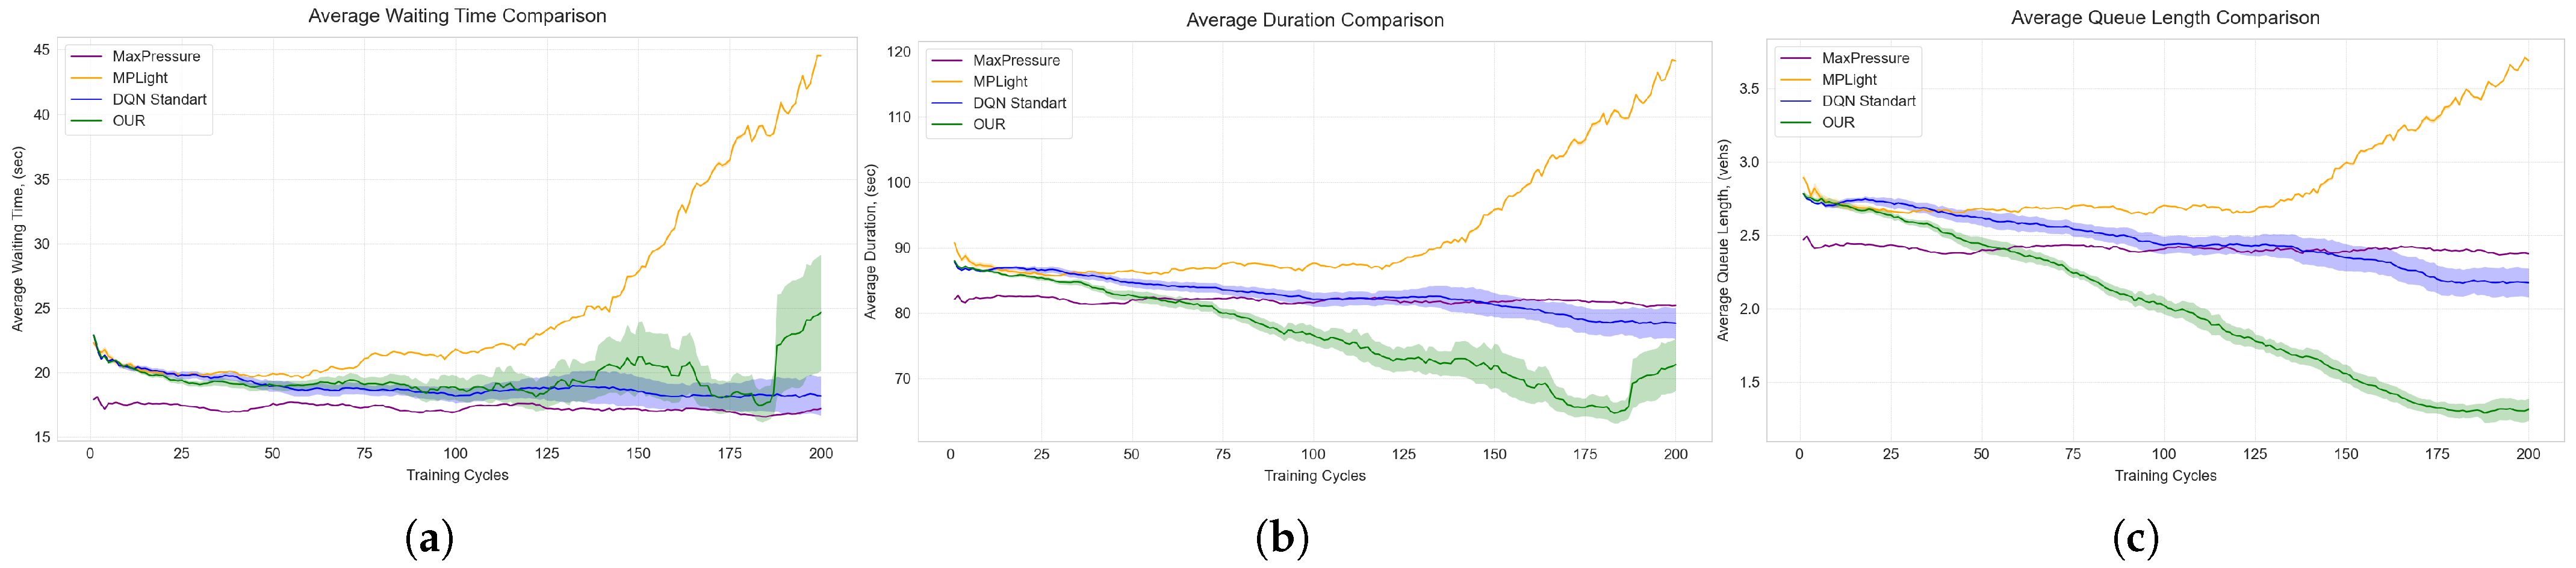
Figure A3a–c (Appendix C) and Table A13 (Appendix B) further clarify this dynamic. While waiting times rise modestly during late training, trip durations and queue lengths steadily decline. Thus, the controller does not merely hold vehicles longer; it strategically redistributes service to minimize repeated braking and restarting on the energy-intensive ascent. This specialized controller functions as an eco-stabilizing policy rather than a pure delay minimizer, a distinction central to this paper’s contribution.
4.4. Cross-Scenario Interpretation
These three scenarios provide a layered interpretation. Scenario 1 demonstrates that the universal CSRD controller performs well on flat terrain. Scenario 2 reveals that this universal reward misaligns when introduced to a meaningful incline. Scenario 3 proves that a targeted reward reformulation recovers substantial environmental losses without increasing overall trip durations. This progression separates the physical impact of road slope from the algorithmic benefits of reward adaptation, offering stronger insights than a simple before-and-after comparison.
Table 4 and Table 6 distinguish sensitivity from recoverability. Sensitivity measures performance degradation when a fixed controller encounters an uphill site. Recoverability measures the performance regained by adapting the reward for a fixed site. Here, universal controllers show high sensitivity, whereas CSRD-T achieves meaningful recoverability. This confirms that conventional DRL-TSC models primarily lack information about which costly physical events to avoid, rather than lacking the capacity to learn.
Table 6.
Welch tests for Scenario 3. Negative mean difference means that CSRD-T is lower than the comparator.
Statistical evidence reinforces these practical gains. Reductions in total CO2 and queue lengths are substantial and highly significant across five-seed replications. Conversely, waiting times significantly increase. Rather than a contradiction, this indicates the terrain-aware controller intentionally trades longer waits for fewer high-cost restart events. This trade-off effectively shortens average trip durations by reducing environmentally harmful turbulence instead of just accelerating every vehicle movement.
Practically, these results suggest a clear decision rule. A universal reward is adequate and easier to maintain for flat intersections or fleets with negligible heavy-vehicle shares. However, sites with meaningful inclines and consistent traffic loads require an environmental objective tailored to local restart costs. While not every intersection needs a bespoke reward, specific geometric contexts justify customized approaches. Ultimately, this study advocates for context-sensitive specialization rather than uncontrolled fragmentation into isolated, non-transferable controllers.
5. Discussion
The simulation results strongly support integrating topography into DRL traffic control to improve environmental outcomes. On a flat intersection (Scenario 1), the CSRD procedure remains highly competitive with established baselines like MP and standard deep Q-learning [25,28], achieving the lowest CO2 emissions and queue lengths (Table 2). However, Table 4 shows that introducing a 3.8° uphill approach severely degrades standard universal reward performance, as it fails to mitigate the immense energetic costs of uphill stops. Deploying the specialized CSRD-T reward (Equation (9)) in Scenario 3 recovers a significant portion of this environmental loss (Figure 10). The major contribution is therefore not merely applying deep Q-learning [7,8], but aligning the objective function with the physical reality, confirming that road gradients deeply influence energy consumption [2,3,4].
5.1. Interpretation of the Physical Mechanism
The topography-aware reward redefines operational cost. Conventional controllers view all queues merely as stored demand. The proposed method distinguishes between queues that are briefly inconvenient and those that are environmentally devastating because they force heavy vehicles (Table A4) to restart on an incline. By observing the dynamic descriptors in Equation (4), the agent inherently learns to avoid actions causing massive emission spikes. Consequently, the specialized reward serves as a compact representation of complex physical mechanisms without requiring heavy powertrain calculations within the control loop.
The CSRD weight calibration (Algorithm 2) transitions reward design from qualitative guesswork to a reproducible optimization protocol (Equation (10)). For new intersections, practitioners only need localized dry-run statistics and baseline constraints. This directly addresses broader challenges in DRL traffic applications, where preventing one numerical objective from overshadowing others remains notoriously difficult [10,27,41].
These findings clarify the important role of proxy variables. Directly penalizing CO2 often causes numerical instability. Here, specific uphill stop-and-restart frequencies effectively serve as physically grounded surrogates for the precise emission spikes the system seeks to eliminate. This aligns with modern eco-friendly, intelligent transportation research, leveraging operational proxies such as delay or stopping patterns rather than raw emissions to improve algorithmic stability across fluctuating conditions [9,40,44]. By tying surrogates to literal geometric relationships rather than treating them as generic congestion metrics, the controller achieves greater reliability.
5.2. Implications for Reward Engineering
A broader implication is that sustainable reward engineering should be site-mechanism-specific. Often, rewards are assembled from universally convenient variables, such as waiting time. On a flat benchmark, these metrics correlate strongly. Introducing an uphill segment breaks this interchangeability. A slight reduction in queue length may tragically cause a massive surge in uphill restart costs, while slightly elevated waiting times can yield net environmental gains by reducing truck accelerations. Intelligent reward structures must thus emerge from the exact physical context the agent controls.
This perspective explains the method’s robust competitiveness on flat terrain. The CSRD workflow (Figure 7) avoids prescribing one rigid formula globally. Instead, it dynamically selects optimal structures based on static features (Equation (3)). On flat networks, the optimal mechanism relies on the generic formulation (Equation (8)). On sloped junctions with heavy traffic, CSRD adapts structurally. Treating reward engineering as a dynamic model-selection problem provides a more transferable foundation than assuming a single mathematical equation will effortlessly generalize to every urban topology.
Furthermore, the specific terms in Equation (9) dramatically improve interpretability. Explaining a tailored reward comprising understandable elements, i.e., waiting time, queue size, and specific uphill restarts, to municipal engineers is easier than justifying completely nontransparent neural network objectives. This transparency is crucial for civic trust. Planners are more likely to implement a controller when its exact penalty mechanisms correspond directly to visible traffic engineering phenomena, providing a vital bridge between complex machine learning and practical traffic management.
5.3. Scalability and Heterogeneous Traffic
While highly effective locally, the single-intersection framework relies entirely on the localized observation tensor (Equation (5)), inherently lacking coordination with adjacent nodes. A network-wide deployment requires decentralized coordination layers exchanging downstream-queue or incoming-platoon data, resembling advanced multi-agent architectures [29]. Because static topographical features are computed only once per intersection, integrating them into larger systems adds virtually no real-time computational overhead. Addressing network coordination requires advanced multi-agent strategies. Cooperative learning environments demonstrate that regional objectives can be managed without centralizing massive state spaces [34,35,36,37]. A practical network controller would likely be hierarchical: local agents retain terrain-tailored rewards, while an overarching supervisor rigorously balances long-term corridor throughput to prevent localized queue exporting.
Additionally, the simplified fleet comprising two standardized vehicle categories (Table A4) successfully isolates the mechanical interaction between road gradient and mass. Yet, the mathematical framework effortlessly supports extensive vehicle heterogeneity. Incorporating electric vehicles, delivery vans, and public transit buses only requires expanding the simulation route parameters and HBEFA profiles. Crucially, a real-world reward system could uniquely penalize uphill restarts based on precise vehicle classification, reflecting the temporal heterogeneity common in modern urban centers [15]. Such integration would expand CSRD into a multi-criteria planner balancing energy efficiency with nuanced societal transit priorities.
5.4. Practical Deployment, Sensing, and Remaining Limitations
Moving toward practical deployment requires robust real-time data integration. The empirical pipeline described in Section 3.3.1 uses video analytics to extract rolling vehicle counts, turning behaviors, and queue sizes. These inputs subsequently inform either a continuously updated offline simulation library or a highly synchronized digital twin (Figure 5). However, real-world visual sensing faces immense hurdles, including dense weather occlusions and visual masking where heavy trucks completely hide smaller vehicles. These unmodeled disruptions can aggressively degrade state-estimation quality and ultimately diminish the realized environmental gains of the control policy.
Consequently, the automated pipelines (Figure 4 and Figure 5) function primarily as architectural blueprints for future field deployments. Operating a live system requires sophisticated camera calibration algorithms, reliable, persistent multi-object tracking, and robust fallback mechanisms when visual inputs momentarily fail. Currently, this methodology serves best as an advanced framework for a comprehensively calibrated digital twin, operating initially in shadow mode. This staged approach allows civic operators to extensively verify the simulated behavior against empirical field data before activating live actuation.
These findings directly influence broader urban mobility planning. If recurrent environmental penalties consistently occur at a signalized uphill approach, the topography-aware reward design serves as a powerful diagnostic tool. It can systematically identify locations where simple signal optimization is insufficient, thereby justifying more profound complementary infrastructure improvements or specialized freight-phase plans. This fundamentally connects localized microscopic control directly to overarching sustainable-mobility planning objectives.
5.5. Threats to Validity and Generalization
Several crucial validity threats must be acknowledged. Internal validity is primarily constrained by the study’s reliance on a distinct two-level comparative analysis—a perfectly flat baseline and a single 3.8° uphill grade. While sufficient to conclusively demonstrate the core hypothesis, this does not universally map the algorithm’s monotonic response across every possible urban road gradient. Similarly, external validity is narrowed by focusing exclusively on a single four-way junction and using simplified HBEFA vehicle abstractions. Construct validity also faces constraints: representing intricate environmental damage solely through operational proxies maintains mathematical stability, but these proxies cannot capture every nuanced contributor to real-world vehicular energy demands.
Despite these promising findings, significant limitations and potential shortcomings exist within the proposed approach. First, the reliance on idealized empirical data aggregation means that uncontrolled real-world sensing noise, such as minor errors in turning-ratio estimation or obscured camera views, could drastically alter the operating state and undermine the controller’s effectiveness. Human driver heterogeneity, including variable reaction times, distraction levels, and aggressive gap-closing behavior on slopes, was not modeled dynamically and could severely dilute the measured numerical benefits in real-world settings. Consequently, current research challenges remain regarding robust state estimation under adverse weather conditions and bridging the persistent sim-to-real gap. Open questions for future research include effectively coordinating these localized topography-aware controllers across expansive, multi-intersection urban grid networks, as well as seamlessly incorporating sophisticated multi-criteria objectives that dynamically adapt to the varying energetic footprints of heavily mixed, electrified, and autonomous vehicle fleets.
Ultimately, advancing robust, fail-safe computer vision analytics to overcome live-deployment hurdles will successfully bridge the sim-to-real gap, firmly establishing topography-aware intelligent transportation systems as a cornerstone for sustainable, decarbonized urban mobility.
6. Conclusions
This study presents an impactful, topography-aware DRL approach for urban TSC, demonstrating that conditioning reward engineering on local physical context drastically improves environmental sustainability. The core methodological contribution is the CSRD procedure, which intelligently selects reward components based on site characteristics, normalizes them to comparable numeric ranges, and rigorously calibrates their weights under explicit traffic-efficiency constraints. Comprehensive simulation testing revealed that addressing the energetic penalties of uphill stop-and-go driving yields profound benefits. Specifically, the specialized topography-aware controller reduced total CO2 emissions to 256.97 million milligrams, achieving 8.6% and 4.7% reductions relative to a traditional MP controller and a standard deep Q-learning baseline, respectively. Furthermore, it achieved the lowest mean trip duration of 72.09 s and minimized the average queue length to 1.31 vehicles. Welch tests confirmed these CO2, duration, and queue improvements were highly statistically significant across five random seeds (, , and , respectively).
Despite these compelling outcomes, the study’s findings must be interpreted within the scope of a physically informed, single-intersection controller evaluated under a simplified two-class vehicular fleet. Therefore, key limitations include the lack of multi-agent coordination in expansive urban grids and the reliance on idealized empirical data that currently bypasses severe sensing noise, visual occlusions, adverse weather conditions, and unpredictable human driver behavior inherent to real-world environments.
Future research will focus on decentralized multi-agent architectures that facilitate seamless reward coupling and straightforward spillback management across complex corridors. Additionally, the authors aim to extend this approach to accommodate multi-criteria objectives for highly heterogeneous, electrified, and public transit fleets.
Author Contributions
Conceptualization, O.R., O.B. and P.R.; methodology, O.R., O.B. and E.M.; software, O.R.; validation, O.R., O.B. and P.R.; formal analysis, O.B., E.M., P.R. and I.K.; investigation, O.R., E.M. and P.R.; resources, O.B., E.M. and I.K.; data curation, O.R., P.R. and I.K.; writing—original draft preparation, O.R. and O.B.; writing—review and editing, E.M., P.R. and I.K.; visualization, O.R. and P.R.; supervision, I.K.; project administration, O.B. and I.K.; funding acquisition, O.B. and E.M. All authors have read and agreed to the published version of the manuscript.
Funding
This research was funded by the European Union’s Horizon Europe Framework Programme for Research and Innovation under grant agreement No. 101148374, project “U_CAN: Ukraine towards Carbon Neutrality.” The contents of this publication are the sole responsibility of its authors and do not necessarily reflect the opinion of the European Union. Neither the European Union nor the granting authority can be held responsible for them.
Institutional Review Board Statement
Not applicable.
Informed Consent Statement
Not applicable.
Data Availability Statement
The data presented in this study are openly available in GitHub at: https://github.com/alexryzhanskiy/RESCO (accessed on 24 February 2026).
Acknowledgments
The authors thank the European Union’s Horizon Europe Framework Programme for supporting this research and acknowledge the open-source communities behind SUMO and the scientific Python v3.13.10 setup used in this work.
Conflicts of Interest
The authors declare no conflicts of interest. The funders had no role in the design of the study; in the collection, analyses, or interpretation of data; in the writing of the manuscript; or in the decision to publish the results.
Abbreviations
The following abbreviations are used in this manuscript:
| CNN | Convolutional Neural Network |
| CO2 | Carbon Dioxide |
| CSRD-DQN | Context-Specific Reward Design Deep Q-Network |
| CSRD-T | Topography-Aware Context-Specific Reward Design |
| CSRD-U | Universal Context-Specific Reward Design |
| D3QN | Dueling Double Deep Q-Network |
| DQN | Deep Q-Network |
| DRL | Deep Reinforcement Learning |
| DTSE | Distance To Stop-line Estimation |
| HBEFA | Handbook Emission Factors for Road Transport |
| MP | Max-Pressure |
| PER | Prioritized Experience Replay |
| PG | Policy Gradient |
| POMDP | Partially Observable Markov Decision Process |
| SUMO | Simulation of Urban MObility |
| TraCI | Traffic Control Interface |
| TSC | Traffic Signal Control |
Appendix A
This appendix presents the foundational tables for mathematical notation, empirical calibration inputs, and simulation parameters.
Table A1.
Core symbols used in the mathematical formulation. The listed sets, mappings, and scalars establish the foundation of the traffic-state space and DRL reward functions.
Table A2.
Empirical calibration inputs used to construct the static and dynamic components of the simulation model. These inputs map raw observational data sources to their specific functions within the simulated environment.
Table A3.
Site and experiment context transferred from the empirical calibration into the simulation environment. The listed geometric and operational descriptors thoroughly define the physical and testing parameters of the target intersection.
Table A4.
Vehicle classes used throughout the simulation study. The provided profiles detail the physical mass properties and designated simulation roles for both passenger cars and heavy trucks.
Table A5.
Traffic demand patterns applied during the simulation experiments. These archetypes highlight essential variations in demand structure, directional volume bias, and heavy-vehicle exposure across different test scenarios.
Table A6.
Primary operational settings consistently applied across all simulation scenarios. These constants specify the software version, geometric reference conditions, decision horizons, and formal evaluation endpoints.
Appendix B
This appendix provides detailed calibration tables, scenario definitions, and longitudinal metrics corresponding to the training trajectories.
Table A7.
Detailed summary of the empirical calibration variables incorporated into the study. The parameters specify how each observed metric is mathematically aggregated and utilized to accurately constrain the simulation dynamics.
Table A8.
Complete scenario library derived from the empirical calibration process. These entries describe the route-generation rules and fleet composition structures explicitly designed to stress-test the DRL controller.
Table A9.
Iterative weight selection process for the universal reward utilized in Scenarios 1 and 2. The sequence illustrates the necessary trade-offs made to effectively balance emission reduction with reliable queue stability.
Table A10.
Iterative weight selection process for the topography-aware reward tested in Scenario 3. The calibration explicitly highlights the introduction of strong terrain penalties to achieve an optimal emission-efficiency balance.
Table A11.
Longitudinal metric values recorded during training for Scenario 1 (flat terrain). The results report the aggregate means and standard deviations over five independent runs captured at 50-episode intervals.
Table A12.
Longitudinal training metrics detailing average performance and standard deviations for Scenario 2. These values track how each controller adapts to the uphill terrain using only a context-agnostic universal reward.
Table A13.
Longitudinal training metrics measuring progressive performance improvements for Scenario 3. The data present means and standard deviations over five independent runs specifically when the specialized topography-aware reward is activated.
Appendix C
This appendix contains the additional figures visualizing the training trajectories for waiting time, trip duration, and queue length across the three evaluated scenarios.
Figure A1.
The training trajectories of the traffic controllers evaluated under the flat terrain configuration of Scenario 1 across three secondary metrics: (a) average waiting time, (b) average trip duration, and (c) average queue length.
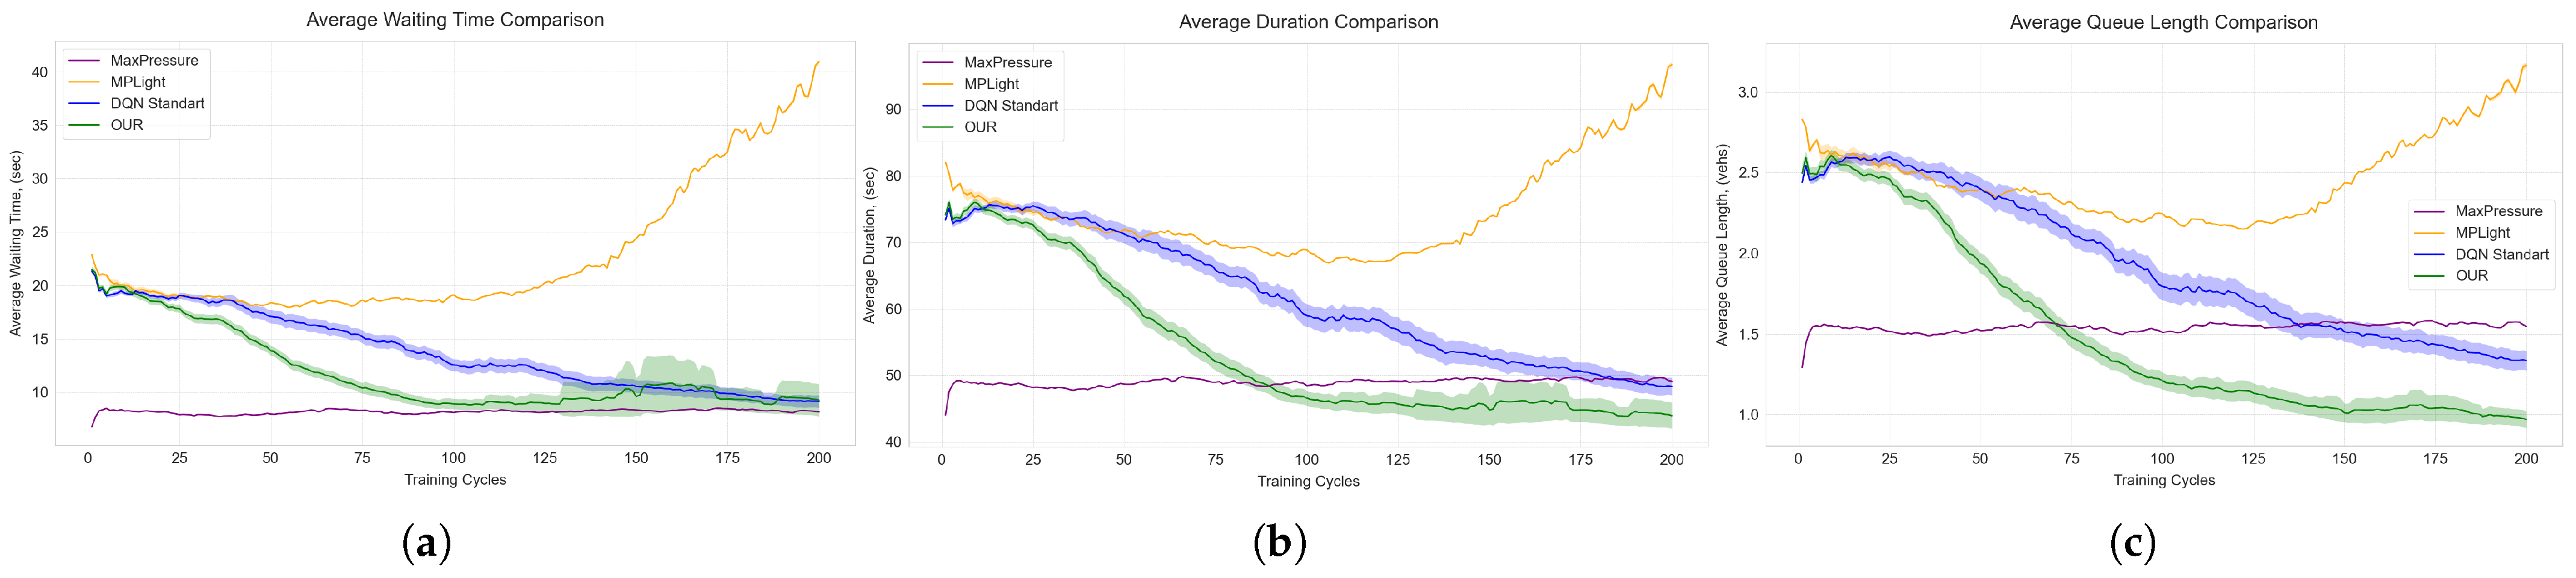
Figure A2.
The performance degradation observed when the context-agnostic universal controllers operate within the 3.8-degree uphill geometry of Scenario 2 across three secondary metrics: (a) average waiting time, (b) average trip duration, and (c) average queue length.
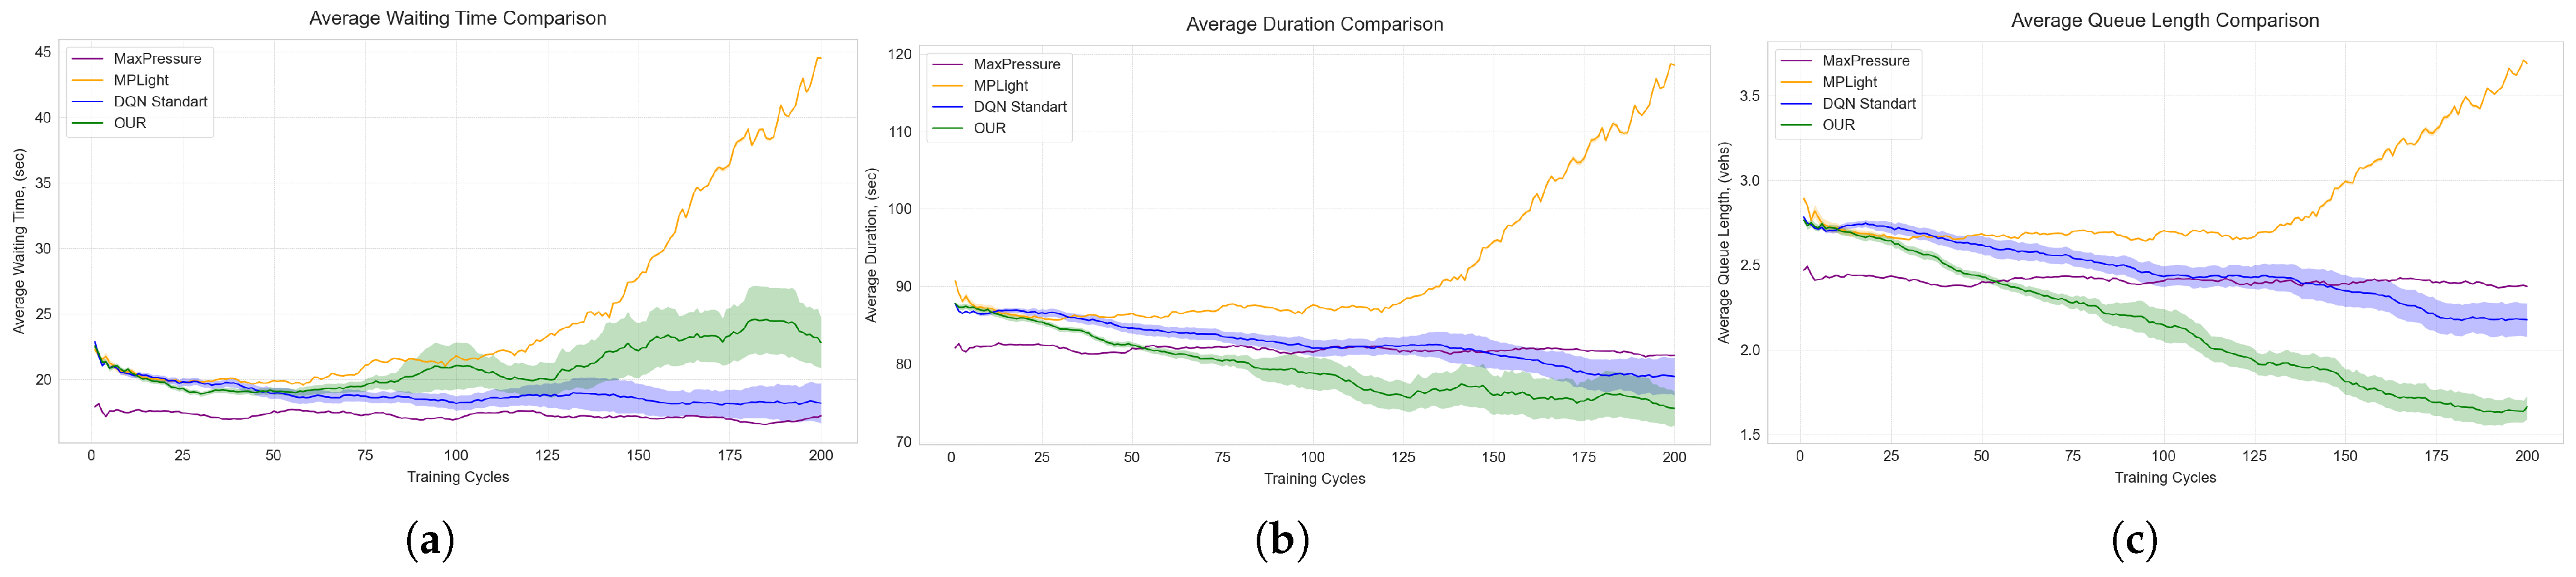
Figure A3.
The recovery of operational stability in Scenario 3 following the activation of the specialized topography-aware reward across three secondary metrics: (a) average waiting time, (b) average trip duration, and (c) average queue length.
References
- United Nations General Assembly; United Nations Economic and Social Council. Progress Towards the Sustainable Development Goals: Report of the Secretary-General. Report of the Secretary-General A/79/79-E/2024/54, United Nations. 2024. Available online: https://unstats.un.org/sdgs/files/report/2024/SG-SDG-Progress-Report-2024-advanced-unedited-version.pdf (accessed on 24 February 2026).
- Coiret, A.; Deljanin, E.; Vandanjon, P.O. Vehicle energy savings by optimizing road speed-sectioning. Eur. Transp. Res. Rev. 2020, 12, 41. [Google Scholar] [CrossRef] [Scilit]
- Ryzhanskyi, O.; Manziuk, E.; Barmak, O.; Krak, I.; Bacanin, N. An approach to optimizing CO2 emissions in traffic control via reinforcement learning. In Proceedings of the 5th International Workshop on Intelligent Information Technologies & Systems of Information Security (IntelITSIS 2024), Khmelnytskyi, Ukraine, 28 March 2024; Hovorushchenko, T., Savenko, O., Popov, P.T., Lysenko, S., Eds.; CEUR: Aachen, Germany, 2024; Volume 3675, pp. 137–155. Available online: https://ceur-ws.org/Vol-3675/paper10.pdf (accessed on 24 February 2026).
- Pavlyshyn, V.; Manziuk, E.; Barmak, O.; Krak, I.; Damaševičius, R. Modeling environment intelligent transport system for eco-friendly urban mobility. In Proceedings of the 5th International Workshop on Intelligent Information Technologies & Systems of Information Security (IntelITSIS 2024), Khmelnytskyi, Ukraine, 28 March 2024; Hovorushchenko, T., Savenko, O., Popov, P.T., Lysenko, S., Eds.; CEUR: Aachen, Germany, 2024; Volume 3675, pp. 118–136. Available online: https://ceur-ws.org/Vol-3675/paper9.pdf (accessed on 24 February 2026).
- Ryzhanskyi, O.; Pavlyshyn, V.; Radiuk, P.; Manziuk, E.; Barmak, O.; Krak, I. AI-driven traffic signal control system to reduce CO2 emissions. In Proceedings of the the Workshops “AI for Environmental and Social Sustainability” and “AI and Interdisciplinary Innovations for Sustainable Development” (YAISD-WS 2025), Ternopil-Skomorochy, Ukraine, 8–9 May 2025; Pitsun, O., Dyvak, M., Eds.; CEUR: Aachen, Germany, 2025; Volume 3974, pp. 18–27. Available online: https://ceur-ws.org/Vol-3974/paper02.pdf (accessed on 24 February 2026).
- Pavlyshyn, V.; Ryzhanskyi, O.; Manziuk, E.; Radiuk, P.; Barmak, O.; Krak, I. Establishing patterns of the urban transport flows on clustering analysis. In Proceedings of the the Workshops “AI for Environmental and Social Sustainability” and “AI and Interdisciplinary Innovations for Sustainable Development” (YAISD-WS 2025), Ternopil-Skomorochy, Ukraine, 8–9 May 2025; Pitsun, O., Dyvak, M., Eds.; CEUR: Aachen, Germany, 2025; Volume 3974, pp. 1–9. Available online: https://ceur-ws.org/Vol-3974/paper01.pdf (accessed on 24 February 2026).
- Louw, J.; Labuschagne, L.; Woodley, T. A comparison of reinforcement learning agents applied to traffic signal optimisation. In Proceedings of the SUMO User Conference 2022; SUMO Conference Proceedings; TIB Open Publishing: Hannover, Germany, 2022; Volume 3, pp. 15–43. [Google Scholar] [CrossRef] [Scilit]
- Wei, H.; Zheng, G.; Gayah, V.V.; Li, Z. Recent advances in reinforcement learning for traffic signal control: A survey of models and evaluation. ACM SIGKDD Explor. Newsl. 2020, 22, 12–18. [Google Scholar] [CrossRef] [Scilit]
- Haddad, T.A.; Hedjazi, D.; Aouag, S. A new deep reinforcement learning-based adaptive traffic light control approach for isolated intersection. In Proceedings of the 2022 5th International Symposium on Informatics and Its Applications (ISIA), M’sila, Algeria, 29–30 November 2022; pp. 1–6. [Google Scholar] [CrossRef] [Scilit]
- Ouyang, C.; Zhan, Z.; Lv, F. A comparative study of traffic signal control based on reinforcement learning algorithms. World Electr. Veh. J. 2024, 15, 246. [Google Scholar] [CrossRef] [Scilit]
- Eclipse SUMO Project. Eclipse SUMO. 2026. Available online: https://eclipse.dev/sumo/ (accessed on 24 February 2026).
- HBEFA. Handbook of Emission Factors for Road Transport. 2026. Available online: https://www.hbefa.net/ (accessed on 24 February 2026).
- Eclipse SUMO Project. TraCI: Traffic Control Interface. 2026. Available online: https://sumo.dlr.de/docs/TraCI/index.html (accessed on 24 February 2026).
- Krajzewicz, D.; Behrisch, M.; Wagner, P.; Luz, R.; Krumnow, M. Second generation of pollutant emission models for SUMO. In Modeling Mobility with Open Data; Behrisch, M., Weber, M., Eds.; Lecture Notes in Mobility; Springer: Cham, Switzerland, 2015; pp. 203–221. [Google Scholar] [CrossRef] [Scilit]
- Pavlyshyn, V.; Manziuk, E.; Barmak, O.; Radiuk, P.; Krak, I. An adaptive machine learning approach to sustainable traffic planning: High-fidelity pattern recognition in smart transportation systems. Future Transp. 2025, 5, 152. [Google Scholar] [CrossRef] [Scilit]
- Eom, M.; Kim, B.I. The traffic signal control problem for intersections: A review. Eur. Transp. Res. Rev. 2020, 12, 50. [Google Scholar] [CrossRef] [Scilit]
- Chala, T.D.; Kóczy, L.T. Intelligent fuzzy traffic signal control system for complex intersections using fuzzy rule base reduction. Symmetry 2024, 16, 1177. [Google Scholar] [CrossRef] [Scilit]
- Wang, A.; Zhang, K.; Li, M.; Shao, J.; Li, S. Game theory-based signal control considering both pedestrians and vehicles in connected environment. Sensors 2023, 23, 9438. [Google Scholar] [CrossRef] [Scilit]
- Faqir, N.; Loqman, C.; Boumhidi, J. Combined extreme learning machine and max pressure algorithms for traffic signal control. Intell. Syst. Appl. 2023, 19, 200255. [Google Scholar] [CrossRef] [Scilit]
- Ren, W.; Zhang, J.; Li, L.; Zhou, Q. An intersection platoon speed control model considering traffic efficiency and energy consumption in CVIS. Math. Probl. Eng. 2021, 2021, 2891247. [Google Scholar] [CrossRef] [Scilit]
- Abohashima, H.; Eltawil, A.B.; Gheith, M.S. A mathematical programming model and a firefly-based heuristic for real-time traffic signal scheduling with physical constraints. IEEE Access 2021, 9, 128314–128327. [Google Scholar] [CrossRef] [Scilit]
- Othmani, T.; Boubaker, S.; Rehimi, F.; Alimi, S.E. Improving energy consumption efficiency and environmental sustainability through smart traffic control adaptation. In Proceedings of the 2023 IEEE International Conference on Artificial Intelligence & Green Energy (ICAIGE), Sousse, Tunisia, 12–14 October 2023; pp. 1–6. [Google Scholar] [CrossRef] [Scilit]
- Sachan, A.; Kumar, N. Intelligent traffic control system for emergency vehicles. In IoT and Analytics for Sensor Networks; Nayak, P., Pal, S., Peng, S.L., Eds.; Lecture Notes in Networks and Systems; Springer: Singapore, 2022; Volume 244, pp. 151–160. [Google Scholar] [CrossRef] [Scilit]
- Levin, M.W. Max-pressure traffic signal timing: A summary of methodological and experimental results. J. Transp. Eng. Part A Syst. 2023, 149, 03123001. [Google Scholar] [CrossRef] [Scilit]
- Kouvelas, A.; Lioris, J.; Fayazi, S.A.; Varaiya, P. Maximum pressure controller for stabilizing queues in signalized arterial networks. Transp. Res. Rec. J. Transp. Res. Board 2014, 2421, 133–141. [Google Scholar] [CrossRef] [Scilit]
- Haydari, A.; Yilmaz, Y. Deep reinforcement learning for intelligent transportation systems: A survey. IEEE Trans. Intell. Transp. Syst. 2022, 23, 11–32. [Google Scholar] [CrossRef] [Scilit]
- Michailidis, P.; Michailidis, I.; Lazaridis, C.R.; Kosmatopoulos, E. Traffic signal control via reinforcement learning: A review on applications and innovations. Infrastructures 2025, 10, 114. [Google Scholar] [CrossRef] [Scilit]
- Ault, J.; Hanna, J.P.; Sharon, G. Learning an interpretable traffic signal control policy. In Proceedings of the 19th International Conference on Autonomous Agents and Multiagent Systems (AAMAS 2020), Auckland, New Zealand, 9–13 May 2020; Fallah-Seghrouchni, A.E., Sukthankar, G., An, B., Yorke-Smith, N., Eds.; International Foundation for Autonomous Agents and Multiagent Systems: Pittsburgh, PA, USA, 2020; pp. 88–96. Available online: https://www.ifaamas.org/Proceedings/aamas2020/pdfs/p88.pdf (accessed on 24 February 2026).
- Chen, C.; Wei, H.; Xu, N.; Zheng, G.; Yang, M.; Xiong, Y.; Xu, K.; Li, Z. Toward a thousand lights: Decentralized deep reinforcement learning for large-scale traffic signal control. Proc. AAAI Conf. Artif. Intell. 2020, 34, 3414–3421. [Google Scholar] [CrossRef] [Scilit]
- Ivander, W.; Kozhevnikov, S.; Sontheimer, M.; Chou, S. Enhancing urban traffic management in Taipei: A reinforcement learning approach. In Proceedings of the 2024 Smart City Symposium Prague (SCSP), Prague, Czech Republic, 23–24 May 2024; pp. 1–6. [Google Scholar] [CrossRef] [Scilit]
- Sun, Z.; Jia, X.; Cai, Y.; Ji, A.; Lin, X.; Liu, L.; Wang, W.; Tu, Y. Joint control of traffic signal phase sequence and timing: A deep reinforcement learning method. Digit. Transp. Saf. 2025, 4, 118–126. [Google Scholar] [CrossRef] [Scilit]
- Bellman, R. A Markovian decision process. J. Math. Mech. 1957, 6, 679–684. [Google Scholar] [CrossRef]
- Mnih, V.; Kavukcuoglu, K.; Silver, D.; Rusu, A.A.; Veness, J.; Bellemare, M.G.; Graves, A.; Riedmiller, M.; Fidjeland, A.K.; Ostrovski, G.; et al. Human-level control through deep reinforcement learning. Nature 2015, 518, 529–533. [Google Scholar] [CrossRef] [Scilit]
- Liu, D.; Li, L. A traffic light control method based on multi-agent deep reinforcement learning algorithm. Sci. Rep. 2023, 13, 9396. [Google Scholar] [CrossRef] [Scilit]
- Kolat, M.; Kovári, B.; Bécsi, T.; Aradi, S. Multi-agent reinforcement learning for traffic signal control: A cooperative approach. Sustainability 2023, 15, 3479. [Google Scholar] [CrossRef] [Scilit]
- Zhang, Z.; Zhang, W.; Liu, Y.; Xiong, G. Mean field multi-agent reinforcement learning method for area traffic signal control. Electronics 2023, 12, 4686. [Google Scholar] [CrossRef] [Scilit]
- Fang, W.; Zhao, X.; Zhang, C. Fairness-aware multi-agent reinforcement learning and visual perception for adaptive traffic signal control. Optoelectron. Lett. 2024, 20, 764–768. [Google Scholar] [CrossRef] [Scilit]
- Nie, Q.; Ou, J.; Zhang, H.; Lu, J.; Li, S.; Shi, H. A robust integrated multi-strategy bus control system via deep reinforcement learning. Eng. Appl. Artif. Intell. 2024, 133, 107986. [Google Scholar] [CrossRef] [Scilit]
- Ran, Q.; Liang, C.; Liu, P. A safe lane-changing strategy for autonomous vehicles based on deep Q-networks and prioritized experience replay. Digit. Transp. Saf. 2025, 4, 170–174. [Google Scholar] [CrossRef] [Scilit]
- Wang, Z.; Xu, L.; Ma, J. Carbon dioxide emission reduction-oriented optimal control of traffic signals in mixed traffic flow based on deep reinforcement learning. Sustainability 2023, 15, 16564. [Google Scholar] [CrossRef] [Scilit]
- Schumacher, M.E.H.; Adriano, C.M.; Giese, H. Challenges in reward design for reinforcement learning-based traffic signal control: An investigation using a CO2 emission objective. In Proceedings of the SUMO User Conference 2023; SUMO Conference Proceedings; TIB Open Publishing: Hannover, Germany, 2023; Volume 4, pp. 131–151. [Google Scholar] [CrossRef] [Scilit]
- Zhang, G.; Chang, F.; Jin, J.; Yang, F.; Huang, H. Multi-objective deep reinforcement learning approach for adaptive traffic signal control system with concurrent optimization of safety, efficiency, and decarbonization at intersections. Accid. Anal. Prev. 2024, 199, 107451. [Google Scholar] [CrossRef] [Scilit]
- Ounoughi, C.; Touibi, G.; Yahia, S.B. EcoLight: Eco-friendly traffic signal control driven by urban noise prediction. In Database and Expert Systems Applications; Strauss, C., Cuzzocrea, A., Kotsis, G., Tjoa, A.M., Khalil, I., Eds.; Lecture Notes in Computer Science; Springer: Vienna, Austria, 2022; Volume 13426, pp. 205–219. [Google Scholar] [CrossRef] [Scilit]
- Jung, J.; Kim, I.; Yoon, J. EcoMRL: Deep reinforcement learning-based traffic signal control for urban air quality. Int. J. Sustain. Transp. 2025, 19, 720–729. [Google Scholar] [CrossRef] [Scilit]
- Kovári, B.; Szoke, L.; Bécsi, T.; Aradi, S.; Gáspár, P. Traffic signal control via reinforcement learning for reducing global vehicle emission. Sustainability 2021, 13, 11254. [Google Scholar] [CrossRef] [Scilit]
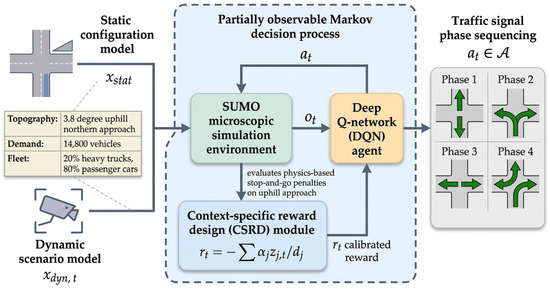
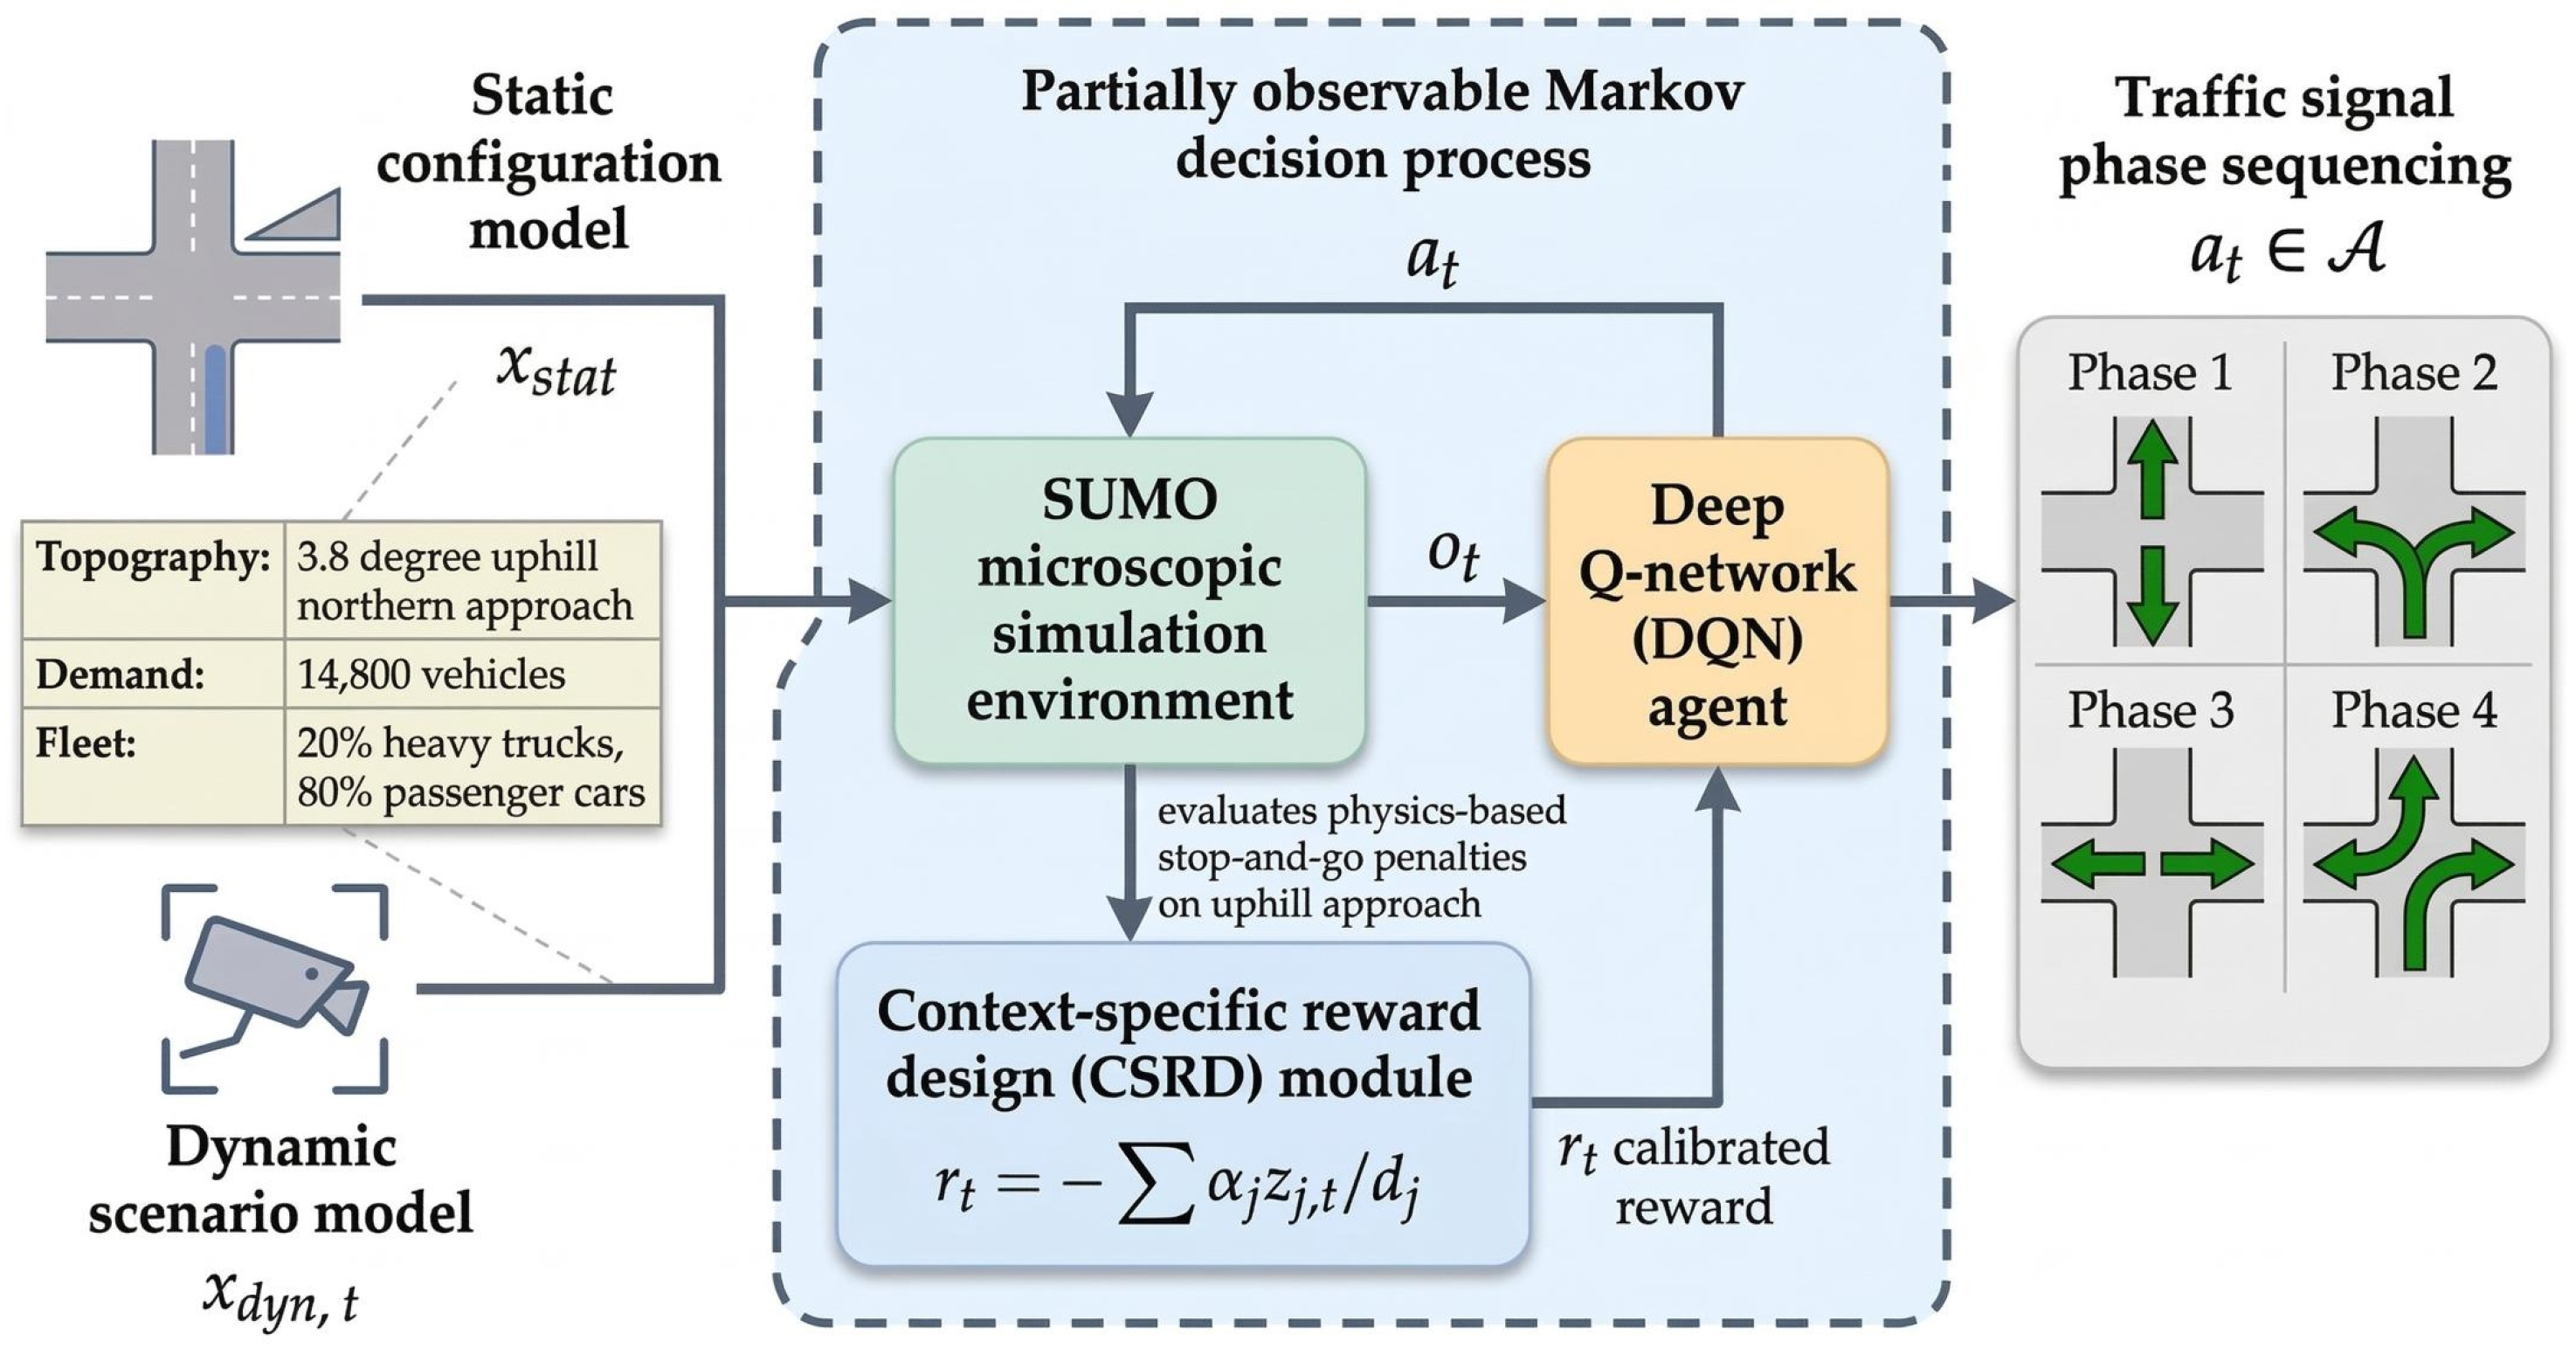
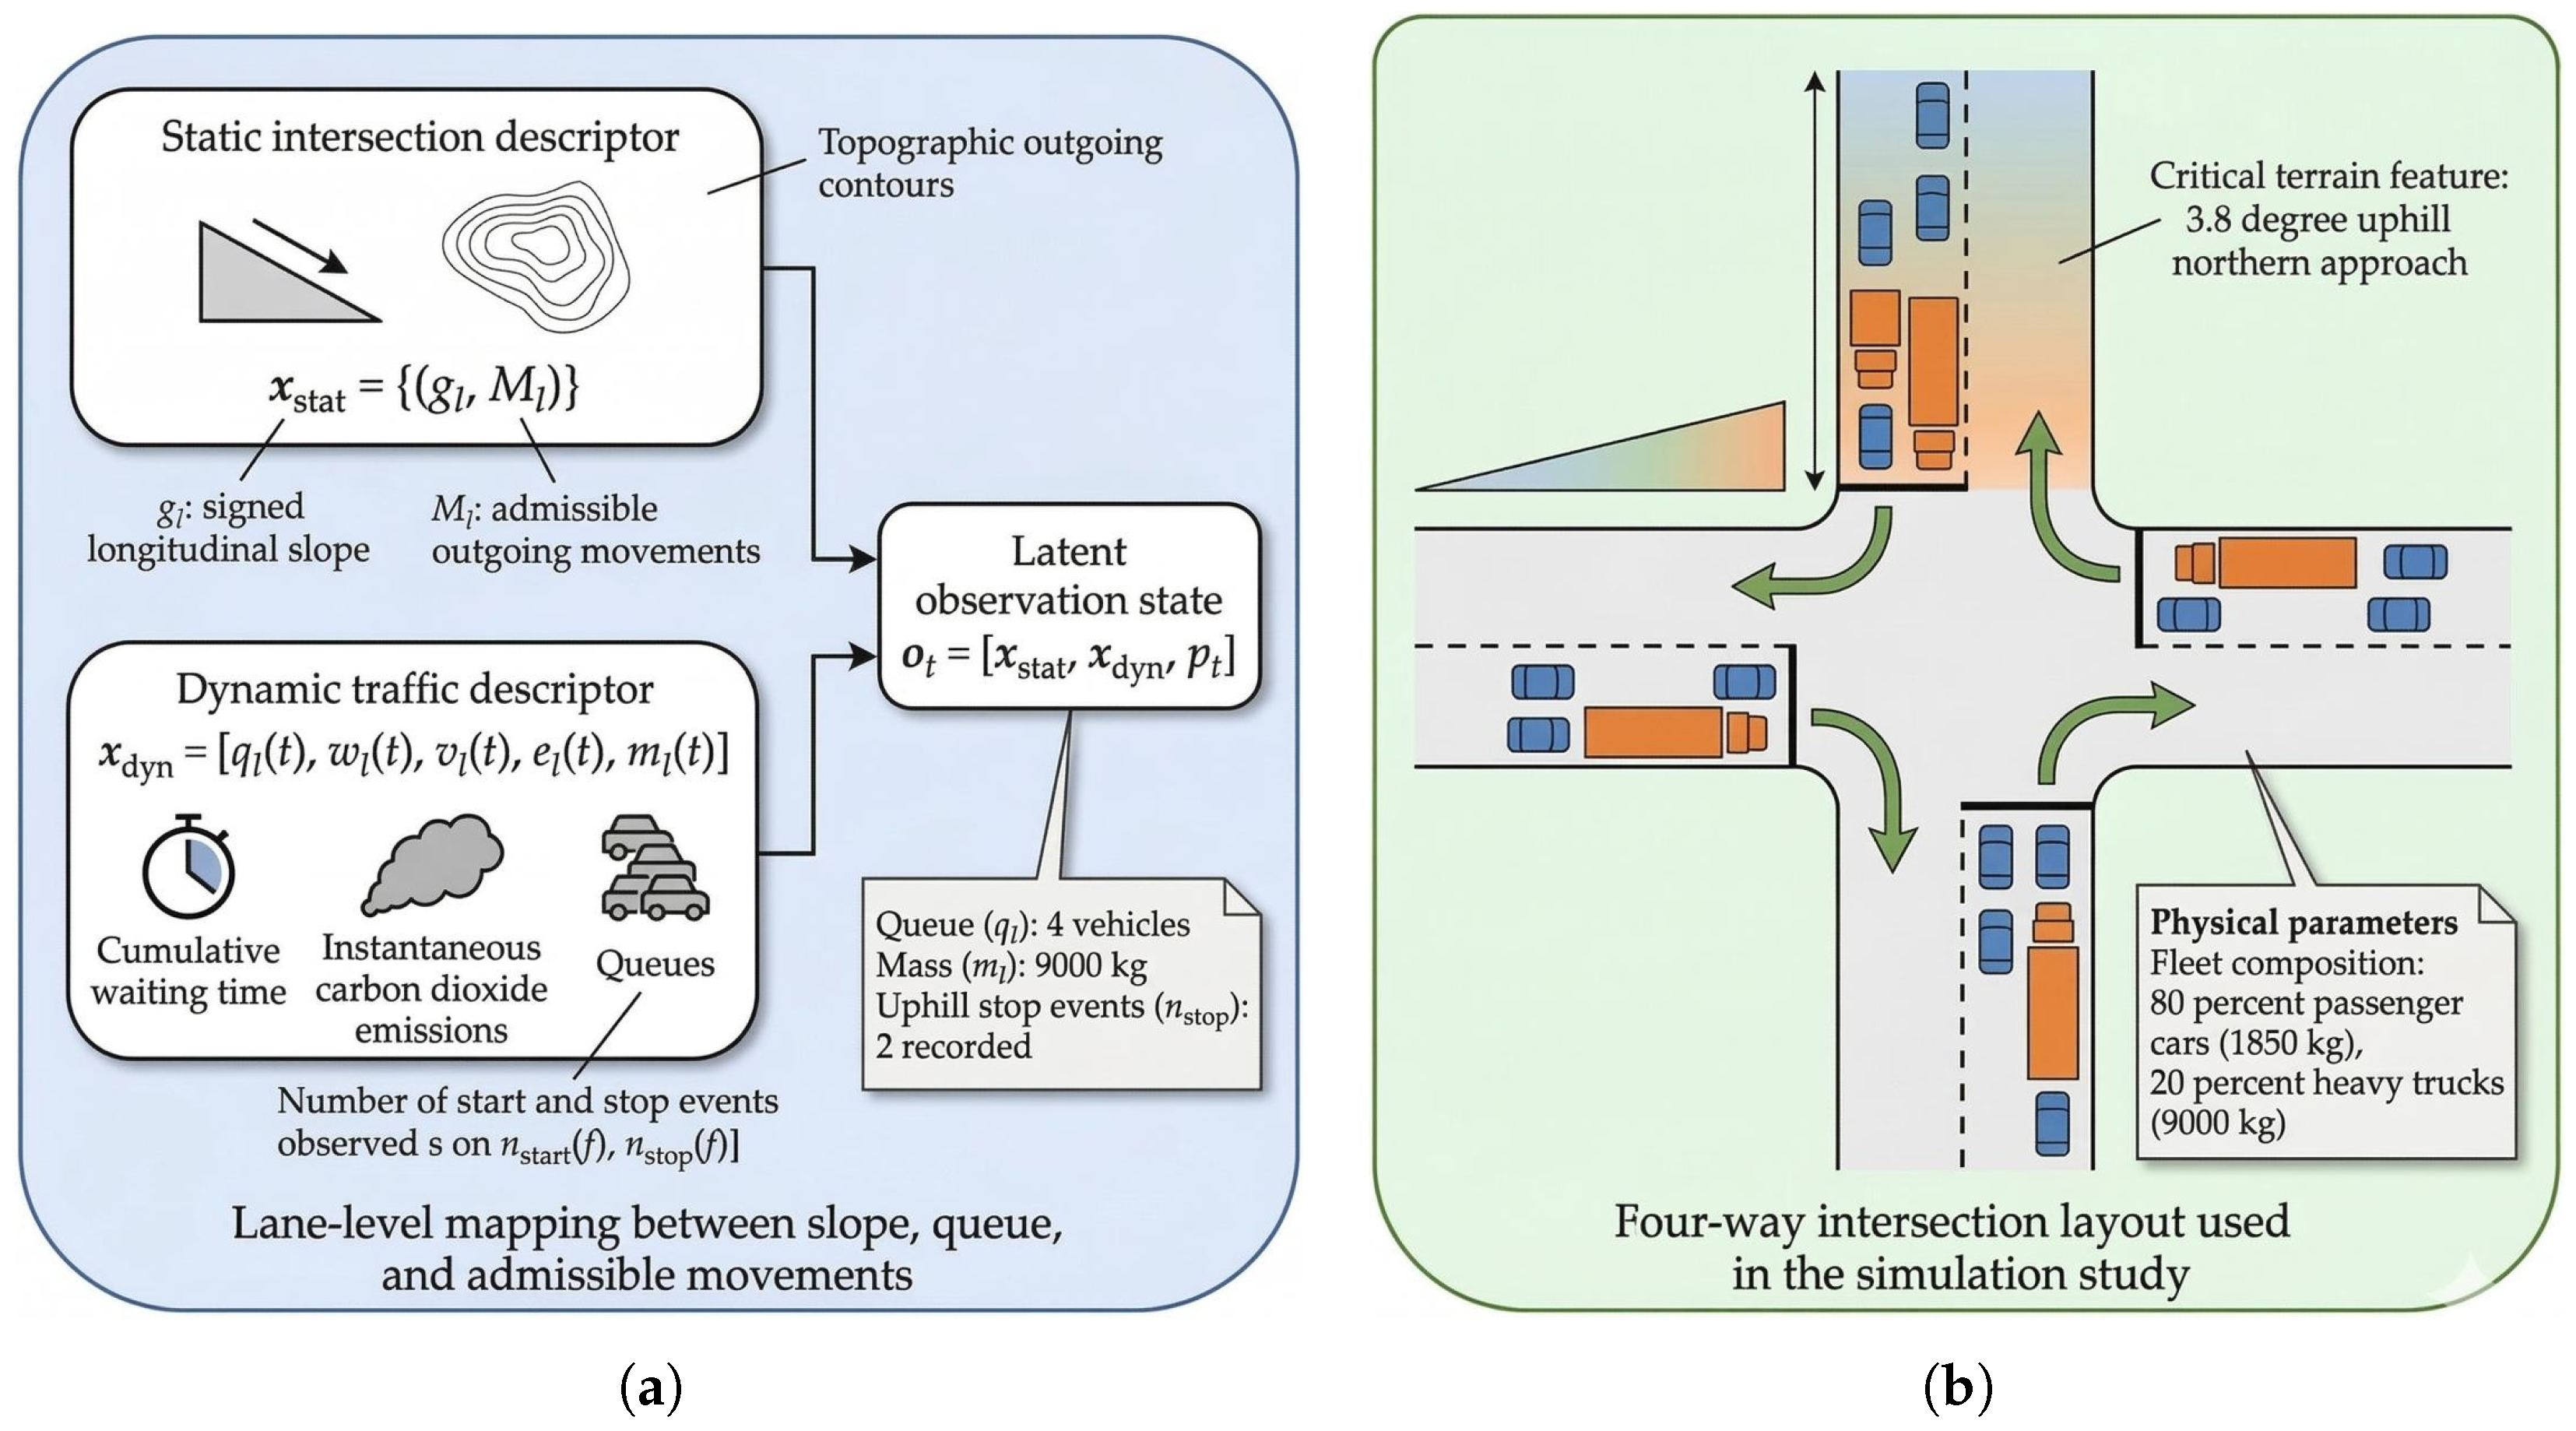
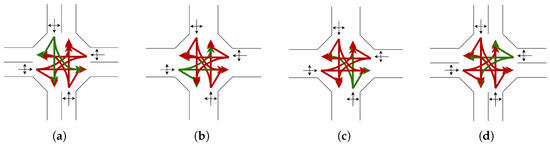
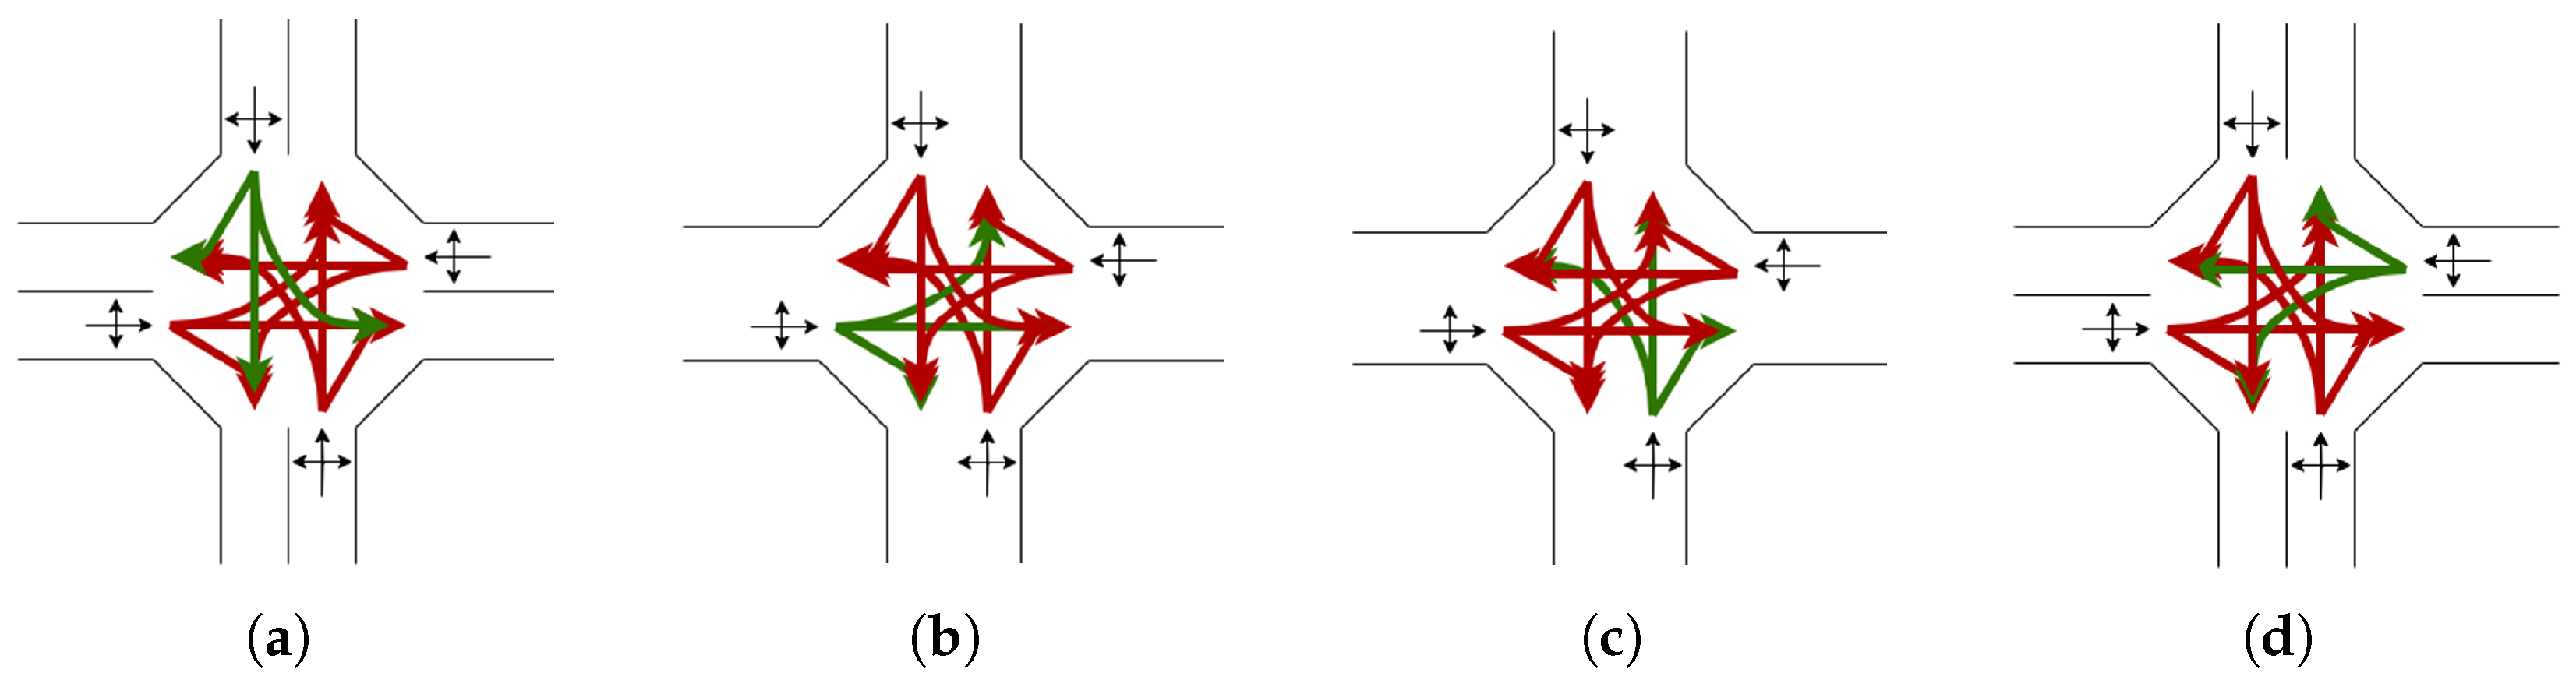
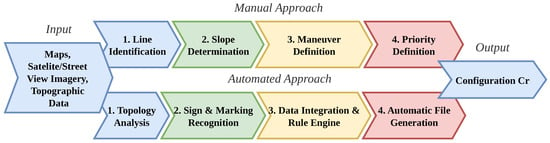
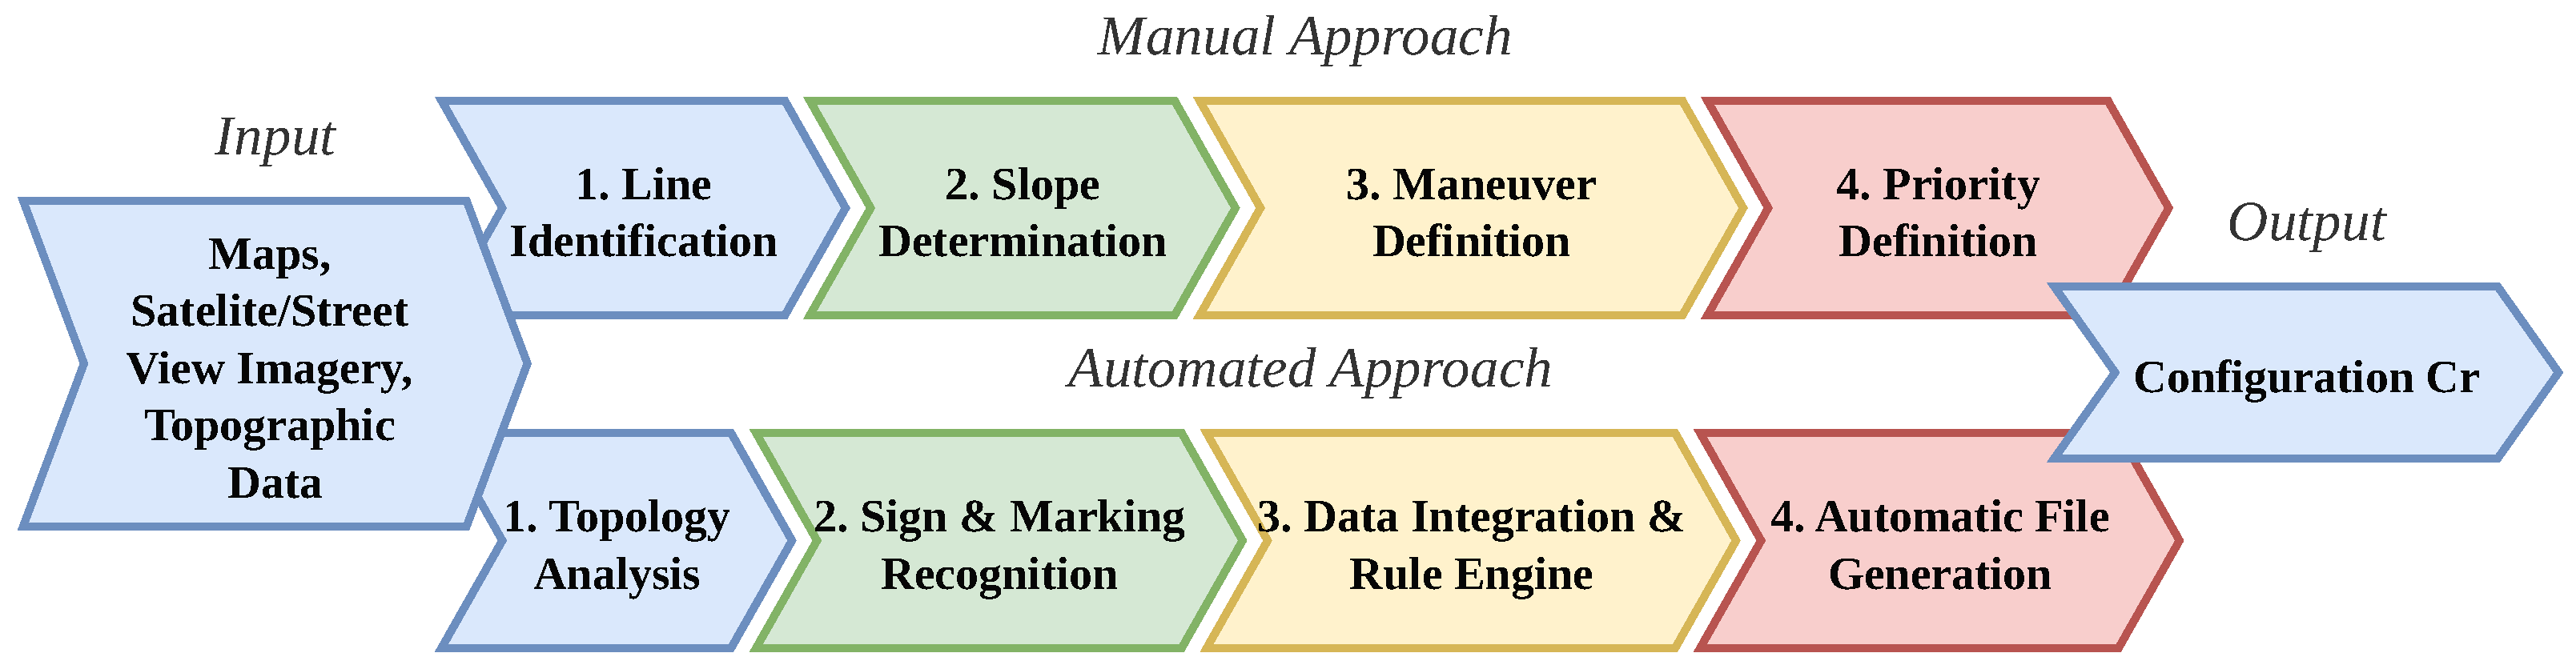
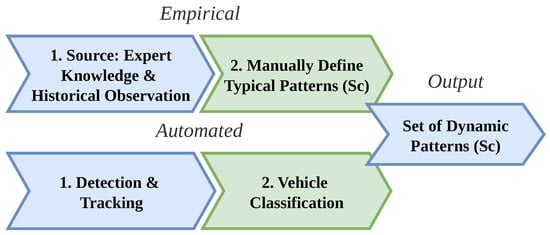
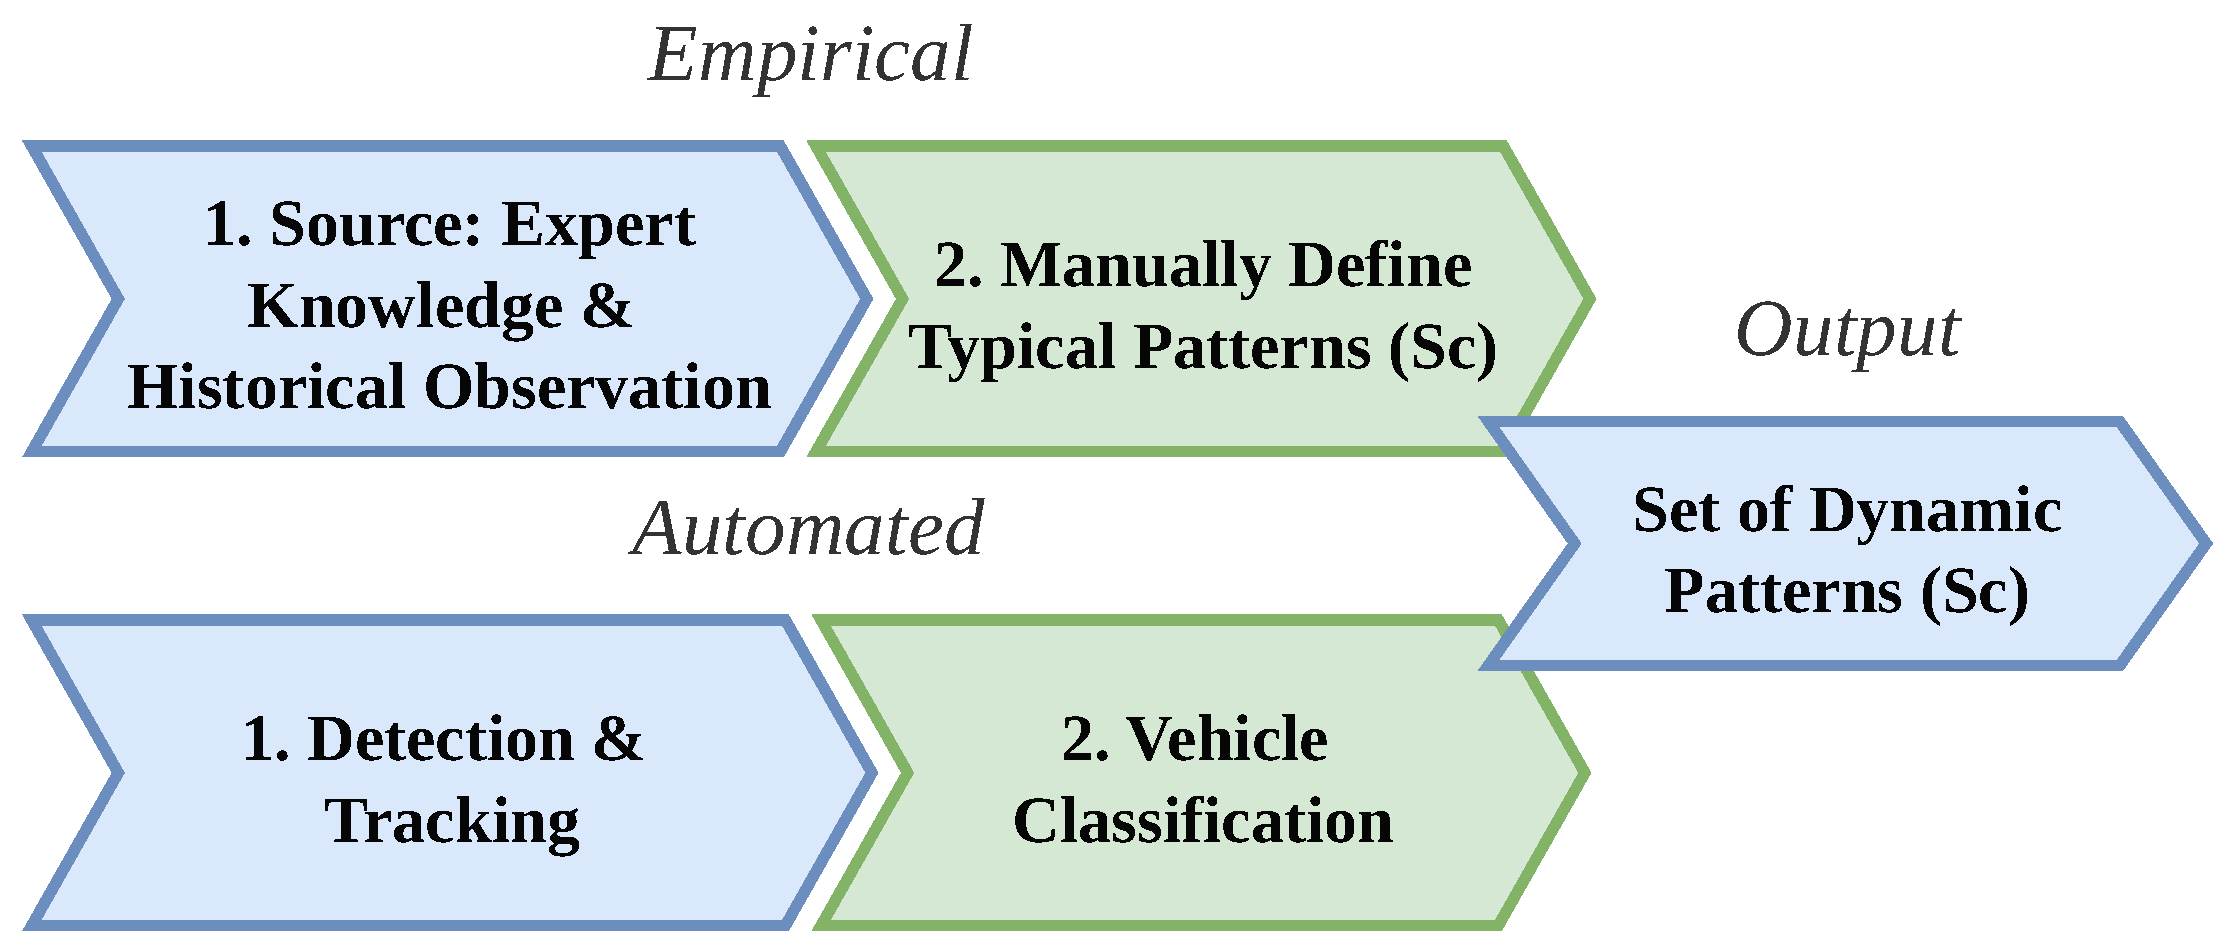




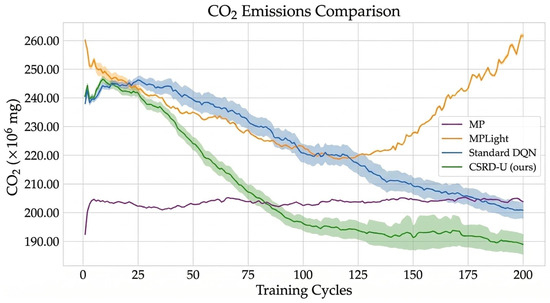
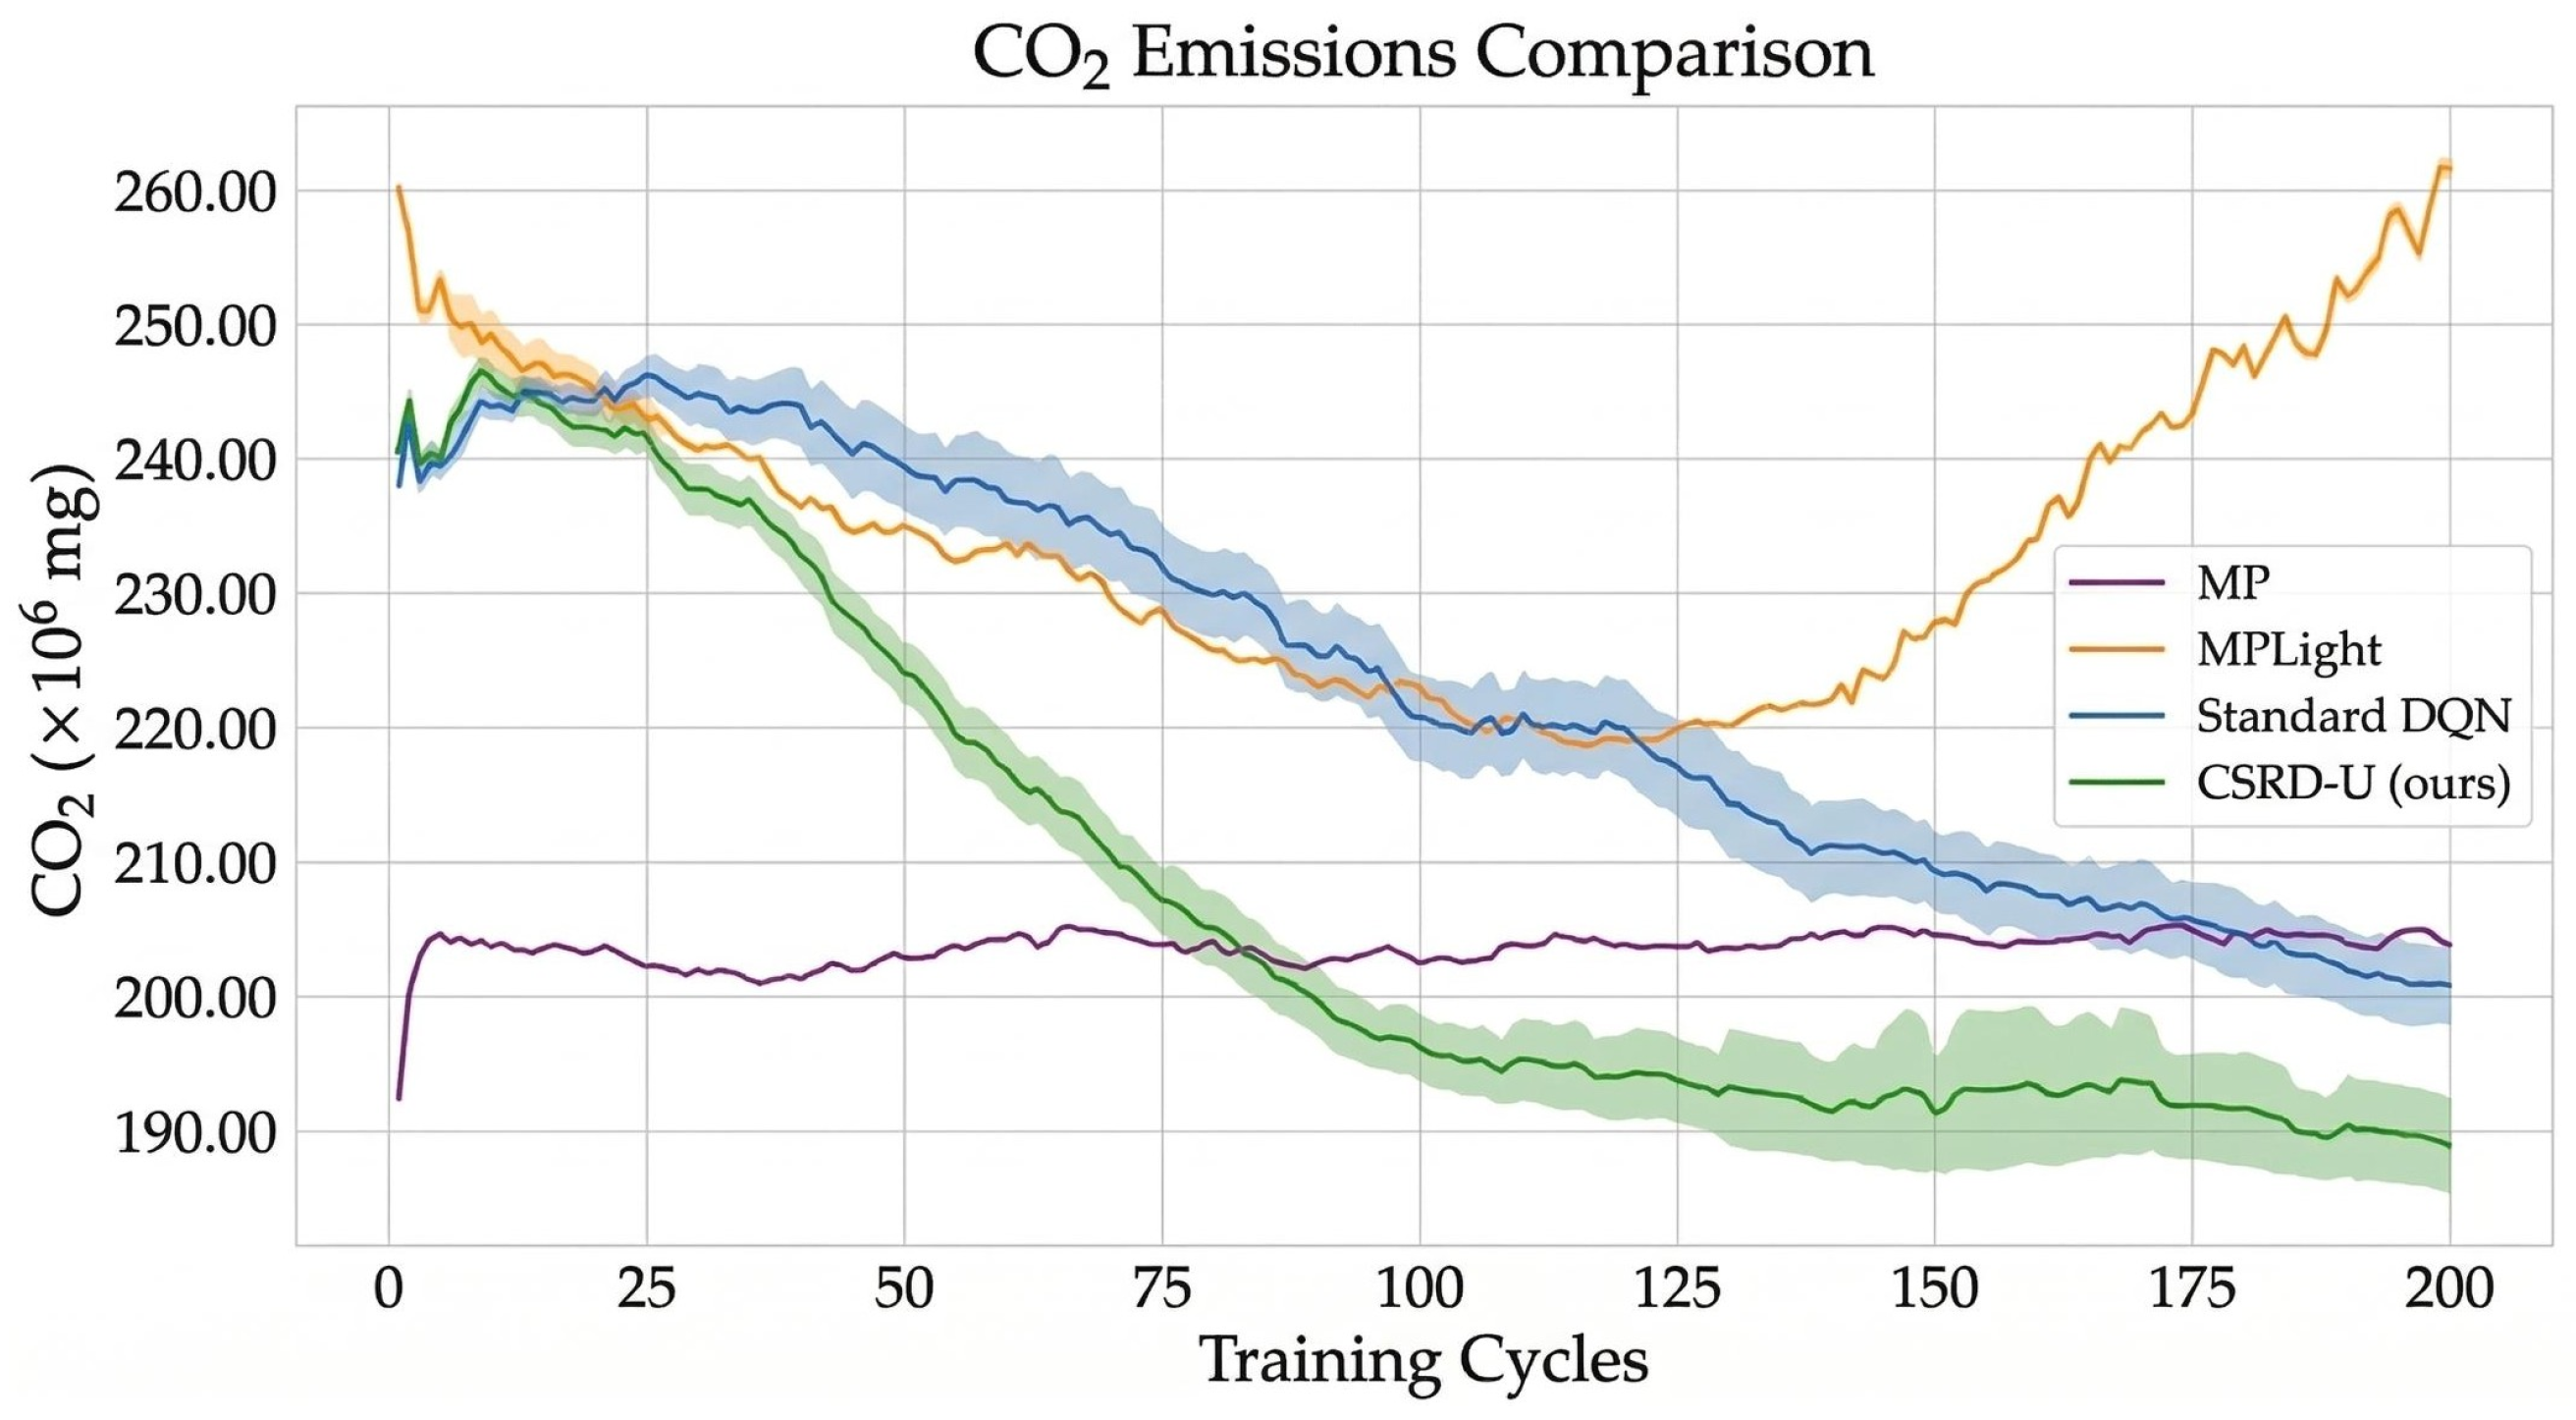
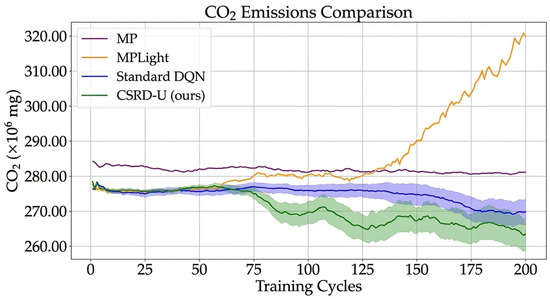
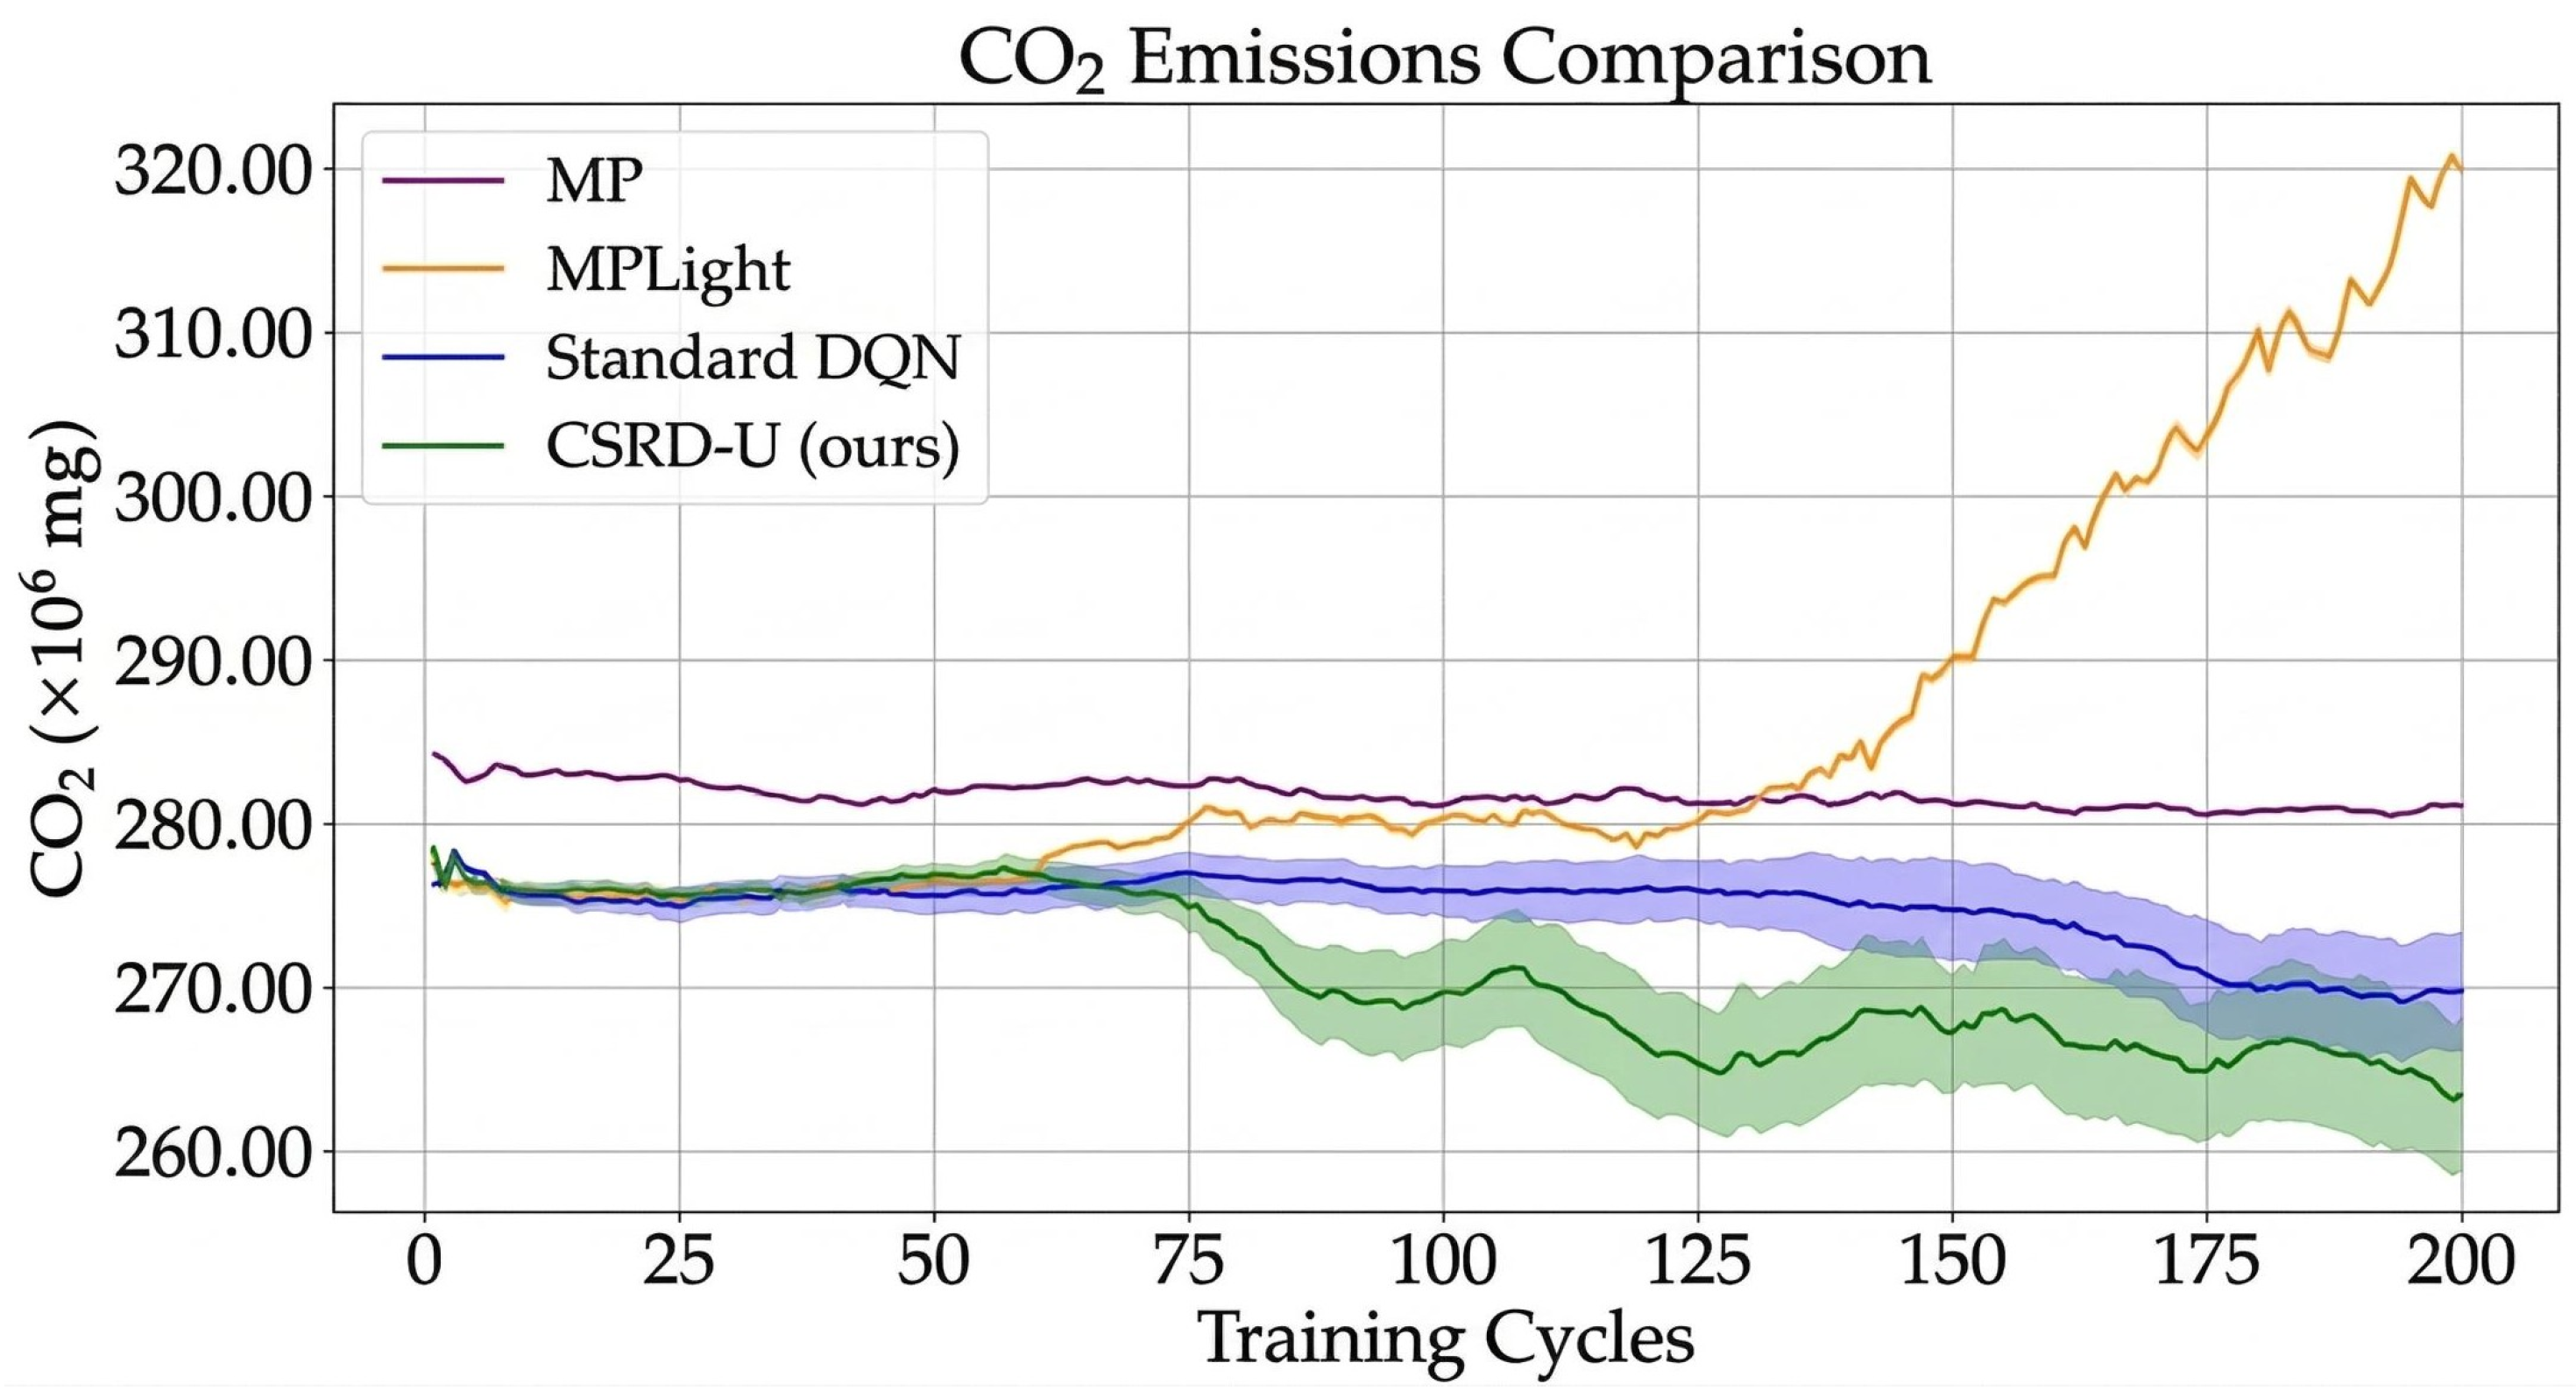
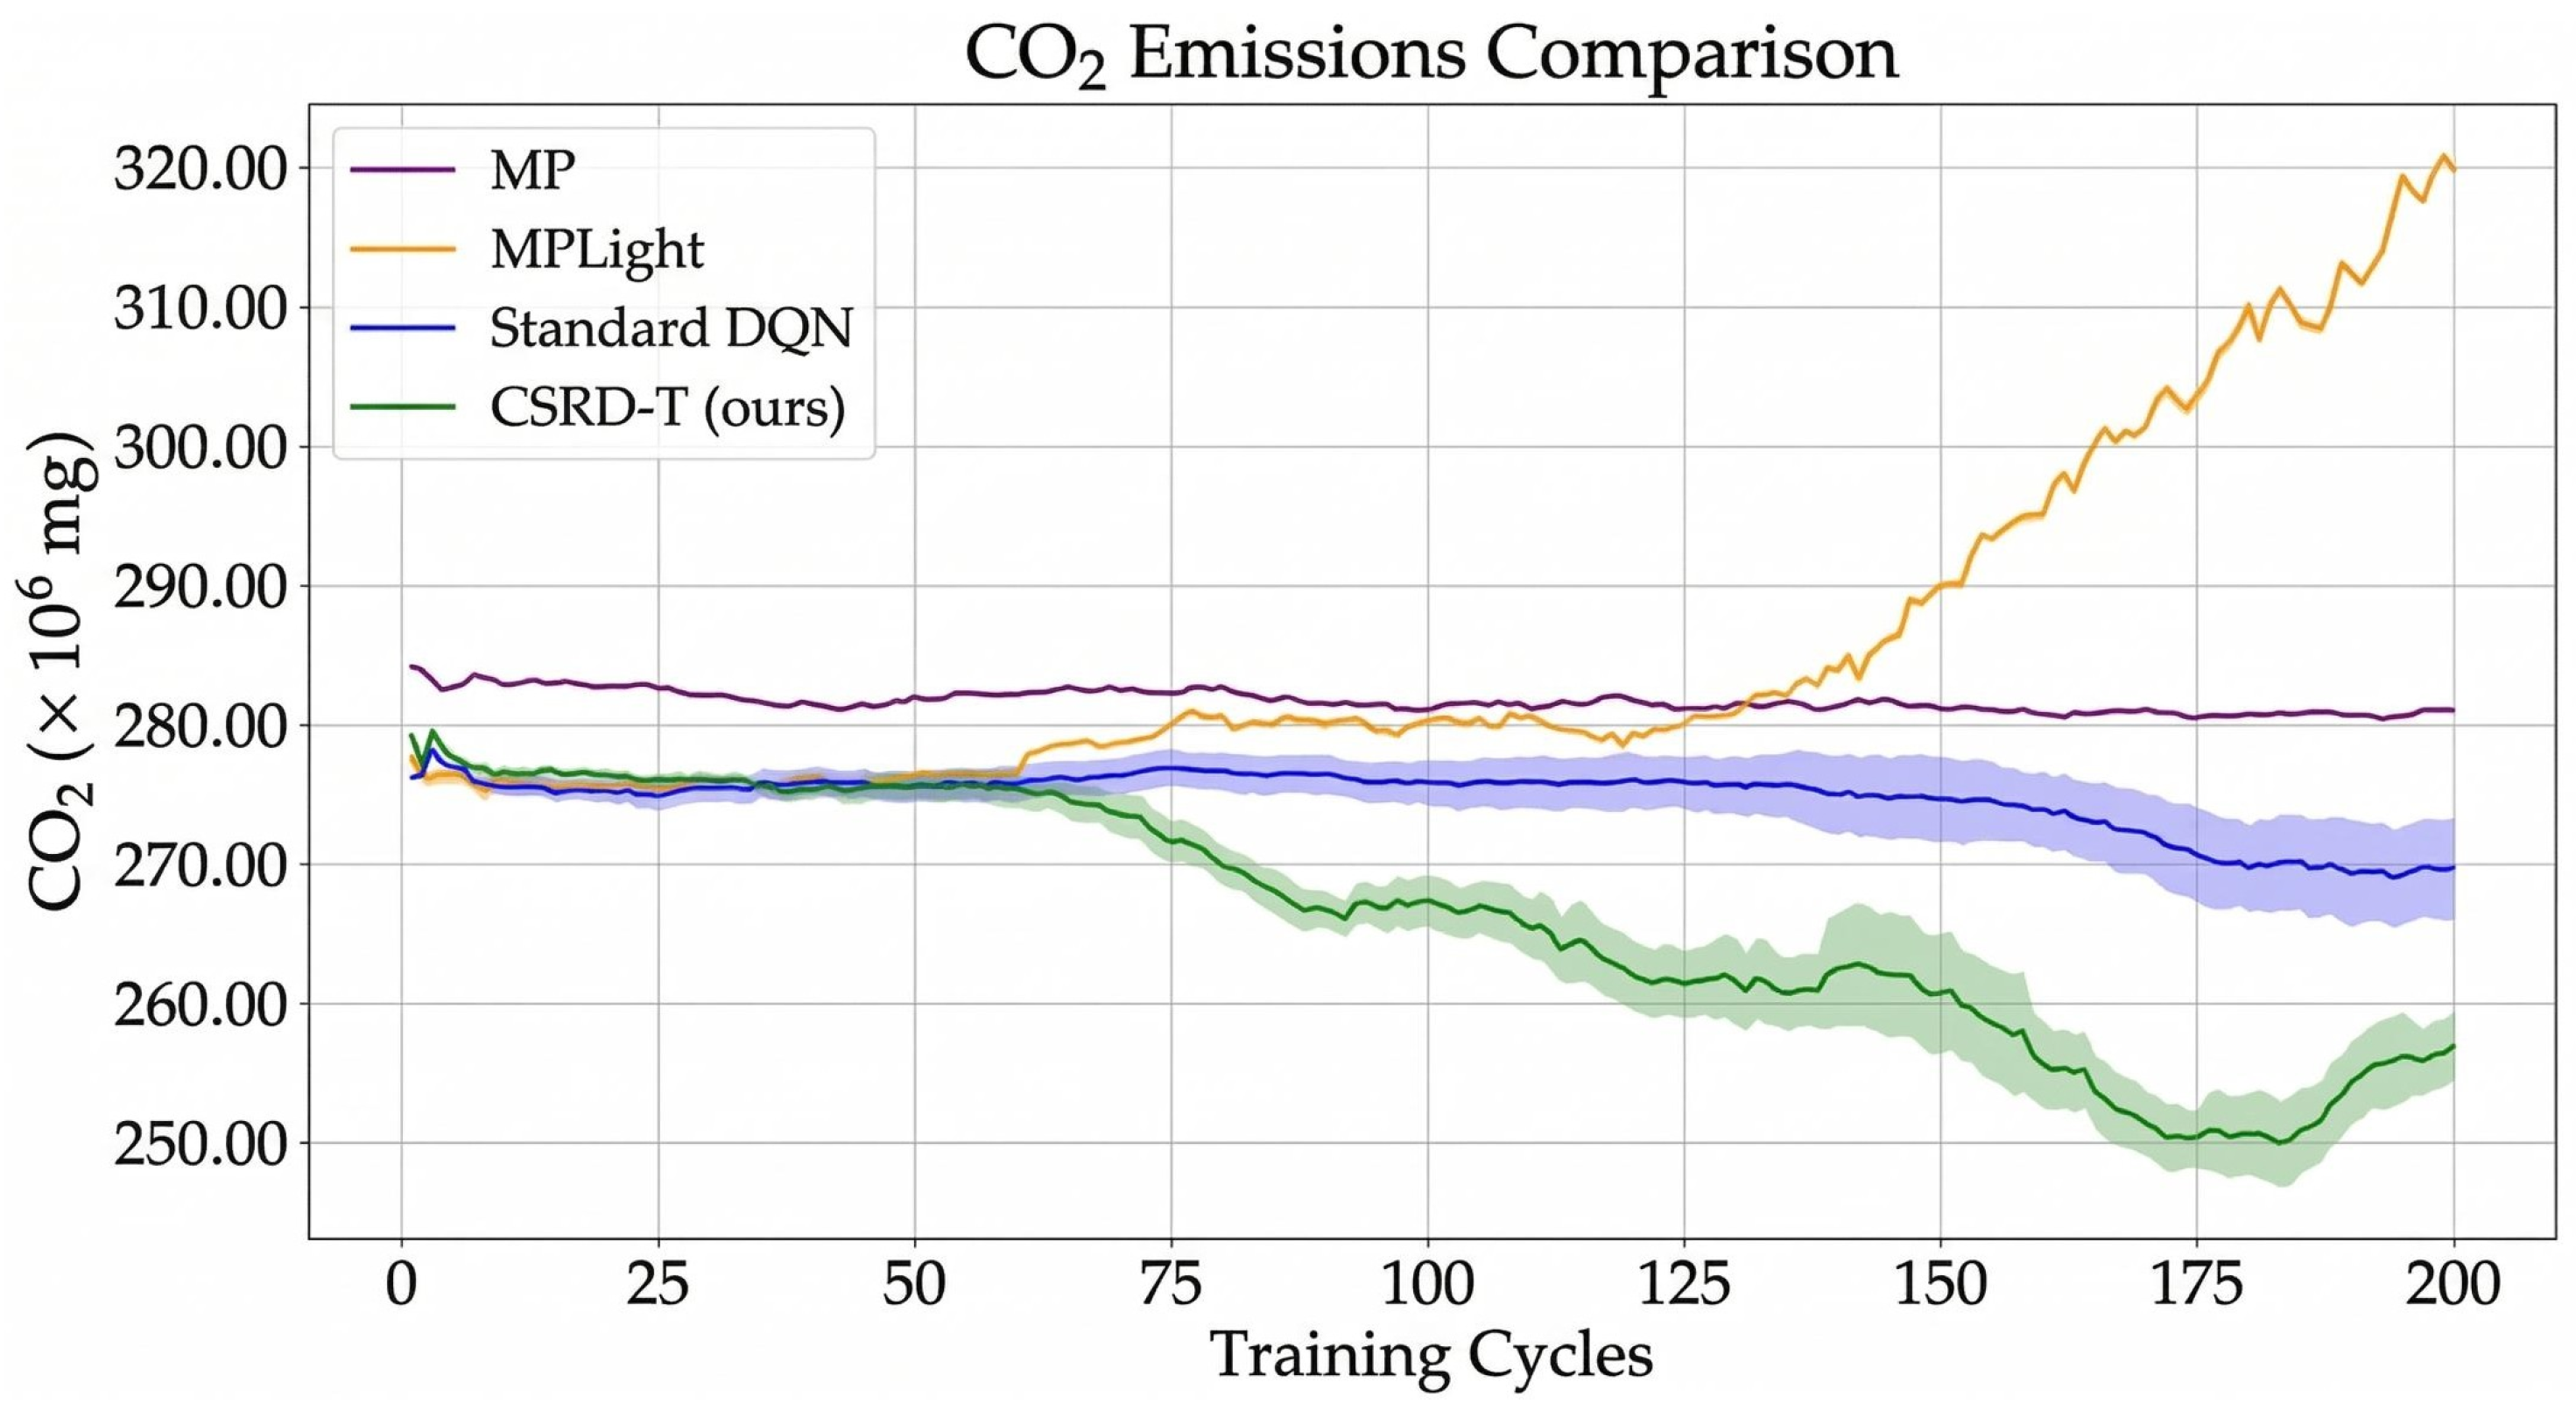

Disclaimer/Publisher’s Note: The statements, opinions and data contained in all publications are solely those of the individual author(s) and contributor(s) and not of MDPI and/or the editor(s). MDPI and/or the editor(s) disclaim responsibility for any injury to people or property resulting from any ideas, methods, instructions or products referred to in the content. |
© 2026 by the authors. Licensee MDPI, Basel, Switzerland. This article is an open access article distributed under the terms and conditions of the Creative Commons Attribution (CC BY) license.