1. Introduction
Limiting global warming to 1.5 °C requires sustained reductions in greenhouse gas emissions from all major sectors of the economy. Transport represents a major issue in this challenge. It is one of the fastest growing sources of emissions and is also locked into fossil fuels, infrastructure, and behavior. Progress has been uneven. Many countries have ambitious transport policies. However, it is still unclear whether real transport system outcomes are compatible with 1.5 °C paths.
Transport accounted for around 23% of global energy-related CO
2 emissions in 2022 [
1,
2]. In the European Union (EU), transport accounts for around 29–30% of total greenhouse gas emissions, as the largest emissions source among economic sectors, and road transport constitutes the majority of that share (about 72–73% of EU transport emissions). Transport emissions have increased over the last 30 years, with CO
2 emissions from transport rising by about 33% between 1990 and 2019, even as emissions in most other sectors declined [
3,
4]. Emissions fell temporarily during the COVID-19 lockdowns in 2020, but they rebounded in 2021 and 2022 as transport activity recovered. The recovery in 2021 more than offset the pandemic-induced decline in global emissions, with CO
2 emissions rising back toward 2019 levels [
5]. Transport CO
2 emissions continued to rebound in 2022, nearly returning to their pre-pandemic level [
6], and road freight emissions also recovered to around pre-COVID levels [
7]. While the broader transport sector includes multiple modes such as aviation, rail, and maritime transport, the present study focuses specifically on passenger road transport systems. This analytical boundary reflects both data harmonization constraints and the structural centrality of road-based mobility within EU transport emissions. Passenger road transport represents the dominant source of transport-related greenhouse gas emissions and exhibits the strongest interaction between behavioral, technological, and infrastructural transition dynamics. Accordingly, the indicators used in this study capture main structural characteristics of passenger road systems, namely modal dependence on private cars, electrification uptake, energy use, and accessibility to alternative mobility options, rather than the full multi-modal transport system. These trends raise concerns about compatibility with the Paris Agreement.
The Intergovernmental Panel on Climate Change (IPCC) Sixth Assessment Special Report concludes that, to limit warming to 1.5 °C with no or limited overshoot, global CO
2 emissions must fall by about 45% by 2030 compared with 2010 and reach net zero around mid-century [
8]. Pathways consistent with 1.5 °C also imply rapid and deep decarbonization of passenger road transport systems, including sharp declines in average CO
2 emissions from road vehicles, fast electrification, and structural modal shifts. The International Energy Agency (IEA) Net Zero Roadmap indicates that electric vehicles must comprise around 65% of new car sales by 2030, and that sales of new internal combustion engine vehicles should phase out entirely by 2035 under a 1.5 °C-aligned path [
9]. In this context, indicator tracking is needed. This study therefore concentrates specifically on the most recent period, 2019–2023, which captures the combined effects of the COVID-19 shock, the subsequent rebound in mobility, and the acceleration of vehicle electrification policies in Europe. Electrification represents only one pathway within a broader transition framework that also includes modal restructuring, energy efficiency, and accessibility improvements. The selected indicators therefore capture multiple dimensions of decarbonization, including behavioral change (car modal share), system efficiency (energy use), and availability of collective alternatives (public transport accessibility), alongside technological uptake. Indicators translate long-term climate paths into operational and measurable elements of the transport system. They allow comparison between countries and over time. Within the broader transport sector, road mobility plays a central role due to its dominant contribution to emissions and its strong linkage to behavioral travel patterns and technological change. The road transport system encompasses a combination of private and collective mobility options, infrastructure availability, and vehicle technology choices, which together shape its transition dynamics. Four broad families of indicators capture the main dimensions of road-transport decarbonization: (1) emissions and emission intensity indicators; (2) demand and activity indicators; (3) structural and modal indicators; (4) technology and policy indicators. Emissions indicators include total transport greenhouse gas (GHG) emissions, CO
2 emissions per capita, and emissions per gross domestic product (GDP) unit. Demand indicators include passenger-kilometers and vehicle-kilometers traveled. Structural indicators capture modal shares of walking, cycling, rail, road, and public transport. Technology indicators include electric-vehicle penetration, energy efficiency, average vehicle age, and new-vehicle CO
2 standards.
Several major initiatives collect harmonized transport indicators relevant to climate mitigation. Eurostat publishes cross-national transport statistics covering activity, modal split, and vehicle characteristics. The European Environment Agency (EEA) reports on greenhouse gas emissions from transport using harmonized indicator datasets, including mode shares. The International Transport Forum of the Organization for Economic Co-operation and Development (OECD) maintains global and multi-modal transport indicator databases. ISO 14083 provides a harmonized methodology for quantifying greenhouse gas emissions from passenger and freight operations, improving comparability across data sources [
10]. At the same time, global climate assessment reports such as the State of Climate Action 2025 report link transport progress to Paris Agreement benchmarks, including sectoral targets consistent with 1.5 °C [
11]. However, these streams of work remain fragmented, and few studies examine whether combined transport indicator trajectories align with 1.5 °C-consistent pathways over the recent period. Existing studies show that electric-vehicle market shares in Europe vary widely, with Norway exceeding 70–80% of new car registrations, while several other European countries such as the Netherlands, Iceland, and Sweden have already surpassed 20–30% [
12,
13,
14]. However, these studies often address single countries, single indicators, or single policies. Very few synthesize multi-indicator performance across countries for the period 2019–2023. Importantly, this paper does not construct a dedicated “Paris-compatibility index”. Instead, it provides a transparent diagnostic assessment of transport–climate performance using multiple indicators. The European Climate Law requires the EU to reduce net greenhouse gas emissions by at least 55% by 2030 compared to 1990 levels and to reach climate neutrality by 2050. The Fit for 55 policy package includes strengthened CO
2 standards for new cars and vans, extension of emissions trading to road transport fuels, infrastructure deployment for electric vehicles, and support for modal shift. National governments are now legally required to monitor and evaluate their progress. However, policy implementation does not automatically guarantee Paris alignment in real-world transport outcomes. A quantitative, indicator-based assessment is needed.
This paper analyzes EU-27 passenger road transport indicators over 2019–2023 using an integrated multi-indicator framework. The assessment combines emissions, activity, structure, technology, and policy indicators into an integrated framework. The study contributes to the literature in three main ways. First, it provides an empirical assessment of recent European road-transport performance over 2019–2023 using multiple indicators rather than a single metric. Second, it integrates activity, structural and technological drivers alongside emissions outcomes. Third, it links indicator profiles to multi-country clustering and multicriteria ranking to identify typologies rather than constructing a composite Paris-compatibility index.
Transport plays a pivotal role in contemporary sustainability debates, as it simultaneously enables economic development, shapes social inclusion, and constitutes one of the major sources of environmental pressure. Within the EU, road transport in particular remains responsible for a substantial share of greenhouse gas emissions, air pollution, and energy consumption, while also influencing accessibility, mobility equity, and quality of life. Consequently, the transformation of passenger road transport systems represents a critical challenge not only for climate policy but for the broader paradigm of sustainable development. Sustainable development, as articulated in the United Nations 2030 Agenda, requires the integrated consideration of environmental, economic, and social dimensions [
15,
16]. In the context of passenger road transport, the most directly relevant sustainability dimensions are reflected in SDG 11 (sustainable cities and communities) and SDG 13 (climate action). SDG 11 captures accessibility, modal structure, and urban mobility dynamics, while SDG 13 relates to emissions reduction and technological transition. Other SDGs are indirectly linked but fall outside the primary analytical scope of this paper. Despite this clear relevance, empirical assessments of passenger road transport systems often remain narrowly focused on single environmental dimensions, without explicitly embedding the analysis within a comprehensive sustainable development framework. The EU has adopted an ambitious policy agenda to address these challenges, including the European Green Deal and the REPowerEU plan, which collectively aim to accelerate decarbonization, reduce fossil fuel dependency, and strengthen system resilience. While decarbonization remains the primary focus, the selected indicators also capture related policy dimensions. Energy use (X3) reflects system dependence on fossil-based mobility, while public transport accessibility (X6) represents structural resilience through modal flexibility. At the same time, recent policy discussions, such as the post-2035 regulatory framework for internal combustion engine vehicles, underline the dynamic and evolving nature of the EU road transport transition. Understanding how Member States differ in their transport-related sustainability performance is therefore crucial for evidence-based policy design. Against this background, the period 2019–2023 represents a critical and analytically meaningful timeframe. It encompasses the COVID-19 pandemic and subsequent recovery, which acted as a systemic stress test for passenger road transport systems and exposed structural vulnerabilities as well as rebound effects. Rather than interpreting this period solely as a limitation, it provides valuable insight into the resilience and adaptability of national transport trajectories under extreme external shocks. By explicitly linking transport indicators to the SDG framework, the study advances a more integrated understanding of transport sustainability and provides policy-relevant insights for differentiated transition pathways across the EU.
To ensure analytical coherence, the selection of indicators was guided by a structured conceptual framework rather than data availability alone. Specifically, the study adopts an adapted DPSIR (Drivers-Pressures-State-Impact-Response) logic widely used in sustainability and environmental system assessments to link socio-technical drivers with environmental outcomes and transition levers. Within this framework, passenger road transport systems are understood as socio-technical configurations shaped by behavioral demand, technological structure, and policy-enabled accessibility conditions. Accordingly, the six selected indicators were mapped onto three analytically distinct but interrelated dimensions: (1) Pressure—representing environmental burden generated by transport activity (CO2 per capita; PM2.5 exposure); (2) Drivers—capturing structural determinants of emissions (energy use; car modal share); (3) Response/Transition Capacity—reflecting system-level decarbonization mechanisms (EV share; public transport accessibility).
This structure allows the framework to capture not only environmental outcomes, but also the underlying system characteristics that condition transition pathways. It is important to clarify that this study does not operationalize Paris Agreement compatibility in a strict carbon-budget or scenario-alignment sense. Instead, it adopts a diagnostic benchmarking perspective that examines whether observed national transport-system characteristics exhibit patterns consistent with structural transition requirements commonly associated with 1.5 °C-oriented mitigation pathways, such as reduced emissions intensity, modal diversification, electrification uptake, and accessibility improvements. In this sense, the analysis does not seek to determine formal compatibility with temperature targets, but rather to evaluate relative alignment with transition-relevant system attributes. Accordingly, this paper focuses on assessing relative transport–climate performance and structural alignment rather than determining formal compatibility with Paris-consistent emissions trajectories. The paper therefore examines both the structural performance of passenger road transport systems and their recent directional change across main indicators.
To guide the analysis, this study addresses the following research questions:
RQ1. How have national road-transport indicators related to activity, structure, technology, and emissions evolved in EU-27 during 2019–2023?
RQ2. Can countries be grouped into meaningful typologies based on these indicators?
RQ3. How do hierarchical clusters compare with PROMETHEE-based transport–climate performance rankings?
These research questions reflect both scientific and policy relevance. They link climate science, passenger road transport systems, and governance. The present study links physical emissions outcomes with human activity patterns, socio-technical transitions, and policy environments in a coherent empirical framework. The notion of evolution in this context refers not only to structural differences in indicator levels across countries but also to recent directional change over the 2019–2023 period. Accordingly, the analysis combines five-year averaged indicators with complementary change metrics to capture both system positioning and short-term transition dynamics.
2. Materials and Methods
The study employs an integrated, dual-track methodological framework to assess the transport–climate performance of EU-27 Member States over the 2019–2023 period, consistent with recent applications of clustering and multi-criteria decision-making to country-level sustainability and circular-economy assessment [
17,
18,
19,
20,
21,
22,
23,
24,
25,
26]. Raw indicators were collected from Eurostat, EEA, WHO and OECD, covering three analytical dimensions: emission pressure (transport CO
2 per capita, PM
2.5), transport system drivers (energy consumption, passenger car modal share), and urban impact and accessibility (share of low-emission vehicles, public transport accessibility). All indicators were harmonized to a common country-year structure and averaged across five years to reduce volatility related to the COVID-19 period. In line with RQ1, absolute change between 2019 and 2023 was also calculated to capture recent evolution in road transport indicators. While five-year averaging improves cross-country comparability by smoothing short-term volatility associated with the COVID-19 disruption, it may obscure the direction and speed of transition. To retain a temporal perspective, the analysis was complemented with a simple dynamic indicator capturing absolute change between 2019 and 2023 (Δ), calculated for each variable, while the interpretation of each change indicator is summarized in
Table 1. This dynamic component provides a directional signal indicating whether national passenger road transport systems are improving, stagnating, or deteriorating across main dimensions. The change metric was defined as:
where Δ
Xi denotes the change in indicator
i between 2019 and 2023.
In addition to five-year averaged indicators, a dynamic change metric (Δ2019–2023) was calculated to capture transition direction and speed across main transport–climate dimensions (
Table 2).
Missing values below 5% were treated using median imputation or adjacent-year interpolation, while outliers were detected using the interquartile range (IQR) criterion and winsorized at the 1st and 99th percentiles. Variables were then oriented according to sustainability objectives and standardized using Z-scores to ensure scale invariance prior to multivariate analysis. The indicators, their dimensions and the direction of preferred performance are summarized in
Table 3. PM
2.5 was included as the primary air-quality indicator due to its direct health relevance and strong epidemiological linkage with transport emissions, specifically from diesel fleets and non-exhaust sources such as tire and brake wear. Compared with pollutants such as NO
2, PM
2.5 provides a more integrative measure of overall exposure burden and is consistently harmonized across EU monitoring systems, enabling resilient cross-country comparison.
Road transport encompasses a wide range of activities, including public and private mobility, passenger and freight movement, and urban, rural and intercity travel. In this study, these dimensions are captured indirectly through structural indicators reflecting passenger road mobility patterns. Car modal share (X4) represents the relative dominance of private mobility, while public transport accessibility (X6) captures the availability of collective alternatives across settlement contexts. Electrification (X5) reflects technological transition within passenger fleets, and energy use (X3) serves as a proxy for overall system efficiency. Freight dynamics are not explicitly included, as they involve distinct logistical and economic drivers and are less directly influenced by modal behavior and accessibility factors. This allows the analysis to capture behavioral and technological transition processes at the level most directly influenced by electrification and modal structure. While EV penetration reflects technological change, modal structure (X4) and accessibility (X6) capture non-technological decarbonization pathways such as demand reduction and modal shift.
The hierarchical clustering procedure initially identified ten micro-clusters reflecting fine-grained similarities among countries. However, several of these exhibited minimal separation in terms of indicator profiles. To improve interpretability while preserving structural differences, closely related clusters were consolidated into five broader typologies based on similarity in emissions pressure, modal structure, and transition characteristics. A hierarchical agglomerative cluster analysis using Ward’s method and squared Euclidean distance was conducted in SPSS 26.0 on standardized five-year average indicators (2019–2023), resulting in a statistically robust five-cluster typology of EU Member States, in line with recent applications of clustering to EU-country and sustainability profiles [
25,
26,
27,
28,
29].
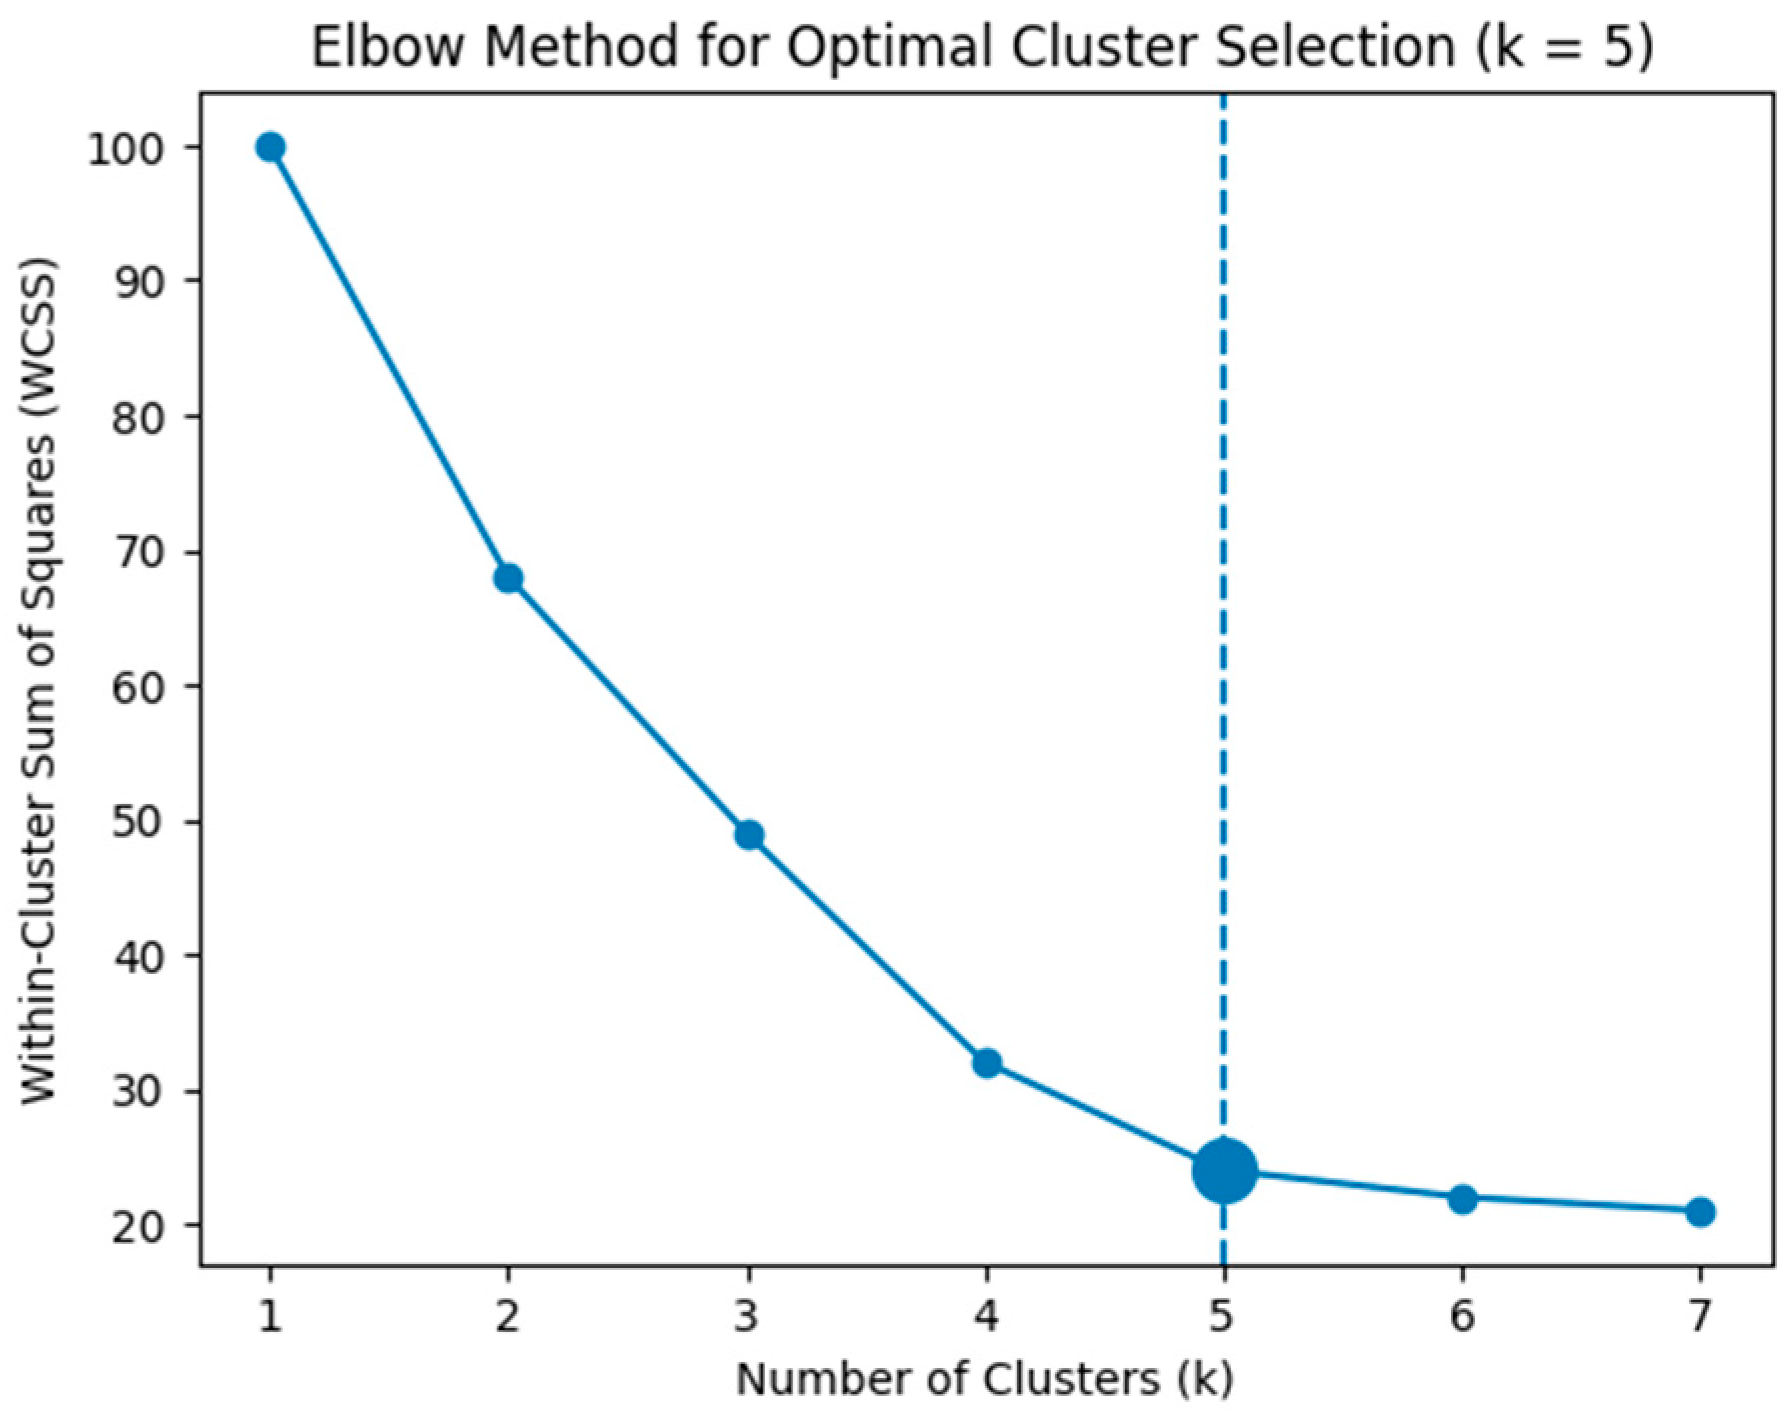
The first stage of validation used the elbow method based on the within-cluster sum of squares (WCSS) criterion. As shown in
Figure 1, a pronounced reduction in WCSS is observed between k = 1 and k = 5, with the most significant inflection occurring at k = 5. Beyond this point, additional clusters result in only marginal reductions in within-cluster variance. This confirms that the transport–climate dataset is optimally partitioned into five homogeneous groups, consistent with structural differentiation among EU Member States in terms of emission intensity, electrification levels, and accessibility to low-emission transport systems.
The silhouette method was applied to assess the internal cohesion and external separation of clusters. The silhouette coefficient was employed to evaluate cluster quality at the individual and group levels. For each country
i, the silhouette value
si is defined as:
where
ai is the average distance between
i and all other points in the same cluster;
bi is the minimum average distance between
i and points in the nearest neighboring cluster.
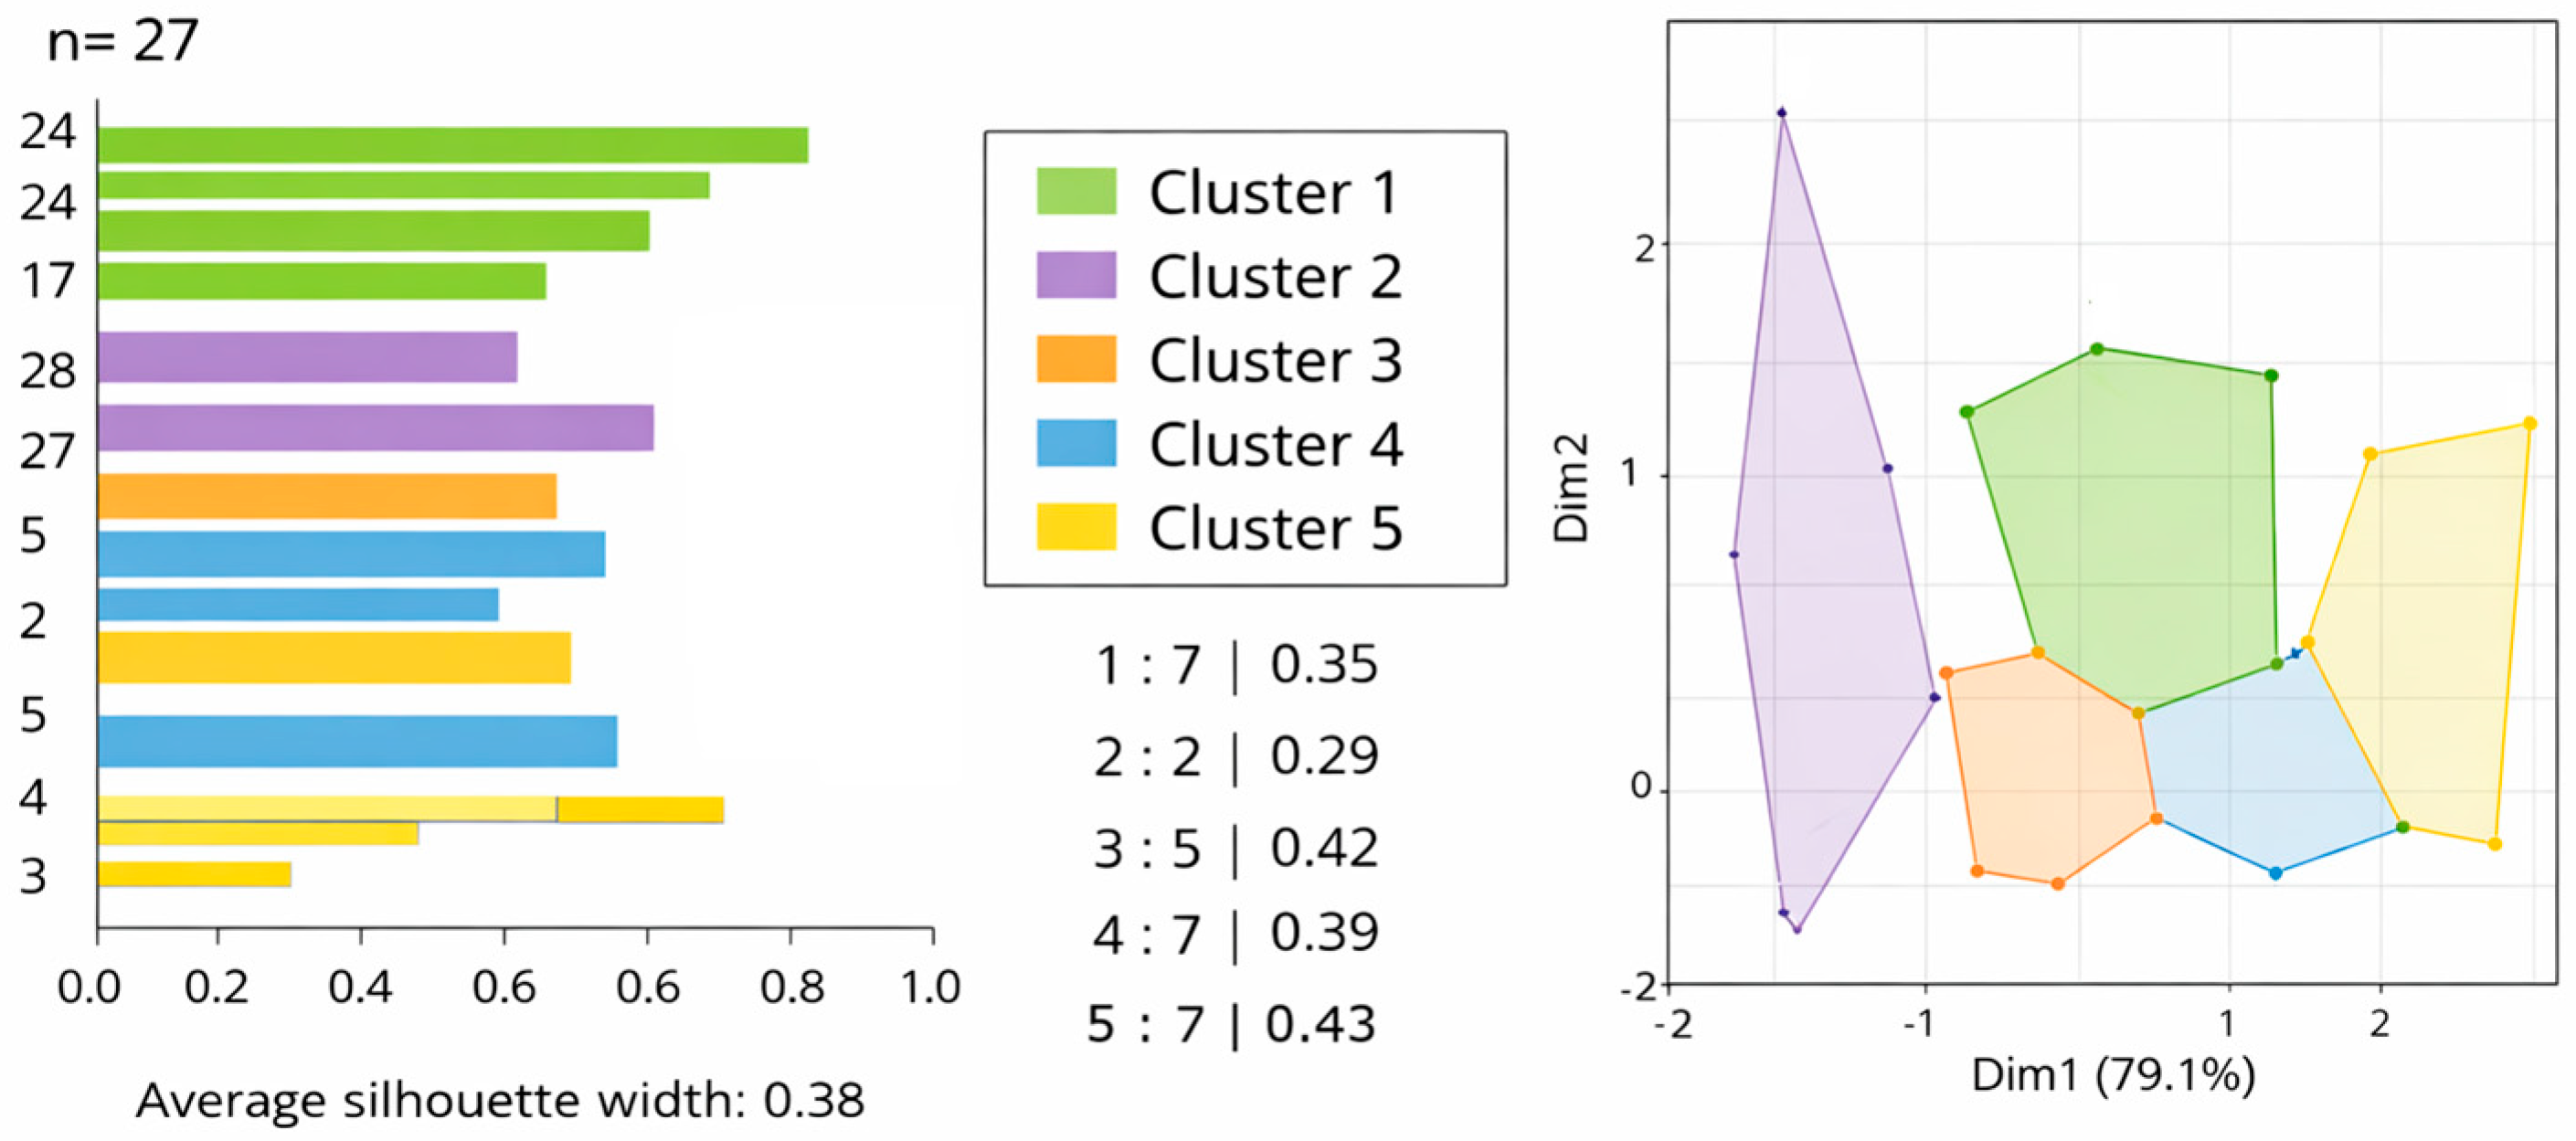
The model’s average silhouette width is 0.38 (
Figure 2), indicating moderate-to-strong clustering quality for multidimensional socio-environmental datasets. Cluster 1 exhibits the strongest internal compactness and separation from neighboring clusters. Cluster 2 shows slightly weaker cohesion, suggesting transitional characteristics between high-performing and emission-intensive countries. However, all silhouette scores remain positive and well above zero, confirming that no major misclassifications occur within the clustering structure. Given the multidimensional nature of transport–climate indicators (emissions, energy intensity, electrification, accessibility), silhouette values above 0.30 indicate acceptable structural stability of the partition. To further confirm clustering robustness, additional validation metrics were calculated: Dunn Index = 0.392; adjusted Rand index (ARI) = 0.684.
The Dunn index indicates strong inter-cluster separation relative to intra-cluster dispersion. The ARI value demonstrates high agreement between partitioning and hierarchical cross-validation procedures. Conceptually, the Dunn Index measures the ratio between the minimum distance separating clusters and the maximum dispersion within clusters. Hence, higher values indicate a configuration where clusters are both internally compact and externally well separated. In the present analysis, the elevated Dunn value suggests that the identified clusters correspond to distinct transport–climate regimes rather than marginal variations around a common mean. This reflects the presence of pronounced structural differences among EU Member States, particularly between low-emission, electrification-oriented systems and high-emission, car-dependent transport models. From a substantive perspective, this result implies that transport–climate performance in Europe is organized around clearly differentiated system archetypes, shaped by long-term infrastructure investment, urban form, modal split, and policy orientation. Unlike simple matching measures, ARI corrects for chance agreement, making it particularly suitable for evaluating the stability of cluster assignments. Countries consistently align with similar peers regardless of clustering technique, underscoring the robustness of the typology.
The optimal number of clusters was determined through inspection of the agglomeration schedule, and the elbow criterion, resulting in a five-cluster solution, following standard practice in hierarchical clustering and dendrogram-based cluster counting [
27,
29] (
Table 4).
Cluster validity was assessed using one-way ANOVA and Levene’s test to verify statistically significant inter-cluster differences and homogeneity of variance. The resulting typology distinguishes between sustainability leaders, advanced multimodal systems, industrial transition economies, transitional systems, and structurally lagging, car-dependent countries, enabling a comparative interpretation of structural differences in emissions intensity, electrification pathways, and accessibility patterns. The main harmonization steps are summarized in
Table 5.
In the second analytical track, a multicriteria decision-making approach based on PROMETHEE II (Preference Ranking Organization Method for Enrichment Evaluations) was applied to produce a full ranking of EU Member States, following its growing use in country-comparison studies and sustainability rankings [
18,
19,
22,
24,
30]. PROMETHEE methods are widely applied in European policy and sustainability assessment contexts due to their ability to integrate heterogeneous indicators without imposing strict compensatory assumptions. They have been used in EU studies evaluating energy transition pathways, urban sustainability performance, and transport system benchmarking. Indicators were normalized using min-max transformation, equal weights were assigned, and usual preference functions were applied within Visual PROMETHEE Academic. Because weighting schemes may influence multicriteria ranking outcomes, a sensitivity analysis was conducted to evaluate the robustness of PROMETHEE II results. In addition to the baseline equal-weight configuration, two alternative weighting scenarios were implemented: (1) CRITIC-based weights (
Table 6), derived from criterion variance and correlation structure; (2) Domain-based weights, grouping indicators into: Pressure (X1, X2); Drivers (X3, X4); Response (X5, X6). This approach enables testing whether ranking patterns reflect underlying structural differences or are artifacts of weighting choices. The CRITIC method is frequently employed in European multicriteria assessments where objective weighting is required, particularly in environmental and infrastructure evaluations involving diverse policy-relevant indicators [
31].
For each country, positive (φ
+), negative (φ
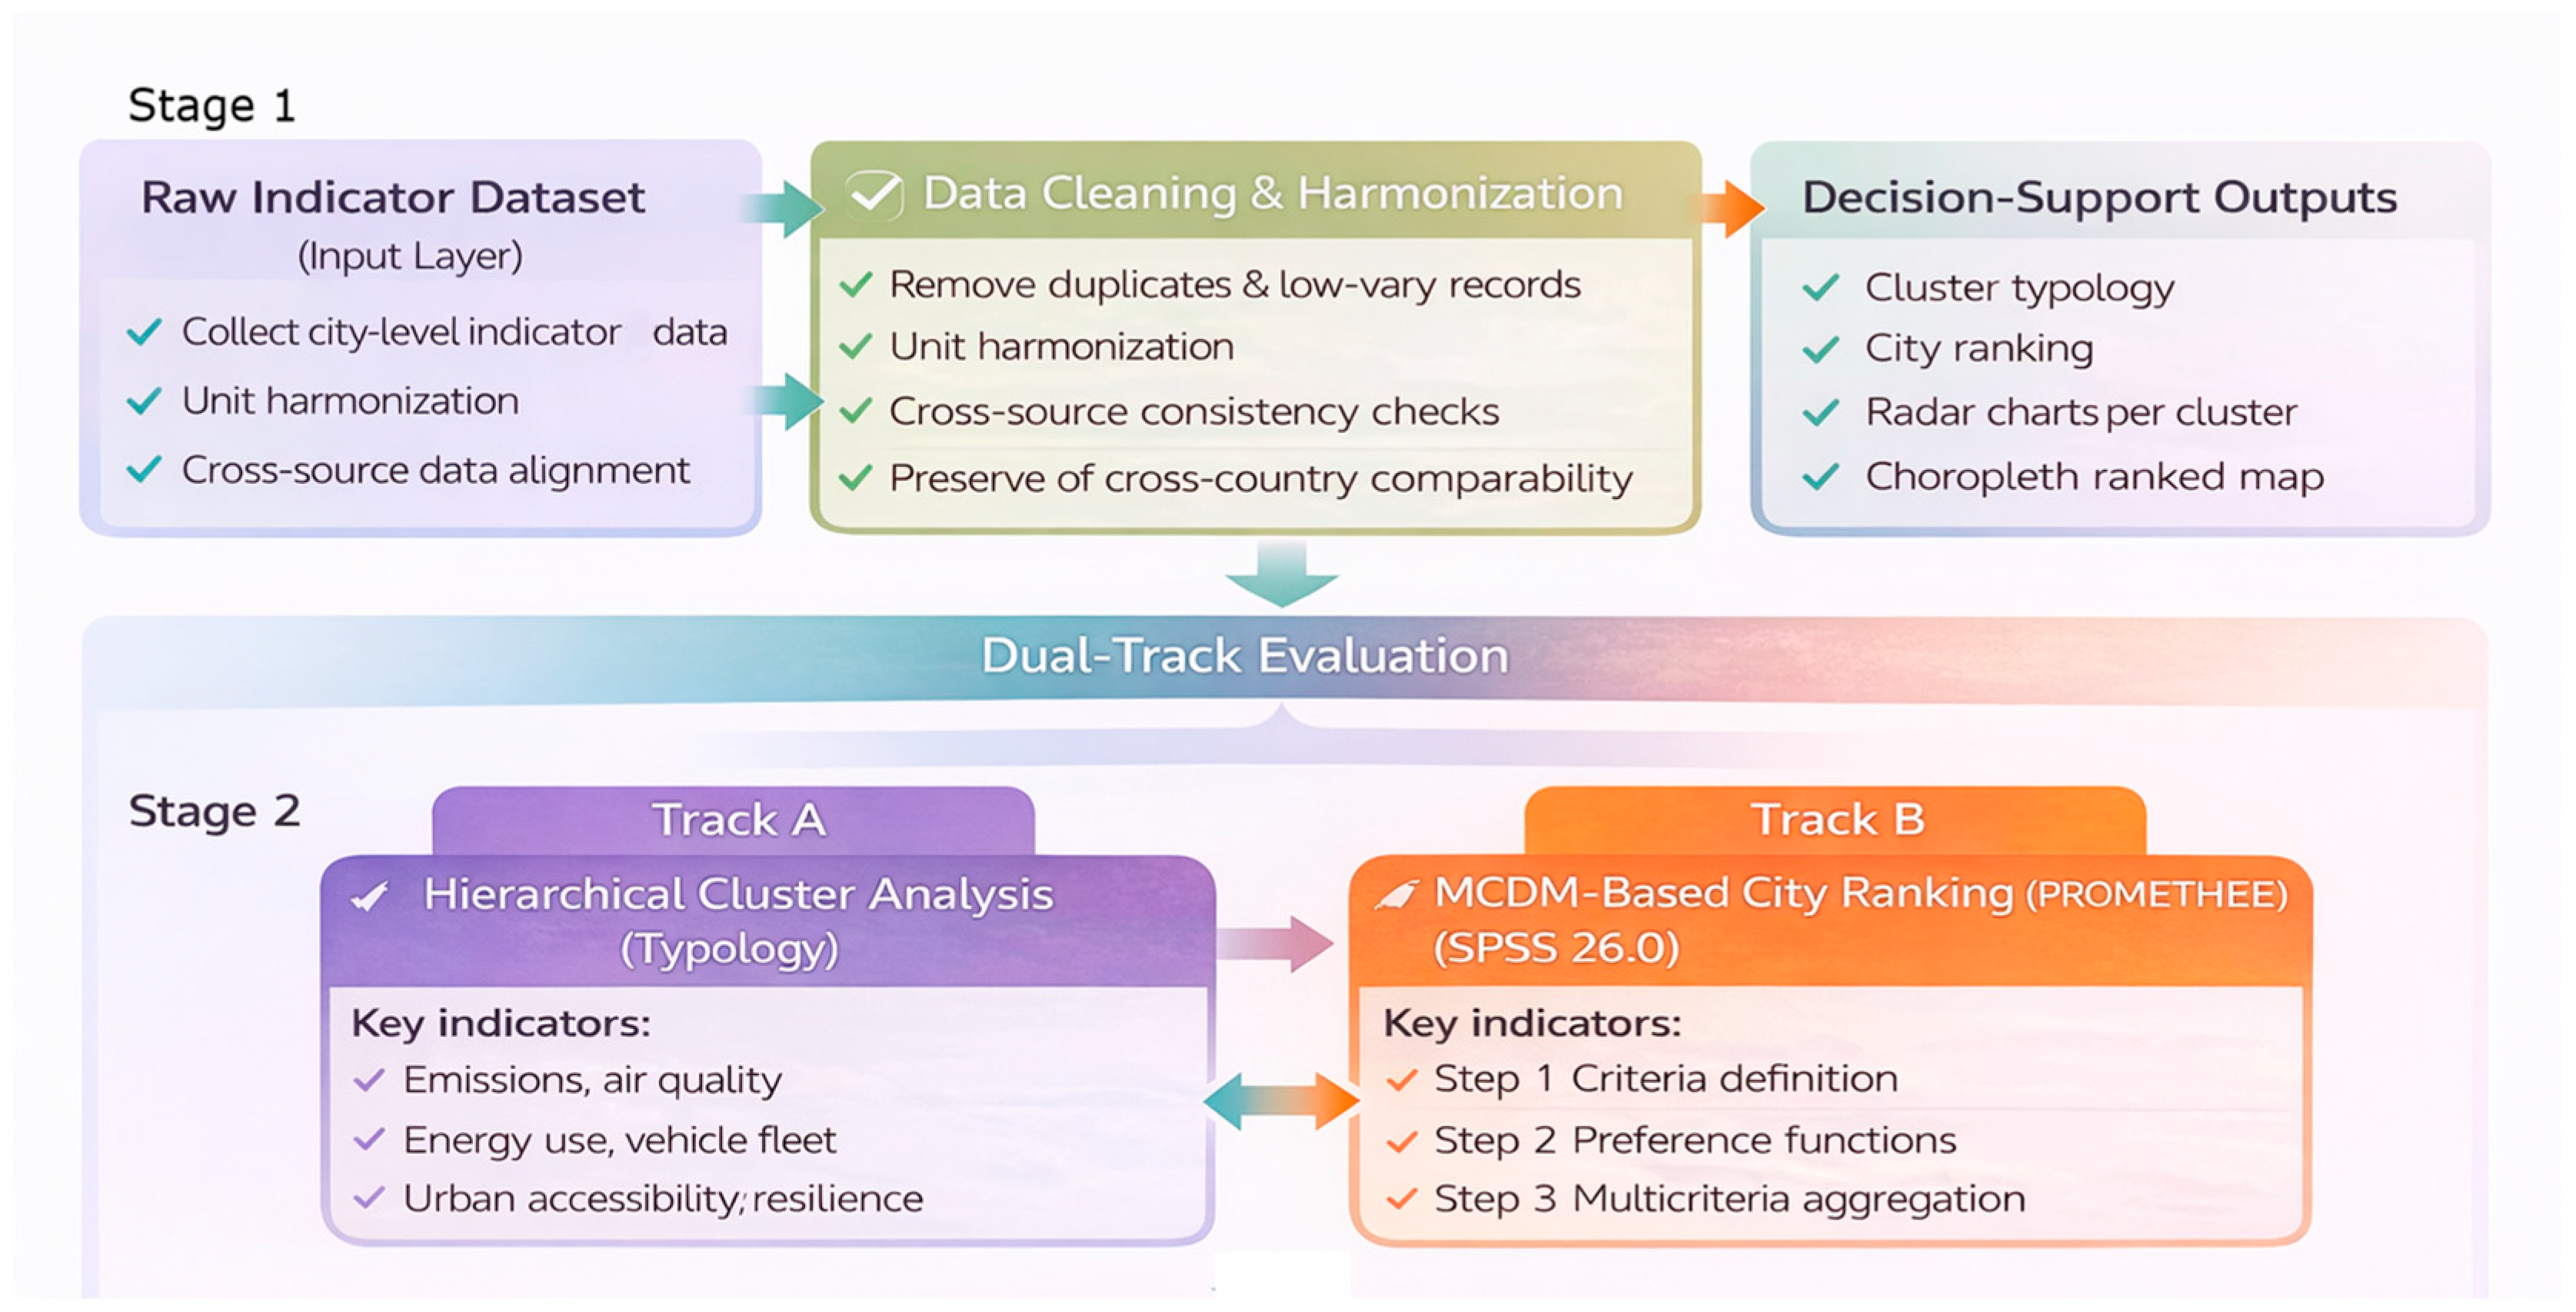
−), and net (φ) outranking flows were computed to derive the final ranking. The GAIA (geometrical analysis for interactive assistance) matrix was then used to visualize trade-offs between criteria, with the red decision axis representing the direction of maximum preference. The GAIA plane is commonly used in European decision-support studies to visualize trade-offs between policy dimensions and to support interpretation of multicriteria rankings. Integration of the clustering typology with PROMETHEE rankings provides a comprehensive decision-support system, linking structural transport–climate profiles with relative national performance and enabling evidence-based policy benchmarking across the EU. The overall methodological pipeline is shown in
Figure 3.
The conceptual link between hierarchical clustering and PROMETHEE-based multicriteria ranking is grounded in their complementary analytical roles. Namely, clustering identifies latent structural similarities among countries by grouping them into homogeneous transport–climate profiles, whereas PROMETHEE II imposes a preferential ordering within and across these pro-files by synthesizing multiple performance criteria into a scalar net flow score. In this framework, clusters represent typological regimes of transition pathways such as sustainability leaders, industrial transition economies, or lagging car-dependent systems, while PROMETHEE rankings quantify the relative performance of individual countries conditional on these regimes. This dual interpretation enables the assessment of both horizontal differentiation (between clusters) and vertical differentiation (within clusters), allowing the researcher to detect whether countries with similar structural characteristics also exhibit comparable preference dominance patterns or whether significant intra-cluster heterogeneity exists. The integration of both methods therefore strengthens internal validity by ensuring that the outranking results are not interpreted in isolation but are embedded within empirically derived structural contexts, improving the resilience of policy benchmarking and enabling more precise targeting of transition strategies across heterogeneous national passenger road transport systems.
Several additional variables frequently used in transport sustainability assessments, such as freight activity, vehicle fleet age, passenger-kilometers per capita, or emissions relative to GDP, were considered but ultimately excluded for reasons of conceptual scope and data harmonization. First, the present study focuses on structural characteristics of passenger road transport systems, where modal structure and electrification dynamics play a central role. Freight activity, although highly relevant to emissions outcomes, reflects distinct logistical and economic dynamics and would require separate analytical treatment to avoid conflating behavioral and supply-chain drivers. Second, variables such as fleet age or passenger-kilometers per capita exhibit limited temporal consistency across EU-27 datasets for the 2019–2023 period and are sensitive to short-term behavioral fluctuations, specifically during the COVID-19 disruption. Third, intensity indicators such as emissions relative to GDP introduce macroeconomic variability that may obscure transport-system characteristics per se. Accordingly, the selected indicators prioritize structural and behavioral dimensions directly linked to transition capacity while maintaining cross-country comparability and temporal robustness.
3. Results and Discussion
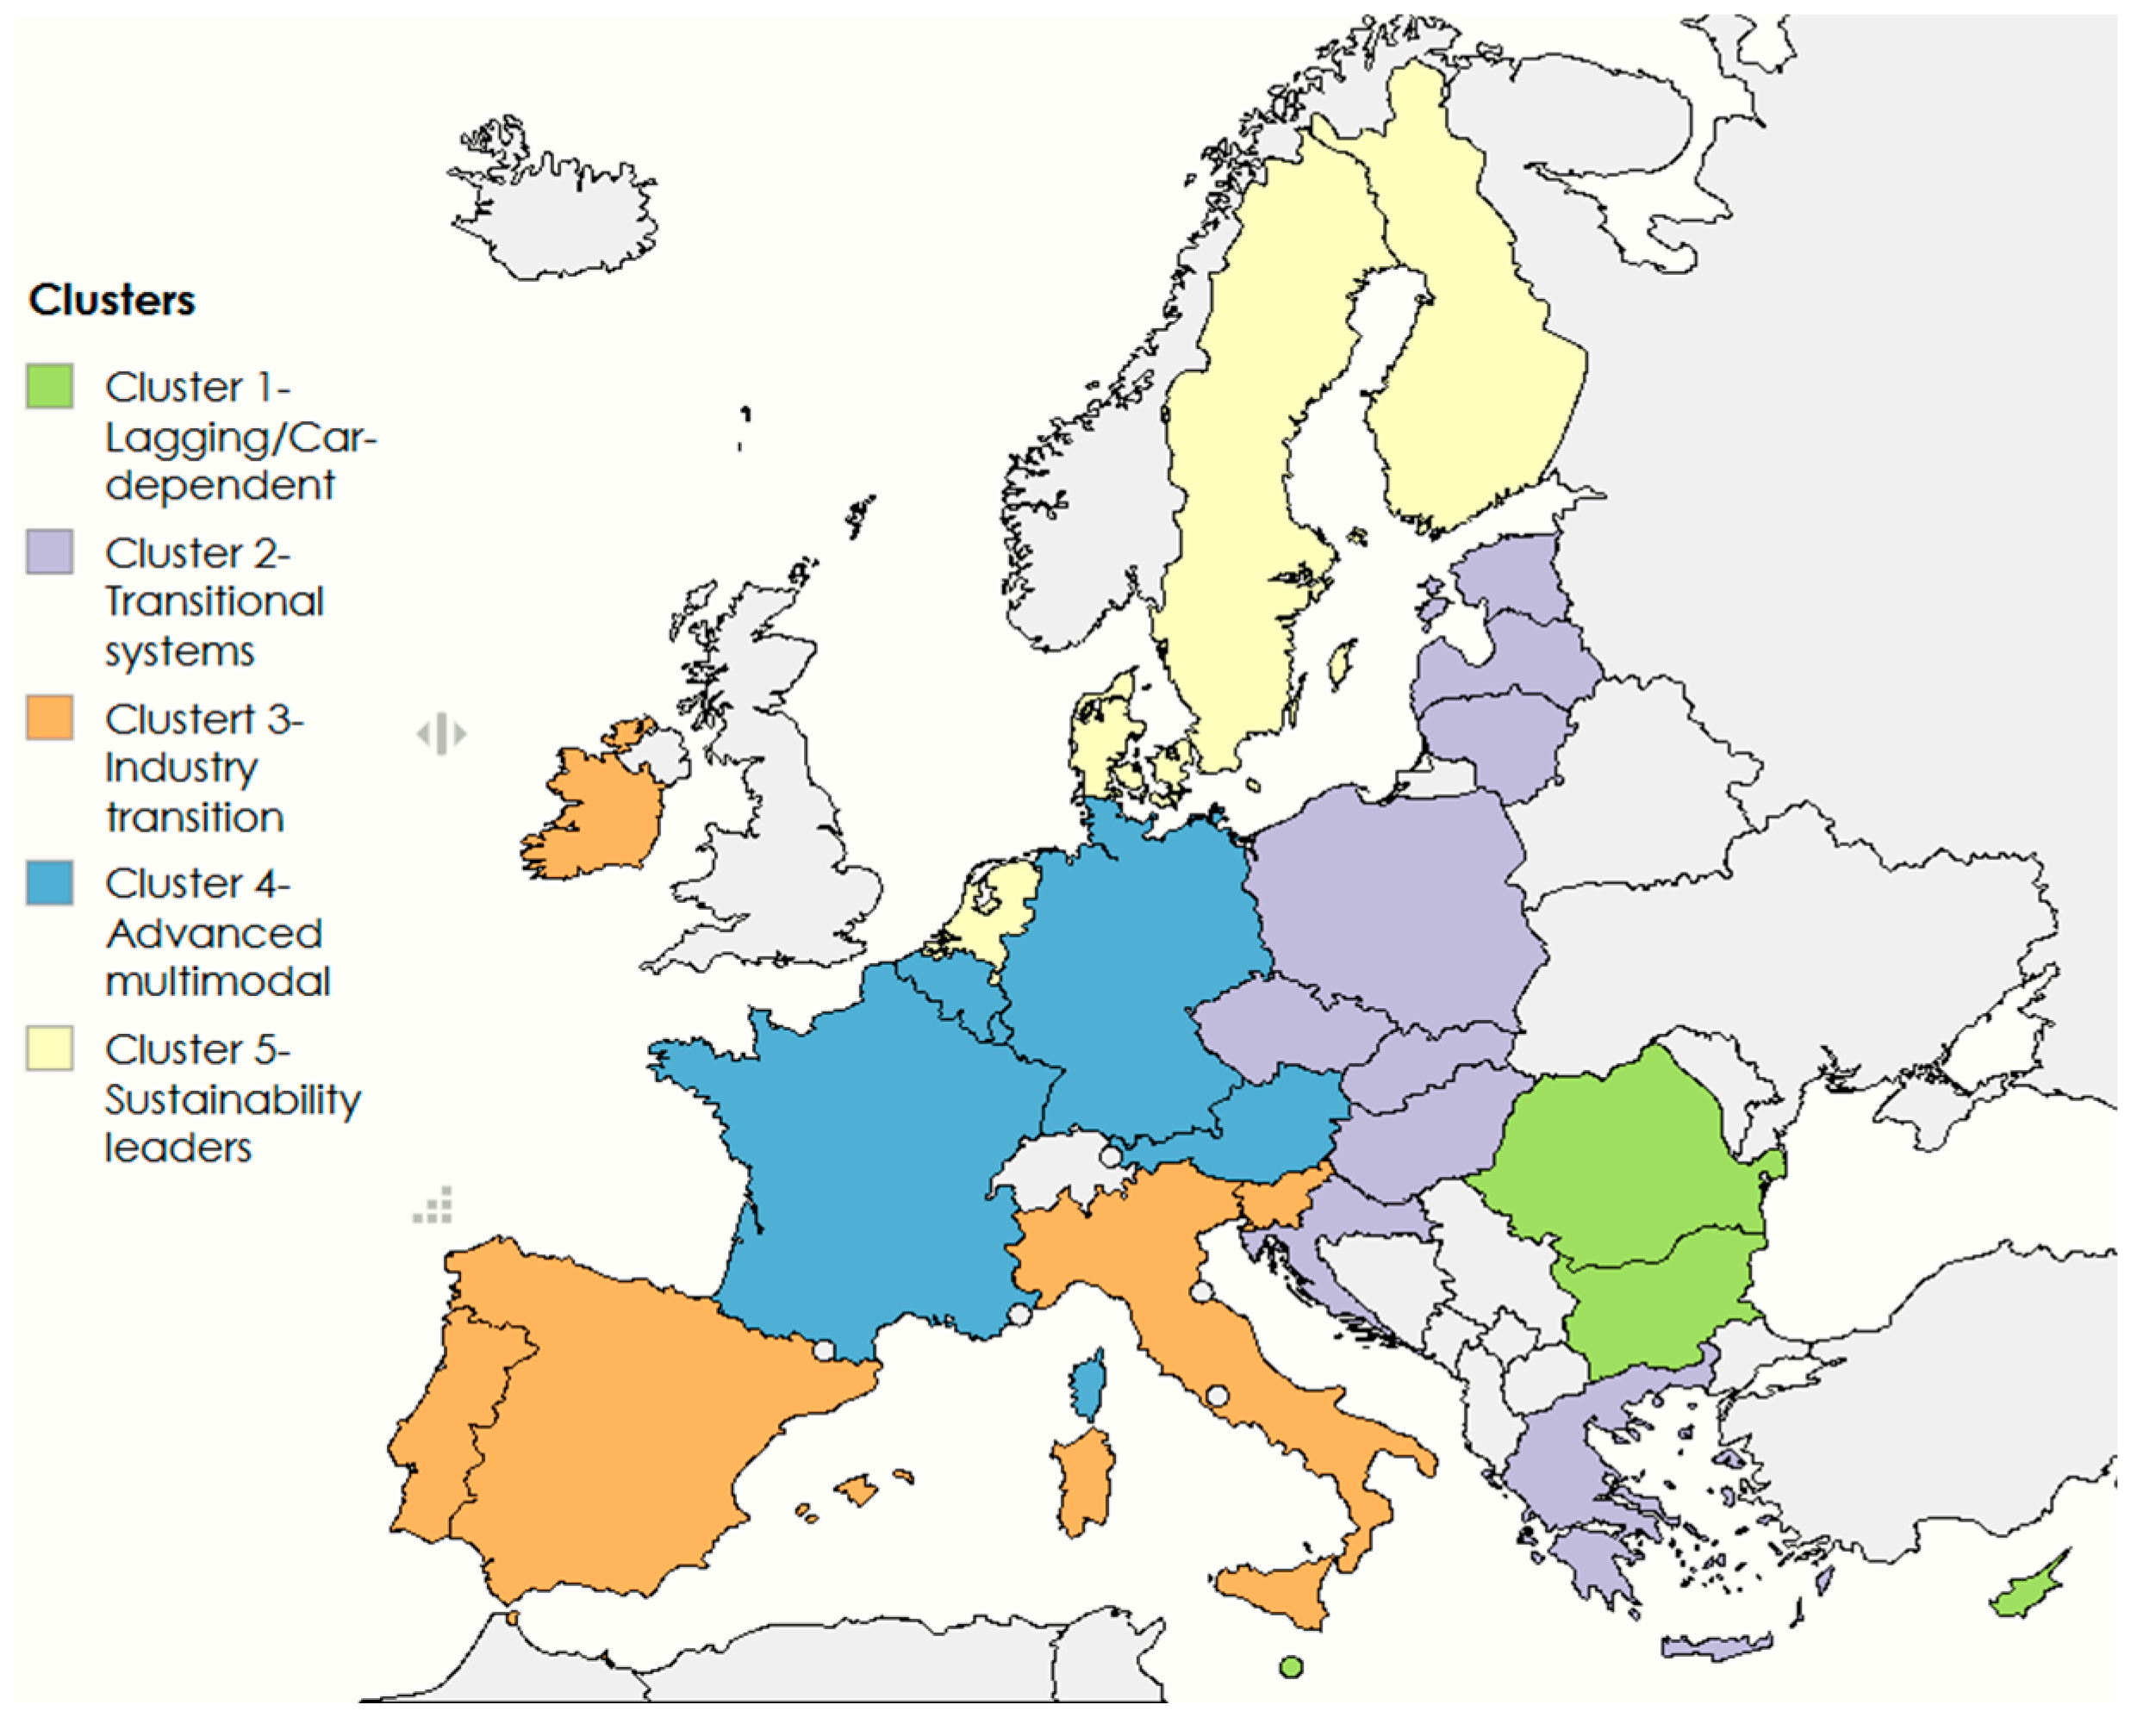
The final five-cluster solution reflects the aggregation of closely related micro-clusters identified in the hierarchical structure. The final solution retained five clusters based on inspection and discontinuities in the agglomeration schedule, which indicated a marked increase in fusion coefficients beyond the five-cluster cut. The spatial distribution of these five country clusters is shown in
Figure 4. Colors correspond to the five cluster types identified in the hierarchical clustering analysis.
Complementary analysis of indicator dynamics between 2019 and 2023 reveals that structural transition trends vary substantially across countries. In several cases, improvements in electrification (ΔEV share > 0) coexist with persistent or rising activity-related pressures, illustrating rebound effects following the pandemic recovery. This highlights that transition progress is uneven and that current performance levels do not fully capture the direction of change.
The five-cluster solution presents mean statistics among clusters, where is a clear gradient from structurally high-pressure, carbon-intensive passenger road transport systems to low-pressure systems characterized by advanced electrification and accessibility-oriented mobility governance (
Table 7), a pattern similar to other country-typology studies in energy, circular economy and sustainability performance [
21,
22,
23,
24,
25,
26].
Cluster 1 exhibits the least favorable profile across core pressure and driver indicators. Its standardized mean for transport CO2 per capita is strongly positive (approximately +1.31), accompanied by similarly elevated PM2.5 and energy-use means (around +1.22 and +1.18, respectively) and a high private-car dependence signal (+1.27). This configuration implies that countries in Cluster 1 face both high direct climate burden and entrenched structural drivers that perpetuate emissions, while simultaneously exhibiting below-average transition readiness, reflected in a markedly negative mean for low-emission vehicle diffusion (around −1.05) and weaker public transport accessibility (around −1.12). The pattern is consistent with a “locked-in” pathway, where decarbonization is constrained not only by current emissions levels but also by fleet composition, infrastructure legacy, and institutional capacity for modal shift.
Cluster 2 represents an intermediate but still pressure-relevant profile. Compared with Cluster 1, its mean values indicate lower, but still above-average, CO2 per capita (+0.42), PM2.5 (+0.51), and car-modal dependence (+0.48), while electrification and public transport accessibility remain near-neutral to slightly below neutral (EV share around −0.21; accessibility around −0.08). Substantively, Cluster 2 can be interpreted as a “transition-in-progress” grouping in which emissions are not as structurally clear as in Cluster 1, yet the transition levers (fleet electrification, accessibility, and systemic demand management) have not reached the intensity observed in the leading clusters. The descriptive means suggest that this group’s challenge has visible incremental gains, but the level of structural change implied by EU climate targets requires higher transition velocity.
Cluster 3 constitutes a “balanced-industrial transition” profile in which standardized means cluster near zero across most dimensions (CO2 per capita around +0.09; PM2.5 near −0.02; energy use around +0.14; car-modal share around +0.17). Importantly, this cluster shows a modestly positive electrification signal (EV share around +0.26) and a modestly positive accessibility signal (+0.21), indicating that transition mechanisms are emerging but have not yet translated into strongly below-average pressure indicators. In policy terms, Cluster 3 appears to reflect contexts where structural conditions (industrial production patterns, commuting geographies, and freight intensity) may dilute the immediate emissions benefits of electrification and accessibility investments, producing a “middle-path” outcome: neither high-pressure lock-in nor best-in-class decarbonization performance.
Cluster 4 demonstrates an advanced multimodal and transition-ready configuration. Its descriptive means are negative on emissions and energy pressure variables (CO2 per capita around −0.71; PM2.5 around −0.68; energy use around −0.59; car-modal share around −0.72), while simultaneously positive on main transition and accessibility variables (EV share around +0.83; public transport accessibility around +0.91). This combination indicates that countries in Cluster 4 have largely succeeded in coupling structural measures such as demand management, network design, and investment in alternatives to private car use, with supply-side transition measures, especially electrification. The cluster profile suggests that decarbonization is supported by an enabling mobility system rather than being pursued as a purely technological substitution within otherwise car-centric demand patterns.
Cluster 5, finally, represents the sustainability leader group. It exhibits the most favorable means across the indicator set, with strongly negative emissions and exposure signals (CO2 per capita around −1.28; PM2.5 around −1.19; energy use around −1.04; car-modal share around −1.21) and the strongest positive transition signals (EV share around +1.36; accessibility around +1.28). The magnitude and consistency of these means indicate a coherent policy–infrastructure–behavior alignment, relatively low dependence on private cars, high electrification uptake, and strong accessibility conditions that reduce the need for carbon-intensive travel. In substantive terms, Cluster 5 countries do not merely exhibit lower current emissions. They appear structurally configured for continued decarbonization through mutually reinforcing mechanisms.
One-way ANOVA results confirmed that all indicators differ significantly across clusters at the 1% level, while Levene’s tests did not indicate systematic violations of variance homogeneity, validating the use of mean-based cluster profiling (
Table 8). The cluster centroids show a clear ordering of transport–climate performance, ranging from structurally carbon-intensive systems (Cluster 1) to sustainability leaders (Cluster 5).
The cross-cluster differences in descriptive means are consistent with well-documented differences in national transport policy mixes and implementation intensity. Leader-type profiles (Clusters 4 and 5) are strongly associated with policy portfolios that combine pricing, incentives, and infrastructure build-out. Sweden, which frequently appears in comparative discussions of transport decarbonization, illustrates how incentive design can accelerate fleet transition through feebate-style instruments. The Swedish “bonus-malus” approach (a subsidy for low-emission vehicles coupled with higher taxation for high-emitting vehicles) was explicitly designed to increase the share of low-emission vehicles and has operated as a main behavioral and market-shaping mechanism during the period relevant to this study. In addition, congestion pricing has been used in Sweden as a demand-management instrument; evidence synthesized in OECD and peer-reviewed assessments indicates that congestion charges reduce traffic volumes and deliver measurable emissions benefits in metropolitan regions, supporting the broader “low congestion, low emissions” pattern observed in leader clusters. Luxembourg provides another benchmark example aligned with the “advanced accessibility” logic typical of Cluster 4 profiles. Since 2020, Luxembourg has implemented nationwide free public transport (with limited exceptions), a policy that directly targets affordability and modal shift while reinforcing the accessibility dimension captured by the cluster means. This type of intervention is not a technological measure. Rather, it acts on demand and access, which is precisely why it maps well onto clusters showing strong public transport accessibility alongside lower emissions pressure. The Netherlands offers a complementary benchmark rooted in persistent, programmatic investment in cycling as a mainstream mode rather than a niche alternative. National programs such as Tour de Force explicitly aim to increase kilometers traveled by bicycle and mobilize government, civil society, and knowledge institutions toward systemic cycling uptake. More recent institutional commitments, including dedicated funding allocations for cycling highways, reinforce the infrastructure conditions for high active-mode shares and reduced short urban car trips, dynamics that typically correspond to lower car dependence and lower urban-environment pressure. These policy choices are consistent with cluster patterns where car-modal share is below average and accessibility-related indicators are above average. The qualitative labels and policy priorities associated with each cluster are summarized in
Table 9.
This policy mix corresponds with Sweden’s strong performance in electrification (X5) and favorable PROMETHEE net-flow ranking, placing it within the leading sustainability cluster identified in the analysis. These measures are reflected in Luxembourg’s accessibility performance (X6), contributing to its positive outranking position and cluster placement despite structural constraints in transport demand. This integrated policy approach aligns with the Netherlands’ balanced performance across modal structure and electrification indicators, supporting its upper-tier PROMETHEE ranking and transition-oriented cluster position. More broadly, these cases illustrate how national policy mixes are associated with measurable indicator outcomes captured in the empirical analysis. Electrification incentives correspond with higher EV shares (X5), while sustained investment in public transport infrastructure aligns with improved accessibility scores (X6). In turn, these structural improvements contribute to stronger PROMETHEE net flows and more favorable cluster assignments. Conversely, countries with more limited or fragmented policy intervention tend to exhibit weaker performance in transition-oriented indicators, reinforcing their placement in mid- or lower-ranking clusters. This suggests that observed performance patterns are closely linked to policy-driven system transformations rather than arising solely from structural or economic conditions.
At the supranational level, EU-wide regulatory instruments shape the feasible transition pathways for all clusters, but they do so unevenly depending on national starting points and institutional capacity. The Fit for 55 package provides the overarching policy architecture to reduce emissions by at least 55% by 2030 and to put the EU on a climate-neutral trajectory, and transport is a central pillar in that architecture. Two components are particularly relevant to the structural drivers captured in the clusters. First, CO
2 standards for cars and vans (Regulation (EU) 2019/631, as revised under Fit for 55 [
32]) progressively tighten the supply-side constraint on new vehicle emissions, supporting higher electrification trajectories over time. Second, the Alternative Fuels Infrastructure Regulation (AFIR) establishes binding deployment expectations for charging and refueling infrastructure, reducing one of the most common bottlenecks in electrification uptake and thereby enabling lagging clusters to converge if implementation is effective. In combination, these EU-level measures can be interpreted as “convergence accelerators,” but the descriptive cluster means suggest that policy translation into outcomes remains contingent on national execution, complementary demand-side instruments, and the pre-existing structure of mobility systems. Importantly, the dynamic indicators show that some mid-performing countries are exhibiting positive transition momentum despite moderate current performance levels, while others with relatively favorable profiles display stagnation. This suggests that policy assessment should consider both structural position and trajectory when evaluating transition readiness.
The PROMETHEE II method was applied to rank the EU-27 Member States according to their transport–climate performance over the period 2019–2023. The decision problem was defined with countries as alternatives and a set of indicators capturing transport emissions, air-quality pressure, energy use, vehicle technology transition, and urban system performance as evaluation criteria. To ensure comparability across heterogeneous measurement scales, all indicators were normalized using min-max transformation and subsequently oriented so that higher values uniformly indicated better performance. Cost-type indicators, such as CO2 emissions per capita, PM2.5 exposure, congestion levels and transport energy consumption, were inverted after normalization, whereas benefit-type indicators, including the share of low-emission vehicles and public transport accessibility, were retained in their original orientation. Preference modeling was implemented in Visual PROMETHEE Academic using the V-shape with indifference preference function, with indifference and preference thresholds derived from the empirical dispersion of each criterion, thereby ensuring that only substantively meaningful differences between countries influenced the preference structure.
The aggregation of unicriterion preferences into global preference indices was performed using an equal-weight scheme as the baseline specification, followed by sensitivity tests based on alternative domain-weight scenarios. For each country, positive preference flows (φ
+), representing the extent to which an alternative outranks others, and negative preference flows (φ
−), indicating the degree to which it is outranked, were computed. The PROMETHEE II net flow (φ = φ
+ − φ
−) served as the final ranking score, allowing a complete ordering of EU-27 Member States (
Table 10).
PROMETHEE II net flow values indicate a clear ranking of EU Member States, with Nordic and Western European countries dominating the upper positions due to strong electrification, low emission intensity, and high public transport accessibility, while Central and Eastern European countries exhibit negative net flows reflecting structural transport–climate challenges.
The comparison between the PROMETHEE II rankings obtained using equal weights and CRITIC-derived weights depicts both high stability at the top of the distribution and selective sensitivity in intermediate positions (taking into account the first five places) (
Table 11). Sweden and Denmark occupy the first and second ranks under both weighting schemes, indicating that their dominance in transport–climate performance is structurally robust and not dependent on the weighting approach. These countries perform consistently well across all indicator dimensions, including emission intensity, electrification, and accessibility, which explains their resistance to methodological variation. Differences emerge in the middle of the ranking, where the Netherlands, Finland, Germany, Spain, and Poland display greater sensitivity to the weighting scheme. Under equal weights, the Netherlands and Finland rank above Germany, reflecting their balanced performance across indicators. However, when CRITIC weights are applied, Germany rises to third position, while Spain and Poland enter the top five. This shift indicates that CRITIC weighting amplifies the influence of indicators with higher variability and lower inter-correlation, particularly those related to electrification dynamics and system performance. Germany’s improvement under CRITIC weighting suggests that its relative strengths lie in indicators that exhibit higher informational content within the dataset, even if its average performance across all indicators is slightly lower than that of some peers. Conversely, the exclusion of the Netherlands and Finland from the CRITIC-based top five implies that their performance advantages are more evenly distributed across indicators, rather than concentrated in those with higher discriminating power.
The Spearman rank (
Table 12) correlation coefficient between the PROMETHEE II rankings obtained under equal weighting and CRITIC weighting equals ρ = 0.884 and is statistically significant at the 1% level (
p < 0.001, N = 27). This indicates a very strong positive monotonic relationship between the two ranking schemes. The high correlation demonstrates that the relative ordering of EU Member States is largely preserved when transitioning from a neutral equal-weight assumption to an objective, data-driven CRITIC weighting scheme. In other words, country performance is primarily driven by structural differences in transport–climate indicators, rather than by the choice of weighting method. Minor rank shifts observed in the mid-ranking positions reflect the sensitivity of transitional countries to weighting schemes that emphasize indicator variability and inter-criteria conflict—particularly those related to electrification and accessibility. However, the stability of the top and bottom ranks confirms that sustainability leaders and lagging transport systems remain consistently identified across weighting scenarios.
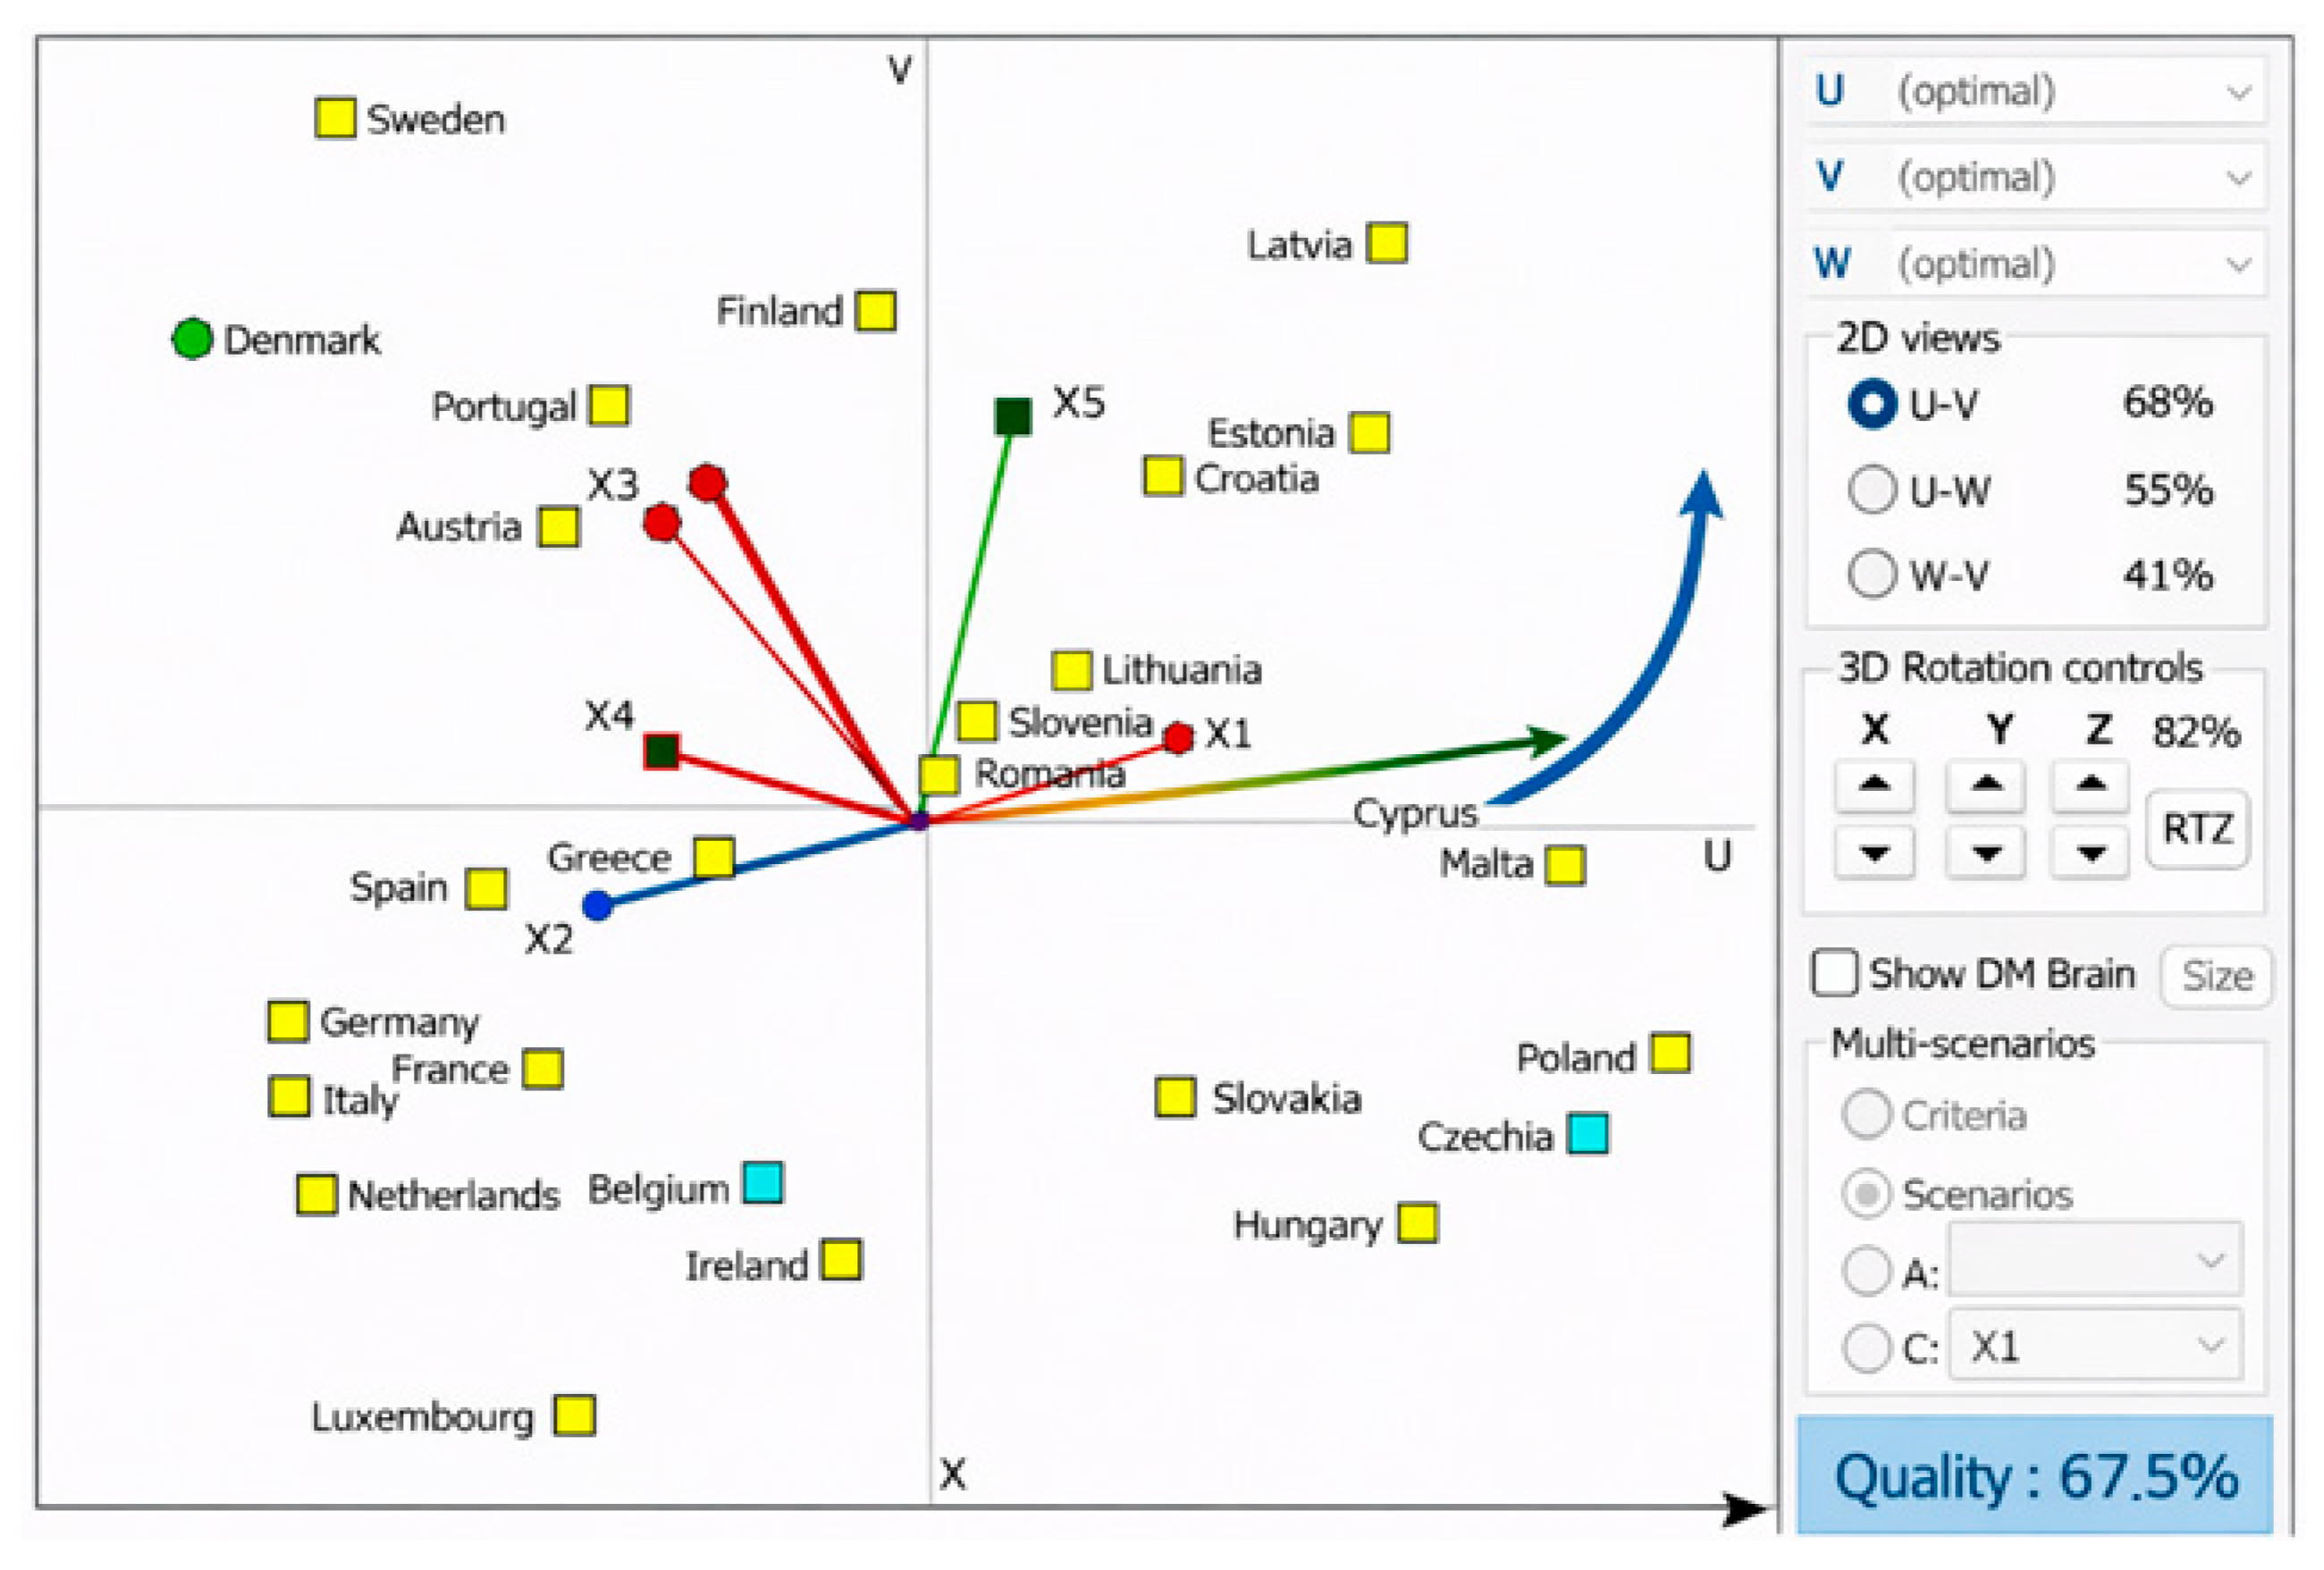
The GAIA decision plane obtained from the PROMETHEE II analysis represents the most informative multidimensional projection of the six transport–climate indicators and provides an interpretable visualization of the trade-offs underlying the EU-27 ranking (
Figure 5). The overall quality of the GAIA model amounts to 67.5%, which exceeds the 60% threshold commonly adopted in the Visual PROMETHEE framework and therefore confirms that the reduced three-dimensional representation captures the dominant structure of the decision problem with satisfactory explanatory power. The red decision stick points toward the positive sustainability pole defined primarily by high shares of electric and hybrid vehicles (X5) and strong accessibility to low-emission transport (X6), while the opposing directions are associated with high CO
2, NO
2, PM emissions and black-carbon intensity (X1–X4). Countries positioned close to the decision axis therefore exhibit balanced and superior performance across the full set of criteria. A first distinct group of alternatives emerges in the first quadrant, including Lithuania, Slovenia, Croatia and Estonia, which are characterized by moderate emission pressure combined with emerging strengths in electrification and public-transport accessibility. These countries align positively with X5 and X6 but remain partially influenced by residual air-pollution and energy-use pressures, reflecting an intermediate transition stage. A second, more advanced cluster is located in the second quadrant and includes Sweden, Finland, Denmark, Austria and Portugal. These countries lie closest to the red decision stick, indicating strong dominance in low-emission vehicle uptake and accessibility indicators, coupled with systematically lower CO
2 and PM burdens. This configuration is consistent with their leading positions in the PROMETHEE ranking and identifies them as sustainability leaders in the transport–climate transition. In contrast, Bulgaria and Malta appear in the fourth quadrant, clearly oriented toward the negative pole of the decision space, where high emission intensity and weak structural transition dominate. Hungary and Slovakia are also located in this lower-right region but at a greater distance from coherent clusters, indicating heterogeneous profiles and the absence of a clearly defined transition pathway. Finally, countries such as Romania and Slovenia are positioned close to the origin of the GAIA plane, suggesting that their performance across the six indicators is neither distinctly positive nor negative, but rather internally inconsistent. Their proximity to the center reflects a lack of strong alignment with any dominant criterion, implying that improvements in electrification and accessibility are currently offset by persistent emission and air-quality pressures. It is also important to recognize that leadership in specific transition domains has at times emerged outside the EU-27 system boundaries. For example, Norway has achieved particularly high levels of electrification [
12], while the United Kingdom was among the few countries to record sustained reductions in transport emissions during earlier phases of transition [
3]. These examples highlight that progress in individual dimensions does not necessarily align with the aggregate EU performance and underscore the importance of analyzing structural patterns within the EU-27 context [
15].
Importantly, alignment with the positive pole in the GAIA decision plane does not necessarily imply high overall performance in the PROMETHEE ranking. The GAIA representation reflects proximity to specific criteria, specifically transition-related indicators such as electrification (X5) and accessibility (X6), rather than dominance across the full multicriteria system. Consequently, countries such as Lithuania, Slovenia, Croatia and Estonia appear favorably positioned along transition-oriented axes while still exhibiting weaker performance in pressure-related dimensions, including emissions intensity and energy use. This explains the apparent tension between spatial positioning in the GAIA plane and net-flow ranking results. PROMETHEE net flows reflect balanced performance across all criteria, whereas GAIA highlights directional strengths. Thus, countries with emerging transition capacity may align with positive axes without yet achieving strong overall sustainability dominance. When interpreted alongside the hierarchical cluster typology, these countries correspond primarily to transitional or balanced-industrial profiles rather than sustainability leaders. Their positioning suggests that structural improvements in electrification and accessibility are underway but have not yet translated into lower emissions pressure sufficient to improve their outranking performance. The joint interpretation of cluster membership, PROMETHEE net flows, and GAIA positioning therefore provides a more nuanced understanding of transport–climate transition dynamics. While PROMETHEE identifies overall system performance, the GAIA plane reveals the direction of emerging change, and clustering situates these developments within broader structural transition regimes. This distinction is relevant from a policy perspective, as it indicates that intermediate countries may be progressing along specific transition pathways even when their current performance remains constrained by legacy system characteristics.
Finally, the PROMETHEE II ranking was integrated with the hierarchical cluster typology derived from Ward’s agglomerative clustering. Countries classified as sustainability leaders consistently exhibited the highest net flows, while those in the lagging and car-dependent cluster displayed strongly negative net flows. This concordance between ranking and clustering validates the resilience of the analytical framework and demonstrates that the observed performance hierarchy is not an artifact of a single method but reflects underlying structural differences in transport–climate transition pathways across the European Union.
Sensitivity testing confirms that leading and lagging clusters retain their relative positions across alternative weighting scenarios, indicating that transition patterns are not driven solely by normative weighting assumptions.
The findings also show the structural difficulty of decarbonizing passenger road mobility. Progress depends not only on technological adoption but on deeper changes in behavioral norms, infrastructure provision, and policy implementation paradigms. This suggests that transition success may require not only incremental policy instruments but broader shifts in mobility narratives and system design.
4. Conclusions
This paper examined how recent developments in European road transport compare with structural transition characteristics associated with Paris-consistent mitigation pathways. The analysis specifically addresses passenger road transport systems, which constitute the dominant emissions source within the wider transport sector and represent the primary locus of behavioral and technological transition in the EU context. Using harmonized indicators for the period 2019–2023, we combined hierarchical clustering and PROMETHEE II multicriteria ranking to characterize the transport–climate performance of EU Member States. The framework jointly considered emissions pressure, activity and structural drivers, vehicle technology transition, and accessibility outcomes. Rather than relying on any single metric, the analysis integrated multiple indicators to provide a diagnostic picture of how national passenger road transport systems are evolving. Three main conclusions emerge.
First, the results reveal pronounced heterogeneity across European countries. The cluster analysis identified five distinct transport–climate profiles ranging from carbon-intensive, car-dependent systems with low electrification to “sustainability leader” systems characterized by lower emissions intensity, higher uptake of low-emission vehicles and stronger public-transport accessibility. This suggests that the European road transport transition is not converging evenly. Structural lock-in remains visible in several countries where high car dependence, elevated energy use and limited electrification coexist. Secondly, the PROMETHEE ranking confirms this performance gradient. Nordic and north-western European countries occupy the upper part of the ranking, whereas parts of southern and eastern Europe remain at the lower end. However, no country achieves high performance across all indicator groups simultaneously. In many cases, technological progress (for example, rising electric-vehicle shares) is partly offset by growing travel demand, freight activity, or persistent car dependence. These interactions indicate that technological substitution alone is unlikely to deliver Paris-compatible trajectories without parallel changes in demand, accessibility and system structure. Third, the analysis for 2019–2023 highlights the effects of post-pandemic recovery dynamics. The rebound in road traffic volumes and freight activity has added upward pressure on emissions indicators, even where average new-vehicle emissions and electrification trends improved. Averaging across the five-year window smooths the extreme 2020 lockdown shock but still captures the recovery phase. This reinforces the importance of viewing climate policy and transport outcomes together rather than assessing vehicle technology metrics in isolation.
The findings address the three research questions posed in the Introduction. First, the analysis shows that road transport indicators evolved unevenly across EU Member States between 2019 and 2023, with improvements in electrification often coexisting with persistent emissions pressure. Second, hierarchical clustering identified meaningful typologies reflecting differing structural transition pathways. Third, comparison with PROMETHEE rankings revealed that these typologies correspond to distinct performance profiles, highlighting both convergence and divergence in transition dynamics.
The policy implications follow directly from these findings. Countries in the lagging clusters require more than incremental change; they need structural interventions addressing car dependence, accessibility deficits and fleet composition simultaneously. Intermediate clusters appear to be “transition in progress” systems in which acceleration of charging infrastructure deployment, electrification incentives and public-transport improvements could yield rapid gains. Leader clusters demonstrate that combinations of pricing instruments, strong public transport, cycling and walking infrastructure, and targeted electrification policies can reinforce each other to produce lower transport-emissions pressure. EU-level measures such as strengthened CO2 standards and alternative-fuel infrastructure policies are likely to support convergence, but national execution remains decisive. Although the EU has articulated ambitious transition goals, the observed pace of structural change remains moderate and, in some cases, comparable to developments in other advanced regions. This suggests that leadership is expressed more strongly in policy commitments than in uniformly realized system transformation.
This study has limitations that should be acknowledged clearly. The analysis is based on aggregate national indicators, which do not capture intra-urban variation, distributional effects or behavioral responses at the household level. The indicator set is necessarily selective, and some potentially relevant variables (for example, land-use patterns or vehicle occupancy rates) are limited by data availability. PROMETHEE results depend on indicator selection and weighting, although we used transparent equal weights and resilience checks. The assessment is diagnostic rather than predictive; it does not claim to simulate future emissions or model full mitigation pathways. The study does not evaluate compatibility with carbon budgets or scenario-based emission trajectories and therefore should be interpreted as a structural alignment assessment rather than a definitive Paris-consistency test. The indicator set is necessarily selective and emphasizes structural transition capacity rather than exhaustive emissions accounting. While the Δ indicators provide a directional signal, they do not constitute full trajectory modeling and should therefore be interpreted as indicative rather than predictive of long-term transition pathways. The combined use of clustering, PROMETHEE ranking, and GAIA visualization is intended to identify structural patterns and transition tendencies rather than to provide causal explanations or forecast future outcomes. As such, the results should be interpreted as indicative of system positioning rather than as a comprehensive representation of all transport transition dynamics. Despite these limitations, the contribution is twofold. First, it provides one of the few multi-indicators, multi-country empirical assessments of whether current road-transport trajectories are compatible with temperature-consistent mitigation expectations. Second, the paper provides a structured and transparent analytical framework that is reproducible using publicly available datasets and standard analytical procedures. The approach relies on harmonized and openly accessible data sources, including Eurostat, the European Environment Agency (EEA), and OECD transport databases [
3,
4], and applies widely used analytical methods such as hierarchical clustering and PROMETHEE II multicriteria decision-making [
18,
25,
26,
27]. The methodology follows a clearly defined sequence of steps, data harmonization, normalization, clustering, and multicriteria ranking, which are well-established in the literature and can be implemented using standard statistical and decision-support software. This ensures that the framework can be replicated and extended to other regions, datasets, or time periods. Unlike many existing studies that focus on single indicators or isolated policy measures, the proposed approach integrates clustering and multicriteria ranking to simultaneously capture both structural typologies and relative performance across EU Member States. This combined perspective allows identification of distinct transport–climate regimes and reveals mismatches between technological progress (electrification) and underlying system characteristics (car dependence and accessibility), providing insights that are not observable through single-indicator analyses. Future research should integrate life-cycle emissions of vehicles and batteries, explicitly link national transport indicators to health and equity outcomes, and examine sub-national spatial patterns. Linking indicator-based assessments with policy-mix evaluation would also improve understanding of which instruments are most effective in closing the remaining mitigation gaps. Achieving passenger road transport systems consistent with the Paris Agreement will require sustained technological progress combined with accessibility-oriented urban planning, behavioral shifts, and strengthened policy implementation. The focus on passenger road transport excludes freight and intermodal dynamics, which involve distinct logistical and economic drivers and would require separate analytical treatment.