


Abstract
Clothing pressure is a critical design parameter in compression garments, yet its estimation in three-dimensional (3D) digital environments remains challenging because it depends on fabric mechanics, garment deformation, body geometry, and garment–body contact. This study developed a calibrated 3D vector-projection method for estimating clothing pressure from digital garment-mesh deformation. The method was based on the mechanical premise that garment extension generates in-plane tensile forces, whereas interface pressure is associated with the component of those forces acting normal to the body surface. Accordingly, corresponding flat and deformed garment meshes from CLO 3D were used to calculate edge-length strain and internal force; resultant forces were projected onto local avatar-normal directions and normalized by vertex-associated surface area to obtain uncalibrated pressure-related values. Five tricot fabrics and two pattern-reduction levels were used to produce ten compression tops, and pressure measured at five body locations was used for modulus-group-specific linear calibration to account for stiffness-dependent differences in deformation-to-pressure conversion. Under leave-one-garment-out cross-validation, the final linear model achieved an overall R2 of 0.563, an RMSE of 0.587 kPa, and an MAE of 0.427 kPa. A 1–15 mm contact-distance analysis identified 10 mm as a conservative numerical stabilization point, with normalized means remaining within ±2% of the 15 mm reference and adjacent-threshold changes below 0.1 from 10 to 15 mm. The proposed method provides a transparent, mechanics-informed mesh-level procedure that converts digital garment deformation into calibrated body-normal pressure estimates and 3D spatial maps without treating commercial virtual-fitting pressure maps as direct physical predictions.
1. Introduction
Compression garments are widely used in medical applications, sportswear, base layers, and protective clothing because they provide mechanical support to the body and influence comfort, physiological responses, and movement performance. In the design of compression garments, clothing pressure is a critical parameter. Excessive pressure may cause discomfort or impede blood circulation, whereas insufficient pressure may fail to provide the intended functional support. Therefore, the ability to estimate clothing pressure before physical prototyping is important for developing functional garments that deliver appropriate pressure levels.
Despite its importance, clothing pressure remains difficult to predict accurately because it is governed by the complex interaction among fabric mechanical properties, garment deformation, pattern reduction, body curvature, and garment–body contact conditions. Conventional pressure-prediction approaches have provided a useful theoretical foundation, particularly through the relationship between fabric tension and body curvature. However, these approaches have limitations when applied to realistic garment configurations and complex three-dimensional (3D) body geometries. Local anatomical curvature, garment openings, and irregular contact conditions can generate pressure distributions that are difficult to represent using simplified geometric assumptions. Recent advances in 3D virtual garment simulation have created new opportunities for pressure-oriented garment design. Commercial virtual-fitting systems can generate garment deformation meshes, strain visualizations, and digital fabric simulation results that facilitate fit assessment and design evaluation. However, the pressure maps generated by these systems should not be interpreted as direct measurements of clothing pressure. Previous studies have reported discrepancies between virtual pressure outputs and experimentally measured clothing pressure, indicating that additional computational and calibration procedures are required when digital garment data are used for pressure estimation.
Accordingly, the present study uses 3D virtual garment simulation not as a direct pressure-measurement tool but as a source of garment deformation data. The deformed garment mesh, avatar geometry, and fabric mechanical properties are used as inputs for a separate pressure-estimation procedure. This distinction is important because the internal forces generated by fabric deformation act primarily along the garment surface, whereas the pressure experienced by the body is associated with the force component acting normal to the body surface. Consequently, surface forces must be transformed into body-directed forces to estimate clothing pressure on a 3D body surface.
To address this challenge, this study proposes a calibrated 3D vector-projection framework for estimating clothing-pressure distribution in digital compression garments. The proposed method calculates strain from garment mesh-edge deformation, estimates internal forces using fabric mechanical properties, and projects the resulting force vectors onto body-normal directions. The projected forces are then converted into pressure-related values using a vertex-based surface-area approach and calibrated against experimentally measured clothing-pressure data obtained from physical garments.
The objectives of this study are threefold: (1) to develop a mesh-based vector-projection method for estimating clothing-pressure distribution from digital garment deformation; (2) to calibrate the estimated pressure values using measured pressure data from compression garments constructed with different fabric properties and pattern-reduction levels; and (3) to evaluate cross-validated calibration performance and assess the numerical sensitivity and stabilization of the calculated values with respect to the contact-distance threshold. The results demonstrate the feasibility of linking digital garment deformation with measured clothing pressure and provide a practical framework for pressure-oriented functional-garment design in a 3D virtual environment.
2. Related Work
2.1. Determinants and Functional Significance of Clothing Pressure in Compression Garments
Fit is a fundamental consideration in apparel design because it influences appearance, comfort, mobility, and wearer satisfaction. In functional close-fitting garments, fit is also directly related to product performance. Medical garments, compression sportswear, and body-supporting innerwear are generally designed with negative ease, in which garment patterns are smaller than the corresponding body dimensions. When worn, the stretch fabric deforms and conforms to the body, generating mechanical pressure at the garment–body interface [1,2]. The magnitude and distribution of clothing pressure are determined by the combined effects of fabric mechanical properties, pattern-reduction level, garment construction, body geometry, and garment–body contact conditions [1,2,3,4]. Although representative anthropometric measurements, such as bust, waist, and hip circumferences, are commonly used in stretch-garment pattern development, they do not fully describe local curvature or cross-sectional shape. Therefore, garments constructed using the same fabric and reduction rate may generate different pressure distributions across body regions or wearers.
Clothing pressure is a critical design parameter in sports compression garments because it can directly influence functional performance and wearing comfort. Appropriately applied compression has been associated with physiological recovery, injury-related support, and exercise performance; however, the reported effects vary according to pressure level, garment configuration, physical activity, and wearer characteristics [5,6,7,8,9]. These findings indicate that the functional effects of compression garments depend not only on the presence of compression but also on the magnitude and spatial distribution of pressure. Pressure level is also closely related to wearer comfort. Mitsuno and Kai [10] reported regional differences in preferred clothing pressure, indicating that a uniform pressure level may not provide equivalent comfort across anatomical locations. In addition, pressure measured in a static standing posture may differ from the dynamic pressure generated during movement. This distinction is particularly important in sportswear because dynamic pressure may affect both functional support and comfort, although many previous studies have focused primarily on static measurements.
Physical pressure sensors provide direct quantitative measurements and remain essential for garment evaluation and final validation. However, point-based sensors measure pressure only at selected locations and cannot readily represent continuous pressure distributions over the entire garment surface. Repeated prototype production and testing may also be time-consuming when multiple fabrics, pattern-reduction levels, or design alternatives are compared. Consequently, further development of clothing-pressure measurement and prediction technologies is required to support efficient functional-garment design. Three-dimensional body scanning and computational garment-design methods have been investigated to address these limitations. Salleh et al. [11] developed customized pressure garments using 3D body-scan data and fabric properties, while Lee and Hong [12] proposed an indirect pressure-estimation method combining 3D imaging, fabric deformation, and curvature information. Kuzmichev et al. [13] also developed a virtual design approach for knitted compression garments using body scanning and a 3D-to-2D pattern-development method. These studies demonstrate the potential of digital body and garment information for pressure-oriented design.
Nevertheless, body scanning, scanned-data processing, physical measurement, and repeated prototype testing can require substantial time and resources. A computational framework capable of integrating fabric properties, digital garment deformation, garment–body geometry, and experimentally measured pressure would therefore be useful for estimating and visualizing pressure-distribution tendencies during early-stage development. Such a framework could complement physical measurements by supporting fabric selection, pattern adjustment, and functional compression-garment design.
2.2. Analytical and Computational Models for Clothing-Pressure Prediction
Clothing pressure has traditionally been estimated using analytical models based on the mechanical relationship between fabric tension and body curvature. Laplace-based approaches relate pressure to fabric tension and radius of curvature and have been widely applied to compression garments. Kirk and Ibrahim [14] considered textile deformation and simplified body geometry, while Macintyre and Baird [15] related fabric tension to body circumference in pressure-garment design. Leung et al. [16] incorporated body circumference, fabric cross-sectional area, strain, and Young’s modulus, and Teyeme et al. [2] further proposed a modified model using engineering strain and elastic modulus for knitted fabrics. Although these approaches provide a useful theoretical basis, their applicability is limited in body regions with complex curvature, local protrusions, soft-tissue deformation, and irregular garment–body contact.
Numerical garment-simulation methods have therefore been applied to represent garment deformation and contact more explicitly. Spring-mass models describe fabric as interconnected particles and offer computational efficiency, whereas finite element methods (FEMs) provide more detailed representations of material deformation, contact, and stress distribution. Previous studies have applied these approaches to garment deformation, fit, and pressure-related analysis. Ishimaru et al. [17], for example, developed a numerical method for predicting clothing-pressure distribution by considering the extension and deformation of knitted fabrics. Although numerical methods can better accommodate complex geometry and material behavior than simplified analytical models, their application may require detailed material characterization, boundary conditions, and substantial computational effort.
Overall, existing analytical and numerical models demonstrate the importance of fabric mechanics, deformation, and body geometry in clothing-pressure prediction while highlighting the need for computational approaches that can be integrated more readily with practical 3D garment-design workflows.
2.3. Pressure Estimation Using 3D Virtual-Garment and Mesh-Based Methods
Commercial 3D virtual-fitting systems are increasingly used in apparel design, product development, online fit evaluation, and digital garment visualization [18,19]. These systems provide garment-mesh data, digital fabric properties, and visualizations of garment deformation, strain, fit, and pressure-related distributions, thereby supporting design evaluation without extensive physical prototyping.
However, virtual pressure outputs do not necessarily correspond directly to measured clothing pressure. Brubacher et al. [20] compared in vivo pressure measurements with virtual-fit pressure maps for sports compression garments, while Kim and Lee [21] reported that simulated pressure was strongly affected by digital material properties and garment-design conditions. Teyeme et al. [3] further showed that virtual pressure distributions in a tight-fitting cycling shirt varied with fabric properties, posture, and pattern configuration while emphasizing that CLO 3D outputs expressed as “virtual kPa” require physical validation. Similarly, Cheng et al. [4] found larger discrepancies between measured and simulated pressure in compliant soft-tissue regions than in relatively rigid regions and proposed material-property-based correction models to improve agreement.
Collectively, these studies indicate that commercial virtual-fitting systems are valuable for generating garment deformation data and visualizing pressure-related trends, but their built-in pressure outputs should be interpreted cautiously. In the present study, CLO 3D was therefore used to obtain deformed garment geometry, mesh coordinates, and fabric-related simulation data rather than as a direct source of physical pressure values.
Mesh-based methods provide another approach for analyzing garment–body relationships. Air-gap and distance-field methods quantify spatial separation, fit, and relative movement between garment and body surfaces. Hu et al. [22], for example, analyzed dynamic air-gap thickness and garment sliding during walking using exported body- and garment-mesh sequences and a 3D garment vector field. Such approaches demonstrate the value of explicit mesh data for characterizing garment–body geometry.
However, distance- and air-gap-based methods primarily describe spatial relationships and do not directly estimate the body-directed force component generated by fabric deformation. Because fabric tension acts mainly along the garment surface whereas clothing pressure is associated with the component acting normal to the body surface, pressure estimation requires a directional transformation from garment-surface force to body-normal force. The proposed framework addresses this gap by combining mesh-edge deformation, fabric mechanical properties, and body-normal vector projection to derive pressure-related values from deformed virtual garments.
2.4. Research Gap
Previous studies have provided valuable foundations for clothing-pressure prediction. Laplace-based models explain the relationship among fabric tension, curvature, and pressure but have limitations when applied to complex body geometries. FEM and spring-mass simulations can model garment deformation; however, they often require extensive material characterization and computational resources. 3D body-scanning-based approaches improve the representation of body geometry but require additional scanning and post-processing procedures. Commercial virtual-fitting systems provide practical digital garment data, yet their built-in pressure maps do not always correspond to actual clothing pressure. Likewise, mesh-based air-gap methods quantify spatial relationships between garments and the body but do not directly calculate body-normal pressure-related forces.
Therefore, a practical method is needed to estimate clothing-pressure distribution from digital garment deformation while accounting for fabric properties, garment-mesh strain, body geometry, and force-transmission direction. To address this gap, the present study proposes a calibrated 3D vector-projection method that utilizes exported digital garment-mesh data and fabric mechanical properties to estimate pressure-related distributions on a 3D body surface. The proposed framework is intended to support pressure-oriented design evaluation in digital compression garments and to complement, rather than replace, physical pressure measurements.
3. Materials and Methods
3.1. Experimental Garments and Fabric Properties
Since the virtual avatar used in the 3D simulation was defined as a rigid body whose size and shape remained unchanged under external forces, unlike the viscoelastic human body, a physical mannequin was used for the wear trials and pressure measurements to maintain consistent geometric boundary conditions between the physical and virtual experiments. A commercially available fitting mannequin (Camilla Nonno, Madamade, Seoul, Republic of Korea), constructed from urethane and Oxford fabric, was selected because its body dimensions approximately correspond to the average anthropometric dimensions of Korean women in their early 20s reported by Size Korea and because this type of mannequin is widely used for garment fitting. The mannequin dimensions were measured directly, as presented in Table 1, and these measurements were used to adjust the dimensions of the virtual avatar.
Table 1.
Major dimensions of the physical mannequin used for pattern development.
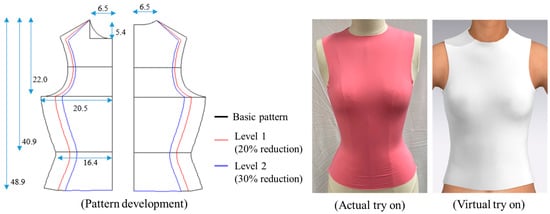
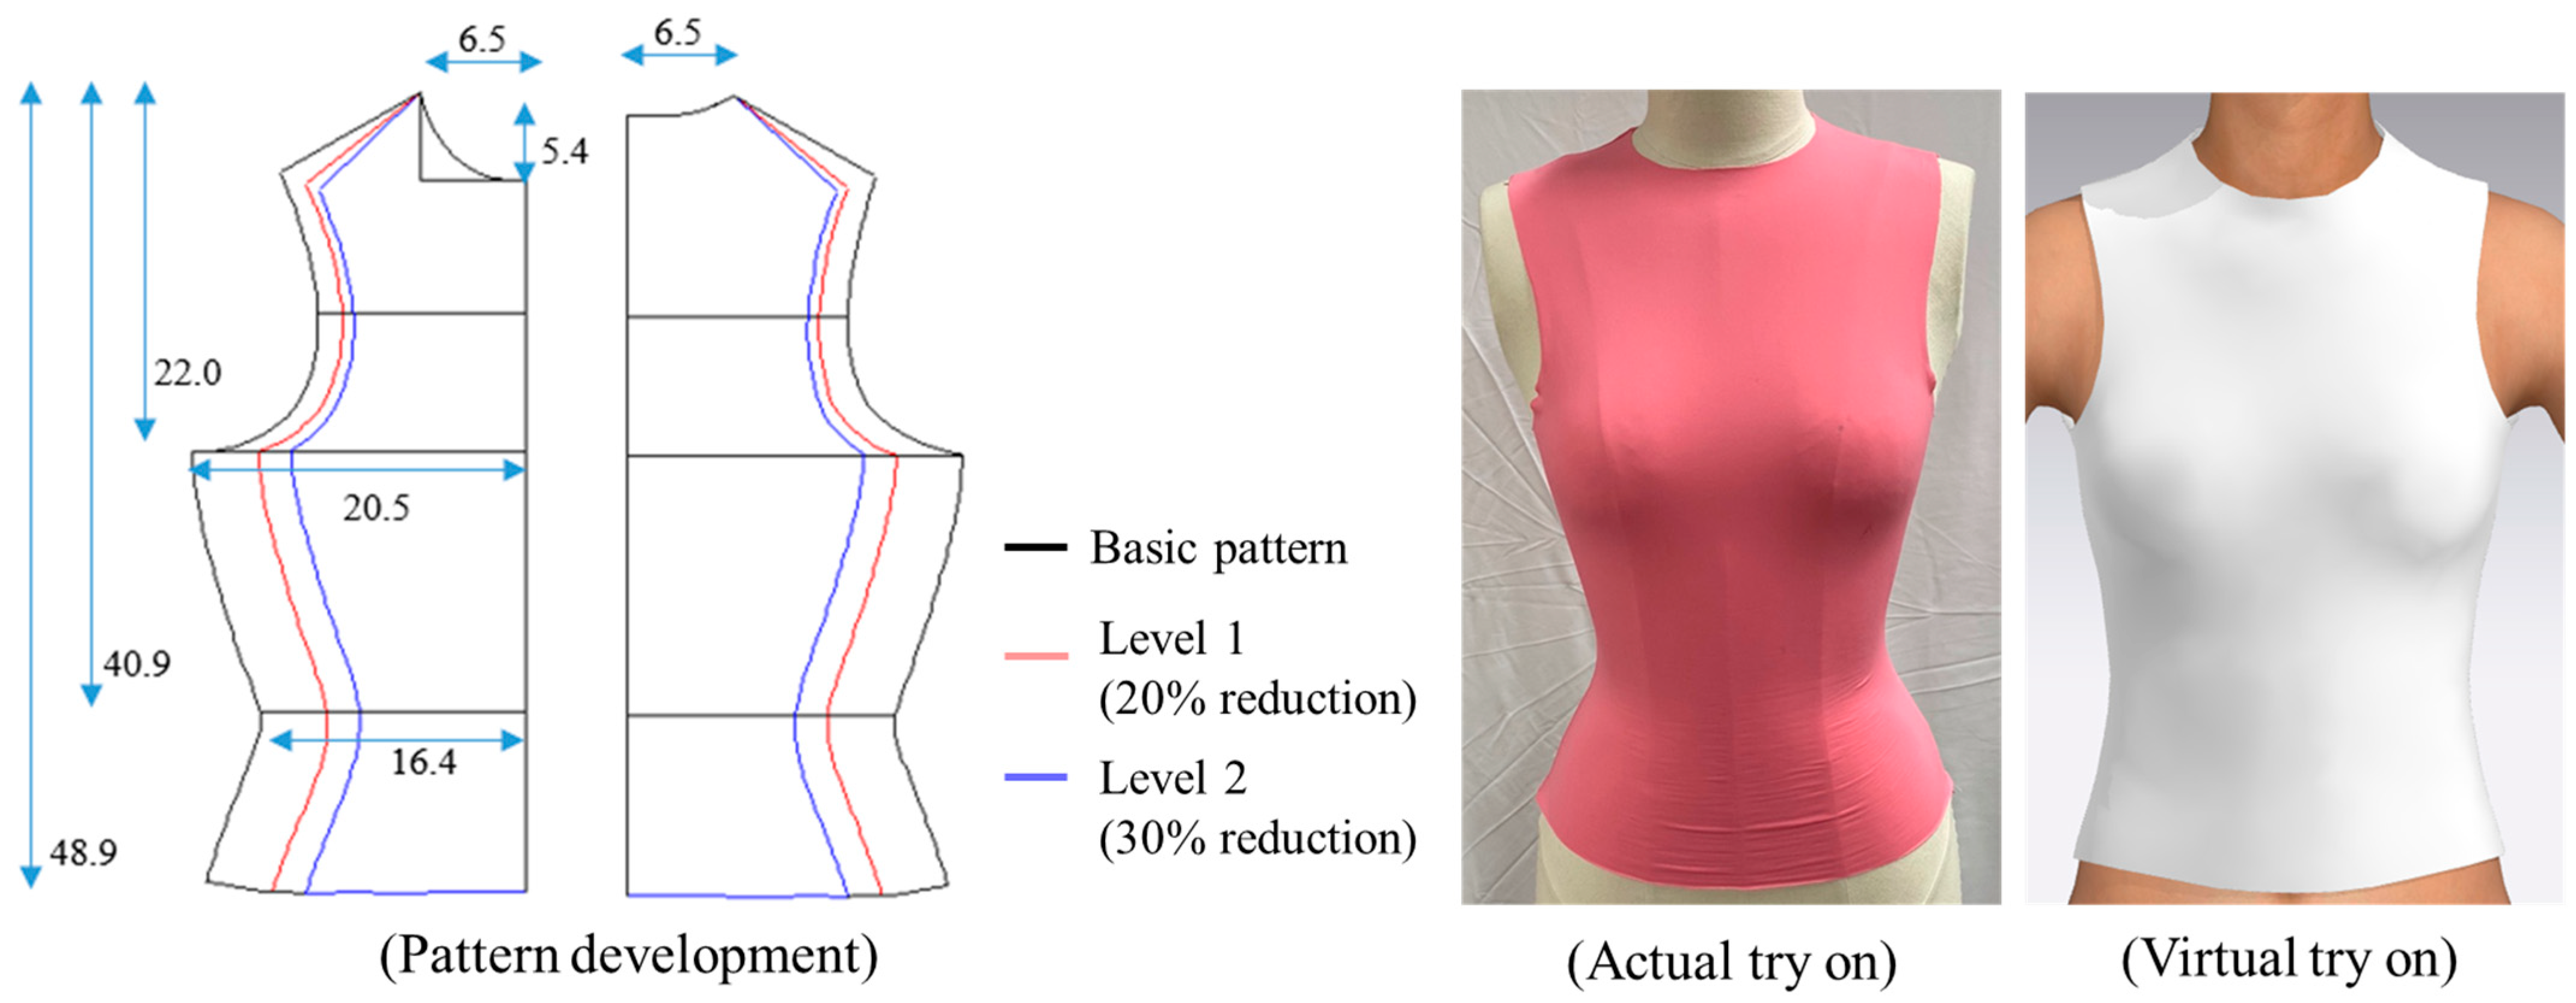
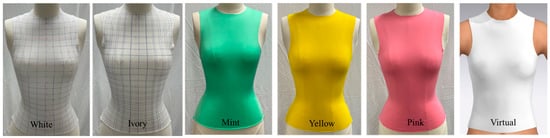
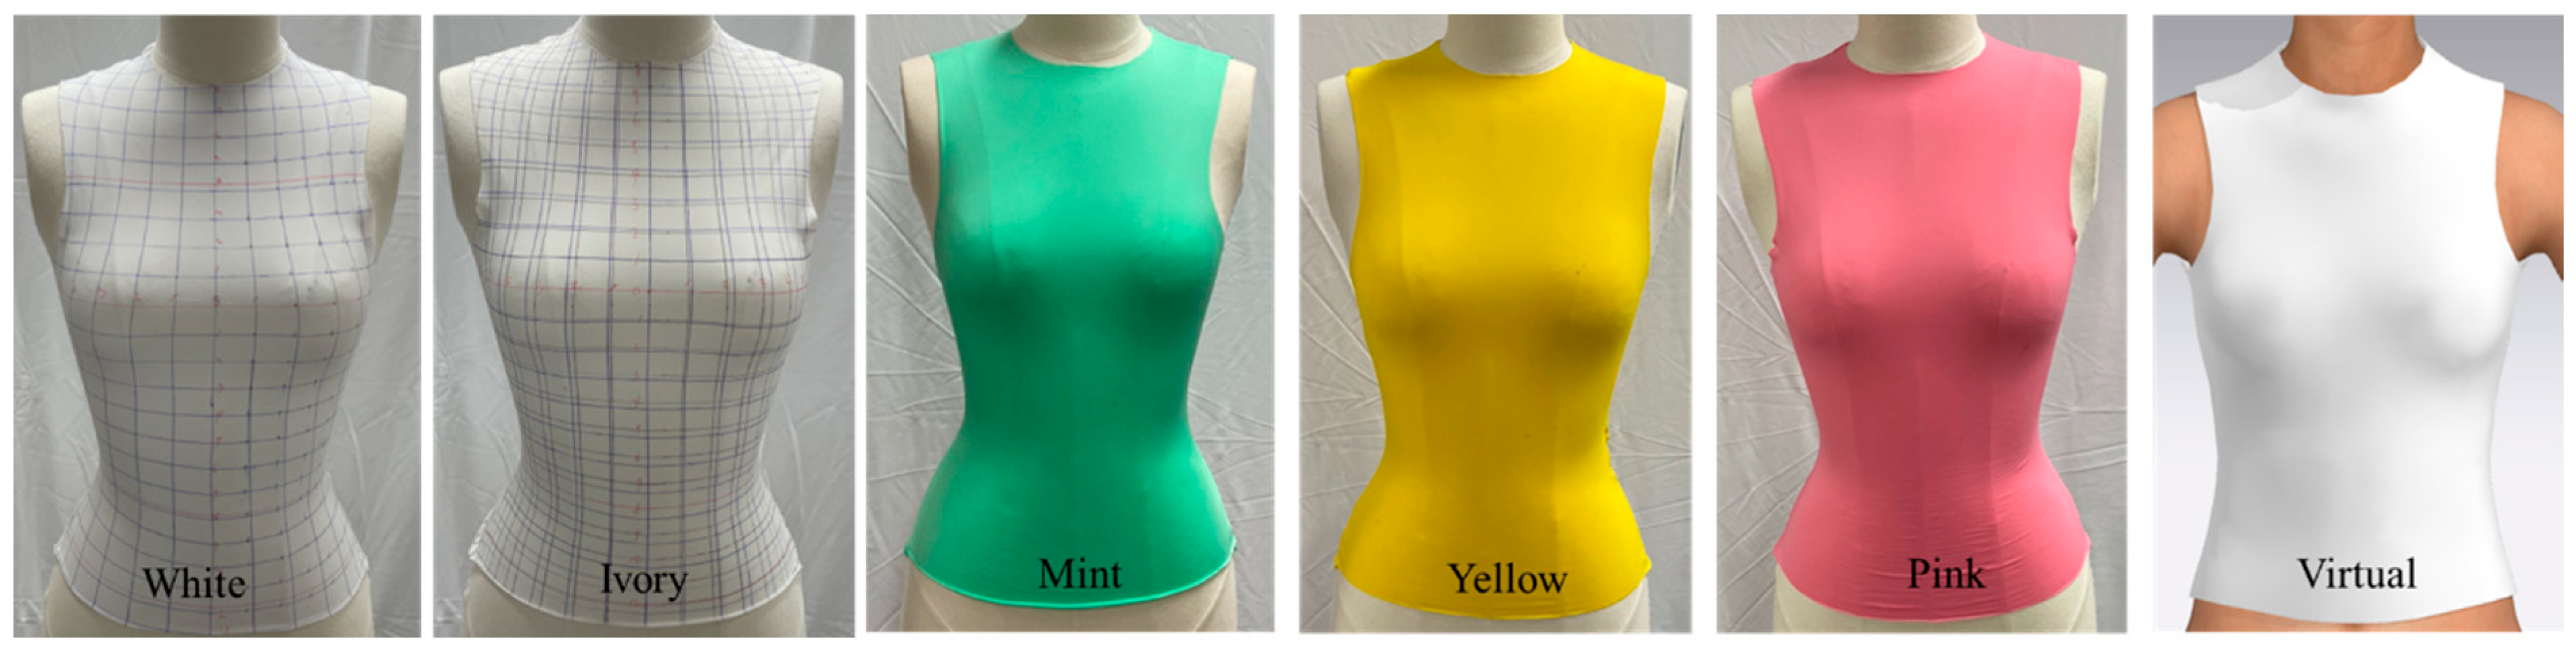
Based on these measurements, a sleeveless basic pattern for a four-way stretch garment was drafted according to the method described by Cole [23], as shown in Figure 1. The basic pattern was then uniformly reduced in the course-wise (horizontal) direction using the X-direction scaling function in YUKA CAD (Youth Hitec, Tokyo, Japan). Based on previous studies of compression and tight-fitting garment design [1,24,25], horizontal reductions of 20% (Level 1) and 30% (Level 2) were selected. Reductions of approximately 15–20% have been applied in compression-garment design, while experimental studies on tight-fitting and compression-oriented garments have examined higher reduction levels of up to 30% or more. Accordingly, the two levels were used to represent distinct garment-tightness conditions within previously investigated ranges.
Figure 1.
Experimental garment patterns and fabricated compression tops.
Five commercially available tricot fabrics were selected for this study because elastic tricot fabrics are commonly used in close-fitting and compression-oriented garments. The fabrics were chosen to represent variations in fiber composition and fabric thickness among commercially available materials, spanning the range of 7–21% polyurethane elastane content and 0.36–0.69 mm in thickness. This selection provided fabrics with distinct mechanical responses for evaluating the proposed framework under controlled garment geometry. The physical and mechanical properties of the five fabrics were characterized prior to garment fabrication and virtual simulation, as summarized in Table 2. The wale and course densities of the fabrics were measured in accordance with KS K 0512:2017 [26]. Tensile strength and elongation were measured in the wale and course directions according to KS K 0642, Section 8.14.1 B (grab method), whereas fabric stretch was evaluated according to ASTM D 2594-2004(2006) [27]. Young’s modulus was derived from the tensile response and used as the representative mechanical parameter for calculating internal forces generated by garment deformation.
Table 2.
Physical and mechanical properties of the experimental fabrics.
A total of ten sleeveless compression tops were fabricated using five tricot fabrics and two pattern-reduction levels. Identical pattern-construction and sewing conditions were maintained to minimize variation unrelated to fabric type and pattern reduction. The garments were used for physical pressure measurements and comparison with the values estimated from the 3D virtual simulations.
3.2. Physical Clothing-Pressure Measurement
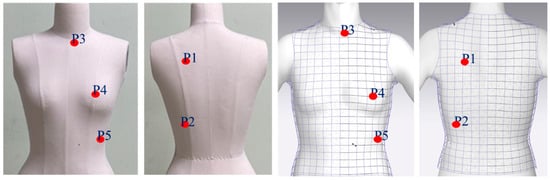
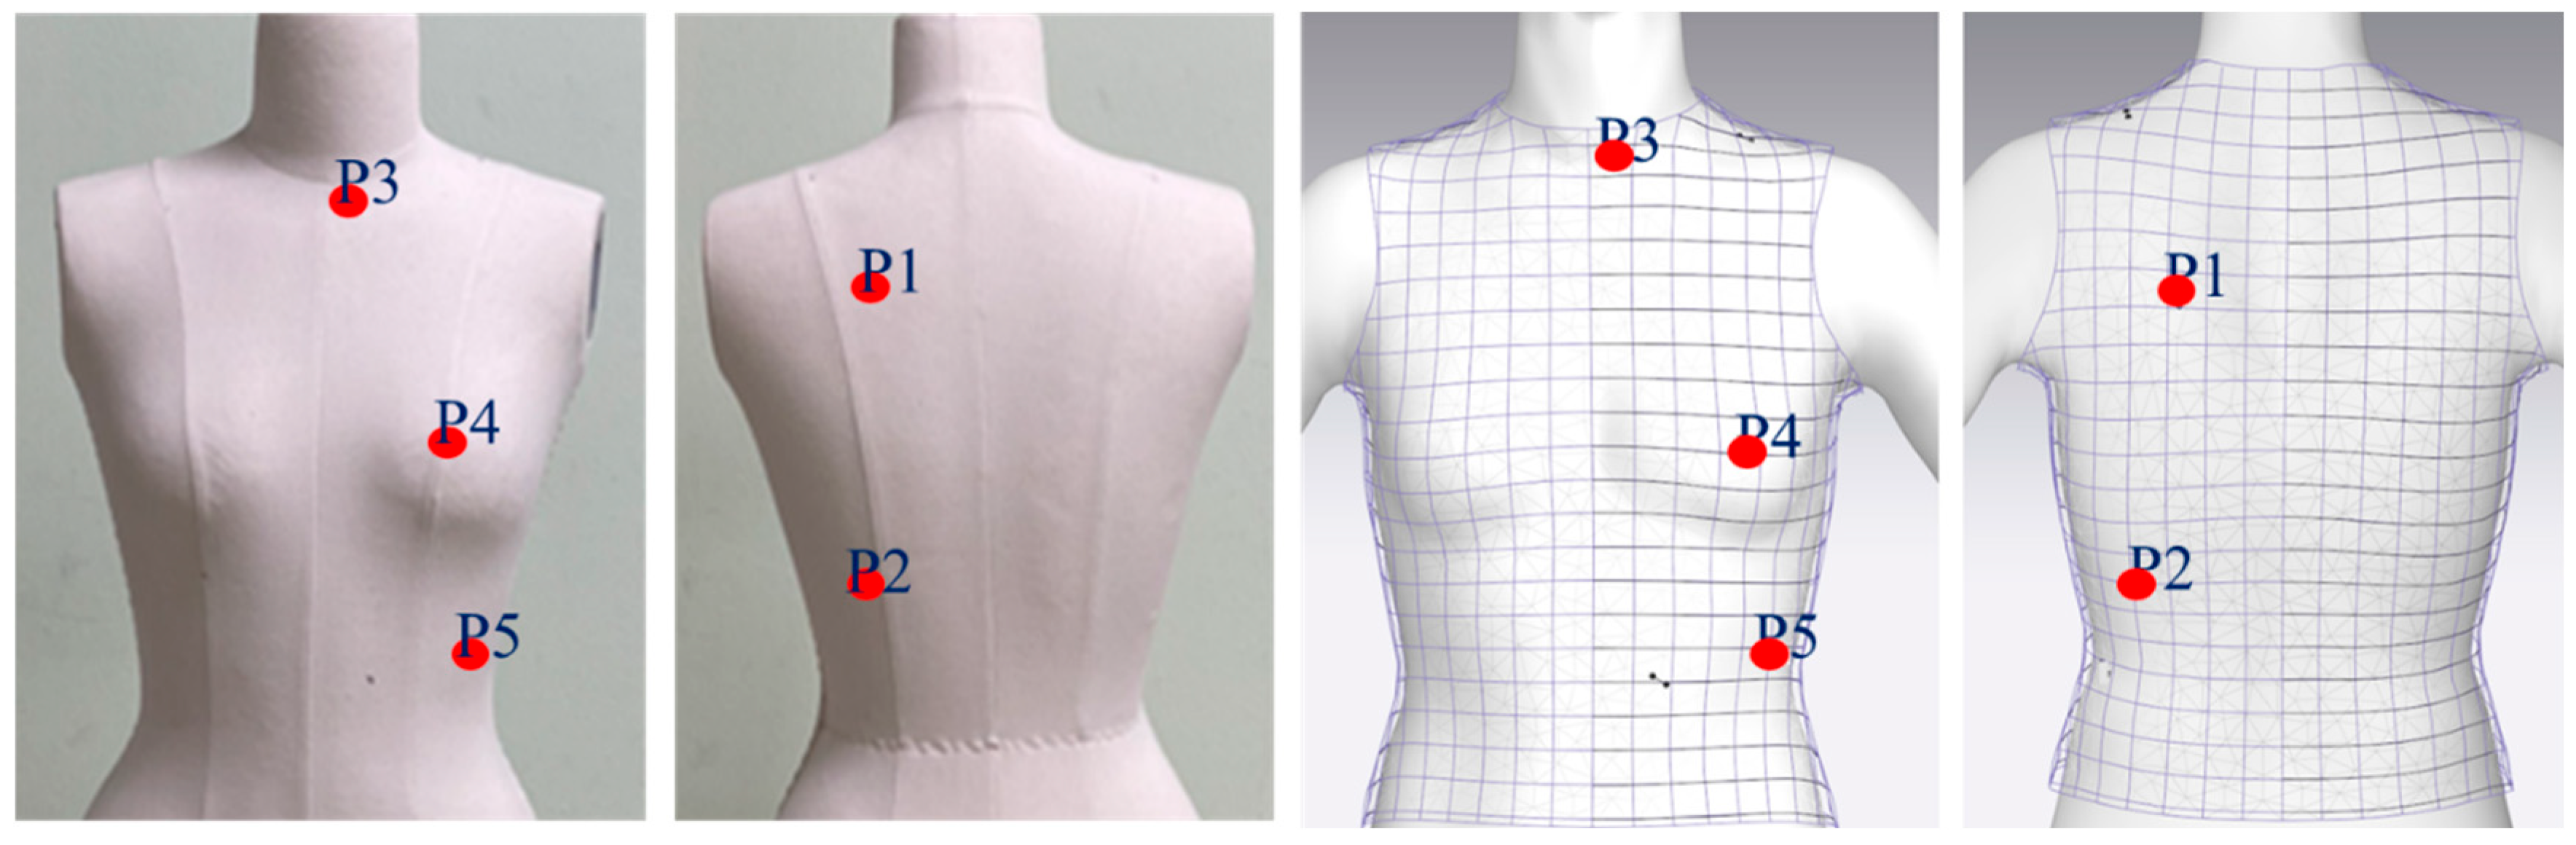
To evaluate the pressure estimates generated by the proposed 3D framework, the pressure exerted by all ten fabricated garments was measured using an AMI-3037 clothing-pressure measurement system (AMI Techno Co., Ltd., Tokyo, Japan) at five predefined locations (P1–P5), as shown in Figure 2. The system employed a circular air-pack sensor with a diameter of 15 mm. The same air-pack-based systems have been used in previous clothing-pressure studies for localized measurement at the garment–body interface [28,29,30]. Each garment was dressed on the mannequin and aligned using consistent anatomical and garment landmarks to maintain comparable positioning across measurement conditions. After the garment position had stabilized, the sensor was placed at each predefined location. Pressure was recorded at 100 frames/s for at least 60 s, and the mean value over the recording period was used for subsequent analysis. The measurement sites were selected to represent anatomically and garment-construction-relevant torso regions with differing local geometries and garment–body interactions, including the front neck, scapular, bust, and waist/abdominal regions. Similar locations have also been examined in previous clothing-pressure studies [10,17,31].
Figure 2.
Clothing-pressure measurement locations. (P1: Scapular region; P2: Lower back region; P3: Anterior neck base; P4: Bust apex; P5: Lateral abdominal region).
3.3. Digital Garment Simulation and Mesh-Data Extraction
CLO 3D (CLO 2026.0, Seoul, Republic of Korea) was selected as the virtual-fitting environment because the proposed framework required pattern-based garment simulation, assignment of experimentally characterized fabric properties, and export of garment and avatar geometries as mesh data. MATLAB R2023a was selected to implement the custom vertex- and edge-level numerical calculations required by the framework. Thus, the software combination was chosen based on its functional compatibility with the computational workflow. The built-in CLO 3D pressure map was not used as a prediction output; pressure-related values were derived through the proposed MATLAB-based vector-projection procedure. The digital material properties of the five experimental fabrics were measured using the CLO Fabric Kit and assigned to the corresponding virtual fabrics in CLO 3D, as shown in Table 3. The fabrics were characterized using the CLO Fabric Kit, and the measured force, extension, bending, thickness, and mass inputs were entered into the CLO Emulator to generate the digital fabric-property parameters used in the virtual simulation. The reported specimen mass was the combined mass of three 30 mm × 220 mm fabric specimens. The virtual garment patterns were constructed using the same dimensions as the physical garment patterns. Ten virtual try-on simulations were then performed, representing five fabric types and two pattern-reduction levels.
Table 3.
Digital fabric-property parameters generated using the CLO Fabric Kit and Emulator.
The same CAD pattern files used for physical garment production were imported directly from YUKA CAD (Youth Hitec, Japan) into the 2D workspace of CLO 3D in DXF format, thereby maintaining identical pattern geometry and avoiding manual redrafting between the physical and virtual conditions. Using the virtual sewing function, the corresponding shoulder and side seams of the front and back pattern pieces were joined to construct the sleeveless top. The garment was then virtually fitted onto the avatar in the 3D window using a particle distance of 20 mm, with the avatar maintained in a fixed upright standing posture throughout the simulation. After each simulation, the avatar was hidden from view, and the deformed garment mesh was exported as an OBJ file for subsequent numerical analysis in MATLAB. Figure 3 shows the experimental garment patterns, physical garments worn by the mannequin, and corresponding virtual try-on simulations. The virtual avatar dimensions were adjusted to match the major circumferential and vertical measurements of the physical mannequin listed in Table 1. Although the waist region of the virtual avatar may appear broader than that of the physical mannequin in Figure 1, Figure 2 and Figure 3, the waist circumference was matched to the corresponding measured value of the physical mannequin. This apparent discrepancy resulted from limitations in the local body-shape adjustment functions of CLO 3D, which did not allow the waist thickness to be independently controlled while preserving the target circumference. Accordingly, although the circumferential dimensions were matched, differences in local cross-sectional shape may have affected garment deformation and pressure estimation around the waist region and are acknowledged as a limitation of the virtual avatar representation.
Figure 3.
Experimental garments and corresponding virtual try-on simulations.
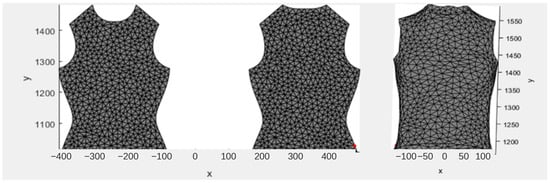
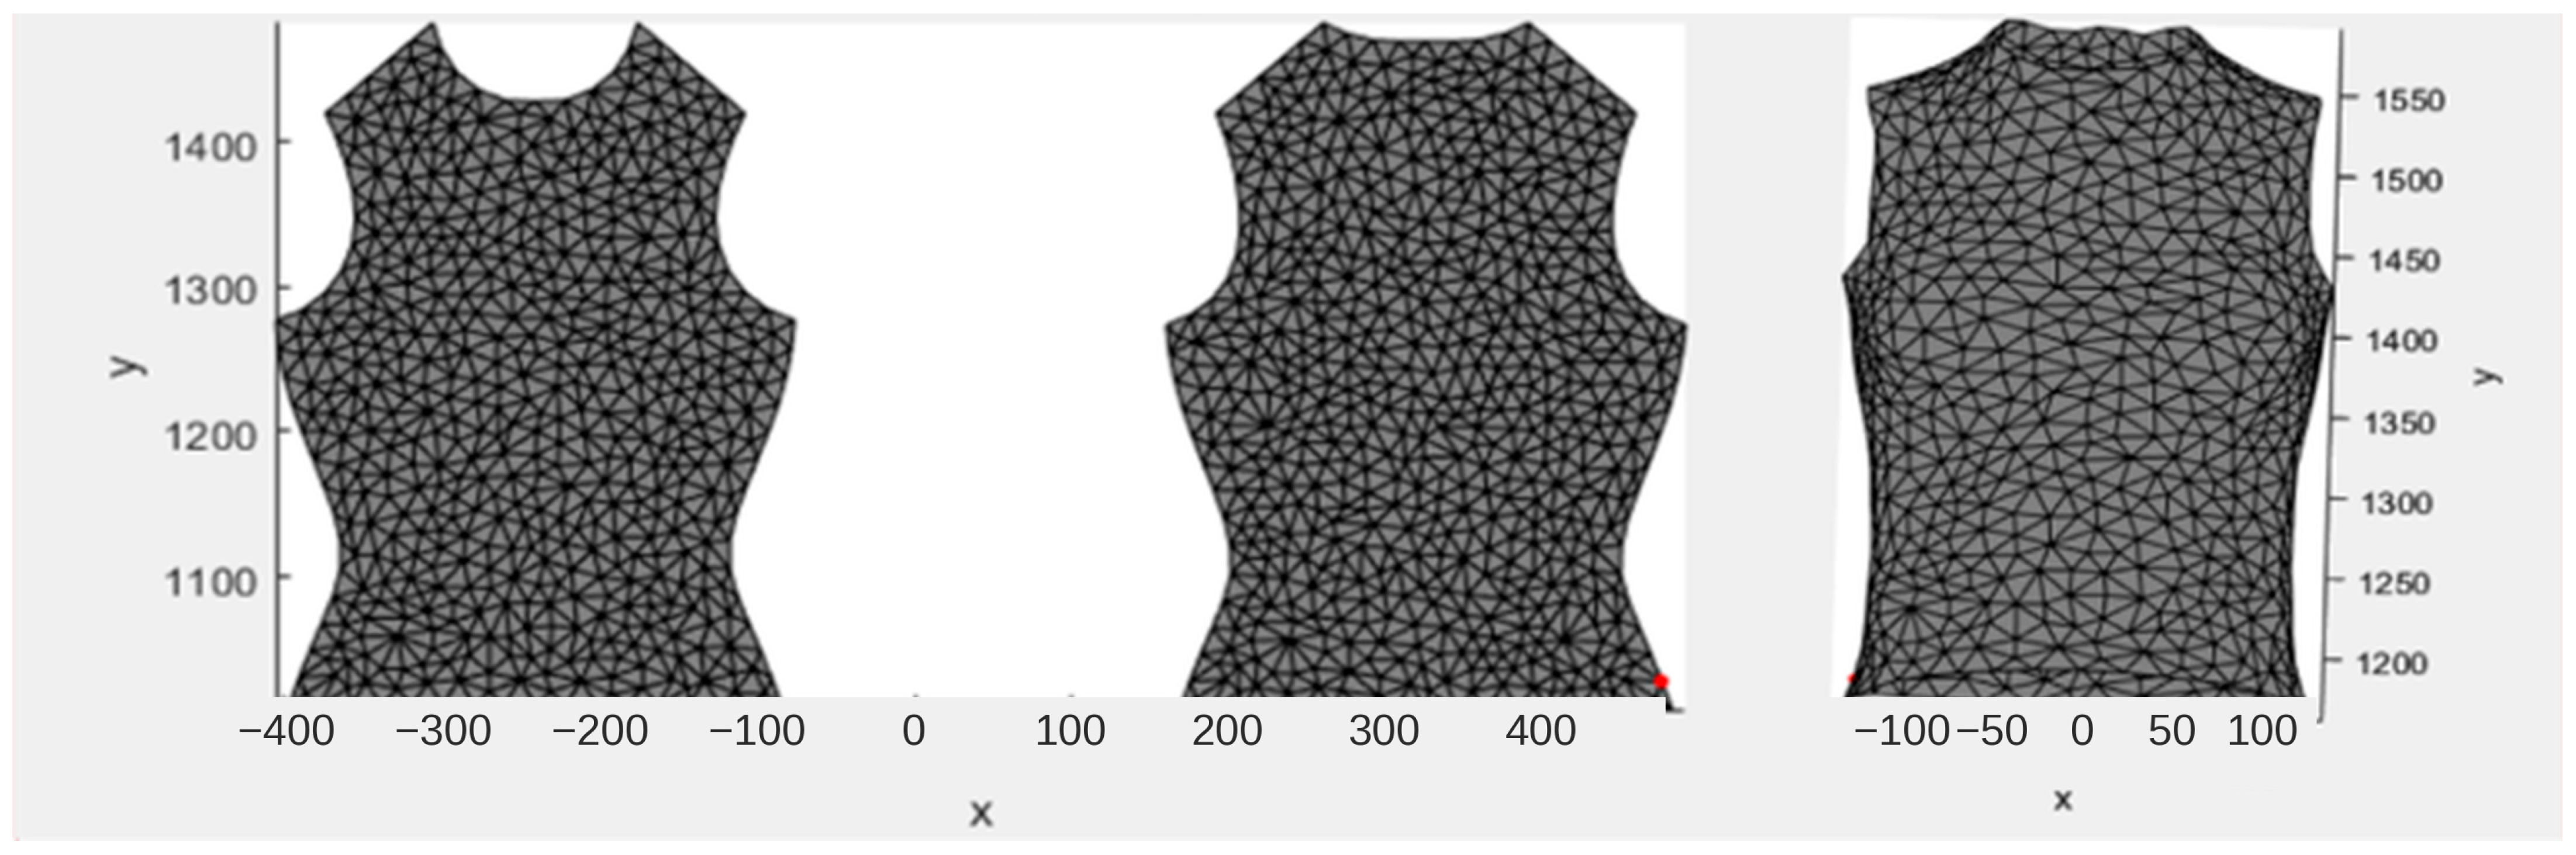
For the subsequent deformation analysis, Figure 4 shows the compression-top pattern before and after virtual simulation, including the flat garment mesh and the corresponding deformed 3D garment mesh. The flat garment mesh was defined as the reference geometry, hereafter referred to as FG, whereas the simulated 3D garment mesh after virtual fitting was defined as DG. The FG and DG meshes, which retained identical vertex correspondence and topology, were exported as OBJ files for subsequent numerical analysis. Their topological and geometric characteristics are summarized in Table 4. The garment meshes were generated using a particle distance of 20 mm, whereas the avatar retained the native high-resolution CLO 3D mesh. Because the avatar mesh was used only as a fixed geometric reference for determining the nearest-surface distance and body-directed projection, direct node-to-node correspondence or matched polygon sizes between the garment and avatar meshes were not required in the present procedure.
Figure 4.
Flat garment mesh (FG) and deformed garment mesh (DG).
Table 4.
Topological and geometric characteristics of the garment and avatar meshes.
3.4. Software Environment and Custom Implementation
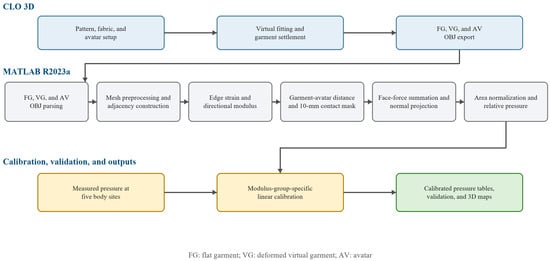
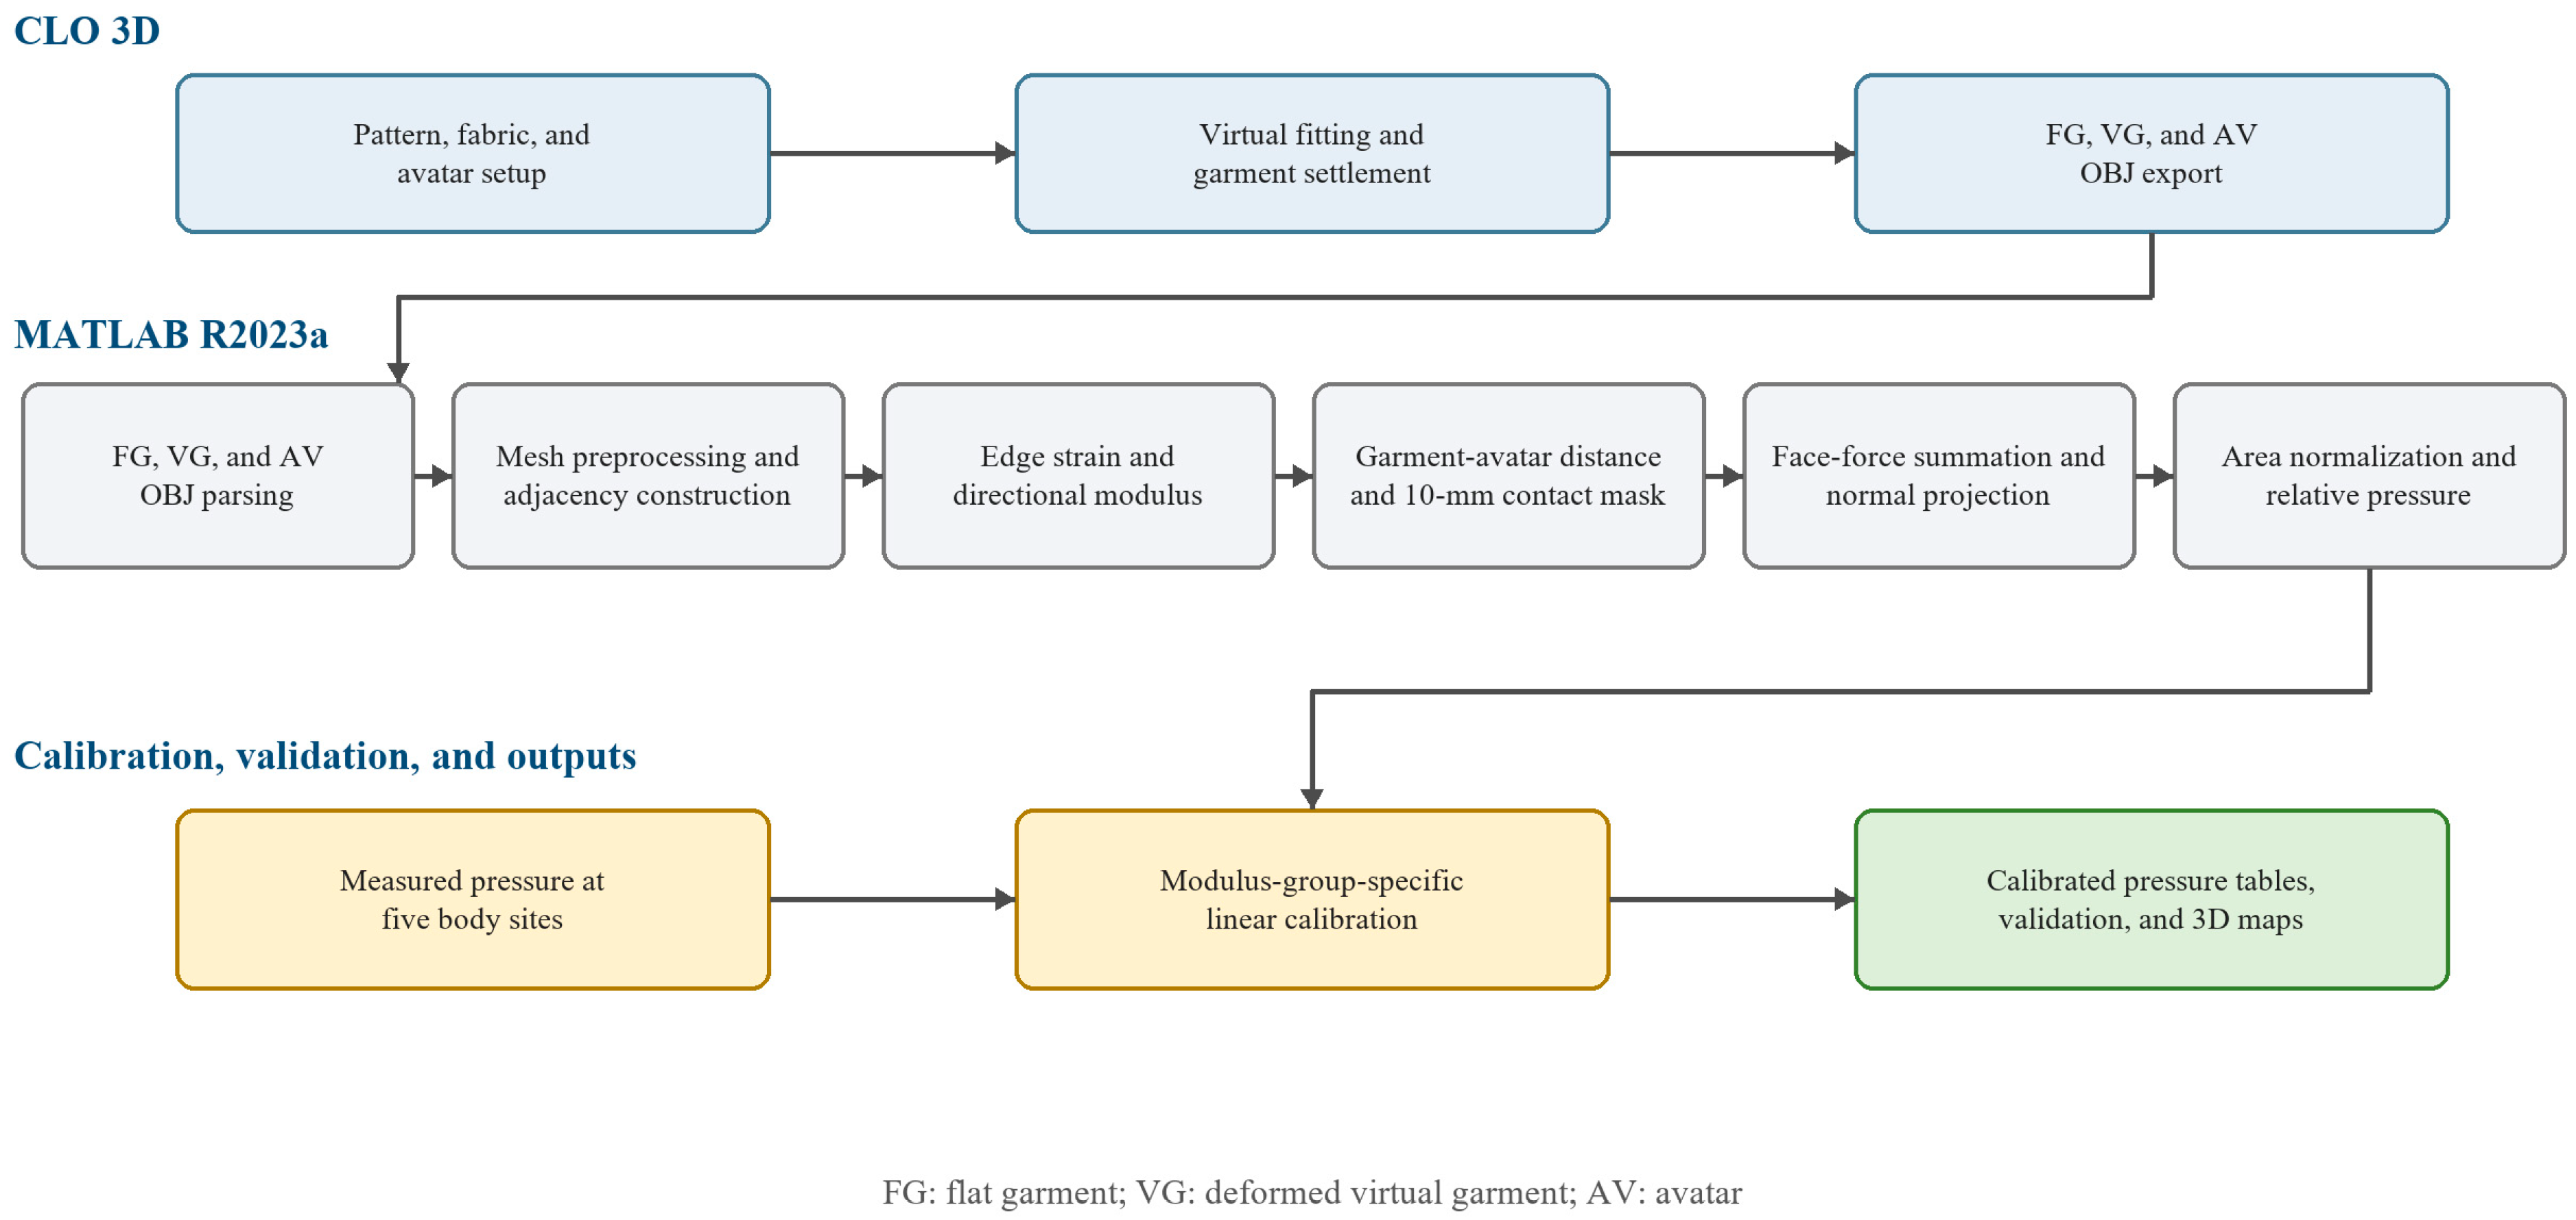
The base garment patterns were prepared and reduced in YUKA CAD and imported into CLO 3D 2026.0 in DXF format. CLO 3D 2026.0 was used to prepare and assign digital fabric properties, conduct virtual fitting, and export the flat garment (FG), deformed virtual garment (DG), and avatar (AV) as triangulated Wavefront OBJ meshes using millimeters as the coordinate/length unit. The corresponding FG and DG meshes were imported into MATLAB R2023a without remeshing, smoothing, decimation, subdivision, or vertex reordering. Custom MATLAB procedures preserved vertex correspondence, reconstructed adjacency, calculated the raw predicted-pressure field, performed modulus-group-specific linear calibration, and generated numerical and 3D outputs. No custom CLO plug-in or add-on was used. The overall computational workflow from pattern preparation and virtual fitting to calibrated numerical output is illustrated in Figure 5. The software environments, principal functions, and data-exchange formats used in the workflow are summarized in Table 5.
Figure 5.
Computational workflow from CLO 3D virtual fitting to calibrated numerical outputs. Colors distinguish the main workflow stages: CLO 3D operations (blue), MATLAB-based numerical processing (gray), measurement input and calibration (yellow), and final calibrated outputs (green).
Table 5.
Software environment and data-exchange format.
The algorithm first identified vertex connectivity and adjacent triangular faces within the garment mesh. For each vertex, all neighboring vertices connected through triangular faces were identified, and the corresponding edge lengths before and after deformation were calculated. The Euclidean distance between two adjacent vertices was computed using Equation (1):
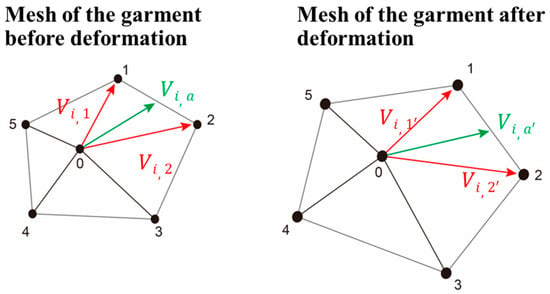
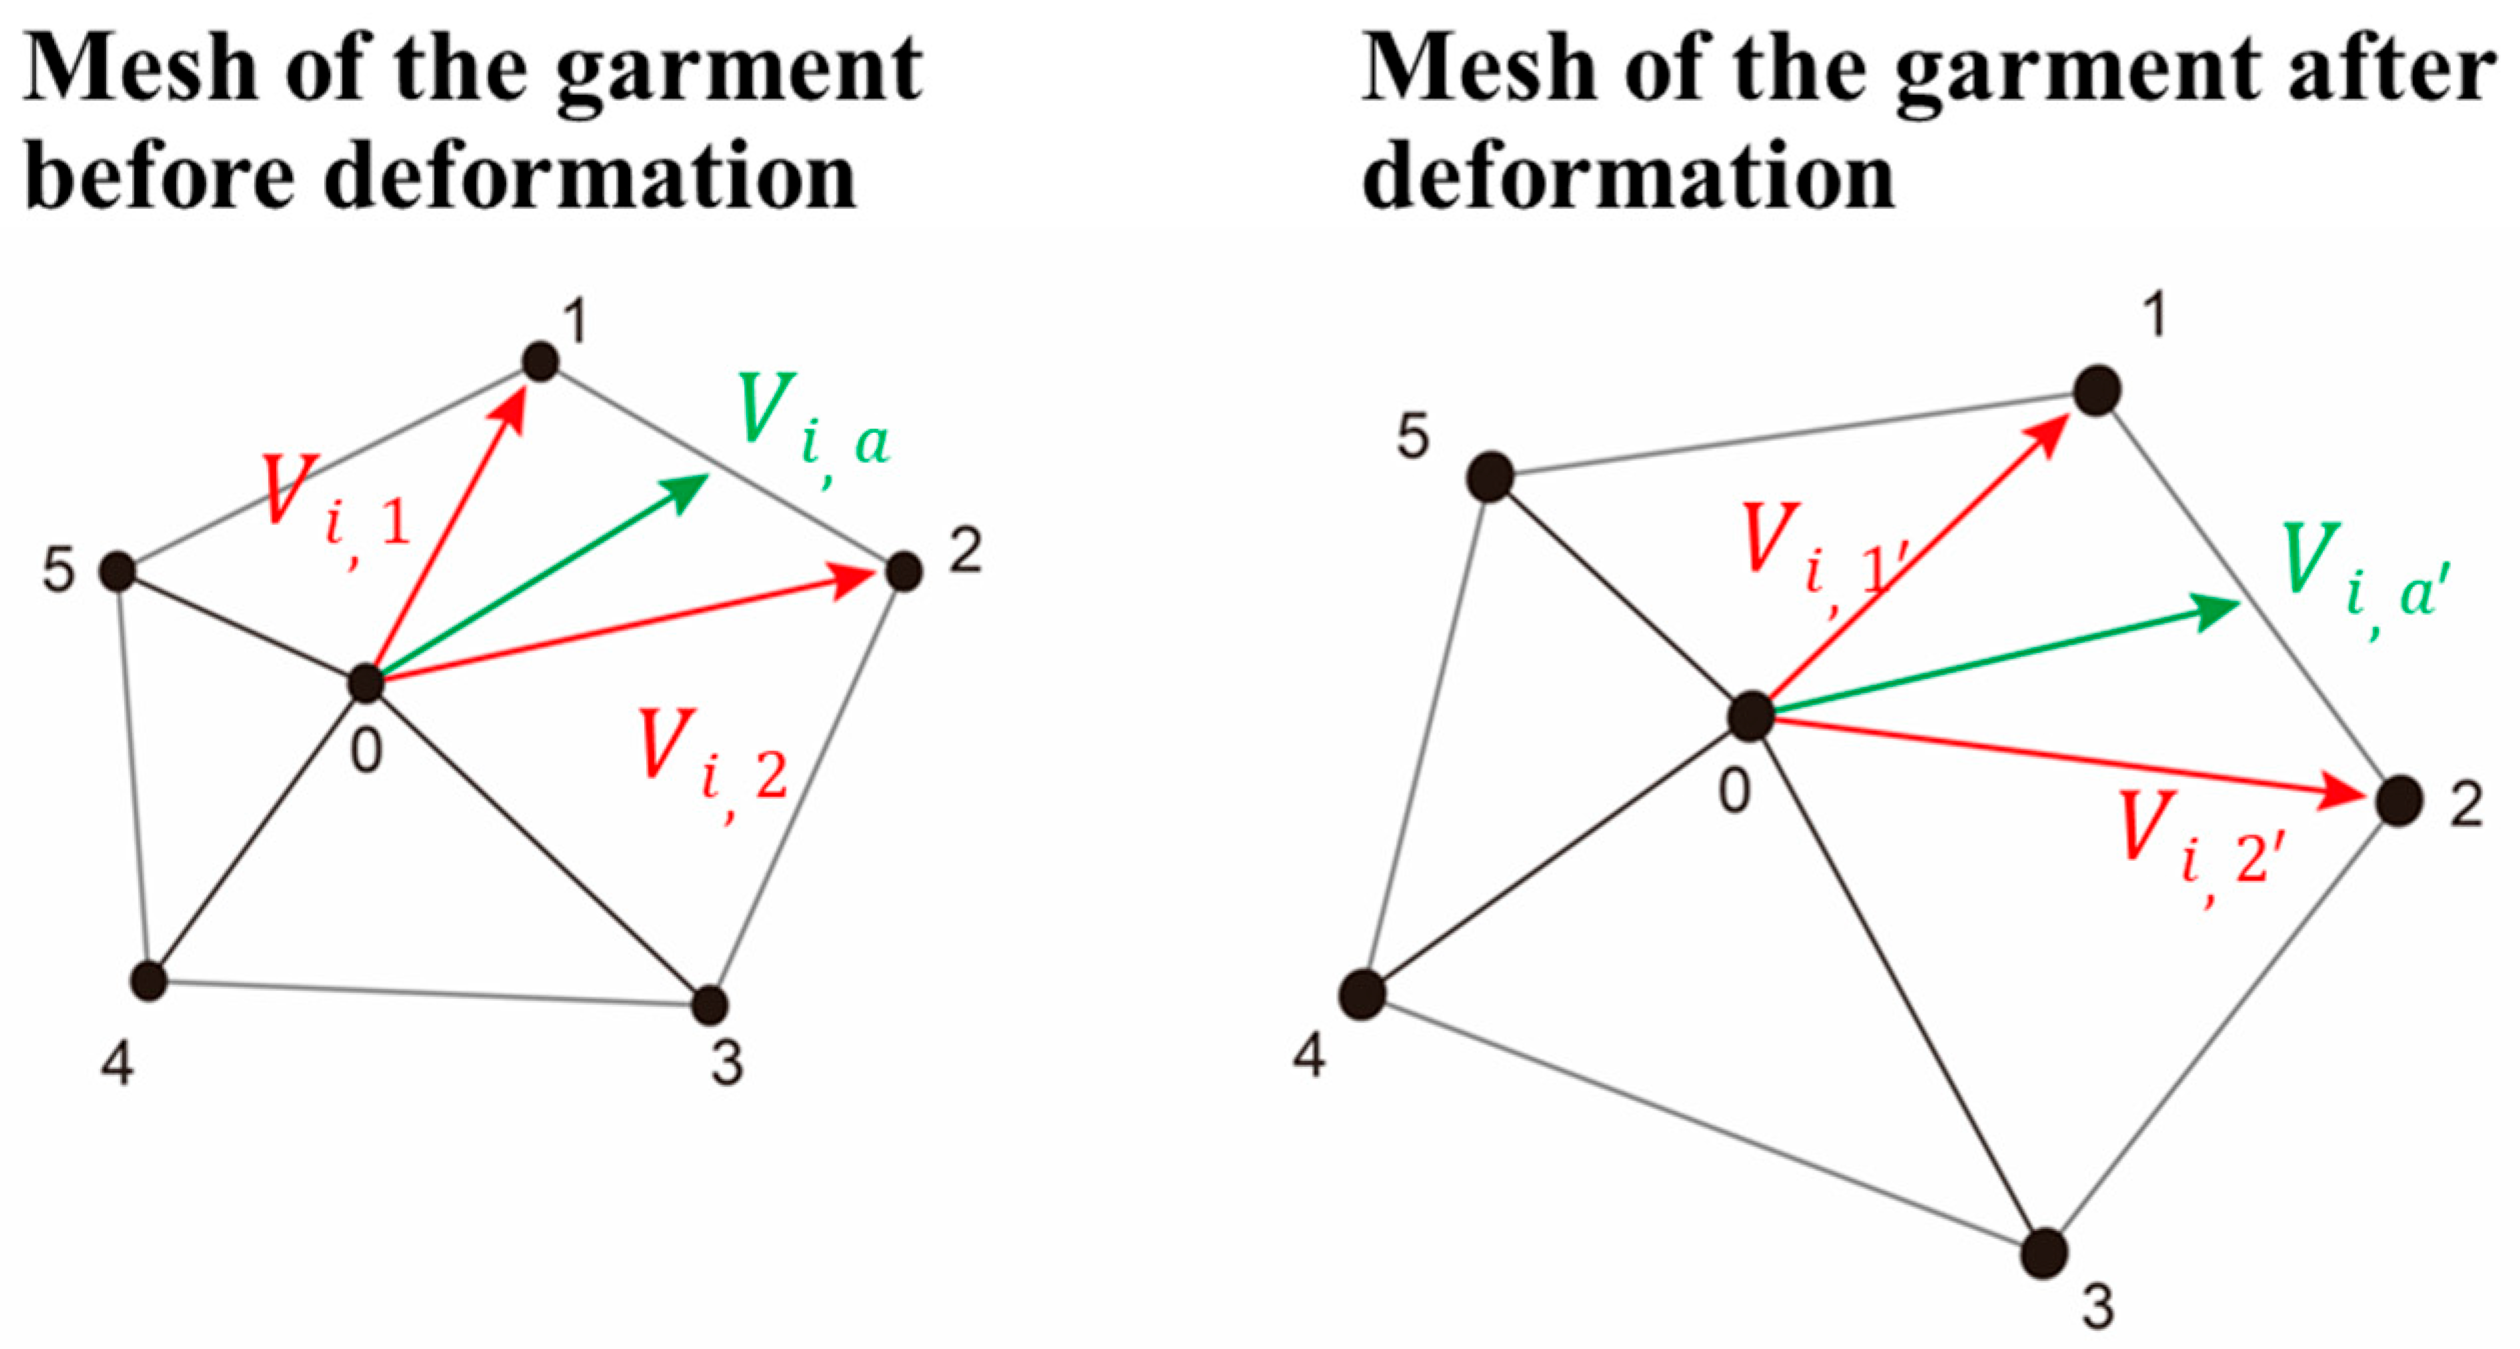
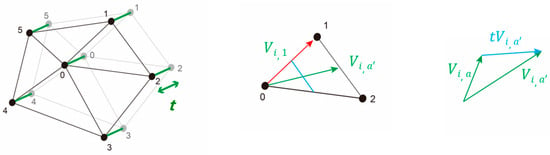
Here, and denote the coordinates of FG (, , ) and DG (, , ), respectively, in the 3D space (x, y, z). Based on these coordinates, the midpoint-direction vector for each adjacent triangular face was calculated by averaging the two edge vectors, (, , …), extending from vertex i to the neighboring vertices of each mesh triangle (Figure 6), as follows:
Figure 6.
3D mesh-edge representation before and after deformation (Step 1). Red arrows represent the two edge vectors, and , whereas green arrows represent their averaged midpoint-direction vector, . Unprimed and primed symbols denote the vectors before and after deformation, respectively.
Accordingly, the engineering strain of each corresponding edge was calculated from the change in edge length between the FG and DG meshes using Equation (3), as illustrated in Figure 6.
Subsequently, this edge-length strain value was used to calculate the internal forces generated by the deformation of the garment mesh.
Because clothing pressure is generated only when the garment is in close contact with the body, the distance between the avatar surface and the deformed garment mesh was calculated. The avatar mesh was defined as AV, and the deformed virtual garment mesh was defined as DG. For each garment vertex, the nearest point on the avatar surface was identified, and the garment–avatar distance was calculated.
For each vertex of the deformed garment mesh, the shortest distance to the avatar surface was calculated using the nearest point on the avatar mesh. A distance-based proximity mask was then applied to determine which garment vertices were included in the pressure-estimation procedure. Vertices located within the selected threshold were retained, whereas vertices beyond the threshold were excluded from the calculation and assigned a pressure-related value of zero. This distance criterion was not intended to represent true physical contact or an actual garment–body gap. Rather, it was introduced as an operational modeling parameter to account for numerical separation between the discrete garment and avatar surfaces, nearest-surface approximation, and the simplified representation of fabric thickness and local surface geometry. Candidate thresholds ranging from 1 to 15 mm were evaluated using the stabilization analysis described in Section 3.7. Based on the predefined numerical stabilization criteria, 10 mm was selected for the final calibration and visualization analyses. Therefore, the 10 mm value should be interpreted as a garment-, mesh-, and avatar-specific proximity threshold rather than as a universally applicable physical contact distance.
3.5. Vector-Projection-Based Pressure Estimation
The computational sequence, including the inputs, operations, and outputs associated with each equation, is summarized in Table 6. The internal forces generated by garment deformation were calculated from edge-length strain and the mechanical properties of the fabric. Because clothing pressure is influenced by the tensile behavior of the material, Young’s modulus was selected as the representative mechanical parameter for estimating the internal stress of the deformed garment mesh. However, because Hooke’s law is valid only within the linear elastic region, the tangent modulus derived from the stress–strain curve was used to represent the effective modulus within the relevant deformation range.
Table 6.
Processing sequence and equation correspondence.
The internal stress of the material was calculated using the following equation:
Material internal stress (σ) = edge-length strain ratio × Young’s modulus
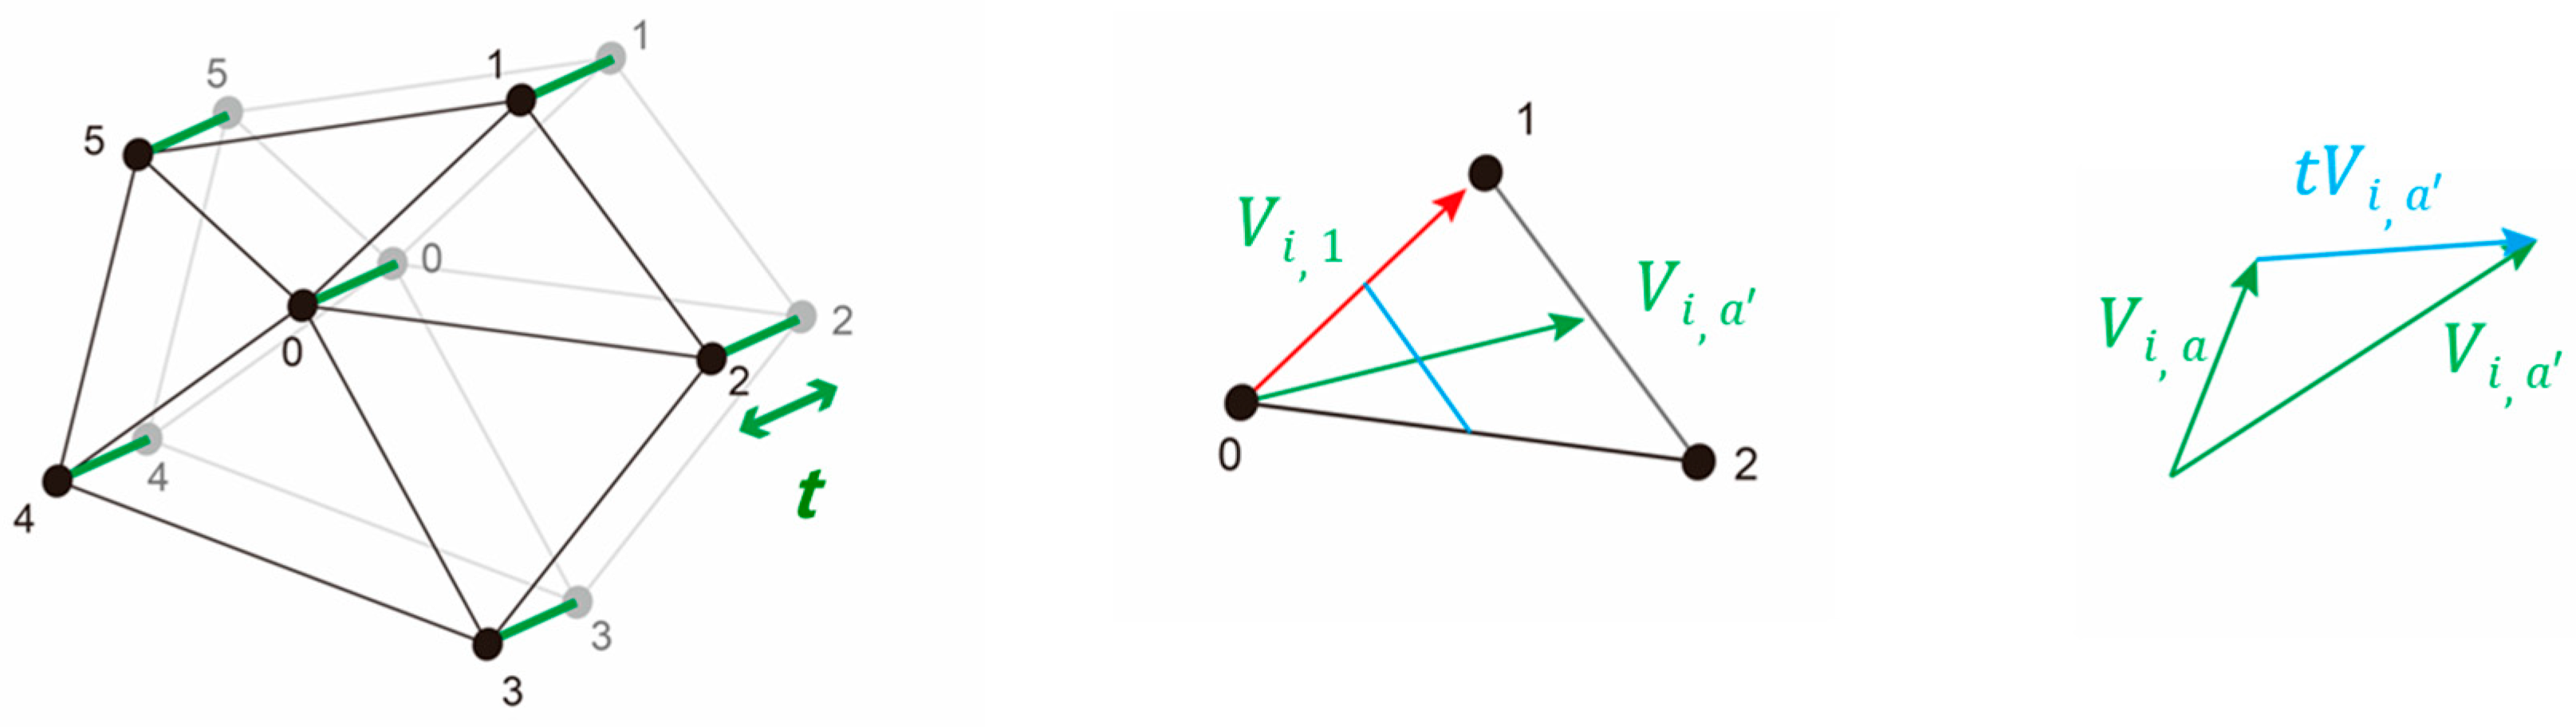
Subsequently, the internal force () was derived using the effective area and direction vector. Internal stress (σ) was obtained from the product of the edge-length strain ratio and Young’s modulus (Hooke’s law). This value was multiplied by the effective area to determine the internal force () generated by each adjacent face. The effective area was calculated as the product of fabric thickness and the representative face length ().
As shown in Figure 6, the internal force of the material represents the magnitude of force exerted by an adjacent triangular face on a vertex (Step 2, Figure 7). The representative face length was calculated as one-half of the side opposite the vertex within the triangular face. The internal force () associated with each adjacent face was calculated and subsequently summed to obtain the resultant internal force . The resultant force was then projected onto the body-normal vector (n_body) to obtain .
Figure 7.
Determination of internal force (Step 2). Red arrows indicate edge vectors, green arrows indicate midpoint-direction vectors and the fabric-thickness offset, and blue arrows or line segments indicate the derived geometric vectors used to determine the effective area and force direction.
The internal force () can be expressed as the product of the edge-length strain ratio, Young’s modulus, effective area, and direction vector:
where F_ij represents the internal force, represents the edge-length strain ratio, E represents the Young’s modulus, and _ef represents . nOa is the unit direction vector extending from vertex i toward the midpoint of the opposite edge of the adjacent triangular face.
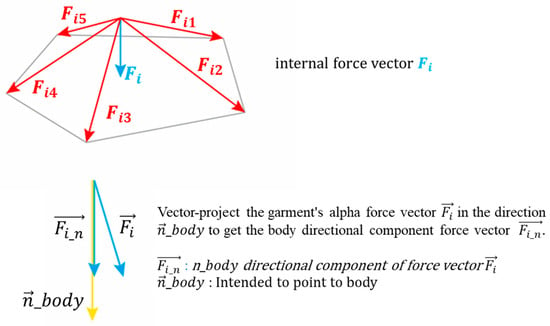
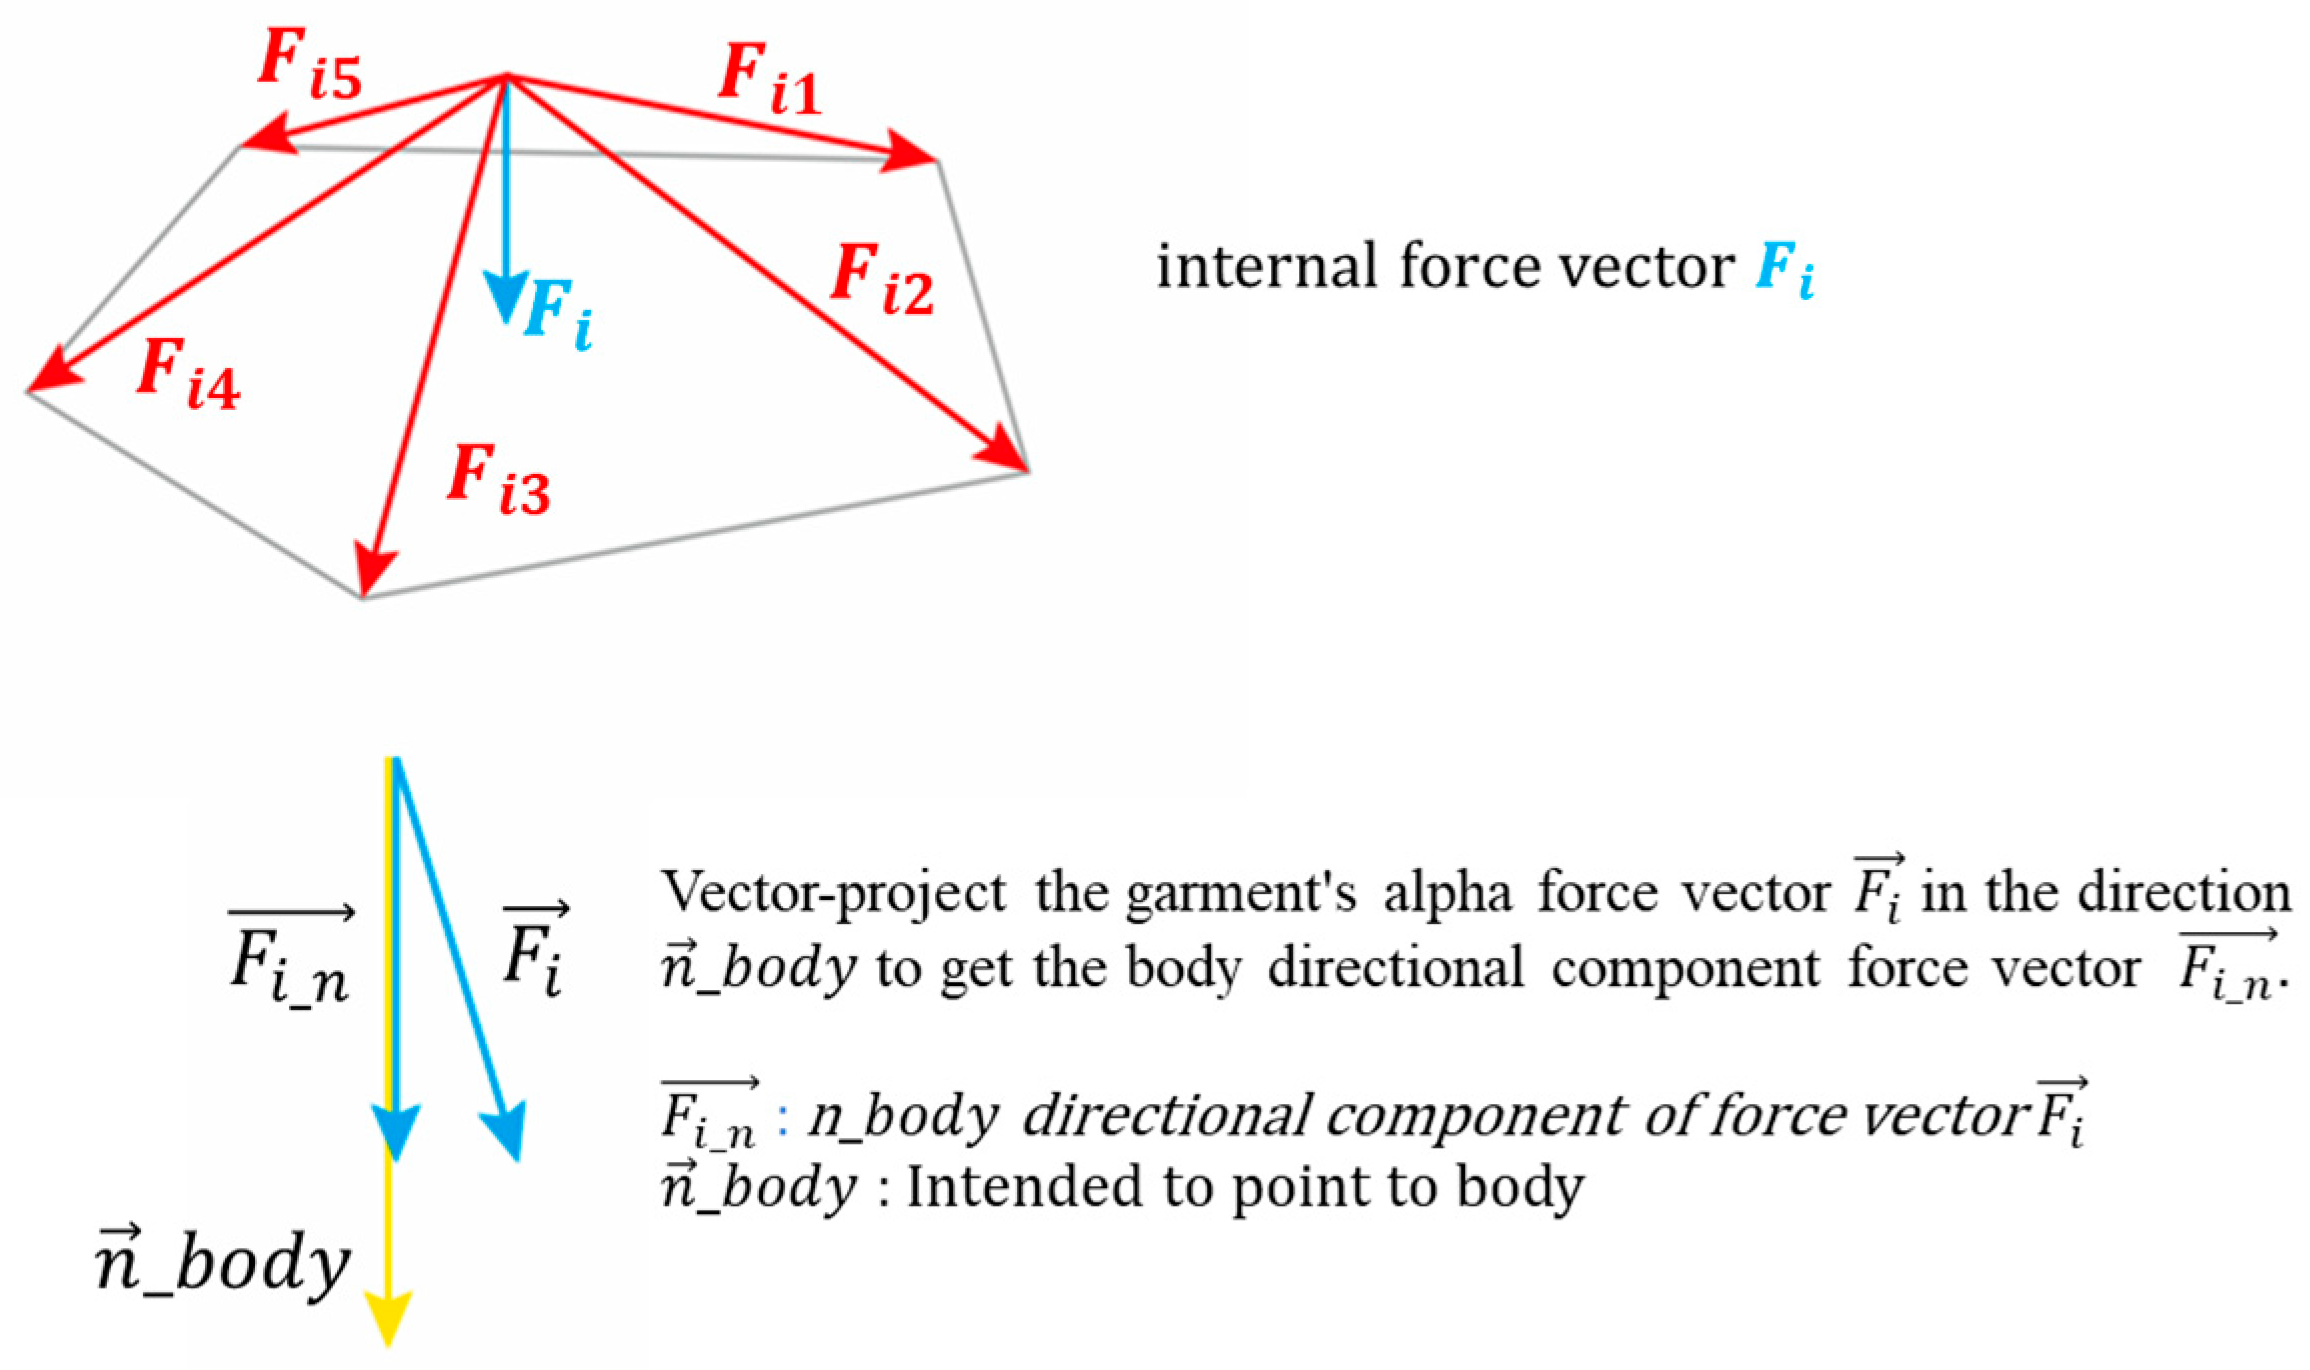
Because the internal forces generated within the fabric act primarily along the garment surface rather than directly toward the body, the net internal force vector () was calculated by summing the forces contributed by all adjacent faces, , , , , …, as illustrated in Step 3 of Figure 8:
where denotes the internal force vector by the jth area component of vertex i.
Figure 8.
Projection of internal force onto the body-normal direction (Step 3).
Finally, the resultant internal-force vector was projected as dot products onto this vector, which is perpendicular to the fabric. The orthogonal vector used for projection is the vector pointing toward the body-normal direction of adjacent faces. The summing of the projected values thus obtained is the unit of force (Step 3); it is divided by the vertex-based area to calculate the pressure (Figure 8). The force vector of the component in the body direction, , can be obtained by vector projection in the n_body direction, so that force vector of the garment points to the avatar, as follows:
where is the force vector and the directional component of in .
The predicted clothing pressure was subsequently calculated as:
where Fi denotes the internal forces of the material, n denotes the orthogonal vector, and Sref denotes the vertex-based area determined using Equation (9). Base area, , was divided by three because each triangular area was shared thrice by each of the three vertices.
Here, denote edge length vectors from the vertex.
The resulting predicted pressure distributions were visualized using color mapping and rendered as 3D graphs to facilitate interpretation of spatial pressure-distribution patterns (Figure 9, Step 4).
Figure 9.
Generation of 3D predicted-pressure distributions from internal-force calculations (Step 4).
3.6. Calibration and Performance Evaluation
The pressure-related values calculated using the vector-projection procedure were predicted values because they were derived from digital mesh deformation and material parameters. Therefore, a calibration procedure was performed to convert the calculated predicted-pressure values into values comparable with the measured clothing-pressure values.
For calibration, the estimated pressure-related values were extracted from the same five body locations used for the physical clothing-pressure measurements. The five measurement locations were the shoulder blade, lower back, front neck, bust apex, and side abdomen. For each of the ten experimental conditions, comprising five fabric types and two pattern-reduction levels, the estimated pressure values were paired with the corresponding measured pressure values obtained from the physical garments.
A linear regression model was used to calibrate the estimated predicted-pressure values against the measured clothing-pressure values:
where denotes the clothing pressure measured using the physical pressure sensor, denotes the predicted-pressure value calculated using the proposed vector-projection method, and and are the calibration coefficients.
Because fabric stiffness can influence the relationship between mesh deformation and measured clothing pressure, the calibration procedure also considered the mechanical characteristics of the fabrics. The fabrics were grouped according to their Young’s modulus values, and separate regression coefficients were calculated for fabrics with relatively low and high modulus values. This grouping was used to reduce bias arising from differences in fabric stiffness and stretch behavior. In this study, a Young’s modulus threshold of 1.0 was used as an empirical criterion to distinguish relatively low- and high-modulus fabrics within the experimental fabric set. This threshold was intended only as a calibration-based grouping criterion for the materials investigated in this study and was not intended as a universal classification standard for compression fabrics.
To illustrate the numerical implementation of the preceding equations, a representative calculation was performed for vertex 409 of the White garment with a 20% pattern reduction using its complete one-ring neighborhood. The principal input values, intermediate calculation results, and resulting raw predicted-pressure value are summarized in Table 7. The complete edge- and face-level calculations are provided in Supplementary Tables S1–S3.
Table 7.
Representative input–calculation–output example retained in the main text.
Because the vector-projection procedure generates predicted pressure-related values rather than direct estimates of physical clothing pressure, empirical calibration was performed to convert the calculated values to a scale comparable to the measured clothing-pressure values. To determine whether this relationship required a nonlinear functional form, linear, quadratic, exponential, and power regression models were compared. The numerically calculated predicted-pressure value was used as the predictor, and the measured clothing pressure was used as the response variable. Separate model coefficients were estimated for the low- and high-Young’s-modulus groups. Predictive performance was evaluated primarily using leave-one-garment-out cross-validation. Each of the ten garments represented one combination of fabric and pattern-reduction level. In each fold, all five measurement-site observations from one garment were withheld together, the calibration model was fitted using the remaining garments, and pressure values were predicted for the withheld garment. Leave-one-fabric-out cross-validation was additionally conducted as a sensitivity analysis. In this analysis, both the 20% and 30% pattern-reduction conditions for one fabric, comprising ten observations, were withheld together.
Predictive performance was evaluated using R2, RMSE, and MAE, which are standard regression-performance metrics [32]. Candidate models were compared on the basis of cross-validated RMSE, MAE, and (), together with residual patterns and model parsimony. Overall performance was calculated by pooling the out-of-fold predictions across all fabrics, pattern-reduction levels, and measurement sites. Out-of-fold prediction errors were additionally summarized by anatomical site to examine location-specific variation in predictive performance. Site-specific analysis was particularly relevant because local body curvature, garment openings, and differences between the physical mannequin and digital avatar could affect pressure estimation in particular regions.
After the candidate models had been compared, the selected calibration function was refitted using all available observations within each Young’s-modulus group to obtain the final group-specific calibration equations. Fabric-specific regression fits were treated as exploratory descriptive analyses and were not used for primary model selection or predictive-performance evaluation.
3.7. Contact-Distance Threshold Stabilization Analysis
Because the proposed method calculates pressure-related values from digital mesh geometry, the contact-distance threshold used to distinguish close-contact regions from loose-fit regions may affect the number of garment vertices included in the pressure-estimation procedure. A threshold-stabilization analysis was therefore conducted to examine how the calculated pressure-related values changed as the garment–avatar contact-distance criterion increased.
The pressure-estimation procedure was repeated using contact-distance thresholds ranging from 1 to 15 mm in 1 mm increments. At each threshold, garment vertices located within the specified distance from the avatar surface were retained for the pressure calculation, whereas vertices outside the proximity mask were assigned a pressure-related value of zero. The analysis included 50 garment–site observations, comprising five fabrics, two pattern-reduction levels, and five measurement sites, evaluated at each of the 15 candidate thresholds. This procedure produced 750 threshold-specific calculated values; however, because the same 50 observations were repeatedly evaluated across thresholds, these values were not treated as independent observations. As an additional robustness check, the stabilization analysis was repeated using the 45 training observations within each outer leave-one-garment-out cross-validation fold. For each threshold d, the mean pressure-related value across the 50 conditions was calculated and normalized by the corresponding mean value obtained at 15 mm:
where denotes the mean pressure-related value calculated using threshold d and denotes the corresponding mean value at the maximum threshold of 15 mm. This normalization was used to determine whether the overall magnitude of the calculated pressure-related values approached a plateau as the threshold increased.
The mean absolute change between two adjacent thresholds was additionally calculated as:
where denotes the pressure-related value for condition at threshold d and denotes the total number of garment–site conditions. This metric represents the average incremental change in the calculated values resulting from a 1 mm increase in the contact-distance threshold. For operational interpretation, numerical stabilization was considered to occur when two conditions were simultaneously satisfied: (1) the normalized mean pressure-related value remained within ±2% of the 15 mm reference value, and (2) the mean absolute change between adjacent thresholds was less than 0.1. The first threshold satisfying both criteria, with the criteria continuing to be satisfied at all larger thresholds, was identified as the conservative operational stabilization point.
This analysis was intended to evaluate numerical convergence and sensitivity of the mesh-based pressure estimates rather than to establish a physically universal contact distance or to provide independent validation of predictive accuracy. Accordingly, the selected threshold was interpreted as an empirical modeling criterion specific to the garment, mesh, and avatar conditions examined in this study.
4. Results
4.1. Calibration-Model Comparison and Predictive Performance
The vector-projection method generates predicted-pressure-related values derived from garment deformation, fabric mechanics, and force-direction characteristics rather than direct numerical estimates of physical clothing pressure. Empirical calibration was therefore required to convert the calculated values to a scale comparable to the measured clothing-pressure values.
Linear and nonlinear calibration functions were evaluated to determine whether the relationship between the calculated predicted-pressure values and measured clothing pressure required a nonlinear functional form. Separate model coefficients were estimated for the low- and high-Young’s-modulus groups. Predictive performance was assessed primarily using leave-one-garment-out cross-validation, in which all five measurement-site observations from the same garment were withheld together. Table 8 summarizes the cross-validated performance of the linear model and the power model, which showed the best performance among the nonlinear alternatives.
Table 8.
Cross-validated linear-power model comparison.
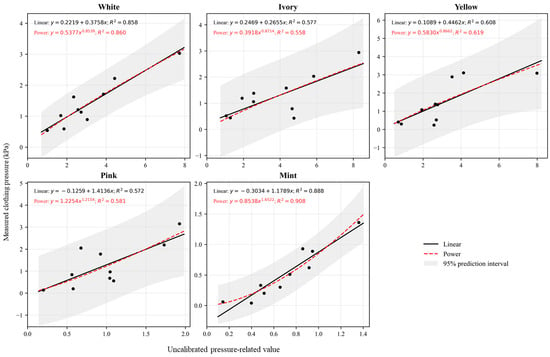
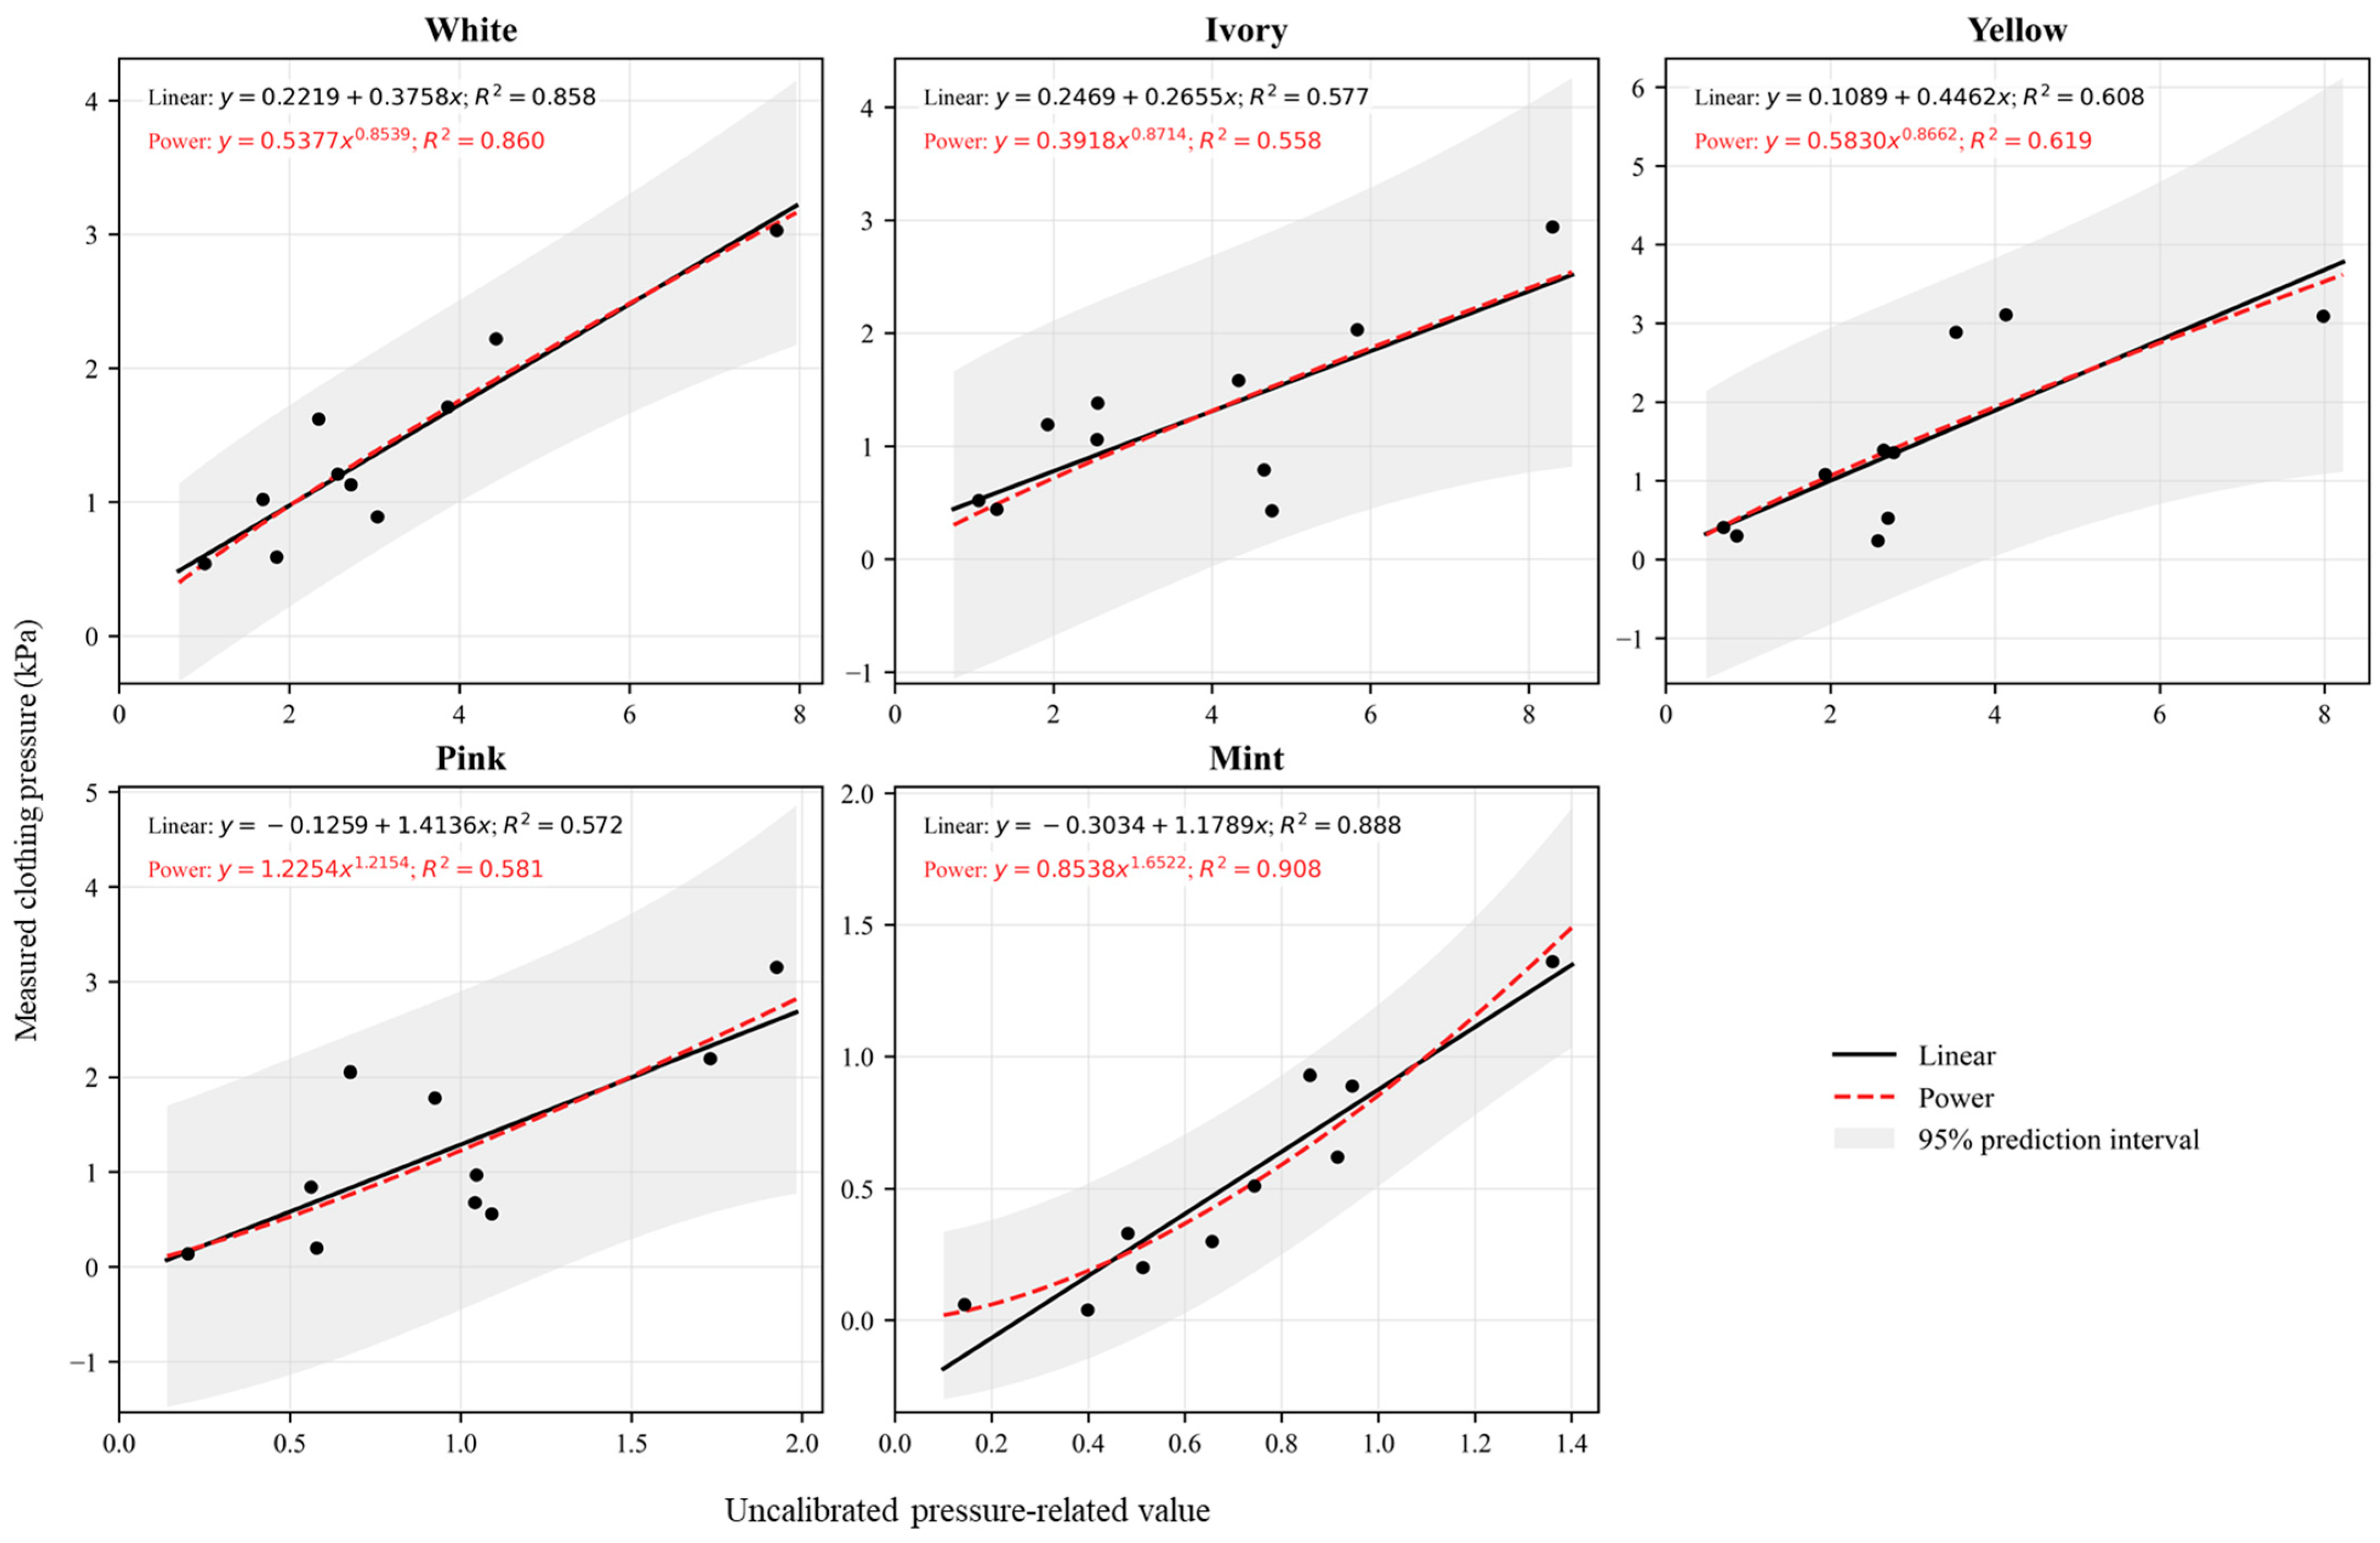
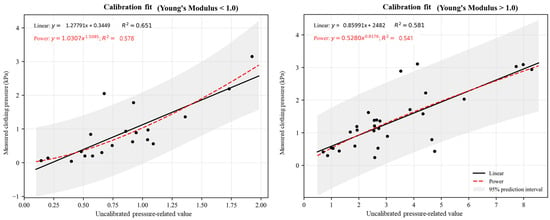
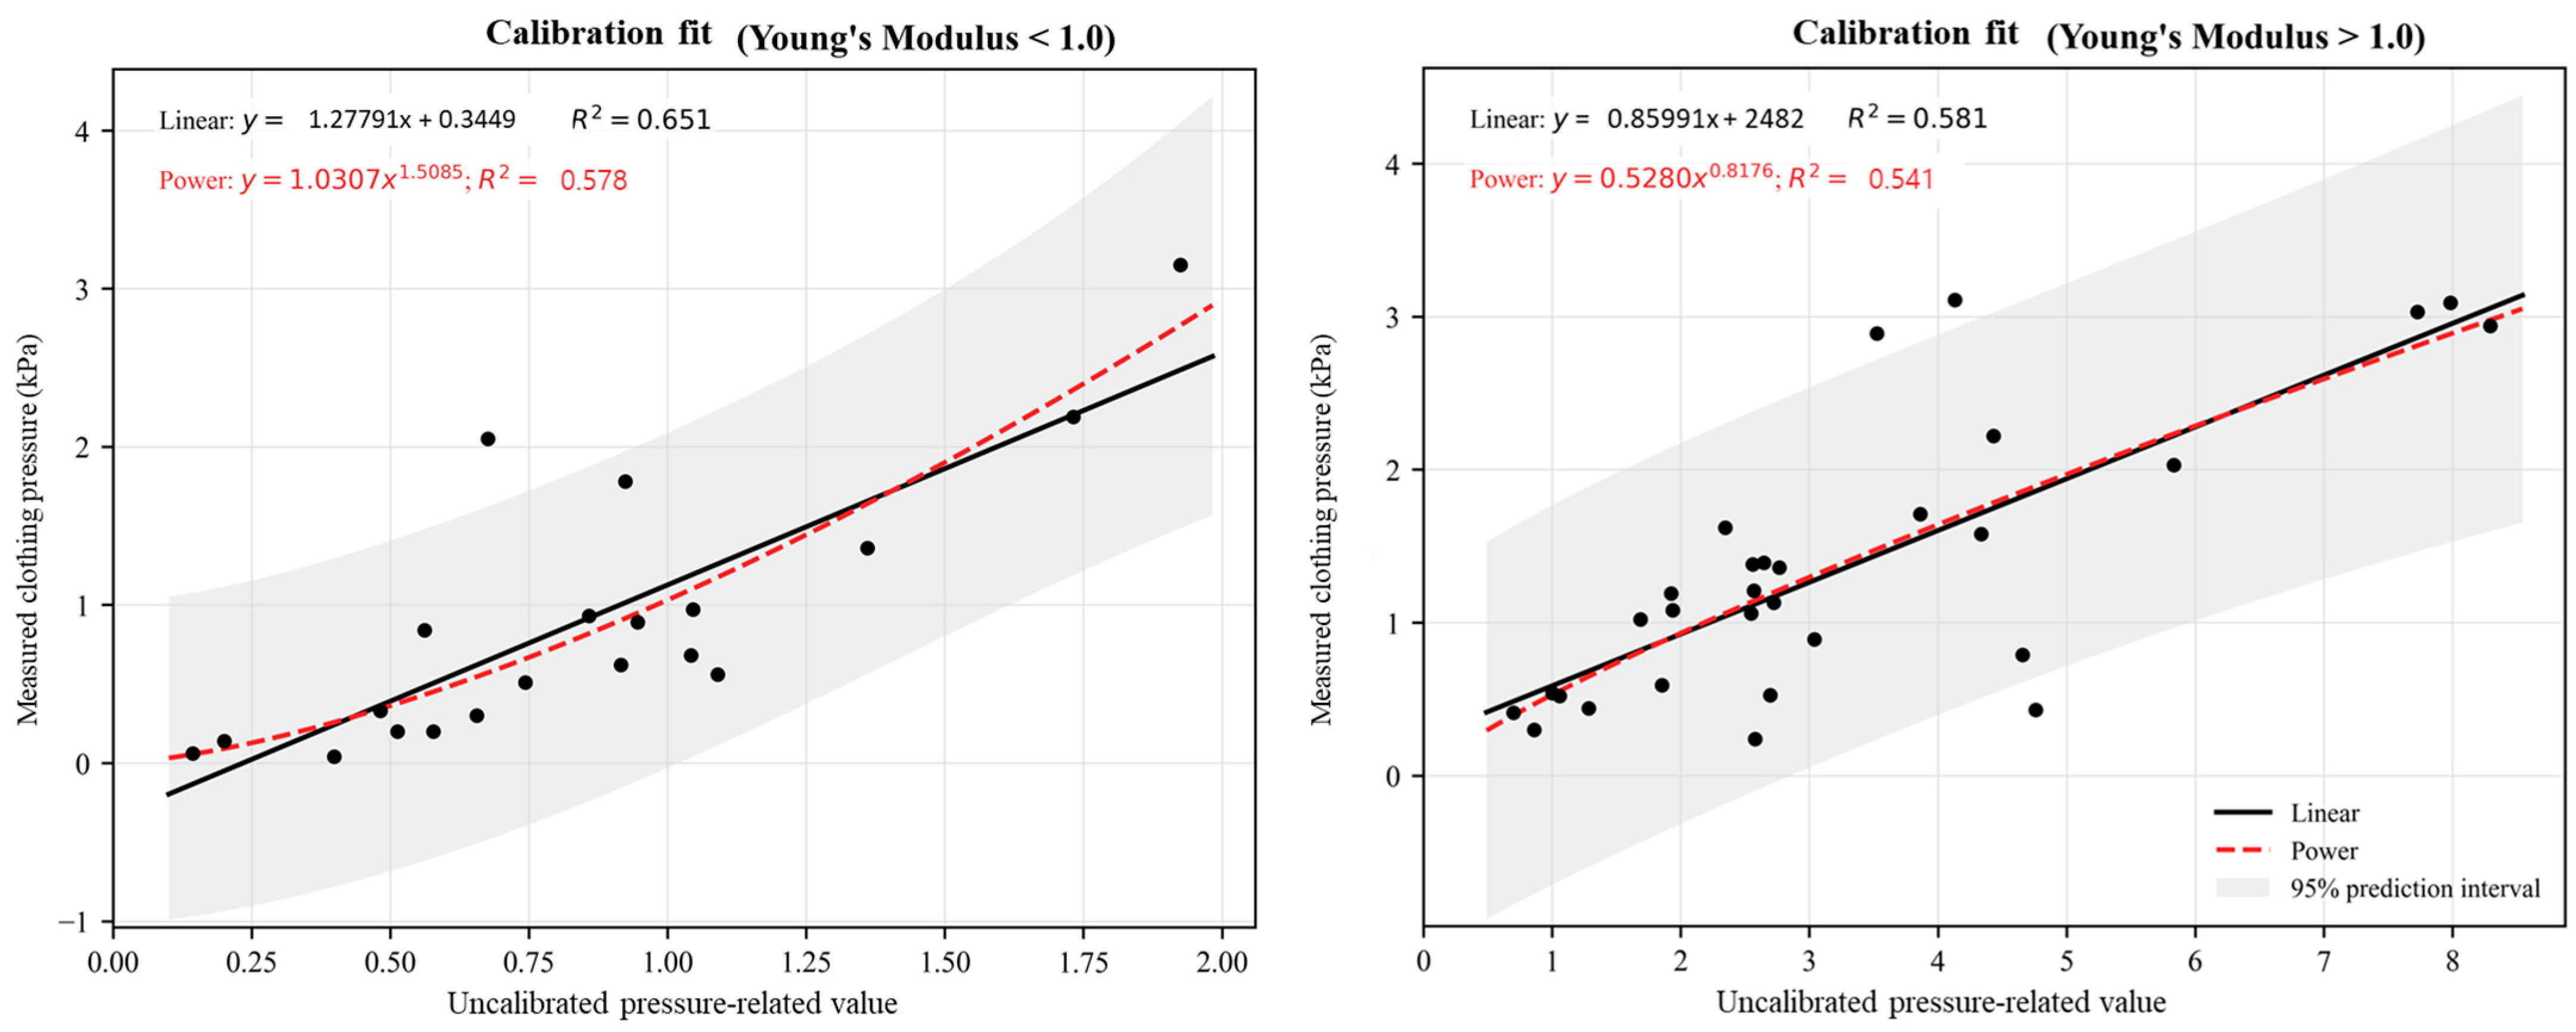
Figure 10 presents the fabric-specific regression relationships, while Figure 11 compares the linear and power calibration fits for the two Young’s-modulus groups. Regression lines and values in Figure 10 and Figure 11 were obtained from full-data exploratory fits and should not be interpreted as cross-validated predictive-performance metrics. The power model yielded slightly lower overall cross-validated prediction errors than the linear model. Under leave-one-garment-out cross-validation, RMSE decreased from 0.587 kPa for the linear model to 0.573 kPa for the power model, while MAE decreased from 0.427 to 0.399 kPa. The pooled out-of-fold () increased from 0.563 to 0.584. The improvement was more apparent in the low-modulus group, for which the power model reduced RMSE from 0.562 to 0.526 kPa and MAE from 0.431 to 0.374 kPa.
Figure 10.
Regression relationships between measured clothing pressure and uncalibrated pressure-related value for each fabric.
Figure 11.
Calibration equations according to the Young’s-modulus group.
In contrast, the linear and power models showed nearly identical performance in the high-modulus group. RMSE decreased only from 0.604 to 0.602 kPa, while () changed from 0.539 to 0.541. Thus, the improvement associated with the nonlinear function was modest overall and was driven primarily by the low-modulus fabrics. Leave-one-fabric-out cross-validation showed the same direction of change. The overall RMSE decreased from 0.630 kPa for the linear model to 0.605 kPa for the power model, while MAE decreased from 0.464 to 0.430 kPa. However, because only five fabrics were included, these results were interpreted as a sensitivity analysis rather than as independent external validation.
Although the power model produced slightly lower prediction errors, the magnitude of improvement over the linear model was small, particularly in the high-modulus group. Considering the comparable cross-validated performance, greater interpretability, and parsimony of the linear function, the modulus-group-specific linear models were retained as the final calibration approach. The power-model results were therefore interpreted as a nonlinear sensitivity analysis demonstrating that the overall predictive performance was not strongly dependent on the assumed functional form.
After model selection, the linear calibration functions were refitted using all available observations within each Young’s-modulus group. The resulting final calibration equations were:
y = 1.2791x + 0.3449 E < 1.0 (E: wale direction modulus)
The final equations should be interpreted as empirical calibration functions derived from the five fabrics and two pattern-reduction conditions examined in this study rather than as universal correction equations applicable to all compression textiles. Model selection considered cross-validated predictive error together with model interpretability, stability, and parsimony. Fabric-specific regression fits are reported as exploratory analyses in Supplementary Table S1 and were not used for primary model selection or predictive-performance evaluation.
4.2. Visualization of Calibrated 3D Pressure Distributions
Physical clothing pressure was measured at five predefined body locations using point-based pressure sensors. Accordingly, the measured values represent local pressure conditions at discrete anatomical sites rather than a continuous pressure distribution over the entire garment surface. In contrast, the vector-projection procedure generated predicted-pressure-related values at the garment-mesh vertices. The final modulus-group-specific linear calibration equations were applied to these mesh-level values to generate calibrated pressure estimates and visualize their spatial distribution as three-dimensional color maps.
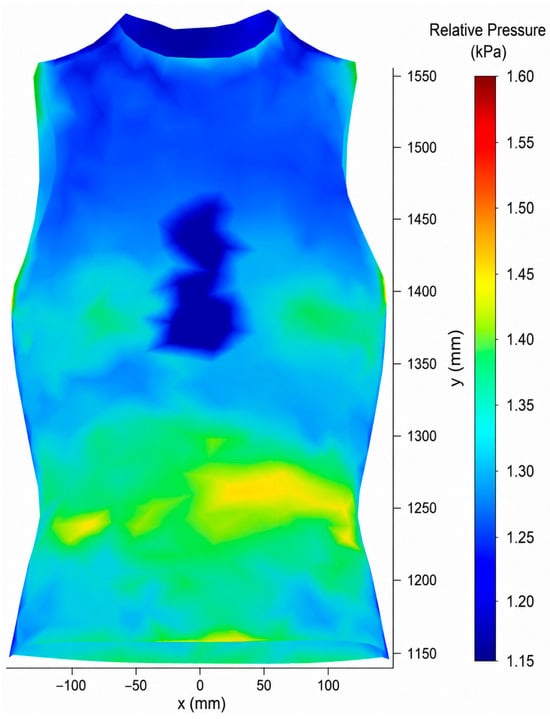
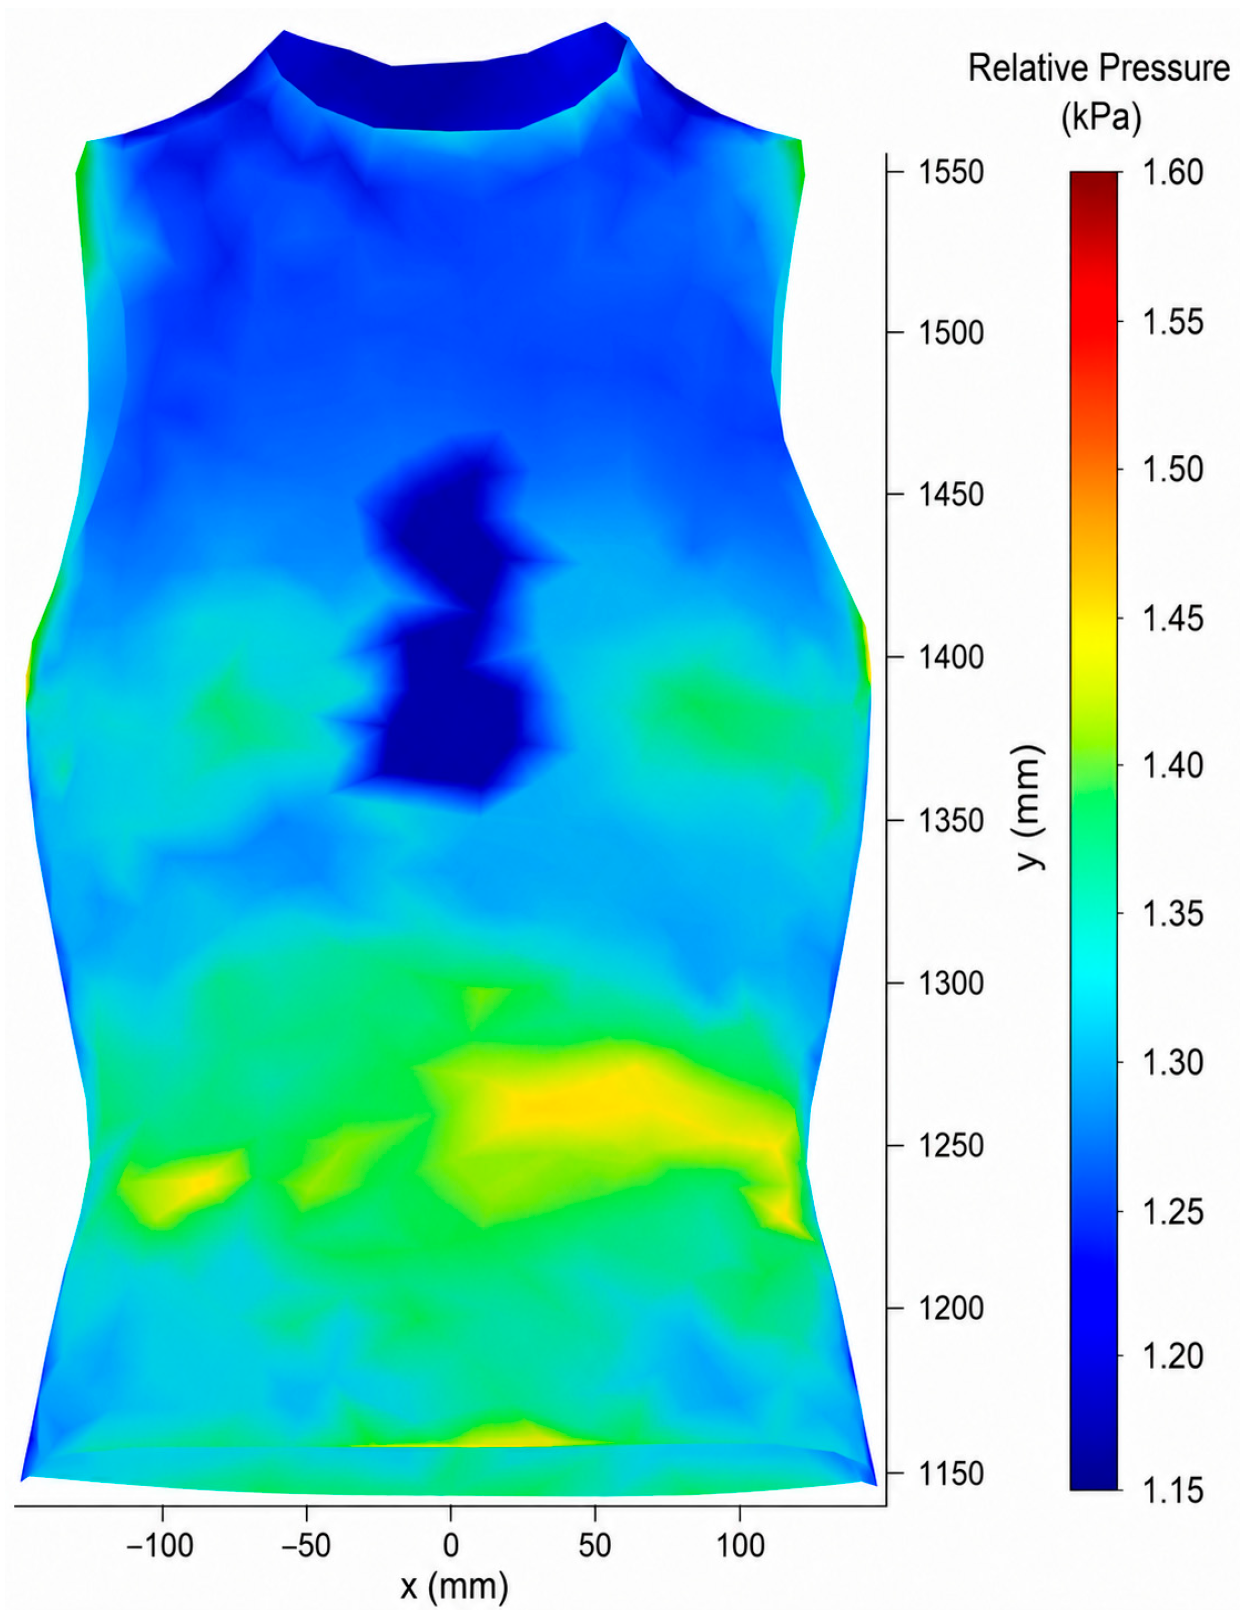
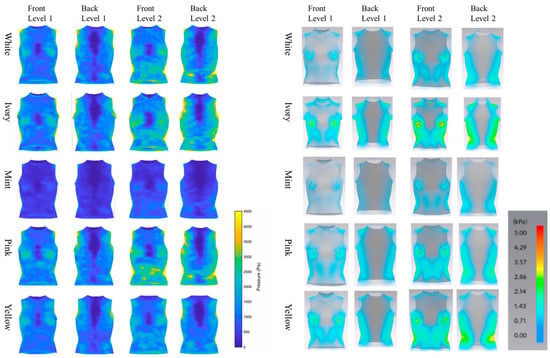
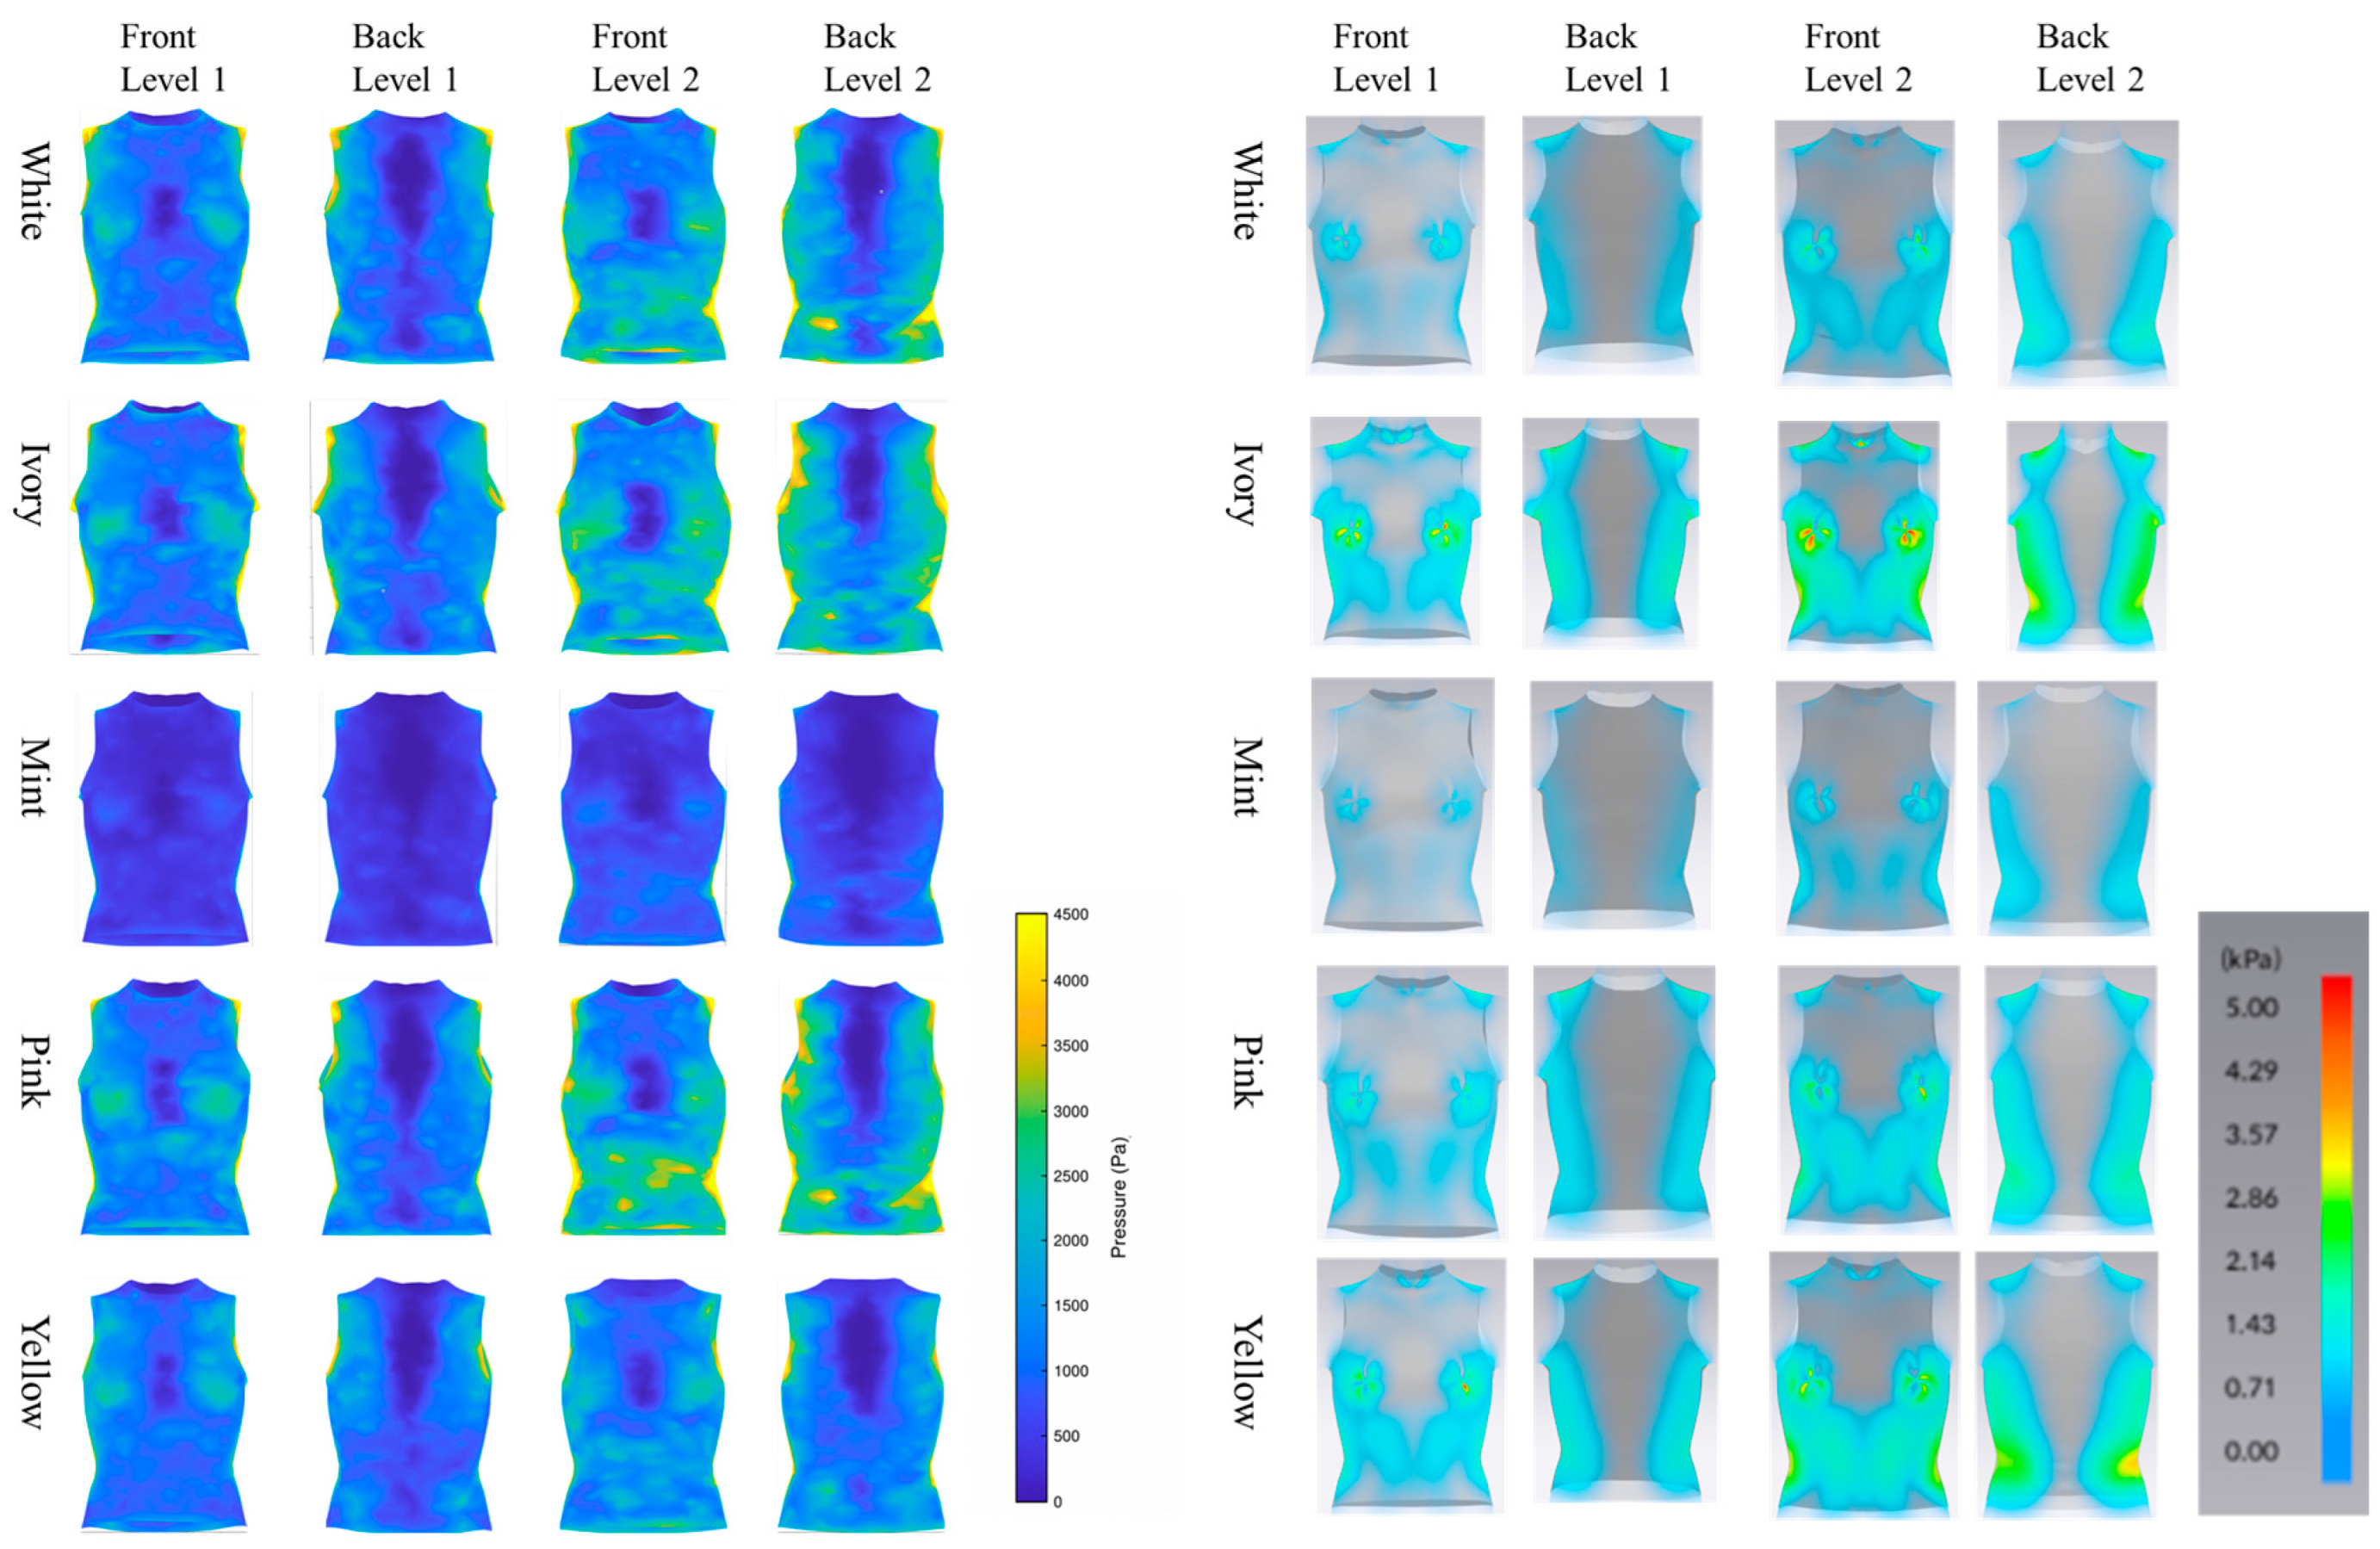
Figure 12 presents side-by-side comparisons of the native CLO 3D built-in pressure maps and the calibrated 3D pressure-distribution maps generated using the proposed method for the ten compression garments, comprising five fabric types and two pattern-reduction levels. The CLO 3D maps represent the native, uncalibrated pressure outputs of the commercial virtual-fitting system, whereas the proposed maps represent mesh-level pressure estimates obtained through body-normal vector projection and modulus-group-specific calibration. These paired maps enable a direct visual comparison of the spatial distributions produced by the two methods. The proposed maps provide a model-based representation of relative spatial pressure variation over the garment surface, complementing the discrete physical measurements obtained at five anatomical locations. Relatively high estimated-pressure regions were observed around the bust and lateral-abdominal areas, and these spatial tendencies were generally consistent with the measured-pressure patterns at the corresponding locations. In contrast, comparatively larger prediction errors were observed around the shoulder-blade region, suggesting that estimates near garment openings or regions with complex local curvature may be more sensitive to differences between the physical mannequin and the digital avatar, as well as to local garment–body contact conditions. Because physical pressure measurements were available at only five locations, however, differences between the two maps at unmeasured mesh locations were interpreted qualitatively, and the spatial accuracy of the continuous pressure distributions could not be independently verified. Therefore, the proposed 3D maps should be interpreted primarily as calibrated visualizations of spatial pressure-distribution patterns rather than as fully validated measurements of absolute pressure at every mesh location. To quantitatively benchmark the two methods under identical garment conditions, the native CLO 3D built-in pressure outputs and the calibrated predictions of the proposed method were compared with the corresponding physical pressure measurements at the same 50 garment–site observations. As shown in Table 9, the uncalibrated CLO 3D output yielded an R2 of 0.325, an RMSE of 0.722 kPa, and an MAE of 0.532 kPa. In comparison, the calibrated out-of-fold predictions of the proposed method achieved an R2 of 0.563, an RMSE of 0.587 kPa, and an MAE of 0.427 kPa. Relative to the native CLO 3D output, the proposed method reduced RMSE by 18.7% and MAE by 19.7%. These results indicate that the complete proposed framework provided closer agreement with the measured clothing-pressure values under the garment, fabric, and mannequin conditions examined in this study.
Figure 12.
Calibrated 3D pressure-distribution maps.
Table 9.
Benchmark comparison of the CLO 3D built-in pressure output and the proposed calibrated method against measured clothing pressure.
4.3. Contact-Distance Threshold Sensitivity Analysis
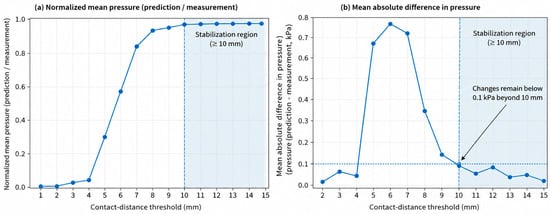
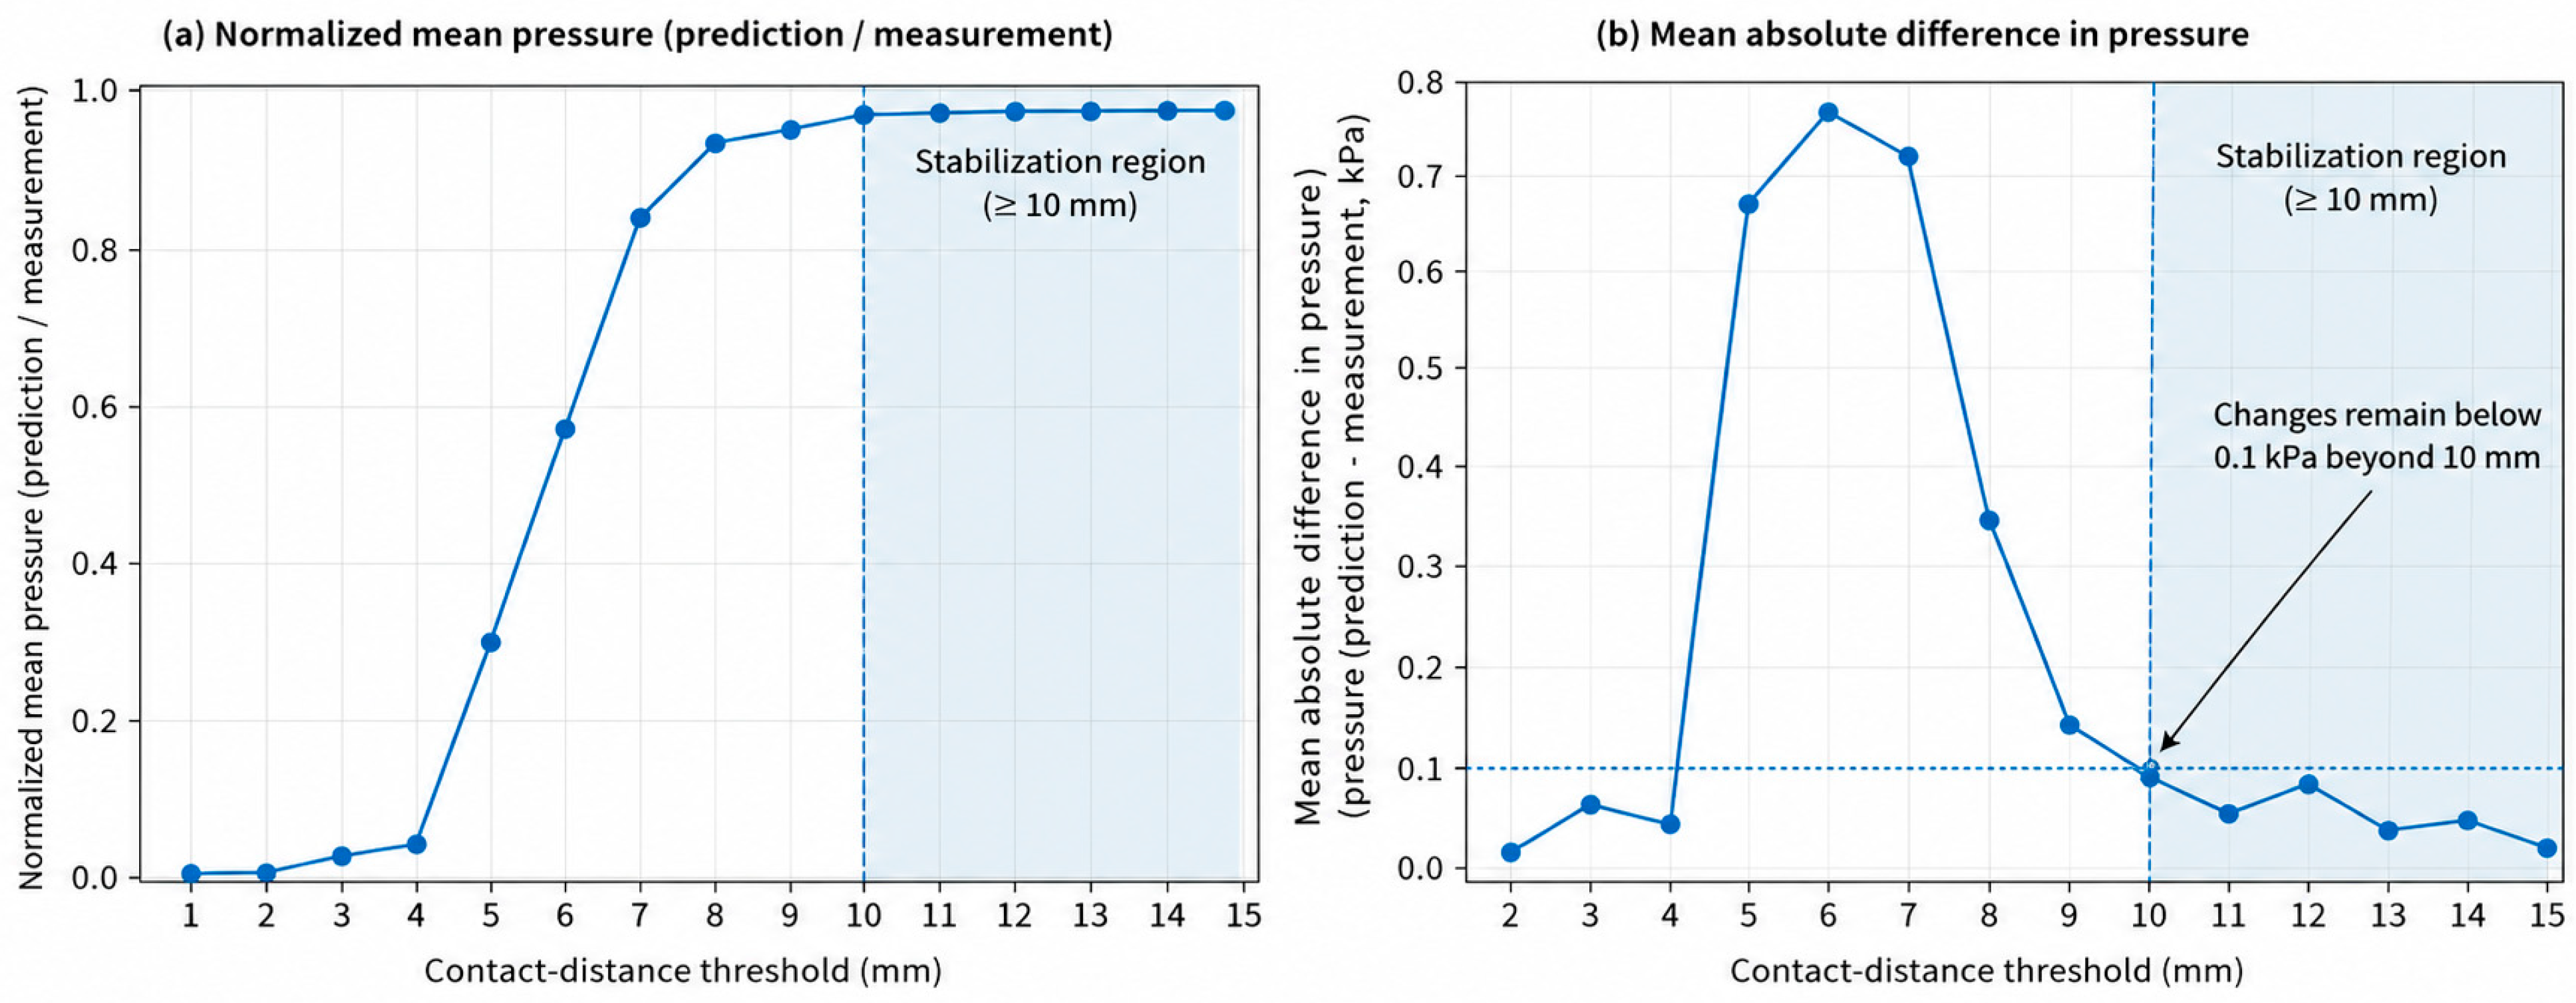
To characterize the effect of the contact-distance criterion in greater detail, the pressure-related values were recalculated using thresholds ranging from 1 to 15 mm in 1 mm increments. For each threshold, the mean pressure-related value was normalized by the corresponding mean value at 15 mm, The mean absolute change between adjacent thresholds was also calculated to evaluate the incremental sensitivity of the estimated values. As shown in Figure 13, the normalized mean value increased rapidly between 5 and 7 mm and began to approach a plateau at approximately 8 mm. At 8 mm, the normalized value reached 0.959; however, the mean absolute change from the preceding threshold remained relatively large at 0.316. The adjacent-threshold change decreased to 0.119 at 9 mm and to 0.069 at 10 mm. From 10 to 15 mm, the normalized mean values remained within approximately ±2% of the 15 mm reference, and all adjacent-threshold changes remained below 0.1, with values ranging from 0.003 to 0.072. Accordingly, 10 mm was defined as a conservative operational stabilization threshold rather than as the threshold producing the minimum calibration error. When this stabilization criterion was applied using only the training data in each outer cross-validation fold, 10 mm was identified. These findings indicate that the calculated pressure-related values became comparatively insensitive to further increases in the contact-distance threshold beyond 10 mm. Nevertheless, the 10 mm criterion should be interpreted as an empirically derived modeling parameter for the present garment, mesh, and avatar conditions rather than as a universally applicable or physically fixed contact distance.
Figure 13.
Sensitivity of calibration performance to different contact-distance thresholds.
5. Discussion
This study proposed a calibrated 3D vector-projection framework for estimating clothing-pressure distributions in digital compression garments. The primary contribution of this study is not the direct validation of the built-in pressure maps provided by a commercial virtual-fitting system but rather the use of digital garment deformation data as the basis for an independent pressure-estimation procedure. Within this framework, CLO 3D was used to generate the deformed garment mesh and avatar geometry, whereas pressure-related values were calculated separately by estimating internal forces from garment-mesh deformation and projecting these forces onto the body-normal direction. Accordingly, the proposed method should be interpreted as a calibrated pressure-estimation framework that converts mesh-based deformation information into pressure-related values rather than as a direct measurement of absolute clothing pressure.
The calibration results indicated that fabric stiffness influenced the relationship between the uncalibrated pressure-related values and measured clothing pressure. The low- and high-modulus fabric groups exhibited different regression relationships, suggesting that the conversion of mesh deformation into measured pressure depends partly on fabric mechanical behavior [2,4,21]. Separate linear calibration equations were therefore applied to fabrics with wale-direction Young’s modulus values below and above 1.0 MPa. However, the 1.0 MPa boundary was an empirical grouping criterion derived from the present fabric set, and the resulting equations should be interpreted as material-group-specific calibration functions rather than as universal correction equations for compression textiles. Under leave-one-garment-out cross-validation, the selected linear calibration model achieved an overall R2 of 0.563, an RMSE of 0.587 kPa, and an MAE of 0.427 kPa. These results indicate moderate predictive performance for garments excluded from model fitting within the experimental range examined in this study. Leave-one-fabric-out cross-validation produced an RMSE of 0.630 kPa and MAE of 0.464 kPa for the linear model; however, because only five fabrics were available, this analysis should be regarded as a sensitivity assessment rather than as independent external validation. Several observations in Figure 11 fell outside the 95% prediction intervals. Although the five fabrics were divided into two Young’s-modulus groups, each group still included fabrics with distinct mechanical characteristics; therefore, the pooled group-specific calibration may not fully capture fabric-specific pressure responses. These deviations may also partly reflect local body geometry and garment–body contact conditions, as discussed below. The observations were retained in the analysis and were interpreted as localized limitations of the calibration model rather than as erroneous data. To provide a direct benchmark, the proposed method was compared with the native CLO 3D built-in pressure output using the same garment–site observations. As shown in Table 9, the proposed method showed a higher R2 than the CLO 3D output (0.563 versus 0.325) and reduced RMSE and MAE by 18.7% and 19.7%, respectively. This improvement suggests that combining garment-mesh deformation, fabric mechanical properties, body-normal force projection, and measurement-based calibration can improve agreement with measured clothing pressure under the present experimental conditions. However, because the CLO 3D values were native, uncalibrated outputs whereas the proposed values were empirically calibrated and evaluated using leave-one-garment-out cross-validation, the comparison reflects the performance of the complete proposed framework rather than the isolated effect of vector projection. The R2 of 0.563 was lower than the R2 of 0.995 reported by Teyeme et al. [2] for a modified Laplace-law model tested using fabric tubes on a rigid cylindrical surface. This difference should be interpreted in light of the greater geometric and mechanical complexity of the complete 3D garment examined in the present study, including nonuniform body curvature, garment openings, local contact variation, multiple fabrics, and different pattern-reduction levels. In addition, the present performance was evaluated using out-of-fold predictions. Therefore, the two R2 values provide useful quantitative context but are not directly equivalent measures of model performance. Accordingly, the reported performance does not demonstrate generalizability to different garment categories, body geometries, postures, or material systems.
Beyond these point-based performance comparisons, the proposed method should not be interpreted as producing fully validated continuous measurements of absolute pressure over the entire garment surface. Physical pressure measurements were obtained at only five discrete anatomical locations, whereas the vector-projection procedure generated calibrated estimates at garment-mesh vertices. The resulting 3D maps therefore represent model-based spatial tendencies of relatively high and low pressure. Their principal value lies in supplementing point-based measurements with spatial information for comparing garment regions and design conditions, rather than replacing physical pressure measurements or establishing exact pressure at every mesh location. Site-specific performance varied across the measurement locations, indicating that local geometry and garment–body contact conditions affected agreement between calibrated estimates and measured pressure. Prediction performance tended to be lower at sites near garment openings or regions of complex local curvature, including the front-neck and shoulder-blade regions. Such discrepancies may result from garment slippage, friction, boundary effects during virtual garment settlement, and geometric differences between the physical mannequin and digital avatar. Previous studies have likewise reported location-dependent differences in pressure-prediction performance, particularly between regions with relatively stable contact and those involving complex anatomical or structural conditions [4,17]. Therefore, estimates near garment openings, highly curved regions, and areas of unstable contact should be interpreted cautiously.
The contact-distance analysis was interpreted as an assessment of numerical stabilization rather than as an optimization of calibration error or a determination of physical contact. The normalized mean pressure-related value approached a plateau as the threshold increased and remained within ±2% of the 15 mm reference from 10 to 15 mm. Over the same range, the mean absolute change between adjacent thresholds remained below 0.1. On this basis, 10 mm was selected as a conservative operational stabilization point under the present garment, mesh, and avatar conditions. This value should not be interpreted as a true physical contact distance or as a universally applicable threshold; additional validation across different mesh resolutions, body geometries, garment types, and simulation conditions is required.
From a design perspective, the proposed method can complement physical pressure measurements by providing model-estimated spatial pressure tendencies during the early stages of functional-garment development. Although physical sensors remain necessary for obtaining reliable local pressure measurements and for final product validation, the digital method enables comparative visualization of regions with relatively higher or lower estimated pressure before physical prototyping. This capability may be useful for comparing alternative fabrics, pattern-reduction levels, and design modifications under otherwise controlled conditions. Accordingly, the proposed method should be regarded as a design-support tool for comparative pressure-oriented evaluation rather than as a replacement for physical pressure measurement or as a fully validated predictor of absolute pressure over the entire garment surface.
Nevertheless, this study has several limitations. First, the calibration and internal cross-validation were based on pressure measurements obtained at only five discrete locations on a single rigid mannequin–avatar pair. Consequently, the measurements did not provide continuous validation of the pressure estimates over the entire garment surface. Second, this study was limited to one sleeveless compression-top design, one upright posture, five tricot fabrics, and two pattern-reduction levels. The applicability of the method to other garment categories, body shapes, postures, and human soft-tissue deformation therefore remains unverified. Third, the virtual avatar was not generated from a 3D scan of the physical mannequin, and correspondence between the two was assessed using major anthropometric dimensions rather than full surface-based geometric validation. Differences in local cross-sectional shape may therefore have contributed to prediction errors in regions of complex curvature. Fourth, the garment meshes were generated using a particle distance of 20 mm, which may have limited the representation of local curvature and pressure gradients, particularly near garment openings and highly curved body regions. Because mesh-resolution convergence was not evaluated, future studies should compare multiple particle-distance settings and assess their effects on predicted pressure distributions. The potential influence of the difference in mesh resolution between the garment and avatar was not independently evaluated and remains a limitation of the present study. Fifth, fabric behavior was represented using simplified mechanical parameters, and nonlinear and anisotropic responses, seam effects, friction, and local construction details were not fully modeled. Sixth, the 10 mm contact-distance criterion was identified as a numerical stabilization point under the present garment, mesh, and avatar conditions and should not be interpreted as a universally applicable physical contact threshold. In addition, independent replicate measurements sufficient to estimate confidence intervals or coefficients of variation for all fabric, pressure-sensor, and calculated quantities were not available. The benchmark comparison was limited to the native, uncalibrated CLO 3D pressure output and did not include other digital pressure-estimation frameworks under identical conditions. Computation time, hardware requirements, and operator effort were also not recorded using a standardized protocol. Future studies should incorporate 3D surface-deviation analysis, repeated specimen-level testing, instrument-level uncertainty assessment, broader method comparisons, and standardized evaluations of computational efficiency and user effort.
6. Conclusions
This study developed a calibrated 3D vector-projection method for estimating clothing pressure from digital garment-mesh deformation. The method combined mesh-edge strain, fabric mechanical properties, internal-force estimation, body-normal projection, and empirical calibration using physical pressure measurements. Under leave-one-garment-out cross-validation, the selected linear model achieved an overall of 0.563, an RMSE of 0.587 kPa, and an MAE of 0.427 kPa. Differences between the low- and high-modulus groups further indicated that fabric stiffness affects the relationship between digital garment deformation and measured clothing pressure.
Prediction performance varied across anatomical locations, suggesting sensitivity to local geometry, garment openings, contact stability, and differences between the physical mannequin and digital avatar. The 10 mm contact-distance criterion was identified as a conservative numerical stabilization point under the present garment, mesh, and avatar conditions, rather than as a universal physical contact distance.
The resulting 3D maps provide model-based visualizations of relative spatial pressure tendencies that can complement point-based physical measurements. However, the findings are limited to one rigid mannequin–avatar pair, one sleeveless compression-top design, five tricot fabrics, two pattern-reduction levels, and five measurement locations. Further validation using broader garment types, body geometries, material conditions, and independent datasets is required to establish the robustness and generalizability of the method.
Supplementary Materials
The following supporting information can be downloaded at: https://www.mdpi.com/article/10.3390/textiles6030091/s1. Table S1: Fabric-specific regression coefficients and goodness-of-fit statistics for the relationships between measured clothing pressure and estimated relative pressure; Table S2: Complete edge- and face-level calculations for the one-ring neighborhood of vertex 409 in the White garment with a 20% pattern reduction; Table S3: Complete site-level predicted and measured data; Table S4: CLO 3D clothing-pressure values.
Author Contributions
Conceptualization, S.J. and H.L.; methodology, H.L.; software, S.J.; validation, S.J. and H.L.; formal analysis, H.L.; investigation, H.L.; resources, H.L.; data curation, S.J.; writing—original draft preparation, H.L.; writing—review and editing, H.L.; visualization, S.J.; supervision, H.L.; project administration, H.L.; funding acquisition, H.L. All authors have read and agreed to the published version of the manuscript.
Funding
This work was supported by the National Research Foundation of Korea (NRF) grant funded by the Korea government (MSIT) (IRIS No. RS-2025-00558547) and by a research grant from Kongju National University in 2026.
Data Availability Statement
The raw data supporting the conclusions of this article will be made available by the authors on request.
Conflicts of Interest
The authors declare no conflicts of interest.
Abbreviations
The following abbreviations are used in this manuscript:
| 3D | Three-dimensional |
| AV | Avatar mesh |
| CAD | Computer-aided design |
| CLO 3D | CLO 3D virtual-fitting software (CLO Virtual Fashion) |
| FEM | Finite element method |
| FG | Flat garment mesh |
| kPa | Kilopascal |
| MAE | Mean absolute error |
| OBJ | Wavefront OBJ (3D geometry file format) |
| PE | Polyethylene |
| PU | Polyurethane |
| R2 | Coefficient of determination |
| RMSE | Root mean square error |
| DG | Deformed garment mesh |
References
- Sang, J.S.; Lee, M.S.; Park, M.J. Structural effect of polyester SCY knitted fabric on fabric size, stretch properties, and clothing pressure. Fash. Text. 2015, 2, 22. [Google Scholar] [CrossRef] [Scilit]
- Teyeme, Y.; Malengier, B.; Tesfaye, T.; Vasile, S.; Endalew, W.; Van Langenhove, L. Predicting compression pressure of knitted fabric using a modified Laplace’s law. Materials 2021, 14, 4461. [Google Scholar] [CrossRef] [Scilit] [PubMed]
- Teyeme, Y.; Malengier, B.; Tesfaye, T.; Vasile, S.; Van Langenhove, L. Fit and pressure comfort evaluation on a virtual prototype of a tight-fit cycling shirt. AUTEX Res. J. 2023, 23, 153–163. [Google Scholar] [CrossRef] [Scilit]
- Cheng, Z.; Wu, X.; Kuzmichev, V. Research on the accuracy of clothing simulation development: The influence of human body part characteristics on virtual indicators. Appl. Sci. 2023, 13, 12257. [Google Scholar] [CrossRef] [Scilit]
- Franke, T.P.; Hofstede, H.; Van den Broek, A.G.; Huisstede, B.M. The effects of lower leg compression garments on lower extremity sports injuries, subjective fatigue, and biomechanical variables: A systematic review with meta-analysis. Int. J. Exerc. Sci. 2024, 17, 445–467. [Google Scholar] [CrossRef] [Scilit] [PubMed]
- Kim, N.Y.; Lee, H. Influence of clothing pressure on blood flow and subjective sensibility of commercial sports compression wear. Fash. Text. Res. J. 2019, 21, 459–467. [Google Scholar] [CrossRef] [Scilit]
- Lee, H.; Kim, R.-K.; Chae, W.-S.; Kang, N. Compression sportswear improves speed, endurance, and functional motor performances: A meta-analysis. Appl. Sci. 2023, 13, 13198. [Google Scholar] [CrossRef] [Scilit]
- Lee, Y.G.; Shin, S.H. Effect of the pressure intensity of compression wear on kinematic variables in running. Korean J. Sports Sci. 2020, 29, 919–927. [Google Scholar] [CrossRef] [Scilit]
- MacRae, B.A.; Cotter, J.D.; Laing, R.M. Compression garments and exercise: Garment considerations, physiology and performance. Sports Med. 2011, 41, 815–843. [Google Scholar] [CrossRef] [Scilit] [PubMed]
- Mitsuno, T.; Kai, A. Distribution of the preferred clothing pressure over the whole body. Text. Res. J. 2019, 89, 2187–2198. [Google Scholar]
- Salleh, M.N.B.; Acar, M.; Burns, N.D. Customised pressure garment development by using 3D scanned body image. Res. J. Text. Appar. 2011, 15, 9–18. [Google Scholar] [CrossRef] [Scilit]
- Lee, Y.; Hong, K. Development of indirect method for clothing pressure measurement using three-dimensional imaging. Text. Res. J. 2013, 83, 1594–1605. [Google Scholar] [CrossRef] [Scilit]
- Kuzmichev, V.E.; Tislenko, I.V.; Adolphe, D.C. Virtual design of knitted compression garments based on bodyscanning technology and the three-dimensional-to-two-dimensional approach. Text. Res. J. 2019, 89, 2456–2475. [Google Scholar] [CrossRef] [Scilit]
- Kirk, W., Jr.; Ibrahim, S.M. Fundamental relationship of fabric extensibility to pressure. Text. Res. J. 1966, 36, 37–40. [Google Scholar] [CrossRef] [Scilit]
- Macintyre, L.; Baird, M. Pressure garments for use in the treatment of hypertrophic scars—A review of the problems associated with their use. Burns 2006, 32, 10–15. [Google Scholar] [CrossRef] [Scilit] [PubMed]
- Leung, W.Y.; Yuen, D.W.; Ng, S.P.; Shi, S.-Q. Pressure prediction model for compression garment design. J. Burn Care Res. 2010, 31, 716–727. [Google Scholar] [CrossRef] [Scilit] [PubMed]
- Ishimaru, S.; Isogai, Y.; Matsui, M.; Furuichi, K.; Nonomura, C.; Yokoyama, A. Prediction method for clothing pressure distribution by the numerical approach: Attention to deformation by the extension of knitted fabric. Text. Res. J. 2011, 81, 1851–1870. [Google Scholar] [CrossRef] [Scilit]
- Wang, Y.; Liu, Z. Virtual clothing display platform based on CLO3D and evaluation of fit. J. Fiber Bioeng. Inform. 2020, 13, 37–49. [Google Scholar] [CrossRef] [Scilit]
- Wu, Y.; Liu, H.; Lu, P.; Zhang, L.; Yuan, F. Design and implementation of virtual fitting system based on gesture recognition and clothing transfer algorithm. Sci. Rep. 2022, 12, 18356. [Google Scholar] [CrossRef] [Scilit] [PubMed]
- Brubacher, K.; Tyler, D.; Apeagyei, P.; Venkatraman, P.; Brownridge, A.M. Evaluation of the accuracy and practicability of predicting compression garment pressure using virtual fit technology. Cloth. Text. Res. J. 2023, 41, 107–124. [Google Scholar]
- Kim, N.; Lee, H. Exploring variables affecting the clothing pressure of compression garments: A comparison of actual garments and virtual garments. J. Korean Soc. Cloth. Text. 2023, 47, 1080–1095. [Google Scholar]
- Hu, P.; Ho, E.S.; Aslam, N.; Komura, T.; Shum, H.P. A new method to evaluate the dynamic air gap thickness and garment sliding of virtual clothes during walking. Text. Res. J. 2019, 89, 4148–4161. [Google Scholar] [CrossRef] [Scilit]
- Cole, J. Patternmaking with Stretch Knit Fabrics; Bloomsbury Publishing: New York, NY, USA, 2016. [Google Scholar]
- Jeong, Y.H. Fundamental relationship between reduction rates of stretch fabrics and clothing pressure. Korean J. Hum. Ecol. 2008, 17, 963–973. [Google Scholar] [CrossRef] [Scilit]
- Kim, S.; Lee, S.; Jeong, W. EMG measurement with textile-based electrodes in different electrode sizes and clothing pressures for smart clothing design optimization. Polymers 2020, 12, 2406. [Google Scholar] [CrossRef] [Scilit] [PubMed]
- KS K 0512:2017; Test Method for Determination of Number of Wales and Courses per Unit Length in Knitted Fabrics. Korean Standards Association: Seoul, Republic of Korea, 2017.
- ASTM D2594-04; Standard Test Method for Stretch Properties of Knitted Fabrics Having Low Power. ASTM International: West Conshohocken, PA, USA, 2004.
- Lee, J.; Do, W. Clothing pressure analysis of commercial women’s leggings for applying medical compression classes. Fash. Text. 2023, 10, 8. [Google Scholar] [CrossRef] [Scilit]
- Lee, O.; Lee, Y. Nonlinear compression responses reveal limits of elongation-based design in knitted compression sleeves. Sci. Rep. 2026. [Google Scholar] [CrossRef] [Scilit] [PubMed]
- Kim, N.Y.; Lee, H. Designing differential pressure leggings for late middle-age women using 3D technology: Identifying optimal muscle-support levels via electromyography. J. Eng. Fibers Fabr. 2025, 20, 15589250251352022. [Google Scholar] [CrossRef] [Scilit]
- Liu, K.; Wang, J.; Zhu, C.; Hong, Y. Development of upper cycling clothes using 3D-to-2D flattening technology and evaluation of dynamic wear comfort from the aspect of clothing pressure. Int. J. Cloth. Sci. Technol. 2016, 28, 736–749. [Google Scholar] [CrossRef] [Scilit]
- Chicco, D.; Warrens, M.J.; Jurman, G. The coefficient of determination R-squared is more informative than SMAPE, MAE, MAPE, MSE and RMSE in regression analysis evaluation. PeerJ Comput. Sci. 2021, 7, e623. [Google Scholar] [CrossRef] [Scilit] [PubMed]

Disclaimer/Publisher’s Note: The statements, opinions and data contained in all publications are solely those of the individual author(s) and contributor(s) and not of MDPI and/or the editor(s). MDPI and/or the editor(s) disclaim responsibility for any injury to people or property resulting from any ideas, methods, instructions or products referred to in the content. |
© 2026 by the authors. Licensee MDPI, Basel, Switzerland. This article is an open access article distributed under the terms and conditions of the Creative Commons Attribution (CC BY) license.