


Abstract
Developing sustainable strategies for natural resource management and conservation under shifting climatic scenarios is increasingly necessary due to exacerbated abiotic stresses, such as salinity. Under salt stress, several negative effects are observed in plants, particularly in leafy vegetables such as lettuce (Lactuca sativa L.). To mitigate the effects of saline stress from brackish water, several strategies have been adopted, including hydroponic cultivation. Therefore, this study aimed to determine the effects of variations in nutrient solution concentration and volume per lettuce plant cultivated in a nutrient film technique (NFT) hydroponic system using brackish water. The experiment was conducted using a randomized complete block design in a 2 × 2 × 2 factorial scheme, combining two levels of water electrical conductivity (ECw of 0.3 and 5.0 dS m−1), two nutrient solution concentrations (NSC of 50 and 100%), and two nutrient solution volumes (NSV of 1 and 2 L plant−1), with four replications. Growth, production, and water productivity variables were evaluated at 20 and 25 days following the imposition of treatments. The responses of the variables to saline stress varied according to the evaluation period (20 and 25 days), depending on the NSC and NSV levels. At the end of the 25-day cycle, it can be concluded that for lettuce cultivation using brackish water, the NSC can be reduced to 50% and provide an NSV of 2 L plant−1. Under these growing conditions, leaf fresh matter production loss was approximately 40% lower than under cultivation without saline stress, which yielded 144.11 g plant−1 under 100% NSC and an NSV of 2 L plant−1. In contrast, water productivity of fresh matter was similar, at 78.68 and 76.55 g L−1, respectively.
1. Introduction
Climate change has become one of the most pressing and growing global issues due to its negative consequences on biodiversity and ecosystems [1]. Therefore, developing sustainable strategies for natural resource management and conservation under shifting climatic scenarios is increasingly necessary because unsustainable water and soil management are exacerbating the pressures on agricultural systems [2]. Soil productivity is declining due to increasing salinity, particularly in arid and semi-arid regions [3,4,5,6]. Additionally, the scarcity of freshwater in these regions has led to the use of low-quality water sources, such as brackish water [7,8,9,10]. The situation is no different in the Brazilian semiarid region, where saline groundwater is commonly used for irrigation to meet the water demand of crops due to the scarcity of good-quality water [11,12,13,14,15,16,17,18].
Irrigation with saline water demands careful management to avoid exacerbating stress on the soil–plant system [19]. The adverse effects of salt stress on plants can be manifested in different ways, from phenotypic alterations to genetic changes [20,21]. Salinity affects plants by inducing both osmotic stress and ionic toxicity, which together inhibit key enzymes, restrict carbon dioxide uptake via stomatal closure, and impair cell division and elongation, ultimately causing decreased biomass [20,22,23]. Stomatal closure results in the generation of reactive oxygen species (ROS), which are highly harmful to cells at high concentrations by causing damage to important cellular structures such as proteins, lipids, and nucleic acids [23,24,25,26,27]. Osmotically, high salt concentrations in the root zone reduce water potential, thereby impairing root uptake of water and mineral ions. Ionically, the excessive accumulation of toxic ions such as sodium (Na+) and chloride (Cl−) within plant cells [28,29]. To mitigate the deleterious impacts of salt stress, plants maintain intracellular ion homeostasis by controlling ion influx and its compartmentalization. Plants protect themselves by restricting the Na+ influx into the cell, enhancing Na+ exclusion out of the cell, and maximizing the compartmentalization of Na+ into the vacuole [30,31].
Plant responses to salt stress depend of various factors, including: growing conditions (open field and/or protected environment) [32], salt concentration/salt source or electrical conductivity level of the irrigation water (ECw) [33,34,35,36,37,38,39,40,41,42,43,44,45,46,47], water source (groundwater or artificially produced with salts of different cationic compositions) [48,49], plant material [34,45,50,51,52,53,54,55,56], exposure duration to salts [57,58], growing season [53,55,59,60,61,62,63], and cropping systems [47,64], among others. Regarding cropping systems, soilless cultivation techniques (hydroponics) have proven suitable for using brackish water as a strategy to mitigate the effects of salinity on plants, particularly for leafy vegetables such as lettuce (Lactuca sativa L.). A member of the Asteraceae family, lettuce is cultivated globally [65,66,67], including in Brazil [68,69,70,71], and is valued for its rapid growth and nutritional attributes. Therefore, the present study focused on lettuce using brackish water.
Lettuce tolerance to salinity ranges from sensitive to moderate when grown in a conventional system [34,72,73]. However, under hydroponic conditions, it demonstrates greater tolerance to saline stress. This is because the direct cultivation of plants in nutrient solution eliminates the matric potential, thereby increasing the free energy of water and facilitating its uptake [74,75,76]. Despite this improved lettuce response to saline stress under hydroponic conditions, several factors contribute to this tolerance. These factors are related to nutrient solution management, including nutrient concentration according to the formulation used, solution volume to the plants, and maintenance of the solution volume in the reservoir.
First, the method of preparing saline nutrient solutions must be considered, as there are two approaches. The first involves preparing the nutrient solution directly in brackish water (e.g., artificially prepared with sodium chloride–NaCl), thereby simulating real field conditions in which this water is used directly for cultivation [56,77,78,79,80,81,82,83,84]. The second approach, adopted by another group of researchers, consists of starting with a standard nutrient solution and adding salts such as NaCl to achieve the desired electrical conductivity (EC) levels [85,86,87]. In this sense, the first group considers the ECw as the treatment, while the second group focuses on the EC levels of the nutrient solution (ECsol). Therefore, when evaluating salinity tolerance, it is essential to know the salt concentration in the nutrient solution, as the same EC level does not necessarily correspond to the same salinity level across different methodologies.
This issue is particularly relevant when nutrient salts are added to brackish water during solution preparation, as this further reduces the osmotic potential (making it more negative), restricting water uptake by plants and impairing their development [88,89]. In the literature, several studies with lettuce can be found testing different ECsol levels, namely 2.5 and 3.5 dS m−1 [53]; 0.8, 1.3, 1.8, and 2.3 dS m−1 [68]; 0.5, 1.0, 2.0, and 4.0 dS m−1 [90]; 2.0, 2.5, and 3.0 dS m−1 [91]; 1.0, 2.0, and 3.0 dS m−1 [92]; 1.0, 2.0, and 4.0 dS m−1 [93]; 1.4, 1.6, 1.8, and 2.0 dS m−1 [94]; 0.5, 0.7, 0.9, 1.2, and 2.0 dS m−1 [95]; 1.6 and 2.9 dS m−1 [96]; 1.2 and 1.6 dS m−1 [97]; 1.5 and 2.5 dS m−1 [98]; 0.9, 1.7, 2.0, and 2.1 dS m−1 [99]; 1.27, 1.62, and 1.97 dS m−1 [100]; and 0.6, 1.5, 2.5, and 3.5 dS m−1 [101]. This extensive survey was carried out to discuss the gaps in lettuce responses to different ECsol levels. In these studies, the salinity effect is limited only to the osmotic effect caused by nutrient salts. When brackish water is used, the scenario becomes more complex because, in addition to the osmotic effect, plants are exposed to ionic toxicity (primarily Na+ and Cl−) and potential nutrient imbalances. Therefore, the simultaneous regulation of nutrient concentration and solution volume becomes even more critical when this type of water is used, as it helps dilute toxic ions while maintaining adequate nutrient availability—a challenge that cannot be addressed by simply adjusting ECsol levels in standard hydroponic solutions.
While several studies under hydroponic conditions have explored the use of different attenuators as strategies to mitigate saline stress in lettuce, such as iodine [40], amino acid, fulvic acid, and chitosan [102] via nutrient solution, as well as nitric oxide [42,43,103], chitosan [46], and amino acids (histidine, lysine, phenylalanine, and threonine) [104] and (alanine, arginine, glutamine, glycine, methionine, and proline) [105] by foliar application, we hypothesize that simultaneous regulation of nutrient concentration and solution volume may mitigate stress in plants grown hydroponically with brackish water.
Therefore, our study presents a promising line of research for alleviating saline stress caused by brackish water through the simultaneous regulation of nutrient concentration and solution volume. This interaction becomes even more relevant in hydroponic cultivation under hot climate conditions. That is because, throughout the day, plants naturally consume water and nutrients. In the absence of automatic water replenishment, the solution becomes concentrated, leading to a decrease in osmotic potential (i.e., a more negative value). In addition to this, the volume of solution available per plant also affects the consumption rate. These nutrient solution management practices also impact the process by heating the solution, which exacerbates the negative effects of saline stress [56,76] because increased solution temperature reduces dissolved oxygen concentration, which can further impair plant growth [106,107,108,109]. The volume of solution per plant is crucial, as temperature changes exacerbate the buffering capacity of the nutrient solution, which can result in rapid pH fluctuations [110,111]. In a small-volume solution, root-induced unbalanced ion absorption causes drastic pH shifts that rapidly alter nutrient solubility and availability [112]. This scenario becomes critical under brackish water cultivation, where high concentrations of Na+ already induce antagonistic interactions with essential nutrients such as potassium (K+), calcium (Ca2+), and magnesium (Mg2+). This imbalance may be due to both the impairment of the water absorption process (which leads to reduced nutrient uptake) and the competitive absorption of ions [113,114].
Therefore, maintaining an adequate solution volume helps buffer pH stability, mitigating nutrient antagonisms and ensuring a more balanced ion supply under saline conditions. In studies involving brackish water for lettuce cultivation, solution volume values vary considerably. For instance, values of 8.33 L plant−1 have been reported in a nutrient film technique (NFT) system [56,64,85]; 2.25 and 3.33 L plant−1 in NFT and floating systems, respectively [78]; 2.40 L plant−1 in deep flow technique (DFT) and NFT systems [80]; and 12.00 L plant−1 in a floating system [115]. Thus, an adequate solution volume helps buffer both thermal fluctuations and nutrient imbalances, mitigating the effects of saline stress. Although using larger volumes increases the buffering capacity of the nutrient solution, a drawback is the increased cost of preparing the nutrient solution. Additionally, it generates more waste solution, which generally contains high salt levels due to the use of brackish water.
Based on these factors, the present study aimed to determine the effects of variations in nutrient solution concentration and volume per lettuce plant cultivated in an NFT hydroponic system using brackish water.
2. Materials and Methods
2.1. Study Site, Plant Material, Experimental Design, and Growth Conditions
An experiment was conducted under hydroponic conditions in a greenhouse (east–west orientation and operating under uncontrolled conditions with natural sunlight) from April to May (autumn) 2025, using lettuce ‘Jade’ (Lactuca sativa L.) (Sakata Seed Sudamerica Ltda., Bragança Paulista, SP, Brazil). The greenhouse is located within the experimental area of the Postgraduate Program in Agricultural Engineering of the Federal University of Recôncavo da Bahia (UFRB), Cruz das Almas-BA (12°40′19″ S, 39°06′23″ W, at an elevation of 220 m a.s.l), Brazil. The greenhouse (7.0 m wide and 24 m long) was protected on the sides by black screens with 70% shading, and the roof was covered with 150 μm thick polyethylene transparent film. A reflective aluminized screen was installed at a ceiling height of 2.5 m.
To monitor environmental conditions, BH1750FVI (illuminance) and DHT11 (air temperature and relative humidity) sensors were positioned 2.0 m above ground level at the center of the greenhouse to measure. These sensors were connected to an Arduino Uno board equipped with a data logging shield integrating a real-time clock for tracking date, time, and calendar data. The recorded data were stored on a memory card, with means logged every minute. Each plastic tank was equipped with an encapsulated DS18B20 digital temperature sensor to continuously monitor the solution temperature. All sensors were connected to a single Arduino Uno. All components were obtained from a Brazilian company (Usina Ind. Comércio e Importação, Santo Ângelo, RS, Brazil). During the experimental period, daily air temperatures ranged from a minimum of 20.76 °C to a maximum of 25.08 °C, with a mean of 23.56 ± 0.96 °C. Relative humidity values varied between 81.97 and 95.37%, with a mean of 88.30 ± 3.83%. The maximum illuminance values occurred from 10:00 a.m. to 1:00 p.m., ranging from 13,090.32 ± 1822.16 to 15,728.05 ± 4256.96 lux, whereas the minimum values occurred in the early morning (5:00–6:00 a.m., 79.10 ± 24.10 lux) and late afternoon (5:00–6:00 p.m., 116.55 ± 25.91 lux).
The experiment was conducted using a randomized complete block design in a 2 × 2 × 2 factorial scheme, combining two levels of water electrical conductivity (ECw of 0.3 and 5.0 dS m−1), two nutrient solution concentrations (NSC of 50 and 100% of the standard formulation), and two nutrient solution volumes (NSV of 1 and 2 L plant−1), with four replications. Each replication consisted of a hydroponic channel that supported 20 plants. Due to the capacity of the experimental setup and the need to support the three evaluated factors, it was only possible to simultaneously analyze two levels per factor. The macronutrient formulation followed the recommendation of Furlani et al. [116] for leafy vegetables, consisting of calcium nitrate YaraTera™ Calcinit™ [Ca(NO3)2: 14.4% nitrate—NO3−; 1.1% ammonium—NH4+; and 19.0% calcium—Ca] (Yara Brazil S.A, Porto Alegre, RS, Brazil), potassium nitrate Dripsol® NKS [KNO3: 12.0% NO3− and 45.0% potassium oxide—K2O], Dripsol® MAP—monoammonium phosphate (12.0% NH4+ and 61.0% phosphorus pentoxide—P2O5) (Vitas Brazil, Candeias, BA, Brazil), and magnesium sulfate [MgSO4: 9.0% magnesium—Mg and 11.0% sulfur—S] (Sais Nordeste Ind. e Com. Ltda., Feira de Santana, BA, Brazil). Micronutrients were supplied using Micromix® and GeoQuel® 13% Fe-EDTA (Rigrantec Tecnologias para Sementes e Plantas Ltda., Porto Alegre, RS, Brazil) (Table 1).
Table 1.
Description of treatments (water electrical conductivity—ECw, nutrient solution concentration—NSC, and nutrient solution volume—NSV), nutrient solution formulation, initial solution electrical conductivity (ECsol), and nutrient solution temperatures (Tsol).
The lettuce plants were cultivated in a nutrient film technique (NFT) hydroponic system consisting of 6 m long channels constructed from 0.075 m diameter irrigation PVC tubes (Figure 1a). Four hydroponic channels were arranged per bench with a 5.0% slope, maintaining a 0.25 m × 0.30 m distance between plants and channels, respectively, corresponding to a density of 13 plants m−2. Each channel supported 20 plants. For the treatments with NSV of 1 and 2 L plant−1, the nutrient solution was stored in 100 and 500 L plastic tanks, respectively, each equipped with a float valve that maintained a constant volume of 80 and 160 L, respectively. For this purpose, the float valve was connected to an automatic supply system constructed from a 0.15 m diameter PVC tube. This system allowed automatic water delivery to the nutrient solution tank and automatic replenishment of water consumed by the plants. A graduated scale attached to a transparent hose was used for daily readings to calculate water consumption. Each plastic tank was equipped with a 34 W washing machine electric drain pump to inject the mixture into the four hydroponic channels.
Figure 1.
Overview of lettuce plants (a) and seedlings on the day of transplanting for the hydroponic system (b).
2.2. Crop and Nutrient Solution Management
Lettuce seeds were sown on 28 April 2025, in phenolic foam with cells of 2 × 2 × 2 cm (Mizu Indústria e Comércio de Produtos Ornamentais e Agrícolas, Holambra, SP, Brazil), with one seed per cell. Four days after sowing (DAS), these seedlings were taken to a nursery (NFT system) built with a PVC corrugated roof sheet. For 16 days, they received a nutrient solution at 50% concentration, prepared according to the formulation of Furlani et al. [116] using low-salinity water (electrical conductivity of the solution—ECsol ~ 1.0 dS m−1). An analog timer controlled nutrient solution circulation in the nursery, programmed at alternate intervals of 15 min (turned on for 15 min and off for 15 min), from 6:00 a.m. to 6:00 p.m. From 6:00 p.m. to 6:00 a.m., the nutrient solution was recirculated once every two hours for 15 min. Next, the seedlings were transplanted into the final cultivation system to start the treatments (Figure 1b), with 20 seedlings in each hydroponic channel. The programming to control nutrient solution circulation in the cultivation channels of the final cultivation system was similar to that used in the nursery.
The 5.0 dS m−1 ECw treatment was established based on Costa et al. [78], who reported that this level maintained 50% relative shoot fresh matter yield in ‘Jade’ lettuce compared to non-saline conditions grown in an NFT system. Based on this productivity, lettuce was classified as moderately tolerant to salinity. This ECw level was obtained by diluting sodium chloride (NaCl) in public-supply water (ECw of 0.3 dS m−1). For this purpose, the salt quantity (in g L−1) was calculated using the expression from Silva et al. [117]: {QNaCl = [58.44 × (ECw − ECwps)]/100}, where 58.44 is the molar mass of NaCl (in g mol−1), ECw is the desired value for the electrical conductivity of water (in dS m−1), and ECwps is the EC of public-supply water (in dS m−1). A concentration of 2.747 g L−1 NaCl was used to achieve an ECw level of 5.0 dS m−1. Subsequently, fertilizer salts were added to these waters (0.3 or 5.0 dS m−1) following the nutrient solution formulation of Furlani et al. [116] at the evaluated concentrations of 50 and 100%. The same water used to prepare the nutrient solutions was used to replenish the plants’ water consumption.
2.3. Measurements of ECsol and Dissolved Oxygen (DO) Concentrations in Nutrient Solution
ECsol values were measured every five days. For this purpose, solution samples were collected, and ECsol was determined using a benchtop conductivity meter model W12D (Bel® Equipamentos Analíticos Ltda., Piracicaba, SP, Brazil). Simultaneously, DO concentrations in the nutrient solution (in mg L−1) were measured directly in the reservoirs between 8:00 and 9:00 a.m. using a HI 98193 oximeter (Hanna Instruments Inc., Woonsocket, RI, USA).
2.4. Measurements in Lettuce Plants
At 20 and 25 days after transplanting (DAT), two plants per hydroponic channel were evaluated. Plants were separated into leaves and stems to obtain leaf fresh matter (LFM, in g plant−1) and stem fresh matter (SFM, in g plant−1). Stem diameter (SD, in mm), plant height (PH, in cm), and number of leaves (NL) were also evaluated. SD was measured using a digital caliper model LT-A509 (Lotus Comercial, Serra, ES, Brazil), whereas PH was measured using a graduated ruler. NL was obtained by counting only leaves whose blade length was ≥ 3 cm [78]. Immediately after weighing the plant parts, the material was placed in paper bags and dried in a Q314M forced-air oven (Quimis®, Diadema, SP, Brazil) at 65 °C until reaching constant weight to quantify the leaf dry matter (LDM, in g plant−1) and stem dry matter (SDM, in g plant−1). All plant parts were weighed using a precision analytical balance (0.01 g accuracy) (Bel® Equipamentos Analíticos Ltda., Piracicaba, SP, Brazil).
Leaf area (LA) was determined using the leaf disk method [118]. From one plant per plot (replication), ten leaf disks were collected. Each disk had a diameter of 9.5 mm, corresponding to an area of 0.6734 cm2. The disks were taken from the middle third of the leaf blade, avoiding both the central vein and the leaf margins. Therefore, LA was calculated based on the relationship between LDM of the disk (LDMD, in g) and LDM of the plant (in g): LA (cm2 plant−1) = [(LDM × 0.6734)/LDMD], where 0.6734 is the disk area (in cm2). LDMD was weighed using a precision analytical balance (0.0001 g accuracy) (Bel® Equipamentos Analíticos Ltda., Piracicaba, SP, Brazil).
Water content of leaf (WCL) was calculated using the LFM and LDM relationship: WCL (%) = [(LFM − LDM)/LFM] × 100, as described by Acikbas and Bulut [119].
2.5. Water Productivity of Lettuce Plants
Water productivity (WP, in g L−1) was calculated as the ratio between plant production (total matter as the sum of leaves and stems, based on both fresh and dry matter) and accumulated water consumption per plant in 20 and 25 days. Water consumption was calculated as the volume consumed from the reservoir divided by the number of plants. The nutrient solution reservoirs were covered; therefore, there were no losses due to evaporation. Thus, the volume consumed corresponded solely to plant transpiration.
2.6. Statistical Analysis
Data normality was evaluated using the Shapiro–Wilk test (p ≤ 0.05). Subsequently, analysis of variance was performed by the F-test (p ≤ 0.05). Mean separation for levels of water electrical conductivity, nutrient solution concentrations, and nutrient solution volumes was performed using Tukey’s test (p ≤ 0.05). The statistical analysis was performed with the SISVAR 5.6 statistical program [120]. Additionally, principal component analysis (PCA) was conducted with FactoMineR and factoextra packages to examine interrelationships among variables and factors, while Pearson’s correlation analysis was performed using the Hmisc and corrplot packages. These analyses were carried out in R statistical software (version 4.4.1) [121].
3. Results
Figure 2 shows the lettuce plants on the day of the final harvest. The overall quality of the plants is noteworthy, even under saline stress (water electrical conductivity—ECw of 5.0 dS m−1), despite the reduced plant size observed, particularly at 100% nutrient solution concentration (NSC). This effect will be addressed in the discussion.
Figure 2.
Visual appearance of lettuce plants under non-saline (water electrical conductivity—ECw of 0.3 dS m−1) and saline stress (ECw of 5.0 dS m−1) conditions, at nutrient solution volume (NSV) and nutrient solution concentration (NSC) of 50% (a) e 100% (b), in an NFT hydroponic system at 25 days after transplanting.
Overall, dissolved oxygen (DO) concentrations exhibited similar behavior under non-saline (Figure 3a) and saline stress (Figure 3b) cultivation conditions across evaluation periods, regardless of nutrient solution volume (NSV) and NSC. Under non-saline conditions (ECw of 0.3 dS m−1) at the end of the experiment (25 DAT), DO concentrations were 6.78 and 6.71 mg L−1 at 1 L plant−1 NSV under 50 and 100% NSC, respectively, and 6.84 and 7.07 mg L−1 at 2 L plant−1 NSV, respectively. Under saline stress, and following the same order of treatment combinations, DO concentrations were 6.60, 6.51, 6.71, and 6.59 mg L−1, respectively.
Figure 3.
Dissolved oxygen concentrations and electrical conductivity of nutrient solution under non-saline (water electrical conductivity—ECw of 0.3 dS m−1) ((a) and (c), respectively) and saline stress (ECw of 5.0 dS m−1) ((b) and (d), respectively) conditions as a function of the nutrient solution concentration (NSC) and nutrient solution volume (NSV), under lettuce cultivation at different evaluated periods.
Regarding ECsol levels during the experimental period under non-saline conditions, the values decreased compared to initial cultivation, more markedly at 100% NSC and 2 L plant−1 NSV, by approximately 61%. In the other combinations, the decreases were also pronounced, ranging from 52 to 54% (Figure 3c). Under saline conditions (Figure 3d), ECsol values increased due to replenishing plant consumption with the same brackish water used in preparing the nutrient solution. The greater increase occurred at lower NSC and NSV levels, by approximately 63%, whereas a smaller increase was registered at higher NSC and NSV levels, by approximately 25%.
Table 2 presents the traits evaluated in the experiment: plant height (PH), stem diameter (SD), number of leaves (NL), leaf area (LA), leaf fresh matter (LFM), stem fresh matter (SFM), leaf dry matter (LDM), stem dry matter (SDM), water content in leaf (WCL), and water productivity (WP) based on both fresh (WPFM) and dry matter (WPDM). Significant interactions among the three evaluated factors (ECw × NSC × NSV) were observed for PH, SFM, WCL, and WPDM at 20 DAT, and for SD, LFM, WPFM, and WPDM at 25 DAT. At 20 DAT, significant two-way interactions were detected for SD (ECw × NSC and ECw × NSV) and for LFM (ECw × NSC and NSC × NSV). For WPFM, all three pairwise combinations (ECw × NSC, ECw × NSV, and NSC × NSV) were significant. The isolated effect of ECw affected LA and LDM, while NL and SDM were influenced by the isolated effects of ECw and NSV. At 25 DAT, PH was significantly affected by all three pairwise interactions (ECw × NSC, ECw × NSV, and NSC × NSV), while SFM and WCL were significantly influenced by the ECw × NSC and ECw × NSV interactions. The ECw × NSC interaction significantly affected NL, LA, and LDM, while the NSC × NSV interaction significantly affected SDM. The isolated effect of NSV affected NL and LA, while SDM was influenced by the isolated effect of ECw.
Table 2.
Summary of F-test for plant height (PH), stem diameter (SD), number of leaves (NL), leaf area (LA), leaf fresh matter (LFM), stem fresh matter (SFM), leaf dry matter (LDM), stem dry matter (SDM), water content in leaf (WCL), and water productivity (WP) based on both fresh (WPFM) and dry matter (WPDM) of lettuce grown under levels of water electrical conductivity (ECw), nutrient solution concentration (NSC), and nutrient solution volume (NSV), at 20 and 25 days after transplanting (DAT).
In both evaluations (20 and 25 DAT, Figure 4a and Figure 4b, respectively), PH means were of the same magnitude. At 20 DAT, analysis of the ECw × NSC × NSV interaction showed that PH means were significantly higher under non-saline conditions than under saline stress across all NSC and NSV levels. Analysis of NSV levels within ECw × NSC combination revealed that, at 2 L plant−1 NSV, the higher PH occurred under non-saline conditions within 50% NSC, whereas the opposite behavior was observed at 100% NSC—that is, the mean was higher at 1 L plant−1 NSV. Similarly, the same behavior was observed under saline stress. Analysis of NSC levels within ECw × NSV combination showed that, at 100% NSC, a higher PH mean was obtained under non-saline conditions within 1 L plant−1 NSV, whereas under saline stress, a higher mean was obtained at 50% NSC within 2 L plant−1 NSV. In the other combinations, the means did not differ statistically across NSC levels. At 25 DAT, analysis of the ECw × NSC and ECw × NSV interactions also showed that PH means were significantly higher under non-saline conditions than under saline stress across all NSC and NSV levels. Analysis of NSC levels within each ECw level showed that, at 100% NSC, the higher PH was obtained under non-saline conditions. In contrast, under saline stress, the means were statistically equal across NSC levels. Analysis of NSV levels within each ECw showed that, at 2 L plant−1 NSV, the higher PH means were obtained for both non-saline and saline stress conditions.
Figure 4.
Follow-up analyses of the interaction between levels of water electrical conductivity (ECw), nutrient solution concentration (NSC), and nutrient solution volume (NSV) on plant height (PH) (a) and stem diameter (SD) (d) of lettuce grown in an NFT hydroponic system; follow-up analyses of the ECw × NSC and ECw × NSV interactions on PH (b) and SD (c); isolated effects of ECw and NSV and follow-up analyses of the ECw × NSC interaction on number of leaves (NL) (e) and leaf area (LA) (f). In (a,d), uppercase letters compare ECw levels within each combination of NSC and NSV, lowercase letters compare NSV levels within each combination of ECw and NSC, and Greek letters compare NSC levels within each combination of ECw and NSV; in (b,c), uppercase letters compare ECw levels within each NSC or NSV, while lowercase letters compare NSC or NSV levels within each ECw; in (e,f), for the ECw × NSC interaction (at 25 days after transplanting—DAT), uppercase letters compare ECw levels within each NSC, and lowercase letters compare NSC levels within each ECw, whereas different uppercase letters alone indicate significant differences for the isolated effects of ECw or NSV. Mean comparisons were performed using Tukey’s test (p ≤ 0.05). Vertical bars show the means ± standard deviation.
Regarding SD, unlike PH, the means were variable under both saline and non-saline growing conditions. For instance, at 20 DAT (Figure 4c), analysis of the ECw × NSC interaction showed that the SD mean was significantly higher under saline stress than under non-saline conditions at 50% NSC. In contrast, at 100% NSC, the means were statistically equal under non-saline and saline stress conditions. Under non-saline conditions, the means did not differ significantly across NSC levels, whereas under saline stress, a higher SD was obtained at 50% NSC. Analysis of the ECw × NSV interaction showed that the means were statistically equal under non-saline and saline stress conditions across NSV levels. Analysis of NSV levels within each ECw level showed that, at 1 L plant−1 NSV, a higher SD was obtained under saline stress, whereas under non-saline conditions, the means did not differ significantly across NSV levels. For the ECw × NSC × NSV interaction at 25 DAT (Figure 4d), SD means were significantly higher under saline stress than under non-saline conditions at 50 and 100% NSC with a 1 L plant−1 NSV. At 2 L plant−1 NSV, the means did not differ significantly across ECw levels within 50% NSC, whereas at 100% NSC, SD was significantly higher under non-saline conditions. Analysis of NSV levels within ECw × NSC combination revealed that, at 2 L plant−1 NSV, the SD mean was higher under non-saline conditions within 50% NSC, whereas at 100% NSC, the means did not differ significantly across NSV levels. Under saline stress, the means did not differ significantly across NSV levels at 50% NSC, whereas at 100% NSC, the SD mean was higher at 1 L plant−1 NSV. Analysis of NSC levels within ECw × NSV combination showed that, at 100% NSC, the SD means were statistically higher for both under non-saline and saline stress conditions at 1 L plant−1 NSV. At 2 L plant−1 NSV, the same behavior was observed only under non-saline conditions, whereas under saline stress, the SD mean was higher at 50% NSC.
NL (Figure 4e) and LA (Figure 4f) showed the same behavior. The higher means of NL and LA at 20 DAT were obtained under non-saline conditions (17 leaves and 1866.94 cm2 plant−1, respectively) than under saline stress (15 leaves and 1501.32 cm2 plant−1, respectively). For the isolated effect of NSV, the NL of 16 and 23 leaves at 20 and 25 DAT, respectively, was higher at 2 L plant−1 NSV compared to 1 L plant−1 NSV (15 and 21 leaves, respectively). Similarly, for LA at 25 DAT, the value at 2 L plant−1 NSV (3626.19 cm2 plant−1) was higher than at 1 L plant−1 NSV (2985.63 cm2 plant−1).
In the analysis of the ECw × NSC interaction, the NL and LA means were statistically equal across ECw levels at 50% NSC, whereas at 100% NSC, higher means were observed under non-saline conditions (24 leaves and 4552.91 cm2 plant−1, respectively) than under saline stress (21 leaves and 3000.31 cm2 plant−1). Analysis of NSC levels within ECw showed that the higher NL and LA were obtained at 100% NSC compared to 50% NSC (22 leaves and 2884.35 cm2 plant−1, respectively) under non-saline conditions. In contrast, the means were statistically equal across NSC levels under saline stress.
Analysis of the ECw × NSC interaction for LFM at 20 DAT showed that means were higher under non-saline conditions (60.11 and 71.51 g plant−1) than under saline stress (48.21 and 46.62 g plant−1) across the 50 and 100% NSC levels, respectively (Figure 5a). Analysis of NSC levels within each ECw showed that, at 100% NSC, the higher LFM was obtained under non-saline conditions, whereas under saline stress, the means did not differ significantly across NSC levels. In the analysis of the NSC × NSV interaction, the LFM of 58.41 g plant−1 was higher under 2 L plant−1 NSV compared to 1 L plant−1 NSV (49.90 g plant−1) at 50% NSC. In contrast, at 100% NSC, no significant difference was observed between NSV levels, with a mean of approximately 59 g plant−1. At 1 L plant−1 NSV, higher LFM was obtained at 100% NSC, whereas at 2 L plant−1 NSV, no significant difference was observed across NSC levels. In the analysis of the ECw × NSC × NSV interaction at 25 DAT (Figure 5b), at 50% NSC, no significant differences were observed between non-saline and saline stress conditions across NSV levels. At 100% NSC, means were higher under non-saline conditions (101.38 and 144.11 g plant−1) compared to saline stress (74.56 and 78.58 g plant−1) at the 1 and 2 L plant−1 NSV levels, respectively. Analysis of NSV levels within ECw × NSC combination revealed that, at 50% NSC, LFM means were higher at 2 L plant−1 NSV (93.49 and 86.03 g plant−1) compared to 1 L plant−1 NSV (61.79 and 61.41 g plant−1) under non-saline and saline stress conditions, respectively. At 100% NSC, the same behavior was observed under non-saline conditions, whereas under saline stress, no significant differences were observed across NSV levels. Analysis of NSC levels within ECw × NSV combination showed that, at 50 and 100% NSC, the means were statistically equal under saline stress conditions at 2 L plant−1 NSV, In contrast, under the other treatment combinations, LFM was higher at 100% NSC.
Figure 5.
Follow-up analyses of the interactions between ECw (levels of water electrical conductivity) × NSC (nutrient solution concentration) and NSC × NSV (nutrient solution volume) on leaf fresh matter (LFM) (a) of lettuce grown in an NFT hydroponic system; follow-up analyses of the ECw × NSC × NSV interaction on LFM (b) and stem fresh matter (SFM) (c); follow-up analyses of the ECw × NSC and ECw × NSV interactions on SFM (d); isolated effects of ECw and ECw × NSC interaction on leaf dry matter (LDM) (e); isolated effects of ECw and NSV and NSC × NSV interaction on stem dry matter (SDM) (f). In (a), uppercase letters compare NSC levels within each ECw or NSV, and lowercase letters compare ECw or NSV levels within each NSC; in (b,c), uppercase letters compare ECw levels within each combination of NSC and NSV, lowercase letters compare NSV levels within each combination of ECw and NSC, and Greek letters compare NSC levels within each combination of ECw and NSV; in (d), uppercase letters compare ECw levels within each NSC or NSV, and lowercase letters compare NSC or NSV levels within each ECw; in (e), for the ECw × NSC interaction (at 25 days after transplanting—DAT), uppercase letters compare ECw levels within each NSC, and lowercase letters compare NSC levels within each ECw, whereas different uppercase letters alone indicate significant differences for the isolated effects of ECw; in (f), for the NSC × NSV interaction at 25 DAT, uppercase letters compare NSV levels within each NSC, and lowercase letters compare NSC levels within each NSV, whereas different uppercase letters alone indicate significant differences for the isolated effects of ECw or NSV. Mean comparisons were performed using Tukey’s test (p ≤ 0.05). Vertical bars show the means ± standard deviation.
In the analysis of the ECw × NSC × NSV interaction for SFM at 20 DAT (Figure 5c), means were significantly higher under non-saline conditions than under saline stress across all NSC and NSV levels. Analysis of NSV levels within ECw × NSC combination revealed that, at 2 L plant−1 NSV, a higher SFM mean was obtained under non-saline conditions within 50% NSC, whereas the opposite behavior occurred within 100% NSC. Under saline stress, the means did not differ significantly across NSV levels at both 50 and 100% NSC. Analysis of NSC levels within ECw × NSV combination revealed that, at 100% NSC, a higher SFM mean was obtained under non-saline conditions at 1 L plant−1 NSV, whereas at 2 L plant−1 NSV, SFM was higher at 50% NSC. Under saline stress, the means did not differ significantly across NSC levels at both 1 and 2 L plant−1 NSV. For the ECw × NSC and ECw × NSV interactions at 25 DAT (Figure 5d), SFM means were significantly higher under non-saline conditions than under saline stress across both NSC and NSV levels. Under saline stress, the means did not differ significantly across both NSC and NSV levels. Under non-saline conditions, SFM was higher at 100% NSC in the ECw × NSC interaction; whereas in the ECw × NSV interaction, SFM was higher at 2 L plant−1 NSV.
In the analysis of the isolated effect of ECw on LDM at 20 DAT (Figure 5e) and on SDM at 20 and 25 DAT (Figure 5f), higher means were obtained under non-saline conditions than under saline stress. For the isolated effect of NSV on SDM at 20 DAT (Figure 4f), the mean was higher at 1 L plant−1 NSV. For the ECw × NSC interaction on LDM at 25 DAT (Figure 5e), means were significantly higher under non-saline conditions than under saline stress at 100% NSC, whereas at 50% NSC, means did not differ significantly across ECw levels. Analysis of NSC levels within each ECw showed that, at 100% NSC, the higher LDM was obtained under non-saline conditions, whereas under saline stress, the means did not differ significantly across NSC levels. For the NSC × NSV interaction on SDM at 25 DAT (Figure 5f), the mean was higher at 1 L plant−1 NSV within 100% NSC, whereas within 50% NSC, means did not differ significantly across NSV levels. Analysis of NSC levels within each NSV showed that means did not differ significantly across NSC levels at 1 L plant−1 NSV, whereas at 2 L plant−1 NSV, the mean was higher at 50% NSC.
In the analysis of the ECw × NSC × NSV interaction for WCL at 20 DAT (Figure 6a), means were significantly higher under non-saline conditions than under saline stress within 2 L plant−1 NSV across NSC levels. At 1 L plant−1 NSV, means did not differ significantly across ECw levels at 50% NSC; however, at 100% NSC, the mean was higher under non-saline conditions. Analysis of NSV levels within ECw × NSC combination revealed that, at 1 and 2 L plant−1 NSV levels, the means did not differ significantly for both non-saline and saline stress conditions at 100% NSC. The same lack of significant difference was observed at 50% NSC under saline stress, whereas under non-saline conditions, the mean was higher at 2 L plant−1 NSV. Analysis of NSC levels within ECw × NSV combination revealed that, at 100% NSC, the WCL mean was higher under non-saline conditions at 1 L plant−1 NSV, whereas at 2 L plant−1 NSV, the means did not differ significantly across NSC levels. Under saline stress, the means did not differ significantly across NSC levels for both 1 and 2 L plant−1 NSV. For the ECw × NSC and ECw × NSV interactions at 25 DAT (Figure 6b), means were significantly higher under non-saline conditions than under saline stress within the 100% NSC treatment and 2 L plant−1 NSV treatment, respectively. At 50% NSC in the ECw × NSC interaction, the mean was higher under saline stress, whereas in the ECw × NSV interaction at 1 L plant−1 NSV, the means did not differ significantly. In the analysis of NSC or NSV within each ECw level, higher means were obtained with the 100% NSC treatment and the 2 L plant−1 NSV treatment for both ECw levels.
Figure 6.
Follow-up analyses of the interaction between levels of water electrical conductivity (ECw), nutrient solution concentration (NSC), and nutrient solution volume (NSV) on water content in leaf (WCL) (a), water productivity (WP) based on fresh matter (WPFM) (d), and WP based on dry matter (WPDM) (e,f) of lettuce grown in an NFT hydroponic system; follow-up analyses of the ECw × NSC and ECw × NSV interactions on WCL (b) and WPFM (c). In (a,d–f), uppercase letters compare ECw levels within each combination of NSC and NSV, lowercase letters compare NSV levels within each combination of ECw and NSC, and Greek letters compare NSC levels within each combination of ECw and NSV; in (b,c), uppercase letters compare ECw levels within each NSC or NSV, and lowercase letters compare NSC or NSV levels within each ECw level. Mean comparisons were performed using Tukey’s test (p ≤ 0.05). Vertical bars show the means ± standard deviation.
For WPFM at 20 DAT (Figure 6c), means were significantly higher under saline stress than under non-saline conditions at 50% NSC (62.57 and 47.78 g L−1, respectively) (ECw × NSC interaction) and at 2 L plant−1 NSV (65.53 and 54.21 g L−1, respectively) (ECw × NSV interaction). At 100% NSC and 1 L plant−1 NSV, means did not differ significantly across ECw levels. Analysis of NSC levels within each ECw showed that the higher WPFM was obtained at 100% NSC under non-saline conditions (55.14 g L−1). Under saline stress, a higher mean was obtained at 50% NSC compared to 100% NSC (49.93 g L−1). An analysis of NSV levels within each ECw showed that, under both non-saline and saline stress conditions, higher means were obtained at 2 L plant−1 NSV compared to 1 L plant−1 NSV (48.72 and 46.97 g L−1, respectively). In the analysis of the ECw × NSC × NSV interaction at 25 DAT (Figure 6d), WPFM means did not differ significantly across ECw levels within 1 L plant−1 NSV for both 50 and 100% NSC. At 2 L plant−1 NSV, the mean of 78.68 g L−1 under saline stress was higher than that obtained under non-saline conditions (54.09 g L−1) at 50% NSC. At 100% NSC, a contrary behavior was observed, i.e., the mean of 76.55 g L−1 under non-saline conditions was higher than that obtained under saline stress (62.58 g L−1). Analysis of NSV levels within ECw × NSC combination revealed that, for both non-saline and saline stress conditions, the higher means were obtained at 2 L plant−1 NSV than at 1 L plant−1 NSV for both 50% NSC (36.47 and 42.24 g L−1, respectively) and 100% NSC (48.62 and 53.62 g L−1, respectively). Whereas the mean was higher at 50% NSC under saline stress within 2 L plant−1 NSV, in the other treatment combinations, WPFM was higher at 100% NSC.
WPDM at 20 DAT (Figure 6e) and 25 DAT (Figure 6f) exhibited the same behavior in the analysis of the ECw × NSC × NSV interaction. In the analysis of ECw levels within NSC × NSV combination, the mean was higher under saline stress than under non-saline conditions at 50% NSC within 2 L plant−1 NSV; however, in the other treatment combinations, WPDM means did not differ significantly across ECw levels. Similarly, in the analysis of NSV levels within ECw × NSC combination, only within 50% NSC under saline stress, the mean was higher at 2 L plant−1 NSV than at 1 L plant−1 NSV. This behavior was also observed in the analysis of NSC levels within ECw × NSV combination, where the WPDM mean was higher at 50% NSC than at 100% NSC under saline stress within 2 L plant−1 NSV.
Principal component analysis (PCA) successfully discriminated the behavioral responses of lettuce plants to ECw × NSC × NSV treatment combination at 20 (Figure 7a) and 25 DAT (Figure 7b). At 20 DAT, the first two principal components accounted for 82.95% of the total variance, with PC1 and PC2 explaining 64.00 and 18.95%, respectively. PC1 showed positive loadings for PH, NL, LA, LFM, SFM, LDM, SDM, and WCL, associating these traits with non-saline cultivation conditions, with the exception of the 0.3 dS m−1 ECw × 1 L plant−1 NSV × 50% NSC combination. In contrast, PC2 revealed a positive association for WPDM under saline stress, but this occurred only in the 5.0 dS m−1 ECw × 2 L plant−1 NSV × 50% NSC combination. At 25 DAT, the first two principal components accounted for 86.80% of the total variance, with PC1 and PC2 explaining 57.89 and 28.91%, respectively. Similar behavior was observed for the variables at 20 DAT; however, the traits PH, NL, LA, LFM, SFM, LDM, and WCL showed positive loadings on PC1 and were associated with the 0.3 dS m−1 ECw × 2 L plant−1 NSC × 100% NSV combination.
Figure 7.
Principal component analysis between the treatments and analysis of lettuce variables grown in an NFT hydroponic system at 20 (a) and 25 (b) days after transplanting (DAT). PH: plant height; SD: stem diameter; NL: number of leaves; LA: leaf area; LFM: leaf fresh matter; SFM: stem fresh matter; LDM: leaf dry matter; SDM: stem dry matter; WCL: water content in leaf; WPFM: water productivity based on fresh matter; WPDM: water productivity based on dry matter.
The Pearson correlation matrix revealed positive correlations with coefficients r ≥ 0.76 between growth traits (PH, NL, and LA) and production variables (LFM, SFM, and LDM) (Figure 8), indicating a strong interdependency among these characteristics. Additionally, WCL correlated with NL, LA, and LFM, while WPFM and WPDM were correlated with each other.
Figure 8.
Pearson correlation matrix for the evaluated variables on lettuce grown in an NFT hydroponic system. Data represent two joint assessments conducted at 20 and 25 days after transplanting (DAT). PH: plant height; SD: stem diameter; NL: number of leaves; LA: leaf area; LFM: leaf fresh matter; SFM: stem fresh matter; LDM: leaf dry matter; SDM: stem dry matter; WCL: water content in leaf; WPFM: water productivity based on fresh matter; WPDM: water productivity based on dry matter. *, **, and ***: significant correlations at p ≤ 0.05, p ≤ 0.01, and p ≤ 0.001, respectively, by Student’s t-test.
4. Discussion
Under salt stress, various negative effects have been observed in plants. Excessive salt concentrations in the soil solution and/or irrigation water induce osmotic stress (i.e., lowering of the external water potential), which prevents water and nutrient uptake by plants [104,105,122,123], leading to cellular dehydration, reduced turgor, and inhibited cell division and elongation [124,125,126,127]. A second phase of saline stress relates to ionic stress, characterized by the accumulation of toxic ions (sodium—Na+ and chloride—Cl−) in plant tissues, leading to ionic imbalance [16,60,126,128]. As a consequence, it induces various morphological and physiological changes, thereby restricting growth, yield, and quality [102]. Both osmotic and ionic stresses induce oxidative stress by promoting the excessive accumulation of reactive oxygen species (ROS) [24]. This overproduction overwhelms the antioxidant defense system, leading to cellular damage, including lipid peroxidation, protein oxidation, and DNA fragmentation [23,24,25,26,27]. In general, abiotic stress induces stomatal closure, which reduces carbon dioxide availability, hinders carbon fixation, and promotes the successive reduction in molecular oxygen. This yields excess ROS and impairs chloroplast function, thereby disturbing photosynthetic processes [129,130]. ROS play a dual role, acting as signaling molecules at optimum concentrations and as toxic molecules at higher concentrations [131]. Therefore, when an imbalance occurs between ROS production and elimination, it is counteracted by enzymatic and non-enzymatic antioxidant responses [132], which contribute to maintaining cellular osmotic adjustment through cell turgidity, protecting internal cell components, and reducing ionic toxicity [133]. Each cellular compartment maintains its own ROS homeostasis control, and ROS signaling varies depending on cell type, developmental stage, and stress level. Under adverse conditions such as salinity stress, the production of ROS molecules is detected by various ROS sensors, which generate stress-specific signals that trigger acclimation responses [134,135].
Therefore, plants develop different adaptive mechanisms to mitigate the deleterious impacts of salt stress. These include the regulation of ion uptake by roots and subsequent ion transport to leaves, the selective accumulation or exclusion of salt ions, and ion compartmentalization [130,132]. Tolerance requires the compartmentalization of Na+ at both cellular and intracellular levels to prevent toxic concentrations from accumulating in the cytoplasm. To remove excess salt from the cytosol, it is sequestered either in older plant tissues or transferred into the vacuole [130,136,137,138,139]. Salt-tolerant plants adjust osmotically by maintaining an enhanced ability to regulate the ratio between potassium (K+) and Na+, i.e., an elevated K+/Na+ ratio achieved by limiting Na+ absorption and enhancing K+ assimilation [16,21,30,31]. K+ is indispensable for several plant processes, playing a crucial role in maintaining cell homeostasis [140]; therefore, a higher K+/Na+ ratio serves as a hallmark of effective ion management, reducing the influx of harmful ions while promoting the retention of essential nutrients [28,141,142].
To adjust osmotically, the plant’s energy demand increases dramatically to sustain Na+ exclusion and ion compartmentalization [133,143,144,145]. Therefore, plants actively suppress growth in favor of survival [146,147]. Consequently, over time, toxicity develops as Na+ concentrations increase to high levels in older leaves [130], which serve as a sink for toxic ions—a sacrificial strategy to protect younger tissues—eventually causing necrosis that begins at the tips and then extends toward the leaf base [148,149,150]. In the case of leafy vegetables, necrotic leaves make commercial exploitation impossible. The plants produced in the present study, even under high salinity (water electrical conductivity—ECw of 5.0 dS m−1), maintained their leaf quality without any evidence of Na+ toxicity based on visual quality assessment, which further indicates lettuce tolerance under the conditions in which it was grown (Figure 2). In addition to visual quality, saline stress has been used to assess key properties of fresh vegetables, with particular emphasis on quality attributes such as physical characteristics (color, texture, visual appearance, and firmness), flavor and nutritional value (aroma and taste), as well as health-promoting properties (antioxidants and bioactive compounds) [22,40,151,152,153,154,155,156]. Among the leafy vegetables, lettuce (Lactuca sativa L.) is a species widely used in studies involving saline stress. The highest phenolic compound concentrations and antioxidant activity were obtained under moderate salt stress (50 mM NaCl), which did not affect photosynthetic activity or biomass production. In contrast, severe salt stress (150 and 200 mM NaCl) also increased phenolic compounds, but this was accompanied by a significant reduction in both antioxidant activity and biomass production [155]. Under higher salinity (120 mM NaCl), chlorophyll levels were maintained, whereas total soluble solids content increased [156]. β-carotene and total carotenoid contents were either maintained or increased at 100 mM NaCl salinity, depending on the genotype evaluated [157]. Therefore, the maintenance or increase in these compounds under salinity stress indicates that the plants were protected from oxidative stress through the neutralization of ROS [114,158]. ROS generation greatly varies with plant species, genotypes, stress tolerance level, and duration of stress exposure [159].
Therefore, the survival conditions of plants cultivated under saline stress involve complex interactions with the growing environment. In open-field conditions, in addition to saline stress, plants are often exposed to multiple abiotic stresses simultaneously [160,161]. For instance, under soil cultivation conditions, water consumption by plants decreases soil matric potential (making it more negative) and reduces moisture; consequently, roots expend more energy to extract water, a situation that is exacerbated by saline stress as the osmotic pressure in the soil solution increases [162,163]. In hydroponic systems, cultivating plants directly in nutrient solutions eliminates the matric potential, thereby increasing the free energy of water and facilitating its uptake. This results in greater plant tolerance to saline stress [74,75,76,102]. Despite these improved plants’ response to saline stress under hydroponic conditions, adding nutrient salts to brackish water during preparation of the nutrient solution further reduces the osmotic potential (making it more negative) [164], and less water is available for plants, which then need to expend more energy to absorb it. For this reason, slower growth is still expected depending on the level of stress applied; consequently, nutrient consumption is lower [56,86,87,102,165]. In this sense, it may be strategic to use a less concentrated nutrient solution formulation; consequently, the effect of osmotic potential is less on the plants [89,166,167]. The nutrient solution volume (NSV) available to the plants, in turn, influences water uptake and, consequently, the nutrient depletion rate, which affects the nutrient solution’s buffering capacity (i.e., its ability to resist pH changes) [168,169].
The NSV influences root respiration by depleting the available dissolved oxygen, and this effect shows an inverse relationship with temperature [76,106]. In the present study, minimum differences in nutrient solution temperatures were observed as a function of the NSV (Table 1). For instance, at an NSV of 2 L plant−1, temperatures ranged from a minimum of 25.83 ± 0.79 °C to a maximum of 27.05 ± 0.77 °C during cultivation under saline stress at 50% nutrient solution concentration (NSC) and non-saline conditions at 100% NSC, respectively. In fact, temperatures had no detrimental effects on dissolved oxygen (DO) concentrations, which remained relatively constant throughout the growing cycle (Figure 3a,b). This behavior can be attributed to the season in which the experiment was conducted, e.g., autumn. This favored root development, in addition to quality (white coloring) (Figure 2). Well-developed roots improve the plant’s ability to cope with possible nutrient shortages or other adverse stresses, enhance stress resistance, reduce disease occurrence, and thereby increase lettuce yield and quality [170,171]. In a study conducted under the same conditions in autumn/winter [56], ambient solution temperature values were 23.91 ± 0.91 °C without saline stress and 24.48 ± 0.84 °C with saline stress. In that study, lettuce was grown in an NFT system using an 8.33 L plant−1 NSV. This seasonal effect is clearly illustrated in a study by Yang et al. [172] with lettuce grown in NFT and deep water culture (DWC) systems, where lower DO concentrations in the nutrient solution were observed in summer than in autumn, due to the negative relationship between DO and solution temperature.
In the present study, to assess the degree of salt stress according to the evaluation period, harvests were carried out at 20 and 25 days after transplanting (DAT). Growth variables, including plant height (PH) (Figure 4a,b) and stem diameter (SD) (Figure 4c,d), remained largely unchanged during the five-day period from 20 to 25 DAT. For instance, for SD at 20 DAT (Figure 4c), saline stress did not impair stem development compared to cultivation without saline stress at 100% NSC, as well as under both NSV levels of 1 and 2 L plant−1. However, at a lower NSC (50%), saline stress led to a greater SD. This effect remained evident at 25 DAT (under 1 L plant−1 NSV) and was also observed under both NSV levels (at 100% NSC) (Figure 4d). In contrast to these results, lettuce SD was smaller under saline stress at ECw of 3.5 dS m−1 [42] and 2.0 dS m−1 [118], induced by NaCl in a soilless system using coconut fiber substrate as the growth medium.
Still referring to growth variables, the number of leaves (NL) (Figure 4e) and leaf area (LA) (Figure 4f) showed different responses to saline stress throughout the assessment periods. At 20 DAT, lettuce plants grown under salt stress produced two fewer leaves than those under non-salt stress conditions. Consequently, LA was lower by approximately 20%. Over the 5-day period, plants under saline stress produced a similar NL as those without saline stress when half-strength NSC (50%) was used; consequently, LA also remained similar. Under full-strength NSC (100%), the effect of saline stress was pronounced, and even more drastic on LA. For instance, lettuce plants grown under salt stress produced three fewer leaves than those under non-salt stress conditions, whereas LA was lower by approximately 34%. Therefore, even under saline stress, the plants continued to produce new leaves, despite these leaves being increasingly smaller, thus reducing the plant’s LA. It is worth highlighting that, when analyzing only the cultivation under saline stress, both the NL and LA remained at similar magnitudes under both NSC levels. In this sense, a half-strength solution can be used when brackish water is used for cultivation. Similarly to the present study, lettuce NL under hydroponic conditions did not undergo significant changes during the assessments performed at 5-day intervals (from 5 to 25 days) under saline stress (40 mM NaCl), with differences manifesting only at the end of the cycle (30 and 35 days), where non-stressed plants produced more leaves than stressed plants, on mean, four and seven leaves, respectively [58]. In addition, this effect can be more or less pronounced depending on the level of saline stress. For instance, in both evaluation periods (11 and 19 days) under hydroponic lettuce cultivation, stressed plants at 150 mM NaCl (EC of 12–16 dS m−1) produced, on average, four leaves less than the control, whereas at 100 mM NaCl (10–12 dS m−1), the difference did not exceed two leaves [57]. In other studies under hydroponic conditions, NL was not affected by salt stress during a 25-day period [78], whereas in others, the effect was less pronounced on NL than on LA at 30 days [118] and at 35 days [42].
As already discussed for lettuce growth variables, our hypothesis regarding how much the nutrient solution concentration can be reduced to mitigate saline stress is confirmed based on the evaluation of production variables. For instance, based on LFM at 20 DAT (Figure 5a), no difference was observed among NSC levels under saline stress. At 25 DAT (Figure 5b), the ECw × NSC interaction evolved into a three-way interaction, indicating that the NSV supplied to the plants also contributed to mitigating saline stress. In this case, under cultivation using 50% NSC, LFM production under saline stress was similar to that obtained under non-saline conditions at both NSV levels. However, under cultivation at 100% NSC, LFM was lower under saline stress, and more drastically so at the highest NSV (2 L plant−1). Considering only cultivation under saline stress, the means are statistically equal across NSV levels. Therefore, as a strategy to improve lettuce production when grown using brackish water, a half-strength nutrient solution (50% NSC) can be used, providing 2 L plant−1 NSV. This behavior at the highest NSV of 2 L plant−1 can be explained by the greater buffering capacity provided, which ensures stable water and nutrient uptake, corroborating the results obtained under cultivation without saline stress. Meanwhile, full-strength NSC (100%) combined with a smaller one (1 L plant−1) leads to an excessive total ionic concentration, which negatively affects plant growth. It is worth highlighting that, at the end of the 25-day period (the stage at which the plants are ready for harvest), the present results suggest that the use of 50% NSC does not compromise the visual quality of the lettuce plants (Figure 2). However, these results may vary depending on the hydroponic system type (e.g., NFT, DWC, and the deep flow technique—DFT—or the floating, aeroponics, or substrate-based system) as well as the lettuce cultivar used, due to differences in root morphology, transpiration rates, and salt tolerance thresholds. Therefore, further research is needed to confirm this hypothesis across multiple hydroponic configurations and lettuce cultivars.
This behavior observed under non-saline conditions at 25 DAT is evident in the principal component analysis (Figure 7b), where lettuce growth and production variables were associated with higher NSC and NSV levels. This is justified by the fact that plants require greater nutrient availability to support their growth, a demand that is intensified by competition among plants. This demand is directly associated with the availability of nutrient solutions, as evidenced by the pronounced decline in electrical conductivity (ECsol) values at the end of the cultivation period (Figure 3c). There are many studies in the literature on lettuce that evaluate NSC and, consequently, ECsol levels. For instance, two lettuce cultivars (‘Cinderela’ and ‘Rubinela’) were grown in NFT and floating systems (with 4.3 and 6.0 L plant−1 NSV, respectively) at 50% half-strength and 100% full-strength nutrient solutions based on the formulation of Furlani et al. [116] (corresponding to ECsol values of 1.60 and 2.90 dS m−1, respectively). The half-strength solution (50% NSC) provided the highest values for most growth and quality variables in both lettuce cultivars and hydroponic systems [96]. In a floating hydroponic system, lettuce was grown using an NSV of approximately 3 L plant−1 [173,174,175]. In the first study, lettuce yield at 40, 60, and 80% NSC levels was only 12% lower than at the higher NSC level (100%). In the second study, lettuce yield was approximately 30% lower at the lowest NSC (50%) compared to the higher NSC (100%). In the third study, lettuce yield was approximately 54% lower at 20% NSC compared to 100% NSC, whereas at 40, 60, and 80% NSC levels, the yield was 20% lower compared to the higher NSC. In these studies, the ECsol levels in the 100% full-strength nutrient solution were 1.8, 2.4, and 2.2 dS m−1, respectively. In the present study, these differences were even greater. Under non-saline conditions at 25 DAT, LFM accumulation was approximately 61 and 65% lower under 50% NSC compared to 100% NSC at 1 and 2 L plant−1 NSV levels, respectively (Figure 5b).
Therefore, in addition to NSC, these results may also be associated with the volume of solution available to the plants. In this regard, Subedi et al. [169] showed that the highest NSV (4 L plant−1) did not favor greater accumulation of shoot fresh matter (SFM) compared to the lowest NSV (2 L plant−1), using an ECsol of 1.80 dS m−1. In summer, the highest mean was obtained in the lowest NSV, while in autumn, the means were statistically equal. This highlights the effect of the growing season.
Our results are supported by the accumulation of dry biomass in the leaves (LDM), which showed that reducing NSC to half-strength (50%) mitigated the saline stress. At 25 DAT, a significant effect on LDM was observed only for the ECw × NSC interaction (Figure 5e); in other words, the absence of an effect from NSV may be related to water accumulation in the leaves (WCL), despite a minimal significant difference within the 2 L plant−1 NSV (Figure 6b). Because of WCL, LDM production under saline stress at 50% NSC was similar to that obtained under non-saline conditions. At 100% NSC, LDM was reduced by approximately 30% under saline stress, whereas LFM was reduced by approximately 45%. It is worth highlighting that brackish water (ECw of 5.0 dS m−1) was used both to prepare the nutrient solution and to replenish plant water consumption. Consequently, ECsol gradually increased throughout the growing cycle (Figure 3d). In hydroponic conditions, the use of brackish water with high ECw has been shown to be feasible, including with the same ‘Jade’ lettuce cultivar [64,78,115] used in the present study. In the first study using the NFT system, SFM varied depending on the growing season, decreasing by approximately 43 and 53% at an ECw of 4.0 dS m−1 in spring and autumn, respectively. In the second study, conducted during winter, SFM was reduced by approximately 34 and 47% when grown under NFT and floating hydroponic systems, respectively, at an ECw of 5.1 dS m−1 relative to non-saline conditions. In the third study, which used only the floating system, SFM decreased by approximately 85% under a 100 mM NaCl concentration (ECw ~ 10 dS m−1). These studies were conducted under the same climatic conditions as the present study, with the same water supply (ECw of 0.3 dS m−1), and brackish water was used only for preparing the nutrient solution. In addition to all these factors—such as ECw level, water replenishment strategy, hydroponic growing system, and growing season—the plant material used is also affected by saline stress. For instance, in a study by Silva et al. [56] conducted under the same climatic conditions in autumn/winter, the SFM of ‘Rubinela’ lettuce decreased by approximately 52% under an ECw level of 6.5 dS m−1 compared to cultivation under non-saline conditions (ECw of 0.25 dS m−1), whereas that of ‘Veneranda’ lettuce decreased by approximately 32%. It is noteworthy that, in this study, the use of brackish water was exclusive—that is, it was applied both for preparing the nutrient solution and for replenishing plant water consumption.
In summary, our results are supported by the plants’ water consumption patterns, indicating better water use efficiency under saline stress conditions. In other words, plants subjected to saline stress consumed less water [64,77,78], and in this case, the water consumed was more efficiently converted into biomass accumulation [78,84]. In the present study, the reduction in NSC to 50% combined with the use of 2 L plant−1 of NSV favored lettuce cultivation under saline stress, which confirms what was previously stated. Under these conditions, the WPFM at 25 DAT was approximately 45% higher than that observed under non-saline conditions. At harvest five days earlier (20 DAT), higher WPFM was also obtained under saline stress, specifically at 50% NSC (ECw × NSC interaction) or 2 L plant−1 NSV (ECw × NSV interaction). Based on WPDM, at 50% NSC combined with 2 L plant−1 NSV, the values were approximately 71 and 44% higher under saline stress at 20 and 25 DAT, respectively.
5. Conclusions
In the present study, we hypothesize that simultaneous regulation of nutrient concentration (NSC) and solution volume per plant (NSV) can mitigate saline stress in ‘Jade’ lettuce plants grown in an NFT hydroponic system using brackish water (electrical conductivity—ECw of 5.0 dS m−1). To validate this hypothesis, growth, production, and water productivity variables were evaluated at 20 and 25 days after treatment imposition. Our results show that the impact of brackish water use depended on the evaluation period and the variable analyzed, as modulated by NSC and NSV levels. At the end of the 25-day cycle, lettuce cultivation using brackish water can successfully be managed by reducing the NSC to 50% and applying an NSV of 2 L plant−1. These findings confirm our hypothesis that nutrient solution concentration can be reduced under saline stress conditions. Thus, this combination offers an effective, resource-efficient strategy for lettuce production under saline stress. Our research also showed that, under non-saline conditions (ECw of 0.3 dS m−1), using full-strength NSC (100%) combined with a 2 L plant−1 NSV led to higher lettuce growth and production attributes. These findings open a new line of research focused on the integrated management of solution concentration and volume as a resource-efficient strategy for mitigating saline stress in soilless systems. Therefore, further research is needed to evaluate different plant species, hydroponic cultivation systems, and additional environmental or management factors.
Author Contributions
Conceptualization, software, data curation, supervision, and project administration, M.G.d.S.; methodology and investigation, M.G.d.S., L.S.S. and G.S.d.J.P.; validation, formal analysis, visualization, writing—original draft preparation, and writing—review and editing, M.G.d.S., H.R.G. and T.I.d.S.; funding acquisition, H.R.G. All authors have read and agreed to the published version of the manuscript.
Funding
This research was funded by the Brazilian National Council for Scientific and Technological Development (CNPq), Brazil, grant number 408511/2023-0.
Institutional Review Board Statement
Not applicable.
Informed Consent Statement
Not applicable.
Data Availability Statement
All data produced in this research are included in the manuscript. Further inquiries can be directed to the corresponding author.
Acknowledgments
To the National Institute of Science and Technology in Sustainable Agriculture in the Tropical Semi-Arid Region (INCTAgriS), supported by the following Brazilian agencies: CNPq (grant number 406570/2022-1), Foundation for Support of Scientific and Technological Development of Ceará (FUNCAP: grant number INCT-35960-62747.65.95/51), and Coordination for the Improvement of Higher Education Personnel (CAPES). To the Institute of Science, Innovation and Technology of the State of Bahia—Water Resources and Sustainable Development (INCITE Green Economy), with support from the Bahia State Research Support Foundation (FAPESB: No. 005/2022—order term No. 4137/2022). To the FAPESB (No. 4362/2024—order term No. TSC0010/2025). The authors also thank the Postgraduate Program in Agricultural Engineering (PPGEA) of the Federal University of Recôncavo da Bahia for supporting the research project.
Conflicts of Interest
The authors declare no conflicts of interest.
Abbreviations
| CV | Coefficient of variation |
| DAS | Days after sowing |
| DAT | Days after transplanting |
| DFT | Deep flow technique |
| DO | Dissolved oxygen |
| DF | Degree of freedom |
| DWC | Deep water culture |
| EC | Electrical conductivity |
| ECsol | Nutrient solution electrical conductivity |
| ECw | Water electrical conductivity |
| ECwps | Water electrical conductivity of public supply |
| LA | Leaf area |
| LDM | Leaf dry matter |
| LDMD | Leaf dry matter of disk |
| LFM | Leaf fresh matter |
| NFT | Nutrient film technique |
| NL | Number of leaves |
| NSC | Nutrient solution concentration |
| NSV | Nutrient solution volume |
| PC1 | Principal component 1 |
| PC2 | Principal component 2 |
| PCA | Principal component analysis |
| PH | Plant height |
| ROS | Reactive oxygen species |
| SD | Stem diameter |
| SDM | Stem dry matter |
| SFM | Stem fresh matter |
| SV | Source of variation |
| Tsol | Nutrient solution temperature |
| UFRB | Federal University of Recôncavo da Bahia |
| WCL | Water content in leaf |
| WPDM | Water productivity based on dry matter |
| WPFM | Water productivity based on fresh matter |
References
- Kricsfalusy, V.; Chakma, K. Prediction of potential habitat distributions and climate change impacts on six Carex L. species of conservation concern in Canada. Conservation 2025, 5, 55. [Google Scholar] [CrossRef] [Scilit]
- Yaulilahua-Huacho, R.; Araujo-Reyes, L.D.; Estrada-Ayre, C.P.; Basualdo-Garcia, P.E.; Enriquez-Ochoa, A.; Porras-Sarmiento, S.; Palacios-Mucha, M.L. Using water footprint indicators to support biodiversity conservation and rights-based water governance in the Andean high Andes: A scoping review and framework. Conservation 2025, 5, 71. [Google Scholar] [CrossRef] [Scilit]
- Faisal, M.; Faizan, M.; Tonny, S.H.; Rajput, V.D.; Minkina, T.; Alatar, A.A.; Pathirana, R. Strigolactone-mediated mitigation of negative effects of salinity stress in Solanum lycopersicum through reducing the oxidative damage. Sustainability 2023, 15, 5805. [Google Scholar] [CrossRef] [Scilit]
- Suleiman, M.K.; Bhatt, A.; Madouh, T.A.; Islam, M.A.; Jacob, S.; Thomas, R.R.; Sivadasan, M.T. Effects of salt stress on growth, proline and mineral content in native desert species. Sustainability 2023, 15, 6232. [Google Scholar] [CrossRef] [Scilit]
- Sahito, Z.A.; Benavides-Mendoza, A.; Cota-Ruiz, K. Editorial: Plant responses to salt stress. Front. Plant Sci. 2024, 15, 1475599. [Google Scholar] [CrossRef] [Scilit]
- El-Sharkawy, M.; Alotaibi, M.O.; Alhaithloul, H.A.S.; ElGhannam, M.K.; Alla, M.M.M.G.; El-Akhdar, I.; Shabana, M.M.A. Multivariate linkages between soil health, salinity stress, and wheat yield under bio-organic management. Sustainability 2026, 18, 2902. [Google Scholar] [CrossRef] [Scilit]
- Coca, L.I.R.; González, M.T.G.; Unday, Z.G.; Hernández, J.J.; Jáuregui, M.M.R.; Cancio, Y.F. Effects of sodium salinity on rice (Oryza sativa L.) cultivation: A review. Sustainability 2023, 15, 1804. [Google Scholar] [CrossRef] [Scilit]
- Al-Barakaha, F.N.; Alghamdi, A.G. Plant-growth-promoting rhizobacteria as a sustainable strategy for enhancing quinoa resilience to salt stress in arid regions. Sustainability 2025, 17, 9048. [Google Scholar] [CrossRef] [Scilit]
- Alqardaeai, T.; Alharbi, A.; Alenazi, M.; Alomran, A.; Alghamdi, A.; Obadi, A.; Elfeky, A.; Osman, M. Effectiveness of grafting in enhancing salinity tolerance of tomato (Solanum lycopersicum L.) using novel and commercial rootstocks in soilless systems. Sustainability 2025, 17, 4333. [Google Scholar] [CrossRef] [Scilit]
- Zhang, Y.; Ge, Y.; Jie, F.; Li, S.; Guo, R.; Liu, T.; Li, T. Research on the synergistic effects of water quality and quantity as dual factors in irrigation in arid region oases. Sustainability 2026, 18, 2486. [Google Scholar] [CrossRef] [Scilit]
- Lessa, C.I.N.; Lacerda, C.F.; Cajazeiras, C.C.A.; Neves, A.L.R.; Lopes, F.B.; Silva, A.O.; Sousa, H.C.; Gheyi, H.R.; Nogueira, R.S.; Lima, S.C.R.V.; et al. Potential of brackish groundwater for different biosaline agriculture systems in the Brazilian semi-arid region. Agriculture 2023, 13, 550. [Google Scholar] [CrossRef] [Scilit]
- Abrantes, E.M.; Pessoa, L.G.M.; Silva, L.F.S.; Silva, E.M.; Silva, J.O.N.; Freire, M.B.G.S.; Oliveira, A.C.; Alencar, E.L.N. Silicon combined with Trichoderma harzianum and organic matter as an environmental friendly strategy for mitigating salt stress in quinoa (Chenopodium quinoa Willd.). Sustainability 2024, 16, 2825. [Google Scholar] [CrossRef] [Scilit]
- Souza, W.B.B.; Lima, G.S.; Soares, L.A.A.; Dias, M.S.; Lima, B.M.; Santos, L.F.S.; Oliveira, V.K.N.; Torres, R.A.F.; Gheyi, H.R.; Borborema, L.D.A.; et al. Reduced glutathione in modulation of salt stress on sour passion fruit production and quality. Plants 2025, 14, 2149. [Google Scholar] [CrossRef] [Scilit]
- Brito, G.F.; Souza, E.R.; Almeida, C.D.G.C.; Lima, G.S.; Silva, T.G.F.; Silva, M.V.; Ferreira, M.B.; Silva, Ê.F.F.; Dantas, D.C.; Santos Júnior, J.A. Photosynthetic parameters of melons in response to NO3− and NH4+ as N sources and irrigation with brackish water high in Na+, Ca2+, and Cl−. Appl. Sci. 2025, 15, 9601. [Google Scholar] [CrossRef] [Scilit]
- Mendes Filho, H.T.; Matos, D.A.; Maia, I.C.S.; Souza, Í.B.; Carvalho, I.C.; Silva, I.P.; Silva, T.L.; Silva, M.G.; Silva, R.O. Uso de águas de baixa qualidade para irrigação no Nordeste brasileiro: Uma revisão. Water Resour. Irrig. Manag. 2025, 14, 48–87. [Google Scholar]
- Santos, T.S.; Correia, M.R.S.; Sena, L.S.; Santana, L.P.S.; Silva, G.B.G.; Lima, K.S.; Dutra, E.V.S.; Adas, M.E.; Ribeiro, M.C.B.O.; Ribeiro, J.E.S.; et al. The combination of salicylic acid, nicotinamide, and proline mitigates the damage caused by salt stress in nasturtium (Tropaeolum majus). Plants 2025, 14, 1156. [Google Scholar] [CrossRef] [Scilit] [PubMed]
- Oliveira, P.H.A.; Ribeiro, J.E.S.; Silva, E.F.; Coêlho, E.S.; Silva, A.G.C.; Ferreira, F.N.; Morais, F.M.S.; Barros Júnior, A.P.; Silveira, L.M. Melatonin alleviates salt stress in West Indian gherkin by modulating photosynthesis and ion homeostasis to enhance fruit yield. S. Afr. J. Bot. 2026, 189, 403–418. [Google Scholar] [CrossRef] [Scilit]
- Souza, A.R.; Azevedo, C.A.V.; Borborema, L.D.A.; Lima, G.S.; Soares, L.A.A.; Silva, A.A.R.; Nunes, K.G.; Costa, D.S.; Durval, P.H.D.; Arruda, T.F.L.; et al. Foliar application of selenium in mitigating salinity stress on the physiology, growth, and yield of okra. Plants 2026, 15, 21. [Google Scholar] [CrossRef] [Scilit]
- Suhani, I.; Srivastava, V.; Megharaj, M.; Suthar, S.; Garg, V.K.; Singh, R.P. Effect of compost and vermicompost amendments on biochemical and physiological responses of lady’s finger (Abelmoschus esculentus L.) grown under different salinity gradients. Sustainability 2023, 15, 11590. [Google Scholar] [CrossRef] [Scilit]
- Alyahya, N.; Taybi, T. Comparative transcriptomic profiling reveals differentially expressed genes and important related metabolic pathways in shoots and roots of a Saudi wheat cultivar (Najran) under salinity stress. Front. Plant Sci. 2023, 14, 1225541. [Google Scholar] [CrossRef] [Scilit] [PubMed]
- Fu, H.; Yang, Y. How plants tolerate salt stress. Curr. Issues Mol. Biol. 2023, 45, 5914–5934. [Google Scholar] [CrossRef] [Scilit] [PubMed]
- Gruda, N.S.; Dong, J.; Li, X. From salinity to nutrient-rich vegetables: Strategies for quality enhancement in protected cultivation. Crit. Rev. Plant Sci. 2024, 43, 327–347. [Google Scholar] [CrossRef] [Scilit]
- Chen, G.; Zheng, D.; Feng, N.; Zhou, H.; Mu, D.; Zhao, L.; Shen, X.; Rao, G.; Meng, F.; Huang, A. Physiological mechanisms of ABA-induced salinity tolerance in leaves and roots of rice. Sci. Rep. 2022, 12, 8228. [Google Scholar] [CrossRef] [Scilit] [PubMed]
- Singh, D. Juggling with reactive oxygen species and antioxidant defense system—A coping mechanism under salt stress. Plant Stress 2022, 5, 100093. [Google Scholar] [CrossRef] [Scilit]
- Li, J.; Yang, Y. How do plants maintain pH and ion homeostasis under saline-alkali stress? Front. Plant Sci. 2023, 14, 1217193. [Google Scholar] [CrossRef] [Scilit]
- Ma, L.; Li, W.; Zhang, K.; Zhang, Q.; Xu, H.; Wang, B.; Wang, L.; Zou, J. ZmPRN1 negatively regulates salt stress tolerance by modulating ROS homeostasis in maize (Zea mays L.). Plants 2026, 15, 1585. [Google Scholar] [CrossRef] [Scilit]
- Usman, M.; Wang, L.; Sun, W.; An, X.; Sun, Z.; Yu, F.; Liu, R.; Zhang, C. Integrative omics and biotechnological strategies to enhance crop salinity tolerance. J. Plant Growth Regul. 2026, 45, 2646–2671. [Google Scholar] [CrossRef] [Scilit]
- Atta, K.; Mondal, S.; Gorai, S.; Singh, A.P.; Kumari, A.; Ghosh, T.; Roy, A.; Hembram, S.; Gaikwad, D.J.; Mondal, S.; et al. Impacts of salinity stress on crop plants: Improving salt tolerance through genetic and molecular dissection. Front. Plant Sci. 2023, 14, 1241736. [Google Scholar] [CrossRef] [Scilit]
- Bahadur, A.; Singh, P.M.; Rai, N.; Singh, A.K.; Singh, A.K.; Karkute, S.G.; Behera, T.K. Grafting in vegetables to improve abiotic stress tolerance, yield and quality. J. Hortic. Sci. Biotechnol. 2024, 99, 385–403. [Google Scholar] [CrossRef] [Scilit]
- Balasubramaniam, T.; Shen, G.; Esmaeili, N.; Zhang, H. Plants’ response mechanisms to salinity stress. Plants 2023, 12, 2253. [Google Scholar] [CrossRef] [Scilit]
- Xu, J.; Wang, T.; Sun, C.; Liu, P.; Chen, J.; Hou, X.; Yu, T.; Gao, Y.; Liu, Z.; Yang, L.; et al. Eugenol improves salt tolerance via enhancing antioxidant capacity and regulating ionic balance in tobacco seedlings. Front. Plant Sci. 2024, 14, 1284480. [Google Scholar] [CrossRef] [Scilit]
- Silva, C.B.; Santos, M.A.L.; Santos, D.P.; Santos, C.G.; Santos, V.R.; Sá, M.B.; Santos, R.S.S.; Brandão Júnior, W.Q. Produtividade da alface cultivada em campo e ambiente protegido em resposta às lâminas de irrigação e níveis salinos. Res. Soc. Dev. 2020, 9, e8549109143. [Google Scholar] [CrossRef] [Scilit]
- Adhikari, B.; Olorunwa, O.J.; Horgan, T.E.; Wilson, J.; Barickman, T.C.; Li, T.; Bheemanahalli, R. Seed priming attenuates the impact of salt stress and enhances lettuce yields. J. Agric. Food Res. 2024, 15, 100947. [Google Scholar] [CrossRef] [Scilit]
- Baz, H.; Creech, M.; Chen, J.; Gong, H.; Bradford, K.; Huo, H. Water-soluble carbon nanoparticles improve seed germination and post-germination growth of lettuce under salinity stress. Agronomy 2020, 10, 1192. [Google Scholar] [CrossRef] [Scilit]
- Carillo, P.; Raimondi, G.; Kyriacou, M.C.; Pannico, A.; El-Nakhel, C.; Cirillo, V.; Colla, G.; De Pascale, S.; Rouphael, Y. Morpho-physiological and homeostatic adaptive responses triggered by omeprazole enhance lettuce tolerance to salt stress. Sci. Hortic. 2019, 249, 22–30. [Google Scholar] [CrossRef] [Scilit]
- Cristofano, F.; El-Nakhel, C.; Colla, G.; Cardarelli, M.; Pii, Y.; Lucini, L.; Rouphael, Y. Modulation of morpho-physiological and metabolic profiles of lettuce subjected to salt stress and treated with two vegetal-derived biostimulants. Plants 2023, 12, 709. [Google Scholar] [CrossRef] [Scilit]
- Fedeli, R.; Celletti, S.; Loppi, S. Wood distillate promotes the tolerance of lettuce in extreme salt stress conditions. Plants 2024, 13, 1335. [Google Scholar] [CrossRef] [Scilit]
- Fedeli, R.; Vannini, A.; Djatouf, N.; Celletti, S.; Loppi, S. Can lettuce plants grow in saline soils supplemented with biochar? Heliyon 2024, 10, e26526. [Google Scholar] [CrossRef] [Scilit]
- Li, F.; Yuan, Y.; Gong, P.; Imazumi, Y.; Na, R.; Shimizu, N. Comparative effects of mineral fertilizer and digestate on growth, antioxidant system, and physiology of lettuce under salt stress. Hortic. Environ. Biotechnol. 2023, 64, 379–391. [Google Scholar] [CrossRef] [Scilit]
- Maglione, G.; Vitale, E.; Costanzo, G.; Polimeno, F.; Arena, C.; Vitale, L. Iodine enhances the nutritional value but not the tolerance of lettuce to NaCl. Horticulturae 2022, 8, 662. [Google Scholar] [CrossRef] [Scilit]
- Marka, S.; Zografaki, M.-E.; Karavidas, I.; Ntanasi, T.; Kalloniati, C.; Ntzouvaras, A.; Skliros, D.; Tzovenis, I.; Ntatsi, G.; Moschopoulou, G.; et al. Metabolomic and physiological insights into the biostimulant activity of Chlorella vulgaris extract in hydroponic lettuce under salinity stress. Sci. Hortic. 2026, 355, 114560. [Google Scholar] [CrossRef] [Scilit]
- Marques, I.C.S.; Silva, D.M.R.; Bispo, G.L.; Oliveira, F.A.; Ono, E.O.; Rodrigues, J.D. Nitric oxide modulates salt stress tolerance in lettuce. Stresses 2023, 3, 701–716. [Google Scholar] [CrossRef] [Scilit]
- Sardar, H.; Khalid, Z.; Ahsan, M.; Naz, S.; Nawaz, A.; Ahmad, R.; Razzaq, K.; Wabaidur, S.M.; Jacquard, C.; Širić, I.; et al. Enhancement of salinity stress tolerance in lettuce (Lactuca sativa L.) via foliar application of nitric oxide. Plants 2023, 12, 1115. [Google Scholar] [CrossRef] [Scilit]
- Simko, I.; Zhao, R.; Peng, H. Differential impact of SiO2 foliar application on lettuce response to temperature, salinity, and drought stress. Plants 2025, 14, 1845. [Google Scholar] [CrossRef] [Scilit]
- Xu, C.; Mou, B. Evaluation of lettuce genotypes for salinity tolerance. HortScience 2015, 50, 1441–1446. [Google Scholar] [CrossRef] [Scilit]
- Zhang, G.; Wang, Y.; Wu, K.; Zhang, Q.; Feng, Y.; Miao, Y.; Yan, Z. Exogenous application of chitosan alleviate salinity stress in lettuce (Lactuca sativa L.). Horticulturae 2021, 7, 342. [Google Scholar] [CrossRef] [Scilit]
- Zhou, C.; Shen, H.; Yan, S.; Ma, C.; Leng, J.; Song, Y.; Gao, N. Acetoin promotes plant growth and alleviates saline stress by activating metabolic pathways in lettuce seedlings. Plants 2024, 13, 3312. [Google Scholar] [CrossRef] [Scilit]
- Niu, G.; Sun, Y.; Masabni, J.G. Impact of low and moderate salinity water on plant performance of leafy vegetables in a recirculating NFT System. Horticulturae 2018, 4, 6. [Google Scholar] [CrossRef] [Scilit]
- Imbernón-Mulero, A.; Martínez-Alvarez, V.; Gallego-Elvira, B.; Acosta, J.A.; Maestre-Valero, J.F. Lettuce growth under desalinated seawater irrigation: Effects on yield, nutrient uptake, and soil properties. J. Soil Sci. Plant Nutr. 2025, 25, 8545–8560. [Google Scholar] [CrossRef] [Scilit]
- Adhikari, B.; Olorunwa, O.J.; Wilson, J.C.; Barickman, T.C. Morphological and physiological response of different lettuce genotypes to salt stress. Stresses 2021, 1, 285–304. [Google Scholar] [CrossRef] [Scilit]
- Aydin, A. Evaluation of salt stress tolerance in lettuce (Lactuca sativa L.) cultivars under hydroponic conditions. Black Sea J. Eng. Sci. 2025, 8, 1339–1348. [Google Scholar] [CrossRef] [Scilit]
- Cavalcante, J.S.J.; Ferreira Neto, M.; Peixoto, T.D.C.; Silva Júnior, M.P.; Rodrigues Filho, R.A.; Araújo, K.F.P.; Andrade, R.A.; Souto, L.S.; Rocha, J.L.A.; Silva, L.A.; et al. Analysis on salinity tolerance of lettuce cultivars under saline irrigation and application of organic acids. Plants 2025, 14, 262. [Google Scholar] [CrossRef] [Scilit]
- Conversa, G.; Bonasia, A.; Lazzizera, C.; Elia, A. Soilless cultivation system, electrical conductivity of nutrient solution, and growing season on yield and quality of baby-leaf oak-leaf lettuce. Agronomy 2021, 11, 1220. [Google Scholar] [CrossRef] [Scilit]
- Corrado, G.; Vitaglione, P.; Giordano, M.; Raimondi, G.; Napolitano, F.; Di Stasio, E.; Di Mola, I.; Mori, M.; Rouphael, Y. Phytochemical responses to salt stress in red and green baby leaf lettuce (Lactuca sativa L.) varieties grown in a floating hydroponic module. Separations 2021, 8, 175. [Google Scholar] [CrossRef] [Scilit]
- Orsini, F.; Pennisi, G.; Mancarella, S.; Al Nayef, M.; Sanoubar, R.; Nicola, S.; Gianquinto, G. Hydroponic lettuce yields are improved under salt stress by utilizing white plastic film and exogenous applications of proline. Sci. Hortic. 2018, 233, 283–293. [Google Scholar] [CrossRef] [Scilit]
- Silva, M.G.; Gheyi, H.R.; Silva, L.L.; Souza, T.T.; Silva, P.C.C.; Queiroz, L.A.; Santos, T.S.; Soares, T.M. Evaluation of salt and root-zone temperature stresses in leafy vegetables using hydroponics as a clean production cultivation technique in northeastern Brazil. Hortic. Environ. Biotechnol. 2024, 65, 95–118. [Google Scholar] [CrossRef] [Scilit]
- Adhikari, B.; Olorunwa, O.J.; Brazel, S.; Barickman, T.C.; Bheemanahalli, R. Impact of salt stress on physiology, leaf mass, and nutrient accumulation in romaine lettuce. Photosynthetica 2023, 61, 342–353. [Google Scholar] [CrossRef] [Scilit]
- Harakotr, B.; Taebuanhuad, S.; Jirakiattikul, Y.; Puangchick, T. Foliar application of bamboo-derived nano-biochar enhances morphological and biochemical responses of lettuce (Lactuca sativa L.) under salt stress. Plants 2026, 15, 9. [Google Scholar] [CrossRef] [Scilit]
- ALKahtani, M.; Hafez, Y.; Attia, K.; Al-Ateeq, T.; Ali, M.A.M.; Hasanuzzaman, M.; Abdelaal, K. Bacillus thuringiensis and silicon modulate antioxidant metabolism and improve the physiological traits to confer salt tolerance in lettuce. Plants 2021, 10, 1025. [Google Scholar] [CrossRef] [Scilit]
- Breś, W.; Kleiber, T.; Markiewicz, B.; Mieloszyk, E.; Mieloch, M. The effect of NaCl stress on the response of lettuce (Lactuca sativa L.). Agronomy 2022, 12, 244. [Google Scholar] [CrossRef] [Scilit]
- Di Mola, I.; Rouphael, Y.; Colla, G.; Fagnano, M.; Paradiso, R.; Mori, M. Morphophysiological traits and nitrate content of greenhouse lettuce as affected by irrigation with saline water. HortScience 2017, 52, 1716–1721. [Google Scholar] [CrossRef] [Scilit]
- Fernández, J.A.; Niñirola, D.; Ochoa, J.; Orsini, F.; Pennisi, G.; Gianquinto, G.; Egea-Gilabert, C. Root adaptation and ion selectivity affects the nutritional value of salt-stressed hydroponically grown baby-leaf Nasturtium officinale and Lactuca sativa. Agric. Food Sci. 2016, 25, 230–239. [Google Scholar] [CrossRef] [Scilit]
- Hirst, A.K.; Anee, S.A.; Housley, M.J.; Qin, K.; Ferrarezi, R.S. Selected beneficial microbes alleviate salinity stress in hydroponic lettuce and pak choi. HortTechnology 2024, 34, 345–352. [Google Scholar] [CrossRef] [Scilit]
- Silva, P.V.S.R. Procedimento para Obtenção das Respostas da Alface à Salinidade em Hidroponia e Solo. Doctoral Dissertation, Federal University of Recôncavo da Bahia, Cruz das Almas, Brazil, December 2023. [Google Scholar]
- Carillo, P.; Giordano, M.; Raimondi, G.; Napolitano, F.; Di Stasio, E.; Kyriacou, M.C.; Sifola, M.I.; Rouphael, Y. Physiological and nutraceutical quality of green and red pigmented lettuce in response to NaCl concentration in two successive harvests. Agronomy 2020, 10, 1358. [Google Scholar] [CrossRef] [Scilit]
- Moncada, A.; Vetrano, F.; Miceli, A. Alleviation of salt stress by plant growth-promoting bacteria in hydroponic leaf lettuce. Agronomy 2020, 10, 1523. [Google Scholar] [CrossRef] [Scilit]
- Vetrano, F.; Moncada, A.; Miceli, A. Use of gibberellic acid to increase the salt tolerance of leaf lettuce and rocket grown in a floating system. Agronomy 2020, 10, 505. [Google Scholar] [CrossRef] [Scilit]
- Dalastra, C.; Oliveira, C.E.S.; Fernandes, G.C.; Jalal, A.; Souza, M.C.; Silva, E.C.; Teixeira Filho, M.C.M. Yield and nutrient use efficiency of lettuce grown at different electrical conductivity levels of hydroponic solutions. Int. J. Veg. Sci. 2026, 32, 115–138. [Google Scholar] [CrossRef] [Scilit]
- Oliveira, C.E.S.; Jalal, A.; Aguilar, J.V.; Camargos, L.S.; Zoz, T.; Ghaley, B.B.; Abdel-Maksoud, M.A.; Alarjani, K.M.; AbdElgawad, H.; Teixeira Filho, M.C.M. Yield, nutrition, and leaf gas exchange of lettuce plants in a hydroponic system in response to Bacillus subtilis inoculation. Front. Plant Sci. 2023, 14, 1248044. [Google Scholar] [CrossRef] [Scilit]
- Oliveira, C.E.S.; Jalal, A.; Vitória, L.S.; Giolo, V.M.; Oliveira, T.J.S.S.; Aguilar, J.V.; Camargos, L.S.; Brambilla, M.R.; Fernandes, G.C.; Vargas, P.F.; et al. Inoculation with Azospirillum brasilense strains AbV5 and AbV6 increases nutrition, chlorophyll, and leaf yield of hydroponic lettuce. Plants 2023, 12, 3107. [Google Scholar] [CrossRef] [Scilit]
- Zappelini, J.; Pescador, R.; Girardello, G.M.; Souza, P.F.; Borghezan, M.; Oliveira, J.L.B. Physiological alterations in ‘Rubinela’ lettuce (Lactuca sativa L.) cultivated in conventional and hydroponic systems. Acta Sci. Agron. 2024, 46, e62502. [Google Scholar] [CrossRef] [Scilit]
- Samarah, N.H.; AL-Quraan, N.A.; AlZyout, R.I.M.; Elrys, A.S. Salinity-induced inhibition of lettuce seed germination in association with altered catalase and endo-β-mannanase activities. Horticulturae 2026, 12, 390. [Google Scholar] [CrossRef] [Scilit]
- Shin, Y.K.; Bhandari, S.R.; Jo, J.S.; Song, J.W.; Cho, M.C.; Yang, E.Y.; Lee, J.G. Response to salt stress in lettuce: Changes in chlorophyll fluorescence parameters, phytochemical contents, and antioxidant activities. Agronomy 2020, 10, 1627. [Google Scholar] [CrossRef] [Scilit]
- Freitas, W.E.S.; Oliveira, A.B.; Mesquita, R.O.; Carvalho, H.H.; Prisco, J.T.; Gomes-Filho, E. Sulfur-induced salinity tolerance in lettuce is due to a better P and K uptake, lower Na/K ratio and an efficient antioxidative defense system. Sci. Hortic. 2019, 257, 108764. [Google Scholar] [CrossRef] [Scilit]
- Leal, L.Y.C.; Souza, E.R.; Santos Júnior, J.A.; Santos, M.A. Comparison of soil and hydroponic cultivation systems for spinach irrigated with brackish water. Sci. Hortic. 2020, 274, 109616. [Google Scholar] [CrossRef] [Scilit]
- Silva, M.G.; Soares, T.M.; Gheyi, H.R.; Oliveira, M.G.B.; Santos, C.C. Hydroponic cultivation of coriander using fresh and brackish waters with different temperatures of the nutrient solution. Eng. Agríc. 2020, 40, 674–683. [Google Scholar] [CrossRef] [Scilit]
- Alves, M.S.; Soares, T.M.; Silva, L.T.; Fernandes, J.P.; Oliveira, M.L.A.; Paz, V.P.S. Estratégias de uso de água salobra na produção de alface em hidroponia NFT. Rev. Bras. Eng. Agríc. Ambient. 2011, 15, 491–498. [Google Scholar] [CrossRef] [Scilit]
- Costa, L.F.; Azevedo Neto, A.D.; Soares, T.M.; Santos, I.L.N.; Silva, M.G.; Silva, P.V.S.R.; Ferreira, W.J.O.; Rosario, A.S. Produtividade e tolerância salina da alface e da rúcula em diferentes sistemas hidropônicos com águas salobras. Water Resour. Irrig. Manag. 2025, 14, 88–108. [Google Scholar]
- Cova, A.M.W.; Freitas, F.T.O.; Viana, P.C.; Rafael, M.R.S.; Azevedo Neto, A.D.; Soares, T.M. Content of inorganic solutes in lettuce grown with brackish water in different hydroponic systems. Rev. Bras. Eng. Agríc. Ambient. 2017, 21, 150–155. [Google Scholar] [CrossRef] [Scilit]
- Freitas, F.T.O.; Soares, T.M.; Silva, M.G.; Rafael, M.R.S. Cultivo de alface sob intervalos de recirculações das soluções nutritivas em sistemas hidropônicos usando água salobra. Irriga 2021, 1, 67–96. [Google Scholar] [CrossRef] [Scilit]
- Silva, J.S.; Paz, V.P.S.; Soares, T.M.; Almeida, W.F.; Fernandes, J.P. Production of lettuce with brackish water in NFT hydroponic system. Semina Ciênc. Agrár. 2018, 39, 947–962. [Google Scholar] [CrossRef] [Scilit]
- Soares, H.R.; Silva, Ê.F.F.; Silva, G.F.; Lira, R.M.; Bezerra, R.R. Mineral nutrition of crisphead lettuce grown in a hydroponic system with brackish water. Rev. Caatinga 2016, 29, 656–664. [Google Scholar] [CrossRef] [Scilit]
- Soares, H.R.; Silva, Ê.F.F.; Silva, G.F.; Pedrosa, E.M.R.; Rolim, M.M.; Santos, A.N. Lettuce growth and water consumption in NFT hydroponic system using brackish water. Rev. Bras. Eng. Agríc. Ambient. 2015, 19, 636–642. [Google Scholar] [CrossRef] [Scilit]
- Soares, H.R.; Santos Júnior, J.A.; Silva, Ê.F.F.; Rolim, M.M.; Silva, G.F. Water and physiological relationships of lettuce cultivated in hydroponics with brackish waters. Rev. Ciênc. Agron. 2019, 50, 216–222. [Google Scholar] [CrossRef] [Scilit]
- Guimarães, R.F.B.; Nascimento, R.; Melo, D.F.; Ramos, J.G.; Pereira, M.O.; Cardoso, J.A.F.; Lima, S.C. Production of hydroponic lettuce under different salt levels of nutritive solution. J. Agric. Sci. 2017, 9, 242–252. [Google Scholar] [CrossRef] [Scilit]
- Silva, A.C.R.A.; Silva, G.F.; Menezes, S.M.; Cruz, R.Í.F.; Santos Júnior, J.A.; Rolim, M.M. Accumulation of cations in lettuce cultivars under low-cost hydroponic system with brackish waters. Rev. Bras. Eng. Agríc. Ambient. 2021, 25, 833–839. [Google Scholar] [CrossRef] [Scilit]
- Xavier, J.F.; Azevedo, C.A.V.; Sales, J.C.R.; Azevedo, M.R.Q.A.; Fernandes, J.D.; Lima, V.L.A.; Gomes, J.P.; Monteiro Filho, A.F. Salinity levels in growth and production of curly lettuce (Elba, Cristina and Veneranda) grown in hydroponic system. Aust. J. Crop Sci. 2021, 15, 73–81. [Google Scholar] [CrossRef] [Scilit]
- Al Meselmani, M.A. Nutrient solution for hydroponics. In Recent Research and Advances in Soilless Culture; Turan, M., Argin, S., Yildirim, E., Güneş, A., Eds.; IntechOpen: London, UK, 2022; pp. 1–21. [Google Scholar] [CrossRef] [Scilit]
- Pereira, G.S.J.; Silva, M.G.; Sacramento, L.S.; Gheyi, H.R. Crescimento da moringa sob diferentes concentrações das soluções nutritivas preparadas com água salobra. Water Resour. Irrig. Manag. 2025, 14, 139–158. [Google Scholar]
- Gondim, A.R.O.; Flores, M.E.P.; Martinez, H.E.P.; Fontes, P.C.R.; Pereira, P.R.G. Condutividade elétrica na produção e nutrição de alface em sistema de cultivo hidropônico NFT. Biosci. J. 2010, 26, 894–904. [Google Scholar]
- Cunha-Chiamolera, T.P.L.; Urrestarazu, M.; Cecílio Filho, A.B.; Morales, I. Agronomic and economic feasibility of tomato and lettuce intercropping in a soilless system as a function of the electrical conductivity of the nutrient solution. HortScience 2017, 52, 1195–1200. [Google Scholar] [CrossRef] [Scilit]
- Sago, Y.; Shigemura, A. Quantitative nutrient management reduces nitrate accumulation in hydroponic butterhead lettuces grown under artificial lighting. HortScience 2018, 53, 963–967. [Google Scholar] [CrossRef] [Scilit]
- Sublett, W.L.; Barickman, T.C.; Sams, C.E. The effect of environment and nutrients on hydroponic lettuce yield, quality, and phytonutrients. Horticulturae 2018, 4, 48. [Google Scholar] [CrossRef] [Scilit]
- Samarakoon, U.; Palmer, J.; Ling, P.; Altland, J. Effects of electrical conductivity, pH, and foliar application of calcium chloride on yield and tipburn of Lactuca sativa grown using the nutrient–film technique. HortScience 2020, 55, 1265–1271. [Google Scholar] [CrossRef] [Scilit]
- Hosseini, H.; Mozafari, V.; Roosta, H.R.; Shirani, H.; van de Vlasakker, P.C.H.; Farhangi, M. Nutrient use in vertical farming: Optimal electrical conductivity of nutrient solution for growth of lettuce and basil in hydroponic cultivation. Horticulturae 2021, 7, 283. [Google Scholar] [CrossRef] [Scilit]
- Góis, H.M.M.N.; Oliveira, F.A.; Oliveira, R.R.T.; Pinto, F.F.B.; Aroucha, E.M.M.; Queiroz, G.C.M.; Almeida, J.G.L.; Oliveira, C.E.A. Lettuce growing in different hydroponic systems and nutrient concentrations of the nutrient solution. Rev. Bras. Eng. Agríc. Ambient. 2024, 28, e279686. [Google Scholar] [CrossRef] [Scilit]
- Vought, K.; Bayabil, H.K.; Pompeo, J.; Crawford, D.; Zhang, Y.; Correll, M.; Martin-Ryals, A. Dynamics of micro and macronutrients in a hydroponic nutrient film technique system under lettuce cultivation. Heliyon 2024, 10, e32316. [Google Scholar] [CrossRef] [Scilit]
- Dias, G.C.; Machado, R.M.A.; Alves-Pereira, I.; Ferreira, R.A.; Gruda, N.S. Potential of pine bark to replace perlite in coir-based substrates: Effects on nutrient uptake, growth, and phytochemicals in lettuce under two salinity levels. Plants 2025, 14, 2577. [Google Scholar] [CrossRef] [Scilit]
- Kleiber, T.; Treder, J.; Kołton, A.; Krzesiński, W.; Kowalczyk, W.; Kowalski, A.; Wilczyński, A. Different effects of a cultivar and nutrition on the response of lettuce (Lactuca sativa L.) grown in the Nutrient Film Technique (NFT). J. Elem. 2025, 30, 731–755. [Google Scholar] [CrossRef] [Scilit]
- Moreno-Aguilera, C.Y.; Botello-Álvarez, J.E.; Martinez-Nolasco, J.J.; Padilla-Medina, J.A.; Martinez-Nolasco, C.; Herrera-Arroyo, R.O. Hydroponic cultivation experiment monitored by an Internet of Things system. Agrociencia 2025, 59, 1–17. [Google Scholar] [CrossRef] [Scilit]
- Silva, W.A.V.; Faria, G.; Guedes Filho, O.; Mazzini-Guedes, R.B. Hydroponic lettuce cultivated under different electrical conductivities in the Kratky method. Bragantia 2025, 84, e20250076. [Google Scholar] [CrossRef] [Scilit]
- İkiz, B.; Dasgan, H.Y.; Balik, S.; Kusvuran, S.; Gruda, N.S. The use of biostimulants as a key to sustainable hydroponic lettuce farming under saline water stress. BMC Plant Biol. 2024, 24, 808. [Google Scholar] [CrossRef] [Scilit]
- Marques, I.C.S.; Rodrigues, J.D.; Ono, E.O.; Silva, D.M.R.; Bispo, G.L.; Oliveira, F.A. Protective effect of nitric oxide on lettuce plants subjected to salt stress in semi-hydroponic system. Acta Physiol. Plant. 2024, 46, 19. [Google Scholar] [CrossRef] [Scilit]
- Abdelkader, M.; Voronina, L.; Shelepova, O.; Puchkov, M.; Loktionova, E.; Zhanbyrshina, N.; Yelnazarkyzy, R.; Tleppayeva, A.; Ksenofontov, A. Monitoring role of exogenous amino acids on the proteinogenic and ionic responses of lettuce plants under salinity stress conditions. Horticulturae 2023, 9, 626. [Google Scholar] [CrossRef] [Scilit]
- Abdelkader, M.; Voronina, L.; Baratova, L.; Shelepova, O.; Zargar, M.; Puchkov, M.; Loktionova, E.; Amantayev, B.; Kipshakbaeva, A.; Arinov, B. Biostimulants-based amino acids augment physio-biochemical responses and promote salinity tolerance of lettuce plants (Lactuca sativa L.). Horticulturae 2023, 9, 807. [Google Scholar] [CrossRef] [Scilit]
- Silva, M.G.; Soares, T.M.; Gheyi, H.R.; Costa, I.P.; Vasconcelos, R.S. Growth, production and water consumption of coriander grown under different recirculation intervals and nutrient solution depths in hydroponic channels. Emir. J. Food Agric. 2020, 32, 281–294. [Google Scholar] [CrossRef] [Scilit]
- Hawash, A.M.; Mohamed, M.H.; Shehata, A.S.A. The influence of root zone temperature of nutrient solution on lettuce grown in hydroponic systems. Egypt. J. Soil Sci. 2025, 65, 1555–1567. [Google Scholar] [CrossRef] [Scilit]
- Zhao, Z.; Cai, Y.; Gu, C.; Xu, H.; Teng, Y.; Guo, W. The effects of root-zone temperature regulation on the growth and quality of hydroponic lettuce in summer. Agronomy 2025, 15, 2768. [Google Scholar] [CrossRef] [Scilit]
- Cai, Y.; Zhao, Z.; Guo, W.; Xu, H.; Teng, Y.; Han, X.; Zhao, Q.; Wang, L. Smart nutrient solution temperature control system for oversummering lettuce cultivation based on adaptive dung beetle optimizer-fuzzy PID. Appl. Sci. 2025, 15, 5381. [Google Scholar] [CrossRef] [Scilit]
- Langenfeld, N.J.; Pinto, D.F.; Faust, J.E.; Heins, R.; Bugbee, B. Principles of nutrient and water management for indoor agriculture. Sustainability 2022, 14, 10204. [Google Scholar] [CrossRef] [Scilit]
- Fathidarehnijeh, E.; Nadeem, M.; Cheema, M.; Thomas, R.; Krishnapillai, M.; Galagedara, L. Current perspective on nutrient solution management strategies to improve the nutrient and water use efficiency in hydroponic systems. Can. J. Plant Sci. 2023, 104, 88–102. [Google Scholar] [CrossRef] [Scilit]
- Kudirka, G.; Viršilė, A.; Sutulienė, R.; Laužikė, K.; Samuolienė, G. Precise management of hydroponic nutrient solution pH: The effects of minor pH changes and MES buffer molarity on lettuce physiological properties. Horticulturae 2023, 9, 837. [Google Scholar] [CrossRef] [Scilit]
- Oliveira, F.A.; Silva, D.D.; Santos, S.T.; Oliveira, M.K.T.; Nascimento, L.; Silva, R.T.; Sousa Neto, O.N.; Pinto, F.F.B. Mineral nutrition and hydroponic kale production under saline stress and calcium nitrate. Hortic. Bras. 2023, 41, e2615. [Google Scholar] [CrossRef] [Scilit]
- Campos, F.V.; Oliveira, J.A.; Pereira, M.G.; Farnese, F.S. Nitric oxide and phytohormone interactions in the response of Lactuca sativa to salinity stress. Planta 2019, 250, 1475–1489. [Google Scholar] [CrossRef] [Scilit]
- Silva, P.C.C.; Gheyi, H.R.; Jesus, M.J.S.; Correia, M.R.S.; Azevedo Neto, A.D. Seed priming with hydrogen peroxide enhances tolerance to salt stress of hydroponic lettuce. Rev. Bras. Eng. Agríc. Ambient. 2023, 27, 704–711. [Google Scholar] [CrossRef] [Scilit]
- Furlani, P.R.; Silveira, L.C.P.; Bolonhezi, D.; Faquin, V. Cultivo Hidropônico de Plantas; Boletim Técnico, 180; Instituto Agronômico: Campinas, Brazil, 1999; 52p.
- Silva, M.G.; Costa, L.F.; Soares, T.M.; Gheyi, H.R. Growth and yield of cauliflower with brackish waters under hydroponic conditions. Rev. Bras. Eng. Agríc. Ambient. 2023, 27, 663–672. [Google Scholar] [CrossRef] [Scilit]
- Targino, A.J.O.; Oliveira, F.A.; Oliveira, M.K.T.; Régis, L.R.L.; Morais Neta, H.M.; Cordeiro, C.J.X.; Alves, F.A.T.; Nascimento, L.V.; Pessoa, V.G.; Oliveira, A.A.A.; et al. Lettuce growth in different pot volumes and irrigation frequencies under saline stress. J. Agric. Sci. 2019, 11, 494–503. [Google Scholar] [CrossRef] [Scilit]
- Acikbas, S.; Bulut, A.T. The effect of hormonal priming on morphological characteristics and antioxidant enzyme activities in silage maize under salt stress. Sustainability 2025, 17, 8917. [Google Scholar] [CrossRef] [Scilit]
- Ferreira, D.F. Sisvar: A computer statistical analysis system. Ciênc. Agrotec. 2011, 35, 1039–1042. [Google Scholar] [CrossRef] [Scilit]
- R Core Team. R: A Language and Environment for Statistical Computing; R Foundation for Statistical Computing: Vienna, Austria, 2024; Available online: https://www.r-project.org/ (accessed on 7 November 2024).
- González, F.; Santander, C.; Ruiz, A.; Pérez, R.; Moreira, J.; Vidal, G.; Aroca, R.; Santos, C.; Cornejo, P. Inoculation with Actinobacteria spp. isolated from a hyper-arid environment enhances tolerance to salinity in lettuce plants (Lactuca sativa L.). Plants 2023, 12, 2018. [Google Scholar] [CrossRef] [Scilit]
- Abdelkader, M.; Suliman, A.A.; Salem, S.S.; Assiya, A.; Voronina, L.; Puchkov, M.; Loktionova, E.; Bhuker, A.; Ataya, F.S.; Mahmoud, M.H.; et al. Studying the combined impact of salinity and drought stress-simulated conditions on physio-biochemical characteristics of lettuce plant. Horticulturae 2024, 10, 1186. [Google Scholar] [CrossRef] [Scilit]
- Zhao, C.; Zhang, H.; Song, C.; Zhu, J.-K.; Shabala, S. Mechanisms of plant responses and adaptation to soil salinity. Innovation 2020, 1, 100017. [Google Scholar] [CrossRef] [Scilit]
- Gupta, S.; Schillaci, M.; Walker, R.; Smith, P.M.C.; Watt, M.; Roessner, U. Alleviation of salinity stress in plants by endophytic plant-fungal symbiosis: Current knowledge, perspectives and future directions. Plant Soil 2021, 461, 219–244. [Google Scholar] [CrossRef] [Scilit]
- Xiao, F.; Zhou, H. Plant salt response: Perception, signaling, and tolerance. Front. Plant Sci. 2023, 13, 1053699. [Google Scholar] [CrossRef] [Scilit] [PubMed]
- Zuzunaga-Rosas, J.; Calone, R.; Mircea, D.M.; Shakya, R.; Ibáñez-Asensio, S.; Boscaiu, M.; Fita, A.; Moreno-Ramón, H.; Vicente, O. Mitigation of salt stress in lettuce by a biostimulant that protects the root absorption zone and improves biochemical responses. Front. Plant Sci. 2024, 15, 1341714. [Google Scholar] [CrossRef] [Scilit]
- Caprari, C.; Bucci, A.; Ciotola, A.C.; Del Grosso, C.; Dell’Edera, I.; Di Bartolomeo, S.; Di Pilla, D.; Divino, F.; Fortini, P.; Monaco, P.; et al. Microbial biocontrol agents and natural products act as salt stress mitigators in Lactuca sativa L. Plants 2024, 13, 2505. [Google Scholar] [CrossRef] [Scilit]
- Sharaya, R.; Tuteja, N.; Gill, R.; Gill, S.S. Reactive oxygen species (ROS) scavenging and methylglyoxal (MG) detoxification confers salinity tolerance in mustard cultivars inoculated with Piriformospora (Serendipita) indica. S. Afr. J. Bot. 2023, 163, 630–645. [Google Scholar] [CrossRef] [Scilit]
- Munns, R.; Tester, M. Mechanisms of salinity tolerance. Annu. Rev. Plant Biol. 2008, 59, 651–681. [Google Scholar] [CrossRef] [Scilit]
- Hasanuzzaman, M.; Bhuyan, M.H.M.B.; Anee, T.I.; Parvin, K.; Nahar, K.; Mahmud, J.A.; Fujita, M. Regulation of ascorbate-glutathione pathway in mitigating oxidative damage in plants under abiotic stress. Antioxidants 2019, 8, 384. [Google Scholar] [CrossRef] [Scilit]
- Bali, A.S. Integrating ROS and plant hormone signaling in response to abiotic stress. Discov. Plants 2025, 2, 355. [Google Scholar] [CrossRef] [Scilit]
- Singh, P.; Choudhary, K.K.; Chaudhary, N.; Gupta, S.; Sahu, M.; Tejaswini, B.; Sarkar, S. Salt stress resilience in plants mediated through osmolyte accumulation and its crosstalk mechanism with phytohormones. Front. Plant Sci. 2022, 13, 1006617. [Google Scholar] [CrossRef] [Scilit]
- Raja, V.; Majeed, U.; Kang, H.; Andrabi, K.I.; John, R. Abiotic stress: Interplay between ROS, hormones and MAPKs. Environ. Exp. Bot. 2017, 137, 142–157. [Google Scholar] [CrossRef] [Scilit]
- Ali, M.; Kaderbek, T.; Khan, M.A.; Skalicky, M.; Brestic, M.; Elsabagh, M.; Sabagh, A.E. Biosynthesis and multifaceted roles of reactive species in plant defense mechanisms during environmental cues. Plant Stress 2025, 18, 101102. [Google Scholar] [CrossRef] [Scilit]
- Gupta, B.; Huang, B. Mechanism of salinity tolerance in plants: Physiological, biochemical, and molecular characterization. Int. J. Genom. 2014, 2014, 701596. [Google Scholar] [CrossRef] [Scilit]
- Almeida, D.M.; Oliveira, M.M.; Saibo, N.J.M. Regulation of Na+ and K+ homeostasis in plants: Towards improved salt stress tolerance in crop plants. Genet. Mol. Biol. 2017, 40, 326–345. [Google Scholar] [CrossRef] [Scilit]
- Arif, Y.; Singh, P.; Siddiqui, H.; Bajguz, A.; Hayat, S. Salinity induced physiological and biochemical changes in plants: An omic approach towards salt stress tolerance. Plant Physiol. Biochem. 2020, 156, 64–77. [Google Scholar] [CrossRef] [Scilit]
- Ketehouli, T.; Carther, K.F.I.; Noman, M.; Wang, F.-W.; Li, X.-W.; Li, H.-Y. Adaptation of plants to salt stress: Characterization of Na+ and K+ transporters and role of CBL gene family in regulating salt stress response. Agronomy 2019, 9, 687. [Google Scholar] [CrossRef] [Scilit]
- Shani, M.Y.; Ashraf, M.Y.; Butt, A.K.; Abbas, S.; Nasif, M.; Khan, Z.; Mauro, R.P.; Cannata, C.; Gul, N.; Ghaffar, M.; et al. Potassium nutrition induced salinity mitigation in mungbean [Vigna radiata (L.) Wilczek] by altering biomass and physio-biochemical processes. Horticulturae 2024, 10, 549. [Google Scholar] [CrossRef] [Scilit]
- Hussain, S.J.; Khan, N.A.; Anjum, N.A.; Masood, A.; Khan, M.I.R. Mechanistic elucidation of salicylic acid and sulphur-induced defence systems, nitrogen metabolism, photosynthetic, and growth potential of mungbean (Vigna radiata) under salt stress. J. Plant Growth Regul. 2021, 40, 1000–1016. [Google Scholar] [CrossRef] [Scilit]
- Dehnavi, A.R.; Zahedi, M.; Piernik, A. Understanding salinity stress responses in sorghum: Exploring genotype variability and salt tolerance mechanisms. Front. Plant Sci. 2024, 14, 1296286. [Google Scholar] [CrossRef] [Scilit]
- Munns, R.; Passioura, J.B.; Colmer, T.D.; Byrt, C.S. Osmotic adjustment and energy limitations to plant growth in saline soil. New Phytol. 2020, 225, 1091–1096. [Google Scholar] [CrossRef] [Scilit] [PubMed]
- Mansour, M.M.F. Role of vacuolar membrane transport systems in plant salinity tolerance. J. Plant Growth Regul. 2023, 42, 1364–1401. [Google Scholar] [CrossRef] [Scilit]
- Ribeiro, J.E.S.; Oliveira, P.H.A.; Coêlho, E.S.; Silva, E.F.; Silva, A.G.C.; Fernandes, A.N.; Ferreira, F.N.; Lima, J.V.L.; Silveira, L.M.; Barros Júnior, A.P. Morphophysiological and nutritional responses of West Indian gherkin cultivars under salt stress and exogenous carnitine application. Agronomy 2026, 16, 606. [Google Scholar] [CrossRef] [Scilit]
- Zhang, H.; Zhao, Y.; Zhu, J.-K. Thriving under stress: How plants balance growth and the stress response. Dev. Cell 2020, 55, 529–543. [Google Scholar] [CrossRef] [Scilit] [PubMed]
- Anand, R.; Vardhan, S.; Parihar, A.; Bhatt, D.; Arora, S. Salinity stress mitigation in tomato (Solanum lycopersicum L.): Mechanisms, impacts and copper nanoparticle based solution. Front. Plant Sci. 2026, 17, 1777876. [Google Scholar] [CrossRef] [Scilit]
- Shahid, M.A.; Sarkhosh, A.; Khan, N.; Balal, R.M.; Ali, S.; Rossi, L.; Gómez, C.; Mattson, N.; Nasim, W.; Garcia-Sanchez, F. Insights into the physiological and biochemical impacts of salt stress on plant growth and development. Agronomy 2020, 10, 938. [Google Scholar] [CrossRef] [Scilit]
- Keisham, M.; Mukherjee, S.; Bhatla, S.C. Mechanisms of sodium transport in plants—Progresses and challenges. Int. J. Mol. Sci. 2018, 19, 647. [Google Scholar] [CrossRef] [Scilit] [PubMed]
- Hannachi, S.; Steppe, K.; Eloudi, M.; Mechi, L.; Bahrini, I.; Van Labeke, M.-C. Salt stress induced changes in photosynthesis and metabolic profiles of one tolerant (‘Bonica’) and one sensitive (‘Black Beauty’) eggplant cultivars (Solanum melongena L.). Plants 2022, 11, 590. [Google Scholar] [CrossRef] [Scilit]
- Rouphael, Y.; Kyriacou, M.C. Enhancing quality of fresh vegetables through salinity eustress and biofortification applications facilitated by soilless cultivation. Front. Plant Sci. 2018, 9, 1254. [Google Scholar] [CrossRef] [Scilit]
- Rouphael, Y.; Petropoulos, S.A.; Cardarelli, M.; Colla, G. Salinity as eustressor for enhancing quality of vegetables. Sci. Hortic. 2018, 234, 361–369. [Google Scholar] [CrossRef] [Scilit]
- Ghoname, A.A.; Abou-Hussein, S.D.; El-Tohamy, W.A. Eustress (positive stress) salinity as an enhancement tool for bioactive ingredients and quality characteristics of vegetables: A review. Middle East J. Appl. Sci. 2019, 9, 456–463. [Google Scholar]
- Hossain, M.N.; Sarker, U.; Raihan, M.S.; Al-Huqail, A.A.; Siddiqui, M.H.; Oba, S. Influence of salinity stress on color parameters, leaf pigmentation, polyphenol and flavonoid contents, and antioxidant activity of Amaranthus lividus leafy vegetables. Molecules 2022, 27, 1821. [Google Scholar] [CrossRef] [Scilit] [PubMed]
- Santander, C.; Vidal, G.; Ruiz, A.; Vidal, C.; Cornejo, P. Salinity eustress increases the biosynthesis and accumulation of phenolic compounds that improve the functional and antioxidant quality of red lettuce. Agronomy 2022, 12, 598. [Google Scholar] [CrossRef] [Scilit]
- Güvenaltın, Y.; Demirel, M.; Samet, H.; Kasım, M.U.; Kasım, R. Physiological and quality responses of lettuce to salinity stress and Trichoderma harzianum inoculation. Horticulturae 2026, 12, 472. [Google Scholar] [CrossRef] [Scilit]
- Mahmoudi, H.; Huang, J.; Gruber, M.Y.; Kaddour, R.; Lachaâl, M.; Ouerghi, Z.; Hannoufa, A. The impact of genotype and salinity on physiological function, secondary metabolite accumulation, and antioxidative responses in lettuce. J. Agric. Food Chem. 2010, 58, 5122–5130. [Google Scholar] [CrossRef] [Scilit] [PubMed]
- Kesawat, M.S.; Satheesh, N.; Kherawat, B.S.; Kumar, A.; Kim, H.-U.; Chung, S.-M.; Kumar, M. Regulation of reactive oxygen species during salt stress in plants and their crosstalk with other signaling molecules—Current perspectives and future directions. Plants 2023, 12, 864. [Google Scholar] [CrossRef] [Scilit]
- Hasanuzzaman, M.; Bhuyan, M.H.M.B.; Zulfiqar, F.; Raza, A.; Mohsin, S.M.; Mahmud, J.A.; Fujita, M.; Fotopoulos, V. Reactive oxygen species and antioxidant defense in plants under abiotic stress: Revisiting the crucial role of a universal defense regulator. Antioxidants 2020, 9, 681. [Google Scholar] [CrossRef] [Scilit]
- Das, K.; Roychoudhury, A. Reactive oxygen species (ROS) and response of antioxidants as ROS-scavengers during environmental stress in plants. Front. Environ. Sci. 2014, 2, 53. [Google Scholar] [CrossRef] [Scilit]
- Sewelam, N.; Oshima, Y.; Mitsuda, N.; Ohme-Takagi, M. A step towards understanding plant responses to multiple environmental stresses: A genome-wide study. Plant Cell Environ. 2014, 37, 2024–2035. [Google Scholar] [CrossRef] [Scilit]
- Khataar, M.; Mohammadi, M.H.; Shabani, F. Soil salinity and matric potential interaction on water use, water use efficiency and yield response factor of bean and wheat. Sci. Rep. 2018, 8, 2679. [Google Scholar] [CrossRef] [Scilit]
- Souza, J.R.M.; Leal, L.Y.C.; Paulino, M.K.S.S.; Nunes, J.A.; Medeiros, R.L.S.; Santos, M.A.; Lins, C.M.T.; Souza Júnior, V.S.; Schaffer, B.; Souza, E.R. Cowpea (Vigna unguiculata) water relations, growth, and productivity as affected by salinity in two soils with contrasting mineralogies. Soil Syst. 2025, 9, 36. [Google Scholar] [CrossRef] [Scilit]
- Cruz, A.F.S.; Silva, G.F.; Silva, Ê.F.F.; Soares, H.R.; Santos, J.S.G.; Lira, R.M. Stress index, water potentials and leaf succulence in cauliflower cultivated hydroponically with brackish water. Rev. Bras. Eng. Agríc. Ambient. 2018, 22, 622–627. [Google Scholar] [CrossRef] [Scilit]
- Rouphael, Y.; Carillo, P.; Garcia-Perez, P.; Cardarelli, M.; Senizza, B.; Miras-Moreno, B.; Colla, G.; Lucini, L. Plant biostimulants from seaweeds or vegetal proteins enhance the salinity tolerance in greenhouse lettuce by modulating plant metabolism in a distinctive manner. Sci. Hortic. 2022, 305, 111368. [Google Scholar] [CrossRef] [Scilit]
- Kim, J.Y.; Shin, S.K.; Park, J.W.; Kim, H.N.; Vyavahare, G.D.; Park, J.H. Reducing electrical conductivity of nutrient solution to prevent rhizosphere salt accumulation and its impact on cherry tomato growth and fruit characteristics in hydroponics. Hortic. Environ. Biotechnol. 2025, 66, 1609–1618. [Google Scholar] [CrossRef] [Scilit]
- Albornoz, F.; Lieth, J.H. Over fertilization limits lettuce productivity because of osmotic stress. Chil. J. Agric. Res. 2015, 75, 284–290. [Google Scholar] [CrossRef] [Scilit]
- Silva, M.G.; Soares, T.M.; Oliveira, I.S.; Santos, J.C.S.; Pinho, J.S.; Freitas, T.O.F. Produção de coentro em hidroponia NFT com o uso de águas salobras para reposição do consumo evapotranspirado. Rev. Bras. Agric. Irrig. 2015, 9, 246–258. [Google Scholar] [CrossRef] [Scilit]
- Subedi, P.; Yang, T.; Williams, K.A.; Liu, R.; Pliakoni, E.D.; Rivard, C.L.; Xu, X. Impact of nutrient solution volume during hydroponic production on growth, nutrient content and postharvest characteristics of four leafy greens species. HortScience 2026, 61, 80–90. [Google Scholar] [CrossRef] [Scilit]
- Baiyin, B.; Xiang, Y.; Shao, Y.; Son, J.E.; Yamada, S.; Tagawa, K.; Yang, Q. Effect of nutrient solution flow on lettuce root morphology in hydroponics: A multi-omics analysis of hormone synthesis and signal transduction. Physiol. Plant. 2024, 176, e14435. [Google Scholar] [CrossRef] [Scilit]
- Xiang, Y.; Peng, J.; Shao, Y.; Son, J.E.; Tagawa, K.; Yamada, S.; Yamada, M.; Baiyin, B.; Yang, Q. Auxin responds to flowing nutrient solution to accelerate the root growth of lettuce in hydroponic culture. Int. J. Mol. Sci. 2025, 26, 7742. [Google Scholar] [CrossRef] [Scilit] [PubMed]
- Yang, T.; Samarakoon, U.; Altland, J. Growth, phytochemical concentration, nutrient uptake, and water consumption of butterhead lettuce in response to hydroponic system design and growing season. Sci. Hortic. 2024, 332, 113201. [Google Scholar] [CrossRef] [Scilit]
- Ergun, O.; Dasgan, H.Y.; Isık, O. Effects of microalgae Chlorella vulgaris on hydroponically grown lettuce. Acta Hortic. 2020, 1273, 169–176. [Google Scholar] [CrossRef] [Scilit]
- Dasgan, H.Y.; Yilmaz, D.; Zikaria, K.; Ikiz, B.; Gruda, N.S. Enhancing the yield, quality and antioxidant content of lettuce through innovative and eco-friendly biofertilizer practices in hydroponics. Horticulturae 2023, 9, 1274. [Google Scholar] [CrossRef] [Scilit]
- Ikiz, B.; Dasgan, H.Y.; Gruda, N.S. Utilizing the power of plant growth promoting rhizobacteria on reducing mineral fertilizer, improved yield, and nutritional quality of Batavia lettuce in a floating culture. Sci. Rep. 2024, 14, 1616. [Google Scholar] [CrossRef] [Scilit]
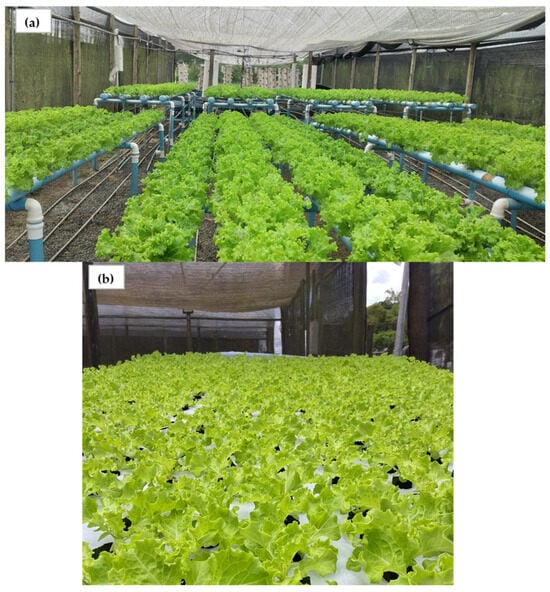
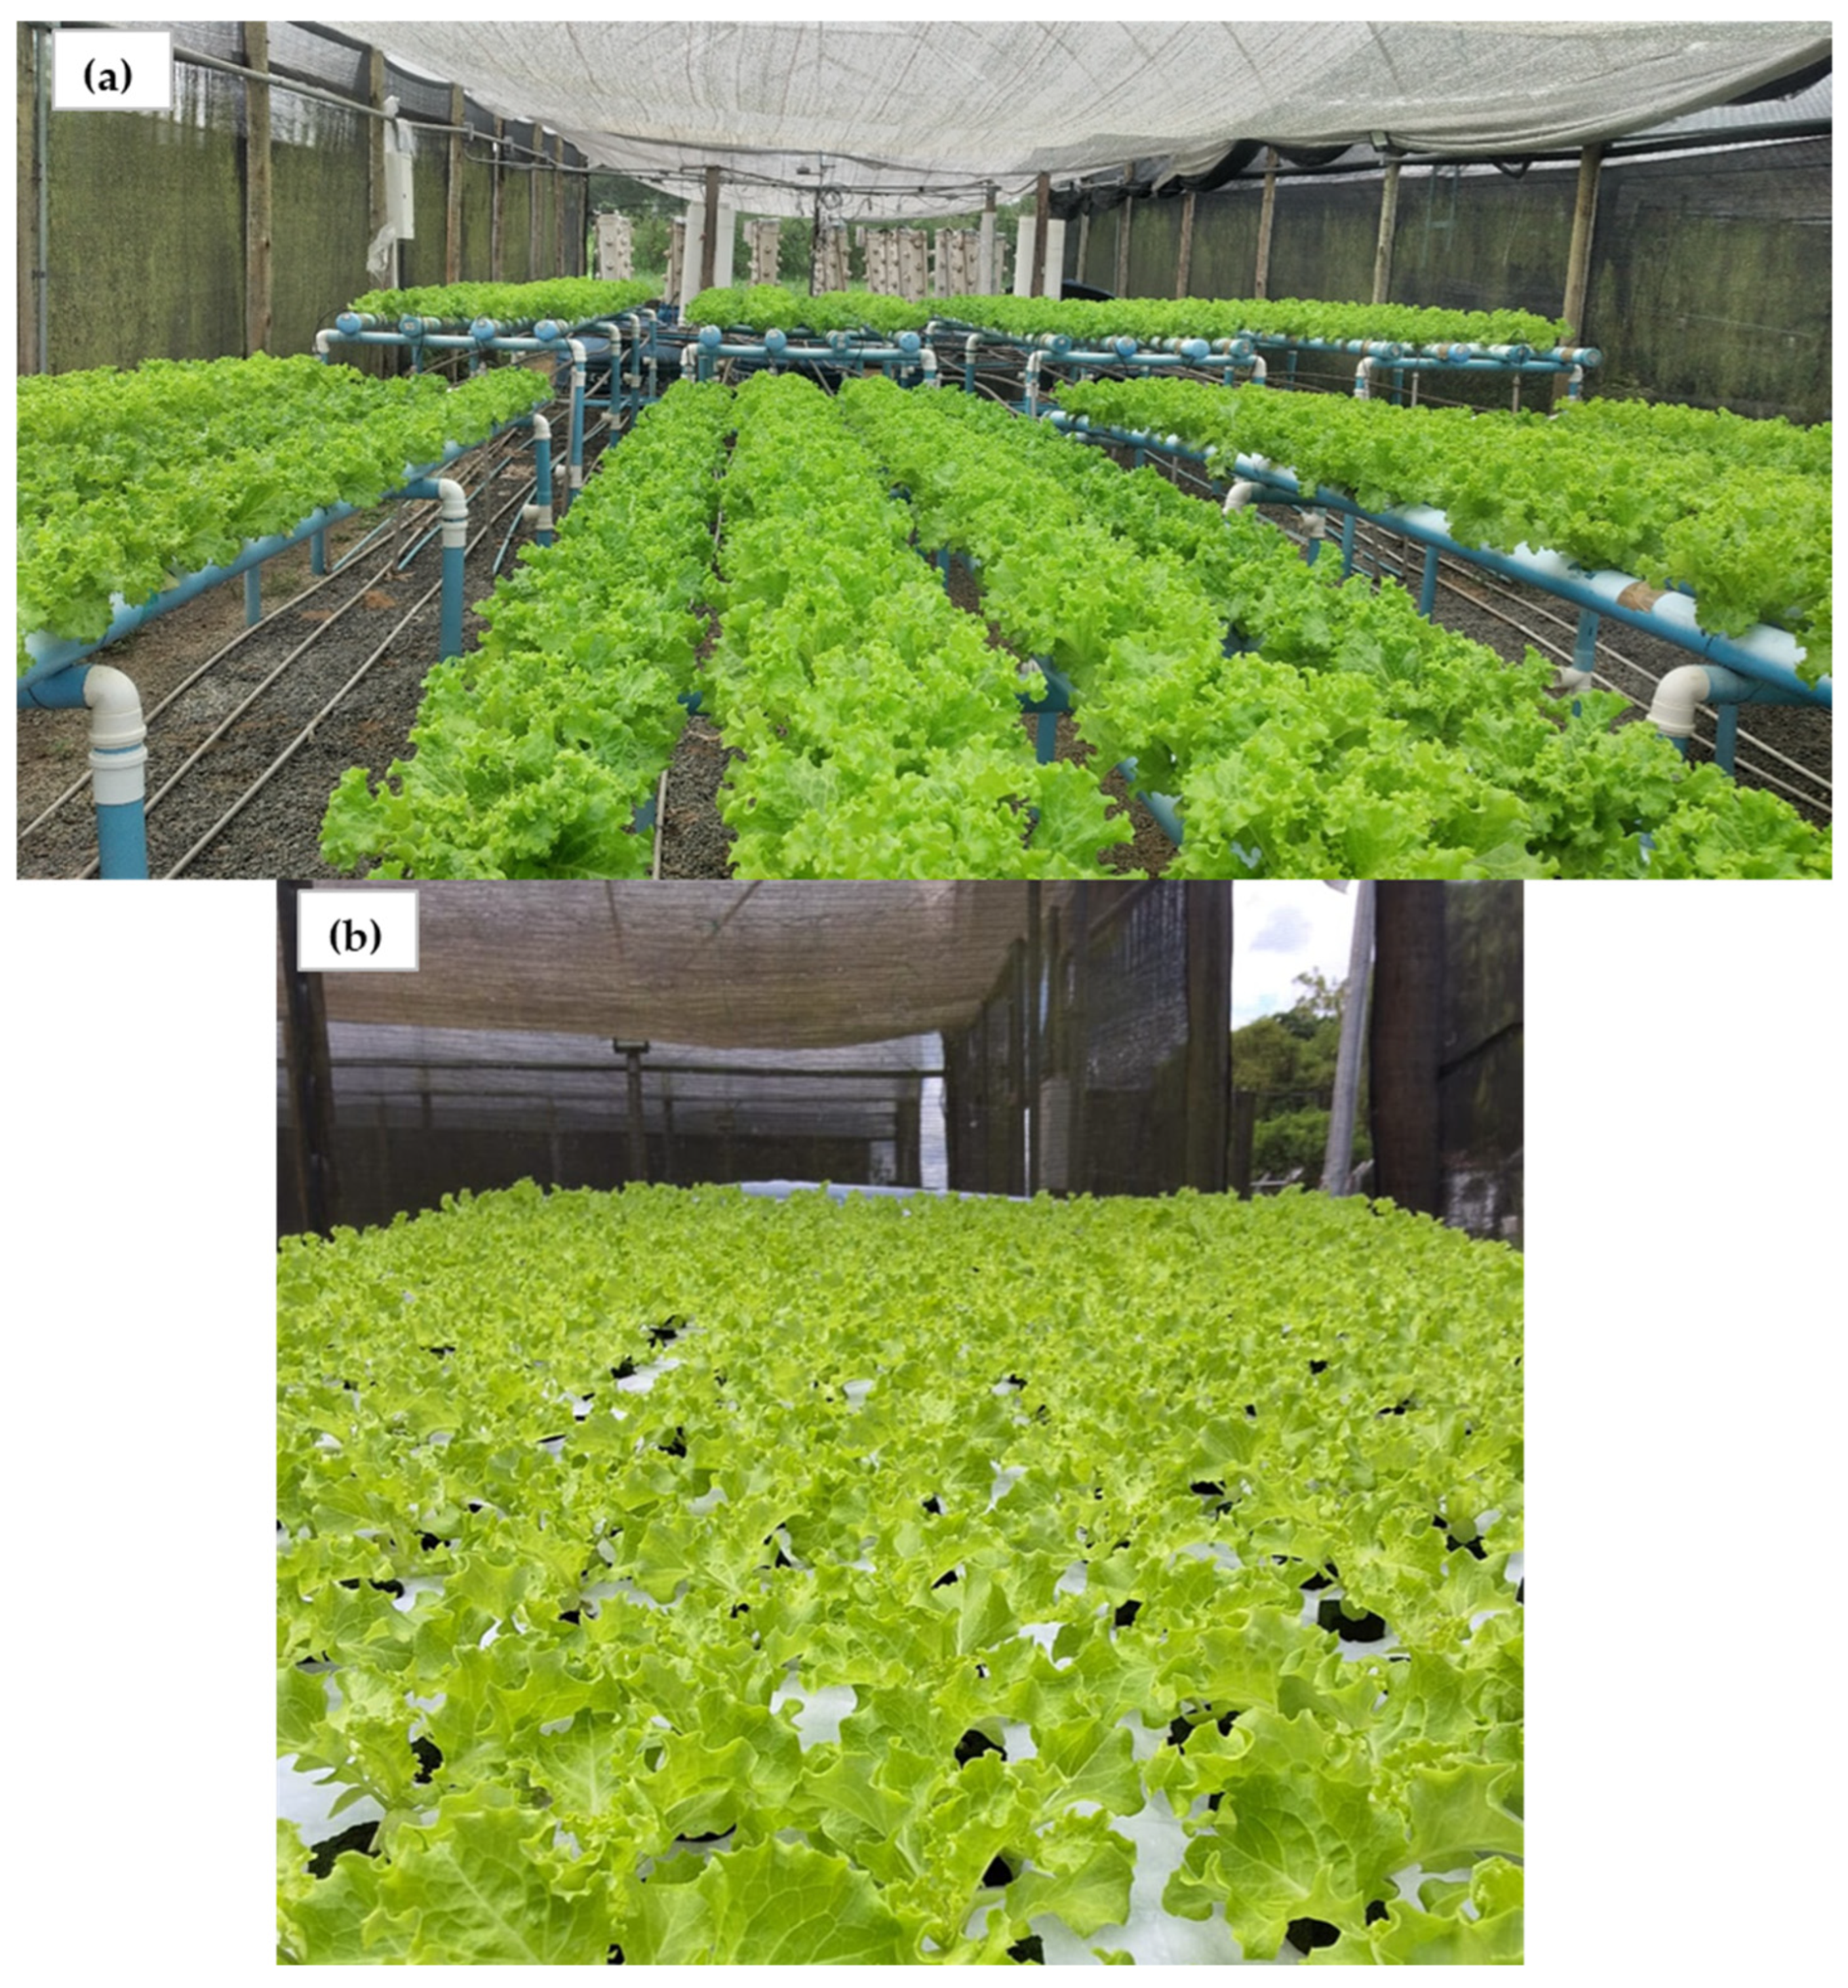
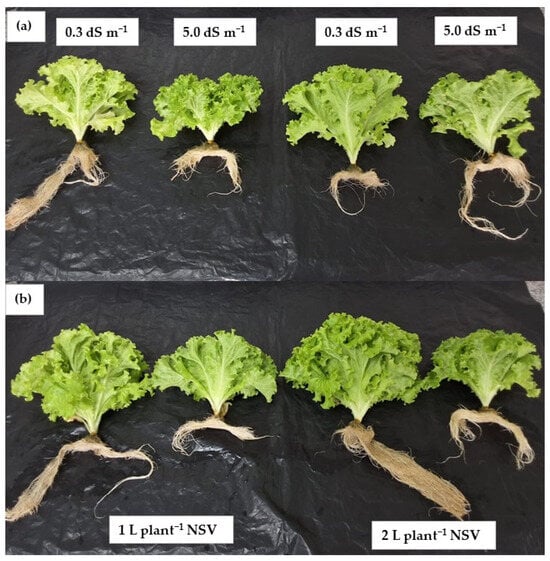
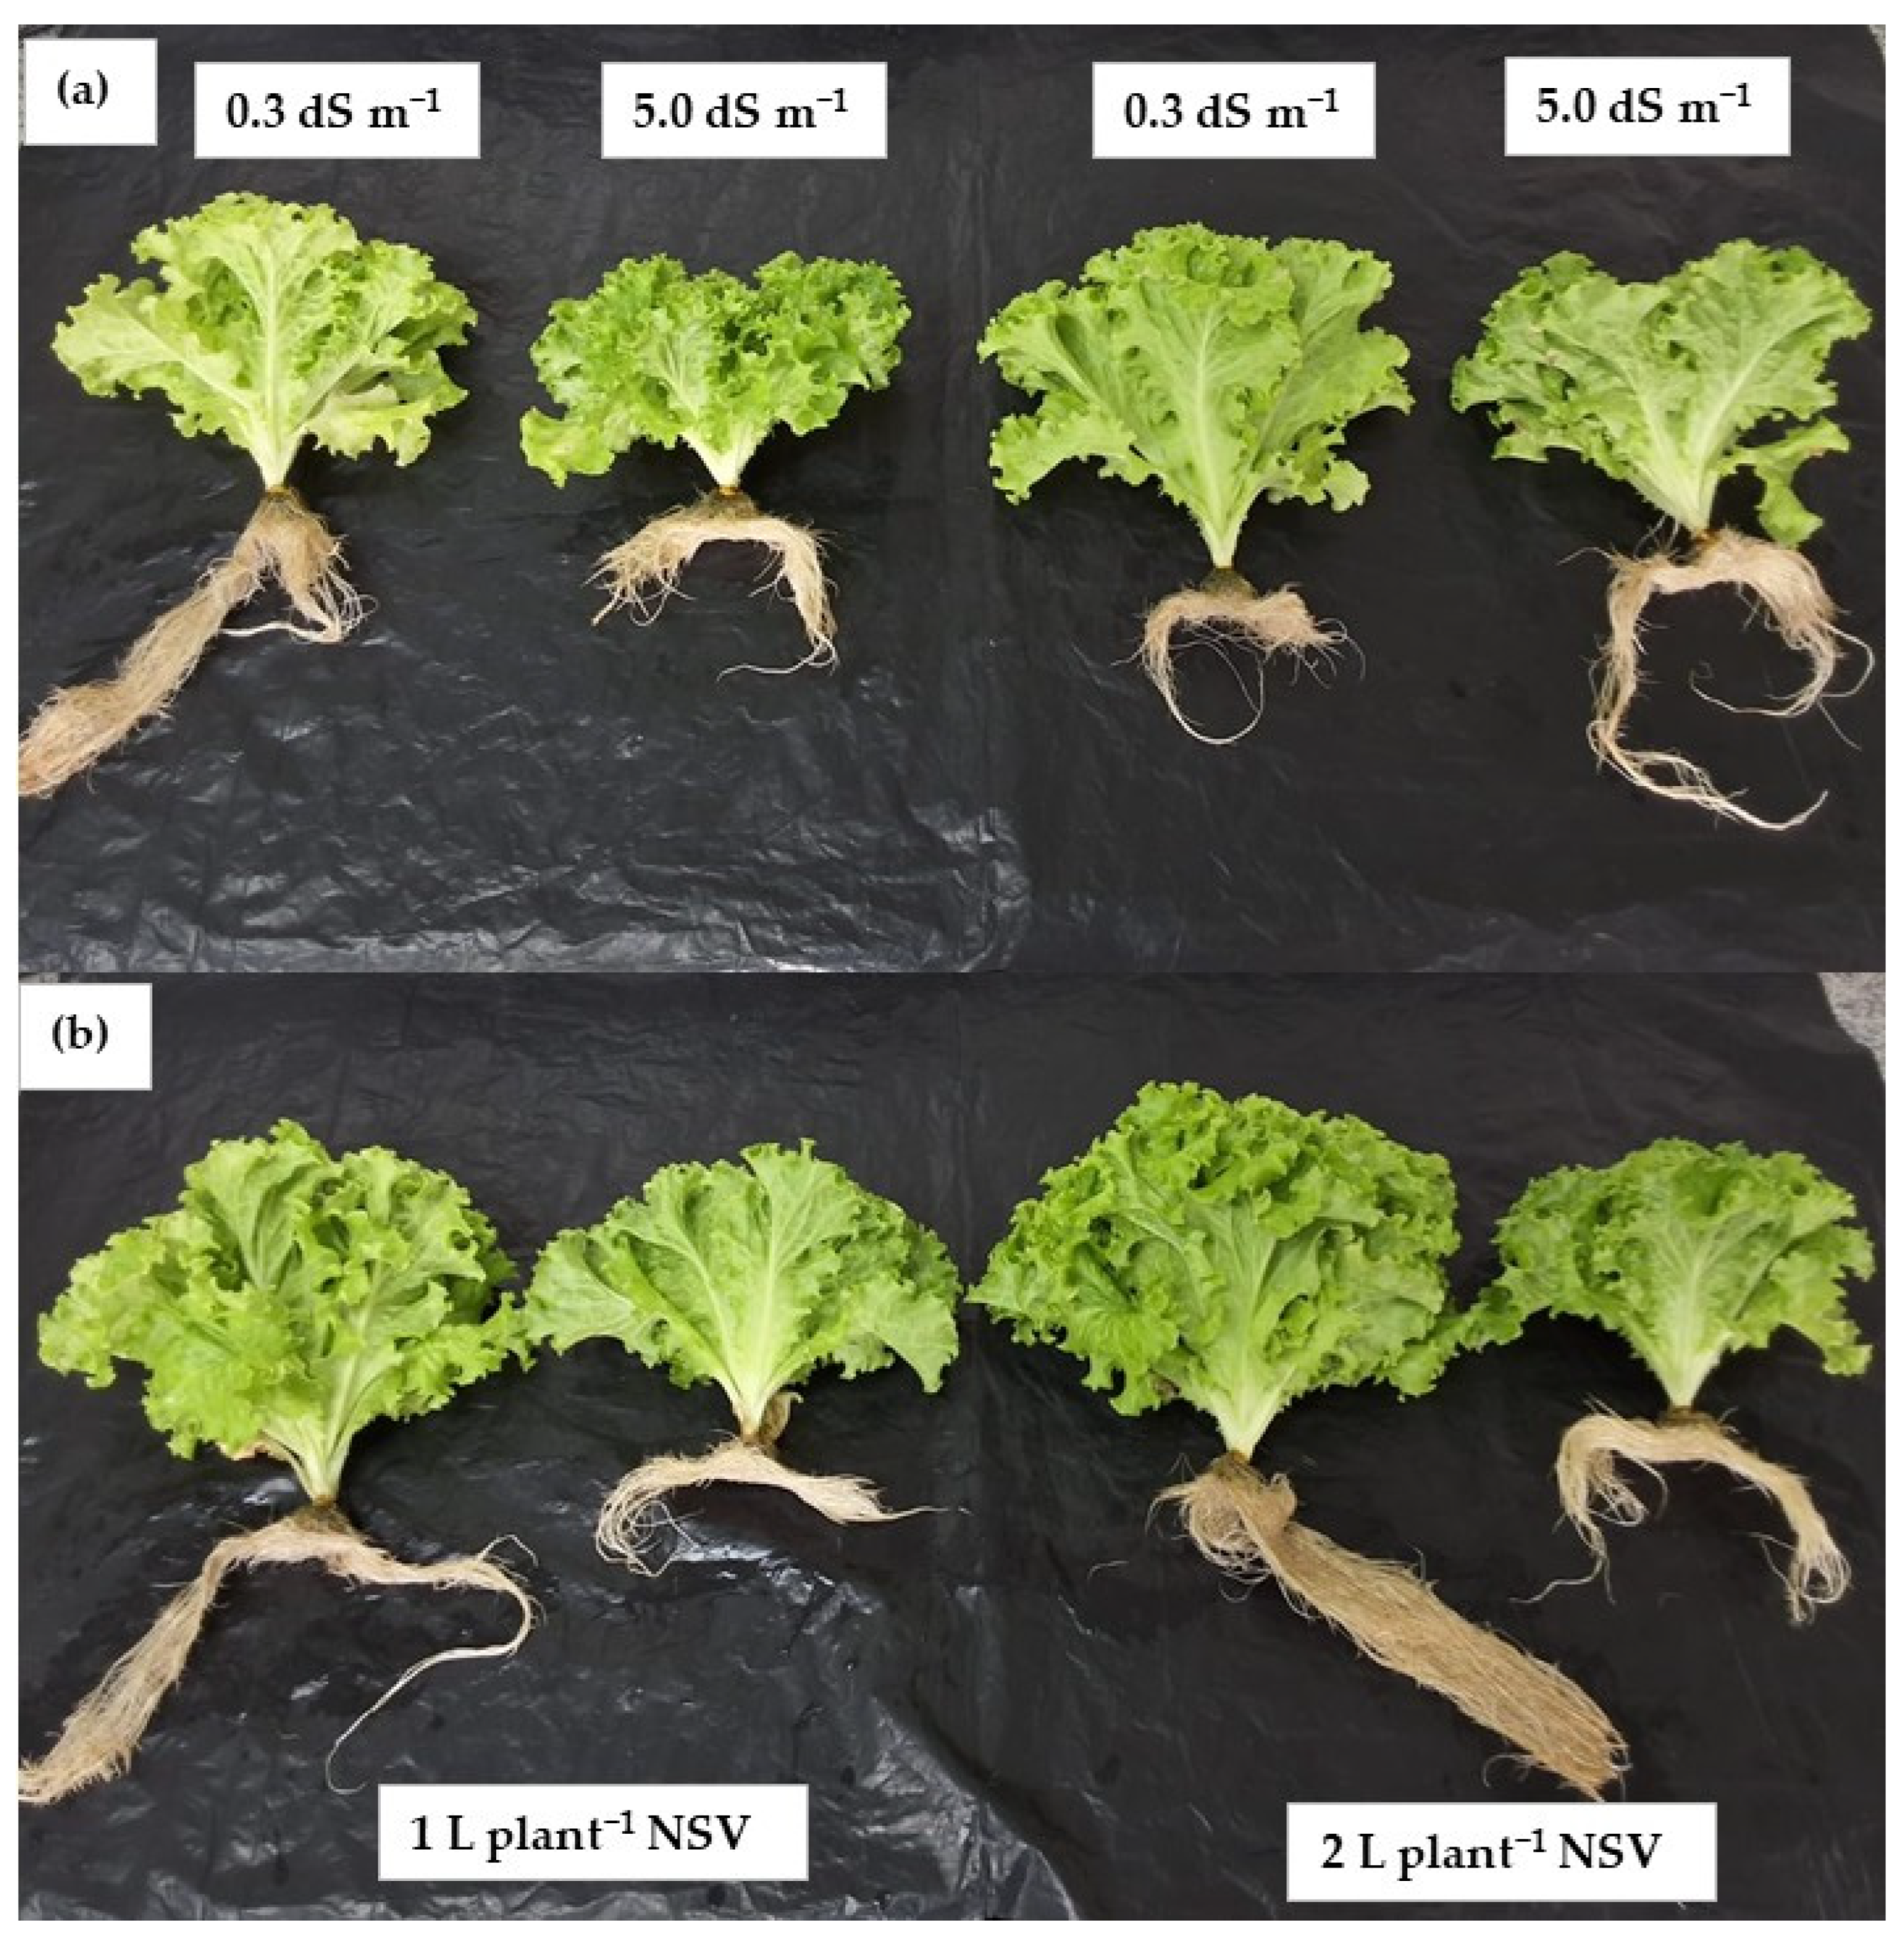
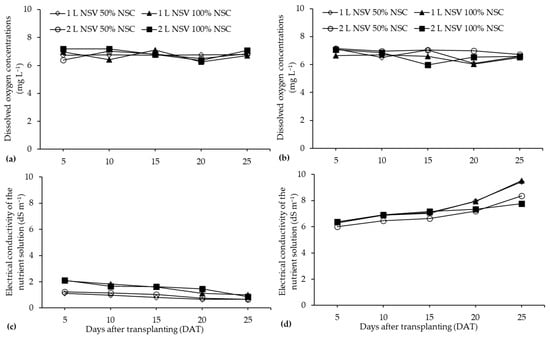
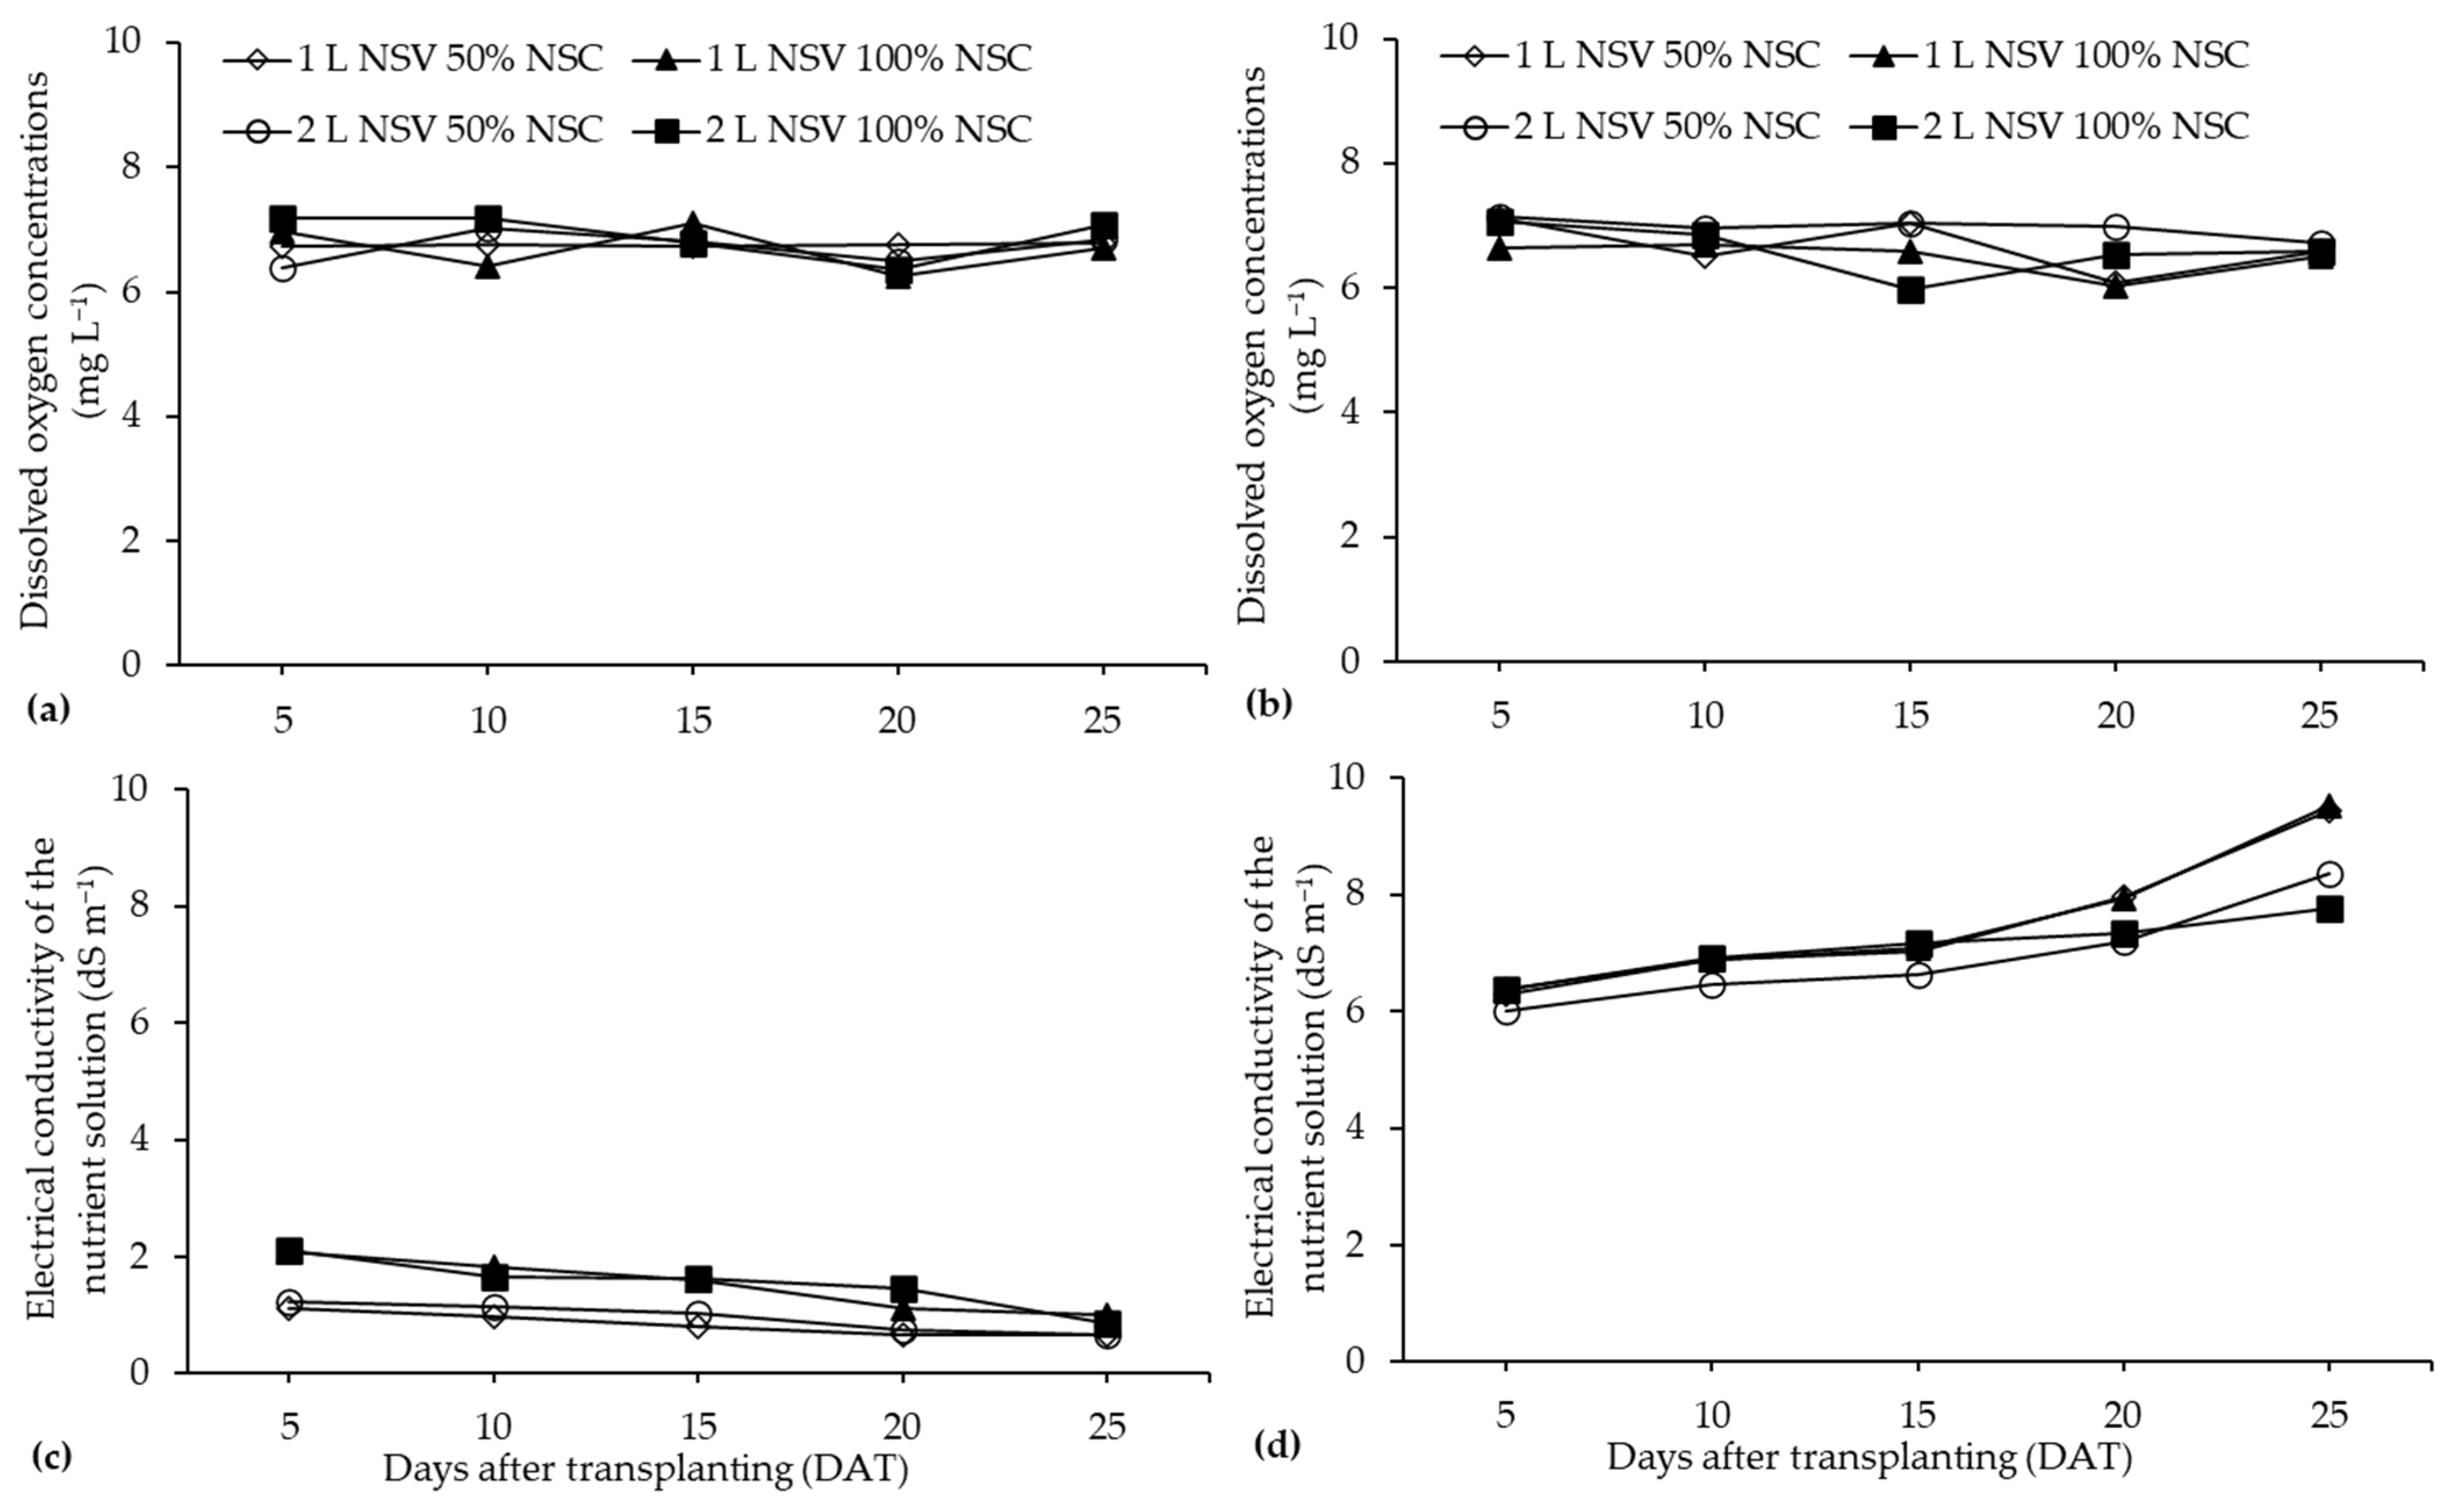
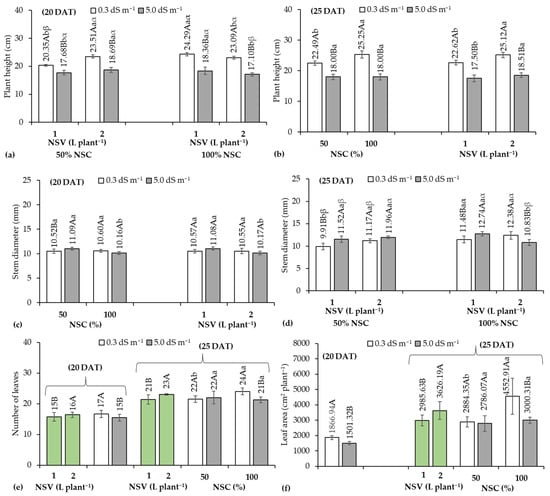
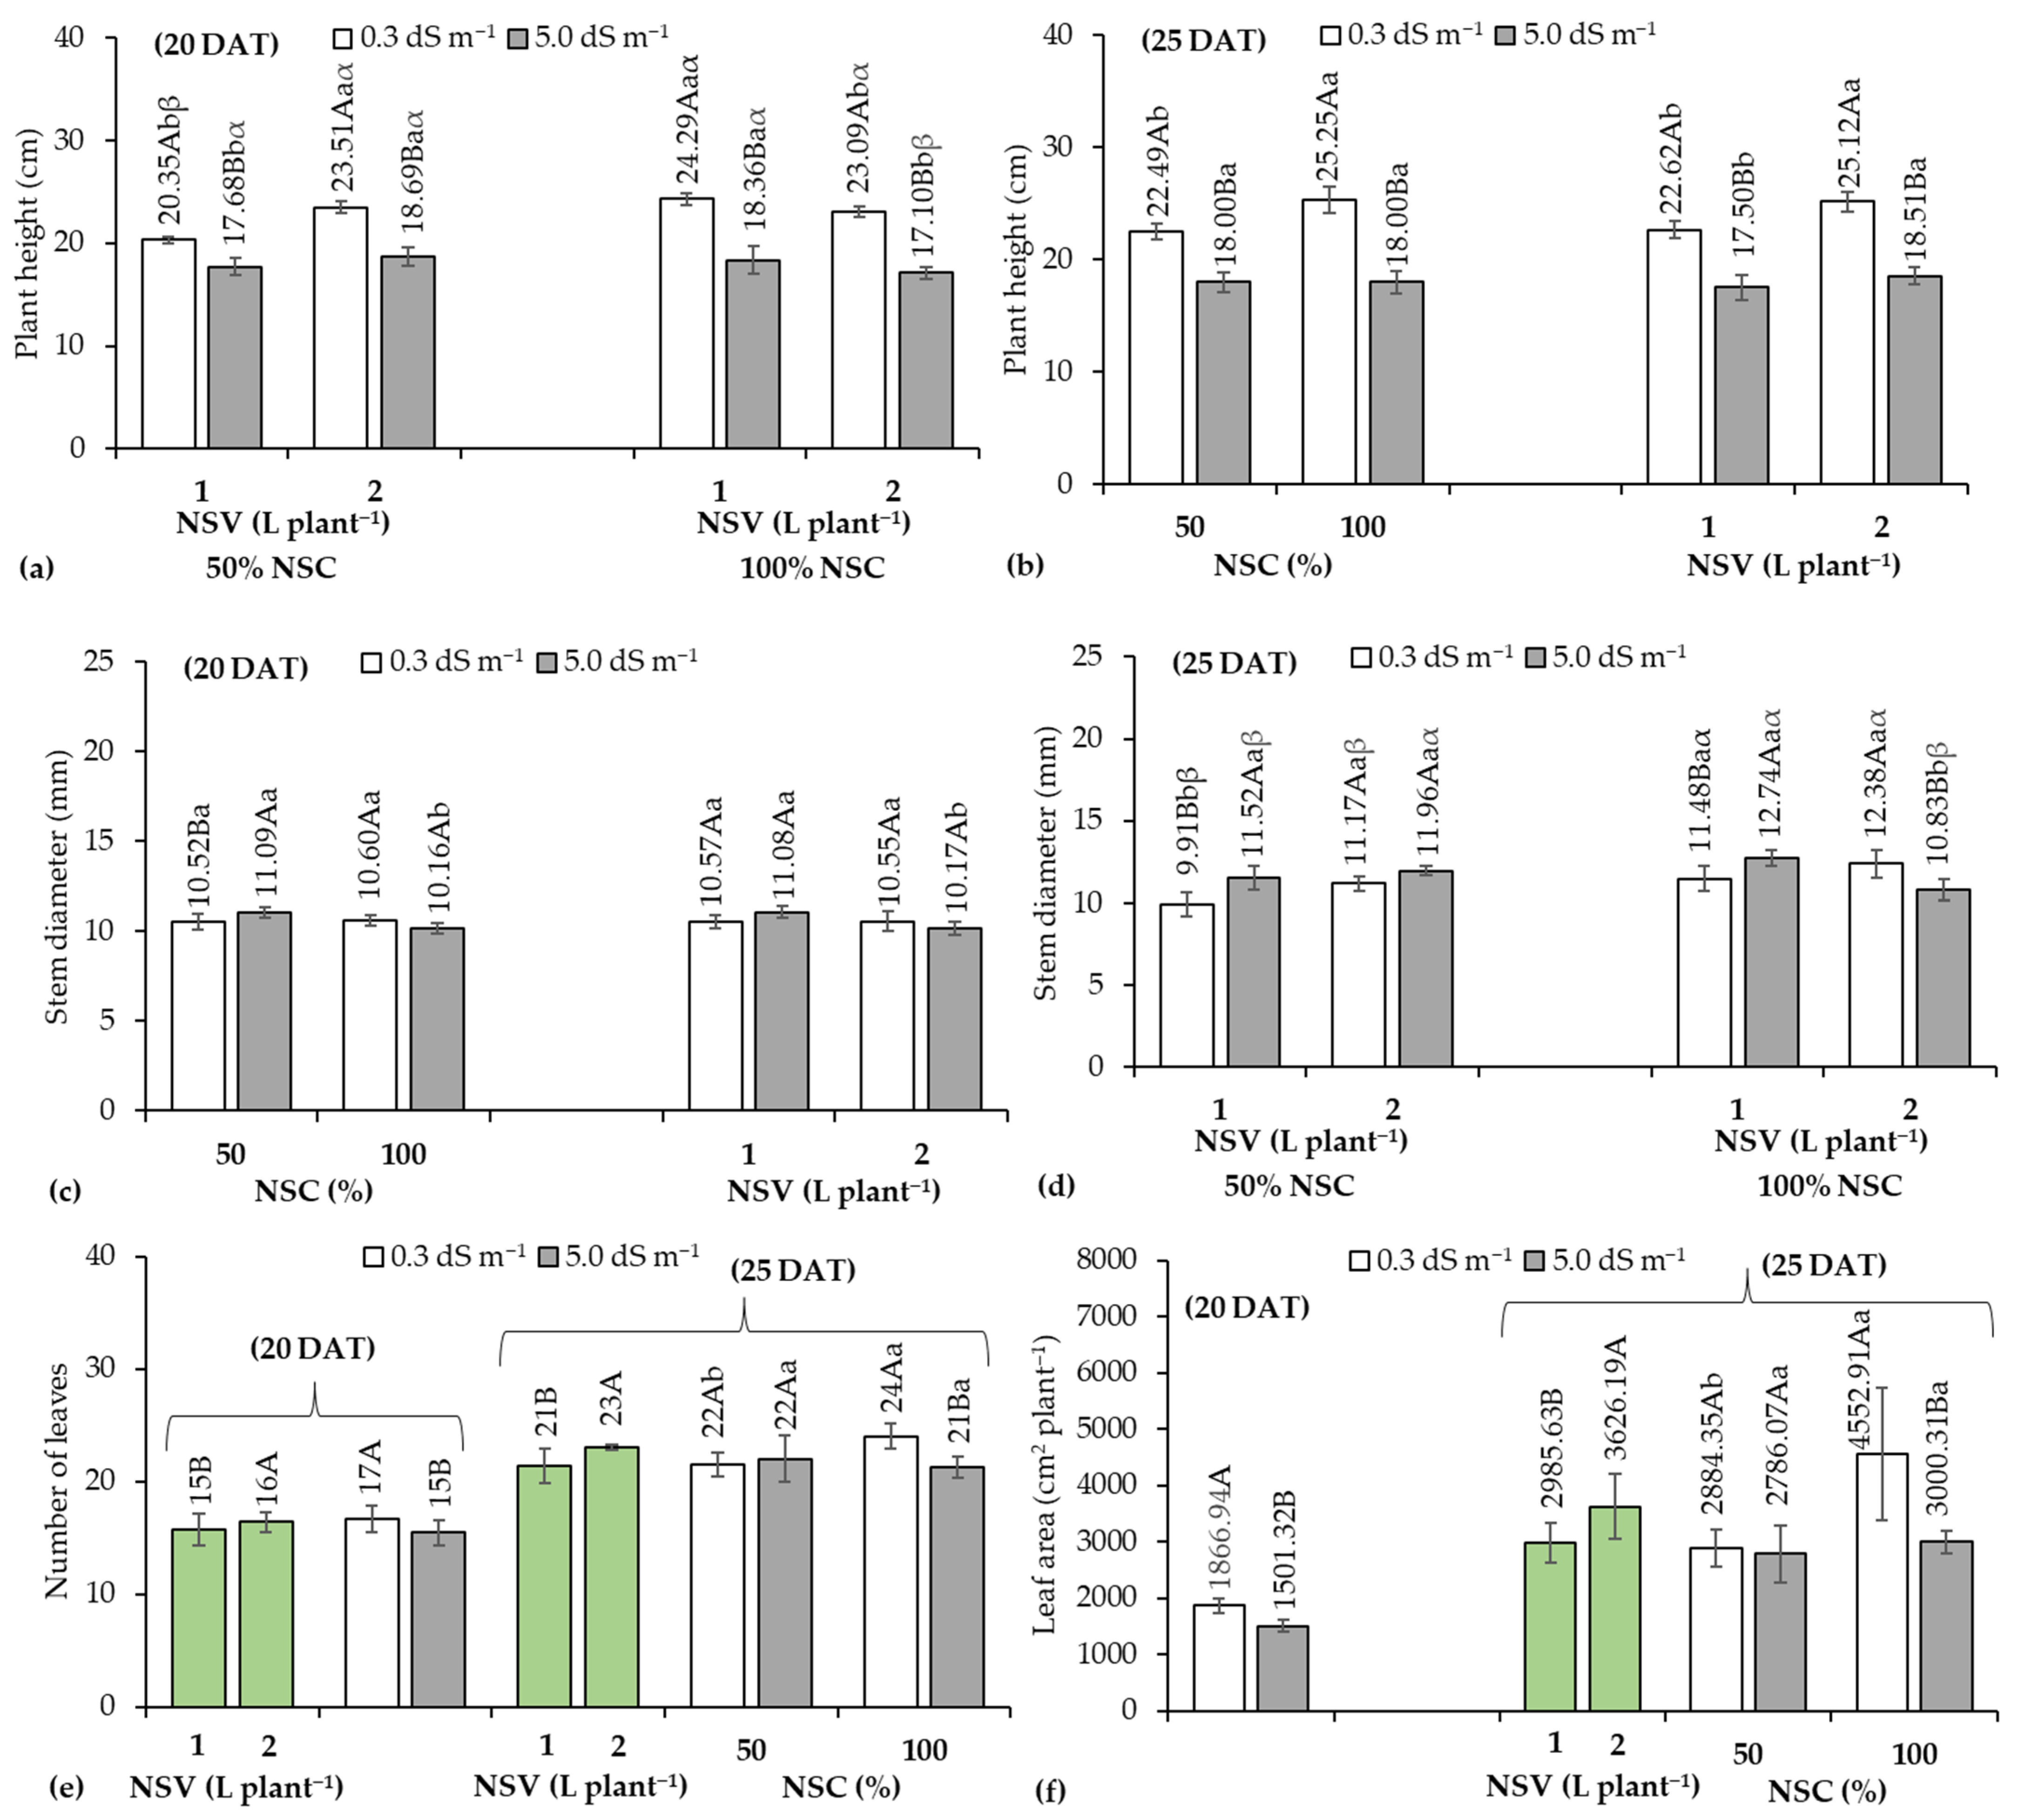
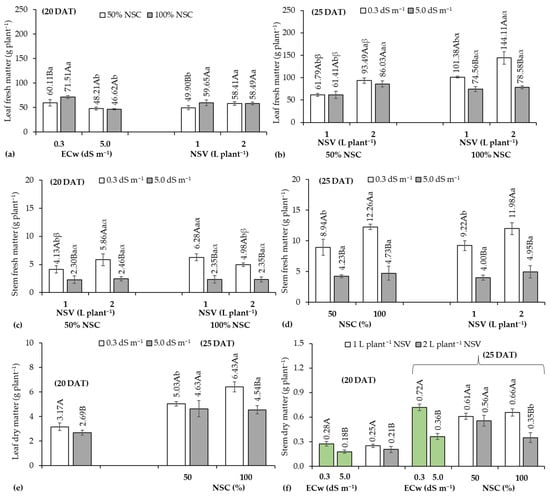
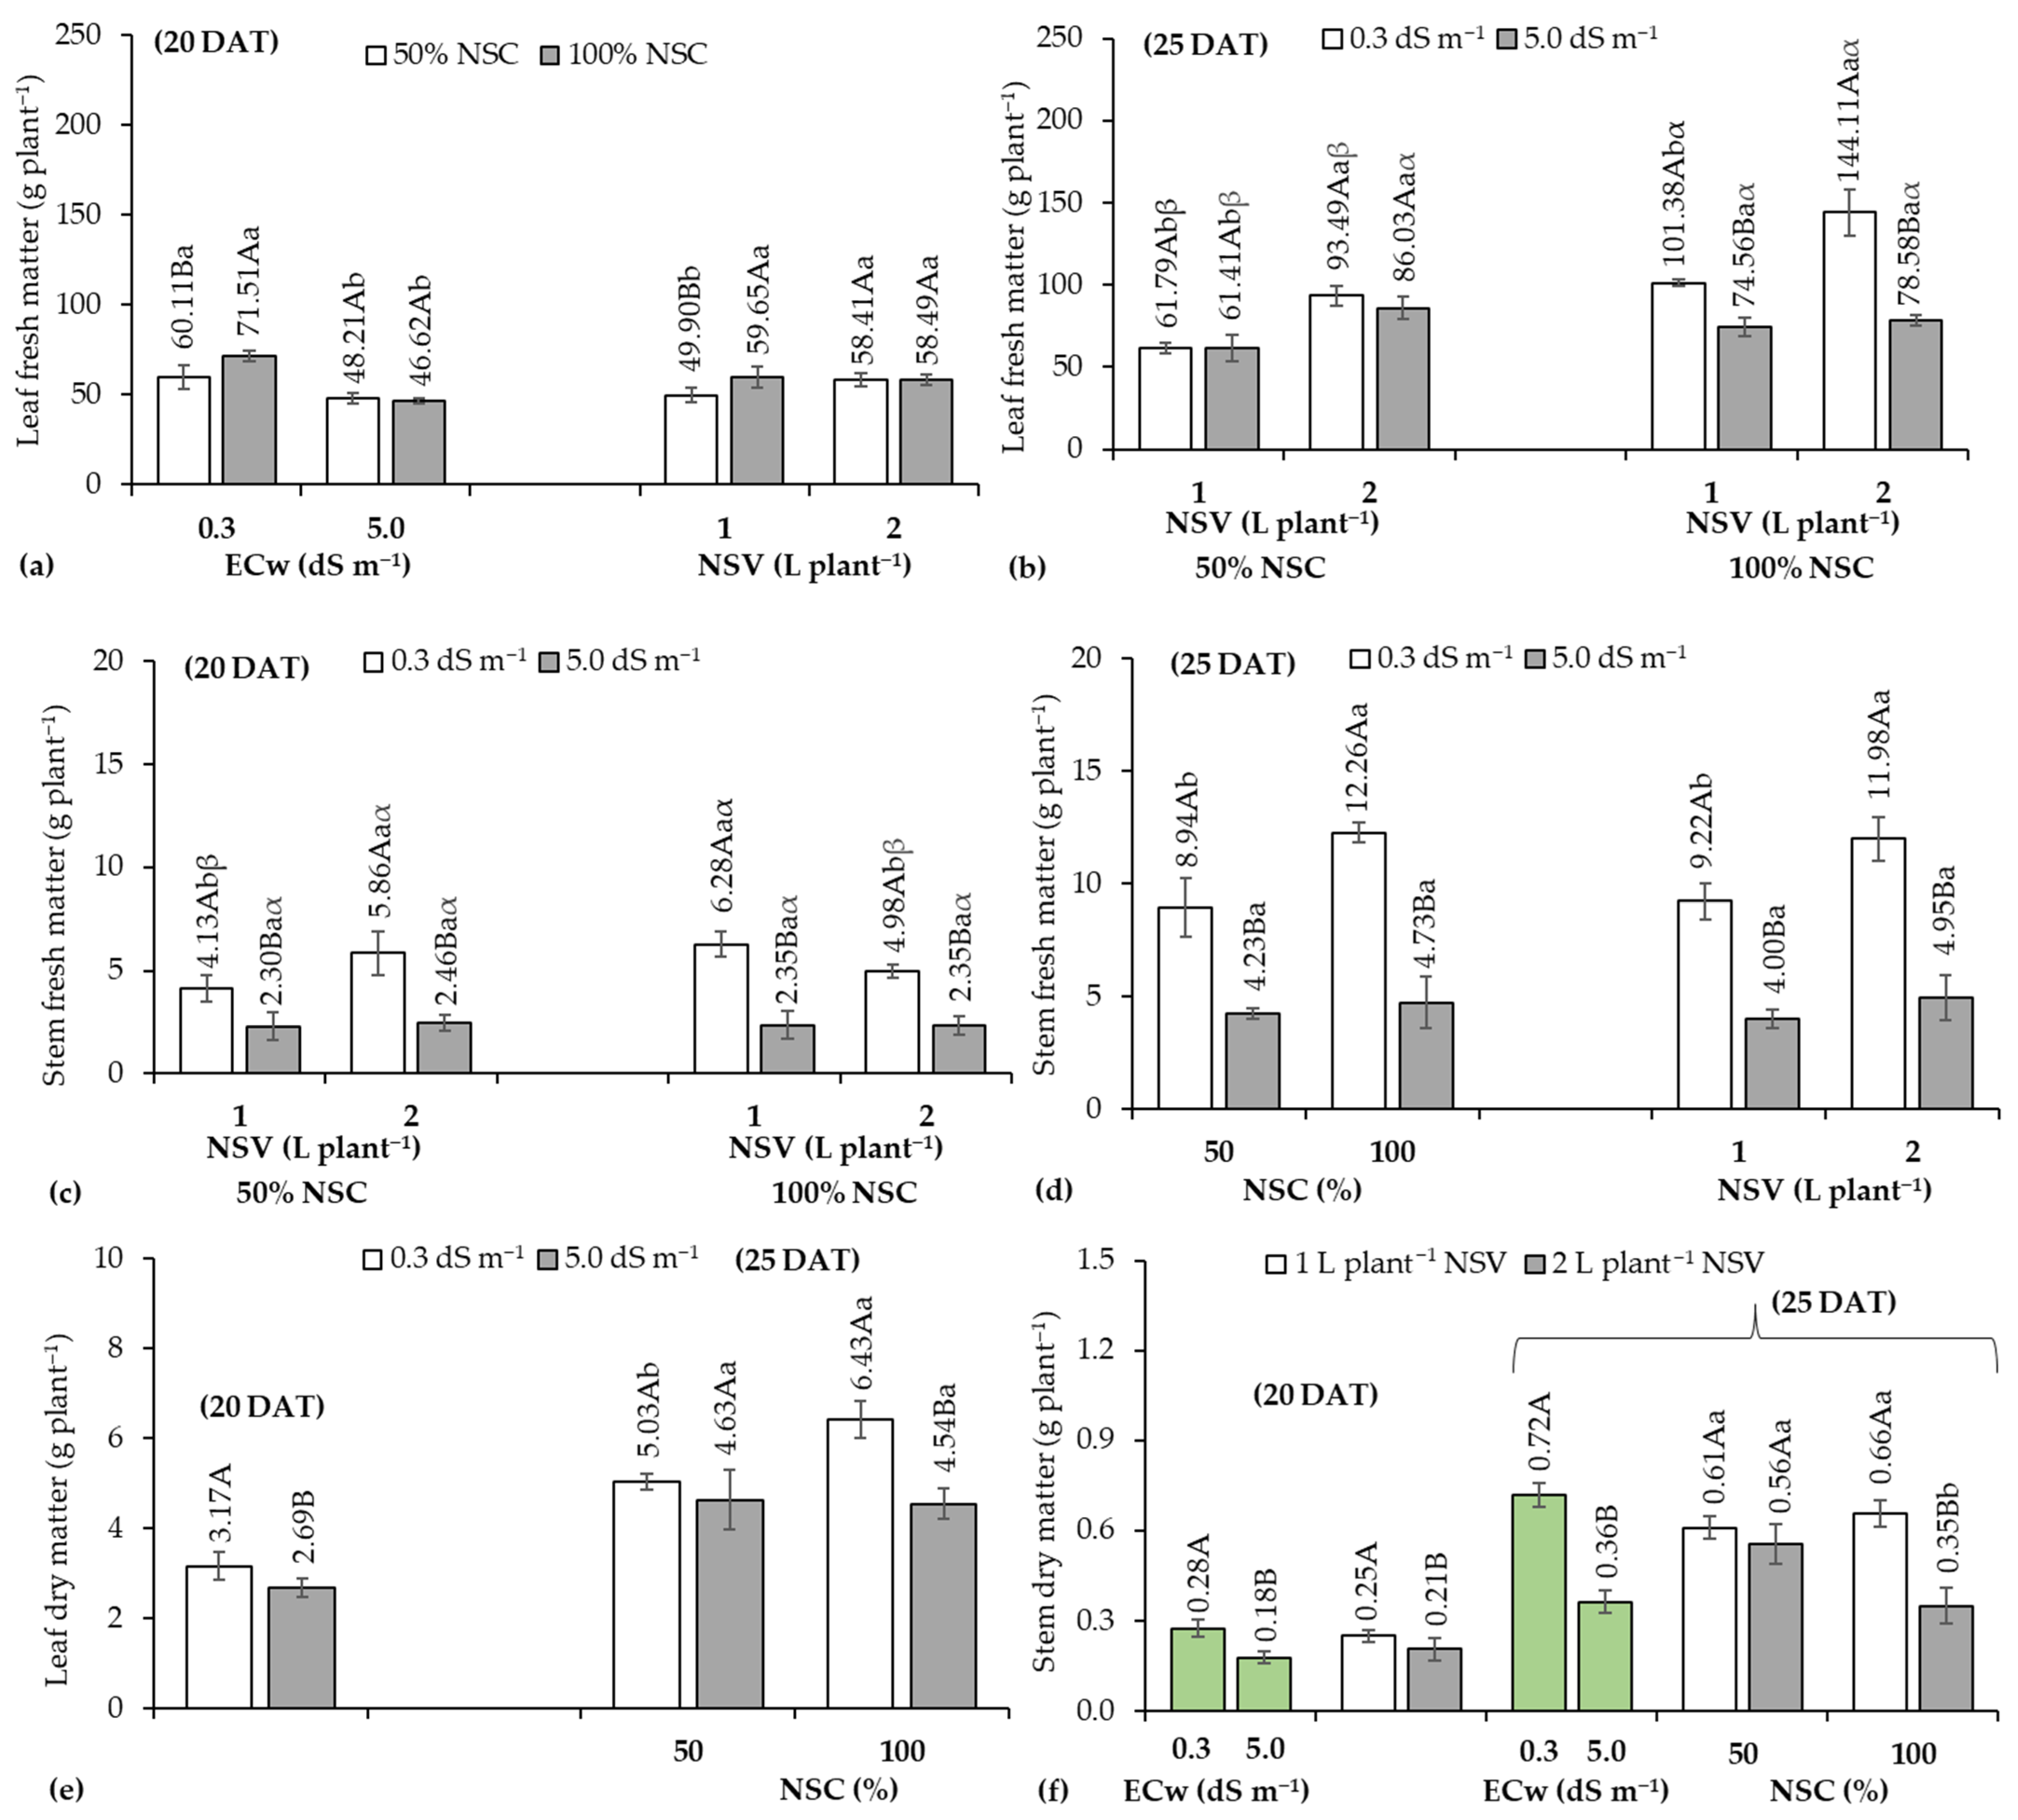
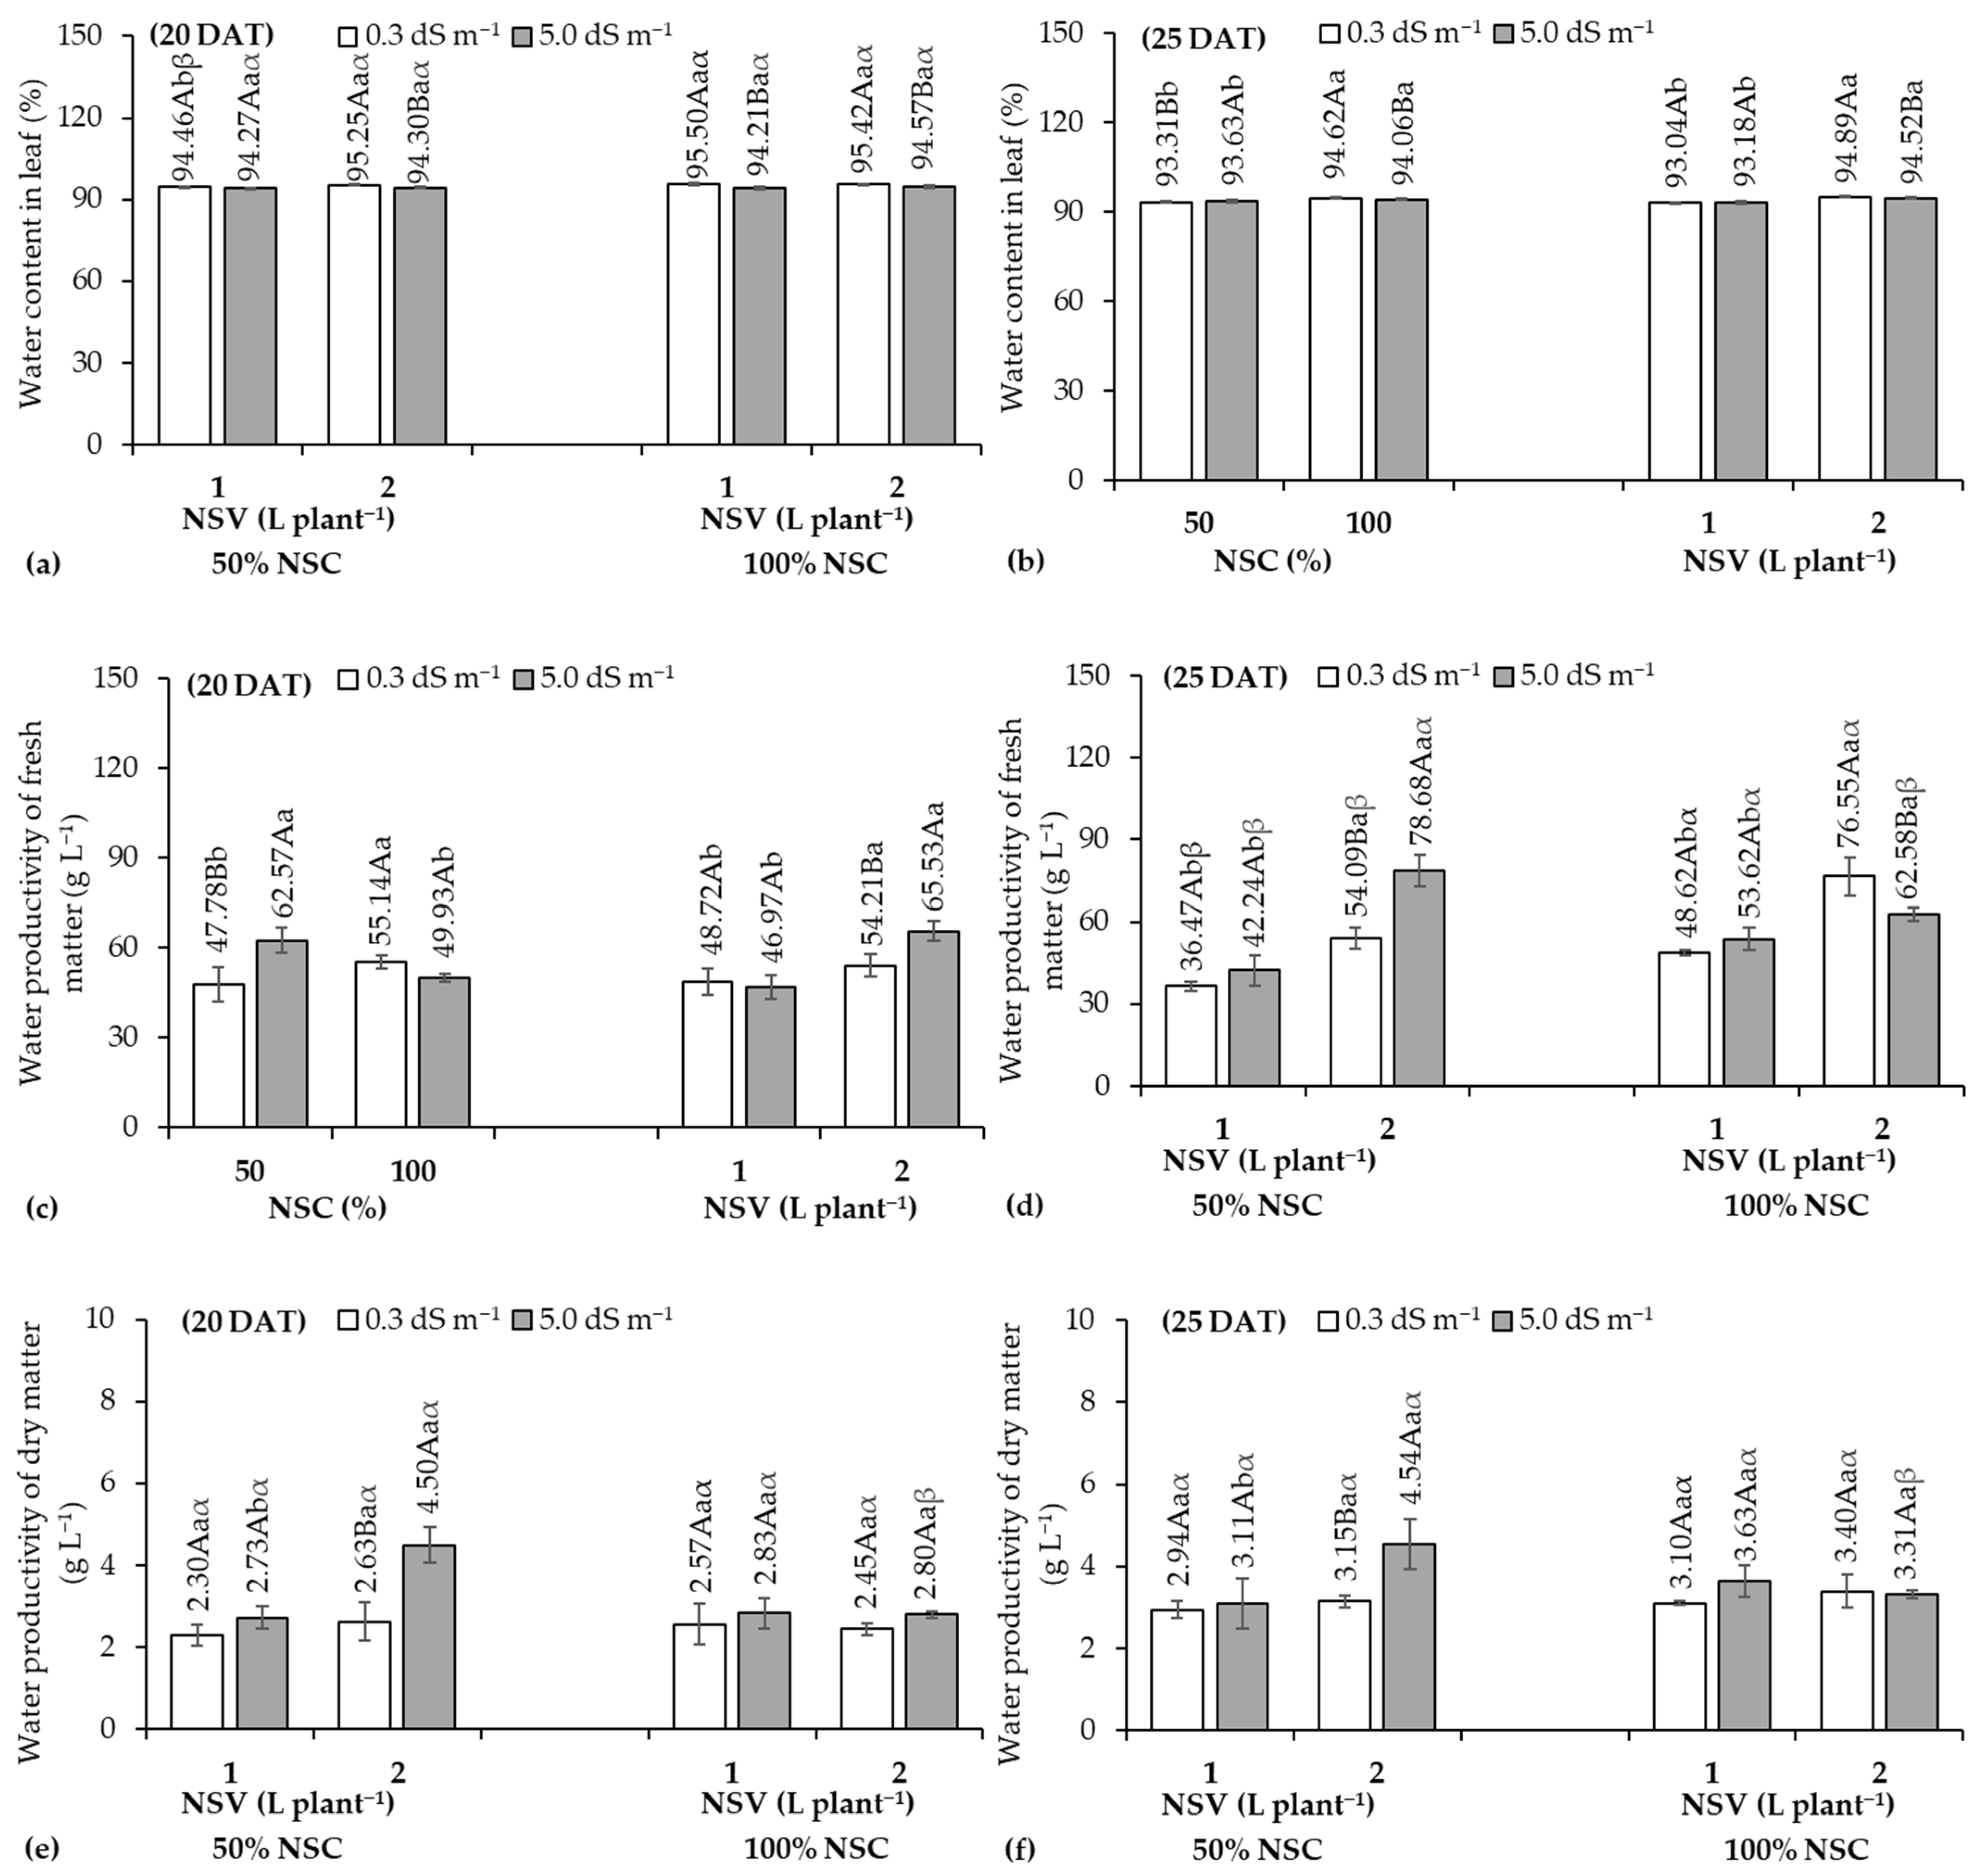
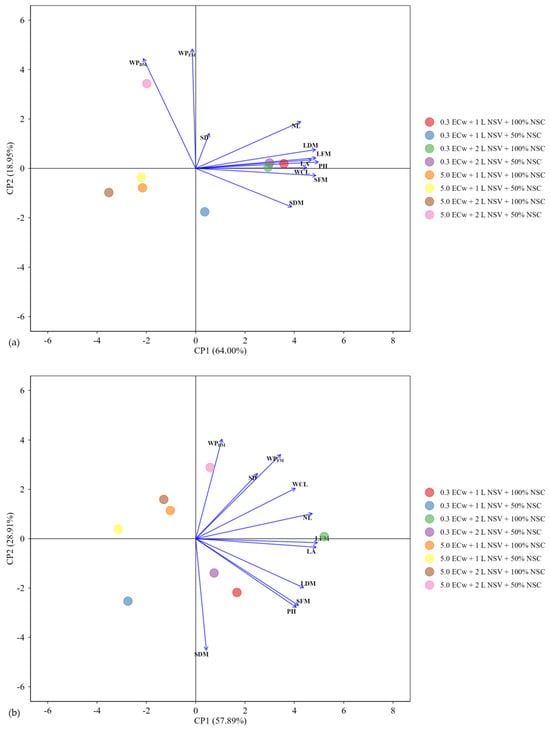
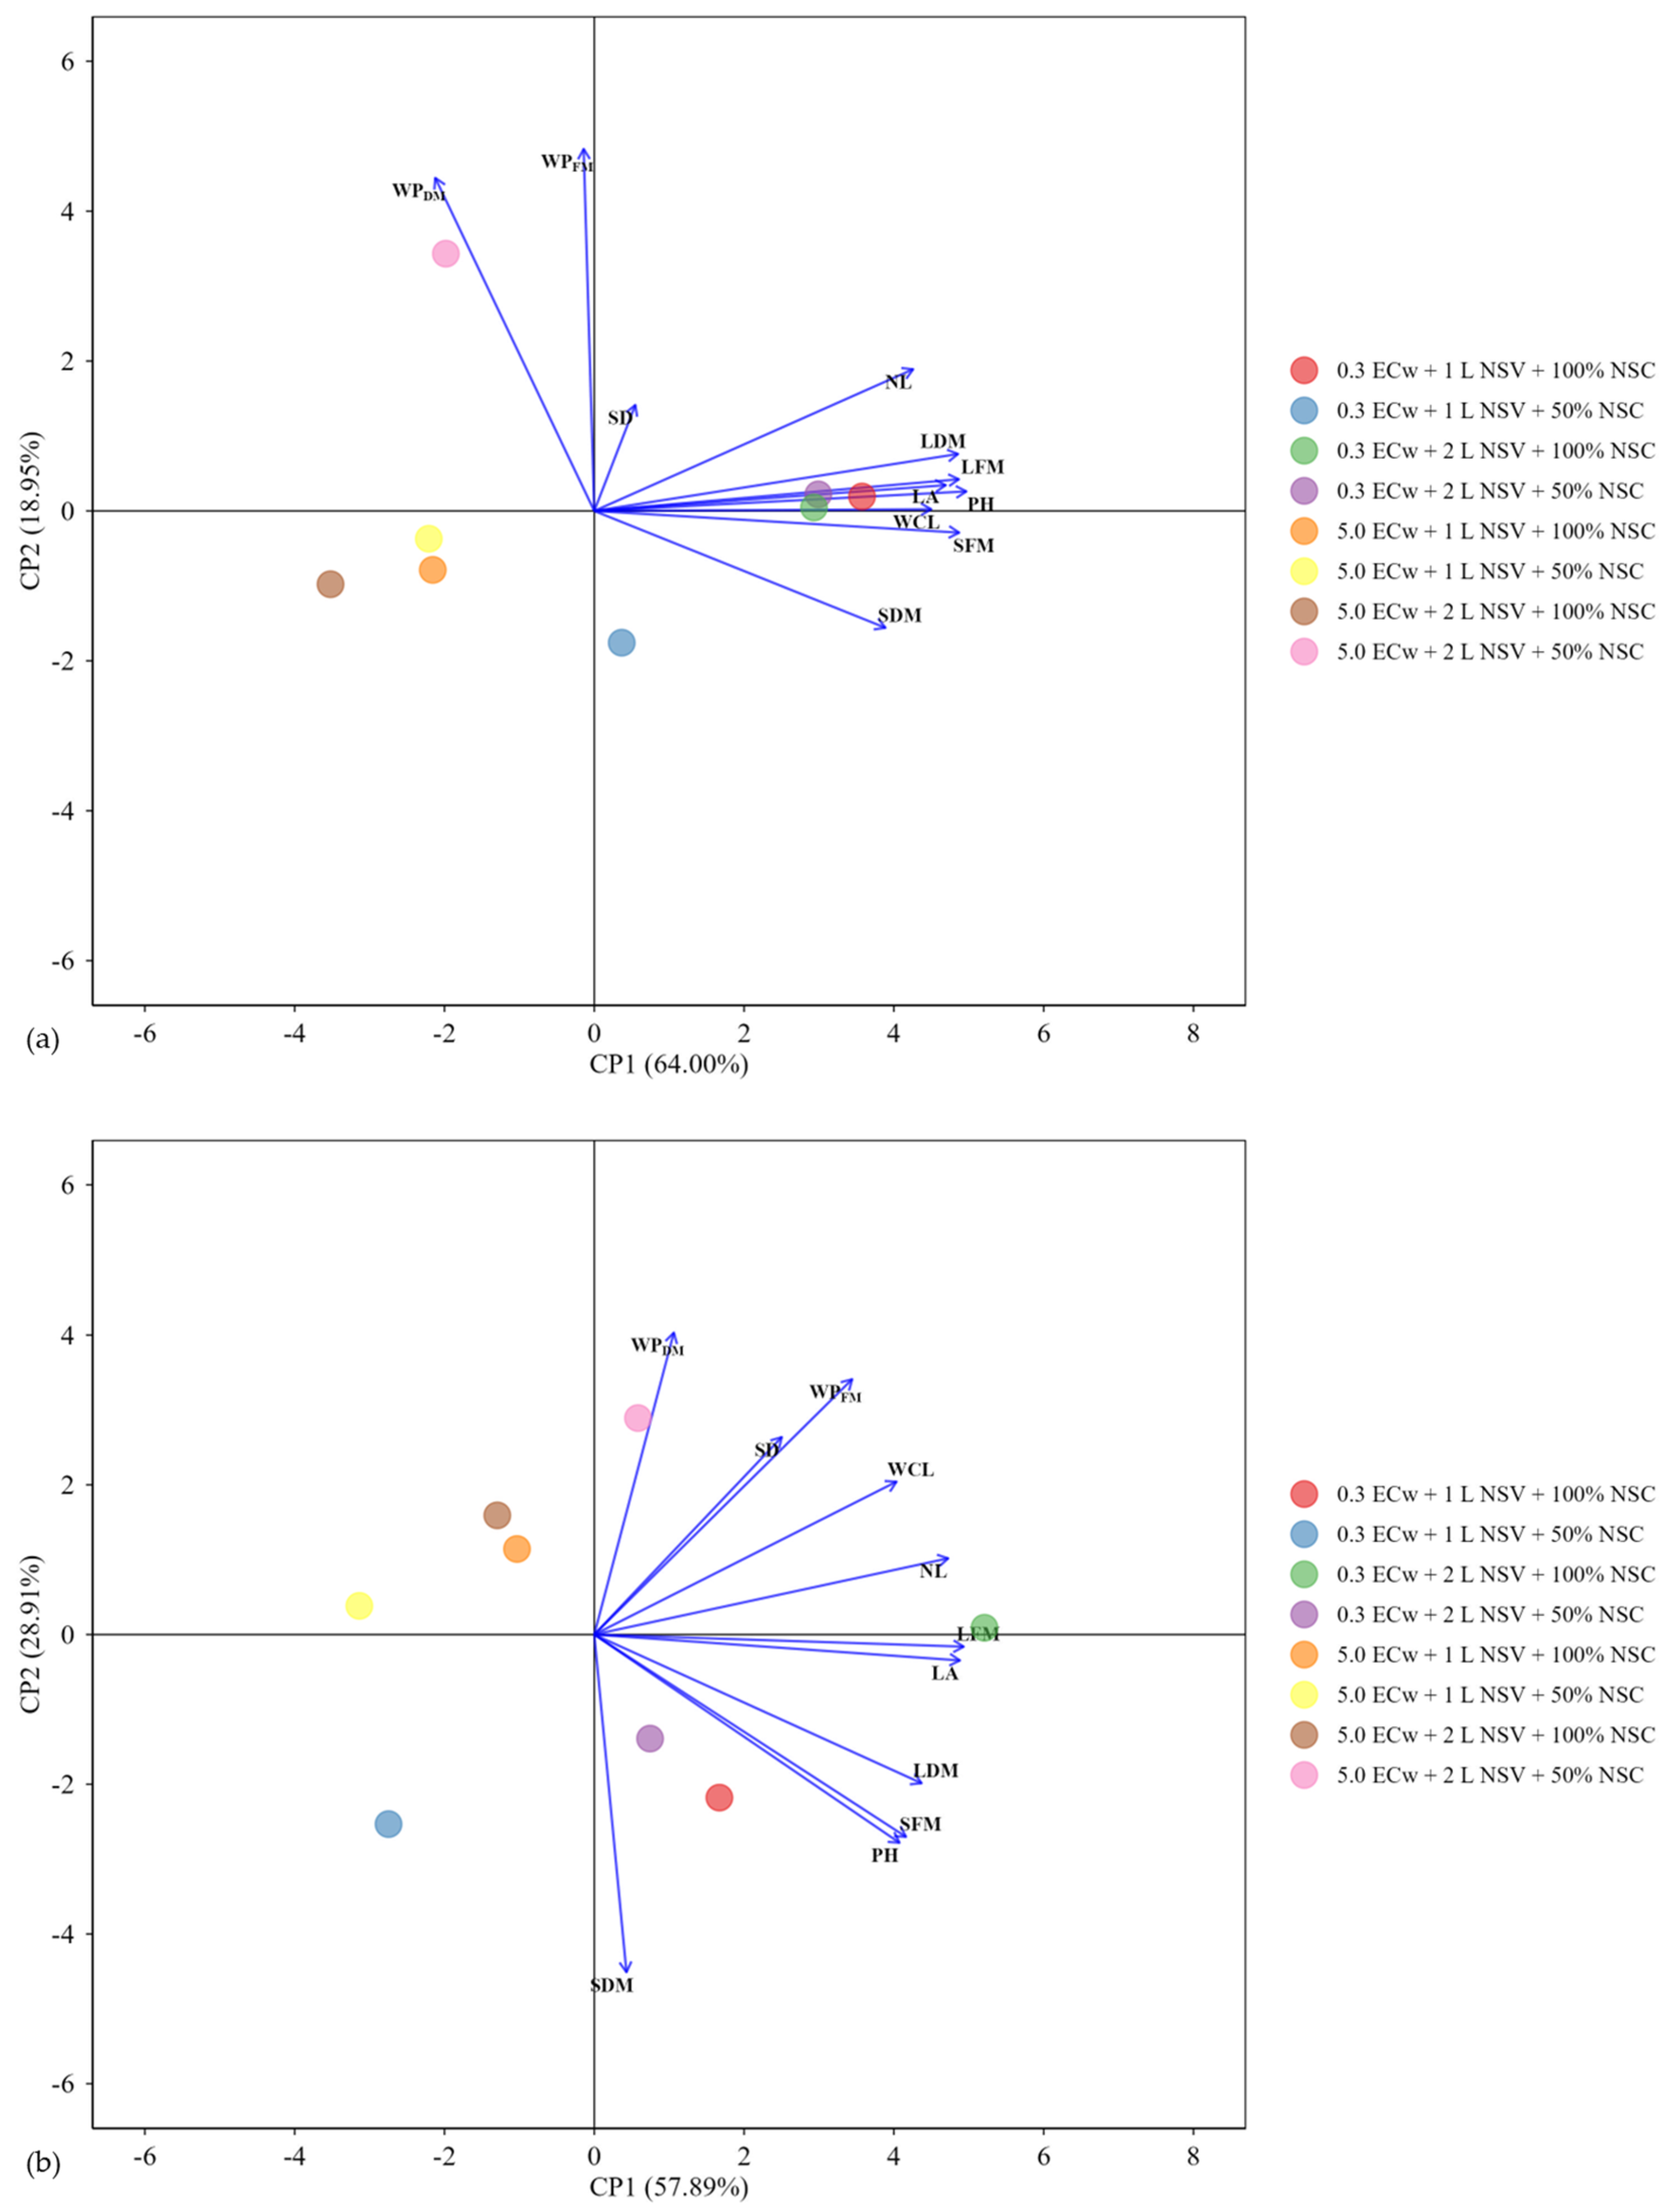
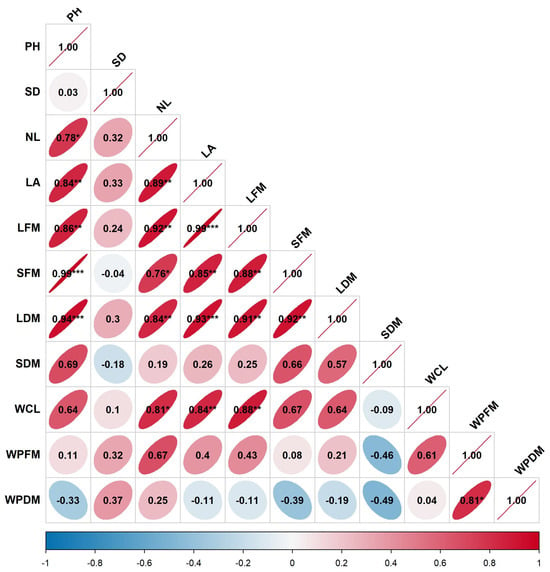
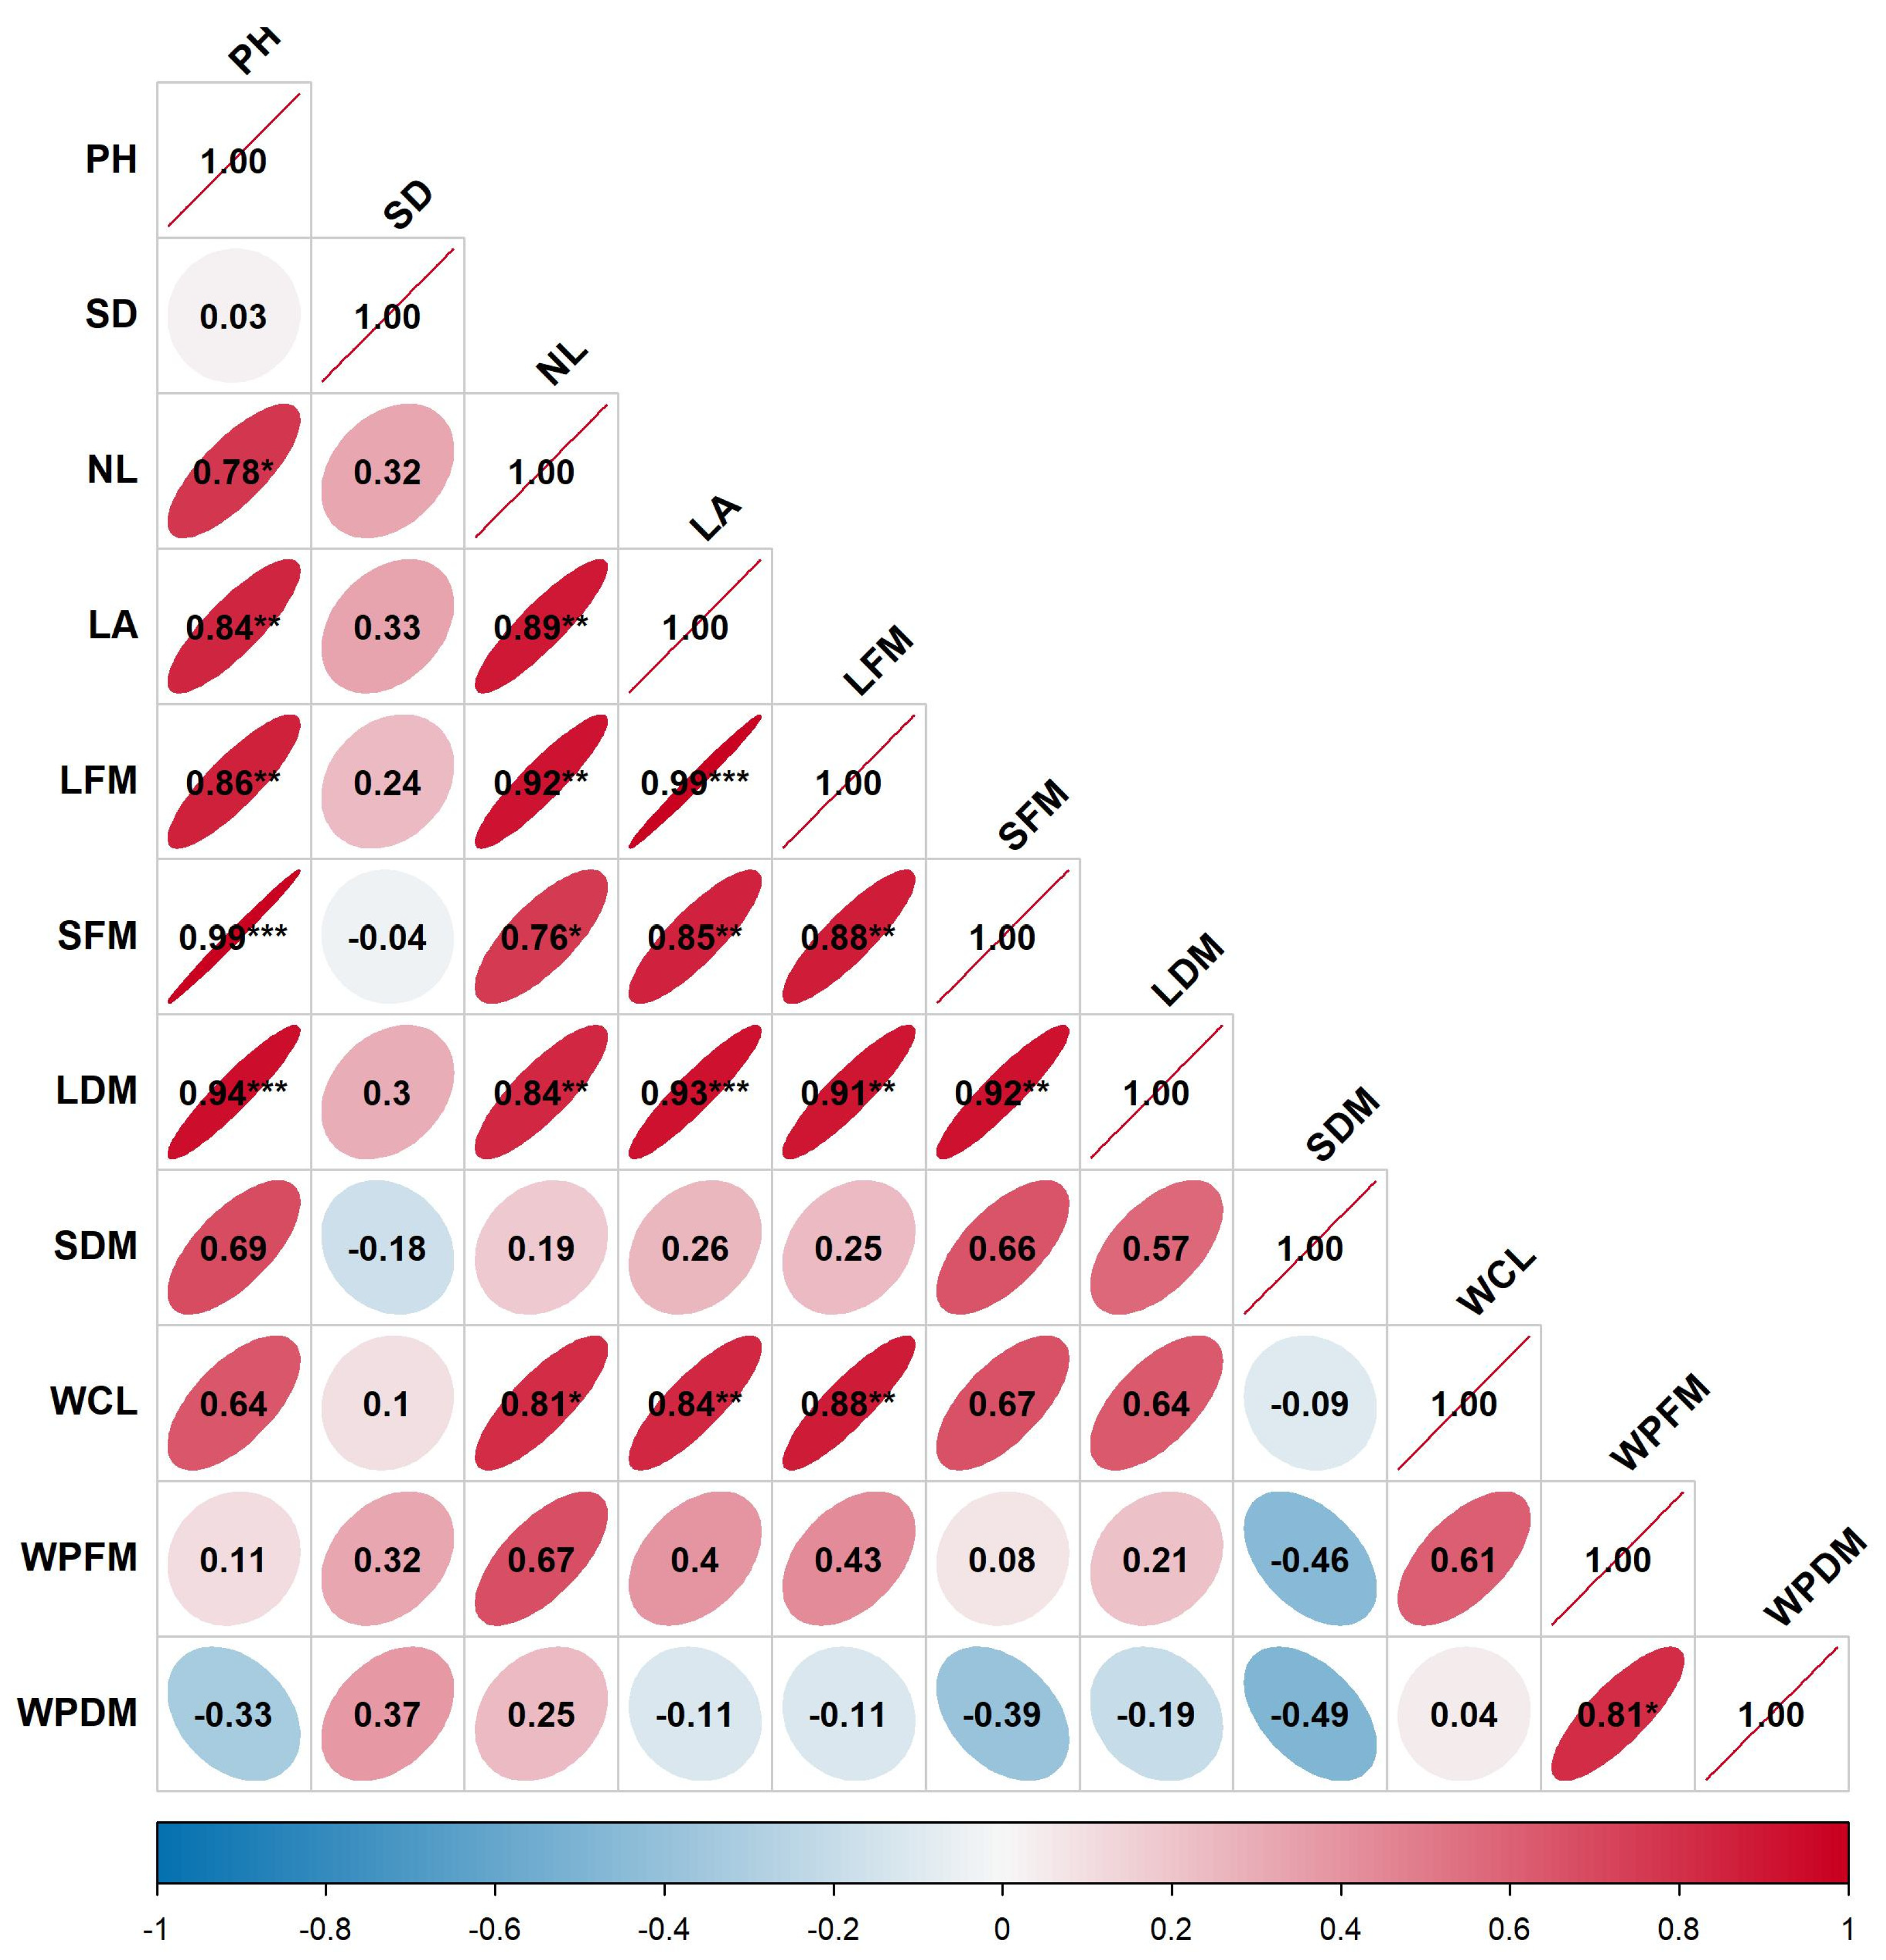

Disclaimer/Publisher’s Note: The statements, opinions and data contained in all publications are solely those of the individual author(s) and contributor(s) and not of MDPI and/or the editor(s). MDPI and/or the editor(s) disclaim responsibility for any injury to people or property resulting from any ideas, methods, instructions or products referred to in the content. |
© 2026 by the authors. Licensee MDPI, Basel, Switzerland. This article is an open access article distributed under the terms and conditions of the Creative Commons Attribution (CC BY) license.