


Abstract
Zebrafish (Danio rerio) are widely used in behavioral neuroscience and ecotoxicology to study stress-related responses. Traditional plus maze paradigms rely on arm preference, with arms differing in perceived safety. Here, we propose an alternative approach using a plus maze with identical arms, where stress is assessed based on movement patterns rather than preference. Fish explored the maze for 20 min under baseline conditions, followed by exposure to hyperosmotic stress (5‰ salinity). Behavior was quantified using automated video tracking, including locomotor activity, spontaneous alternation, and transition patterns between arms. Salinity stress did not significantly affect overall locomotor activity or spontaneous alternation. However, it markedly altered movement structure. The proportion of circular transitions decreased significantly. Most notably, transitions between adjacent arms declined, while transitions between opposing arms increased to nearly 50% of total entries. The runs test analysis further indicated an increased tendency toward repetitive movement sequences under stress conditions. These behavioral changes were associated with significantly increased whole-body cortisol levels. The findings identify a shift toward opposing-arm transitions as a potentially sensitive and previously underappreciated behavioral correlate of stress in zebrafish. This metric may complement conventional behavioral endpoints and offers particular promise for automated high-throughput applications in ecotoxicology and preclinical research.
1. Introduction
Danio rerio is one of the most widely used model organisms in contemporary biological and biomedical research [1,2,3]. This small freshwater cyprinid fish has gained broad approval due to its small size, high fecundity, rapid life cycle, and relative ease of maintenance under laboratory conditions.
Behavioral assessment in zebrafish larvae and adults is applied to study physiological states, adaptive responses, and the effects of diverse environmental and experimental factors [4,5]. In particular, stress-related behavioral responses are commonly evaluated in preclinical drug testing and ecotoxicological studies [5,6,7]. Typically, a set of behavioral endpoints, including locomotor activity, freezing behavior, erratic swimming, and related measures, is quantified in an experimental tank for this purpose [7].
In recent years, increasing attention has been given to approaches that assess stress responses along with more complex forms of behavior. Such approaches enable more sophisticated experimental designs and substantially enhance the informational value of behavioral data by expanding the range of measurable endpoints.
One example is plus-shaped mazes, which are widely used in zebrafish research to evaluate exploratory [8] and learning behavior [9,10]. At the same time, the plus mazes have been applied to assess anxiety-like behavior, which is considered a manifestation of stress typically associated with the anticipation of threat.
By analogy with the rodent elevated plus maze [11], an aquatic light–dark plus maze with opposing black and white arms and a gray central compartment has been proposed for zebrafish [12,13]. Differences in arm entry frequency and time spent in dark versus light arms are interpreted as indicators of stress and anxiety. This approach enables an accurate assessment of anxiety [14]. However, it is extremely difficult to automate using machine vision, so processing is performed manually by an operator.
An alternative approach employs a maze with arms of varying depths, also known as “a plus maze with a ramp” [15]. According to the authors, this test is highly analogous to the rodent elevated plus maze paradigm. Zebrafish preferentially occupy deeper and rarely enter ramped arms. Anxiety levels are inferred from the number of entries into different arms and the relative time spent in each zone. This approach has been shown to detect the effects of alcohol, clonazepam, buspirone, chlordiazepoxide, caffeine, and stress induced by housing density in zebrafish [15,16,17,18]. However, fish exhibit a strong innate preference for deeper areas, which biases the assay toward detecting anxiolytic effects. At the same time, anxiogenic effects may remain undetectable due to the already high baseline avoidance of ramped arms under control conditions. Moreover, the presence of arms with different bottom heights prevents the use of light sources positioned under the maze. This minor technical constraint can be critical for machine vision applications and automated behavioral analysis, where reflections caused by overhead illumination must be minimized.
Another method for assessing anxiety in a plus maze was proposed by Gaikwad et al. [19]. In this approach, fish are trained to associate food reinforcement with a specific arm of the maze. It can engage both spatial and cued memory. In the latter case, fish associate a visible cue (e.g., a red card placed at different arms) with food delivery. During subsequent testing of these conditioned fish, behavioral parameters such as latency to enter the correct (food-associated) arm, as well as the number of visits to and time spent in correct versus incorrect arms, are analyzed. Comparisons between control and experimentally treated groups allow a reliable assessment of anxiety [19,20,21]. Nevertheless, this approach requires prolonged training, which limits its applicability in high-throughput or time-sensitive experimental designs.
Several studies have examined the exploratory behavior of fish in plus mazes with identical arms. In particular, analyses of arm-visit sequences have revealed two principal locomotor strategies employed during maze exploration [8,22]. The first strategy involves transitions between adjacent arms, either clockwise or counterclockwise. The second is characterized by shuttle-like movements between opposing or adjacent arms of the maze. However, these studies have primarily focused on describing spontaneous exploratory structure under baseline conditions, and little is known about how the relative use of these strategies is modulated by stress. It therefore remains unknown whether stress exposure alters the balance between these exploratory strategies. Accordingly, the present study aimed to test the hypothesis that stress exposure induces a measurable shift in the relative contribution of arm transition strategies during exploration of a plus-shaped maze with identical arms in adult D. rerio. We induced stress using a hyperosmotic challenge, a widely applied and reliable stressor in zebrafish research [7].
2. Results
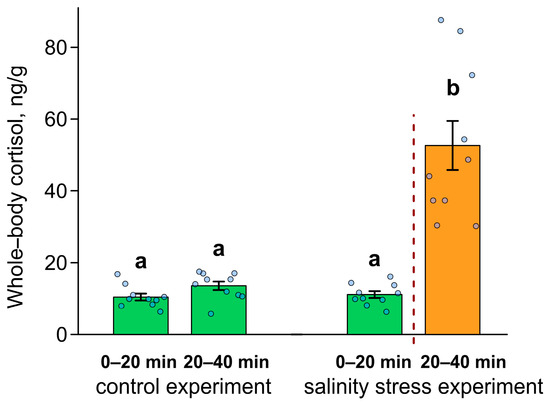
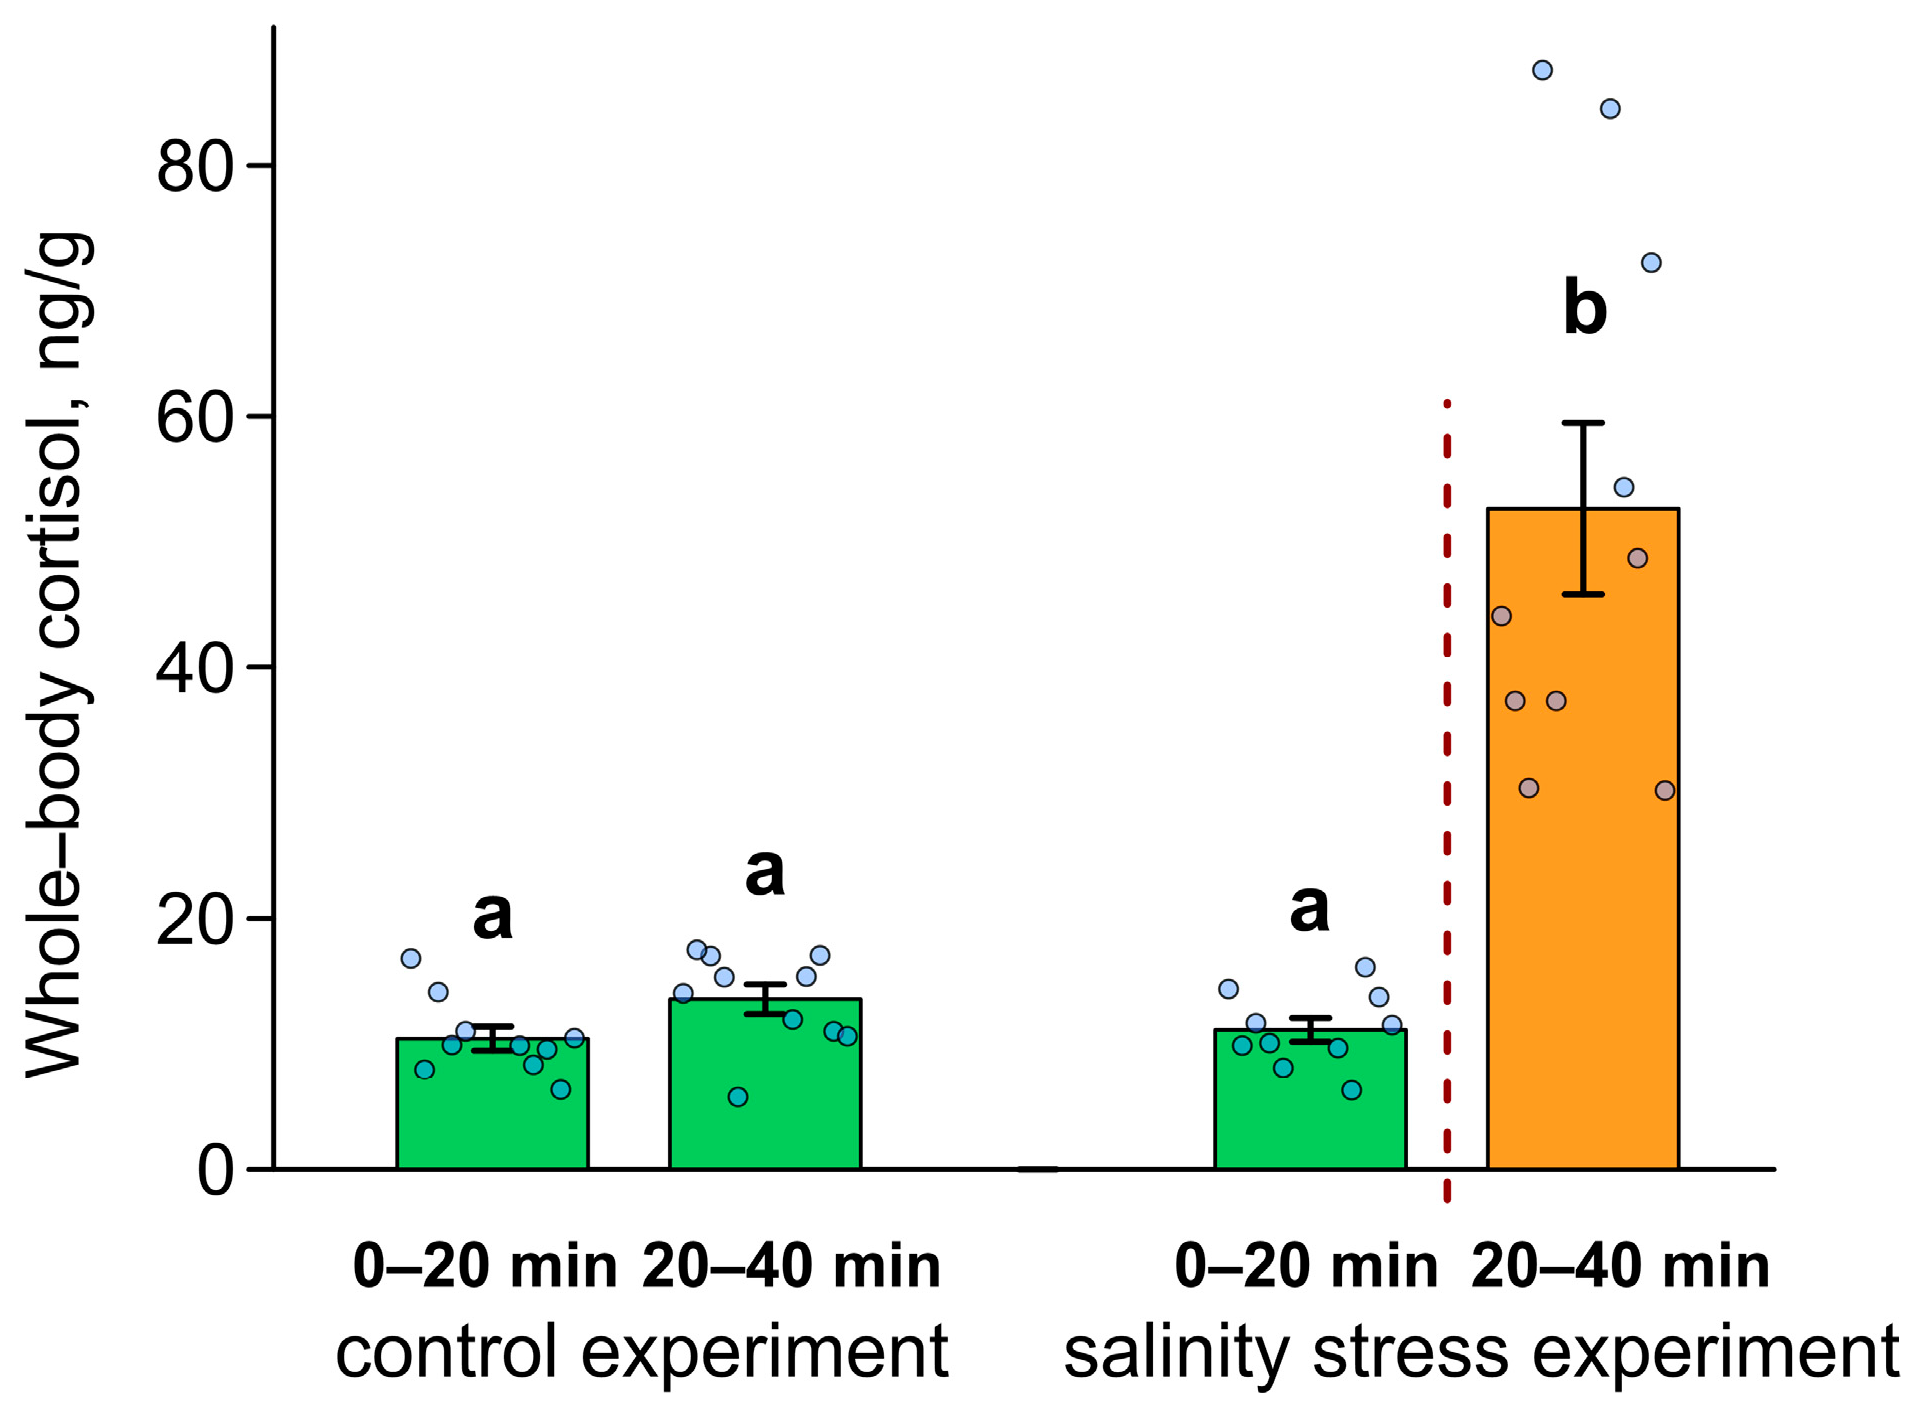
One-way ANOVA revealed a significant effect of salinity treatment on cortisol levels (F (3, 36) = 33.845, p = 0.00001, ŋ2 = 0.738). Exposure of zebrafish to the hyperosmotic environment for 20 min resulted in a pronounced and statistically significant increase in whole-body cortisol levels, exceeding fourfold relative to both the initial 20-min pre-stress period and to the corresponding 20–40 min interval in the control experiment (Figure 1).
Figure 1.
Mean whole-body cortisol levels in the control and salinity stress experiments after 20 and 40 min of exposure to the maze. Green bars represent fish maintained in freshwater, while the orange bar indicates fish in a hyperosmotic environment. Data are presented as mean ± SE; individual data points are shown as dots. Significant differences are indicated by different letters. Identical letters indicate no significant difference.
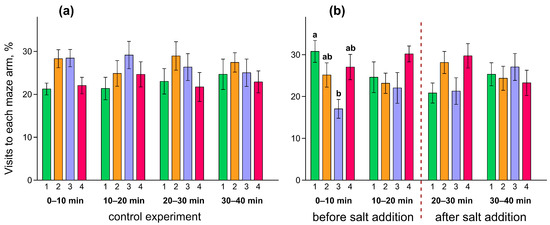
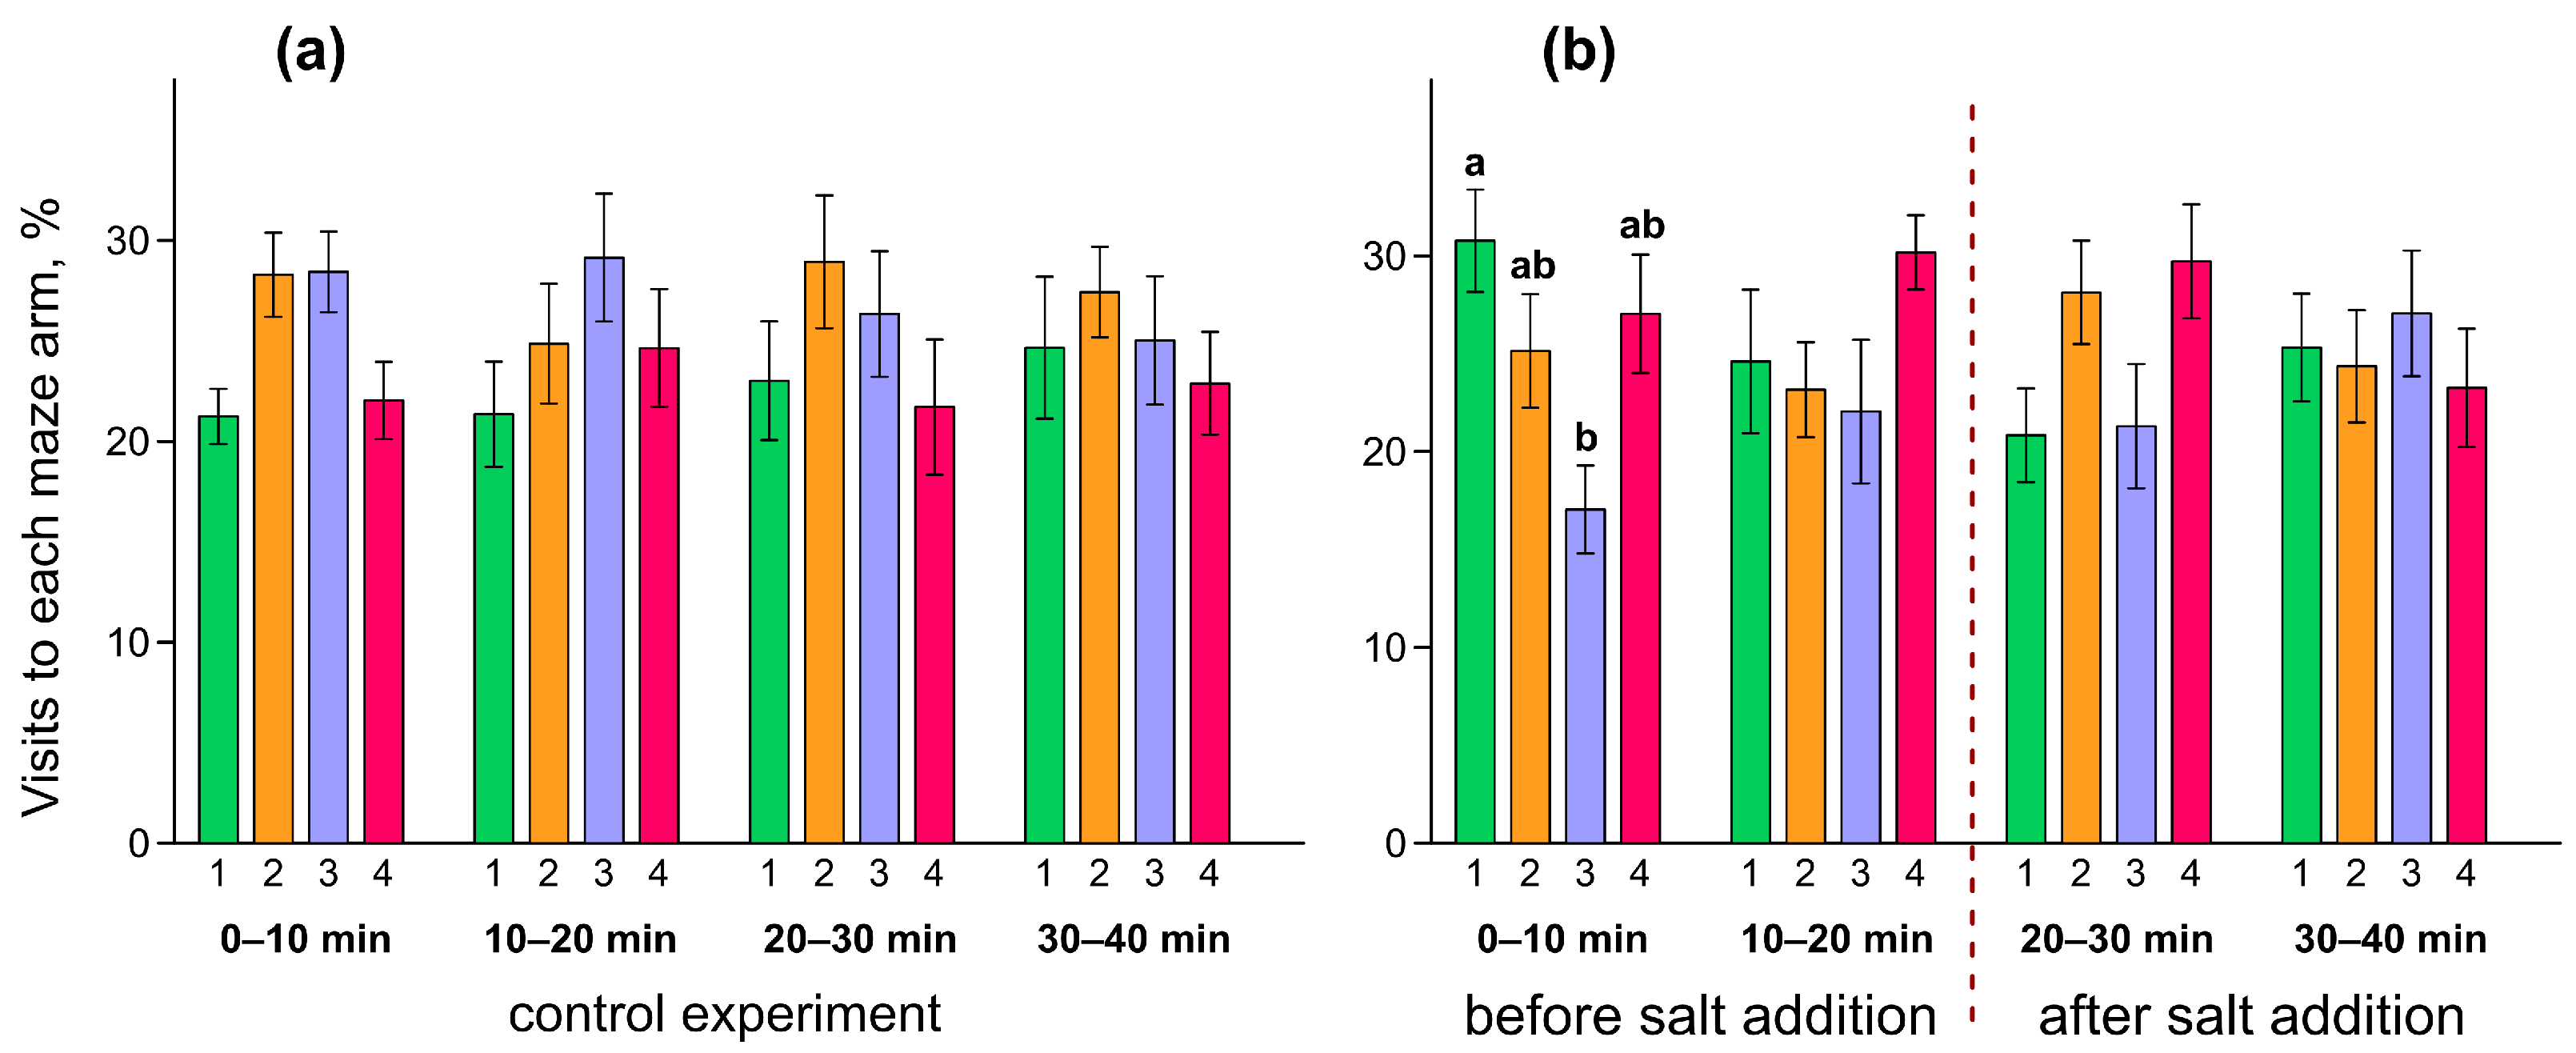
No significant preference for any particular arm of the plus maze was observed during any of the 10-min intervals in the control experiment (Figure 2a). Under salinity stress conditions, fish most frequently entered arm 1 and least frequently arm 3 during the first 10 min in the maze, corresponding to the arm in which the injection tube was located. The difference in visitation frequency between these arms was statistically significant. However, no significant preference for any arm was detected from the 10th to 40th min of the experiment (Figure 2b).
Figure 2.
Arm entries of zebrafish in the plus maze: (a) control experiment; (b) salinity stress experiment. Colors correspond to individual maze arms as follows: arm 1 (green), arm 2 (orange), arm 3 (purple), and arm 4 (red). Data are presented as mean ± SE. Significant differences in the frequency of arm entries within each 10-min interval are indicated by different letters. Identical letters indicate no significant difference. When multiple letters are present (ab), the corresponding group does not differ significantly from any group sharing at least one of the same letters.
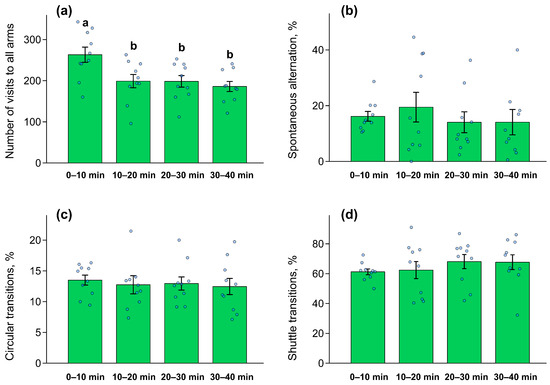
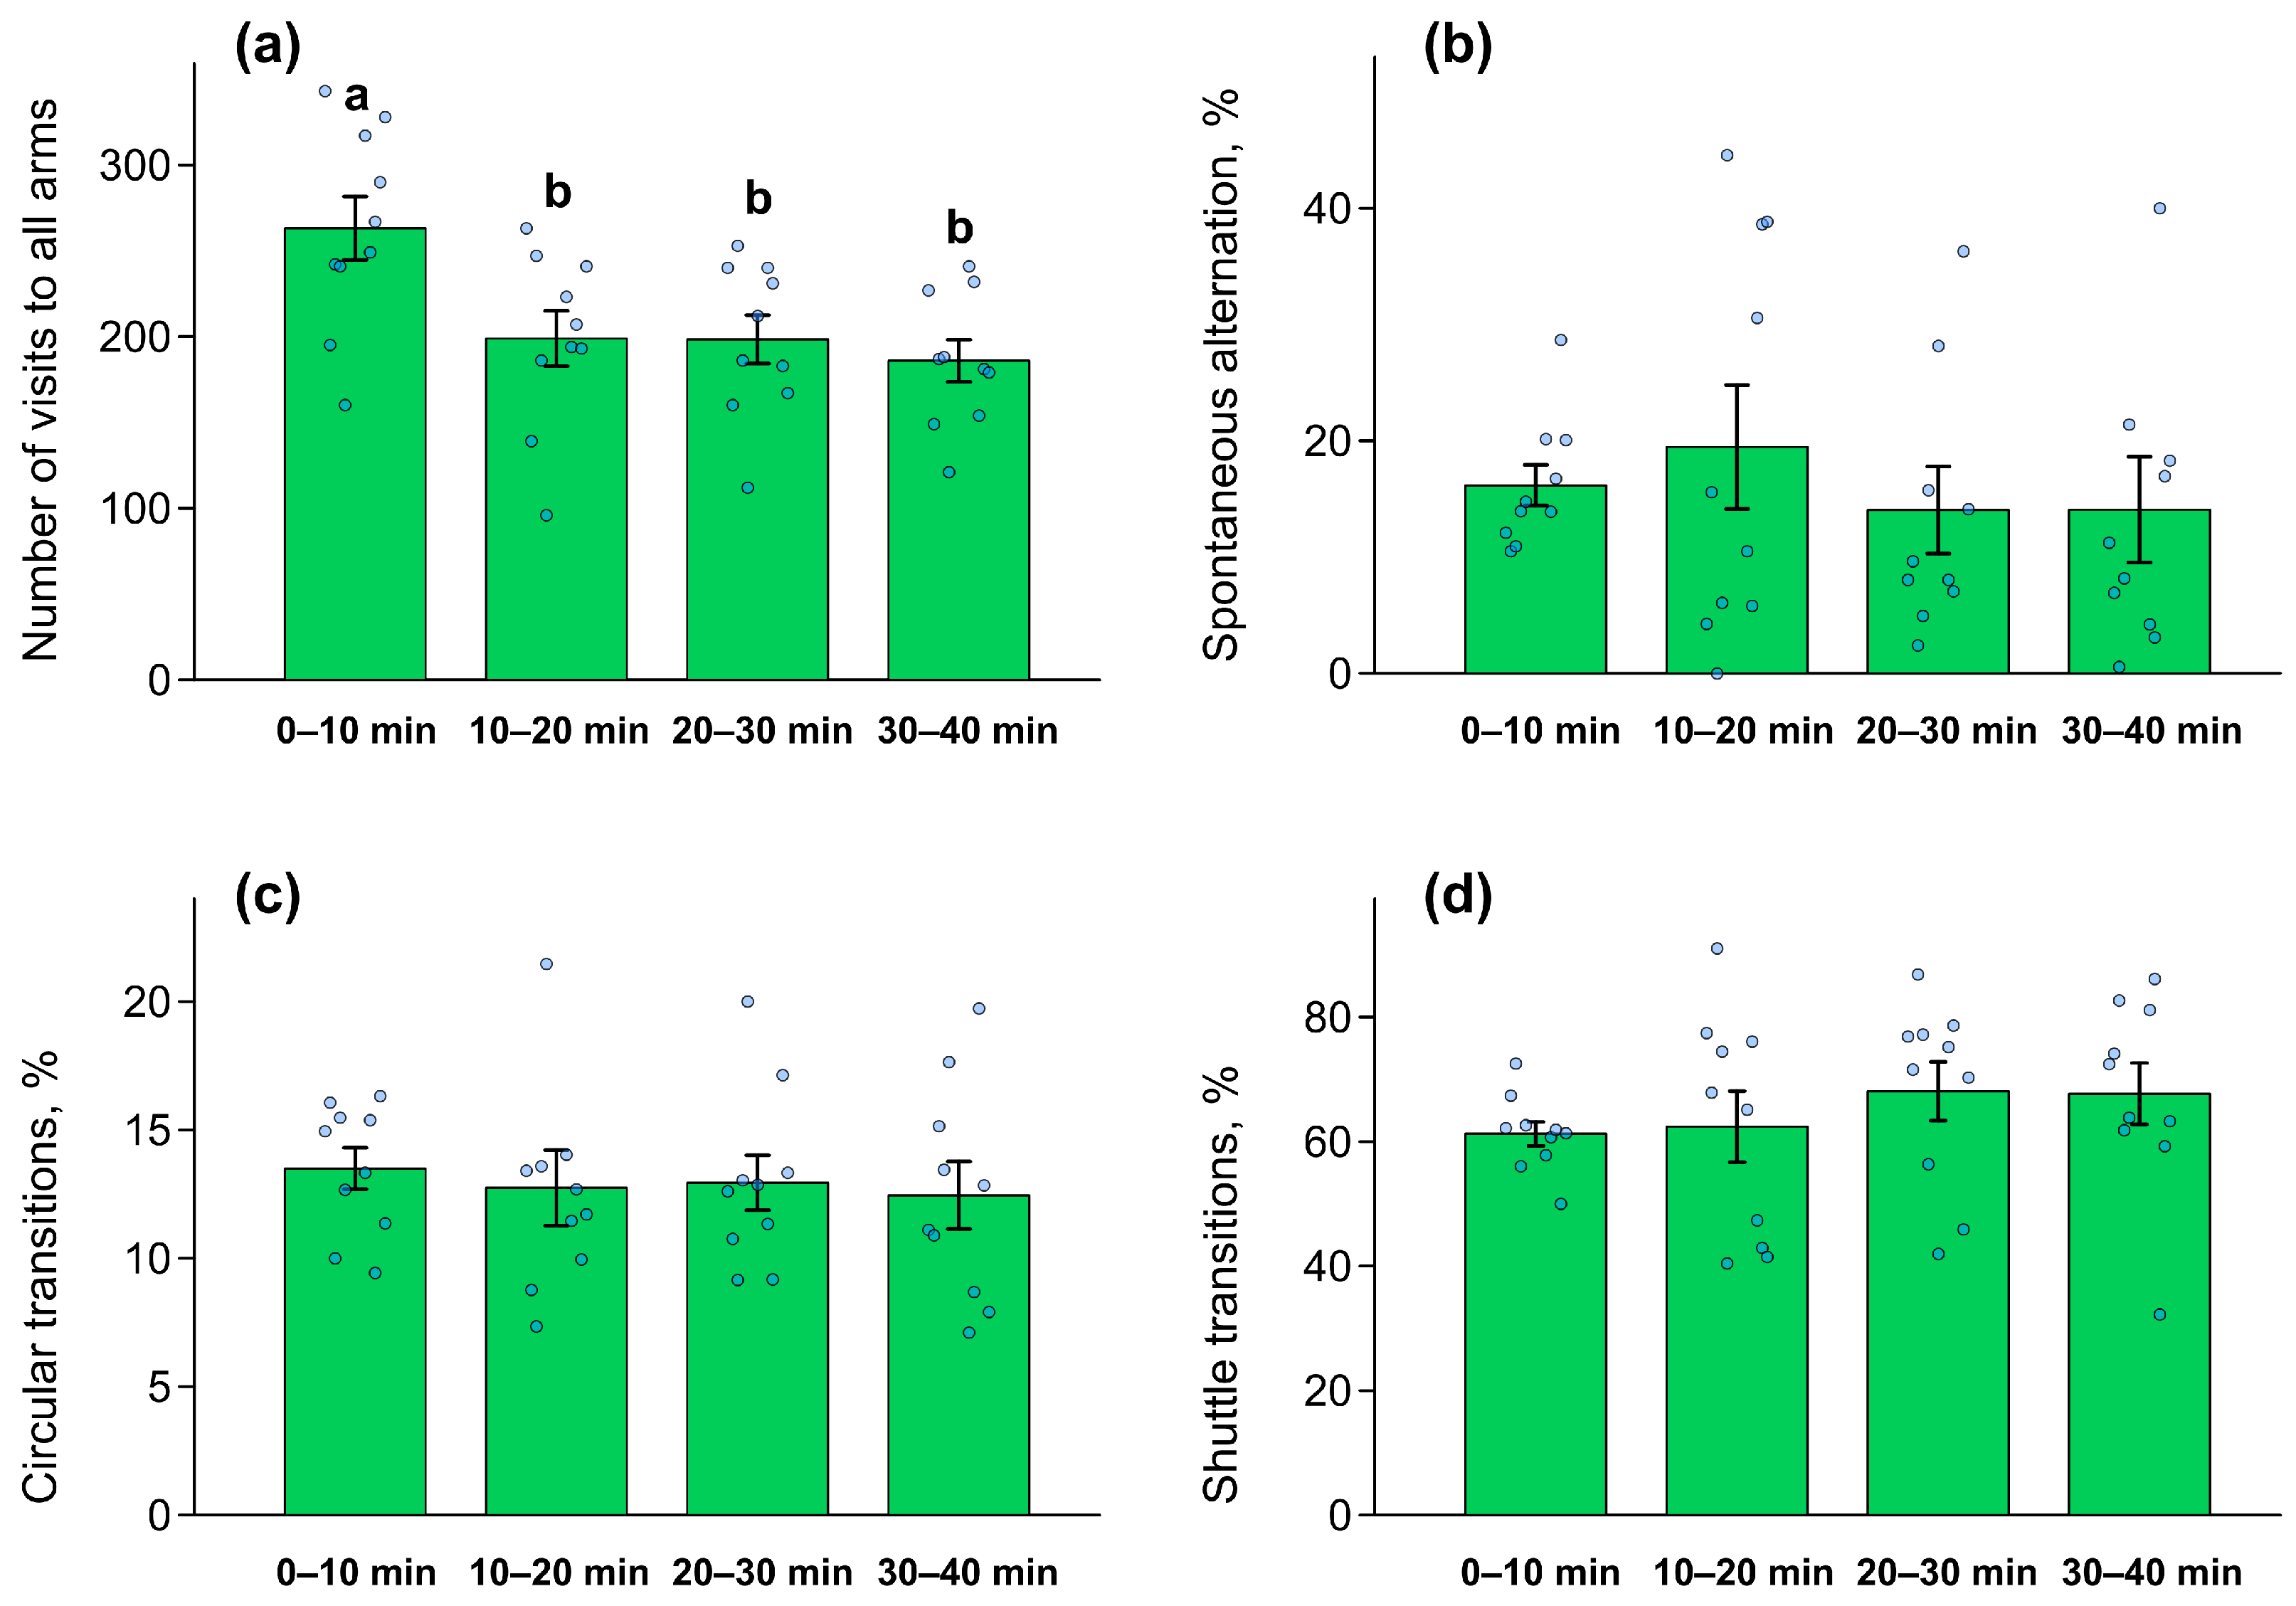
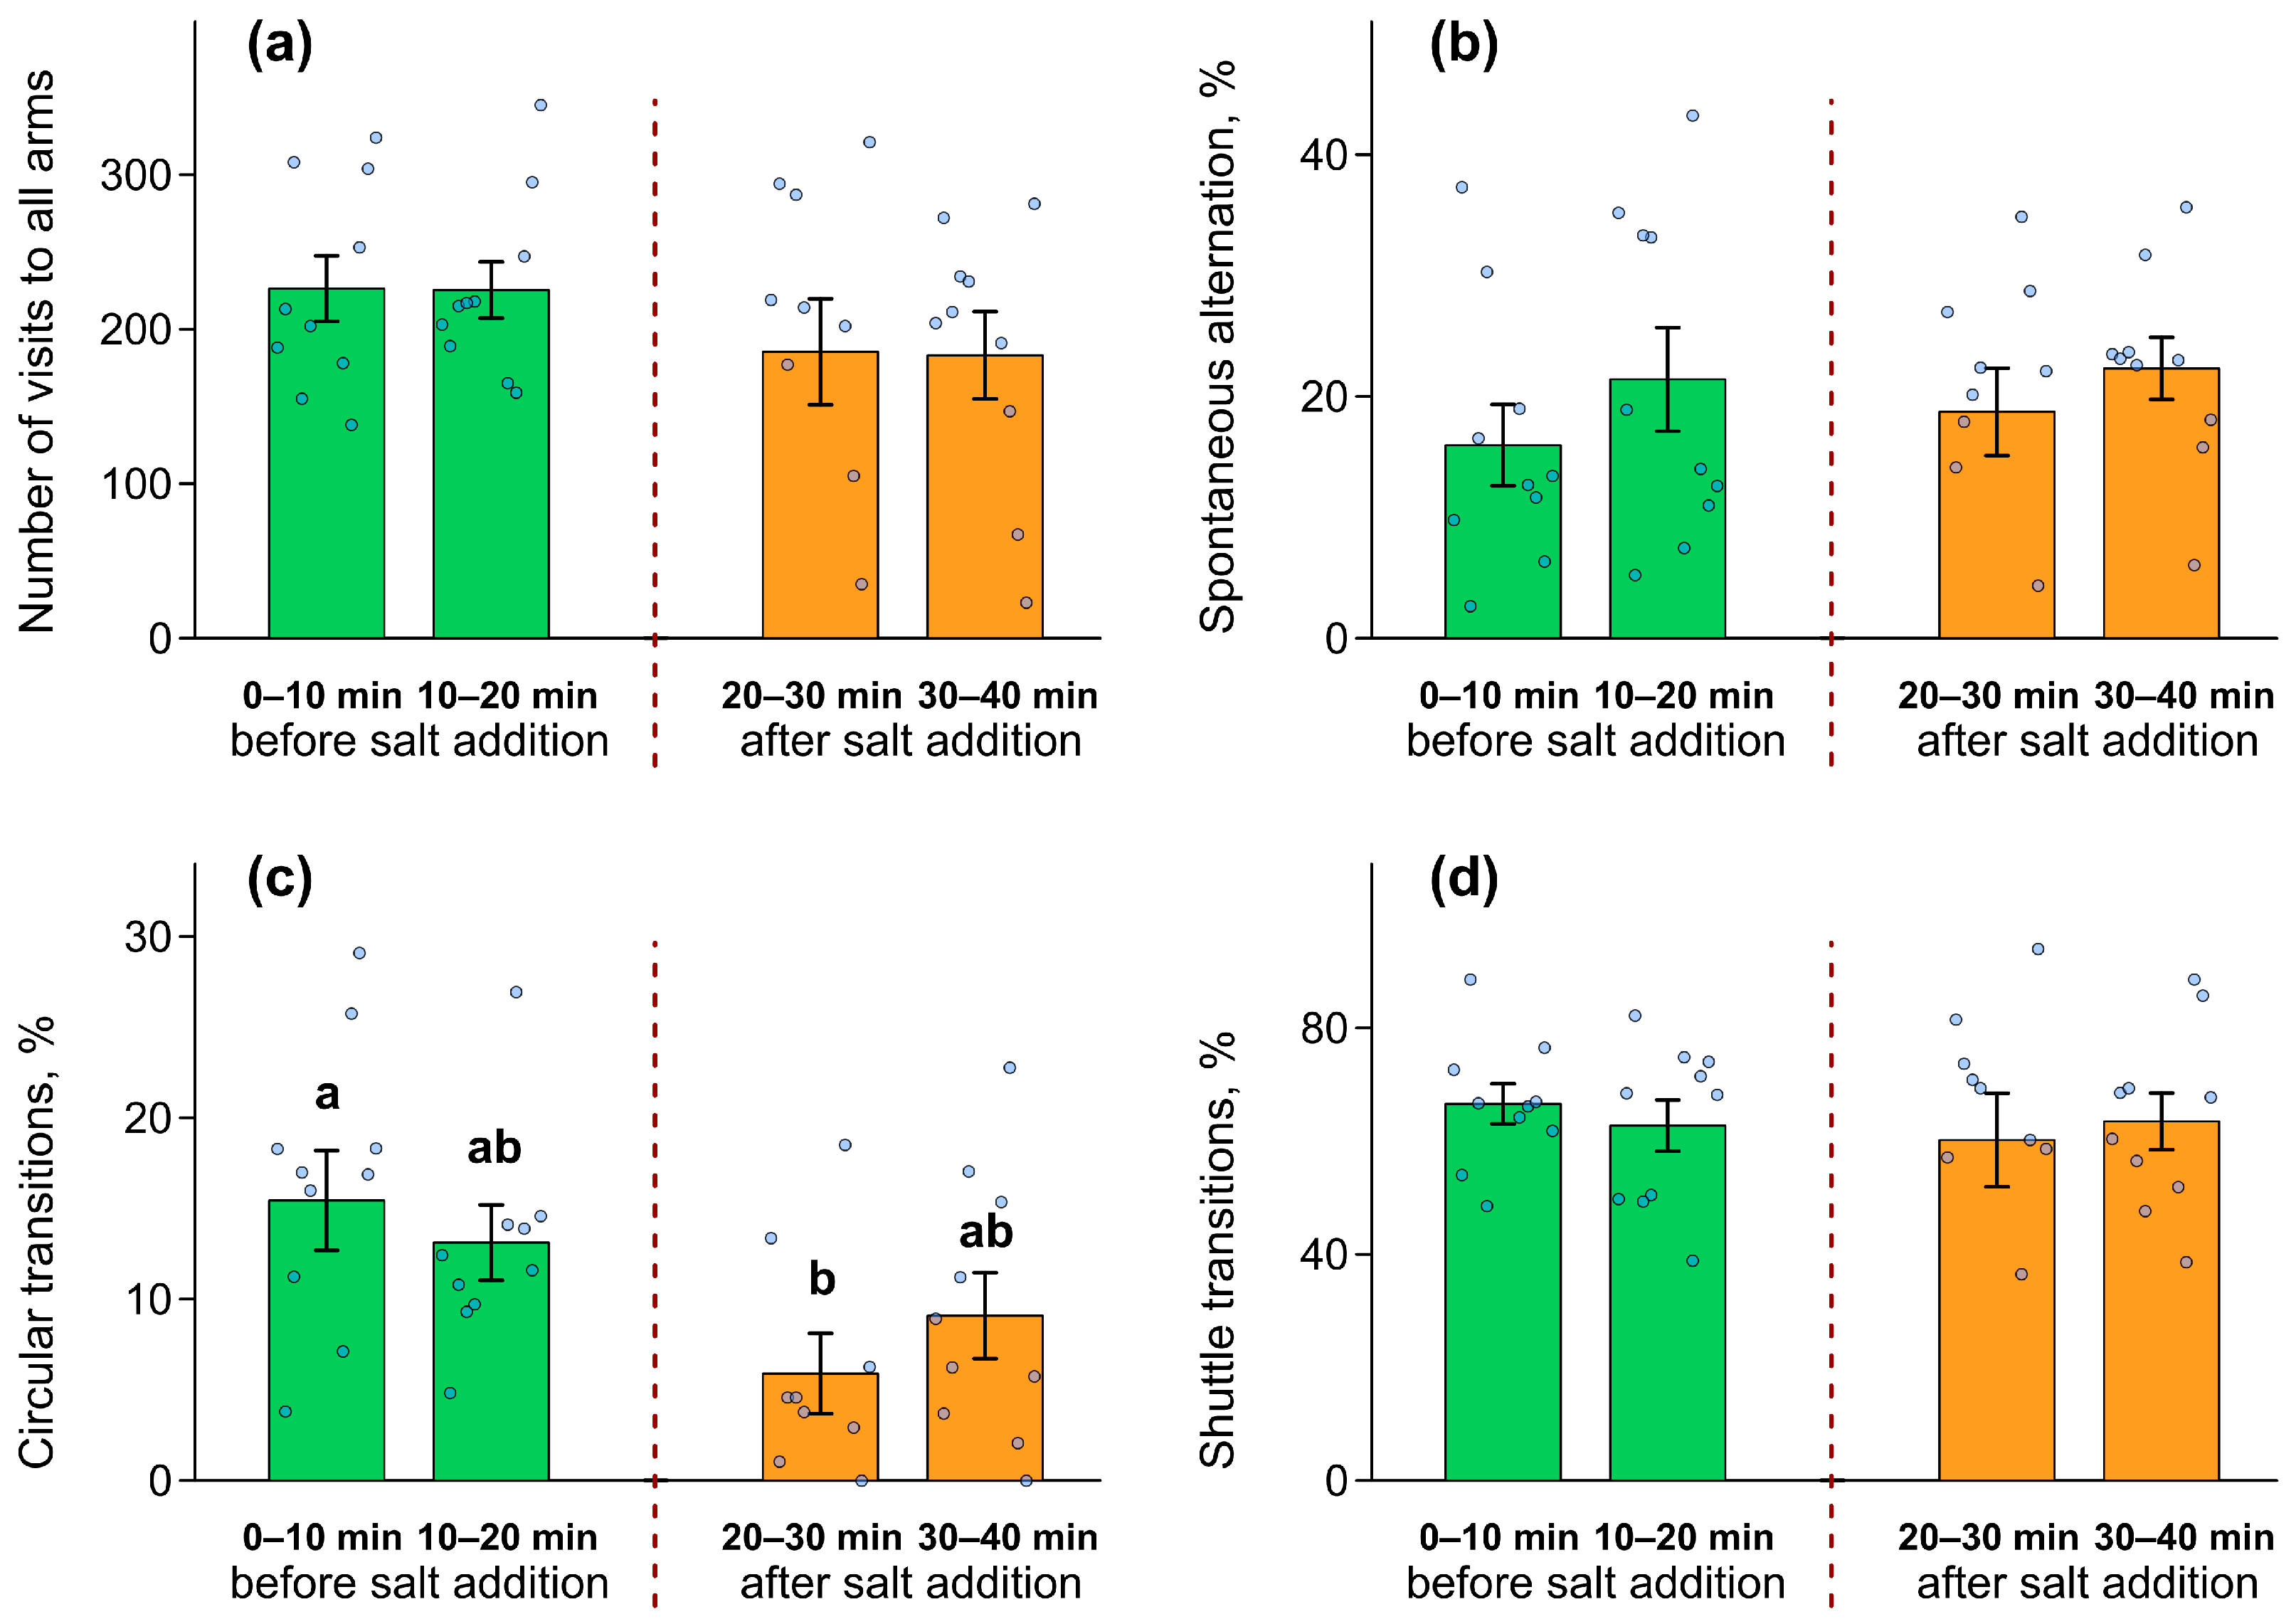
A mixed-design repeated-measures ANOVA revealed a significant effect of time on the total number of arm entries (F (1, 18) = 5.799, p = 0.02697, ŋ2 = 0.244). In both the control (Figure 3a) and salinity stress experiments (Figure 4a), fish exhibited higher locomotor activity, as reflected by the total number of arm entries, during the first 20 min of the trial. In the control experiment, fish showed significantly increased locomotor activity during the first 10 min compared to the subsequent 10-min intervals (Figure 3a).
Figure 3.
Behavioral performance of zebrafish in the plus maze in the control experiment: (a) total number of arm entries; (b) percentage of spontaneous alternation; (c) percentage of circular transitions; (d) percentage of shuttle transitions. Spontaneous alternation is expressed as the percentage of corresponding quintuplets relative to the total number of analyzed quintuplets within each observation interval. Circular transitions and shuttle transitions are expressed as the percentage of circular transition or shuttle transitions triplets relative to the total number of analyzed triplets within each observation interval. Data are presented as mean ± SE; individual data points are shown as dots. Significant differences between 10-min intervals are indicated by different letters. Identical letters indicate no significant difference.
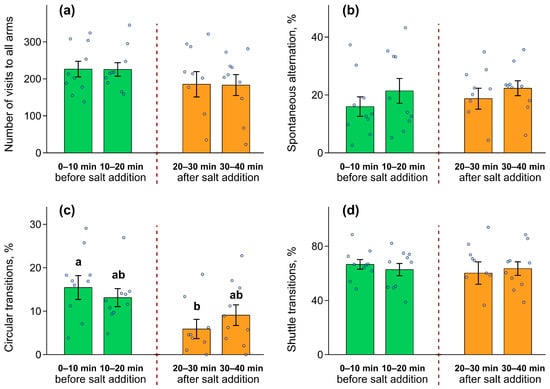
Figure 4.
Behavioral performance of zebrafish in the plus maze during the salinity stress experiment: (a) total number of arm entries; (b) percentage of spontaneous alternation; (c) percentage of circular transitions; (d) percentage of shuttle transitions. Spontaneous alternation is expressed as the percentage of corresponding quintuplets relative to the total number of analyzed quintuplets within each observation interval. Circular transitions and shuttle transitions are expressed as the percentage of circular transition or shuttle transition triplets relative to the total number of analyzed triplets within each observation interval. Data are presented as mean ± SE; individual data points are shown as dots. Green bars represent values before salt addition, and orange bars represent values after salt addition. Different letters indicate significant differences between 10-min intervals; identical letters indicate no significant difference. When multiple letters are present (ab), the corresponding group does not differ significantly from any group sharing at least one of the same letters.
The level of spontaneous alternation, as well as the frequency of shuttle transitions, calculated as the sum of transitions between adjacent arms and between opposing arms, remained relatively stable throughout the 40-min trial in both the control (Figure 3b,d) and salinity stress experiments (Figure 4b,d). A mixed-design repeated-measures ANOVA revealed no significant effects for these behavioral measures.
A mixed-design repeated-measures ANOVA revealed a significant Group (control experiment vs. salinity stress experiment) × Time (0–20 min vs. 20–40 min) interaction effect on circular transitions through the maze arms (F (1, 18) = 11.023, p = 0.00381, ŋ2 = 0.380). The frequency of circular transitions remained approximately constant throughout the 40-min trial in the control experiment (Figure 3c). In the salinity stress experiment, in contrast, during the first 10 min after the increase in salinity (20–30 min in Figure 5), the number of circular transitions decreased by more than twofold compared with any preceding period. The difference between the initial 10-min interval and the 20–30 min interval was statistically significant (Figure 4c).
Figure 5.
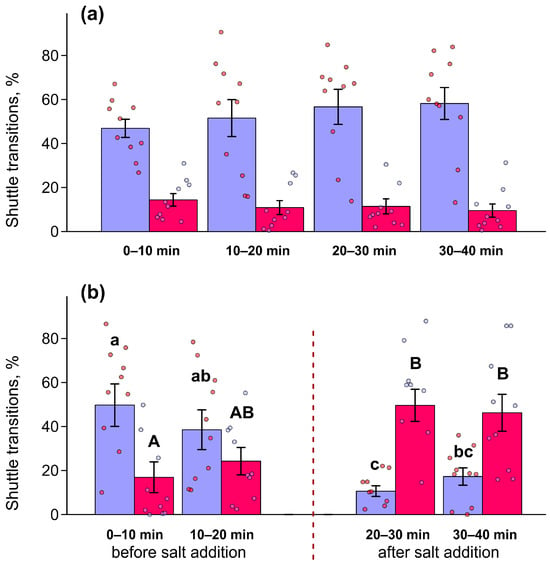
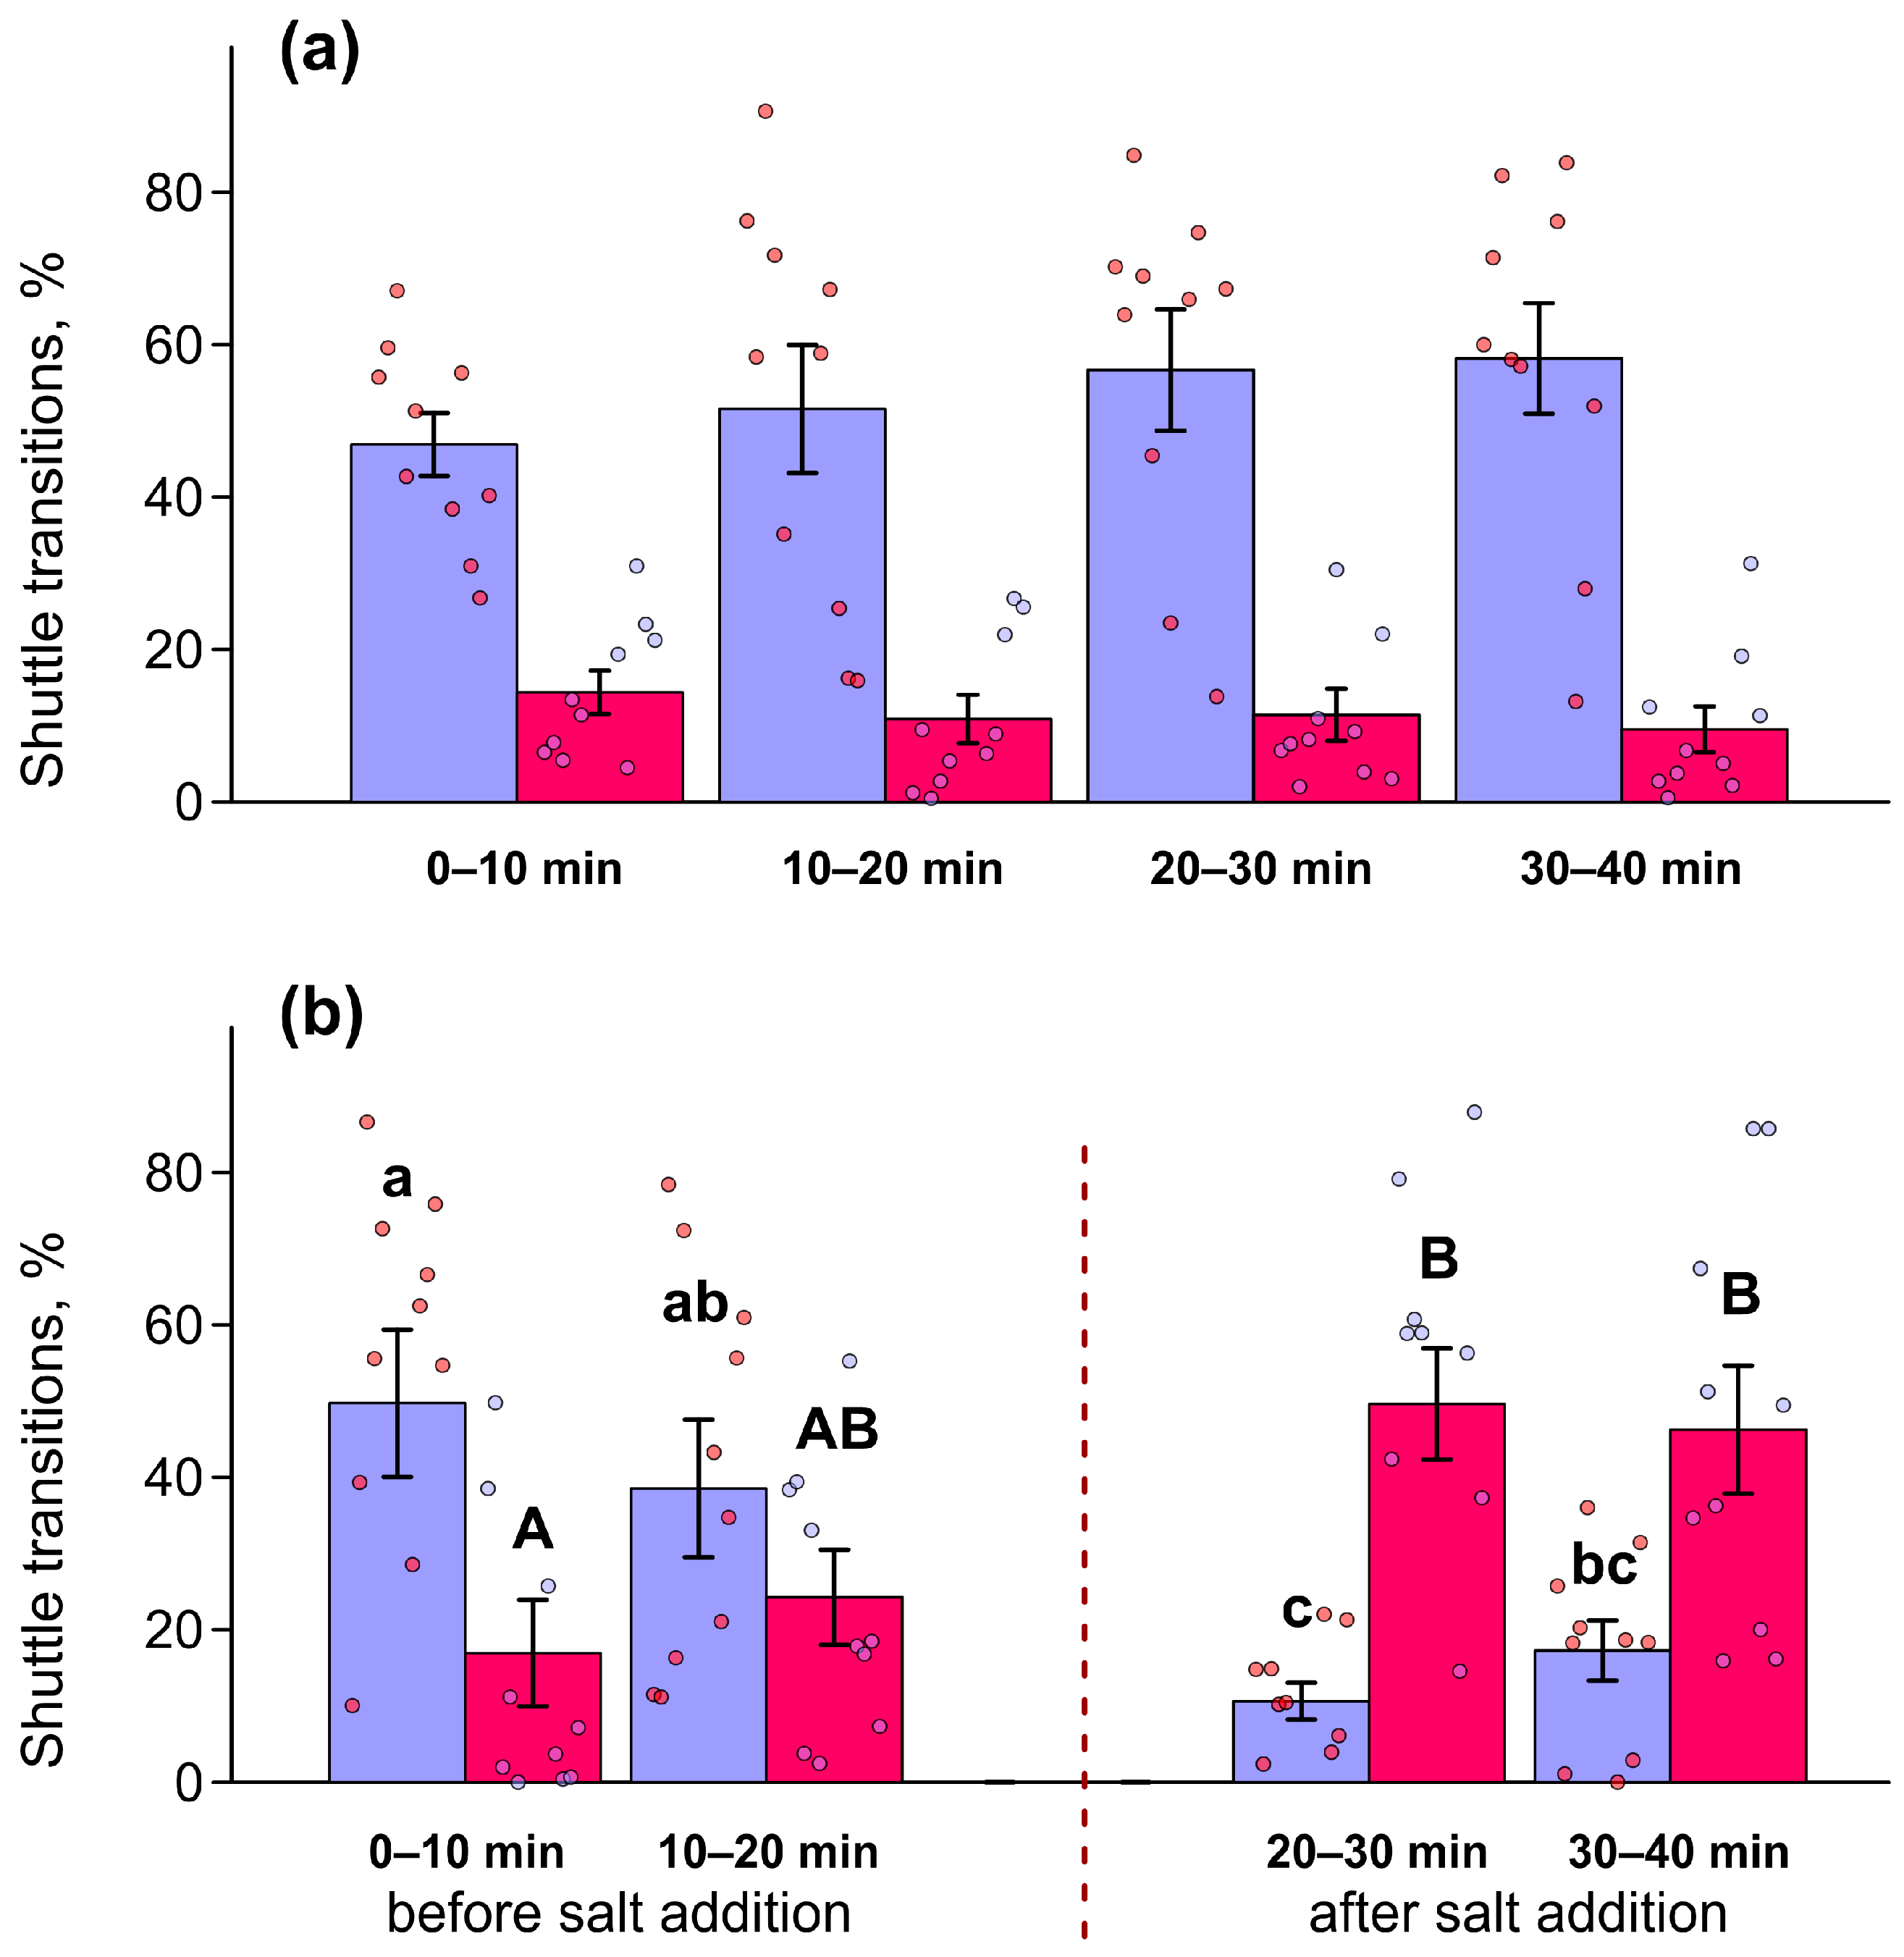
Proportions of shuttle transitions between adjacent arms (blue bars) and between opposing arms (red bars) in the plus maze during the control experiment (a) and the salinity stress experiment (b). Shuttle transitions between adjacent arms were defined as triplets in which a fish returned to the initial arm after visiting a neighboring arm (e.g., 121 or 141), whereas shuttle transitions between opposing arms were defined as triplets in which a fish returned to the initial arm after visiting the opposite arm (e.g., 131 or 242). Values are expressed as the percentage of pattern-specific triplets relative to the total number of analyzed triplets within each observation interval. Data are presented as mean ± SE; individual data points are shown as dots. Significant differences between 10-min intervals are indicated by different lowercase letters for adjacent-arm transitions and by different uppercase letters for opposing-arm transitions. When multiple letters are present (ab, bc, AB), the corresponding group does not differ significantly from any group sharing at least one of the same letters.
Although the overall proportion of shuttle transitions between adjacent and opposing arms remained approximately constant throughout the 40-min trial under both control and salinity stress conditions (Figure 3d and Figure 4d), a pronounced shift was observed in the relative contribution of these two transition types following salinity exposure. In the absence of any stimuli, movements between adjacent arms predominated throughout the 40-min experiment, accounting for approximately 50% of all arm entries. Shuttle transitions between opposing arms remained at a much lower level (10–15%) during the entire trial (Figure 5a).
A similar pattern was observed during the first 20 min of the salinity stress experiment, before salinity exposure. Immediately after the addition of the stressor, however, the pattern changed dramatically in a mirror-like manner. The proportion of shuttle transitions between adjacent arms decreased to 11% and 17% of all arm entries during the 20–30 min and 30–40 min intervals, respectively (Figure 5b). These changes were supported by a mixed-design repeated-measures ANOVA, which revealed a significant Group × Time interaction effect on this parameter (F (1, 18) = 17.409, p = 0.00057, ŋ2 = 0.492). Conversely, shuttle transitions between opposing arms increased to nearly 50% of all arm entries following salinity exposure during the 20–40 min period (Figure 5b). This was also confirmed by ANOVA, which revealed a significant Group × Time interaction (F (1, 18) = 13.518, p = 0.00173, ŋ2 = 0.429).
Under non-stress conditions, a typical negative relationship was observed between the level of spontaneous alternation and shuttle movements. In the control experiment, the correlation coefficient was −0.9529 (n = 10, p < 0.001) during the 0–20 min interval and −0.9761 (n = 10, p < 0.001) during the 20–40 min interval. In the salinity stress experiment before salt addition, the corresponding correlation was −0.9597 (n = 10, p < 0.001). When the two types of shuttle movements were considered separately, a strong negative correlation was found between spontaneous alternation and shuttle transitions between adjacent arms: −0.9254 (n = 10, p < 0.001) during 0–20 min and −0.963 (n = 10, p < 0.001) during 20–40 min in the control experiment, and −0.8714 (n = 10, p < 0.01) in the salinity stress experiment before salt addition. In contrast, the relationship between spontaneous alternation and shuttle transitions between opposing arms was significantly positive: 0.7898 (n = 10, p < 0.01) during 0–20 min and 0.8504 (n = 10, p < 0.01) during 20–40 min in the control experiment, and 0.6427 (n = 10, p < 0.05) in the salinity stress experiment before salt addition.
These relationships changed markedly under salinity stress. Correlation coefficients changed in sign, and the associations became statistically non-significant (r = 0.4954, n = 10, p > 0.1 for spontaneous alternation and shuttle transitions between adjacent arms, and r = −0.5709, n = 10, p > 0.05 for spontaneous alternation and shuttle transitions between opposing arms).
The Z-scores from the runs test for the key parameters affected by salinity stress are presented in Table 1. During the control experiment and before salt addition, Z-scores did not differ significantly from zero. Under salinity stress, however, Z-scores became negative and significantly different from zero. For the sum of shuttle transitions between adjacent and opposing arms, as well as for transitions between opposing arms alone, Z-scores were significantly below zero under all conditions. Notably, the Z-score for transitions between opposing arms was substantially lower than that for the combined measure. The addition of salt resulted in a decrease in Z-scores in the salinity stress experiment (Table 1).
Table 1.
Z-scores from runs test analyses for key behavioral performance of zebrafish in the plus maze under salinity stress.
3. Discussion
The use of a plus maze with identical arms implies that each arm should be visited with equal probability during the test when the level of spontaneous alternation is close to 44.4% [22,23]. The levels of spontaneous alternation observed in our experiments indicate that arm visitation by fish was not random. The use of different locomotor strategies during maze exploration, particularly shuttle transitions, can introduce spatial biases. It may result in individual fish preferentially visiting specific arms. However, such individual preferences are expected to be averaged out at the group level. In our experiments, no statistically significant preference for any arm of the maze was detected, except for the first 10-min interval in trials investigating salinity stress. This effect was most likely related to the experimental setup. During the first 20 min of these experiments, a thin, transparent tube had been inserted beneath the glass cover of the maze to allow for the subsequent injection of the salt solution. The tube was positioned in arm 3 of the maze. It is likely that the presence of this object initially deterred the fish, resulting in a reduced frequency of entries into this arm and a corresponding increase in visits to the opposite arm. Importantly, no arm preference was detected during subsequent observation periods, suggesting rapid habituation to this stimulus. The presence of an identical tube used for water addition in the control experiment did not affect overall arm preferences or avoidance at the group level. Moreover, the major stress-induced changes in movement patterns were observed after salt addition, i.e., when the initial arm bias had already disappeared.
Nevertheless, the possibility that the tube influenced exploratory behavior during the early phase of the experiment should be considered as an important methodological limitation. Future experiments should therefore incorporate a concealed system for injecting test substances into the maze. This could be achieved by masking the injection port or by creating four identical small openings in each arm of the maze to eliminate potential spatial bias.
In both the first 10 min of the control experiment and the first 20 min of the salinity stress experiment, an increased number of arm entries was observed. This transient increase in locomotor activity upon exposure to a novel environment, followed by a gradual decline during acclimation, has been previously described in adult zebrafish [24,25,26]. These behavioral patterns during the initial 10 min of maze exposure are commonly interpreted as exploratory responses to a novel environment [25,26].
Salinity stress models in D. rerio contribute substantially to the understanding of stress physiology and neuroendocrinology [27]. Zebrafish exhibit clear avoidance behavior when exposed to increased salinity, which is crucial for their survival as freshwater fish that cannot tolerate highly saline environments [28]. Previous studies have also shown that zebrafish exhibit reduced exploratory behavior in response to both increased salinity [29] and other stressors [30]. In the present study, fish remained in the maze for a relatively long period before the introduction of the stressor, allowing them to acquire some experience of moving within the maze environment [8]. When all arms of the maze are equivalent, movement along the perimeter from arm to arm in either clockwise or counterclockwise directions may represent an element of exploratory behavior aimed at verifying recently acquired information about the spatial structure of the maze [8]. Thus, the reduction in the proportion of circular transitions observed under salinity stress in our experiment can be interpreted as a decrease in exploratory activity.
The most pronounced manifestation of stress observed after salinity exposure under the present experimental conditions, however, was a dramatic change in the relative proportions of shuttle transitions between adjacent and opposing arms. Under stress conditions, fish predominantly swam between opposing arms. This movement pattern allows zebrafish to spend the maximum amount of time in straight-line swimming. However, transitions between adjacent arms require two additional turns to enter and exit the neighboring arm. To our knowledge, previous studies have not reported changes in zebrafish locomotor patterns in a plus maze under stress or anxiety conditions.
In freshwater fish, hyperosmotic exposure activates osmosensory signaling pathways, including MAPK cascades (p38, JNK) and the transcription factor TonEBP/NFAT5, which is involved in the regulation of osmoprotective gene expression [31]. This response is associated with increased synthesis of stress-adaptive molecules, including ubiquitin E3 ligases and the mRNA stabilizer HuR [31]. The expression and activity of ion transport proteins in gill ionocytes are changed to facilitate ion excretion under hyperosmotic conditions [32]. Although these molecular responses were not directly assessed in the present study, they provide a relevant framework for future validation of the observed behavioral effects. Future research that combines behavioral assays with the analysis of gene expression related to salinity stress in these signaling pathways may clarify the mechanistic connections between osmotic challenges and changes in exploratory behavior.
Adaptation to salinity stress also involves endocrine regulation. Cortisol, the primary glucocorticoid hormone in D. rerio, plays a central role in both the stress response and osmoregulation. In teleost fish, which do not produce aldosterone, cortisol fulfills both glucocorticoid and mineralocorticoid functions [33,34]. At the same time, the mineralocorticoid receptor (MR) in zebrafish is also involved in regulating the activity of the hypothalamic–pituitary–interrenal (HPI) axis [34], although its precise role remains an area of active investigation. Previous studies have demonstrated that salinity stress activates the HPI axis in teleosts, accompanied by elevated cortisol levels [35,36,37]. Zebrafish exposed to salinity stress also exhibit behavioral responses similar to those observed in anxiety models [38]. In the present study, the salinity treatment significantly increased the whole-body cortisol level. It demonstrates that the salinity treatment acted as an effective stressor. However, because cortisol levels and behavioral parameters were measured in different individuals, the present data do not allow conclusions regarding a direct causal relationship between endocrine and behavioral responses. The underlying mechanisms and functional significance of the observed shift in the balance between shuttle transitions involving adjacent versus opposing arms require further investigation.
The reduction in exploratory activity and the increased proportion of visits to opposing arms were also reflected in related behavioral metrics. In all groups, the level of spontaneous alternation was significantly lower than 44.4%, the value expected for a random sequence of arm visits [39]. It indicates that fish tended to return to arms that had been visited recently. Moreover, the strong negative correlations between spontaneous alternation and visits to adjacent arms, typical for zebrafish behavior [22], shifted to positive correlations following salt addition. This change reflects a substantial modification of movement patterns within the maze, characterized by a sharp increase in visits to opposing arms. The decrease in Z-scores for the key behavioral metrics responsive to salinity change further indicates an increased tendency to repeat similar actions in series.
4. Materials and Methods
The present study assessed behavioral and physiological responses to salinity stress, including locomotor activity, arm-transition patterns in a plus maze, and whole-body cortisol levels.
4.1. Zebrafish Maintenance
Wild-type zebrafish (D. rerio, AB strain) were obtained from a commercial distributor and maintained under laboratory conditions. Before experimentation, D. rerio were kept together for two months in 70 L aquaria at 26 °C. A 12:12 h light/dark cycle was used.
Adult males and females approximately four months of age (3.01 ± 0.15 cm total length, 0.27 ± 0.03 g body mass; n = 20) were used in the experiments. Sex ratio was 50% males and 50% females in each test to assess potential sex-specific differences in responses to the applied treatment. However, no sex-related effects were detected. Each zebrafish was employed for a single experimental trial. A priori power analysis for a repeated-measures ANOVA (G*Power 3.1) indicated that a minimum sample size of 10 animals is required to detect a large effect size (f = 0.40) with α = 0.05, assuming a within-subject design with two repeated conditions. All experimental protocols were approved by the Institutional Animal Care and Use Committee (protocol #33, 6 February 2025). The intensity and duration of the stress exposure were within established limits and did not result in any detectable adverse effects on animal welfare.
4.2. Experimental Setup
To provide uniform backlit illumination, a custom lightbox was constructed with an array of light emitting diodes mounted 10 cm below a cover made of matte plexiglass, which served to diffuse the light evenly. Bottom illumination eliminated surface glare on the water, thereby facilitating automated video processing. A glass aquarium measuring 15 by 20 cm and 15 cm high was positioned directly on top of the lightbox. A plus-shaped maze was placed inside the aquarium.
The maze consisted of four arms extending from a central zone at right angles to each other and was fabricated from ABS plastic using a 3D printer. Each arm of the maze was 45 mm long and 30 mm wide. The central zone was 30 × 30 cm. The maze was 60 mm high and had no bottom, allowing light from the lightbox to pass through. Maze dimensions were chosen based on previous experiments (unpublished data) as optimal for zebrafish of the size used in this study.
The aquarium was filled with water from the holding facility to a depth of 80 mm, fully submerging the maze. After a fish was gently placed into the maze, the experimenter covered it with a glass plate from above. The water level above the glass was approximately 20 mm. This configuration eliminated the possibility of fish escaping or jumping over the maze walls, ensuring continuous behavioral tracking.
An IP camera (TR-D1140, Trassir, Shenzhen, China) was mounted directly above the center of the maze to record fish behavior throughout the experiment. Videos were captured in black and white at 25 frames per second with a resolution of 2592 × 1520 pixels. Video signals were transmitted via a switch (T1500-28PCT, TP-Link, Shenzhen, China) to a server-based video recorder (MiniNVR AF16, Trassir, Shenzhen, China).
4.3. Experimental Design
Individual zebrafish were transferred to a submerged maze positioned within an aquarium and covered with a glass plate to prevent escape. The total water volume within the maze was 378 cm3. A thin (diameter 1 mm) transparent silicone tube was inserted beneath the glass cover into arm 3 of the maze.
Fish were allowed to explore the maze for 20 min without any experimental manipulation. During this period, locomotor behavior was recorded to obtain baseline measurements. After the 20-min acclimation and baseline recording phase, 10 mL of a NaCl solution (0.189 g/mL) was slowly injected into the maze via the tube to achieve a final salinity of 5‰, thereby inducing a stress response. The injection rate was approximately 1 mL/s. Immediately after injection, a transient spatial salinity gradient may have occurred. However, it was rapidly homogenized due to water movement generated by fish locomotion. The final salinity in the maze immediately after injection was estimated in a simulation test without fish and was ~5‰. Salinity, measured 20 min after injection in simulation conditions and at the end of the salinity stress experiment, ranged from approximately 4.7 to 4.9‰. Following injection, the tube was carefully removed, and fish behavior was recorded for an additional 20 min under salinity stress conditions. This protocol was performed on 10 fish in the experimental group.
The choice of 5‰ salinity was based on previous studies demonstrating that this level induces a stress response in zebrafish while allowing full recovery after 20 min of exposure [7,40].
Salinity levels were verified by measuring electrical conductivity using an EC400F conductometer (Ybo Technologies, Hefei, China). The conductivity values were converted to salinity based on the dissolved ion content.
An additional 10 fish served as controls. They experienced the same procedure, including placement in the maze and behavioral recording. A transparent silicone tube was also inserted into the maze in the control condition, and after the 20-min recording period, the same volume of system water was injected using the same procedure. This design allowed us to distinguish the effects of salinity from those associated with experimental manipulation.
4.4. Data Processing
The video recordings were processed using the open-source software idTracker v2.1 [41], which extracted the X and Y coordinates of each fish’s body center in every frame. The coordinate data were subsequently analyzed using a custom Excel file with embedded macros to determine the fish’s position relative to the central platform and the four arms of the maze. The arms were numbered clockwise from 1 to 4, starting with the arm located at the top of the frame. An arm entry was recorded when the fish crossed a line positioned 5 mm from the central platform. Fish rarely re-entered the same arm immediately after exiting it without visiting another arm. When such immediate re-entries occurred, they were counted as a single visit.
4.4.1. Locomotor Activity
Locomotor activity was quantified as the number of arm entries during each 10-min observation interval. For each experimental group, mean activity was calculated for every 10-min segment.
4.4.2. Spontaneous Alternation
Spontaneous alternation was calculated according to the method of Ragozzino et al. [23]. The full sequence of arm entries during the observation period was divided into overlapping sets of five consecutive visits. For example, the sequence 1423123424 yields the following quintuplets: 14231, 42312, 23123, and so forth.
Under random movement conditions, the probability that a fish visits all four arms within five consecutive entries can be calculated stepwise. The probability of visiting all four different arms within a quintuplet equals 44.4% [22]. The spontaneous alternation rate was defined as the number of quintuplets containing visits to all four arms divided by the total number of quintuplets.
An alternation rate exceeding 44.4% indicates a tendency to preferentially visit arms that have not been entered recently (i.e., spontaneous alternation). Values below this threshold reflect a bias toward revisiting recently explored arms.
4.4.3. Movement Patterns
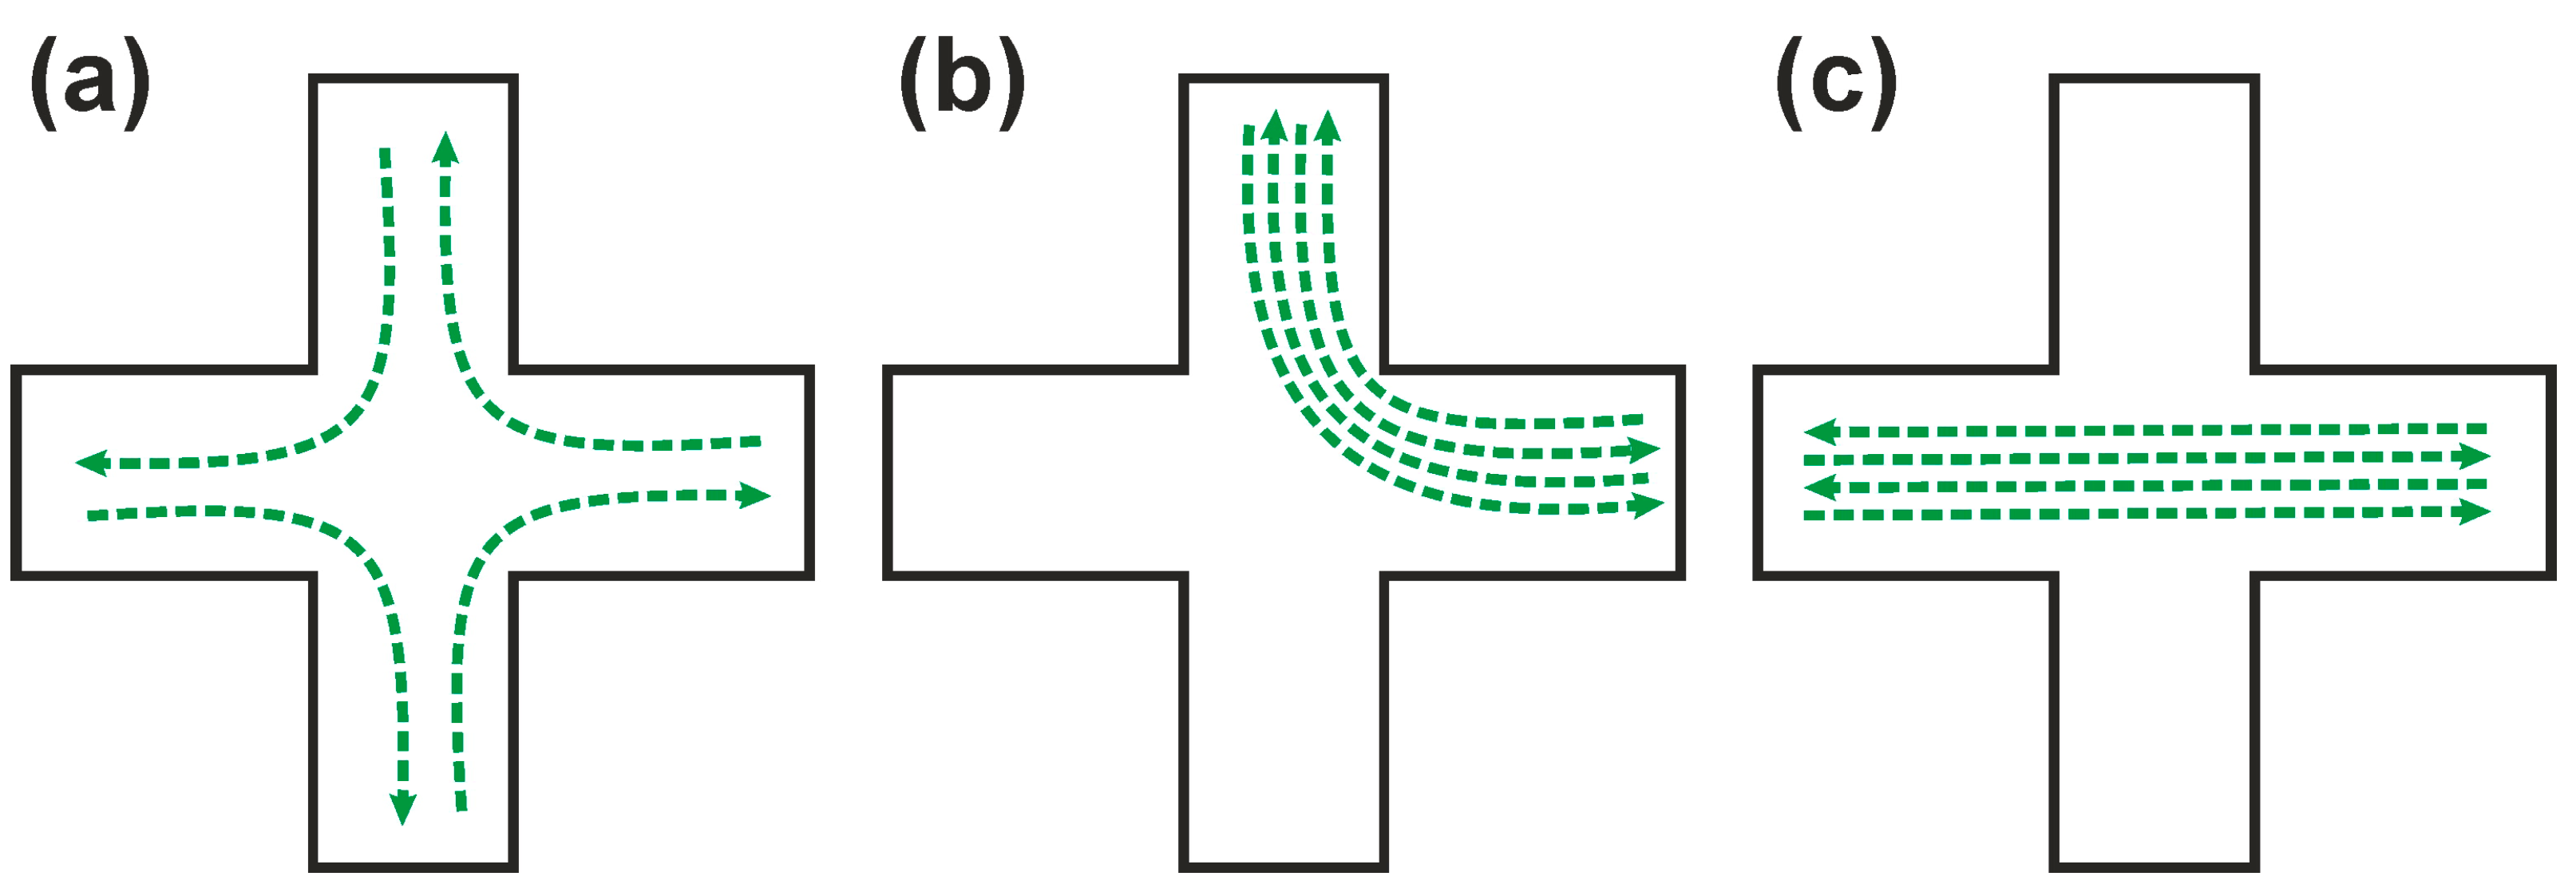
Fish movement patterns in the plus maze were analyzed according to the method proposed by Red’ko et al. [8]. The following movement patterns were identified within the sequence of arm entries (Figure 6, Supplementary Files: Video S1, Video S2, Video S3):
Figure 6.
Representative movement patterns of zebrafish in the plus maze: (a) circular transitions; (b) shuttle transitions between adjacent arms; (c) shuttle transitions between opposing arms. The green arrows indicate the approximate trajectory of the fish’s movement.
- Shuttle transitions between adjacent arms, for example, 121212 or 141414.
- Shuttle transitions between opposing arms, such as 131313 or 242424.
- Transitions between arms in a circular direction, either clockwise (1234) or counterclockwise (3214).
Occasional irregular or random sequences (e.g., 231421) were also observed but occurred infrequently.
To quantify these patterns, the complete sequence of arm entries during the observation period was divided into overlapping triplets of consecutive visits. For example, the sequence 324343121212432 yields the triplets 324, 243, 434, and so forth.
To detect shuttle transitions between adjacent arms, each triplet was examined sequentially. A triplet was coded as “1” if it matched the pattern “initial arm—adjacent arm—initial arm”; otherwise, it was coded as “0”. Shuttle transitions between opposing arms were identified in the same manner, except that the condition was “initial arm—opposite arm—initial arm”.
To quantify circular transitions, overlapping triplets were again analyzed. A triplet was coded as “1” if it represented clockwise or counterclockwise progression (123, 234, 341, 412, 432, 321, 214, or 143); in all other cases, it was coded as “0”.
Thus, each original sequence of arm entries was transformed into a binary sequence for each pattern. The proportion of each pattern was calculated as the number of ones (pattern-specific events) divided by the total number of triplets during the observation period. The original arm entry sequences and the binary sequences for each pattern are available in the Supplementary File “raw data”.
4.5. Whole-Body Cortisol Measurement
An additional 40 adult zebrafish were used for whole-body cortisol analysis under salinity stress conditions in the plus maze. These fish were subjected to the same experimental procedures as those used for behavioral assessment. Ten fish from both the control and experimental groups were collected and immediately frozen in liquid nitrogen after 20 min of exposure to the plus maze (corresponding to the pre-stress phase in the experimental group). Another set of 10 fish from each group was collected and frozen after 40 min in the maze (corresponding to the stress phase following salinity exposure in the experimental group).
Whole-body cortisol levels were measured using a commercially available enzyme-linked immunosorbent assay kit, Fish Cortisol MBS704055 (MyBioSource, San Diego, CA, USA). Cortisol extraction and assay procedures were performed according to the manufacturer’s instructions. Spectrophotometric measurements were conducted in duplicate for each sample using a Multiskan FC microplate photometer (Thermo Scientific, Waltham, MA, USA).
4.6. Statistical Analysis
Whole-body cortisol levels within each group of 10 fish did not significantly deviate from normality (Shapiro–Wilk test), and variances were homogeneous (Levene’s test). Therefore, data were analyzed using analysis of variance (ANOVA) followed by Tukey’s post hoc test.
To reduce short-term variability within experimental phases, behavioral measurements were averaged across two consecutive 10-min intervals for each condition. This procedure resulted in a single value for the pre-stress phase (0–20 min) and a single value for the post-stress phase (20–40 min) for each fish. A mixed-design repeated-measures analysis of variance (ANOVA) was applied to assess the effects of stress exposure. The within-subject factor “phase” was experimental phase (0–20 min or pre-stress vs. 20–40 min or post-stress), and the between-subject factor “group” was treatment group (control experiment vs. salinity stress experiment). The main effects of “phase” and “group”, as well as the interaction between “phase” and “group”, were evaluated. Normality of distributions was verified using the Shapiro–Wilk test or the Kolmogorov–Smirnov test, and homogeneity of variances was assessed using Levene’s test. Where significant effects were detected, post hoc comparisons were performed using Student’s t-test for dependent or independent samples, as appropriate, with Bonferroni correction applied for multiple comparisons.
Correlations between behavioral parameters were assessed using Pearson’s correlation coefficient. To determine whether elements of movement patterns in the binary sequences occurred randomly or in non-random sequences, the Runs test was applied. One-sample Student’s t-tests were used to compare group means with predefined reference values.
5. Conclusions
The present study suggests that an increased proportion of visits to opposing arms of a plus maze may serve as a candidate behavioral indicator of stress in zebrafish, pending further validation. This metric appears particularly informative when compared with the well-known reduction in exploratory activity under stress conditions [27,42,43], which was reflected by a decreased proportion of circular transitions in the present study. Thus, an increased proportion of visits to opposing arms of a plus maze may represent a useful candidate indicator for detecting stress in adult zebrafish tested in a plus maze with identical arms. Such an approach could find applications in ecotoxicological studies and in preclinical drug testing. Furthermore, the use of automated video-tracking systems and machine-learning methods may substantially expand the possibilities for rapid data acquisition while minimizing observer bias in screening and comparative studies. Nevertheless, further research using different stressors and experimental conditions will be required to evaluate the broader applicability of this behavioral endpoint.
Supplementary Materials
The following supporting information can be downloaded at https://www.mdpi.com/article/10.3390/stresses6030045/s1. Raw data: raw_data.xslx; Video S1: Circular transitions.avi. Video S2: Shuttle transitions (adjacent arms).avi. Video S3. Shuttle transitions (opposing arms).avi.
Author Contributions
V.V.K. and E.A.O. conceived the ideas and designed methodology; E.A.O. supervised the project; V.V.K. performed the video recording and wrote the first draft of the manuscript; E.G.E. developed the software; V.V.P., A.E.D., V.K.T. and N.A.P. analyzed the data. All authors have read and agreed to the published version of the manuscript.
Funding
This research was funded by the Russian Science Foundation, grant number 25-24-00024 (https://rscf.ru/en/project/25-24-00024/ (accessed on 6 July 2026)).
Institutional Review Board Statement
The animal study protocol was approved by the Institutional Animal Care and Use Committee of the Papanin Institute for Biology of Inland Waters, Russian Academy of Sciences (protocol #33, 6 February 2025).
Informed Consent Statement
Not applicable.
Data Availability Statement
The original contributions presented in this study are included in the article/Supplementary Materials. Further inquiries can be directed to the corresponding author.
Conflicts of Interest
The authors declare no conflicts of interest.
References
- Chen, X.; Li, Y.; Yao, T.; Jia, R. Benefits of zebrafish xenograft models in cancer research. Front. Cell Dev. Biol. 2021, 9, 616551. [Google Scholar] [CrossRef] [Scilit] [PubMed]
- Liu, Y. Zebrafish as a model organism for studying pathologic mechanisms of neurodegenerative diseases and other neural disorders. Cell. Mol. Neurobiol. 2023, 43, 2603–2620. [Google Scholar] [CrossRef] [Scilit] [PubMed]
- Lima, C.; Gusso, D.; Disner, G.R.; Pinto, F.J.; Falcão, M.A.P.; Rosa, J.G.S.; Lopes-Ferreira, M. The zebrafish in toxicology: A bibliometric analysis reveals current trends and future avenues for predictive safety assessment. Front. Toxicol. 2026, 7, 1700031. [Google Scholar] [CrossRef] [Scilit] [PubMed]
- Norton, W.; Bally-Cuif, L. Adult zebrafish as a model organism for behavioural genetics. BMC Neurosci. 2010, 11, 90. [Google Scholar] [CrossRef] [Scilit] [PubMed]
- Rosa, J.G.S.; Lima, C.; Lopes-Ferreira, M. Zebrafish larvae behavior models as a tool for drug screenings and pre-clinical trials: A review. Int. J. Mol. Sci. 2022, 23, 6647. [Google Scholar] [CrossRef] [Scilit] [PubMed]
- Zhao, W.; Chen, Y.; Hu, N.; Long, D.; Cao, Y. The uses of zebrafish (Danio rerio) as an in vivo model for toxicological studies: A review based on bibliometrics. Ecotoxicol. Environ. Saf. 2024, 272, 116023. [Google Scholar] [CrossRef] [Scilit] [PubMed]
- Clark, K.J.; Boczek, N.J.; Ekker, S.C. Stressing zebrafish for behavioral genetics. Rev. Neurosci. 2011, 22, 49–62. [Google Scholar] [CrossRef] [Scilit] [PubMed]
- Red’ko, V.G.; Nepomnyashchikh, V.A.; Osipova, E.A. Models of fish exploratory behavior in mazes. Biol. Inspired Cogn. Archit. 2015, 13, 9–16. [Google Scholar] [CrossRef] [Scilit]
- Sison, M.; Gerlai, R. Associative learning in zebrafish (Danio rerio) in the plus maze. Behav. Brain Res. 2010, 207, 99–104. [Google Scholar] [CrossRef] [Scilit] [PubMed]
- McAroe, C.L.; Craig, C.M.; Holland, R.A. Place versus response learning in fish: A comparison between species. Anim. Cogn. 2016, 19, 153–161. [Google Scholar] [PubMed]
- Walf, A.A.; Frye, C.A. The use of the elevated plus maze as an assay of anxiety-related behavior in rodents. Nat. Protoc. 2007, 2, 322–328. [Google Scholar] [CrossRef] [Scilit] [PubMed]
- Gould, G.G. Aquatic light/dark plus maze novel environment for assessing anxious versus exploratory behavior in zebrafish (Danio rerio) and other small teleost fish. In Zebrafish Neurobehavioral Protocols; Kalueff, A.V., Cachat, J.M., Eds.; Humana Press: Totowa, NJ, USA, 2010; pp. 99–108. [Google Scholar]
- Sackerman, J.; Donegan, J.J.; Cunningham, C.S.; Nguyen, N.N.; Lawless, K.; Long, A.; Benno, R.H.; Gould, G.G. Zebrafish behavior in novel environments: Effects of acute exposure to anxiolytic compounds and choice of Danio rerio line. Int. J. Comp. Psychol. 2010, 23, 43–61. [Google Scholar] [CrossRef] [Scilit] [PubMed]
- Gould, G.G.; Barba-Escobedo, P.A.; Horton, R.E.; Daws, L.C. High affinity decynium-22 binding to brain membrane homogenates and reduced dorsal camouflaging after acute exposure to it in zebrafish. Front. Pharmacol. 2022, 13, 841423. [Google Scholar] [CrossRef] [Scilit] [PubMed]
- Varga, Z.K.; Zsigmond, Á.; Pejtsik, D.; Varga, M.; Demeter, K.; Mikics, E.; Haller, J.; Aliczki, M. The swimming plus-maze test: A novel high-throughput model for assessment of anxiety-related behaviour in larval and juvenile zebrafish (Danio rerio). Sci. Rep. 2018, 8, 16590. [Google Scholar] [CrossRef] [Scilit] [PubMed]
- Walsh-Monteiro, A.; Pessoa, R.D.S.; Sanches, É.M.; Carvalho, A.C.C.D.; Silva, Y.C.D.B.E.; Chirinéa, G.; Gouveia, A. A new anxiety test for zebrafish: Plus maze with ramp. Psychol. Neurosci. 2016, 9, 457–464. [Google Scholar] [CrossRef] [Scilit]
- Pessoa, R.; Motta, C.; Araujo-Pessoa, E.; Gouveia, A. Effects of housing density on anxiety-like behavior of zebrafish in the plus maze with ramp. Behav. Process. 2024, 222, 105114. [Google Scholar] [CrossRef] [Scilit]
- de Carvalho, A.C.C.; Morato, S.; Gouveia, A., Jr.; Walsh-Monteiro, A. Anxiety and Fryes: A novel model to study anxiety in zebrafish larvae. Zebrafish 2025, 22, 86–98. [Google Scholar] [CrossRef] [Scilit] [PubMed]
- Gaikwad, S.; Stewart, A.; Hart, P.; Wong, K.; Piet, V.; Cachat, J.; Kalueff, A.V. Acute stress disrupts performance of zebrafish in the cued and spatial memory tests: The utility of fish models to study stress-memory interplay. Behav. Process. 2011, 87, 224–230. [Google Scholar] [CrossRef] [Scilit]
- Kolesnikova, T.O.; Galstyan, D.S.; Demin, K.A.; Barabanov, M.A.; Pestov, A.V.; de Abreu, M.S.; Strekalova, T.; Kalueff, A.V. Pharmacological characterization of a novel putative nootropic beta-alanine derivative, MB-005, in adult zebrafish. J. Psychopharmacol. 2022, 36, 892–902. [Google Scholar] [CrossRef] [Scilit] [PubMed]
- Zhdanov, A.V.; Khatsko, S.L.; Zabegalov, K.N.; Bytov, M.V.; Demin, K.A.; Galstyan, D.S.; de Abreu, M.S.; Amstislavskaya, T.G.; Kalueff, A.V. Modeling stress-related disorders in zebrafish using prolonged predator exposure and prolonged unpredictable stress. J. Neurosci. Res. 2025, 103, e70048. [Google Scholar] [CrossRef] [Scilit] [PubMed]
- Zheltova, O.M.; Nepomnyashchikh, V.A. Organization of exploratory behavior in Danio rerio (Hamilton 1822, Cyprinidae) in a maze. Biol. Bull. 2019, 46, 1059–1064. [Google Scholar] [CrossRef] [Scilit]
- Ragozzino, M.E.; Unick, K.E.; Gold, P.E. Hippocampal acetylcholine release during memory testing in rats: Augmentation by glucose. Proc. Natl. Acad. Sci. USA 1996, 93, 4693–4698. [Google Scholar] [CrossRef] [Scilit] [PubMed]
- Wong, K.; Elegante, M.; Bartels, B.; Elkhayat, S.; Tien, D.; Roy, S.; Goodspeed, J.; Suciu, C.; Tan, J.; Grimes, C.; et al. Analyzing habituation responses to novelty in zebrafish (Danio rerio). Behav. Brain Res. 2010, 208, 450–457. [Google Scholar] [CrossRef] [Scilit] [PubMed]
- Rosemberg, D.B.; Rico, E.P.; Mussulini, B.H.; Piato, A.L.; Calcagnotto, M.E.; Bonan, C.D.; Dias, R.D.; Blaser, R.E.; Souza, D.O.; de Oliveira, D.L. Differences in spatio-temporal behavior of zebrafish in the open tank paradigm after a short-period confinement into dark and bright environments. PLoS ONE 2011, 6, e19397. [Google Scholar] [CrossRef] [Scilit] [PubMed]
- Gore, S.V.; Hernández, T.D.R.; Creton, R. Behavioral effects of visual stimuli in adult zebrafish using a novel eight-tank imaging system. Front. Behav. Neurosci. 2024, 18, 1320126. [Google Scholar] [CrossRef] [Scilit] [PubMed]
- Quadros, V.A.; Rosa, L.V.; Costa, F.V.; Koakoski, G.; Barcellos, L.J.G.; Rosemberg, D.B. Predictable chronic stress modulates behavioral and neuroendocrine phenotypes of zebrafish: Influence of two homotypic stressors on stress-mediated responses. Comp. Biochem. Physiol. Part C Toxicol. Pharmacol. 2021, 247, 109030. [Google Scholar] [CrossRef] [Scilit]
- Herrera, K.J.; Panier, T.; Guggiana-Nilo, D.; Engert, F. Larval zebrafish use olfactory detection of sodium and chloride to avoid salt water. Curr. Biol. 2021, 31, 782–793. [Google Scholar] [CrossRef] [Scilit] [PubMed]
- Mahabir, S.; Gerlai, R. The importance of holding water: Salinity and chemosensory cues affect zebrafish behavior. Zebrafish 2017, 14, 444–458. [Google Scholar] [CrossRef] [Scilit] [PubMed]
- Golla, A.; Østby, H.; Kermen, F. Chronic unpredictable stress induces anxiety-like behaviors in young zebrafish. Sci. Rep. 2020, 10, 10339. [Google Scholar] [CrossRef] [Scilit] [PubMed]
- Fiol, D.F.; Kültz, D. Osmotic stress sensing and signaling in fishes. FEBS J. 2007, 274, 5790–5798. [Google Scholar] [CrossRef] [Scilit] [PubMed]
- Hwang, P.-P.; Lee, T.-H.; Lin, L.-Y. Ion regulation in fish gills: Recent progress in the cellular and molecular mechanisms. Am. J. Physiol.-Regul. Integr. Comp. Physiol. 2011, 301, R28–R47. [Google Scholar] [CrossRef] [Scilit] [PubMed]
- Cruz, S.A.; Lin, C.-H.; Chao, P.-L.; Hwang, P.-P. Glucocorticoid receptor, but not mineralocorticoid receptor, mediates cortisol regulation of epidermal ionocyte development and ion transport in zebrafish (Danio rerio). PLoS ONE 2013, 8, e77997. [Google Scholar] [CrossRef] [Scilit] [PubMed]
- Faught, E.; Vijayan, M.M. The mineralocorticoid receptor is essential for stress axis regulation in zebrafish larvae. Sci. Rep. 2018, 8, 18081. [Google Scholar] [CrossRef] [Scilit] [PubMed]
- Redding, J.M.; Schreck, C.B. Influence of ambient salinity on osmoregulation and cortisol concentration in yearling coho salmon during stress. Trans. Am. Fish. Soc. 1983, 112, 800–807. [Google Scholar] [CrossRef] [Scilit]
- Kammerer, B.D.; Cech, J.J., Jr.; Kültz, D. Rapid changes in plasma cortisol, osmolality, and respiration in response to salinity stress in tilapia (Oreochromis mossambicus). Comp. Biochem. Physiol. Part A Mol. Integr. Physiol. 2010, 157, 260–265. [Google Scholar] [CrossRef] [Scilit]
- Aruna, A.; Nagarajan, G.; Chang, C.-F. The acute salinity changes activate dual endocrine response pathways in the brain and pituitary of tilapia. General. Comp. Endocrinol. 2015, 211, 154–164. [Google Scholar] [CrossRef] [Scilit]
- Dereje, S.; Sawyer, S.; Oxendine, S.E.; Zhou, L.; Kezios, Z.D.; Wong, R.Y.; Godwin, J.; Perrin, F. Comparing behavioral responses across multiple assays of stress and anxiety in zebrafish (Danio rerio). Behaviour 2012, 149, 1205–1240. [Google Scholar] [CrossRef] [Scilit]
- Lennartz, R. The role of extramaze cues in spontaneous alternation in a plus maze. Learn. Behav. 2008, 36, 138–144. [Google Scholar] [CrossRef] [Scilit] [PubMed]
- Cheng, R.K.; Tan, J.X.M.; Chua, K.X.; Tan, C.J.X.; Wee, C.L. Osmotic stress uncovers correlations and dissociations between larval zebrafish anxiety endophenotypes. Front. Mol. Neurosci. 2022, 15, 900223. [Google Scholar] [CrossRef] [Scilit] [PubMed]
- Pérez-Escudero, A.; Vicente-Page, J.; Hinz, R.C.; Arganda, S.; de Polavieja, G.G. IdTracker: Tracking individuals in a group by automatic identification of unmarked animals. Nat. Methods 2014, 11, 743–748. [Google Scholar] [CrossRef] [Scilit] [PubMed]
- Egan, R.J.; Bergner, C.L.; Hart, P.C.; Cachat, J.M.; Canavello, P.R.; Elegante, M.F.; Elkhayat, S.I.; Bartels, B.K.; Tien, A.K.; Tien, D.H.; et al. Understanding behavioral and physiological phenotypes of stress and anxiety in zebrafish. Behav. Brain Res. 2009, 205, 38–44. [Google Scholar] [CrossRef] [Scilit] [PubMed]
- Piato, Â.L.; Capiotti, K.M.; Tamborski, A.R.; Oses, J.P.; Barcellos, L.J.G.; Bogo, M.R.; Lara, D.R.; Vianna, M.R.; Bonan, C.D. Unpredictable chronic stress model in zebrafish (Danio rerio): Behavioral and physiological responses. Prog. Neuro-Psychopharmacol. Biol. Psychiatry 2011, 35, 561–567. [Google Scholar] [CrossRef] [Scilit]

Disclaimer/Publisher’s Note: The statements, opinions and data contained in all publications are solely those of the individual author(s) and contributor(s) and not of MDPI and/or the editor(s). MDPI and/or the editor(s) disclaim responsibility for any injury to people or property resulting from any ideas, methods, instructions or products referred to in the content. |
© 2026 by the authors. Licensee MDPI, Basel, Switzerland. This article is an open access article distributed under the terms and conditions of the Creative Commons Attribution (CC BY) license.