


Abstract
Accurate prediction of concrete mechanical and deformation behavior remains one of the major challenges in materials engineering and science. This study presents results from structural and finite element (FE) modeling, providing a prediction of the stress–strain state of hardened cement paste and concrete. It proposes a two-step method: first, develop an FE model for hardened cement paste from the monofractional structural model; second, develop an FE model for concrete by integrating deformation characteristics derived from the hardened cement paste model and interfacial transition zone (ITZ) parameters, calculated by the authors’ method. This study involved: designing structural models of hardened cement paste and concrete, constructing FE models based on these structures, and validating them by comparison with experimental data. The simulations used monodisperse structural and tetrahedral hinge–rod finite element models. The novelty of the method is the combination of simplified monofractional structural models and ITZ volume calculation using parameters for structural density and relative sizes of elements, which allows for the design of an FE model of concrete integrated with an FE model of hardened cement paste. The results confirm the high accuracy of the developed models for each concrete class in the range from C16/20 to C55/67, with deformation deviations not exceeding 6% and strength deviations not exceeding 10%. The authors’ principles of FE modeling for hardened cement paste and concrete were established.
1. Introduction
Scientifically grounded rational design of material structures composed of finite elements whose shape, properties, and arrangement correspond to the structural characteristics of the selected material type represents a promising direction in contemporary construction materials science. Developing methods for designing materials using software packages provides a new technological level for producing and developing new materials. At this level, material composition is determined by a specified structure, with its elements, properties, and distribution being calculated through appropriate models to meet desired performance criteria. Primarily, advancing material design methods necessitates the determination of credible finite element (FE) structural models, as these models offer a comprehensive evaluation of a material’s mechanical and deformation properties—its stress–strain state (SSS). From SSS patterns, various types of strength, elastic modulus, and deformation modulus of the material can be determined.
Modeling the structure and properties of hardened cement paste and concrete using the finite element method and software packages is the focus of numerous studies. Research approaches to FE modeling of hardened cement paste and concrete include the following:
- Macrostructural modeling in FE simulations of concrete and reinforced concrete structures, where the structure of a homogeneous model is subdivided into uniform or non-uniform finite element sections with identical properties [1,2,3], enabling the modeling of the structural SSS but not capturing the relationship between the properties and structure of concrete;
- Structurally phenomenological modeling, which relies on statistical elasticity theory, mitigates material heterogeneity by averaging micro-volume characteristics, thereby reducing the structure to a homogeneous state without reflecting the actual relationship between the properties and structure of concrete [4,5,6];
- Methods for calculating structurally heterogeneous material elements by developing models [7,8] that account for stress concentration areas in transition zones, pores, and cracks, yielding functional FE models of concrete structures that do not directly engage with concrete structural elements, complicating the correlation between models and material composition.
The most prevalent approach is the 3D modeling of concrete structures from three fundamental elements—aggregate, matrix, and contact zone—with a stochastic distribution of various fractions, leading to the derivation of adequate FE models of mechanical and deformation properties from 3D models [9,10,11,12,13], using an increasing range of research methods, including X-ray CT [14] and machine learning with FE modeling [15].
Despite the evident advantages in computing specific parameters, the resulting models encounter common gaps:
- Problem 1: The absence of “end-to-end” modeling, wherein each subsequent scale level model integrates the preceding scale level models. For instance, a concrete model would incorporate a hardened cement paste model. Another limitation is the insufficient development of deformability models capable of jointly calculating elastic and plastic deformations of hardened cement paste and concrete under specified stresses.
- Problem 2: The absence of a widely accepted method for evaluating ITZ parameters based on a synthesis of relevant studies. This limits the development of methods for predicting concrete properties, especially deformation properties.
Resolving Problem 1 requires developing a structural and FE model of hardened cement paste to integrate the outcomes of such modeling into cement concrete structural models. This would render modeling hierarchical and “end-to-end,” leveraging structural parameters of element models in multi-element structural modeling at the next scale level.
Modeling hardened cement paste structure and mathematically simulating its properties, including through the finite element method and software packages, is the subject of several studies. Generally, these studies develop simulation models of the crystal-hydrate structure of hardened cement paste in the form of bulk crystalline aggregates or flat sections, with or without capillary and gel porosity [16,17,18,19]. However, finite element (FE) models that adequately calculate hardened cement paste strength and elastic modulus are scarce. Moreover, most FE hardened cement paste models do not facilitate development, failing to enable the development of simulation models for modified hardened cement paste structures with assessed changes in calculated parameters and integration into composite models incorporating hardened cement paste as an element. A review of studies on integrated models at different scales, including some of those cited above, shows that in practice, attempts at such integration are largely absent. The main reason is the increase by an order of magnitude or more in the number of finite elements in the model, which requires supercomputing resources for such calculations. If complex polyfractional and polymorphic models are used, the distribution of micro-elements in such a diverse and heterogeneous space becomes an intractable task, especially in practical applications. An effective method to avoid this is replacing the microlevel of cement paste with the mesolevel of mortar, as has been done in most studies. One way to address the complexity of integrated “end-to-end” modeling is to simplify the structural complexity at each level, primarily by reducing polyfractionality and polymorphism.
Notably, works by F.H. Witmann, Dale P. Bentz, and Edward J. Garboczi [20,21] justify predicting properties based on hardened cement paste structural models from hydrated spherulites by specifying structural lattices with varied element arrangements. Typically, these models’ development involves polyfractionality [21,22,23,24]. Conversely, monofractional models based on weighted averages simplify the modeling and processing task, making it more accessible for calculations using publicly available software tools.
Addressing Problem 2 involves appropriately incorporating the most deformable element—the interfacial transition zone (ITZ)—into the structural model. Modeling concrete structure critically depends on accounting for the “hardened cement paste–aggregate” contact zone (ITZ) [25,26], where FE modeling suggests treating the contact zone as a region with variable water content up to 50 microns thick, possessing specific dimensions and enhanced deformation properties [27]. This approach is also applied in the authors’ developments concerning the modulus of elasticity of concrete [28]. Considering the ITZ in “hardened cement paste–aggregate” interactions during concrete property modeling highlights the significance of the contact zone’s relative thickness in the matrix layer, suggesting the potential for developing FE concrete models using averaged geometric structural parameters. Analysis of the factors governing ITZ formation has shown that the ITZ is determined by the surface water consumption of the aggregate. The greater the surface area and hydrophilicity of the aggregate, the larger the ITZ volume. The approach developed in [28] was applied in this study to evaluate the size of the ITZ element. Designing the FE model of concrete requires solving the main problem of representing the ITZ as an FE element. Because concrete exhibits elastic–plastic deformation, the ITZ can be represented as either a rigid rod or a compliant hinge. Testing this hypothesis was therefore included among the objectives of the present study.
This study aims to develop a hierarchical integrated “end-to-end” FE structural model of cement concrete, enabling the prediction of concrete deformation properties using averaged geometric structural parameters, integrated hardened cement paste models, and the authors’ methods for calculating the relative thickness of the ITZ.
To achieve this objective, the following tasks were performed:
- Experimental investigation of hardened cement paste deformation under loading to construct a microstructural model and to develop and validate an FE model of hardened cement paste deformations, based on structural model parameters.
- Experimental investigation of concrete deformation under loading and development of hinge–rod FE models of the concrete structure based on previous structural modeling experience.
- The analysis of stress–strain relationships in the proposed FE models with integrated model parameters of the hardened cement paste and selection and validation of the most appropriate option for calculating deformations under loading, modulus of elasticity, and strength of cement concrete with an adequacy assessment.
2. Materials and Methods
In our experiment to determine the modulus of elasticity of concrete, materials from local producers (Chelyabinsk, Russia) were used: granite coarse aggregate (fraction 5–20 mm) and quartz sand (fraction 0–5 mm and fineness modulus of sand 2.5) with a strength of Ragg = 1000 MPa and an elastic modulus of Eagg = 50 × 104 MPa; Portland cement CEM 52.5 I-N. A PCA-I-type high-efficiency water reducer was used.
This research study used Akkermann production Portland cement (Novotroitsk, Russia) CEM 52.5 I-N. The samples were made from Portland cement with a normal-consistency W/C of 0.26, with additional samples prepared at W/C = 0.3 and 0.4, followed by curing under normal moist conditions. The deformation curves were obtained by compressing 2 × 2 × 12 cm prism samples with the automatic recording of deformation and stress–strain curves on the Matest laboratory press (Matest S.p.A., Treviolo, Italy). The distance between the plates of the press was used as the measurement base because the hardened cement paste in the concrete structure was also clamped by aggregate particles, which could have led to the overestimation of the data obtained for the approximation of the modulus of elasticity in the composite structure.
Standard methods of the Russian state standards [29] were used to determine the modulus of elasticity and compressive strength of concrete of various classes. Specimens of concrete mixtures 100 × 100 × 400 mm in size were compacted and placed in a curing room under standard conditions at 20 ± 2 °C and a relative humidity of no less than 95%. The specimens were cured under these conditions for 28 days.
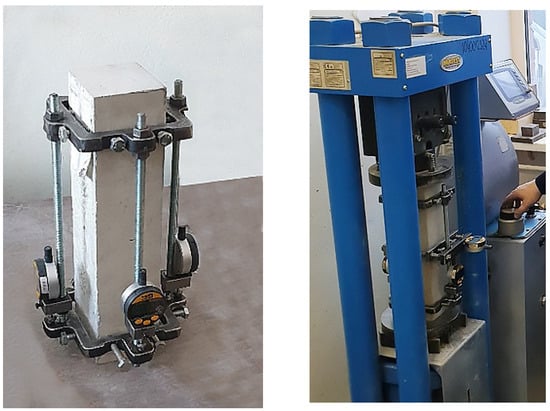
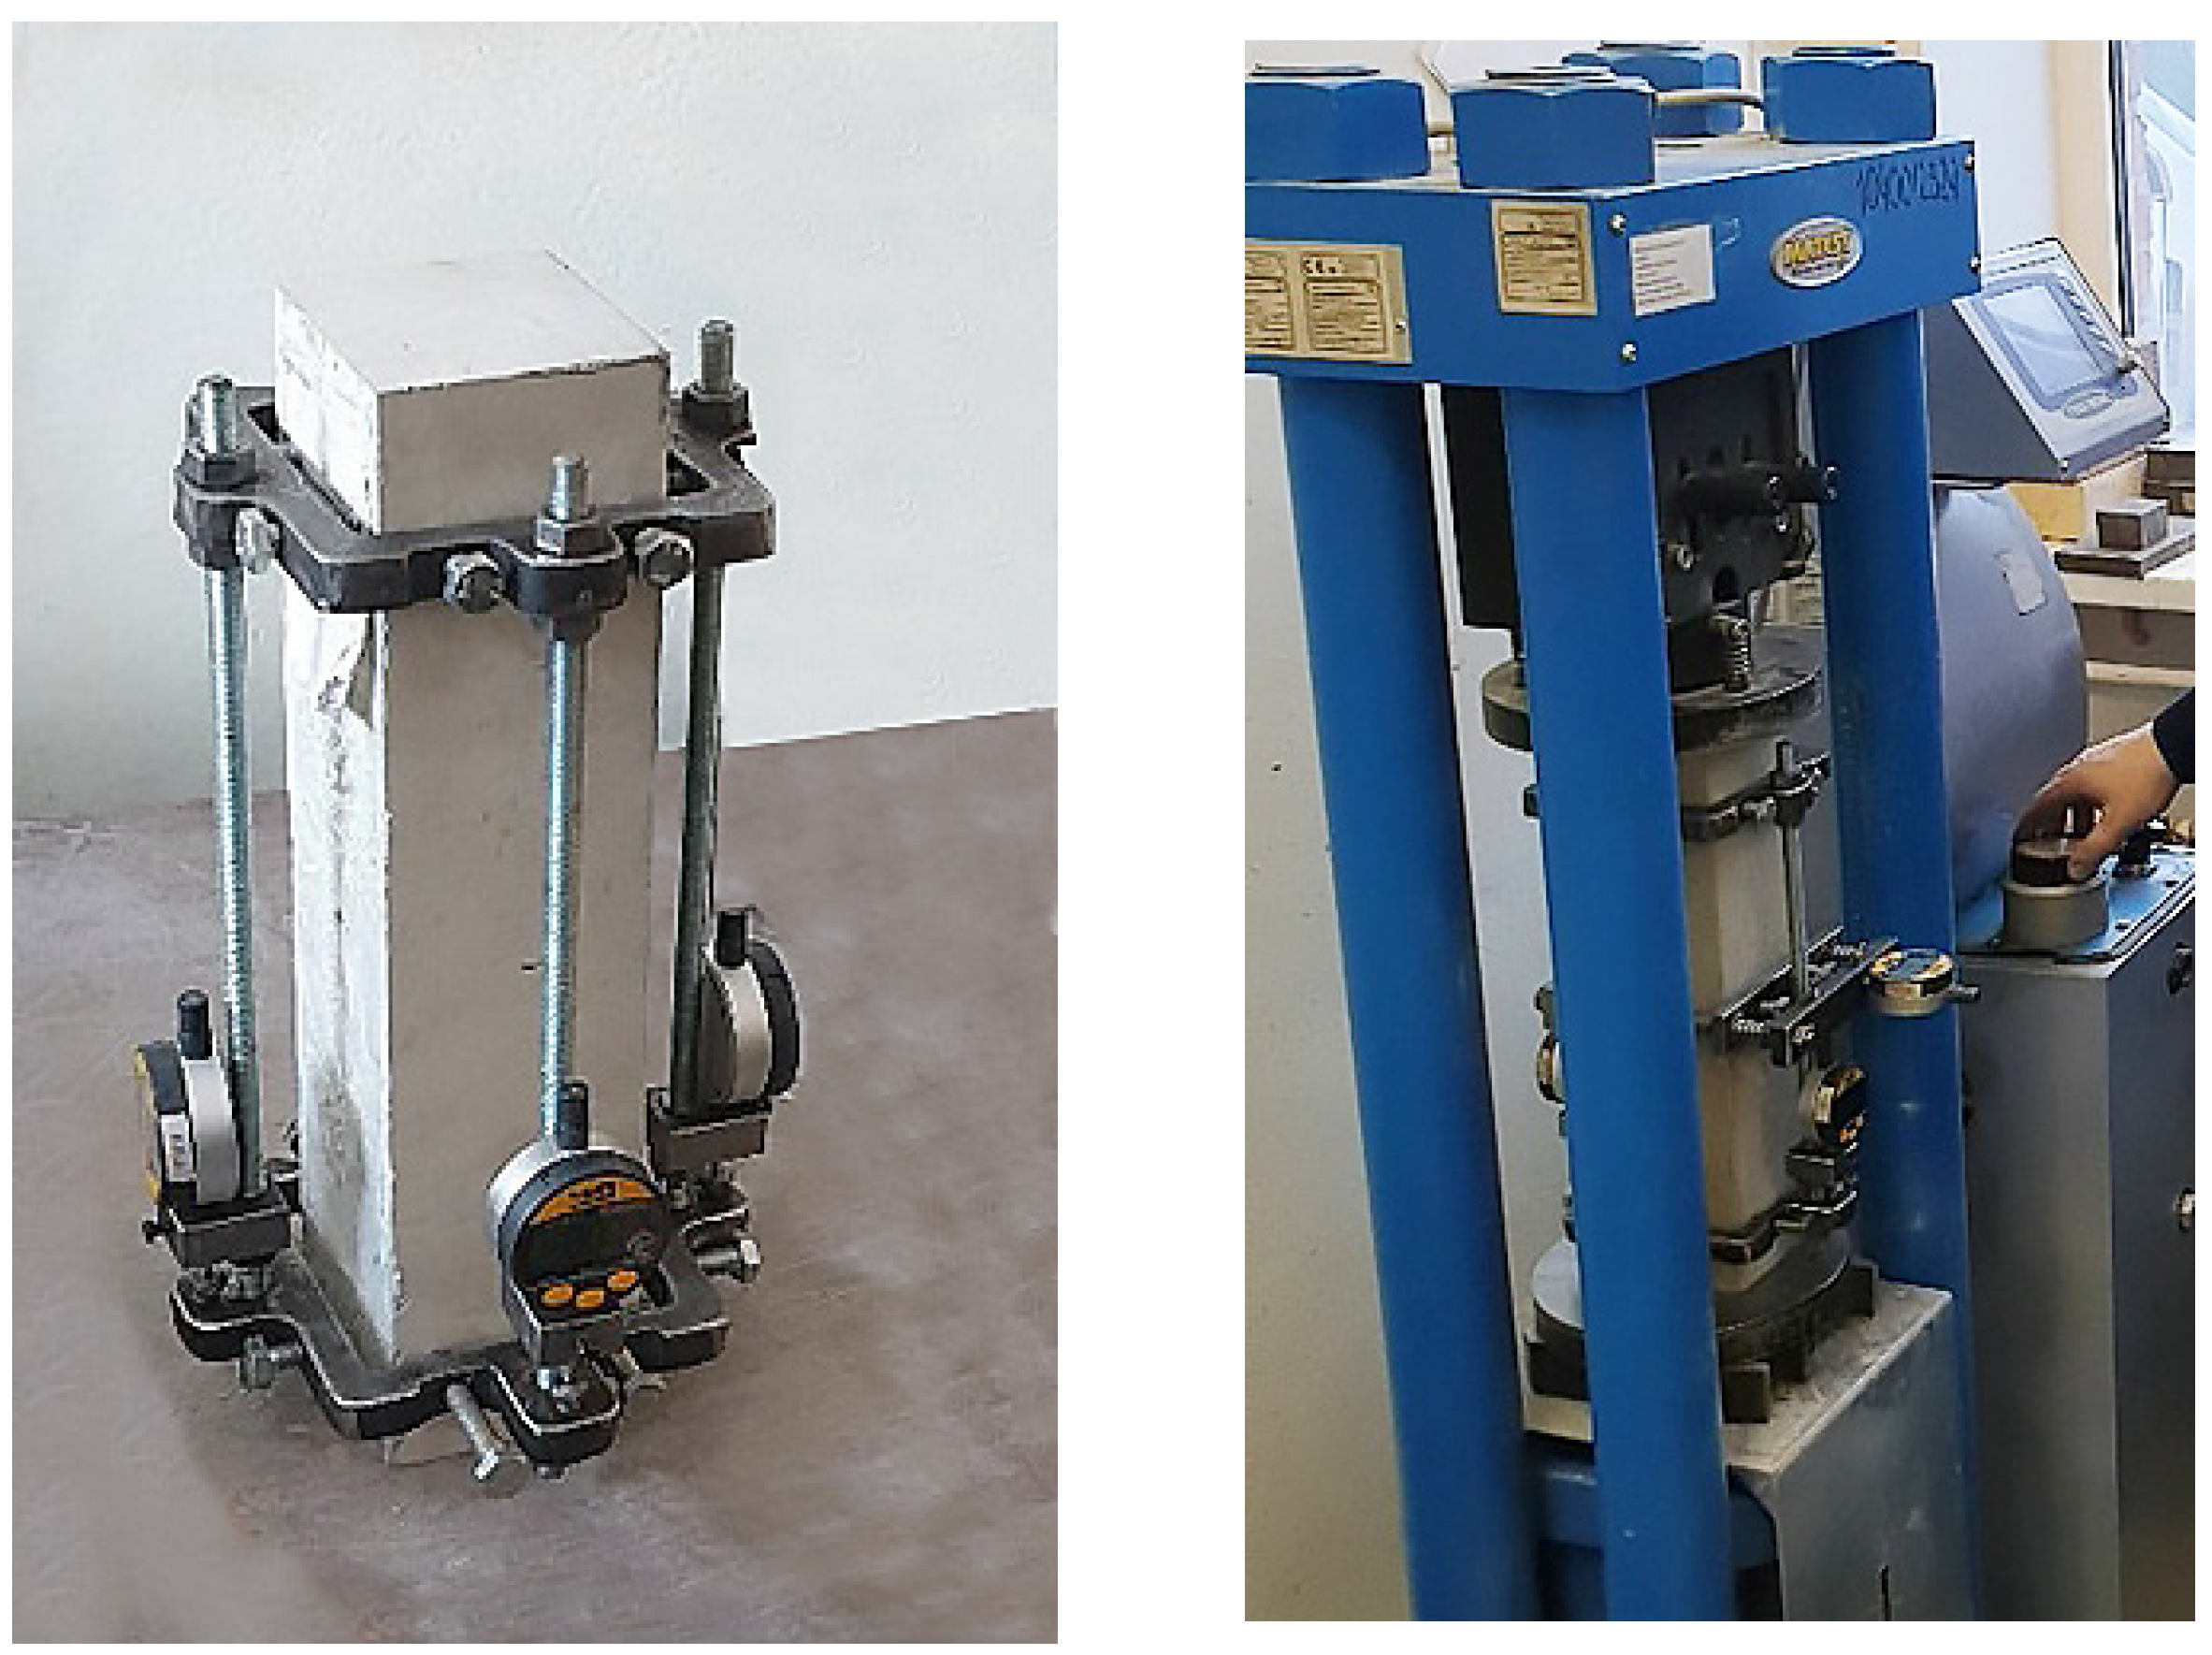
A series of three specimens of each of the 12 tested classes (Table 1) was compression-tested with a Matest press to determine longitudinal elastic and plastic deformations using digital strain sensors on each side of the sample. Compression loading was increased from 10% to 40% of the cracking stress (Figure 1) [30]. The modulus of elasticity was defined, according to the standard, as the ratio of the 30% cracking stress to the sum of the relative elastic deformations, excluding the delay of plastic deformations. Compressive strength was determined on a series of six samples according to the standard. Deviations in strength and modulus within each series did not exceed the standard requirements, and the within-series coefficient of variation was no more than 10%.
Table 1.
Parameters of the concrete mixture compositions used in this study.
Figure 1.
Concrete sample’s modulus of elasticity under compression testing.
The concrete study included classes from C8/10 to C55/67, corresponding to B10 to B60 according to the Russian standard. For concrete structural modeling, according to [28], layer models were used. Layer models included the structural layers of aggregate (agg), hardened cement paste () and ITZ (). The calculation of the relative thickness of the structural layers was based on the following equations by the authors [28]:
—thickness of the structural micro-volume, including all structural layers.
—thickness of the structural hardened cement paste layer.
—thickness of the ITZ layer.
—thickness of the aggregate layer.
The relative thickness of the “hardened cement paste” layer is
—cement consumption per cubic meter of concrete mixture.
—average density of the concrete mixture.
—density of the aggregate structure.
—density of cement paste at normal consistency.
—total water consumption.
W/C—water/cement ratio.
W/Ccem—water/cement ratio of cement paste at normal consistency.
Witz—water absorbed by the aggregate surface.
The authors propose calculating the thickness of the ITZ as the thickness of the water layer sorbed by the aggregate surface. The water layer was determined as the ratio of the volume of sorbed water to the specific surface area of the aggregate. The relative thickness of the ITZ layer was determined as the ratio of the thickness of the ITZ to the relative thickness of the structural layer that includes all the elements:
—specific surface area of the ITZ.
—relative volume of the cement paste layer.
—relative volume of the aggregate layer.
Based on this method, the following parameters of the concrete mixture compositions were calculated and used (Table 1).
Structural modeling for the purpose of predicting deformation properties was implemented on the basis of the authors’ previously developed spherulite-lattice model of hardened cement paste for modeling its hydrophysical and mechanical properties. The spherulite-lattice model includes the following conditions:
- −
- The basic microstructural element is a hydrated cement particle in the form of a spherulite;
- −
- Macrocapillary porosity is the space trapped among spherulites, represented by microstructural elements in the form of porous spherulites;
- −
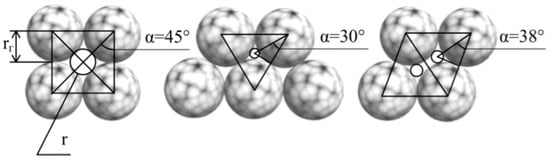
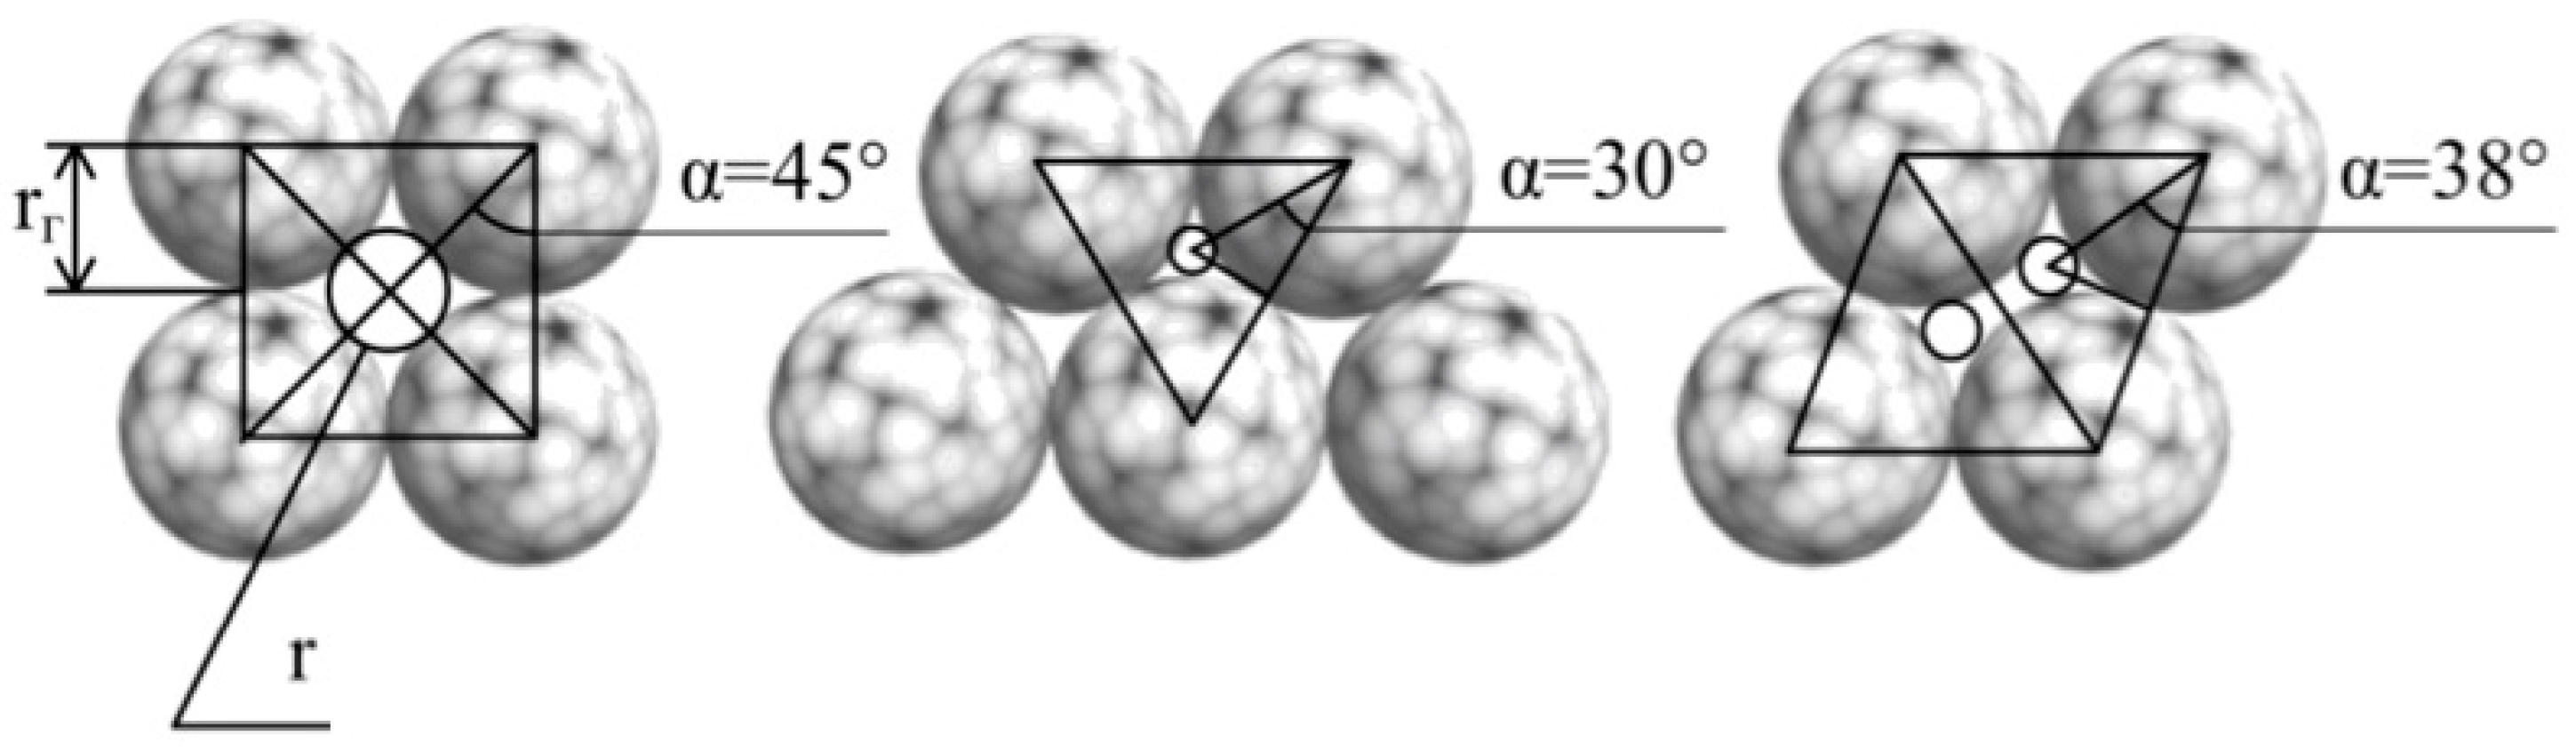
- The structural model is a monofractional packing of spherulites; the degree of packing density determines the radius of the macrocapillary pores (Figure 2).Figure 2. Packs of spherulitic hydrate cluster elements of various degrees of density in the lattice model of hardened cement paste.
The main parameter of such packing is structural density, which characterizes the degree of condensation of cluster formations and describes the relationship between bulk porosity and linear size ratios of hydrate cluster formations.
P is the macrocapillary porosity of the hardened cement paste. The following porosity equation was experimentally determined for the Portland cement under study:
When porosity is known, the proposed structural density (Equation (5)) is applicable as a parameter in FE modeling for determining the length-to-width ratios of the rods between the hinges. It was determined based on the structural density index with known porosity. Equation (1) then yields:
For example, with W/C = 0.4, P = 0.156, and ; then .
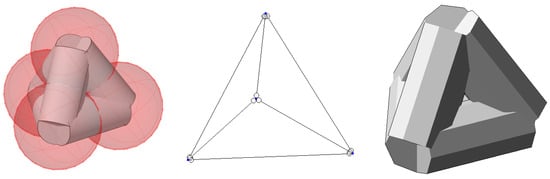
From the analysis of Figure 1 and Equation (5), such porosity corresponds most closely to a dense packing, i.e., an equilateral triangle in a planar scheme; in three dimensions, the basic element is an equilateral tetrahedron (Figure 3).
Figure 3.
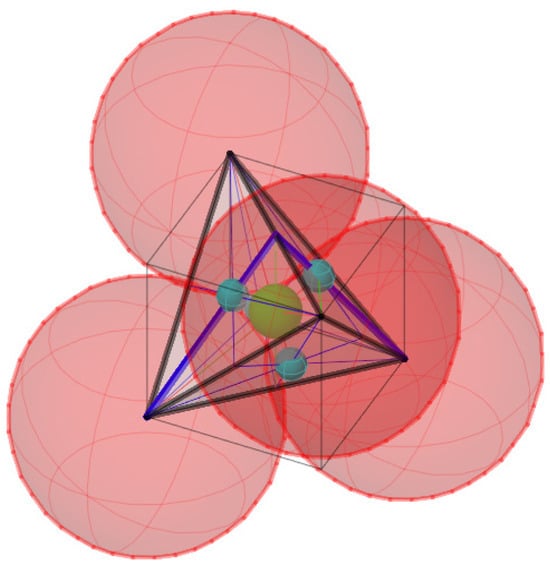
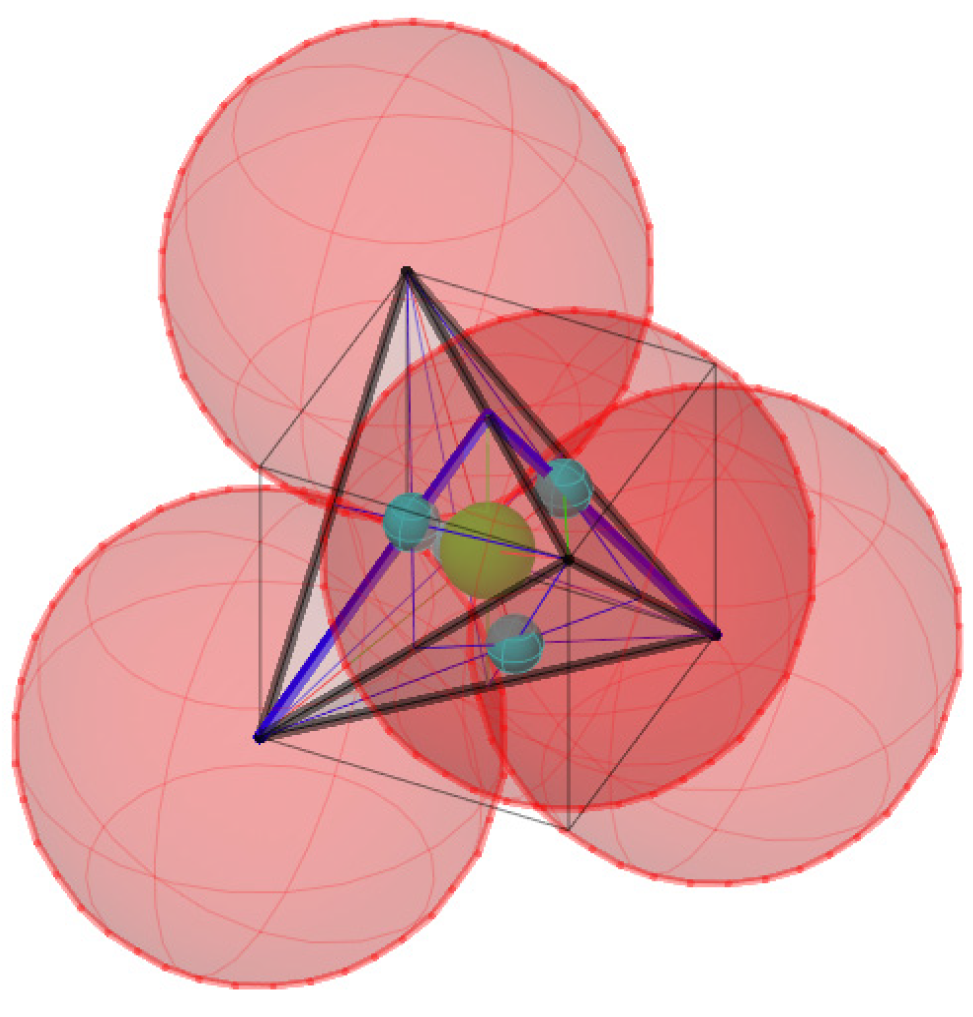
Schematic diagram of the basic element of the FE model of hardened cement paste. The hydrate spherulites are red, the pore in the center is yellow, and the pores on the faces are green.
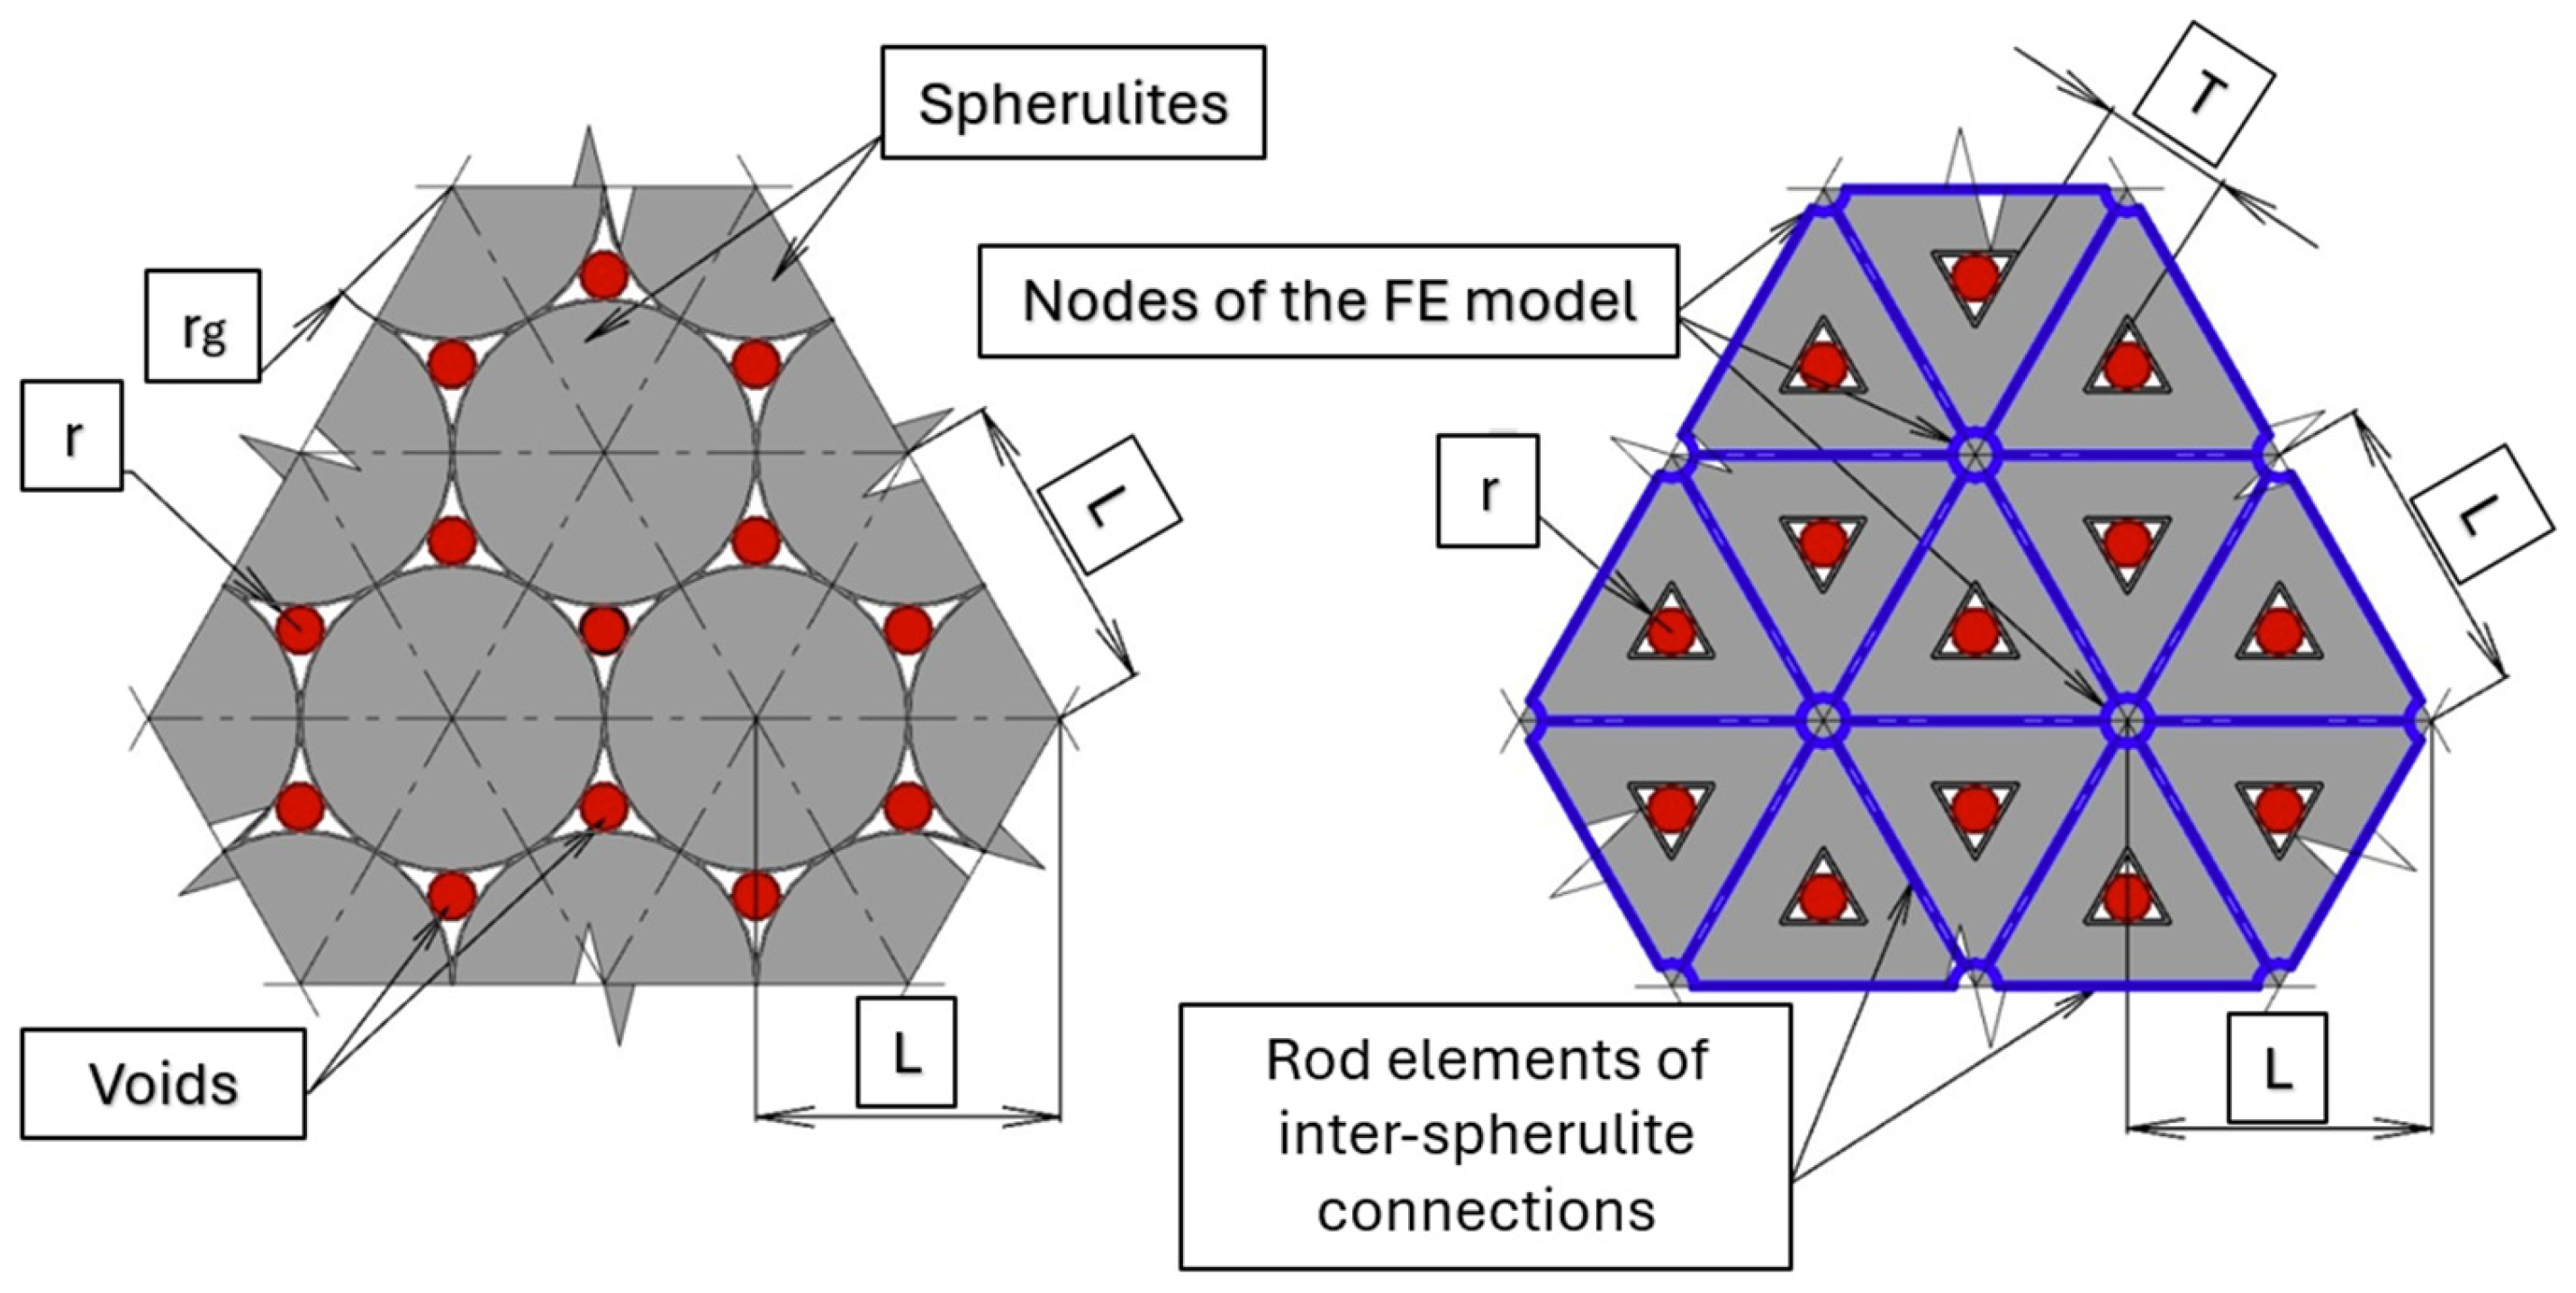
Pore space can be conventionally represented as spherical voids on the faces and in the center of the tetrahedron, with two on the faces and one in the center (referring to other peripheral pores on the faces of other tetrahedra). At the same time, the central pore constitutes the main pore volume, with volume of an order of magnitude higher than the volume of the two peripheral pores. The thickness of the rods was assigned based on the condition of maintaining the required porosity (Figure 4). During modeling, transitional (wellhead) pores were not taken into account and were not specified.
Figure 4.
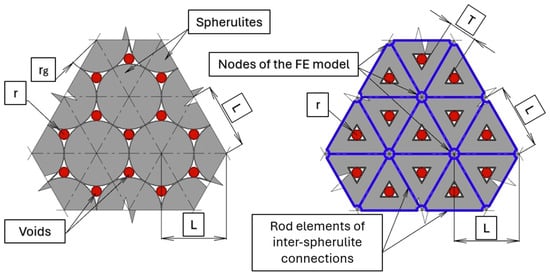
Transition to the hinge–rod model.
As a result of the mathematical analysis of the presented model, formulas for determining the bond relative thickness in model T, where L is the bond (rod) relative length between spherulites, were derived and are shown in Table 2. The table also shows the thickness values satisfying the condition for pores on the faces and in the center of the tetrahedron at W/C = 0.4 (γ = 0.86).
Table 2.
Parameters of hardened cement paste structural model.
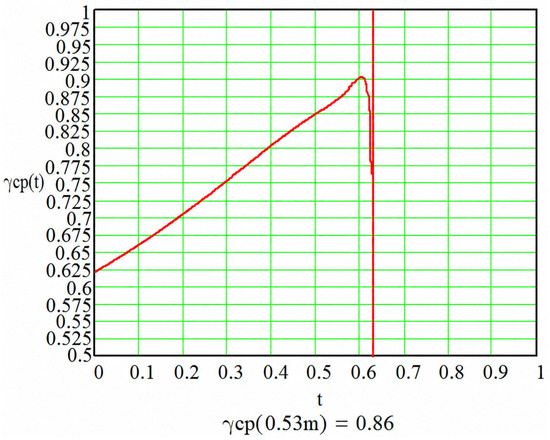
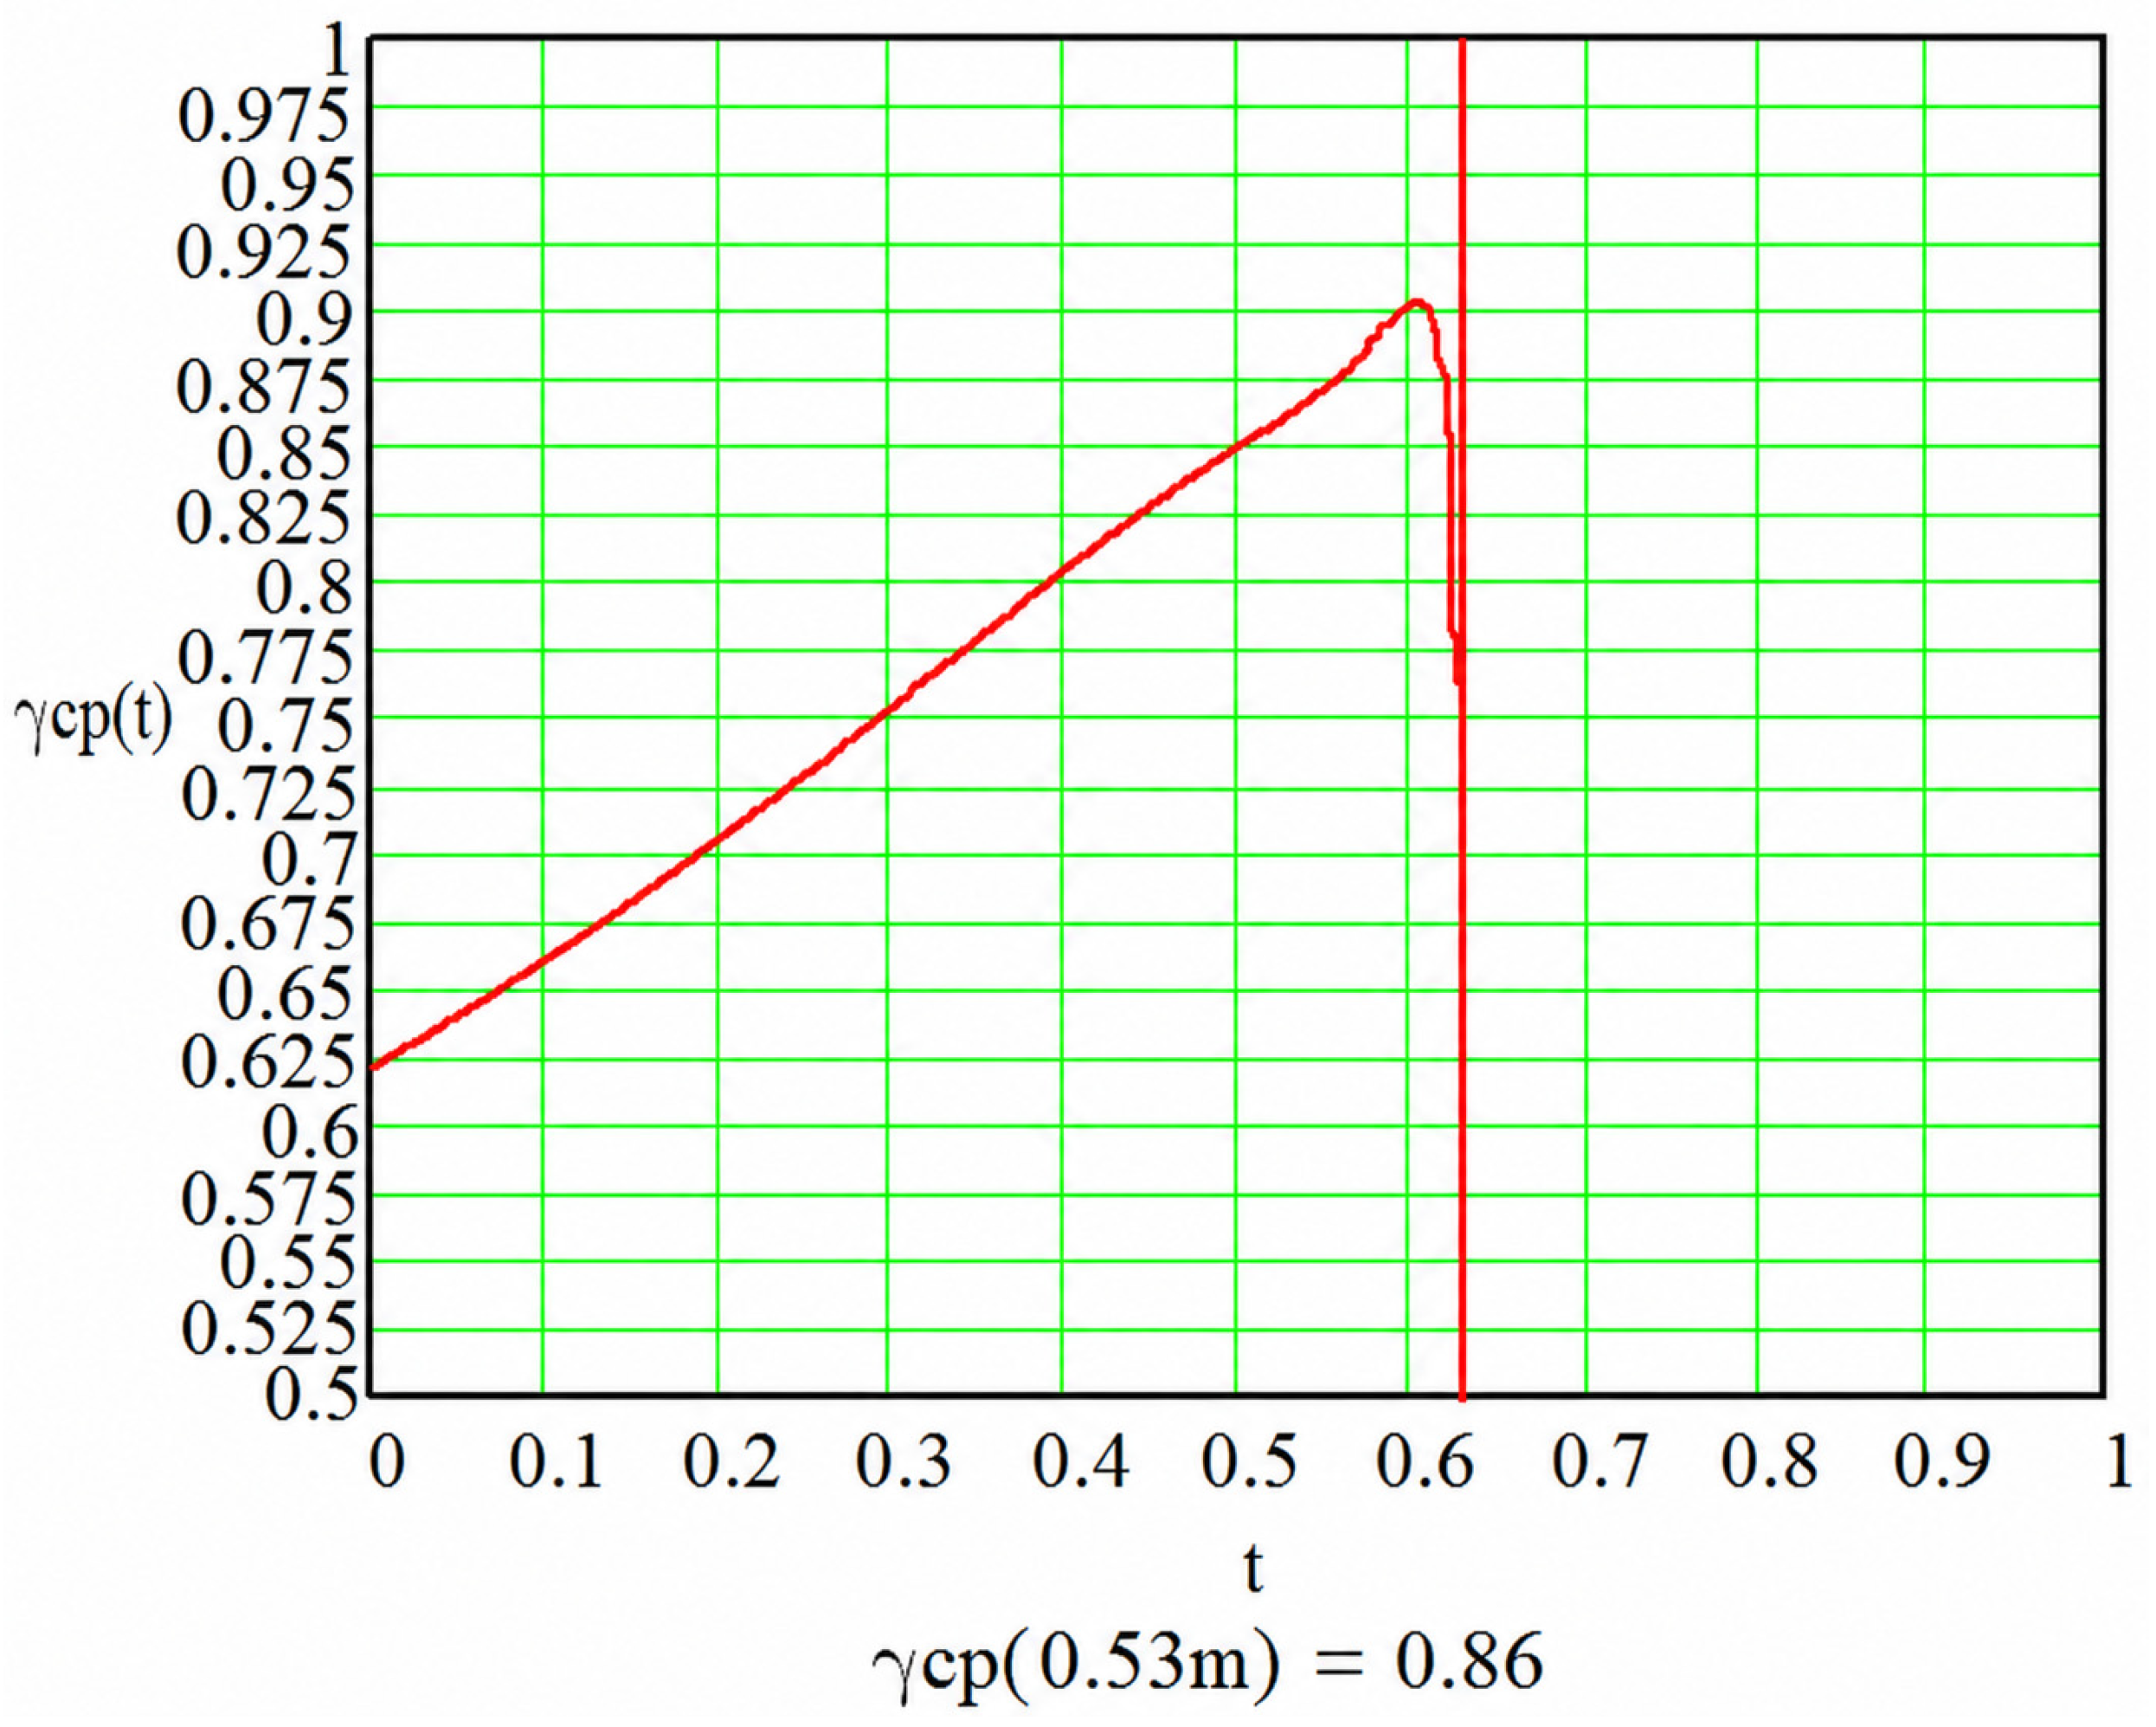
As can be seen from the table, with the same porosity in different planes, different bond (rod) thickness is required. At the same time, the pore sizes do not differ by an order of magnitude, so it is necessary to take them all into account. Therefore, the structural density is considered a plane-weighted average. Based on the obtained dependencies, Mathcad was used to plot the dependence of structural density on bond thickness (Figure 5). To ensure γ = 0.86, a bond relative thickness T = 0.53 L was assumed.
Figure 5.
Graph of dependence of structural density on rod (bond) finite element relative thickness.
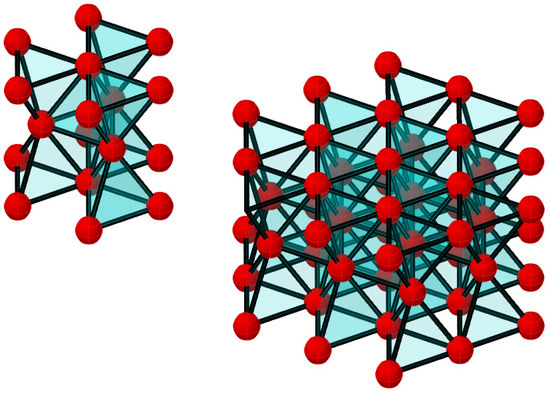
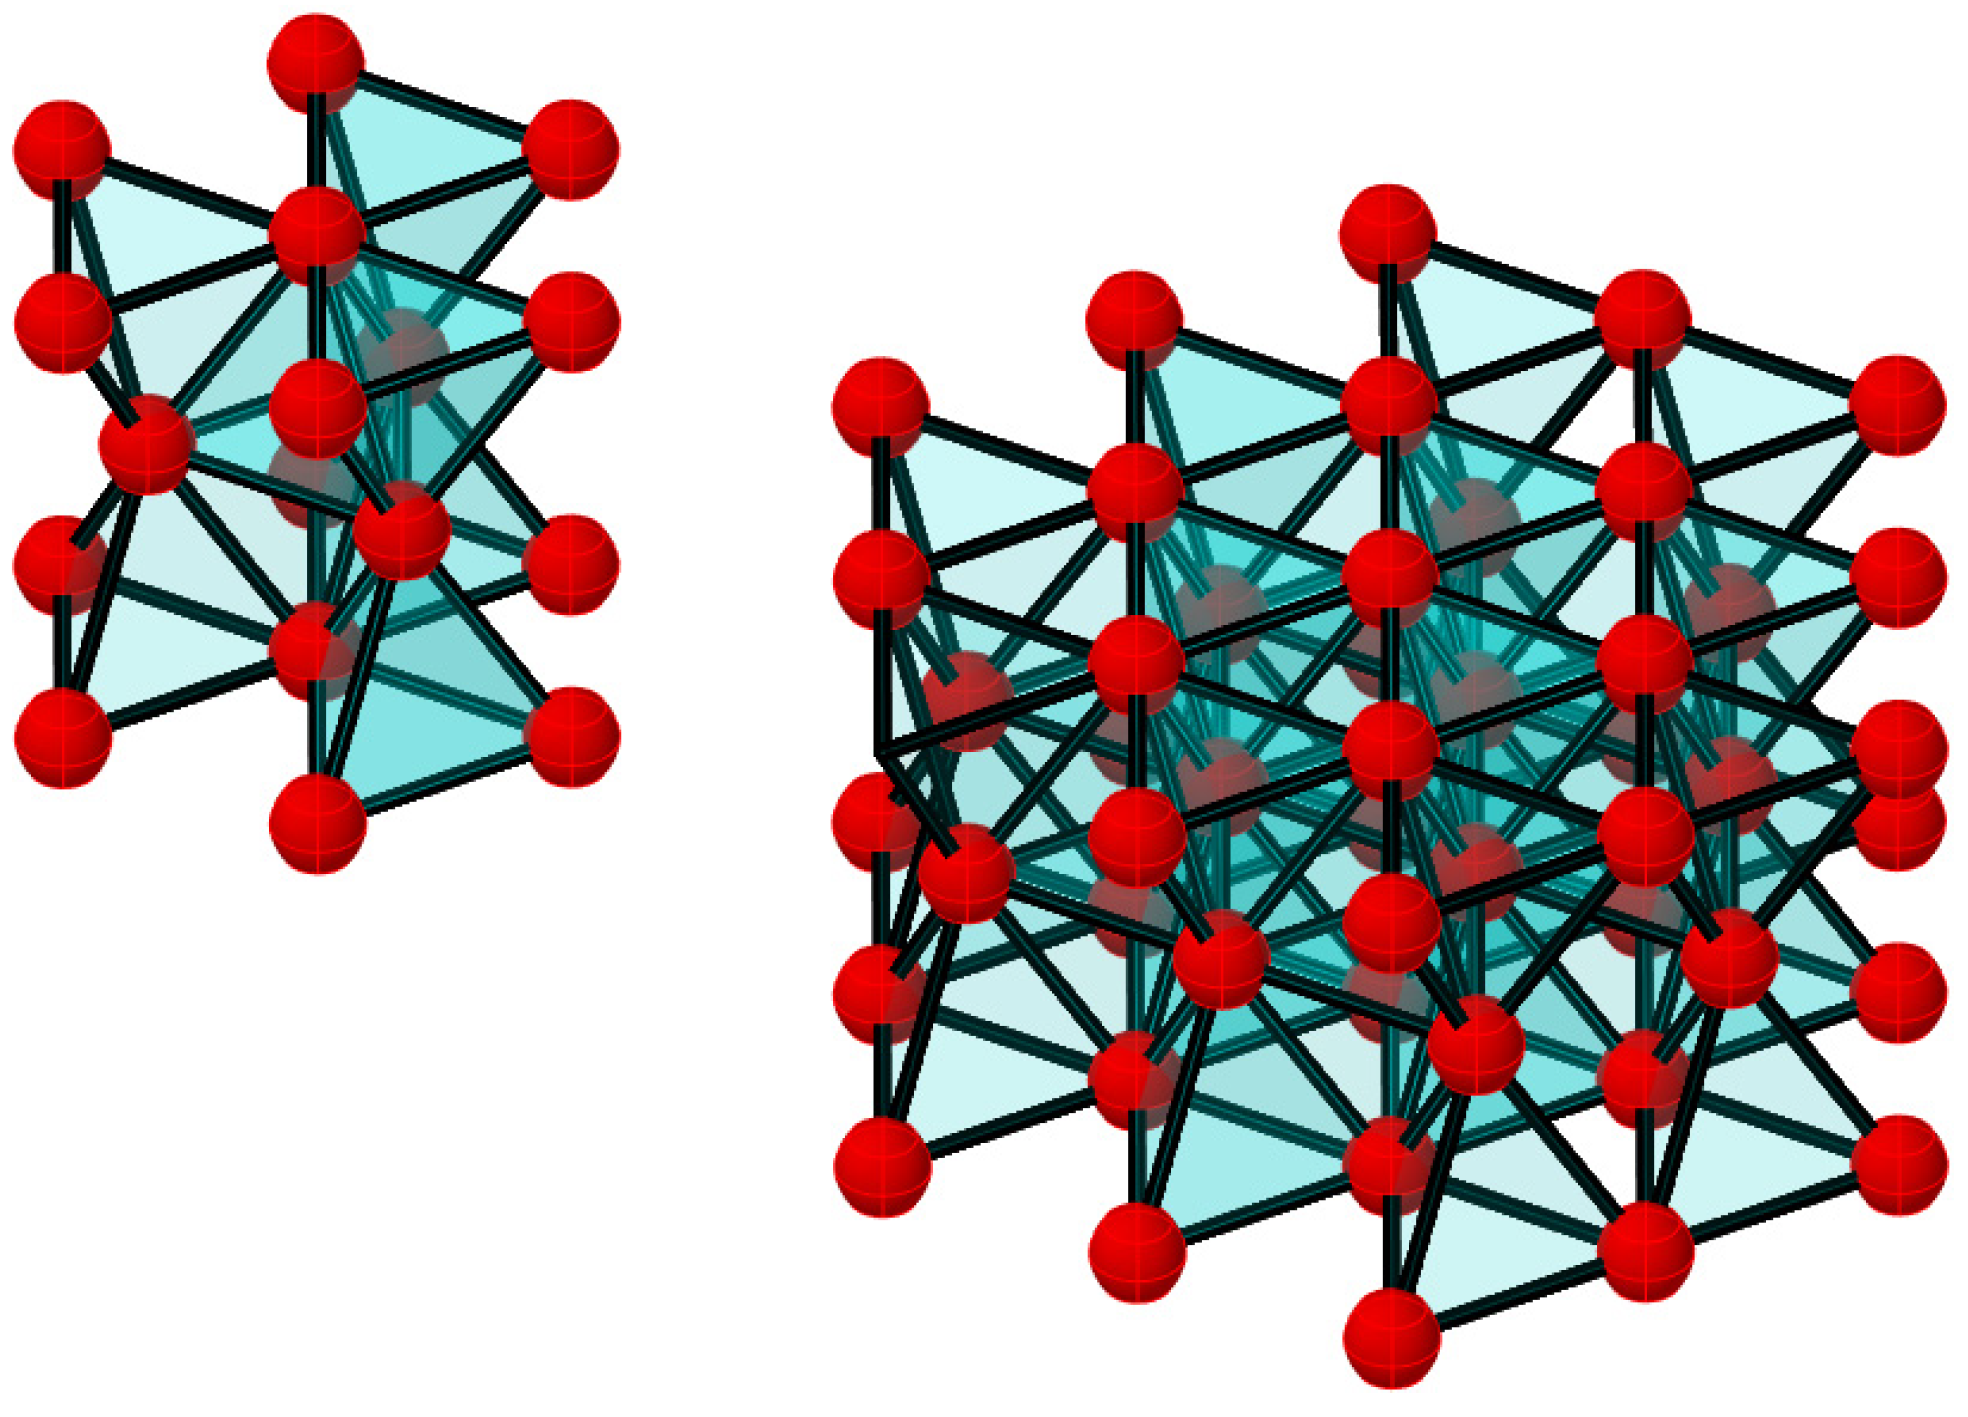
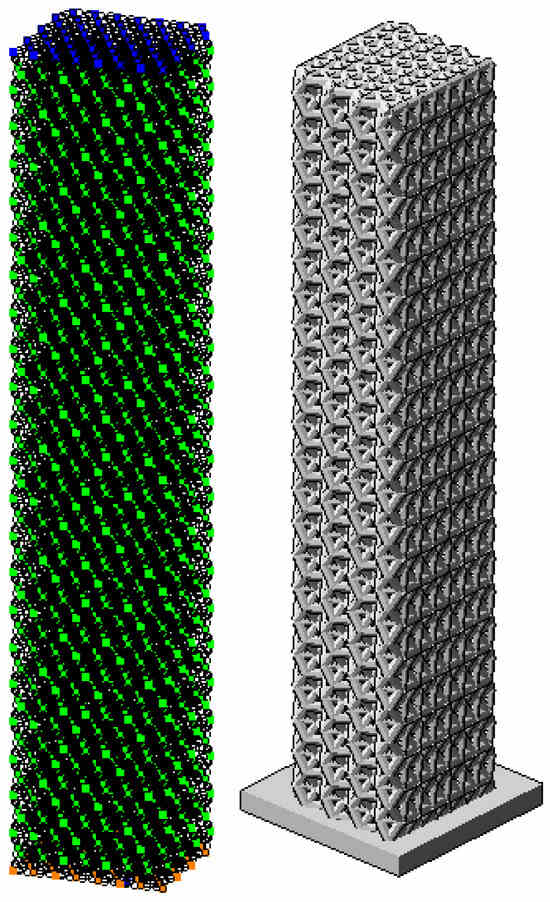
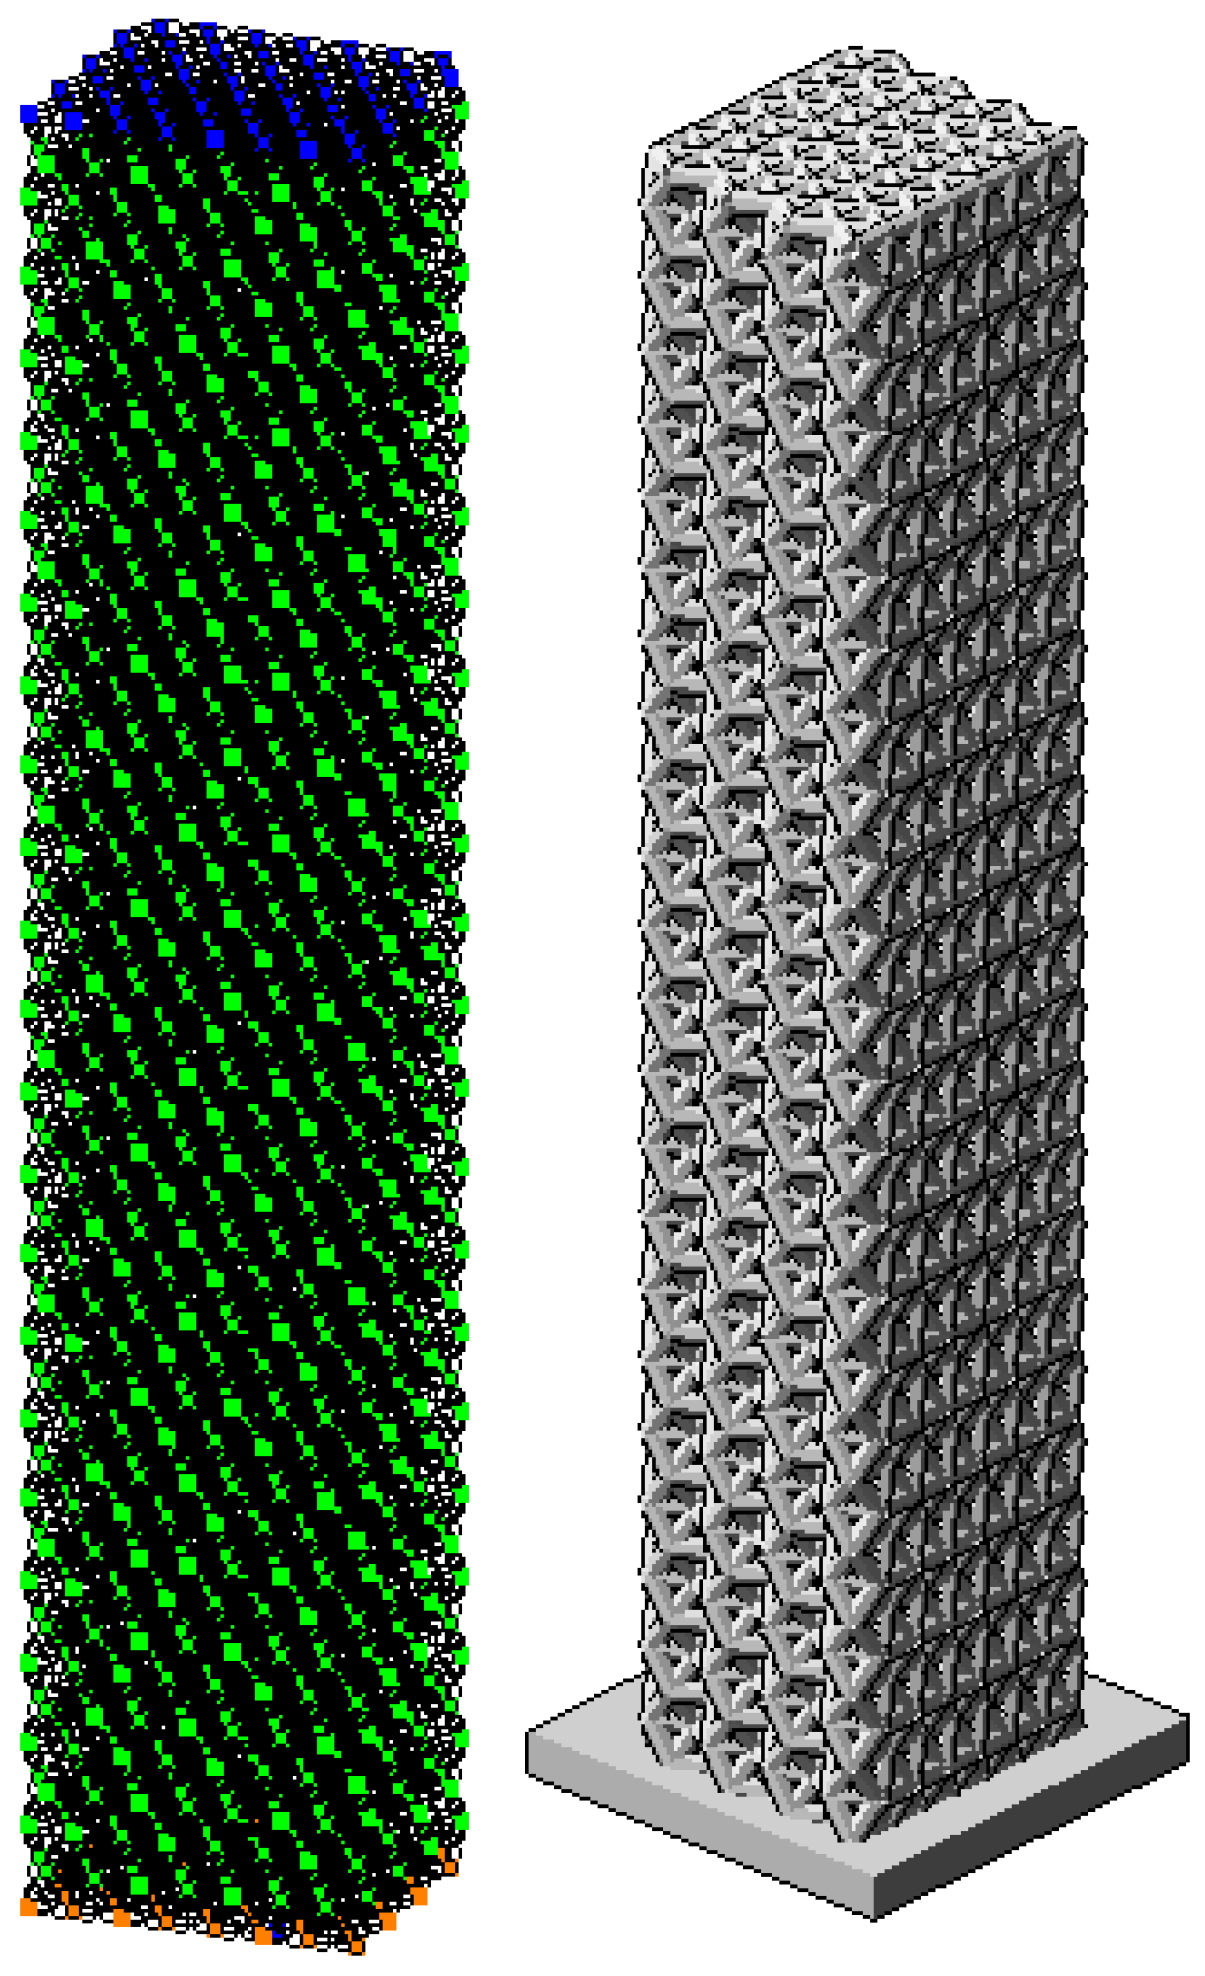
As a result, an FE model of the internal structure of hardened cement paste was developed from the basic tetrahedral elements. A part of the approximate structure is shown in Figure 6. The finite element model developed with the LIRA-CAD 2024 R2.3 software package, as shown in Figure 7. The mesh is uniform throughout the entire volume, with the exception of micro-roughness on the outer surface. At the same time, the structure is self-similar and allows a model to be built with any desired number of elements per unit volume. The parameters of the finite element modeling are presented in Table 3.
Figure 6.
The 3D grid (the spherulite scale is not preserved for clarity).
Figure 7.
The FE model in LIRA CAD.
Table 3.
Parameters of finite element modeling.
Since it is known that the shape of the sample affects the strength index (cubic or prismatic), the FE model was developed with an aspect ratio similar to the tests (h/a = 6). A similar cubic shape model was also created to compare the failure behavior of cubic and prismatic specimens with their actual failure modes.
A test scheme was modeled by the following method: The load was applied in the form of a known relative deformation of the upper nodes. Friction at the sample scale and particle pinning at the microstructure scale were simulated by restraining the upper and lower surfaces against lateral displacements. The corresponding stresses were calculated as the axial force divided by the area of the structure. The axial force was calculated as the sum of the reactions of the support nodes. It was regulated by a high-stiffness rod connected in series to the support nodes via a rigid body. The axial force in the rod was equal to the force in the prism with zero deformation. The deformation and the force can be determined at each stage of the nonlinear calculation. Accordingly, it is possible to recalculate the stresses, relative deformations and modulus of elasticity using the obtained data.
Concrete structural modeling was performed based on the results of hardened cement paste modeling and the principles developed above; the resulting model, which accounts for the features of the concrete structure, is demonstrated in Section 3.
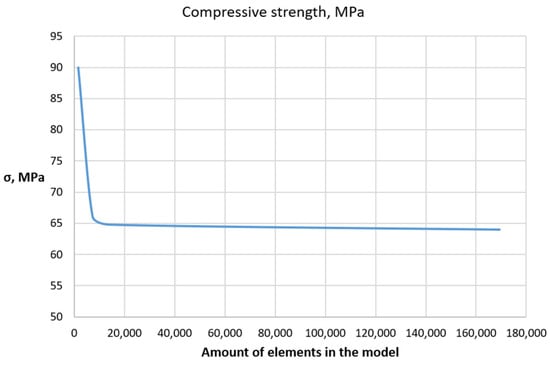
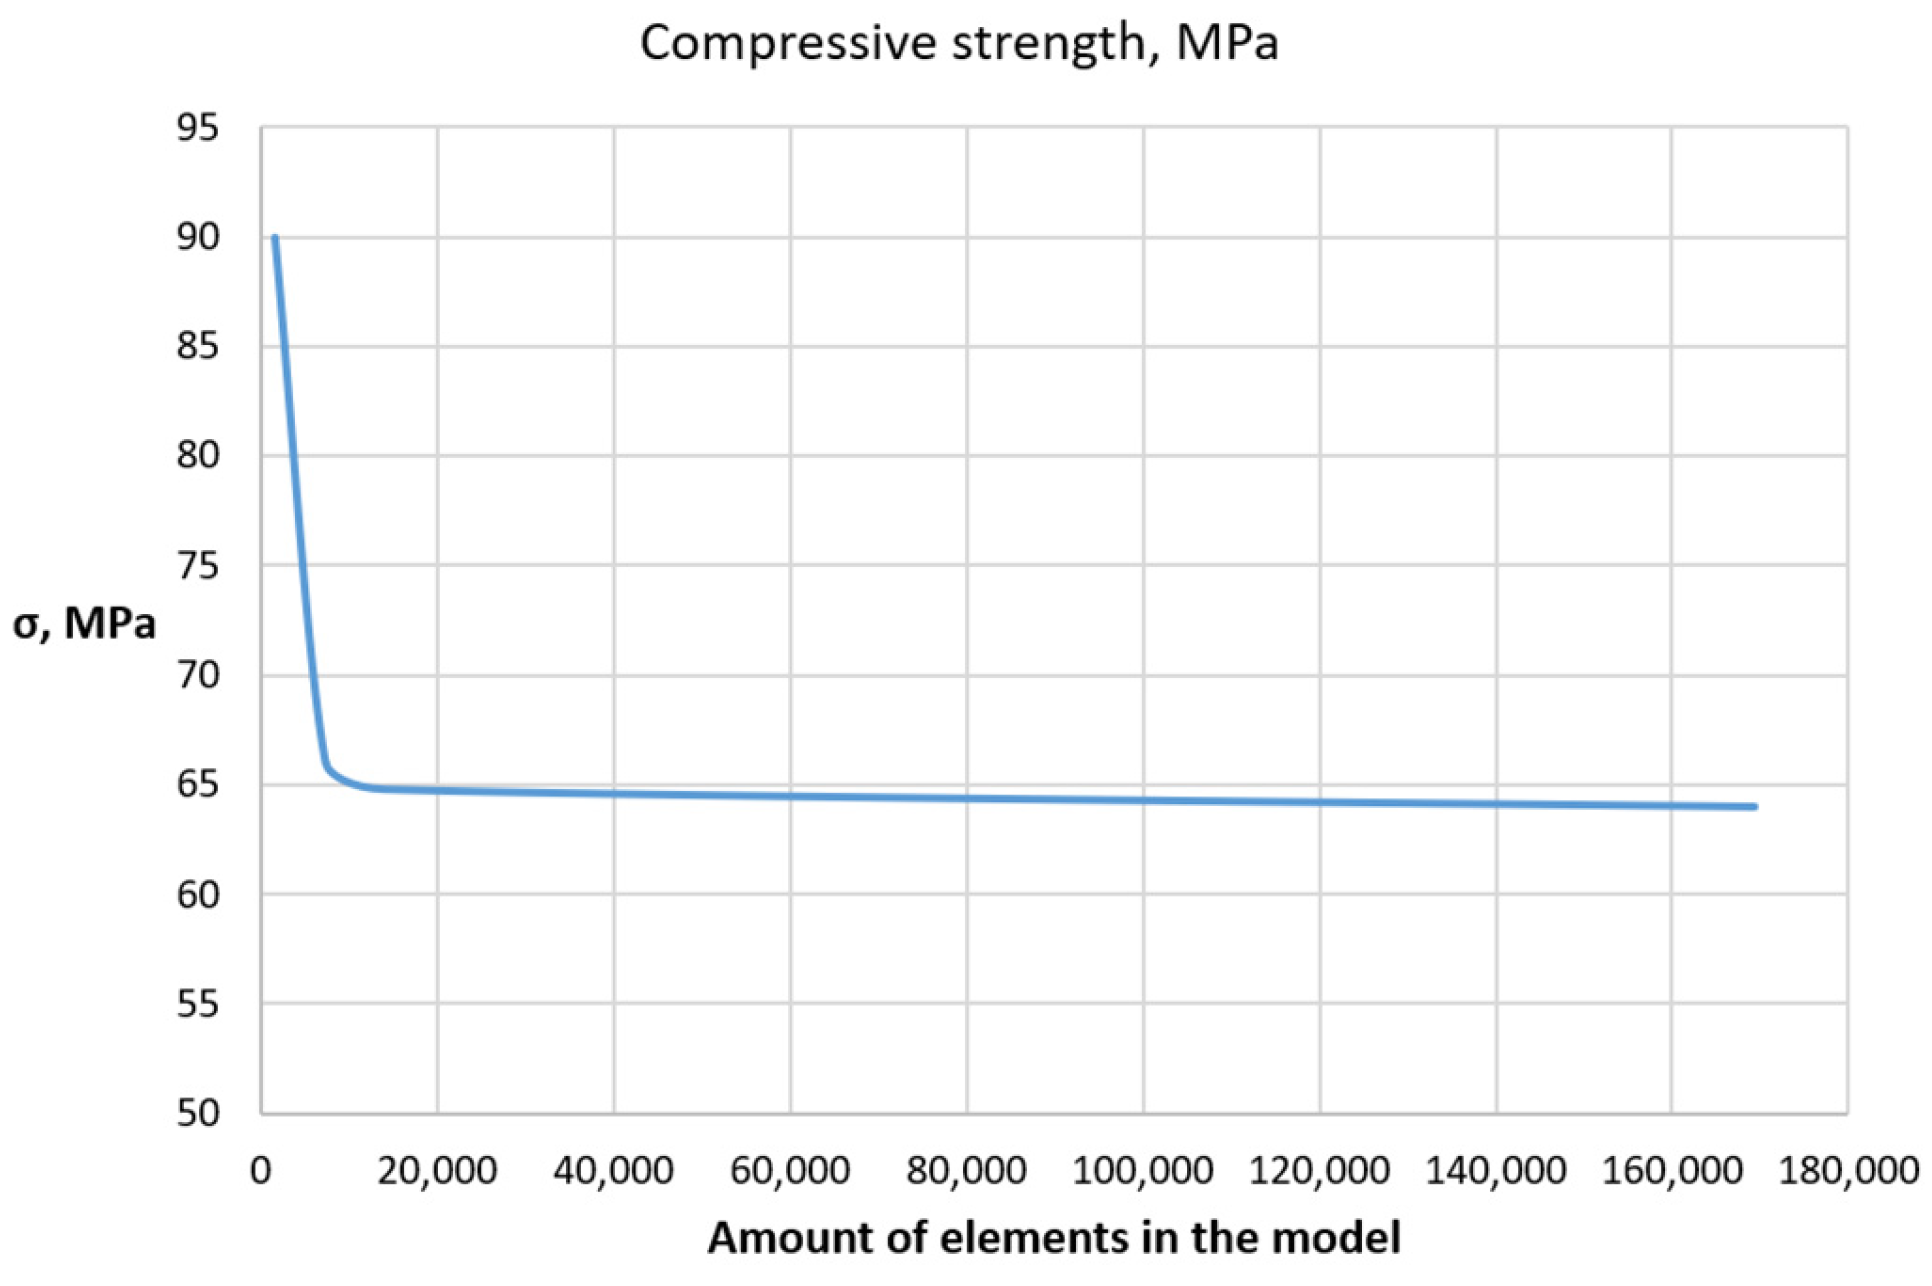
A mesh-sensitivity analysis was performed by comparing the predicted compressive strength for models with different numbers of finite elements. The objective was to verify mesh independence and to determine the minimum discretization level providing stable numerical results. For this preliminary analysis, approximate element parameters were adopted without reference to a specific cement composition; the procedure for determining these parameters is presented in the subsequent sections. The mesh used throughout this study was selected beyond the identified convergence threshold. The convergence curve for mesh-sensitivity analysis is presented in Figure 8.
Figure 8.
Convergence curve.
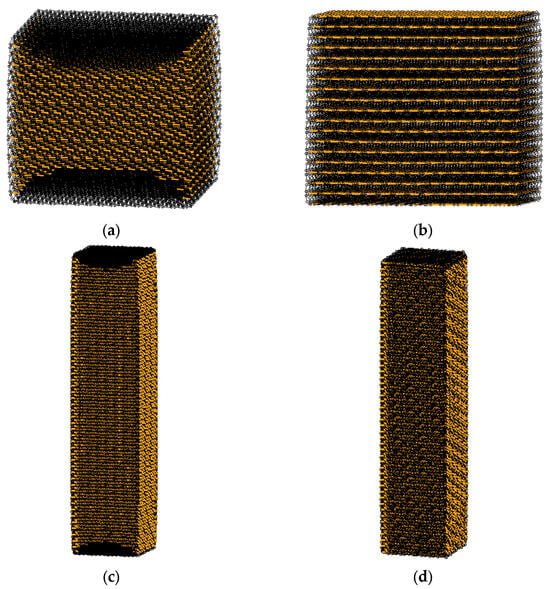
A boundary-condition sensitivity analysis was also performed to evaluate the influence of end restraints on the predicted compressive strength of cubic and prismatic specimens. For both specimen geometries, two loading conditions were considered: (a) restrained lateral displacements at the loading surfaces, representing platen friction, and (b) free lateral displacements, corresponding to frictionless contact. The comparison was used to quantify the effect of end restraints on the numerical predictions and to verify that the adopted boundary conditions provided physically consistent results. The results are presented in Figure 9.
Figure 9.
Failure modes. (a) Cubic specimen with friction at the ends, R = 34 MPa; (b) cubic specimen without friction, R = 25 MPa; (c) prismatic specimen with friction at the ends, R = 26 MPa; (d) prismatic specimen without friction, R = 25.7 MPa.
The boundary-condition sensitivity analysis demonstrated that the adopted end restraints reproduced the expected mechanical behavior of concrete specimens under compression (Figure 9). In cubic specimens, restraining the lateral displacements at the loading surfaces produced characteristic confinement zones adjacent to the platens, resulting in an increase in the predicted compressive strength from 25 to 34 MPa. In prismatic specimens, the influence of end restraints was significantly smaller (25.7 and 26 MPa), since the confined zones occupied only a limited portion of the specimen height and the central region remained close to a uniaxial stress state. In the absence of friction, both cubic and prismatic specimens failed due to relatively uniform transverse expansion over the specimen height. The predicted failure modes and the influence of end restraints are consistent with the well-established behavior of concrete under compression and correctly reproduce the expected differences between cubic and prismatic specimens. Together with the mesh-sensitivity analysis, these results confirm the adequacy of the adopted finite element formulation and boundary conditions. Therefore, the selected discretization and boundary conditions were used in all subsequent numerical investigations.
3. Results
3.1. Hardened Cement Paste Modeling
The experimental stress–strain curve for a series of 28-day-old hardened cement paste samples shows that hardened cement paste has a deformation pattern similar to that of cement composites, such as the classical concrete deformation curve. Elastic and inelastic deformation zones are identified. In this case, the zone of elastic deformations is predominant. Thus, it is incorrect to consider hardened cement paste to be an element of inelasticity in the deformability of cement composites when working in the zone of elastic deformations. Further studies of the deformations of hardened cement paste with various W/C ratios and ages show (Table 4) that the proportion of elastic deformations increases with the age of hardening. With an increase in the degree of hydration, the hydrate shell of the cement particle increases, and porosity, especially microcapillary porosity, decreases. At the age of 7 days, the proportion of elastic deformations is no more than 60%, and by the standard age of 28 days, it reaches 90%. The constancy of the ultimate deformation of hardened cement paste under loading after more than 3 days of curing can be noted; it is determined less by the hydrate component than by the pore component according to the authors’ correlation dependence:
Table 4.
Parameters of elasticity, strength and structural density of hardened cement paste at various curing ages.
Given the characteristics of the deformation properties, the following conclusions about the structure of the basic microstructural element of hardened cement paste were drawn:
- The elastic properties of hardened cement paste are determined by the thickness of the crystal-hydrate shell of hydrated particles and the size of the capillary pores in its structure;
- The plastic properties after reaching the ultimate elastic stress, expressed as a disproportionate increase in deformation under load, should be governed by the ductility of the base element;
- The malleability of the base element may be related to the heterogeneity of its structure.
An analysis of the presented structural model from the point of view of determining the finite elements shows that each hydrate microstructural element has an internal interface, which is a hinge that is connected by rigid links to other elements, which are also hinges. Thus, the FE model of hardened cement paste can be represented by a hinge–rod frame, the stability of which is determined by the arrangement of bonds/rods (Figure 10). Accordingly, the elastic deformation of the frame is the result of the elastic response of the rods up to stresses corresponding to their strength.
Figure 10.
The basic hinge–rod element of the FE model (tetrahedron with hinges).
As a result, we developed a volumetric tetrahedral model with the maximum degree of packing, in which rod/bond thickness was determined by the structural density indicator according to Formulas (1) and (2) and the graph in Figure 4. For W/C = 0.4, it was 0.86. The modulus of elasticity of the bond/crystal-hydrate shell was adopted from literature data as 64.5–71 GPa and the bond/shell strength as 100 MPa [20]. Using basic tetrahedral elements, an FE model of the internal structure of hardened cement paste was constructed (Figure 3). In the elastic stage (before the bonds were broken), the modulus of elasticity according to the model was 31,000 MPa, which was consistent with experimental data. To account for physical nonlinearity, the bond characteristics were set in the form of a stress–strain diagram (in this case, elastic work up to the bond strength limit with an elastic modulus of 70 GPa, followed by the destruction of the element). In the first approximation, it was assumed to be 0.1–0.15 of the compressive strength to match the observed deformation and failure patterns. This ratio is equal to the tensile/compressive strength ratio of cement materials, thereby supporting its applicability to the mechanical properties of the microstructure.
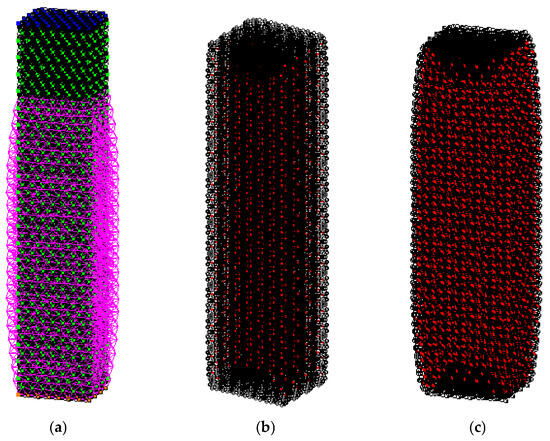
At high tensile strength, failure occurred along compressed elements rather than by transverse rupture, as expected physically. When the strength was exceeded in the most stressed areas, the bonds were turned off, which led to additional deformation as the bonds continued to turn off, resulting in apparent inelastic deformation of the frame (Figure 9 and Figure 10). In the case of prismatic specimens (Figure 11), due to the lower influence of the friction zone, destruction should occur with the formation of parallel longitudinal cracks from transverse tearing forces. The model indeed showed a gradual shutdown of transverse horizontal connections. After switching off all connections, a sharp increase in transverse deformations and destruction of the sample began.
Figure 11.
The presentation of deformations and destruction of the prism according to the FE model. (a) Deformed configuration; (b) switched-off (destroyed) elements at the stage of elastic–plastic deformations, when the circuit is still able to withstand the load (with part of the cross-links showing the appearance of vertical cracks); (c) switched-off (destroyed) elements at the stage of destruction (all cross-links are destroyed, and the destruction of the longitudinal ones begins, except for the zones affected by friction).
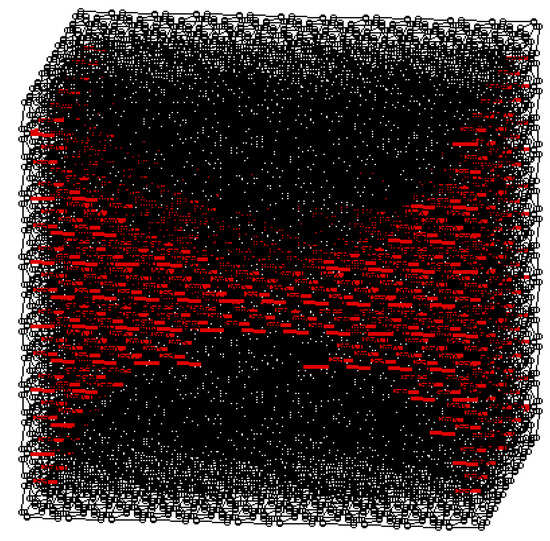
The cubic specimens experienced a greater friction effect, and zones of volumetric compression remained after failure, forming an hourglass shape. According to the model calculations, a similar pattern was observed (Figure 12). The strength of the prism structure was 65–75% of the cubic strength, which was also consistent with the observed behavior.
Figure 12.
The presentation of deformations and destruction of a cube according to the FE model.
3.2. Validation of the Obtained FE Model of Hardened Cement Paste
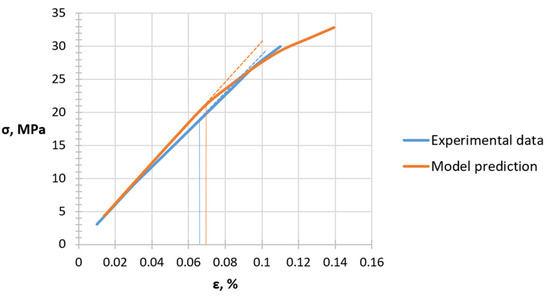
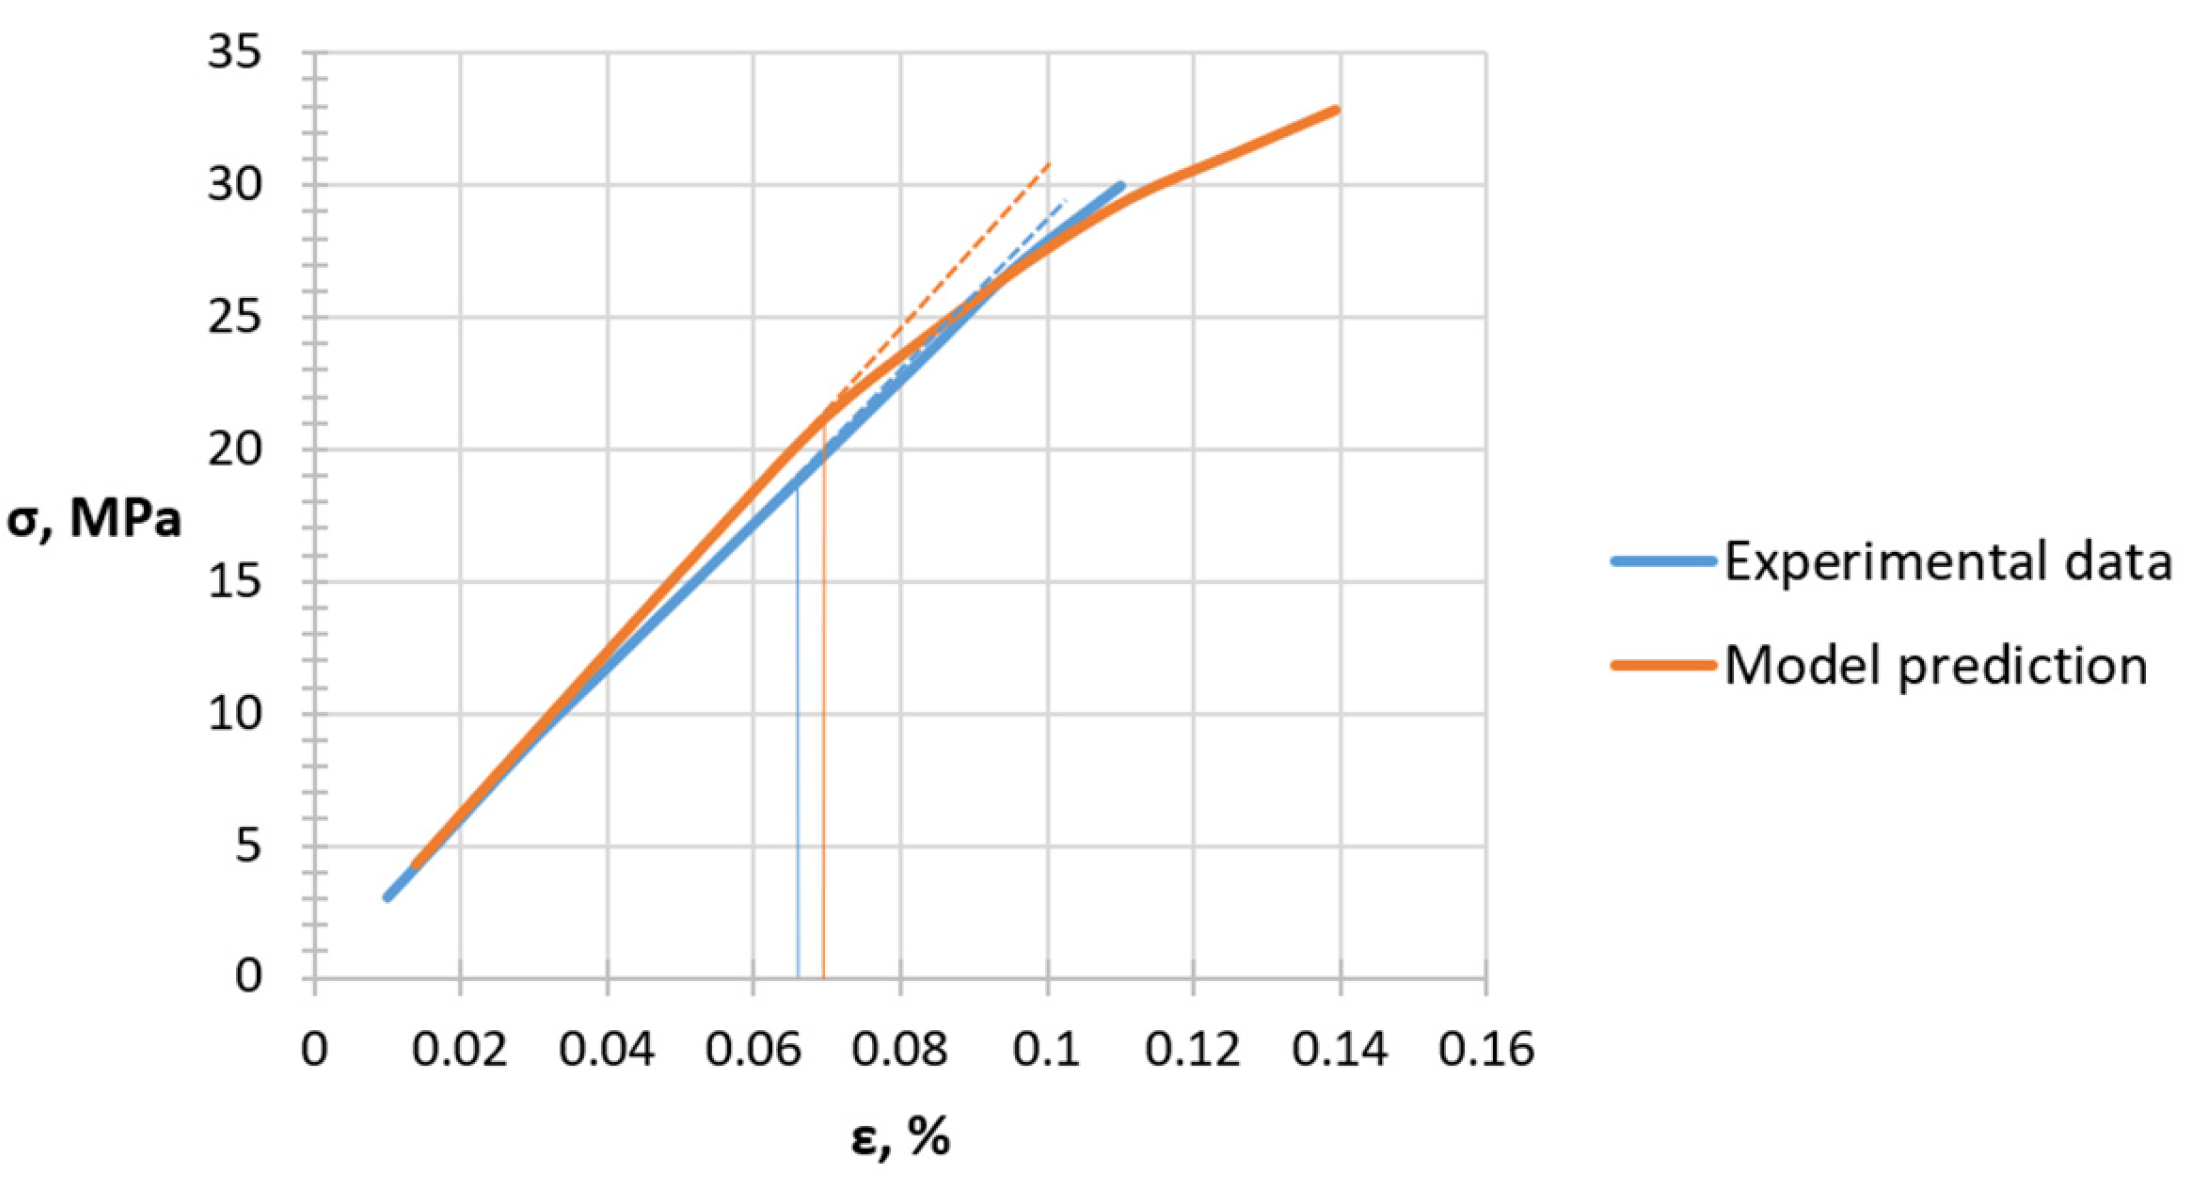
As a result of FE modeling, the deformation curve was obtained. The curve includes both elastic and inelastic deformation zones (Figure 13).
Figure 13.
Experimental and calculated stress–strain curves.
The ultimate strength was assumed to be the stage at which the transverse fracture fields (Figure 12) closed in the center of the section and all cross-links were destroyed. Table 5 shows the calculated (calc) and experimental (exp) data for the modulus of elasticity E and prismatic strength Rb of hardened cement paste at various W/C ratios. The calculated indicators were obtained using the developed FE model; the experimental values were determined experimentally.
Table 5.
Model and validation parameters of hardened cement paste.
The analysis of the convergence of experimental and calculated data on deformations, modulus of elasticity and strength shows a deviation of no more than 7%; i.e., the FE model is highly accurate and can be used for predicting the deformation properties of hardened cement paste.
3.3. Validation of the ITZ Calculation Method
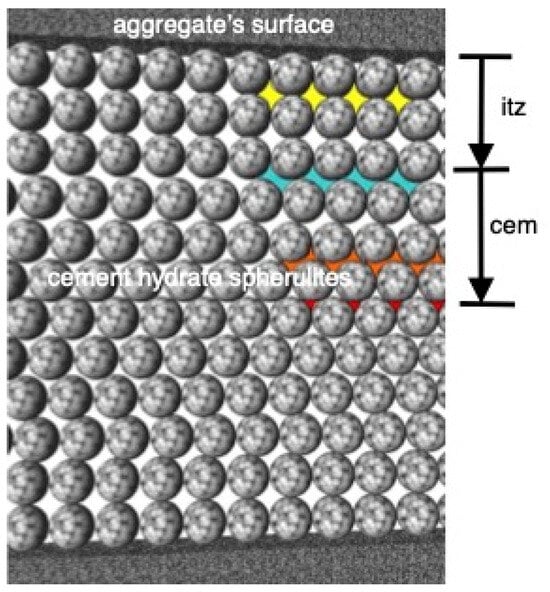
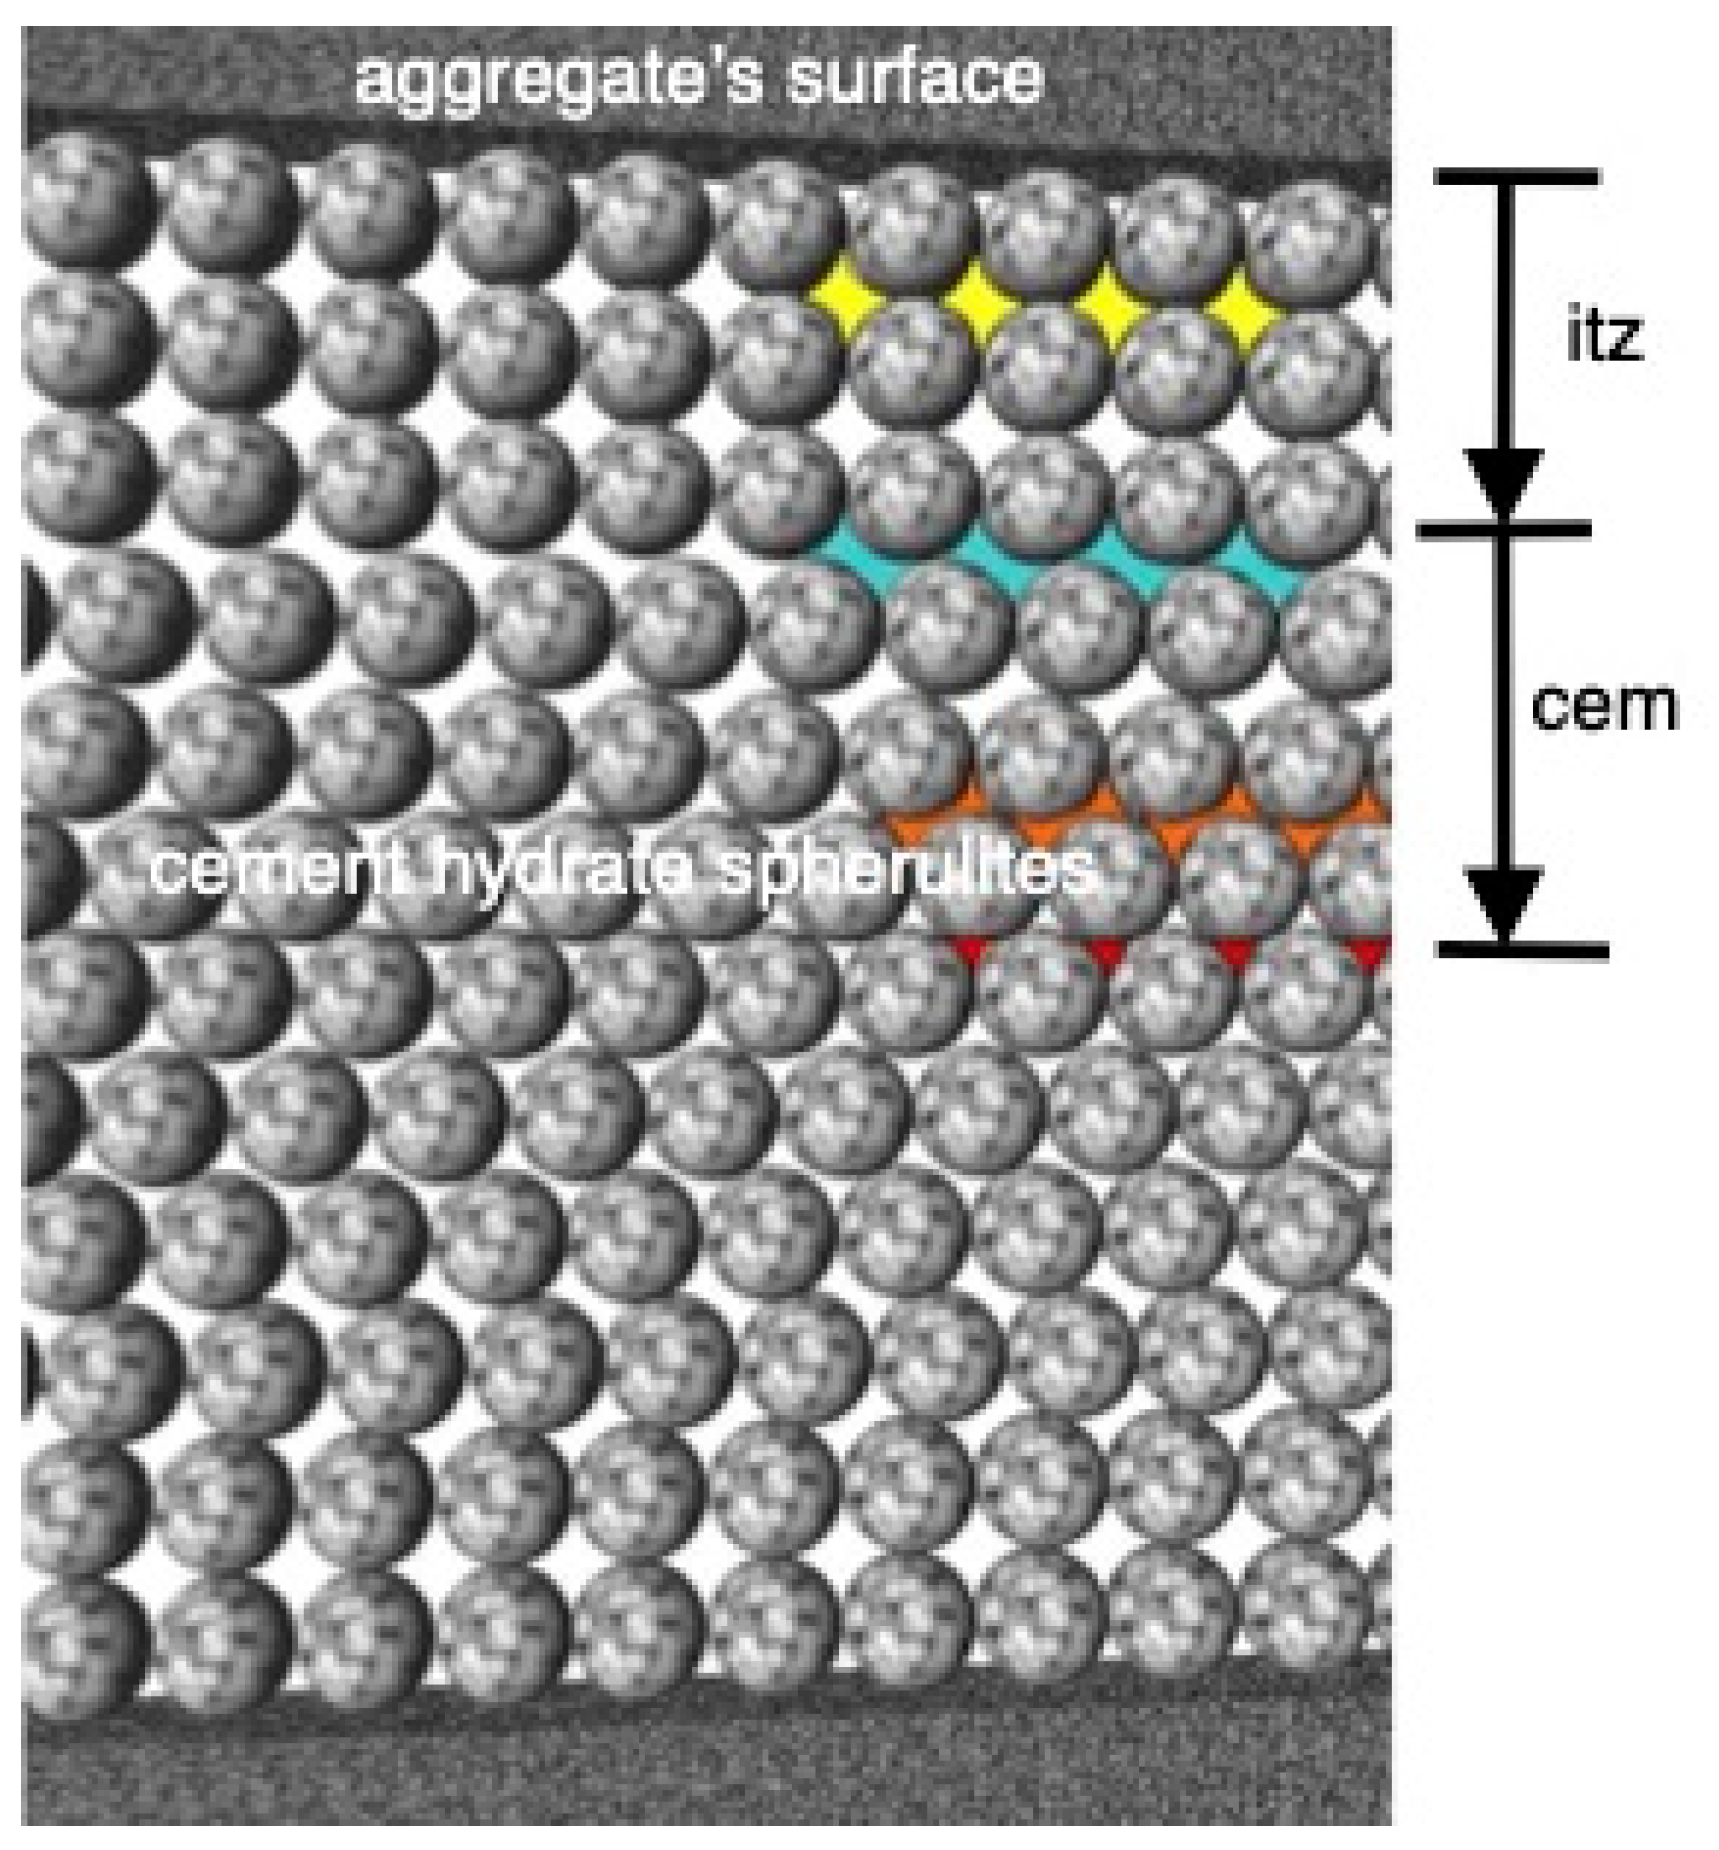
The adequacy of the authors’ structural model to determine the relative thickness of the ITZ was assessed based on the phenomenon of the gradient structure of the matrix component in concrete (Figure 14) [28,30]. The central layer of the hardened cement paste was compacted, and its water content before hardening was close to the water demand of the cement, with a standard normal-consistency value of W/Ccem = 0.22–0.28, while the volume of the ITZ layer was formed by water adsorbed by the aggregate and corresponded to the aggregate water demand, calculated as the residual water after subtracting the cement water demand (Equation (3)).
Figure 14.
Monofractional model of gradient structure of the matrix in concrete with porous ITZ layer.
The value of the dense layer coefficient is determined as:
—thickness of the layer between the aggregate grains, μm.
—thickness of the layer of increased water content at the aggregate surface, μm.
To determine the thickness of the layer between the aggregate grains, the sphere-packing relationships in Equations (6) and (8) were used:
d—the weighted average grain diameter of the aggregate, which is equal to the product of the fineness modulus (Fm) and the smallest grain diameter of the aggregate (dmin).
ky—the compaction factor, which is equal to the ratio of the radii of the intergranular voids to those of the aggregate grains (r/ra).
Using Equation (7),
Thus, the dense layer coefficient is
dmin = 0.14 mm.
Fm = 2.2.
P = 0.4—relative volume of the voids of the aggregate pack.
—grain spreading coefficient, with values according to the cement/sand ratio C/P = 1/1—1.75; 1/2—1.43; 1/3—1.15; 1/4—1.05.
The thickness of the high-water-content layer is
An experimental model was obtained to estimate the relative thickness of the dense layer:
—coefficient of the relationship.
Using the dependence and the laws of tetrahedral packing, the absolute thickness of the ITZ was calculated for fine-grained concrete with different cement-to-sand ratios, and the results were compared with experimental data. Table 6 shows the results of calculating the thickness of the ITZ based on experimental data.
Table 6.
Calculation data for the absolute thickness of the ITZ in fine-grained concrete.
For the selected type of aggregate, the average thickness of the ITZ is 64 μm, which is consistent with data reported in various studies [25,27]. The conducted research study confirmed the adequacy of the monofractional model with average geometric parameters to assess the thickness of the ITZ, which justifies the use of this model in the finite element modeling of concrete.
3.4. Concrete Modeling
The study of the deformation properties of hardened cement paste revealed the similarity between these properties and those of concrete. The development of various types of FE hinge–rod models of concrete was based on the principle of structural similarity between hardened cement paste and concrete, both having rigid rods and dispersed matrix shells. Based on this principle and on the tetrahedral mortar models in [31], the authors propose to consider the structure of concrete in a similar way to hardened cement paste as a tetrahedral hinge–rod model, in which aggregate particles are represented as rigid frames connected by inhomogeneous rods/bonds, including sections of the ITZ and hardened cement paste of the central layer (Figure 15 and Figure 16).
Figure 15.
Basic tetrahedral element of the FE model of concrete. Model elements: Blue denotes the rigid nodal element of the aggregate, pink denotes the interfacial transition zone (ITZ), and dark blue denotes the central element of the compacted hardened cement paste interlayer.
Figure 16.
Three-dimensional finite element model of concrete.
The approach to estimating the relative linear dimensions of these sections was based on the authors’ method of calculating the relative thickness of the layers of concrete elements: hardened cement paste (cem), aggregate (agg) and the contact zone (itz)—the interfacial contact zone (ITZ). Finite element modeling was performed with the LIRA-CAD software package. The aspect ratio of the model corresponded to the dimensions of a standard beam for testing the modulus of elasticity of concrete, 10 × 10 × 40 cm. The characteristics of the hardened cement paste in the central interlayer and the contact zone were determined using the previously obtained FE model (Section 3.1) of hardened cement paste. Verification of the obtained FE models was based on the results of calculations of the relative thickness of the structural layers and experimental studies of deformations under load of concrete samples of various classes, given in the authors’ work in [28]. The structural density of the concrete model in accordance with a concrete-mix compaction coefficient of 0.98, corresponding to a volume porosity of approximately 2%, was set to 0.9 based on this value and calculated using Equation (5). The bond relative thickness was calculated in accordance with the previously developed methodology according to the formulas in Table 2.
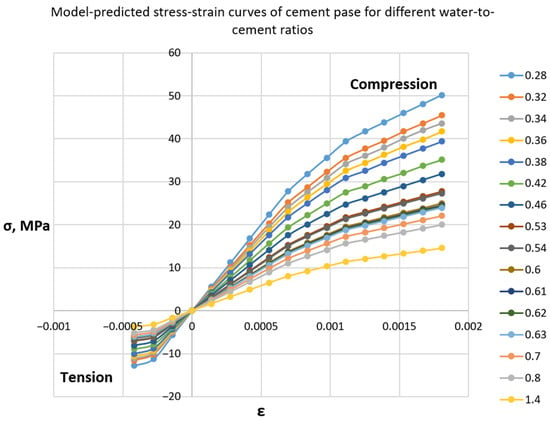
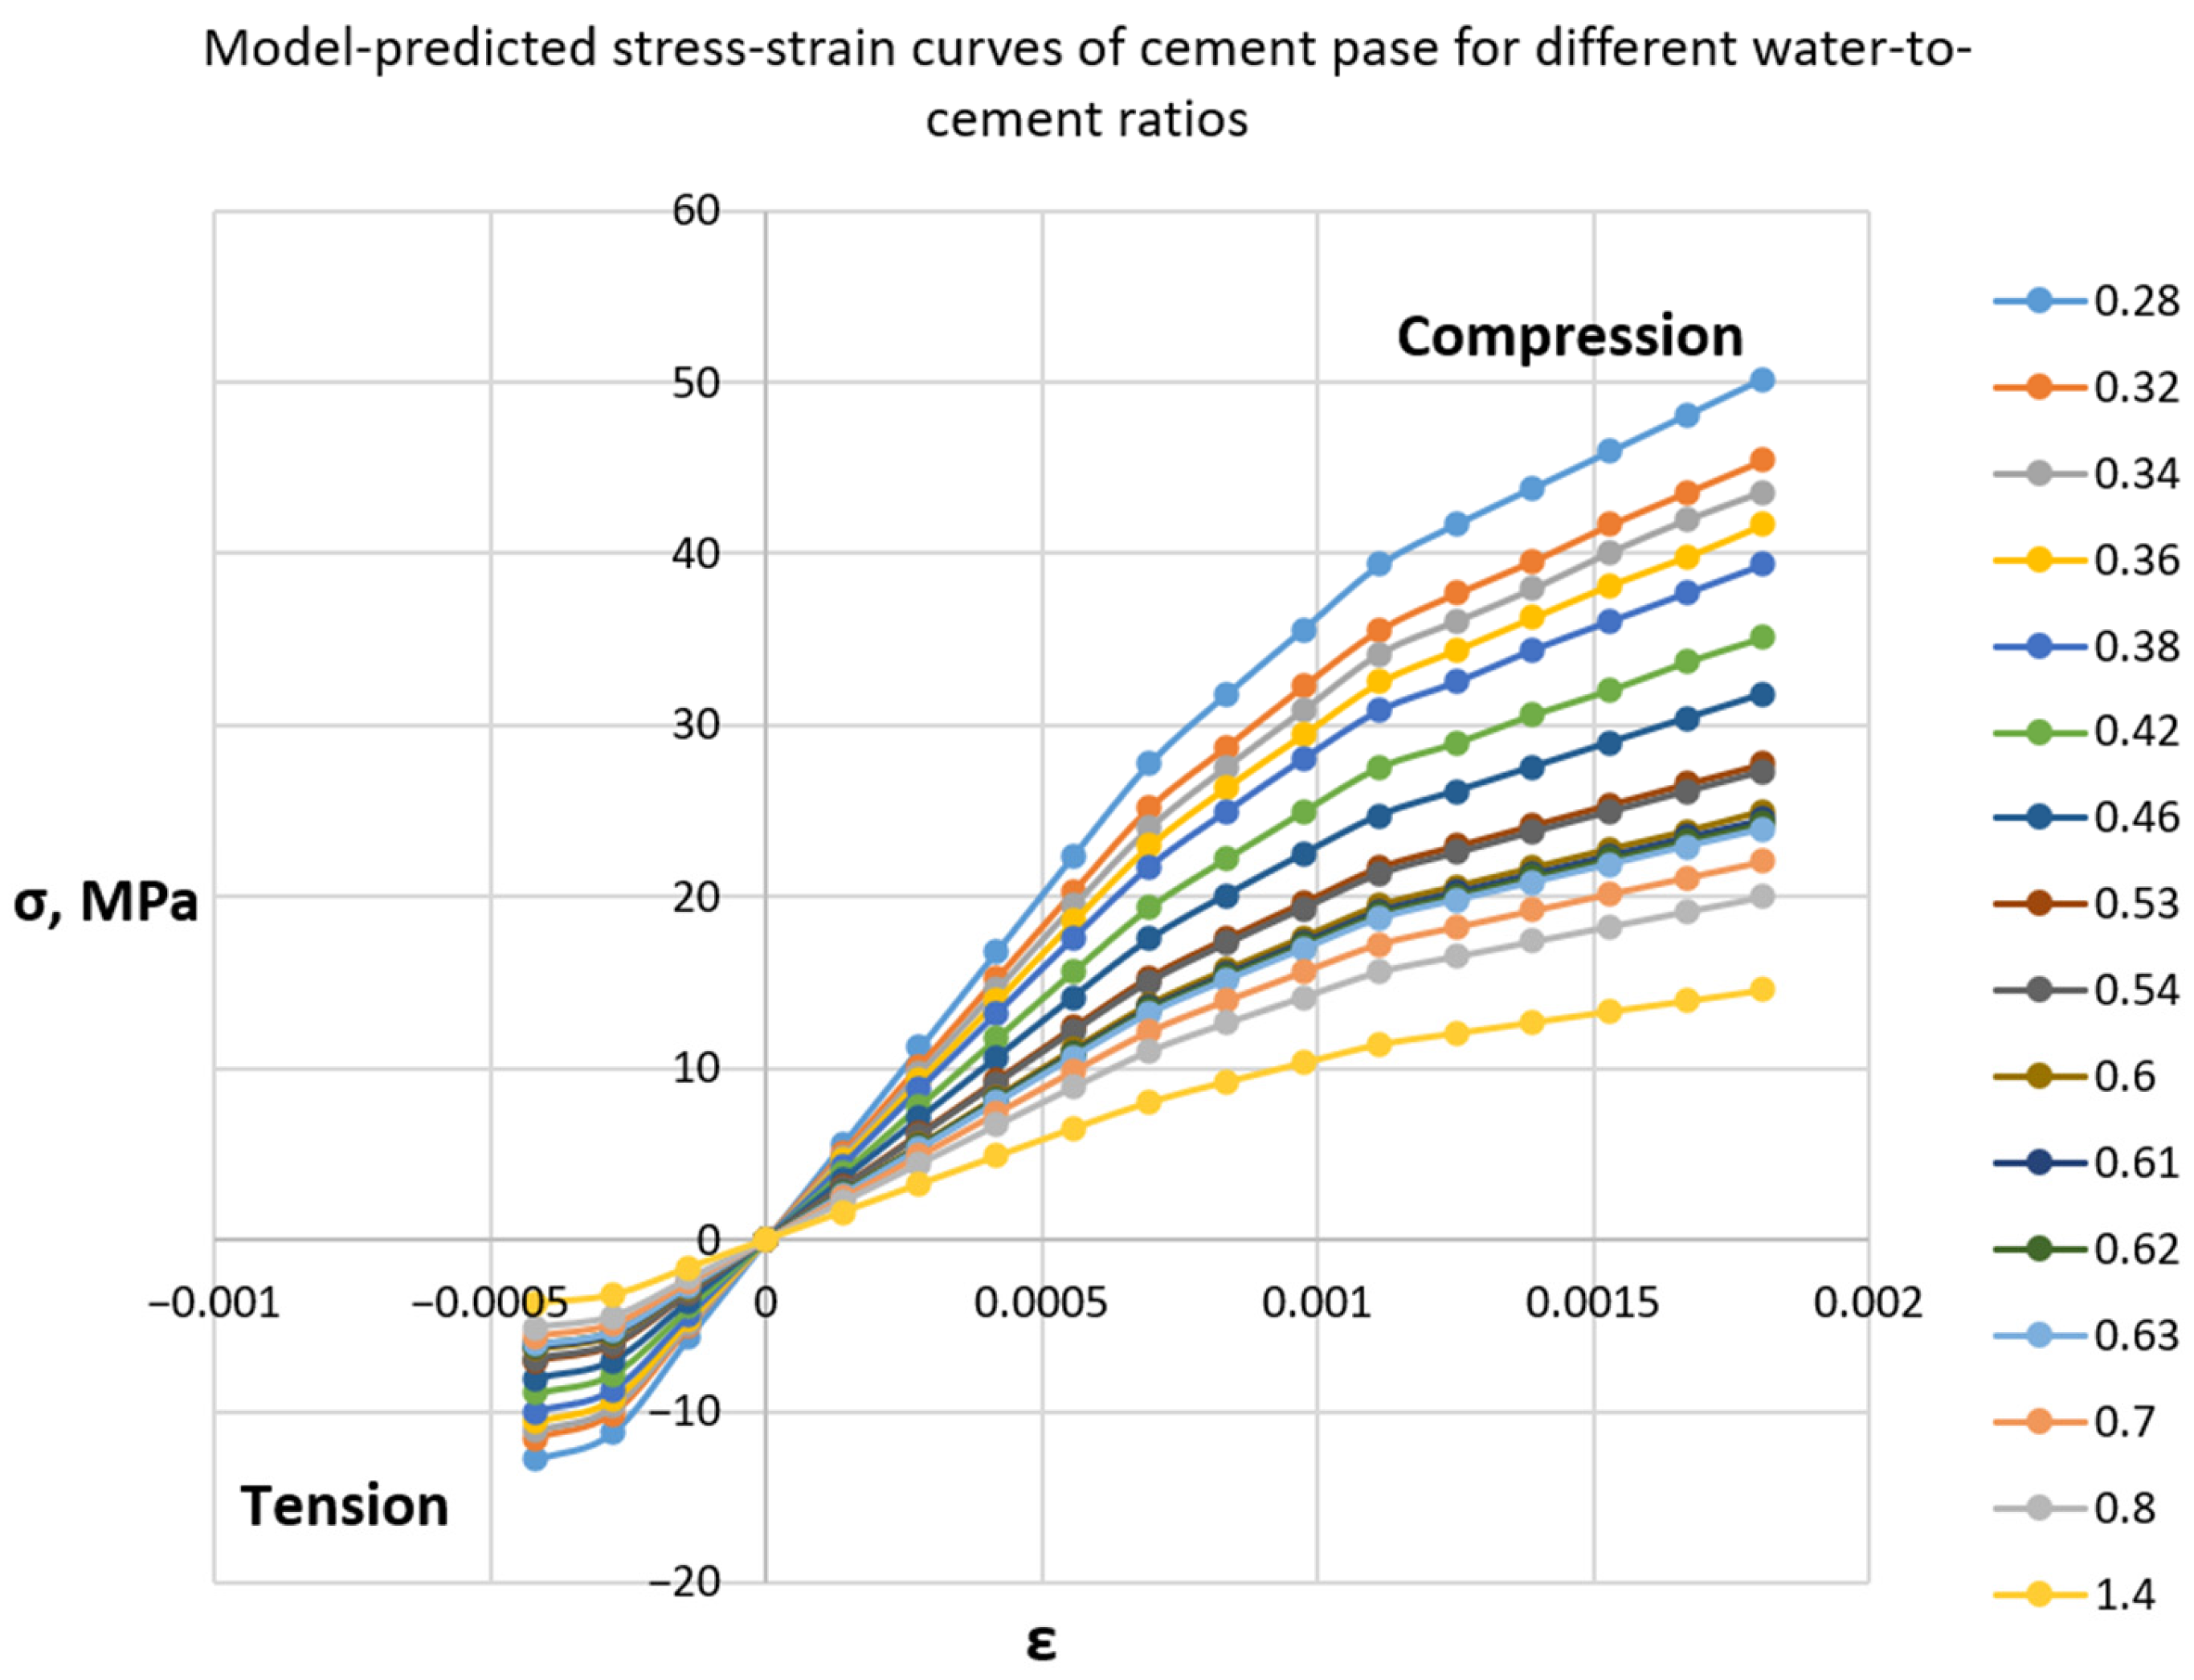
To determine the properties of hardened cement paste in the central layer and the ITZ, we used a previously developed FE model of hardened cement paste which makes it possible to determine the mechanical and deformation properties of hardened cement paste depending on the water-to-cement ratio (W/C). To account for physical nonlinearity, the bond characteristics were set in the form of a stress–strain diagram. In this case, elastic behavior was assumed up to the bond strength limit, followed by destruction of the element. Based on this model, the deformation and mechanical properties, compressive strength Rc, and tensile strength Rct of hardened cement paste at W/C values corresponding to those of the experimental concrete mixtures were determined (Table 7, Figure 17).
Table 7.
Parameters of hardened cement paste integrated into FE model of concrete.
Figure 17.
Deformation curves of hardened cement paste under load with various W/C ratios, integrated into the FE model of concrete.
For granite and quartz aggregates, the average values of a modulus of elasticity of 50,000 MPa and a compressive strength of 1000 MPa were assumed. First, to assess the adequacy of the three-element model, a two-element FE model was built without isolating the ITZ; however, the simulation results showed a significant overestimation of the elastic characteristics. Therefore, only three-element models were further tested. Three types of FE models were built:
- A hinge–rod model, which assumes compliance at the boundary of the ITZ and the aggregate, with a hinge in the rod between the sections of the ITZ and the aggregate;
- A rigid rod model, which assumes rigid attachment of all elements of the concrete structure to each other;
- A hinge–rod model, which assumes compliance at both phase interfaces, with hinges at the boundary of the ITZ and aggregate sections and at the boundary of the ITZ and hardened cement paste sections.
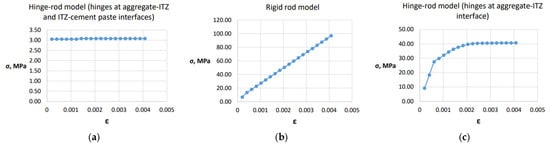
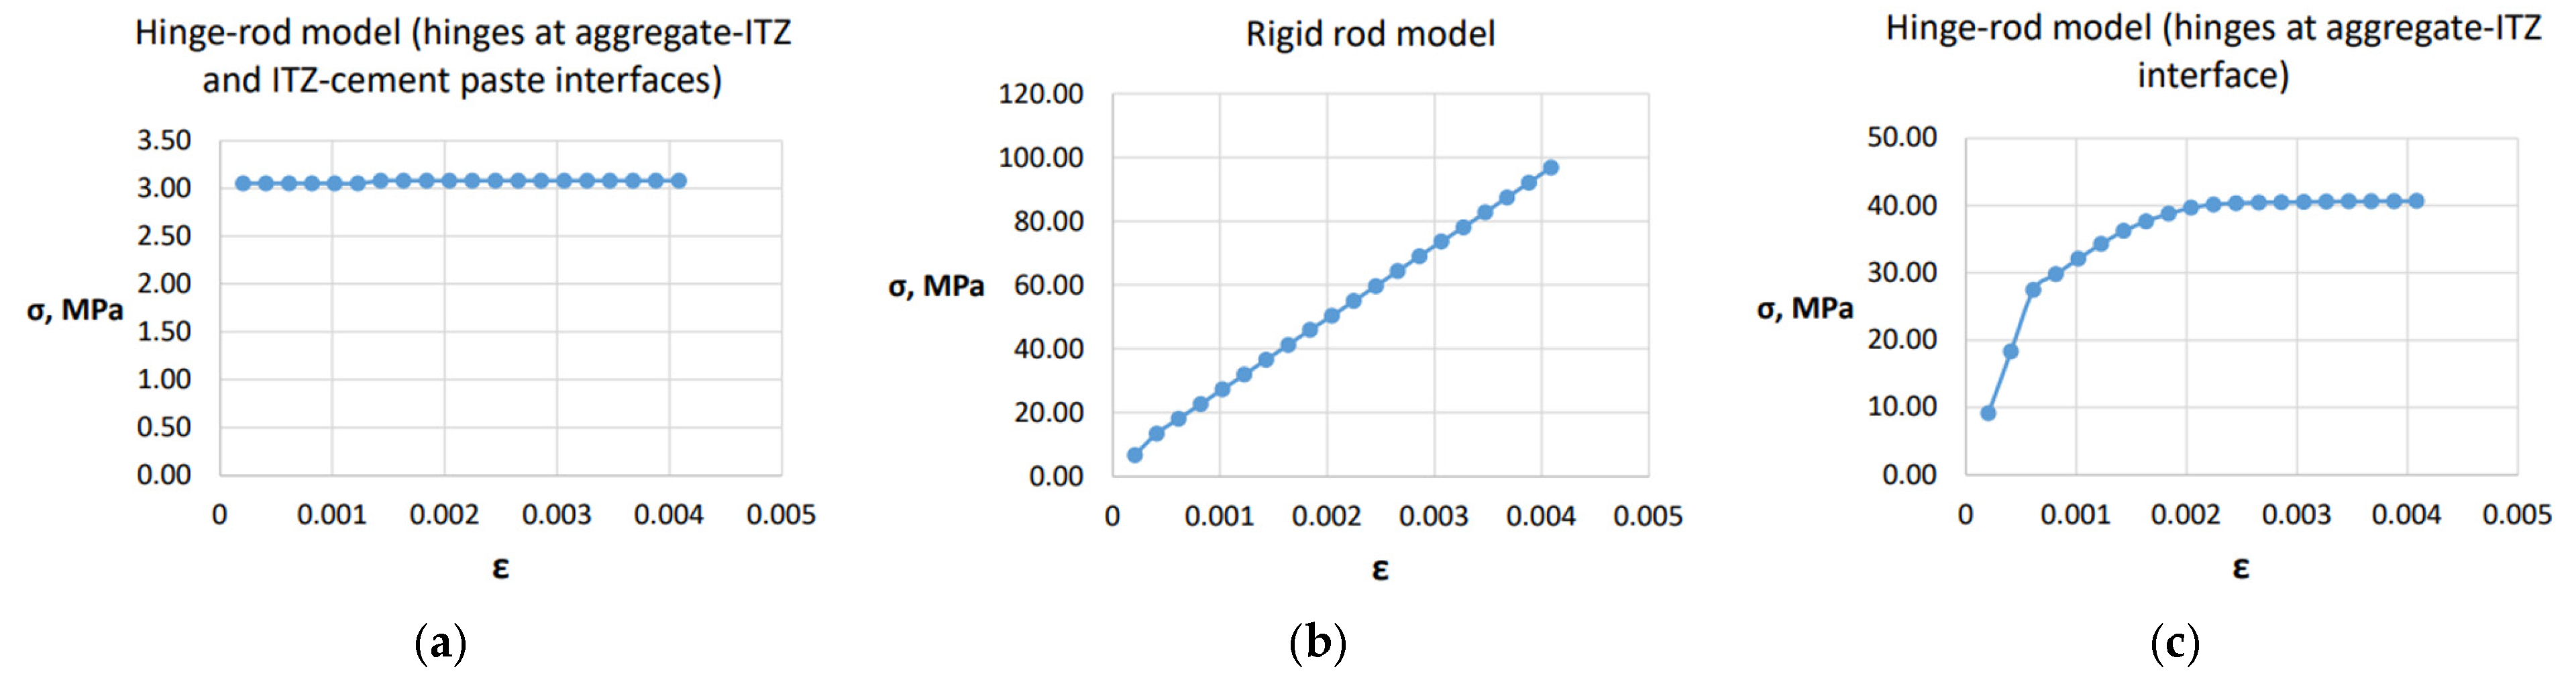
Deformation curves for concrete were calculated using the corresponding thickness values [19] of the agg, cem, and itz layers (Figure 18).
Figure 18.
Concrete compression deformation curves calculated using: (a) 2-hinge joint–rod models, (b)—rigid rod model, and (c) 1-hinge joint–rod model.
The model with hinges at all interfaces led to the geometric variability of the model and its low rigidity and strength. The option with all rigid nodes, on the contrary, led to an overestimation of strength, while the modulus of elasticity was quite close to the initial modulus of elasticity of the corresponding concrete. It is well known that concrete has an elastic–plastic model of deformation under load; therefore, the hinge–rod model with a hinge between the sections of the ITZ and the aggregate is the most adequate.
3.5. Validation of the Obtained FE Model of Concrete
As a result, a hinge–rod model in which the element of inelasticity is a hinge mounted between the ITZ and the aggregate was developed. Loading was continued until failure, which occurred along the ITZ and hardened cement paste (Figure 19).
Figure 19.
Broken hardened cement bonds during loading of the FE model of concrete (highlighted in red).
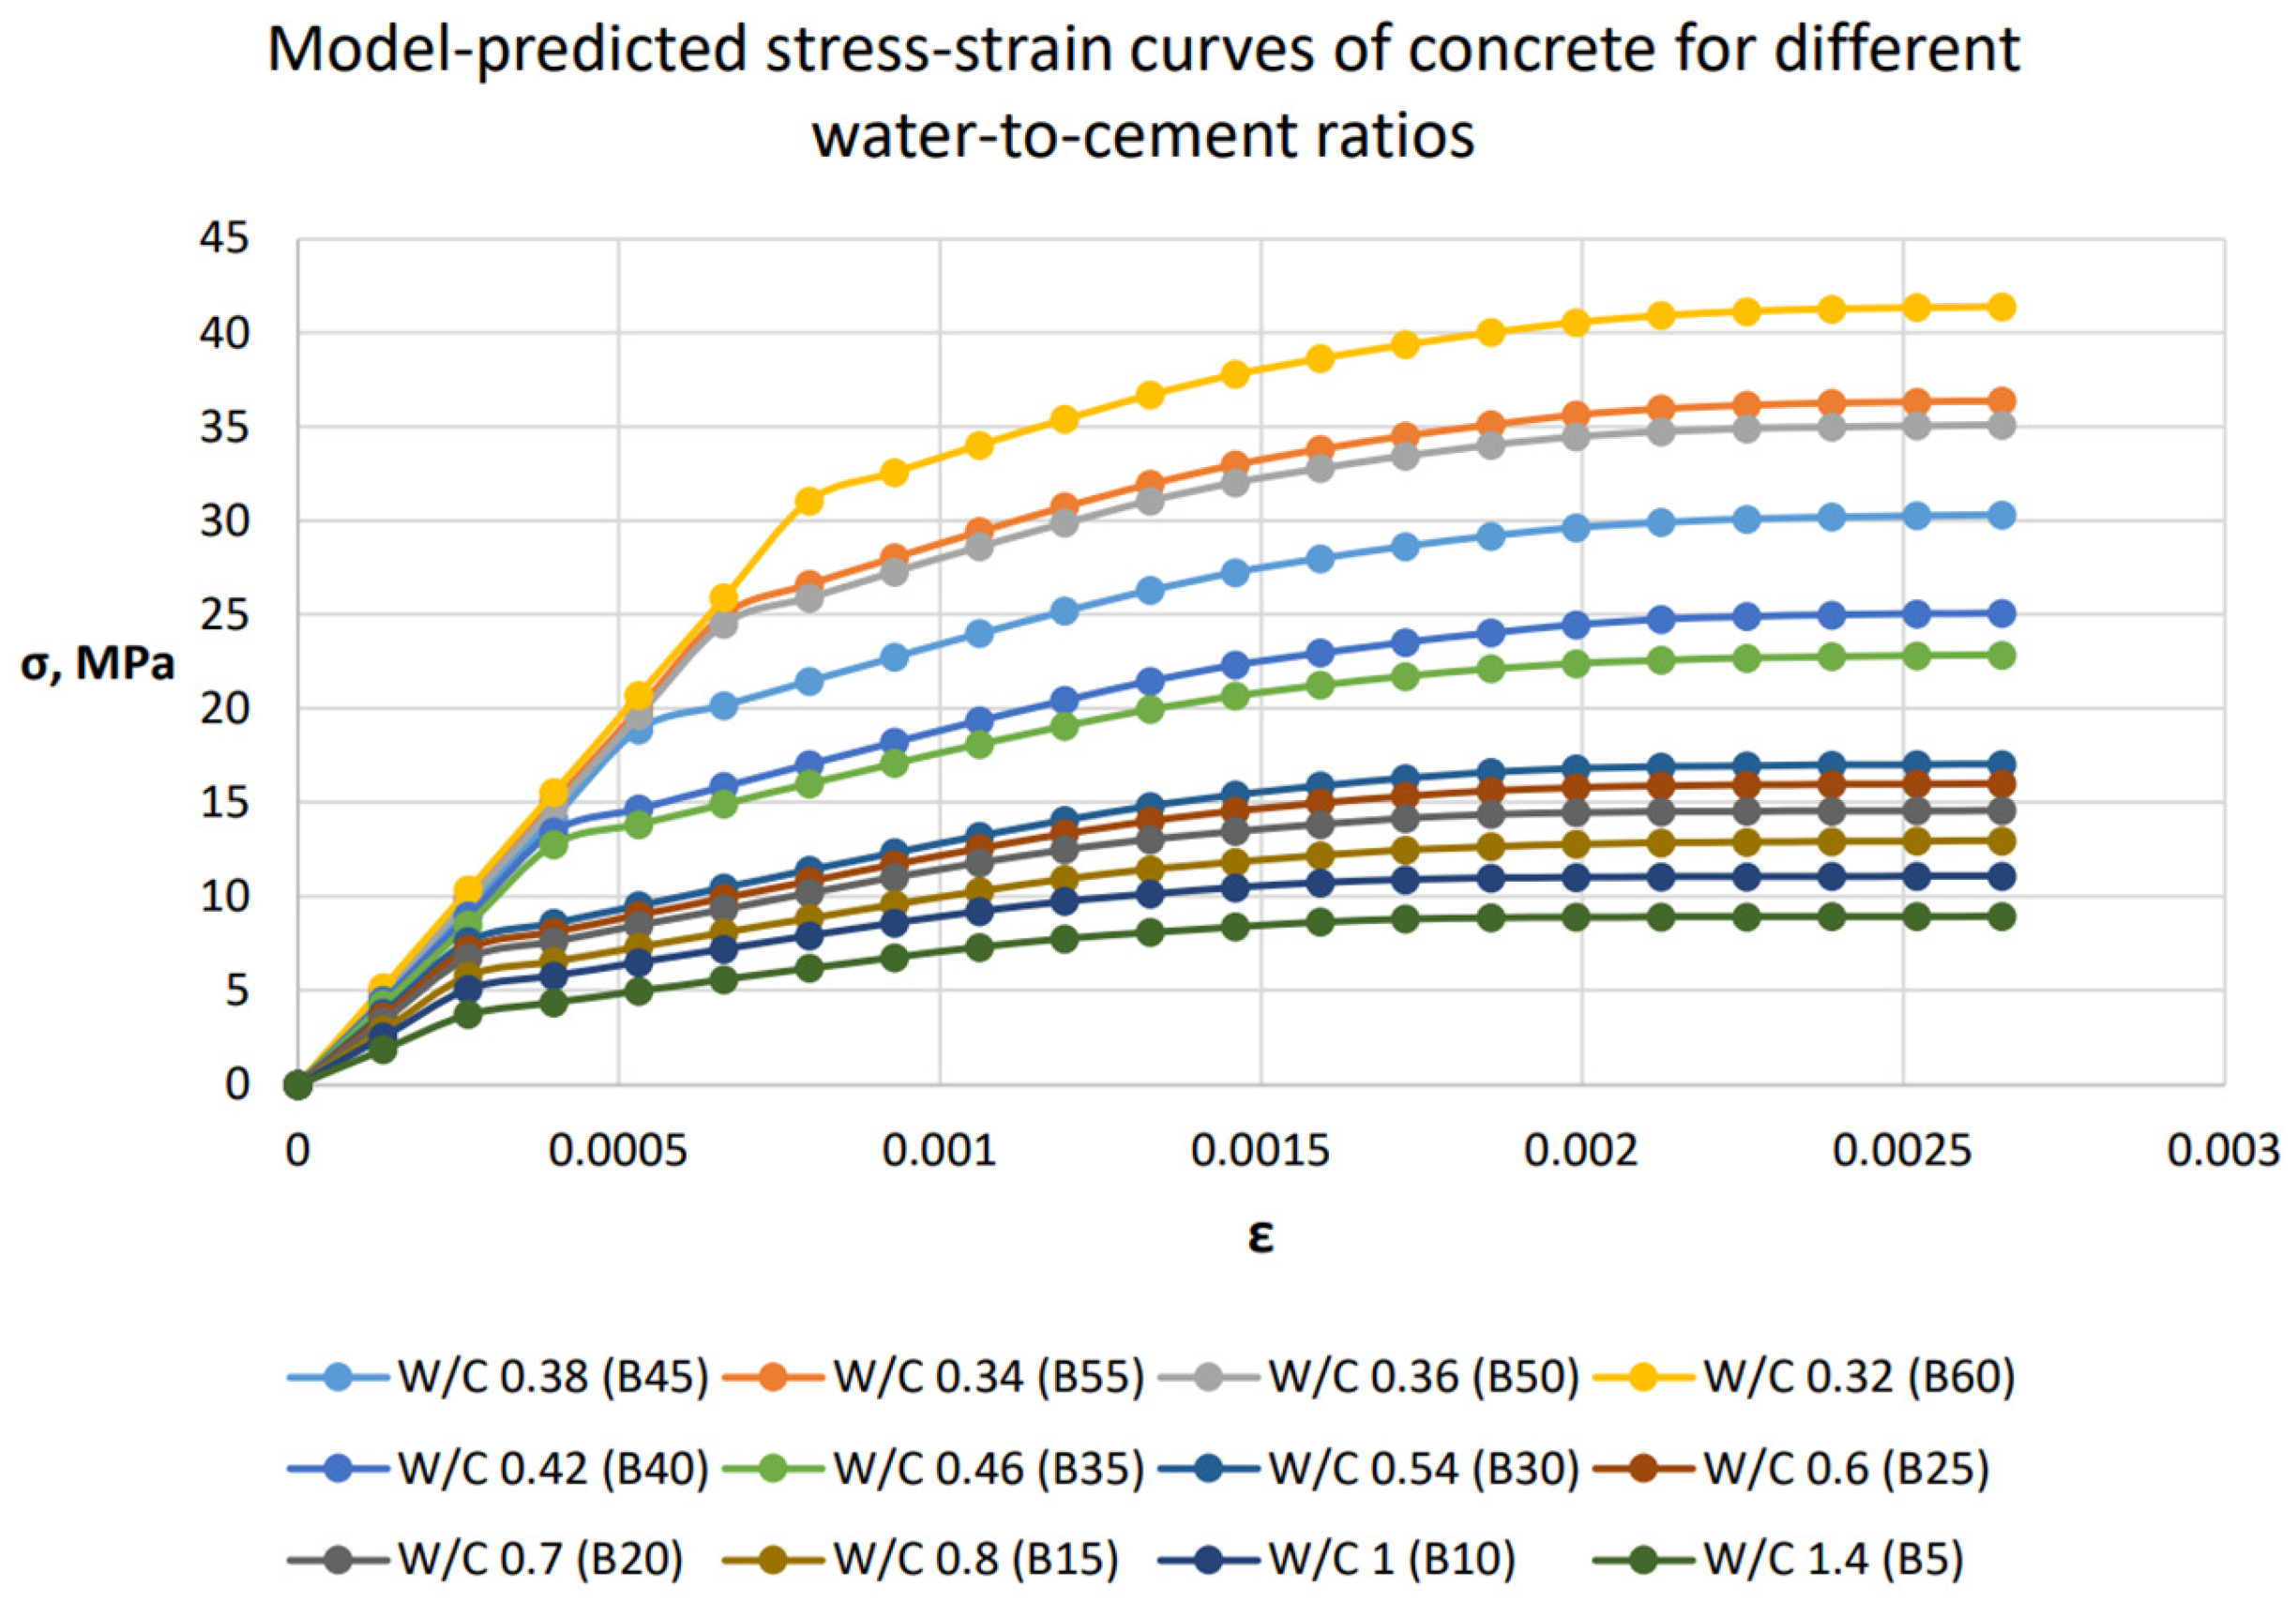
Using this FE model, the deformation curves for concrete classes B5 to B60 (according to the Russian standard, close to the corresponding EN C classes) were constructed in accordance with the parameters of the structure and composition in the study in [19] (Figure 20).
Figure 20.
Calculated deformation curves of concrete for classes B5 to B60, determined by the FE model.
For the specified classes of concrete, the strength and modulus of elasticity were calculated using the FE models. Comparisons with experimental data and values calculated using the layered structural model are given in Table 8.
Table 8.
Model validation based on deviations between the actual and model-calculated modulus of elasticity and compressive strength of concrete.
The analysis of the convergence of experimental and calculated data in deformations and modulus of elasticity shows an average deviation of no more than 6%; i.e., the FE model is highly accurate and can be used for predicting the deformation properties of cement concrete. In strength prediction, accuracy is somewhat lower, and accuracy is unsatisfactory when calculating classes below B15, i.e., for nonstructural concrete. For structural concrete of class B20 and higher, which is used in load-bearing structures, the average error does not exceed the class range and is acceptable.
4. Discussion
This paper presents a controversial deterministic approach to modeling the structure and properties of concrete, which was motivated by the task of creating an integrated concrete model that includes the microlevel of hardened cement paste, the mesolevel of the ITZ contact zone, and the macrolevel that includes all the elements of concrete. The same task dictated solutions to this problem, excluding a number of factors that complicate it. The main one is the transition to monofractional and monomorphic models.
The main difference between the proposed approach and the currently prevailing statistical models [9,12,13,15] is the deterministic location of hydrate clusters and pores. Determinism is associated with the deterministic nature of structure formation and is necessary for designing an integrated model that should account for the specific formation of a cement matrix in concrete in the presence of aggregate.
The deterministic nature of concrete structure formation is governed by the following factors:
- Pores form in place of excess unreacted water.
- Unreacted water is displaced into the intercluster space and structurally accompanies the clusters.
- Excess water is sorbed by the filler and makes the matrix structure variable.
Statistical methods do not allow for direct consideration of any of these factors, but they do allow us to take into account the polyfractionality of the structure. The deterministic method at this stage does not allow polyfractionality to be taken into account, but it does allow the factors governing hydrate-structure formation to be considered. Its structural parameters can be predicted using mathematical relationships with composition factors such as the W/C ratio, the water consumption of cement and aggregates, and the aggregate fineness modulus, because the proposed models correspond to the physical nature of their formation.
A debatable question is which is more important, polyfractionality or consideration of the physical laws of structure formation? The authors claim that for continuous granulometries, polyfractionality is less significant. The practice of working with polyfractional aggregates with continuous granulometry shows that the voidness of their packing is in the range of 43–52%, which corresponds to loose monofractional packing. Any packing with continuous granulometry can be reduced, in terms of properties and topology, to a monofractional one, with a packing angle providing the same voidness.
The next important advantage of the deterministic approach is that it provides affordable finite element modeling based on hinge–rod models. The lack of a statistical distribution of elements in shape, size, and location reduces the number of combinations required for calculation by orders of magnitude and, in fact, makes modeling more efficient and directly addresses the task of predicting mechanical and deformation properties. This is supported in this study by the convergence results (Figure 8). Less than 10,000 elements are needed to apply the proposed FE model. This makes the FE modeling of composites achievable with ordinary computer equipment.
In addition to the approach itself, the authors’ methods for regulating the deformation properties in the model are also debatable, particularly the method for establishing an adequate elastic–plastic deformation pattern. These methods for defining nonlinear deformation include:
- Adjusting the packing angle or the thickness of the rods in the model, leading to a change in the size of the pores, which are factors of plastic deformation.
- Setting hinge joints in the structural model in accordance with the specifics of its formation, which also introduces plastic deformation.
- Setting the difference between the properties of the bonds in the model during compression and expansion and adjusting the ratio between them.
Why do the authors propose a broad set of methods, which is highly controversial? The main reason is the limitations imposed by each method. For example, the use of the first method for a generally rigid frame practically does not lead to modeling plastic deformations, but only affects strength. Only in combination with the second method, when in addition to the space for deformation, there are also malleable bonds that deform without breaking, a pattern of inelastic deformation appears. The use of the third method makes it possible to provide a three-stage deformation pattern in which zones of elastic and inelastic deformation are identified, followed by the final stage of plastic fracture. Refining the deformation relationship makes it possible to create adequate models and improve our understanding of the behavior of the actual material structure.
5. Limitations
In addition to certain advantages, the limitations of the proposed method follow from the discussion:
- Application to the modeling of components with continuous granulometry.
- Application in heavyweight concrete with heavyweight aggregates, mainly of classes for load-bearing structures from C16/20 (B20) to C55/67 (B60).
- Application in concrete that does not include dispersed or external reinforcement.
- Application under static loads, excluding dynamic, shock or cyclic loading.
6. Conclusions
As a result of the analytical research conducted, the tasks have been completed and the purpose of this study has been achieved. The integrated “end-to-end” structural and finite element modeling of concrete has been performed.
Based on the analysis of experimental data on the deformation of hardened cement paste under load, the microstructural model of hardened cement paste, in the form of a spherulite-lattice packing of hydrated particles, has been refined. The structural density indicator has been established as the main parameter of such a model. The three-layer structure of the basic hydrate cluster element has been substantiated; in the finite element scheme, it is defined as a hinge connected to the rest of the elements by rigid crystal-hydrate rods. The FE model of hardened cement paste is defined as a dense tetrahedral packing of cluster elements/hinges connected by rods, whose cross-sectional thickness is determined by the proposed indicator of structural density. Elastic deformations under loading are determined by the elastic response of the rods; inelastic deformations are determined by the sequential shutdown of overstressed connections. The validation of the developed FE model makes it possible to predict stress–strain behavior and the elastic modulus of hardened cement paste with high accuracy. The FE model supports further development and allows the matrix structure to be designed by adjusting the arrangement of elements and the connections between them or by introducing components with modified stiffness of hinges or connections.
A method is proposed for calculating the thickness of the interfacial contact zone (ITZ) in cement concrete using averaged geometric parameters, including the structural density of a monofractional packing, voidness, size modulus, minimum aggregate particle size, and hydraulic self-sealing coefficient. The calculation shows close agreement with data from studies of ITZ thickness, which justifies the use of monofractional packing with a size modulus corresponding to the actual one as the basis for designing a tetrahedral hinge–rod FE model of cement concrete. The following principles are implemented in the hinge–rod FE model of concrete:
- The three-element structure of concrete is defined by the heterogeneity of the bonds/rods along their length, with the rods divided into sections according to the actual component ratio;
- The center of the aggregate is taken as the attachment point, followed by a section of the ITZ and a section of hardened cement paste in the central part of the model rod;
- The relative length and thickness of the rod sections are calculated from the concrete mixture composition parameters using the methods developed in the authors’ study in [19];
- The characteristics of the hardened cement paste sections in the central part and the ITZ are determined by the developed FE models of hardened cement paste;
- A hinge is used as an element of inelasticity, which is installed between structural elements or sections of the rod in the FE model.
A comparative analysis of the calculation results and experimental deformations of rigid rod models and various types of hinge–rod models, in which the components are aggregate elements and the rods are divided into ITZ and hardened cement paste sections, showed the best agreement for the hinge–rod model, in which the hinge is installed in the rod between the sections of aggregate and the ITZ. A rigid model is purely elastic, a model with hinges between all elements exhibits plastic behavior, and a model with a single hinge provides inelastic deformation behavior. At the same time, it should be noted that the multi-joint model is promising for predicting the properties of concrete in the plastic deformation zone during loading.
The assessment of the adequacy of the obtained nonlinear hinge–rod FE model showed an error of no more than 6% on average when predicting the modulus of elasticity and strength within the class range, which is a satisfactory indicator. It should be noted that in the developed model, the relative lengths of the rod sections are related to the composition of the concrete mixture and serve as optimization parameters in the FE model. Thus, the relationship between the composition of the concrete mixture and its mechanical and deformation properties is realized in the developed model of cement concrete.
Regulating the deformation properties of concrete is very effective in the design of reinforced concrete structures. This effectiveness was demonstrated in the authors’ study in [30]. Therefore, the proposed method for predicting concrete deformation properties is promising for improving the accuracy and economy of structural design.
Author Contributions
Conceptualization, A.K.; methodology, A.K. and A.Z.; software, A.Z.; validation, A.K. and A.Z.; formal analysis, M.M.; investigation, M.M.; resources, M.M.; data curation, P.G.; writing—original draft preparation, A.K.; writing—review and editing, A.K. and A.Z.; visualization, A.Z.; supervision, A.G.; project administration, M.M.; funding acquisition, A.G. All authors have read and agreed to the published version of the manuscript.
Funding
This research study received no external funding.
Data Availability Statement
The original contributions presented in this study are included in the article. Further inquiries can be directed to the corresponding authors.
Acknowledgments
The authors have reviewed and edited the output and take full responsibility for the content of this publication.
Conflicts of Interest
The authors declare no conflicts of interest.
References
- Zhang, Y.; Lu, M.; Hwang, K. Finite element modeling of reinforced concrete structures. Finite Elem. Anal. Des. 1994, 18, 51–58. [Google Scholar] [CrossRef] [Scilit]
- Sciegaj, A.; Larsson, F.; Lundgren, K.; Nilenius, F.; Runesson, K. Two-scale finite element modelling of reinforced concrete structures: Effective response and subscale fracture development. Int. J. Numer. Methods Eng. 2018, 114, 1074–1102. [Google Scholar] [CrossRef] [Scilit]
- Ashour, A.F.; Morley, C.T. Three-dimensional nonlinear finite element modelling of reinforced concrete structures. Finite Elem. Anal. Des. 1993, 15, 43–55. [Google Scholar] [CrossRef] [Scilit]
- Wriggers, P.; Moftah, S.O. Mesoscale models for concrete: Homogenisation and damage behaviour. Finite Elem. Anal. Des. 2006, 42, 623–636. [Google Scholar] [CrossRef] [Scilit]
- Roubin, E.; Vallade, A.; Benkemoun, N.; Colliat, J.-B. Multi-scale failure of heterogeneous materials: A double kinematics enhancement for Embedded Finite Element Method. Int. J. Solids Struct. 2015, 52, 180–196. [Google Scholar] [CrossRef] [Scilit]
- Buffo-Lacarrière, L.; Sellier, A.; Turatsinze, A.; Escadeillas, G. Finite element modelling of hardening concrete: Application to the prediction of early age cracking for massive reinforced structures. Mater. Struct. 2011, 44, 1821–1835. [Google Scholar] [CrossRef] [Scilit]
- Grassl, P.; Grégoire, D.; Rojas Solano, L.; Pijaudier-Cabot, G. Meso-scale modelling of the size effect on the fracture process zone of concrete. Int. J. Solids Struct. 2012, 49, 1818–1827. [Google Scholar] [CrossRef] [Scilit]
- Wang, X.; Zhang, M.; Jivkov, A. Computational technology for analysis of 3D meso-structure effects on damage and failure of concrete. Int. J. Solids Struct. 2016, 80, 310–333. [Google Scholar] [CrossRef] [Scilit]
- Zhou, R.; Song, Z.; Lu, Y. 3D mesoscale finite element modelling of concrete. Comput. Struct. 2017, 192, 96–113. [Google Scholar] [CrossRef] [Scilit]
- Zhang, Y.; Wang, Z.; Zhang, J.; Zhou, F.; Wang, Z.; Zhiqiang, L. Validation and Investigation on the Mechanical Behavior of Concrete Using a Novel 3D Mesoscale Method. Materials 2019, 12, 2647. [Google Scholar] [CrossRef] [Scilit]
- Shahbazi, S.; Rasoolan, I. Meso-scale finite element modeling of non-homogeneous three-phase concrete. Case Stud. Constr. Mater. 2017, 6, 29–42. [Google Scholar] [CrossRef] [Scilit]
- Wei, S.; Zhang, H.; Wang, D.; Wang, X.; Cao, M. Mesoscale Mechanical Analysis of Concrete Based on a 3D Random Aggregate Model. Coatings 2025, 15, 883. [Google Scholar] [CrossRef] [Scilit]
- Liu, L.; Shen, D.; Chen, H.; Xu, W. Aggregate shape effect on the diffusivity of mortar: A 3D numerical investigation by random packing models of ellipsoidal particles and of convex polyhedral particles. Comput. Struct. 2014, 144, 40–51. [Google Scholar] [CrossRef] [Scilit]
- Huang, Y.; Yang, Z.; Ren, W.; Liu, G.; Zhang, C. 3D meso-scale fracture modelling and validation of concrete based on in-situ X-ray Computed Tomography images using damage plasticity model. Int. J. Solids Struct. 2015, 67–68, 340–352. [Google Scholar] [CrossRef] [Scilit]
- Zhang, Y.; Cui, S.; Yang, B.; Wang, X.; Liu, T. Research on 3D printing concrete mechanical properties prediction model based on machine learning. Case Stud. Constr. Mater. 2025, 22, e04254. [Google Scholar] [CrossRef] [Scilit]
- Constantinides, G.; Ulm, F.-J. The effect of two types of C-S-H on the elasticity of cement-based materials: Results from nanoindentation and micromechanical modeling. Cem. Concr. Res. 2004, 34, 67–80. [Google Scholar] [CrossRef] [Scilit]
- Zhang, M.; Ye, G.; van Breugel, K. Microstructure-based modeling of water diffusivity in cement paste. Constr. Build. Mater. 2011, 25, 2046–2052. [Google Scholar] [CrossRef] [Scilit]
- Renuka, V.; Venkateswara Rao, S.; Tadepalli, T. Numerical Modelling of Nanoindentation in Cement Paste. Appl. Mech. Mater. 2025, 925, 105–112. [Google Scholar] [CrossRef] [Scilit]
- Hlobil, M.; Sotiriadis, K.; Hlobilová, A. Scaling of strength in hardened cement pastes—Unveiling the role of microstructural defects and the susceptibility of C-S-H gel to physical/chemical degradation by multiscale modeling. Cem. Concr. Res. 2022, 154, 106714. [Google Scholar] [CrossRef] [Scilit]
- Ferraris, C.F.; Wittmann, H.F. Shrinkage mechanisms of hardened cement paste. Cem. Concr. Res. 1988, 18, 162. [Google Scholar] [CrossRef] [Scilit]
- Garboczi, E.J.; Bentz, D.P.; Martys, N.S. Digital images and computer modeling. In Experimental Methods in the Physical Sciences; Academic Press: Cambridge, MA, USA, 1999; Volume 35, pp. 1–41. [Google Scholar] [CrossRef] [Scilit]
- Leite, J.P.B.; Slowik, V.; Mihashi, H. Computer simulation of fracture processes of concrete using mesolevel models of lattice structures. Cem. Concr. Res. 2004, 34, 1025–1033. [Google Scholar] [CrossRef] [Scilit]
- Man, H.-K.; van Mier, J.G.M. Damage distribution and size effect in numerical concrete from lattice analyses. Cem. Concr. Compos. 2011, 33, 867–880. [Google Scholar] [CrossRef] [Scilit]
- Liu, X.; Garboczi, E.J.; Grigoriu, M.; Lu, Y.; Erdoğan, S.T. Spherical harmonic-based random fields based on real particle 3D data: Improved numerical algorithm and quantitative comparison to real particles. Powder Technol. 2011, 207, 78–86. [Google Scholar] [CrossRef] [Scilit]
- Li, G.; Zhao, Y.; Pang, S.S. Four-phase sphere modeling of effective bulk modulus of concrete. Cem. Concr. Res. 1999, 29, 839–845. [Google Scholar] [CrossRef] [Scilit]
- Zhu, X.; Gao, Y.; Dai, Z.; Corr, D.J.; Shah, S.P. Effect of interfacial transition zone on the Young’s modulus of carbon nanofiber reinforced cement concrete. Cem. Concr. Res. 2018, 107, 49–63. [Google Scholar] [CrossRef] [Scilit]
- Grondin, F.; Matallah, M. How to consider the Interfacial Transition Zones in the finite element modelling of concrete? Cem. Concr. Res. 2014, 58, 67–75. [Google Scholar] [CrossRef] [Scilit]
- Korolev, A.; Vatin, N. Elasticity modulus of cement composites predicting using layer structure model. Mag. Civ. Eng. 2021, 104, 10413. [Google Scholar] [CrossRef] [Scilit]
- GOST 24452-80; Concretes. Methods for Determining Prismatic Strength, Compressive Strength, Modulus of Elasticity and Poisson’s Ratio. Gosstandart: Moscow, Russia, 1980.
- Korolev, A.S.; Kopp, A.; Odnoburtsev, D. Compressive and Tensile Elastic Properties of Concrete: Empirical Factors in Span Reinforced Structures Design. Materials 2021, 14, 7578. [Google Scholar] [CrossRef] [Scilit]
- Yamaguchi, E.; Chen, W.F. Microcrack propagation study of concrete under compression. J. Eng. Mech. 1991, 117, 653–673. [Google Scholar] [CrossRef] [Scilit]

Disclaimer/Publisher’s Note: The statements, opinions and data contained in all publications are solely those of the individual author(s) and contributor(s) and not of MDPI and/or the editor(s). MDPI and/or the editor(s) disclaim responsibility for any injury to people or property resulting from any ideas, methods, instructions or products referred to in the content. |
© 2026 by the authors. Licensee MDPI, Basel, Switzerland. This article is an open access article distributed under the terms and conditions of the Creative Commons Attribution (CC BY) license.