


Abstract
Concrete is the most used construction material, but its long-term performance depends on durability. Although fly ash has been used as a supplementary cementitious material, the effects of its mechanical activation on the concrete durability require further investigation. This study evaluated the influence of replacing 30% of cement with natural Class F fly ash (NFA) and ground fly ash (GFA) in concrete with a water-to-binder ratio (w/b) of 0.62, using a mixture without fly ash (WFA) as reference. Mechanical activation was performed by milling the fly ash, followed by characterization through particle size analysis and X-ray diffraction. Concrete durability was assessed using electrical resistivity, ultrasonic pulse velocity (UPV), water absorption, porosity, rapid chloride permeability (RCPT), carbonation resistance, and compressive strength tests. Mechanical milling reduced and transformed the ash morphology from spherical to amorphous, while quartz and mullite remained the main crystalline phases. Compared with CNFA, CGFA exhibited up to 101% higher electrical resistivity, 39.6% greater resistance to chloride penetration, 10.8% improved carbonation resistance, 0.4% lower water absorption, and a 5.38% reduction in porosity, although compressive strength decreased by more than 20%. These results demonstrate that mechanically activated fly ash is a viable alternative for enhancing the concrete durability performance exposed to aggressive environments.
1. Introduction
Concrete is a fundamental construction material used in many elements of civil infrastructure. It is a porous ceramic material that presents chemical stability, high mechanical strength, a wide variety of applications, is relatively inexpensive, and offers a long service life for infrastructure, as long as the concrete is manufactured with durability criteria [1]. Concrete is usually composed of cement, coarse aggregate, fine aggregate, and water [2]. These components are incorporated in different proportions, since the mechanical characteristics of concrete are directly related to its composition [3]. The durability of concrete is a very important aspect, and it is recommended that it be designed with specific durability criteria for each structure and environment to which it will be exposed, since a large part of the infrastructure service life directly depends on concrete degradation. The concrete durability can be defined as the resistance that the material offers to wear, abrasion, chemical attacks, loading cycles, biological attacks, and other processes that could damage the infrastructure integrity [4,5]. This depends on the kind of exposure, type of concrete, cement content, alkalinity, density, etc. [6].
The causes of concrete deterioration can be classified into three categories: mechanical problems, physical phenomena (cracking, wear, and temperature changes), and chemical phenomena (permeation of ions, gases, or aggressive fluids). As a result of these processes of deterioration, problems such as corrosion of reinforcing steel may occur [7,8]. Improving concrete durability is a topic of constant technological development due to the importance of this material for the development and the economic cost of infrastructure maintenance. In order to improve concrete durability, the use of reinforcing materials has been reported [9,10,11], as well as the modification of the concrete composition, adding nanoparticles to the mixture [12]. Some smaller particles, such as carbon nanotubes [13], nano alumina [14], titanium dioxide [15], fly ash [16], nano silica and metakaolin [17], have been studied. The addition of recycled and ground fly ash (GFA) to concrete mixes represents a significant step forward for the construction industry in its transition to a circular economy, transforming industrial waste into a valuable cementitious material. Its use not only mitigates environmental impact by reducing the need for landfills or outdoor storage and carbon dioxide (CO2) emissions associated with Portland cement production, but GFA also improves concrete properties such as workability [18,19,20], durability [21,22,23], and long-term strength [24,25]. Economically, it drives a circular business model by creating a new market for waste, generating savings in material costs for builders and waste management for coal plants. This approach not only optimizes concrete performance, but also closes the material cycle, turning an environmental liability into an economic asset and building in a more sustainable and efficient way. The primary application of ash in concrete mixtures is for federal infrastructure exposed to marine environments, where concrete with very low chloride ion permeability is required. Diverse studies on fly ash are available in the literature [26,27]; these report the fly ash characterization and focus on one or two aspects (primarily mechanical strength and water absorption). However, this study presents the characterization and a set of tests that allow the correlation of microstructure, the transport of aggressive agents, and the mechanical performance, thereby providing a comprehensive approach to the durability of concrete mixtures containing ground fly ash. These results, obtained from concrete mixtures with a high water-to-binder ratio (w/b), provide solid evidence of the material’s potential to improve the performance and durability of cementitious composites, reinforcing its applicability in infrastructure exposed to aggressive environmental conditions.
2. Materials and Methods
The natural fly ash (NFA) comes from the José López Portillo Thermal Power Plant located in the municipality of Nava, in the State of Coahuila, Mexico; this ash was collected from storage silos by taking samples at various depths, followed by quartering to obtain a representative sample. The particle size of this ash was reduced via mechanical milling, using a ball mill (250 W WEG motor; 3 kg of stainless-steel balls, each approximately 3.15 cm in diameter, and 1 kg of fly ash were used; speed of 80 rpm). The ball mill’s energy consumption was very low, as the process utilized equipment with a 250 W motor running for 14 h, resulting in an approximate electrical energy consumption of 3.5 kWh. Considering the average energy cost of 2.5 MXN/kWh for an institutional user with a medium-voltage supply, the operating cost was approximately 8.8 MXN per milling cycle. Consequently, even including these costs, the process remains environmentally friendly and offers economic benefits.
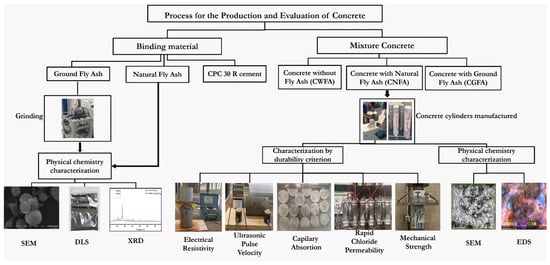
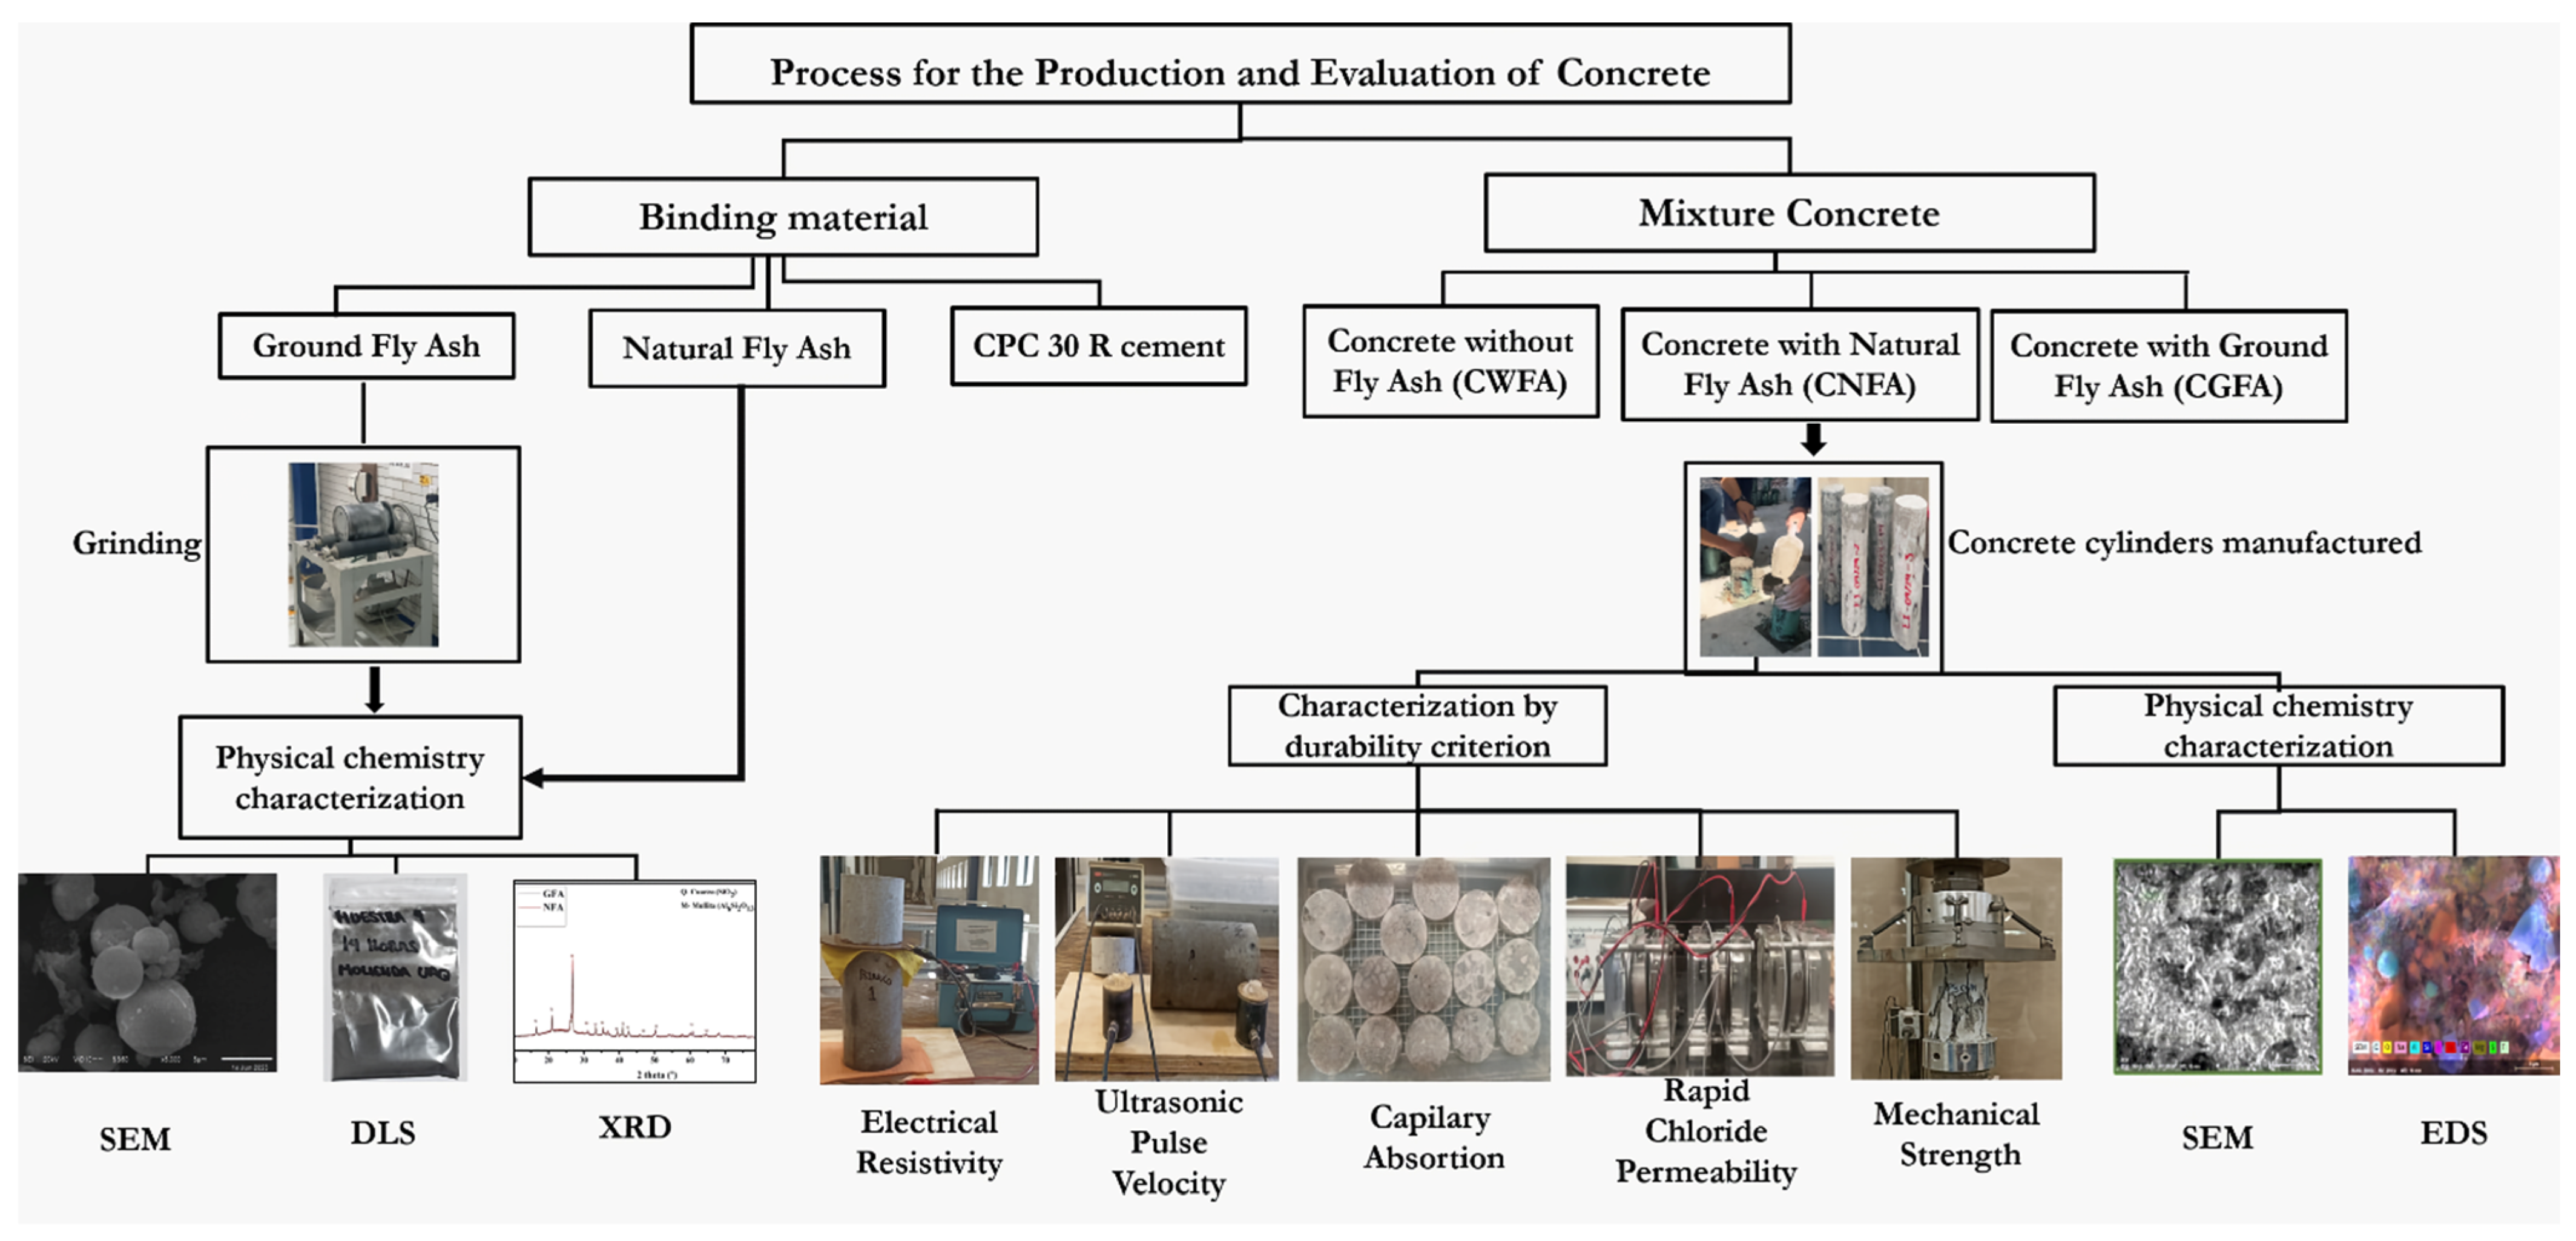
The experimental procedure consisted of two phases. The first phase consisted of mechanical grinding for 14 h in a ball mill, followed by the characterization of Type fly ash (Class F, in accordance with ASTM C618). The chemical composition of the cement and fly ash is shown in Table 1. In the second phase, the concrete mixtures were prepared, and their physical and chemical properties were characterized. The experimental process is illustrated in Figure 1.
Table 1.
Chemical compositions of cement and fly ash.
Figure 1.
Process of concrete specimen preparation using ground and natural fly ash.
2.1. Experimental Design of Concrete Cylinders
Three concrete mixes were prepared: the first mixture of concrete did not contain fly ash (CWFA), the second mixture of concrete was made with 30% cement replacement by natural fly ash (CNFA), and the last mixture of concrete was made with 30% cement substitution by ground fly ash (CGFA). From each mixture, cylinders of 10 cm in diameter and 20 cm in height were produced. Twenty cylindrical test specimens were manufactured with dimensions of 10 cm in diameter and 20 cm in height: CWFA (#1 through #7), CNFA (#8 through #13), and CGFA (#14 through #20). All tests were performed in triplicate, with the exception of the carbonation tests, which were conducted in duplicate. For the capillary absorption, total water absorption (%), and PRC tests, the cylinders were cut at 5 cm intervals to obtain samples of 10 cm in diameter and 5 cm in height, using CPC 30 R cement equivalent to ASTM Type I, 3/4” coarse aggregate, fine aggregate, and GFA. These concrete cylinders were evaluated through hardened state tests, with special emphasis on durability.
The composition of each concrete mixture is presented in Table 2. The concrete cylinders were cured by immersion in calcium hydroxide for 30 days, as ASTM C31/C31M [28], ASTM C192/C192M [29], and NMX-C-159-ONNCCE-2016 [30] indicate.
Table 2.
Concrete mix design.
2.2. Physical and Chemical Characterization
Microstructural characterization was performed using a scanning electron microscope (SEM) (Hitachi model S-3700N, Bruker Xflash 6, Bremen, Germany) with an energy-dispersive spectroscopy (EDS) detector, used to evaluate the chemical composition. Analysis of the crystalline phases present was performed by X-ray powder diffraction (XRD) (Bruker model D8 advance, with Cu Kα radiation with 2.5° sollers in primary and secondary beam, radius of 280 mm, from 10° to 80° in 2θ, with a step size of 0.045° and time per step 1.2 s, a divergence slit of 0.6 mm was used and Ni-Filter LynxEye Detector). The quantitative phase analysis was performed with Diffrac.Topas suite software ver 6.0).
To examine the surface of the mixtures, a Keyence VHX-5000 series digital optical microscope was used, equipped with a VH-Z500R/Z500T optical objective and a numerical aperture (NA = N sen θ) of 0.82 (refractive index N around the objective / N ~ 1 for air). The images were acquired using the VHX software ver 1.6.1.0.
For microscopic characterization tests, the surface is prepared by polishing with #1000, #2000, and #5000 sandpaper, subsequently polished with alumina 1.0, 0.3, and 0.05 µm, followed by drying at 105 °C for 24 h, to obtain a flat surface with a roughness level suitable for observation.
Electrical resistivity tests were performed on a saturated mixture of concrete using a Nilsson Model 400 Soil Resistance Meter, according to the methodology described in ASTM G57-20 [31]. Electrical resistivity (ρ) was calculated using Equation (1) [31,32], where ρ is the electrical resistivity in Ohm*cm, R is the electrical resistance in Ohm, A is the cross-sectional area of the item in cm2, and L is the length of the concrete item in cm.
The test of ultrasonic pulse velocity (V) was carried out on a mixture of concrete according to ASTM-C-597 [33], with Controls brand equipment, model 58-E0048, and this was determined by dividing the distance between the transducers (L) in meters and the transit time of the wave through the material (t) in seconds; the corresponding equation is shown in Equation (2). Table 3 presents the classification of concrete quality according to the ultrasonic pulse velocity (UPV) [32,34].
Table 3.
UPV values and concrete quality.
The total porosity test was performed on a mixture of concrete of 100 mm in diameter and 50 mm in height. The items were heated to 105 °C until reaching constant weight (W105˚C), then they were saturated by immersion in water until reaching constant weight (Wsat), and finally weighed on a hydrostatic balance to obtain their submerged weight (Wsub). The porosity percentage was calculated using Equation (3) [35,36]. The criteria for evaluating the concrete durability based on the porosity percentage are presented in Table 4 [37,38].
Table 4.
Porosity criteria.
The capillary absorption test was performed on a mixture of concrete measuring 10 cm in diameter by 5 cm in height. The experimental development was carried out in accordance with ASTM C1585-20 [39]. The mixture of concrete was brought to constant weight in a drying oven, wax was placed on the circumferential face of the items, and the weight of the item with paraffin was recorded. After this, the items were placed in a container with 3–5 mm of water level from the base of the mixture of concrete. The mass gain was recorded at time intervals of 1/12, 1/6, 1/4, 1/2, 1, 2, 3, 4, 5, 6, 24, and 48 h until reaching constant weight. Capillary absorption (I) is defined as the change in mass (mt) divided by the product of the cross-sectional area of the item exposed to water (A) and the water density (d), as presented in Equation (4) [39]. For this test, the water density is considered to be 0.001 g/mm3.
Compressive strength tests were performed on three 10 × 20 cm mixtures of concrete headed with sulfur mortar, and the average value is reported. The test was performed according to ASTM C39/39M-21 [40] in an Instron 8503 universal testing machine applying a load at a speed of 200 kg/s (0.25 MPa/s). The compressive strength is determined by the following equation:
where
fcm = compressive strength in MPa.
Pmax = maximum load in kN.
D = diameter in mm
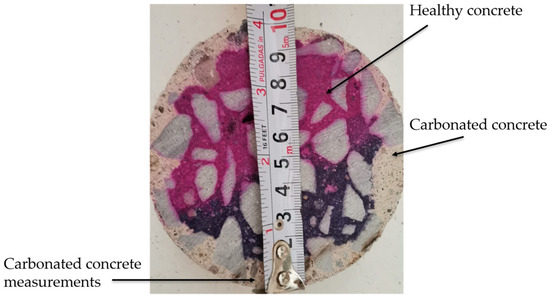
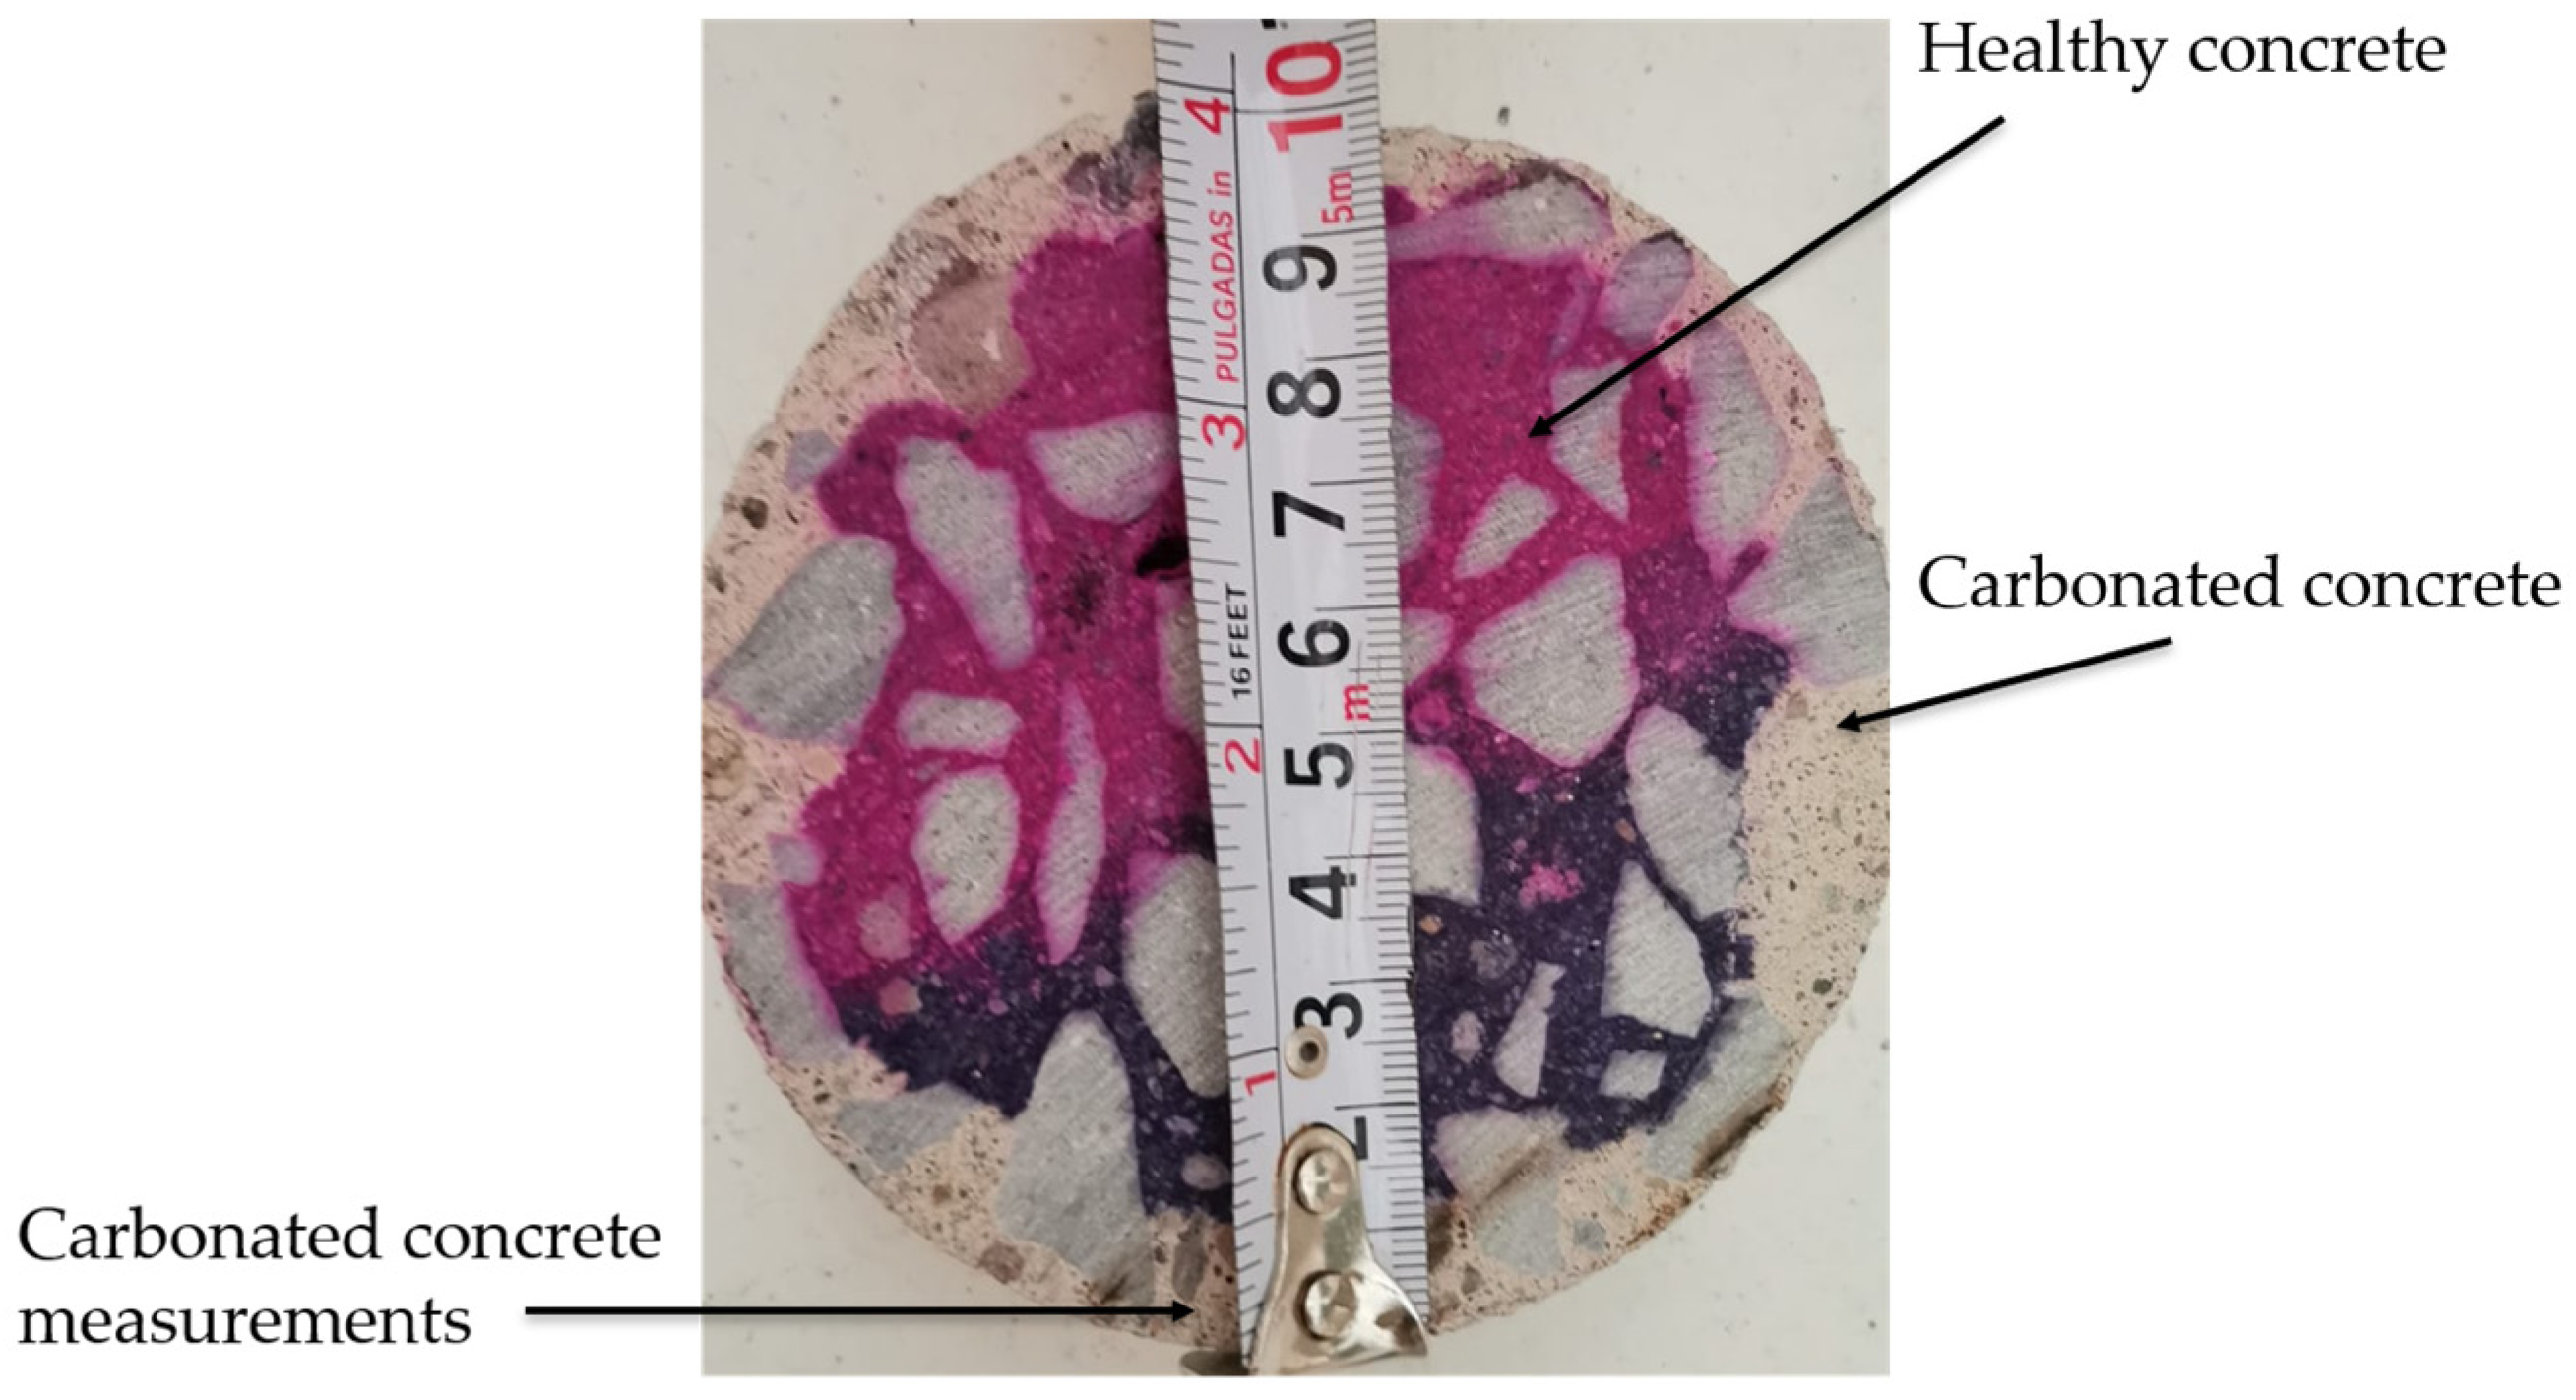
The carbonation depth assay was performed in an accelerated carbonation chamber; the concrete items were subjected to an environment with a carbon dioxide (CO2) concentration of 3.5 ± 2% and a relative humidity of 65 ± 5% at 25 °C, for a period of 15 days of exposure (0.041 year). This is because it has been reported that exposing concrete items for one week to carbon dioxide (CO2) concentrations of 4% reaches the same carbonation depth as exposing them for one year to normal conditions (0.03% of carbon dioxide (CO2) [41]). After the exposure period, the cylinders were cut transversely and sprayed with a 1% phenolphthalein indicator solution. They were allowed to react for a period of 3 min, and then the depth of the colorless section was measured. pH less than 8.2 is indicative of carbonated concrete (colorless part), and a pH greater than 10 indicates that the concrete is healthy (colored part) [32,42]. Four measurements of carbonated concrete were made on the cylinder circumference (Figure 2), and the result presented is an average.
Figure 2.
Carbonation test of concrete, 4-point measurement.
The carbonation constant of concrete (mm/(year)1/2) relates the carbonation depth to the square root of the exposure time; therefore, the progression of the specimen can be predicted from the measured carbonation values. The carbonation constant was calculated using Equation (6) [43].
where:
XCO2 = carbonation depth, mm
kCO2 = carbonation constant, mm/(year)1/2
t = time in years
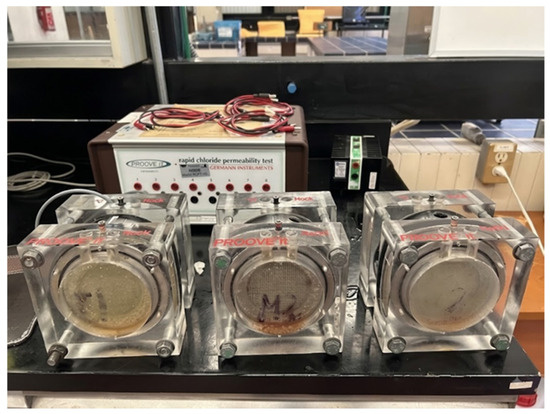
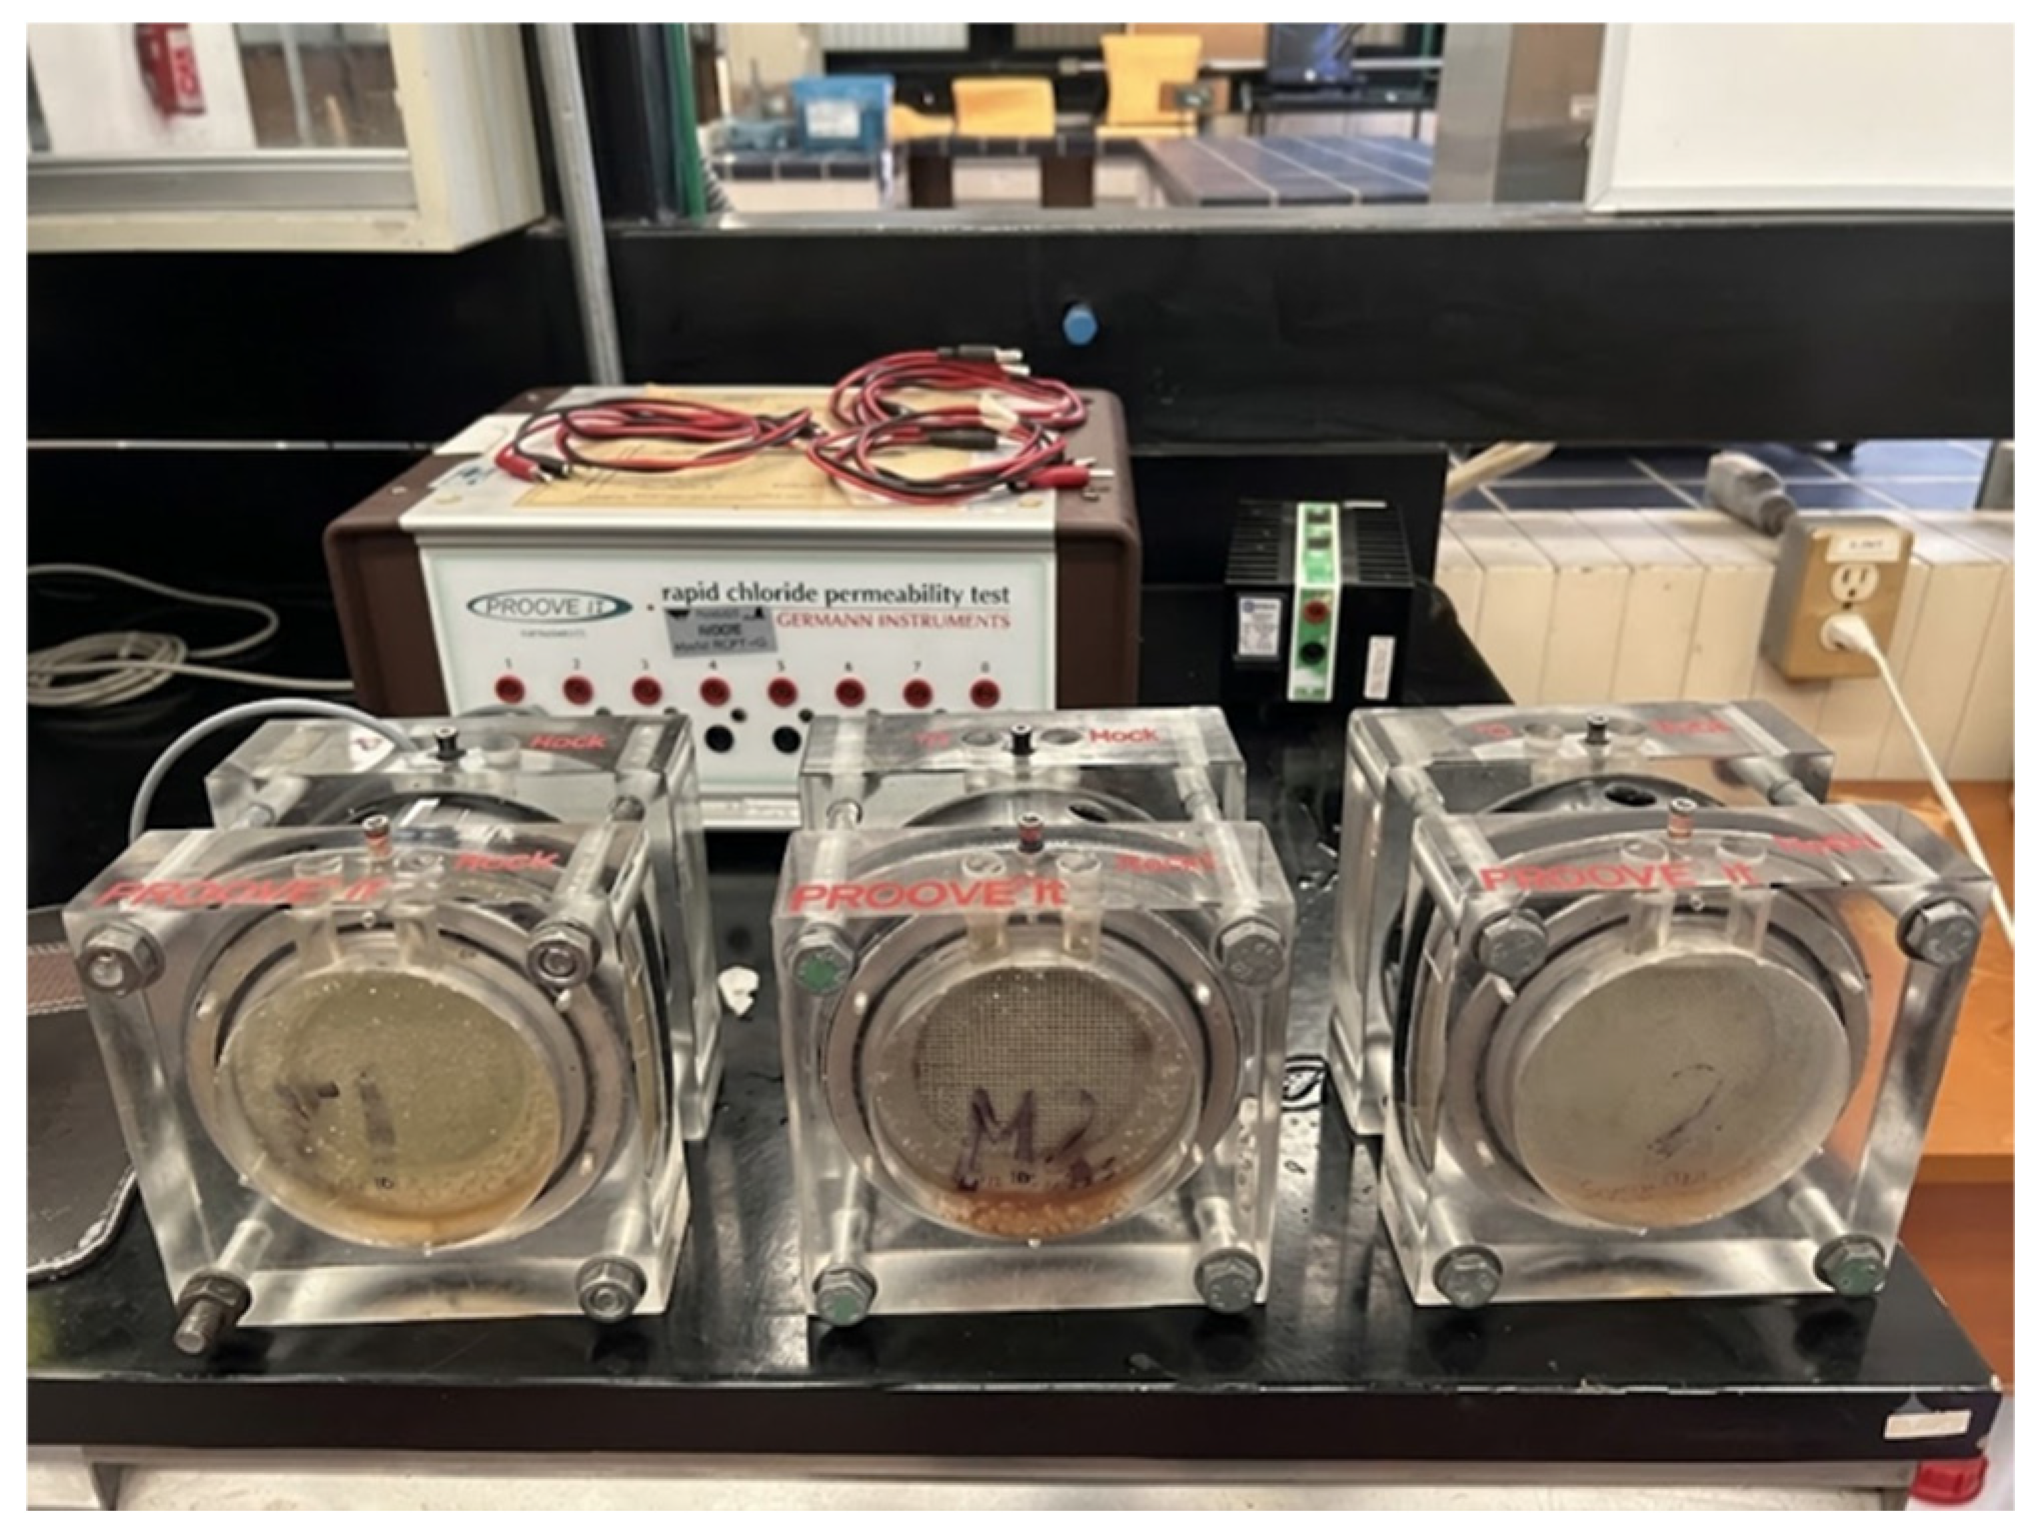
The Test Method for Electrical Indication of Concrete’s Ability to Resist Chloride Ion Penetration test (RCPT) was performed on a rapid chloride ion permeability measuring device, PROOVE’it model, from Germann Instruments. A potential of 60 V was applied as indicated in ASTM C-1202-22 [44], and the device also records the current and temperature. Concrete items measuring 100 mm in diameter by 50 mm in height were used for this test. The concrete items were subjected to a vacuum for a period of 3 h, then immersed in previously boiled water and vacuumed for another hour. Once the vacuum period was over, the concrete items remained immersed in water for a period of 18 h. After 18 ± 2 h, an impermeable film was placed on the circumferential face of the items, and they were mounted in the equipment cells. A 3% wt% NaCl solution (30 g/l) was placed on the cathodic part of the cell, and a 0.3 N NaOH solution (12 g/l) was placed on the anodic part. The cell assembly is shown in Figure 3.
Figure 3.
Rapid chloride ion permeability test on concrete mixes.
From the charge that passes through the concrete, the penetrability of chloride ions is known, classifying it as high permeability when the load is greater than 4000 C, moderate when it is between 2000 C and 4000 C, low permeability of 1000 C–2000 C, very low between 1000 C and 100 C, and negligible when it is less than 100 C [44].
3. Results
The results obtained in the characterization of the material and in the evaluation of concrete mixtures using durability criteria are presented below.
3.1. Physical Chemistry Characterization
3.1.1. Natural Fly Ash (NFA) and Ground Fly Ash (GFA)
Prior to its incorporation into the concrete, the fly ash was analyzed using a scanning electron microscope to observe changes in the particles due to grinding. As an indicator of the reduction in size, particle size analysis via Dynamic Light Scattering (DLS) suggests a decrease in particle size, as the average hydrodynamic diameter (Z-average) dropped from 1247 nm for NFA to 696.6 nm for GFA, which represents a reduction of approximately 44%. This confirms the effectiveness of the milling process; however, the polydispersity index remained almost constant (0.70 and 0.71, respectively), indicating that the amplitude of the size distribution was not significantly altered. Therefore, while milling reduced the mean particle size, the fly ash’s polydisperse nature was preserved.
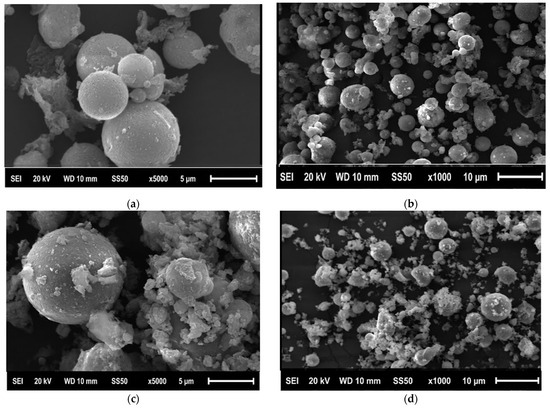
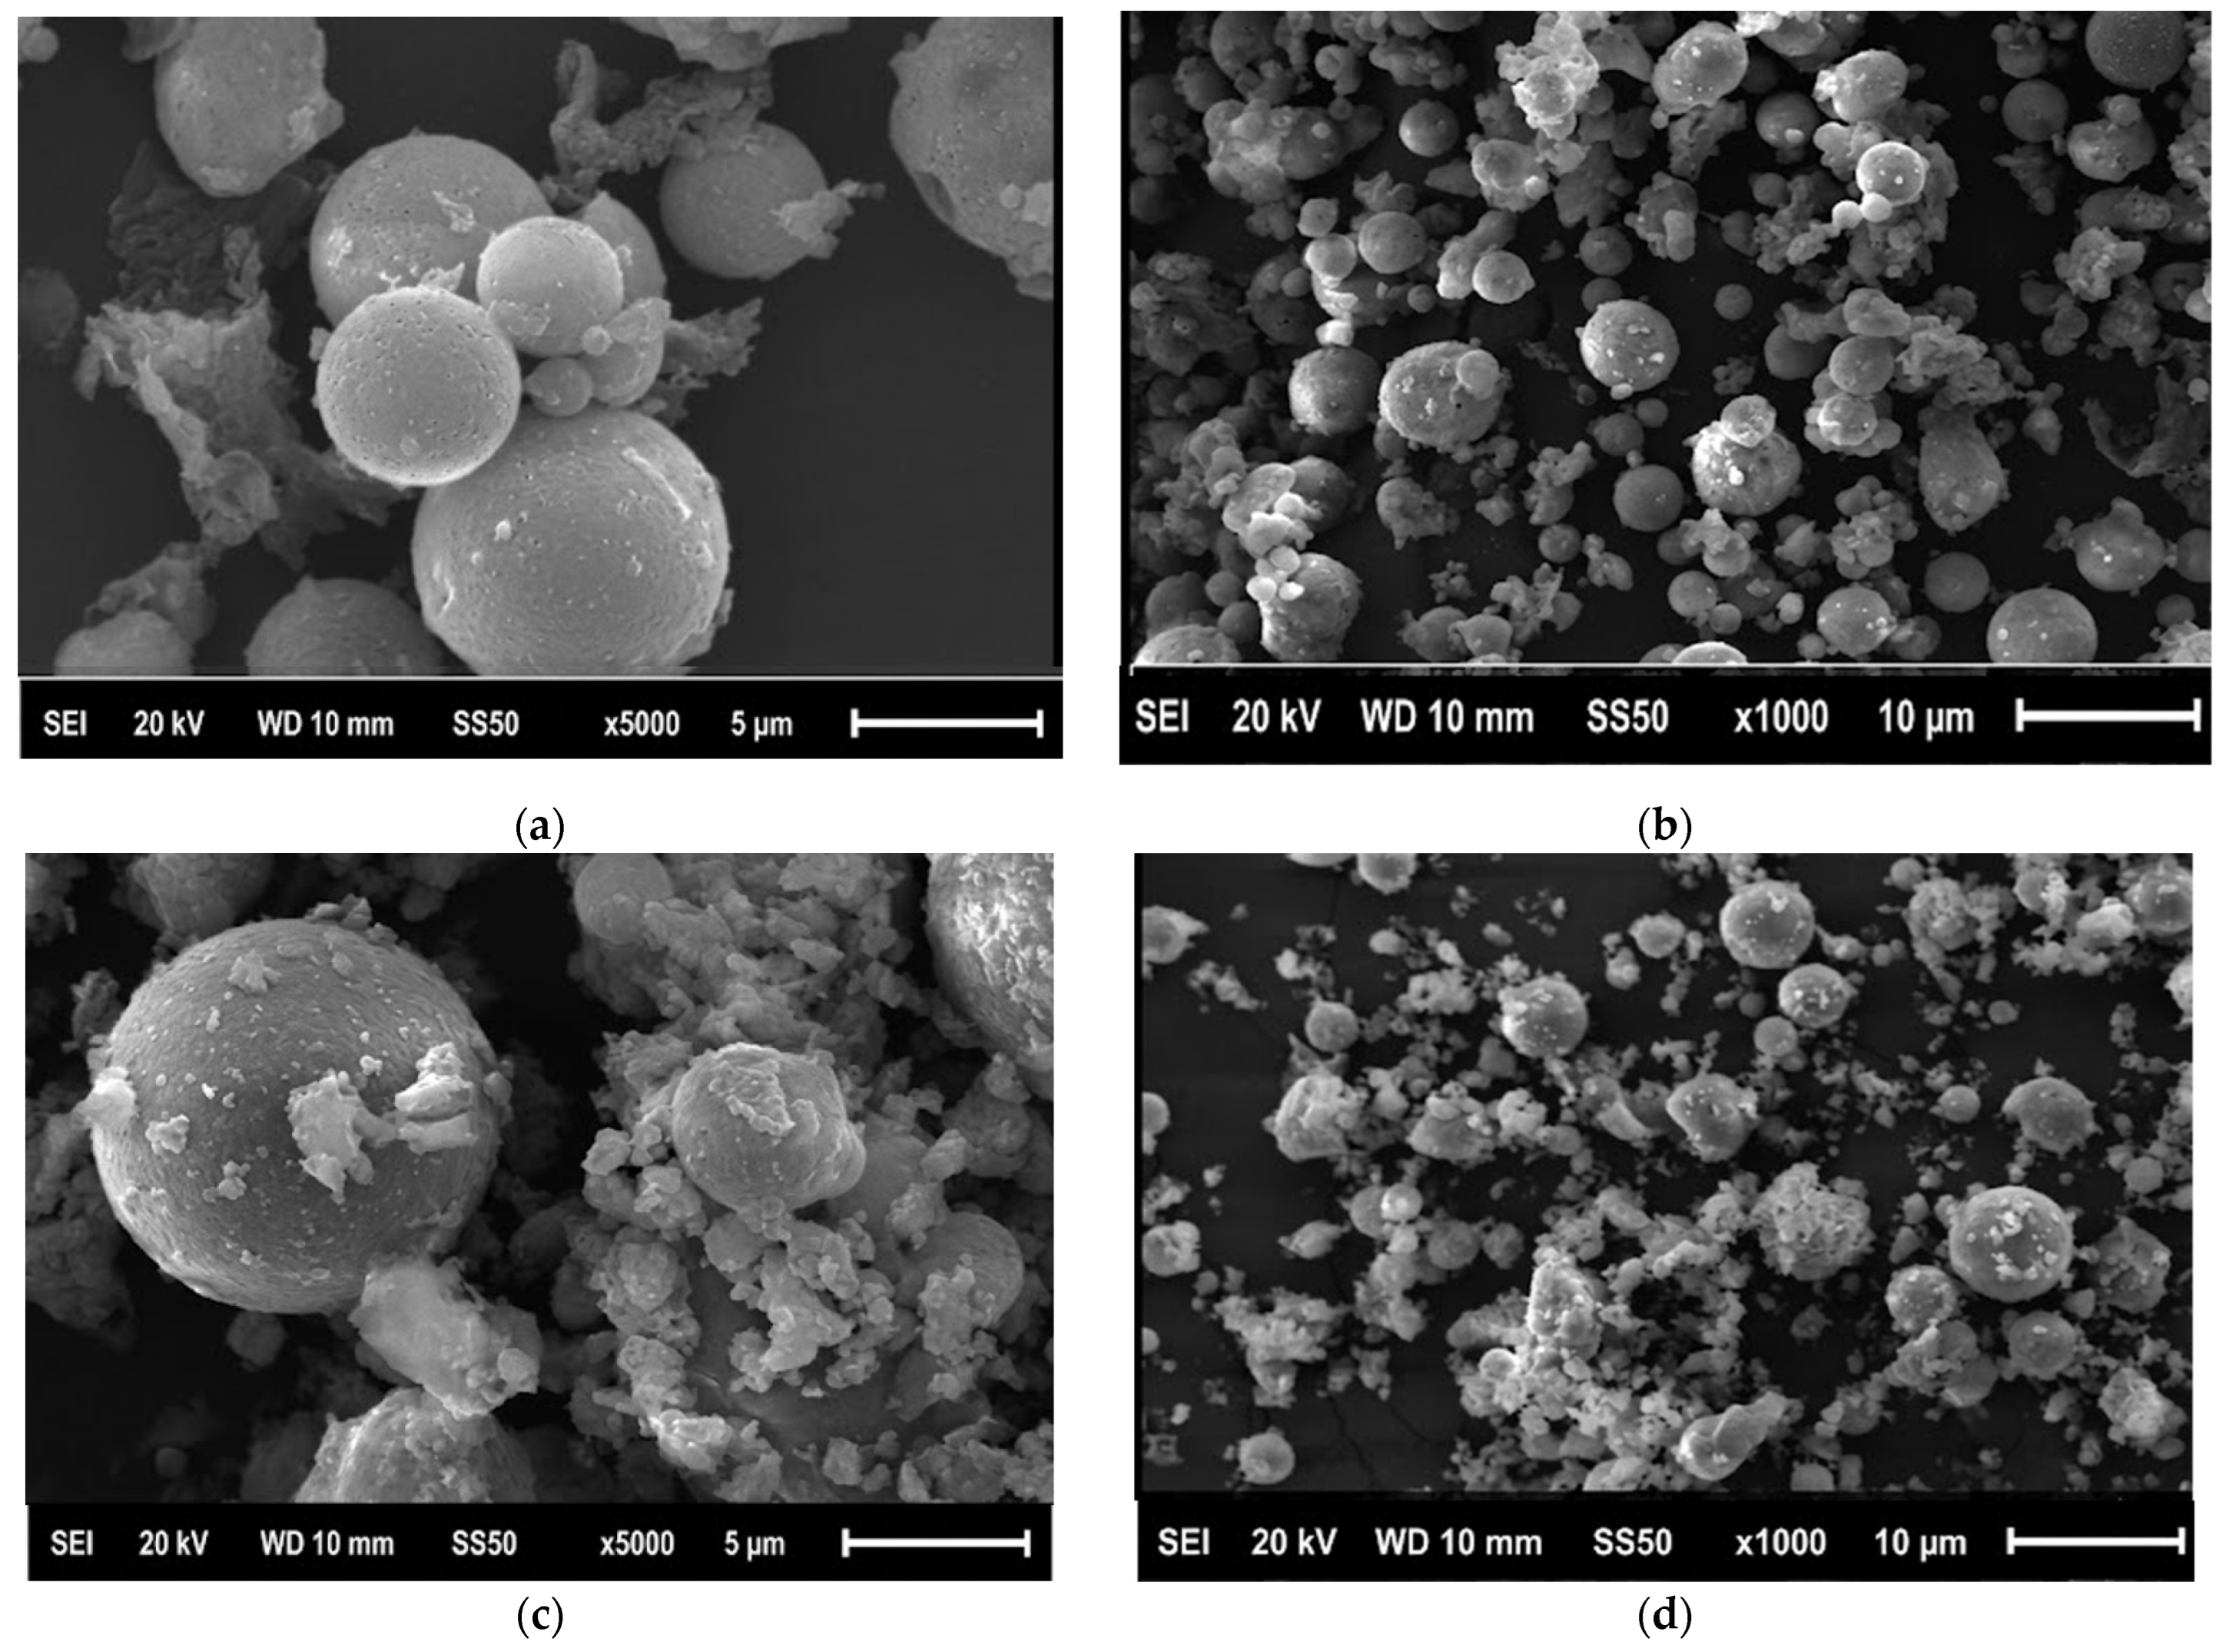
Figure 4 presents the micrographs that reveal the microstructural differences between NFA and GFA that can be observed. Figure 4a,b show that the NFA presents a spherical structure. On the other hand, Figure 4c,d show that the GFA presents a decrease in the number of spherical particles and a large number of angular elements. This implies an increase in the surface area of the fly ash due to the grinding effect, which will benefit the concrete properties. Also, Figure 4c,d show the agglomeration of fly ash particles, which is attributed to the particle size reduction during grinding and to the attractive forces between particles. The decrease in the number of spherical particles and the rupture of the fly ash microspheres causes an increase in the surface area and surface energy, which enhances the attractive forces between particles of the fly ash. This could negatively influence the properties of the hardened mixture, since, at the time of manufacturing the concrete items, these agglomerations could cause the fly ash particles not to be distributed homogeneously in the concrete mixture. To avoid this effect, the fly ash was mixed with the cement before the mixture with water, fine aggregate, and coarse aggregate during concrete preparation.
Figure 4.
Micrographs of fly ash at 1000× and 5000× magnification: (a,b) natural fly ash (c,d) ground fly ash.
3.1.2. Fly Ash Concrete
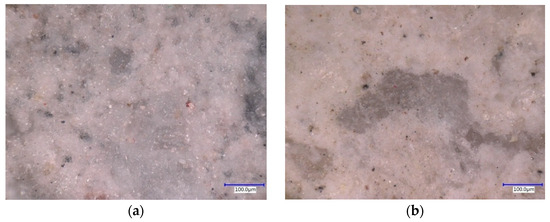
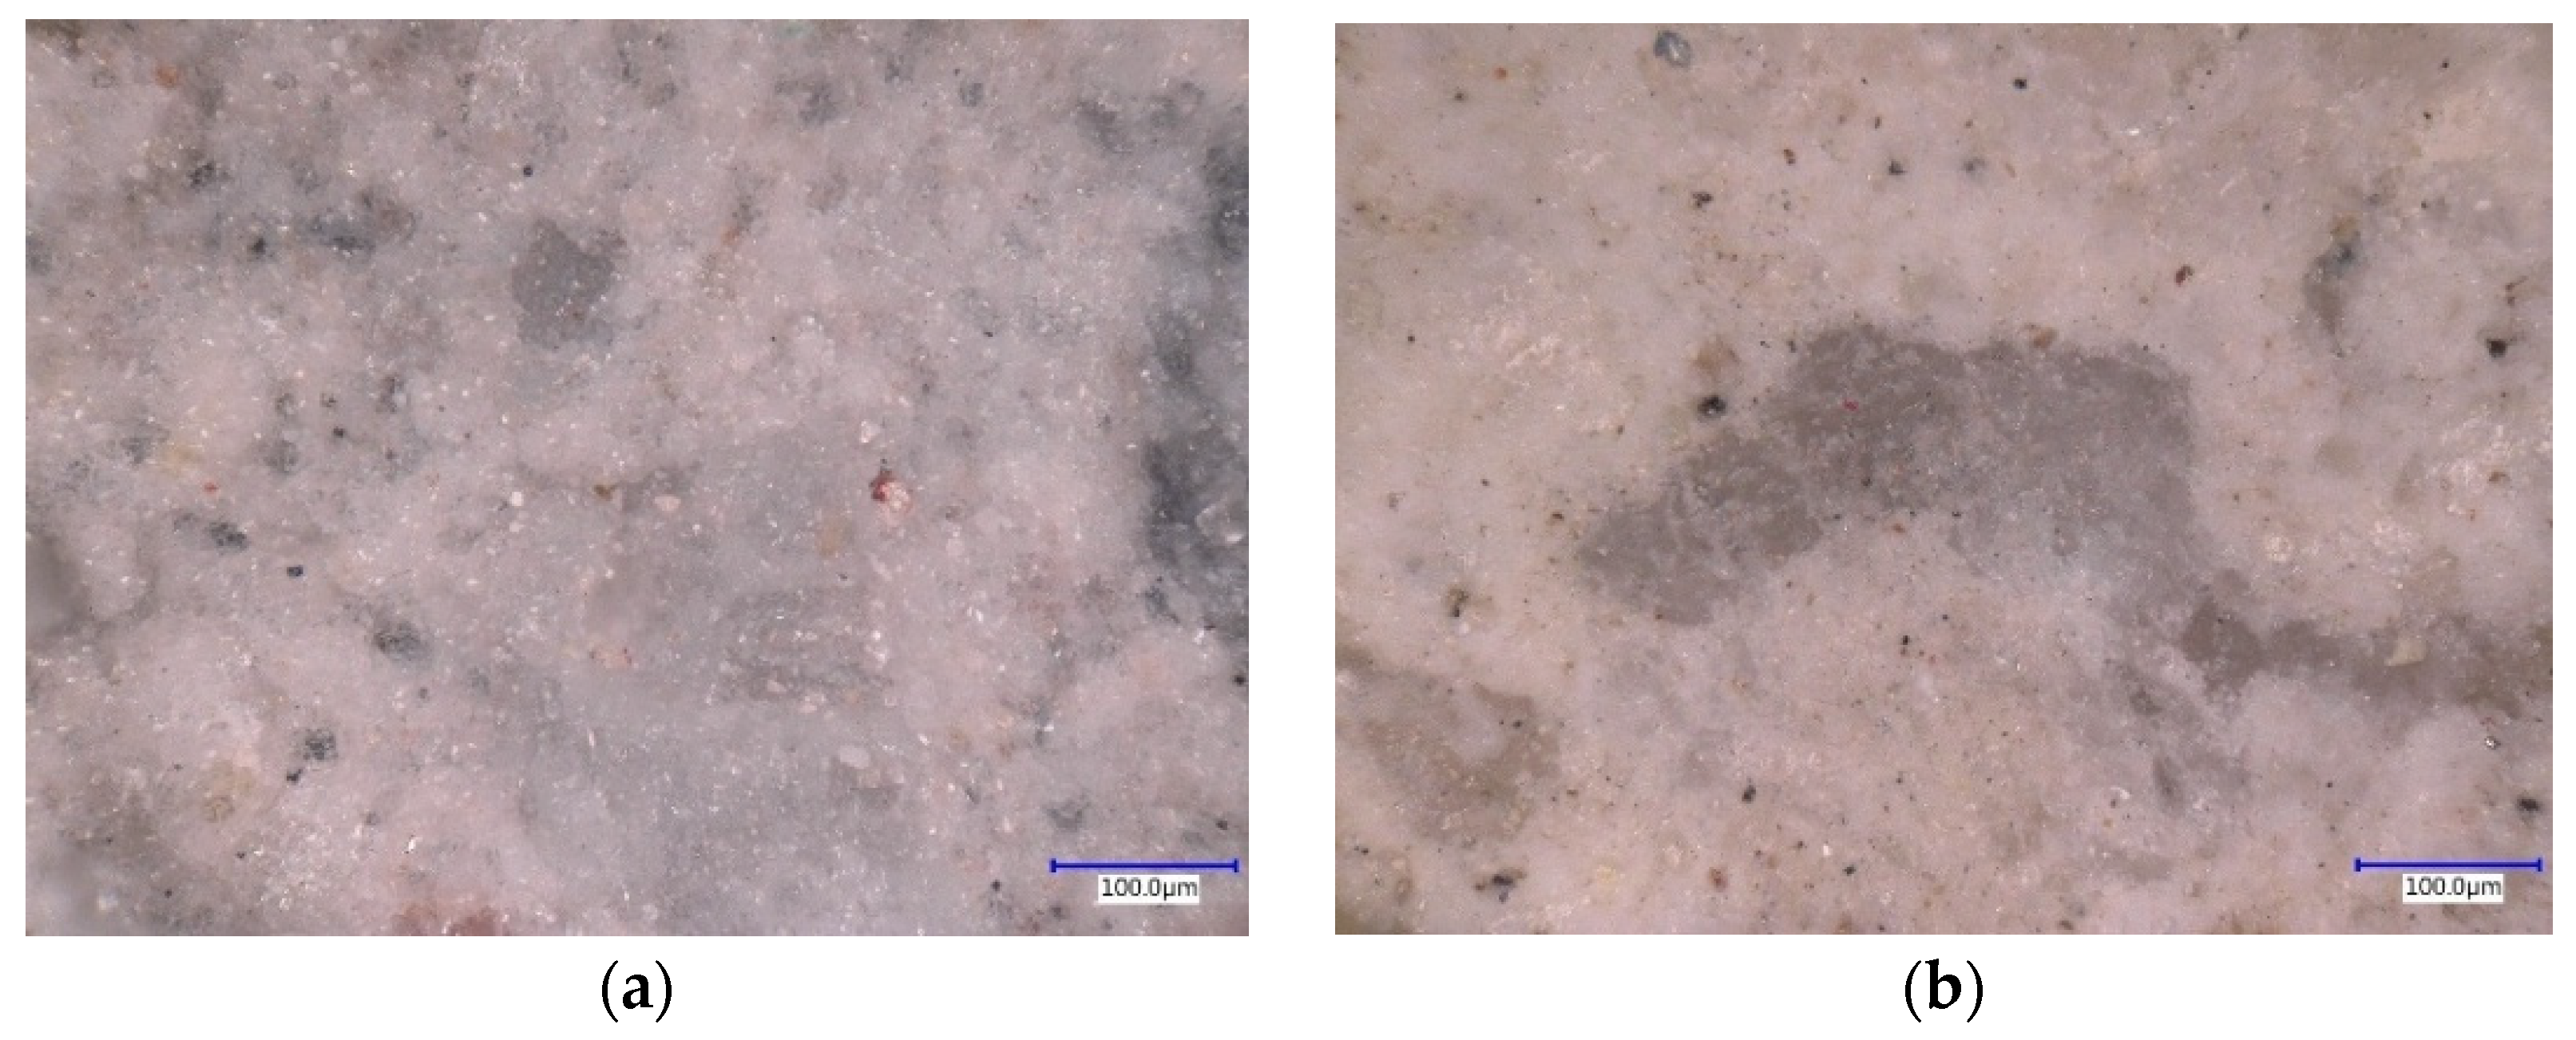
Once the concrete mixture was manufactured, the surface of the fly ash-modified concrete was analyzed. Figure 5a shows the morphology of the CWFA and CGFA in Figure 5b. In both cases, the cement paste exhibits an irregular and heterogeneous morphology, with the possible presence of tobermorite. In the case of the CGFA (Figure 5b), the fly ash particles appear uniformly distributed across the entire concrete surface. This confirms that the fly ash was evenly distributed throughout the concrete.
Figure 5.
Optical microscope micrographs at 1000× for (a) CWFA and (b) CGFA.
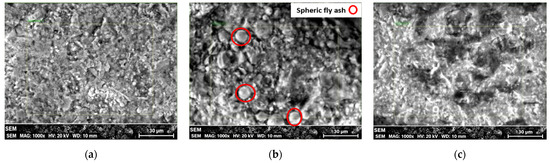
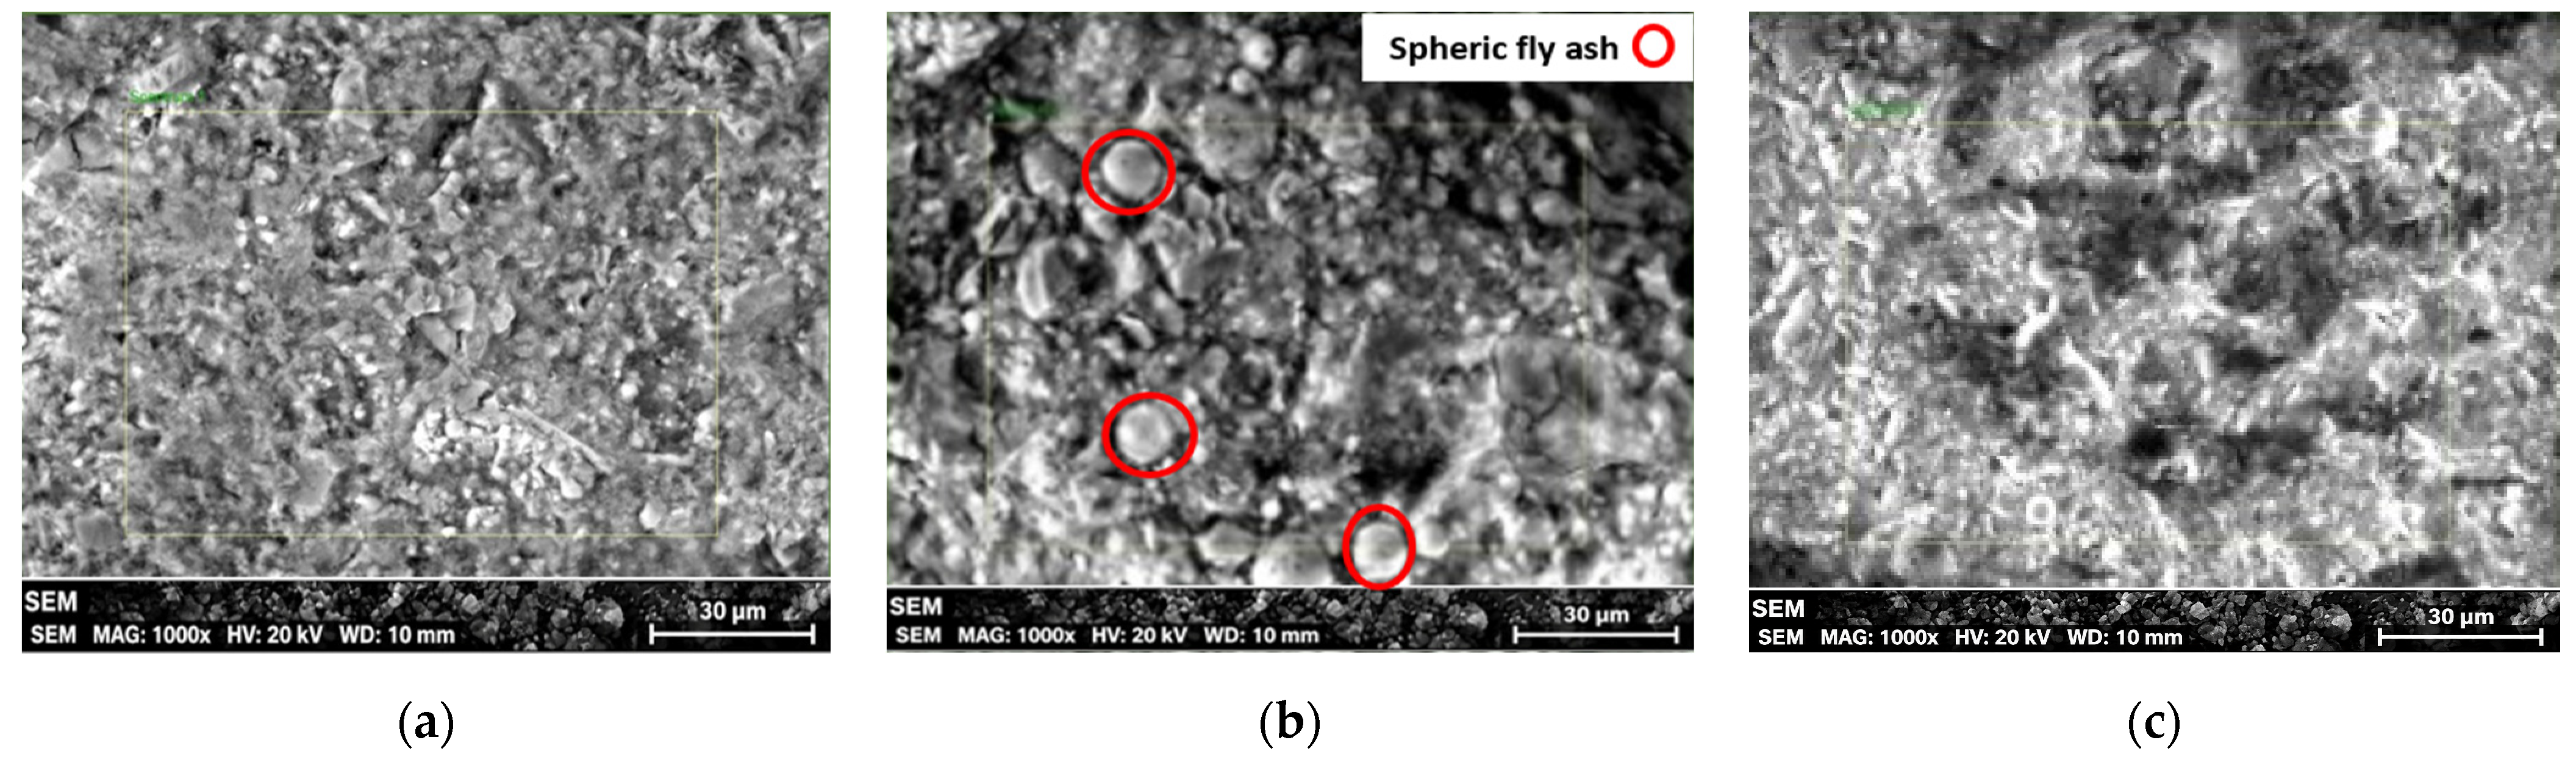
A deeper analysis of the concrete with fly ash substitute is shown in the SEM micrographs of Figure 6, which presents the microstructure change in the concrete items according to the fly ash substitute and natural fly ash, as it can be seen in Figure 6a the specimen without fly ash is less dense due to the material porosity which is associated with the nature of the rapid reaction of the cement. In Figure 6b, the microstructure change is observed with the substitution of 30% of NFA, with the appearance of large amounts of spheric fly ash on the surface (highlighted in red); finally, in Figure 6c, an evidently dense microstructure is observed, due to the filling effect caused by the GFA being smaller in size.
Figure 6.
Micrographs of hardened concrete mixtures: (a) CWFA; (b) CNFA; and (c) CGFA.
The increase in the surface area of fly ash enhances its chemical reactivity, which creates more nucleation sites in transition and pore zones. The reason why the concrete items containing CNFA (Figure 6b) and CGFA (Figure 6c) show a denser structure is attributed to the fact that fly ashes have superior pozzolanic properties [45] due to the presence of active SiO2 and Al2O3, which can react with the Ca(OH)2 produced by the hydration of cement and form calcium silicate hydrate (C–S–H) or calcium aluminate hydrate (C–Al–H) compounds that help to densify the matrix, increase strength, and improve durability.
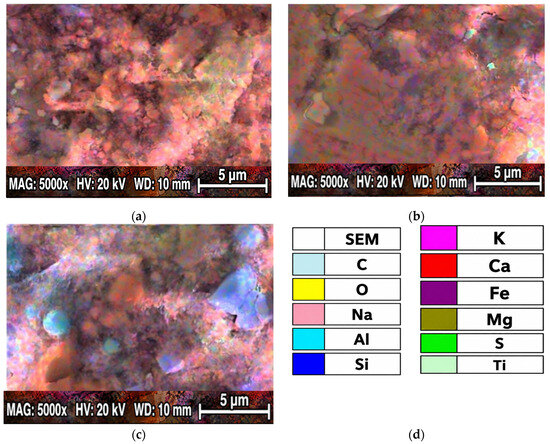
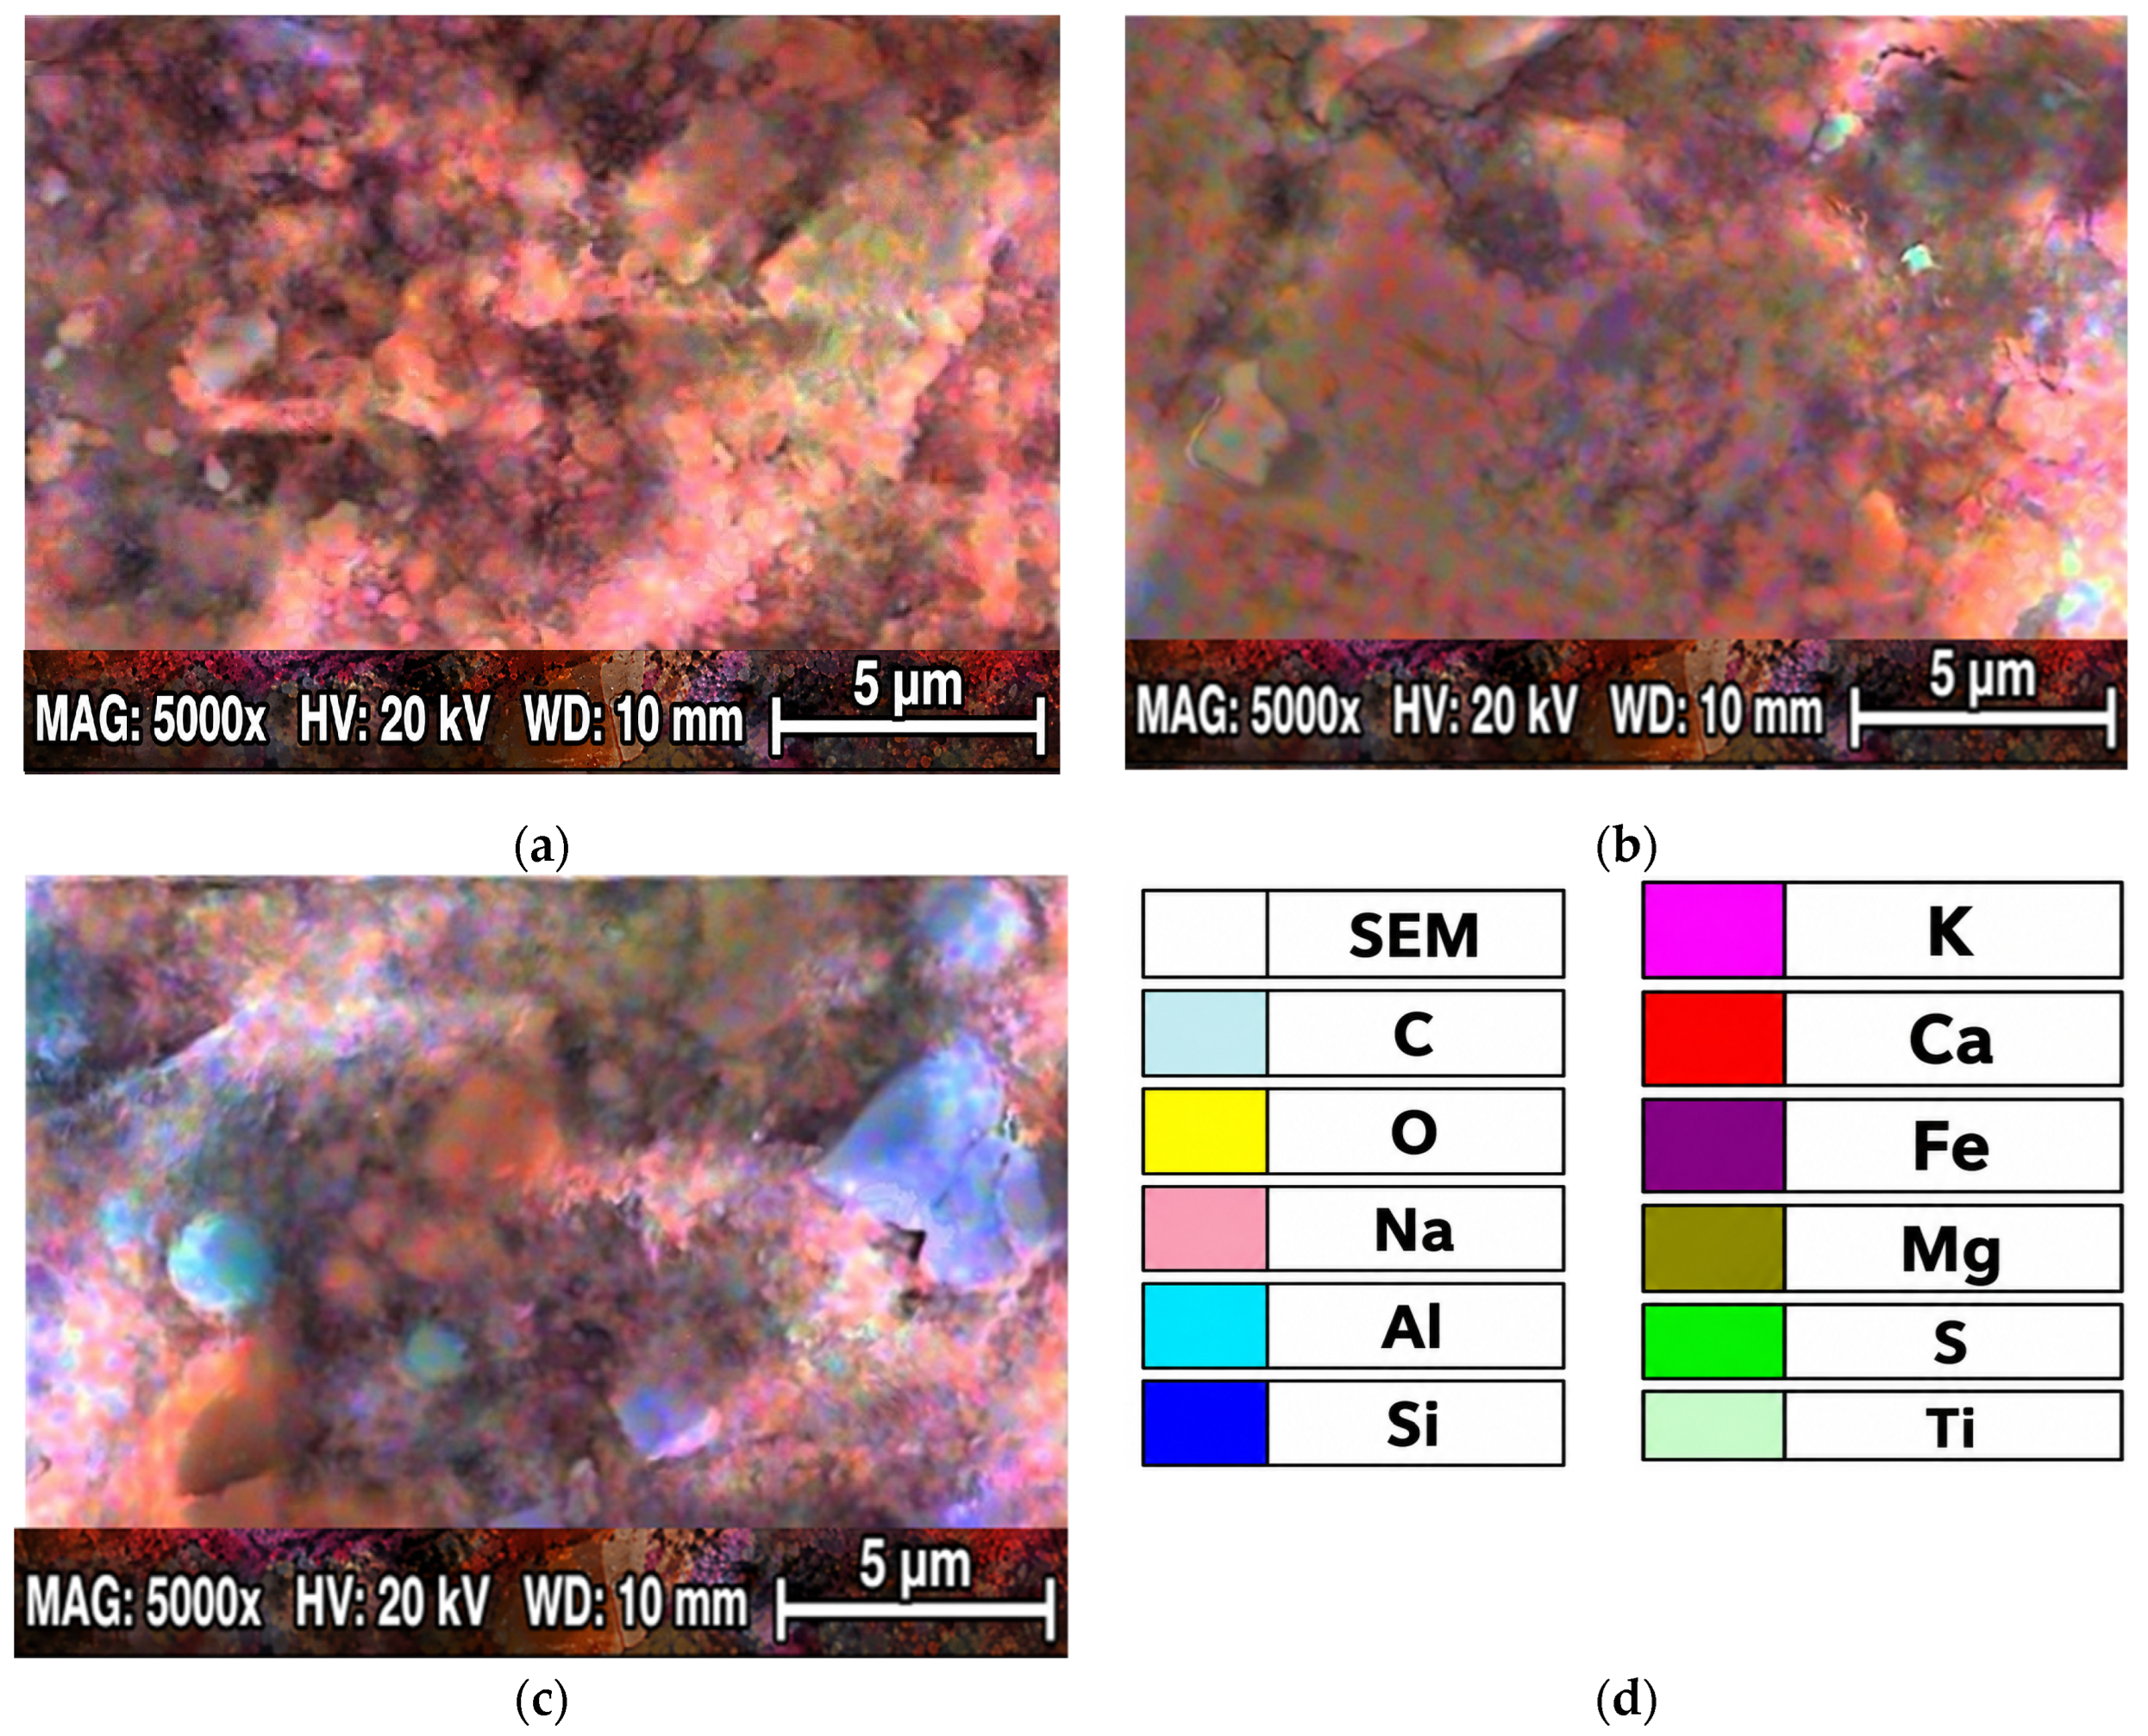
Table 5 presents the results of energy-dispersive X-ray microanalysis, whereas the elemental mapping of each specimen is shown in Figure 7d. It can be observed that oxygen is the predominant element in all three concrete mixtures, accounting for more than 50% of the composition; this is due to the presence of oxides characteristic of the hydration products of cement and supplementary cementitious materials. The significant decrease in calcium content in the mixtures containing NFA and GFA is associated with the partial replacement of cement with fly ash, a material with lower calcium content but higher silica and alumina content. The increment of Si and Al in CGFA is attributed to the fact that mechanical grinding destroys the dense vitreous layer of the particles and causes the release of these elements. These results are consistent with the aluminosilicate nature of fly ash and suggest greater availability of these elements for the development of pozzolanic reactions that promote the additional formation of C-A-S-H gel and the refinement of the microstructure. The higher carbon content in the CNFA and CGFA concrete mixtures can be attributed to the unburned carbon characteristic of some fly ashes or to the carbonate coating that formed on the surface of the sample during storage. In contrast, the sulfur content decreased in both modified mixtures, with the decrease being more pronounced in the CGFA, while the iron, magnesium, sodium, potassium, and titanium contents remained relatively stable, although there were slight increases in alkali metals in the fly ash mixtures, attributable to the material’s inherent mineralogical composition.
Table 5.
Composition analysis by EDS in wt%.
Figure 7.
Semiquantitative and representative characterization of the microzones analyzed by means of EDS analysis of (a) WFA, (b) CNFA, (c) CGFA and (d) Colors assigned to chemical elements.
The results show that the incorporation and grinding of fly ash modifies the elemental composition of the cementitious matrix, reducing the relative proportion of calcium and increasing that of silicon and aluminum. This behavior is consistent with the typical chemical composition of fly ash and supports the pozzolanic reaction mechanisms reported in the literature, which contribute to the development of a denser microstructure and a potential improvement in the durability of concrete.
Figure 7 shows micrographs of chemical composition maps; in these chemical element maps, each chemical element is identified by a specific color (d). The increase and distribution of Si shown in the elemental mapping of Figure 7 is favorable because the mass of hydrated silicate gel (S-C-H) gradually increases with the incorporation of silicon particles, allowing the optimization of the porous structure of the concrete and limiting the diffusion capacity of chloride ions [46]. It should be noted that the pozzolanic activity of fly ash benefits from an increase in the content of SiO and AlO since these cause complex chemical reactions in the cement paste, which causes the concrete structure to be saturated with additional products capable of sealing and strengthening it [47].
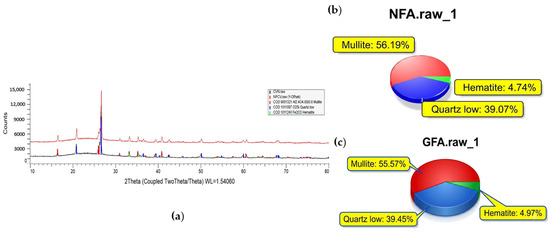
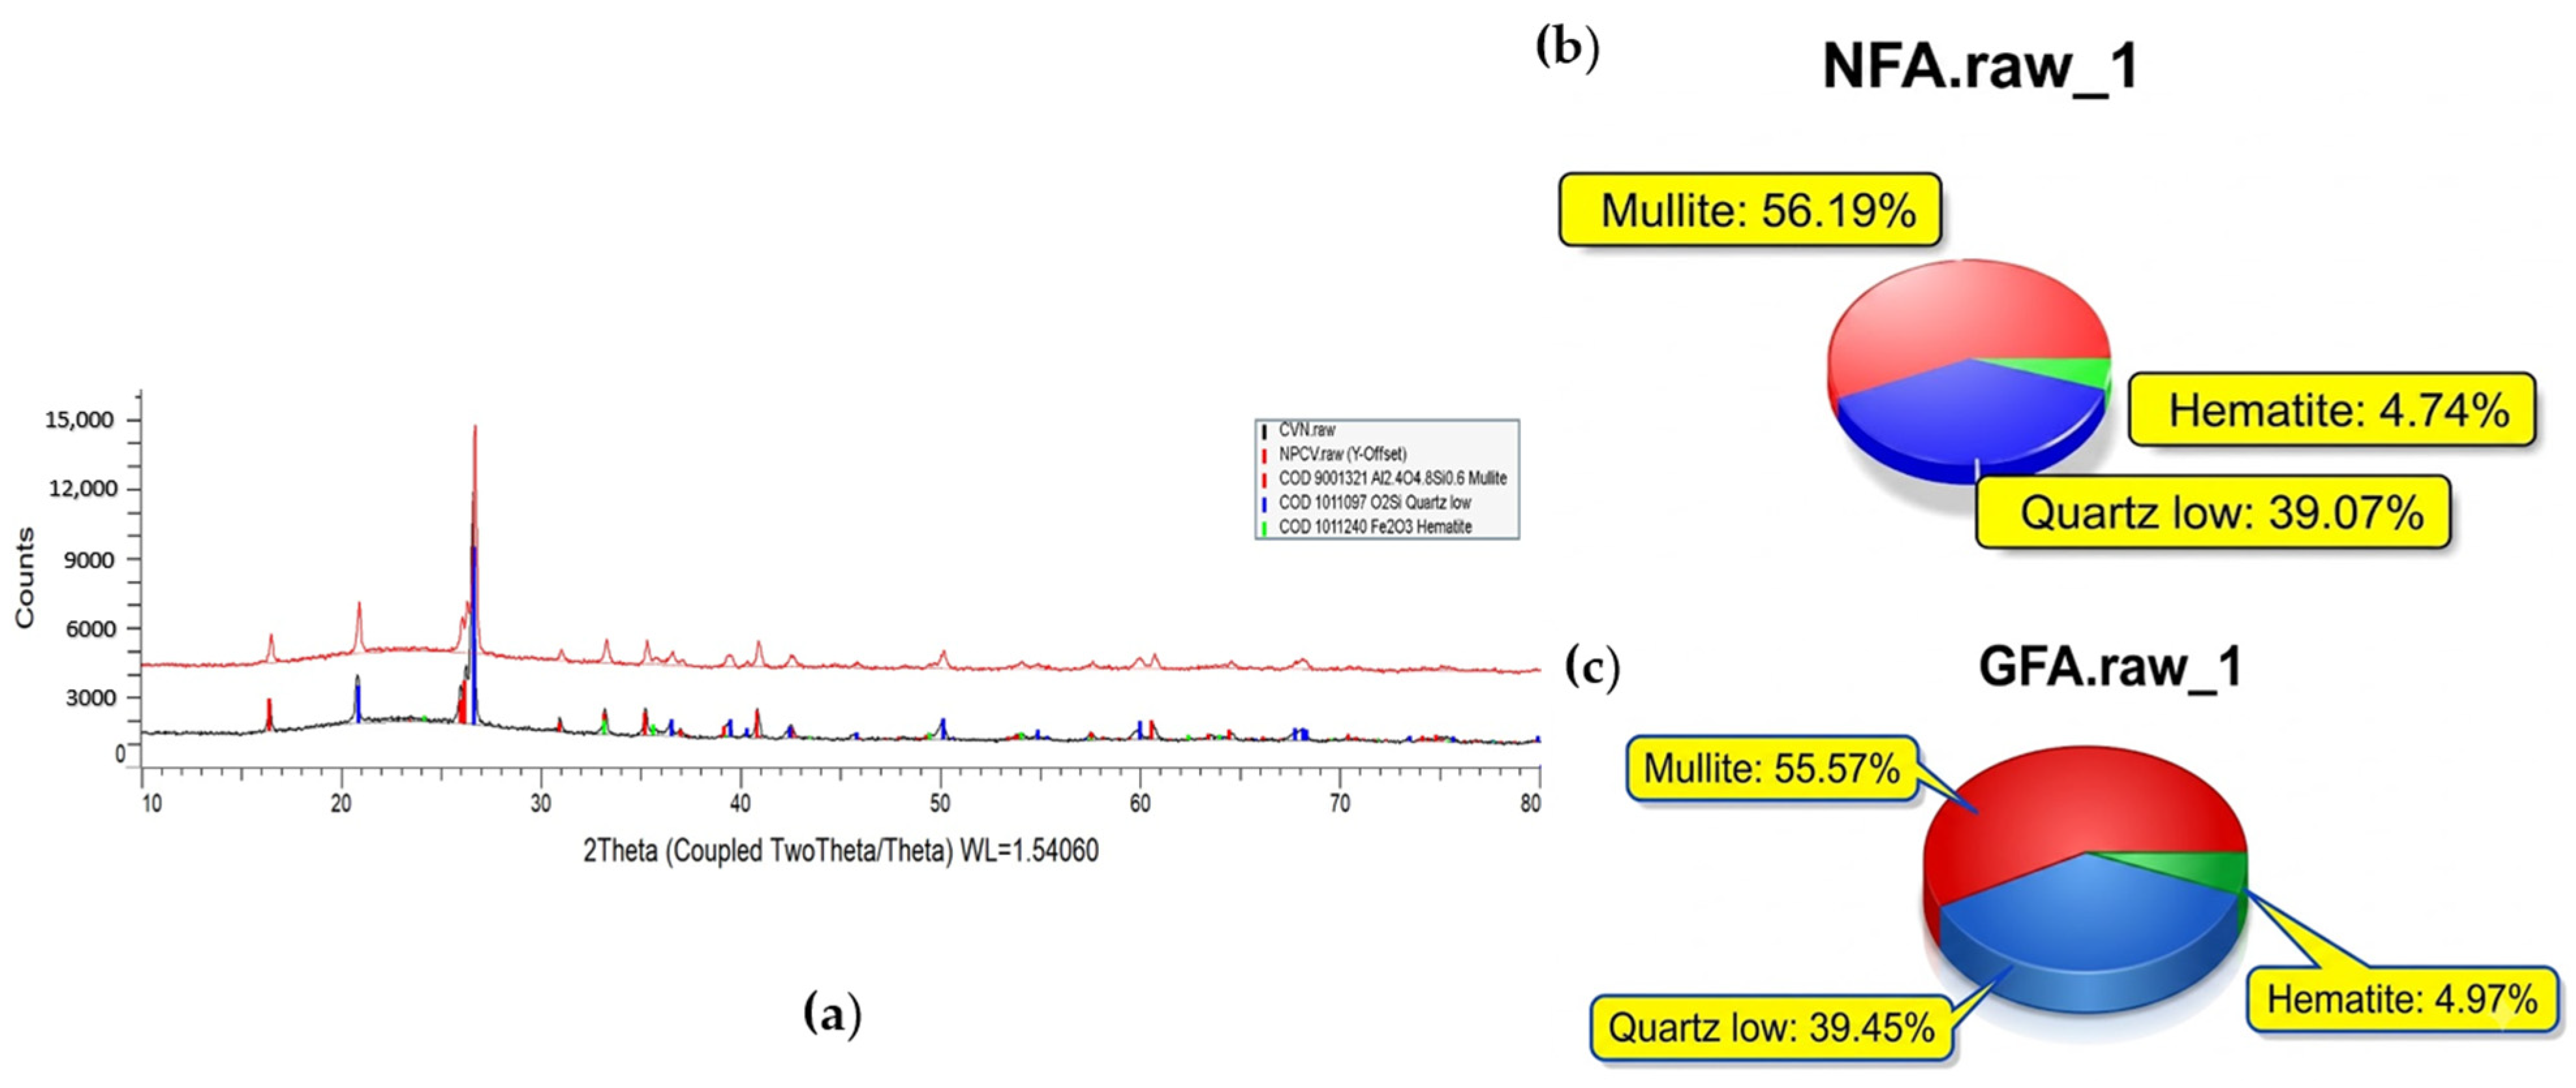
Figure 8a shows the X-ray diffraction pattern of NFA and GFA of the dust samples; phase ID was carried out by means of Diffrac.EVA software, and the database was the Crystallography Open Database (COD); the crystallographic phases present in the concrete items are at 2θ angles ranging from 10° to 80°. The characteristic peak at 27° is attributed to quartz as SiO2 [45], indicating that quartz could be the most abundant structure in the material. Similarly, peaks with lower intensity are observed corresponding to the mullite crystalline phase ((Al6Si2O13) COD-9001321) [45,48,49].
Figure 8.
(a) Diffraction pattern obtained from an X-ray diffractometer operated at a CuKα radiation of 1.5418 Å at a voltage of 40 kV and current of 30 mA, (b,c) results of quantitative analysis with Diffrac.TOPAS.
The X-ray diffraction pattern confirms the Class F fly ash. The quantitative phase analysis was carried out with Diffrac.Topas suite software (Figure 8b,c), the amorphous content was evaluated with a line to model the bump. The crystalline phases are described according to Peña [49]; the mullite structure, with an orthorhombic crystalline system, is present as a primary phase (56% wt), followed by quartz in a hexagonal system as the secondary phase (39%). On the other hand, the presence of Fe as the hematite phase COD-1011240, which has a hexagonal structure, corresponds to the remaining phases (4–5% wt). The crystalline phases after grinding did not change; however, the crystallinity index may have decreased slightly due to a reduction in FA sphere size and in degree of crystallinity, which changes from 36.17% to 32.49%. There is a bump from 20° to 30° on the 2θ scale, which means the presence of an amorphous component. The results obtained from XRD indicate a high concentration of aluminum and silicon and confirm the crystalline phases reported in the literature [46].
3.1.3. Characterization by Durability Criteria
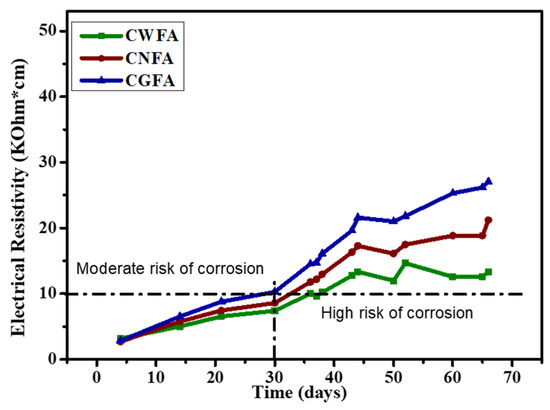
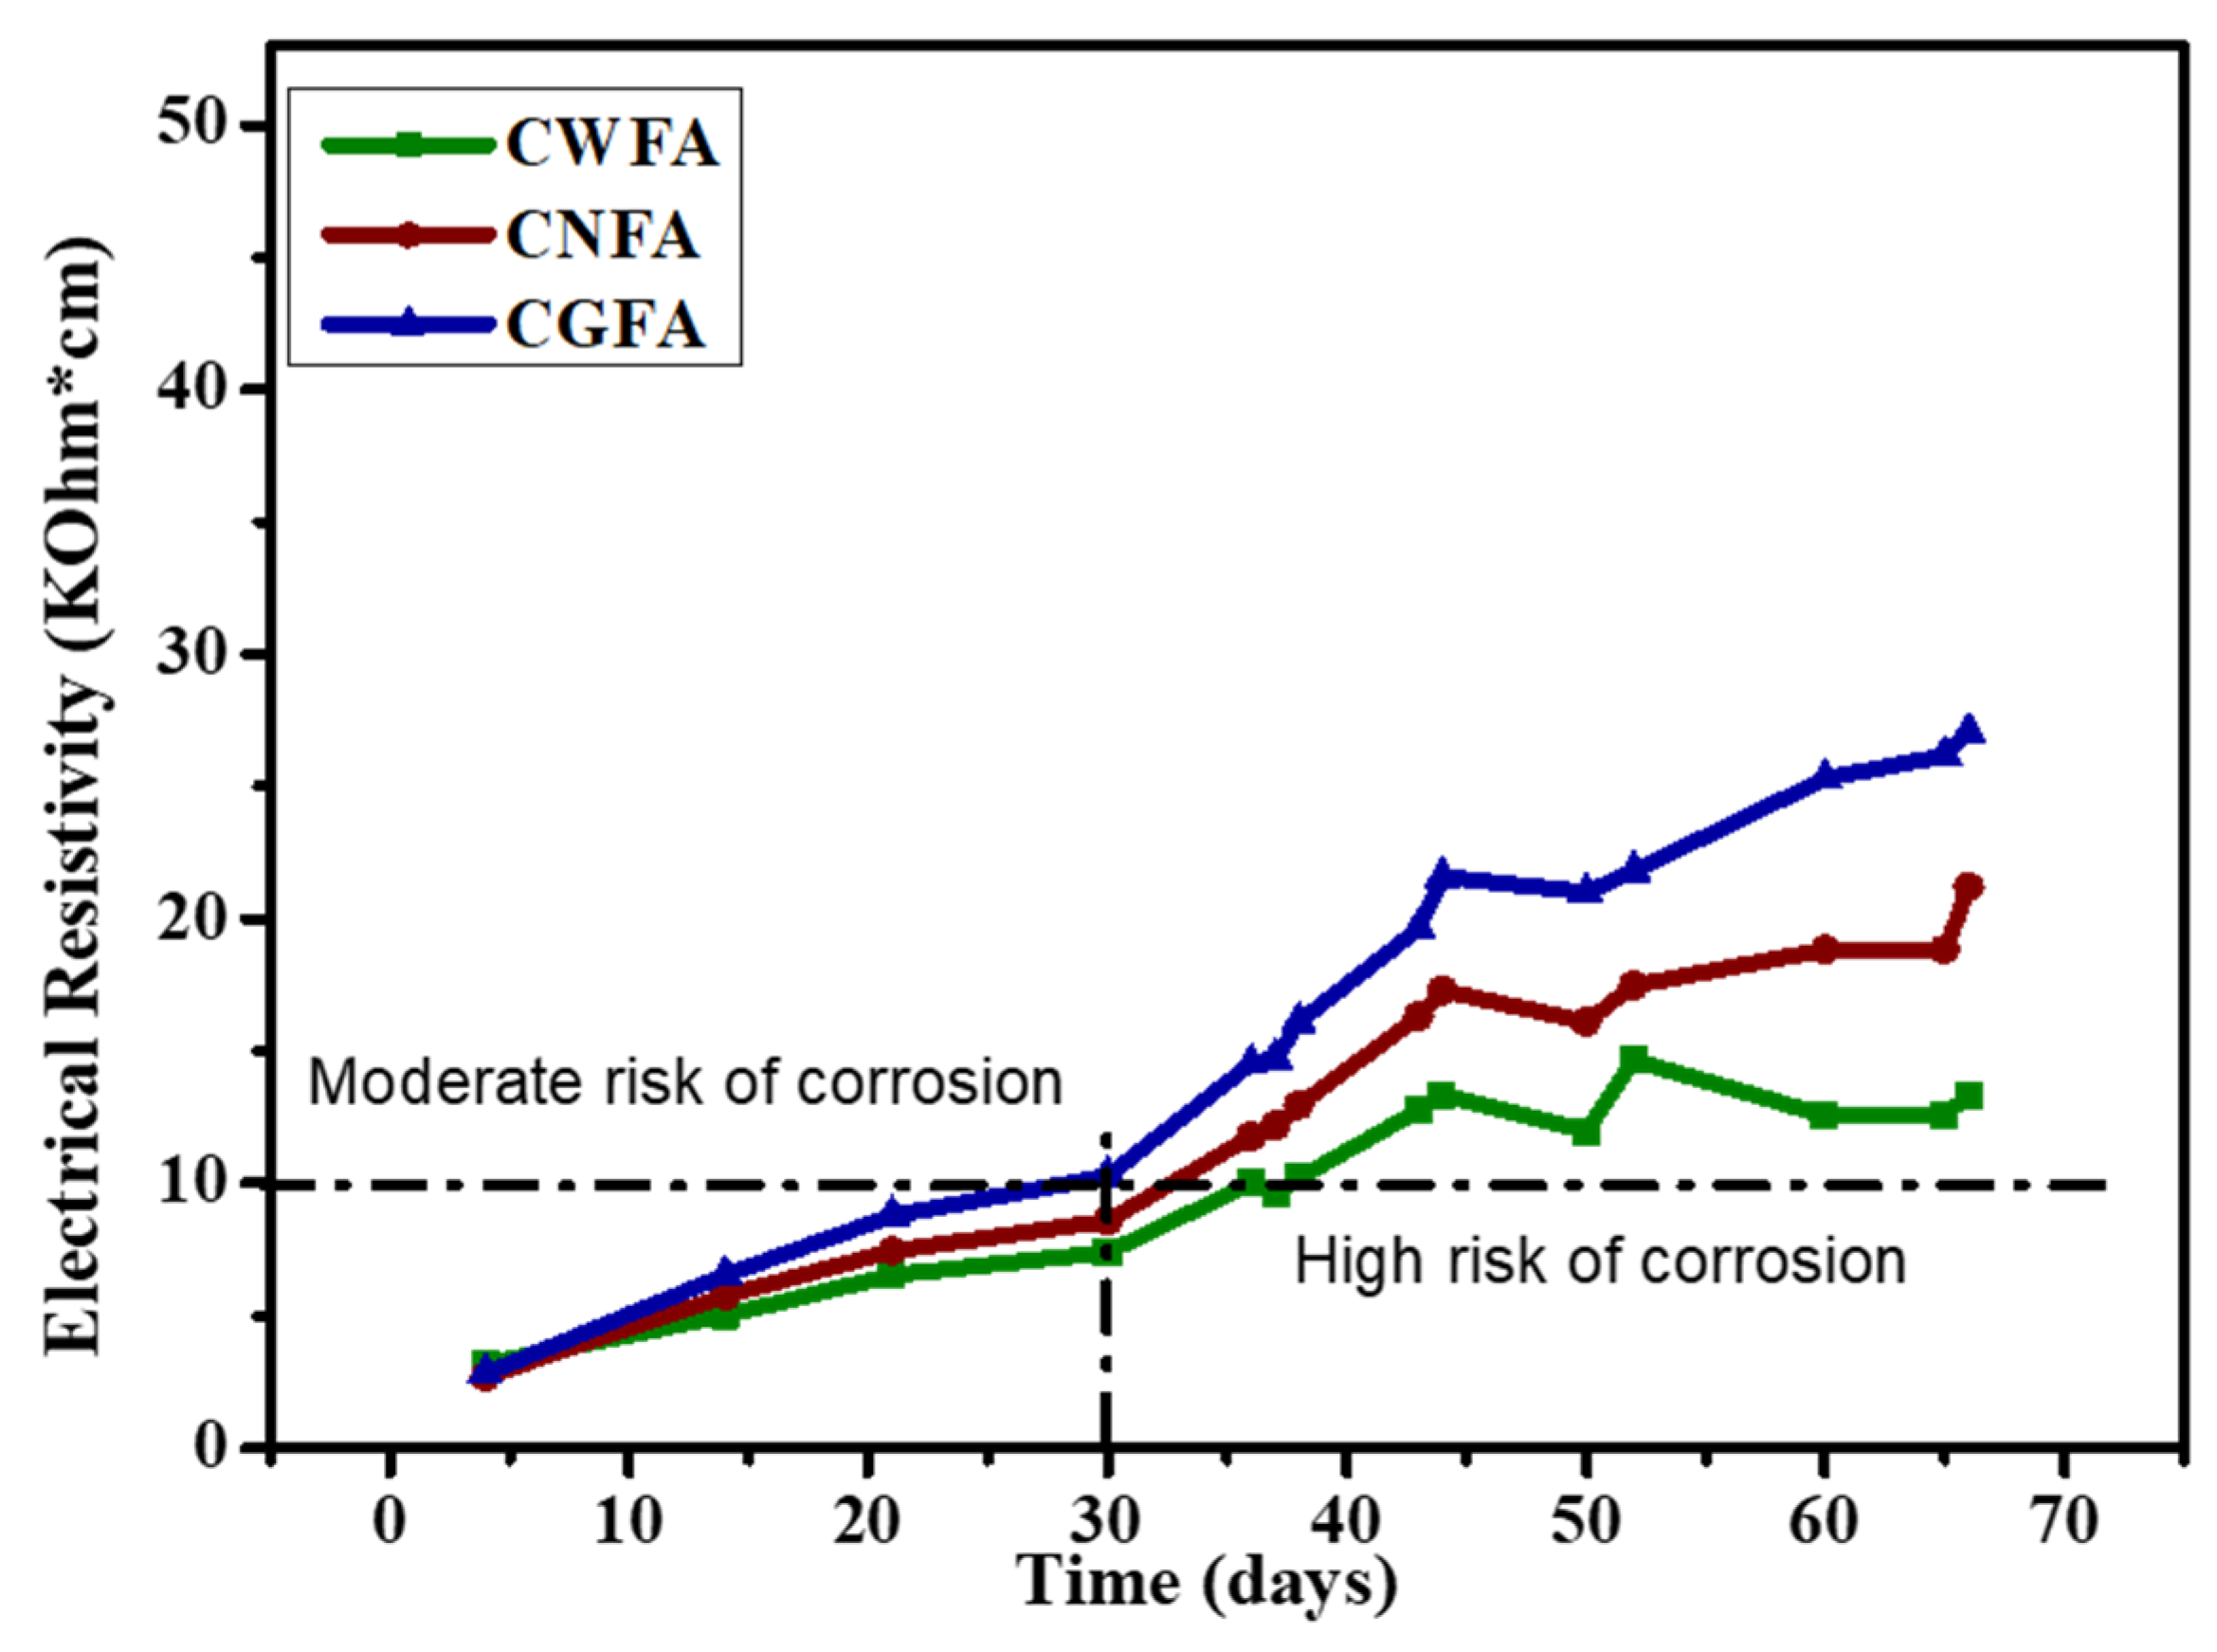
Electrical resistivity is an indirect indicator of concrete durability, since resistivities greater than 100 kOhms indicate lower ionic mobility and, consequently, a lower probability of corrosion of the reinforcing steel. Figure 9 shows the evolution of the electrical resistivity measurements over a period of 65 days. It can be observed that electrical resistivity increases in all mixtures as the curing time of the concrete specimens progresses; this indicates a gradual reduction in the ionic conductivity of the concrete as a result of the progression of hydration reactions and microstructural refinement. At the end of the curing period, the three mixtures exhibit similar behavior, with values below 10 kOhms·cm, which corresponds to a moderate risk of corrosion according to the criteria of the standard. At this stage, the influence of NFA and GFA is limited because the pozzolanic reactions have not yet developed significantly. After 30 days of curing, a clear separation is observed between the resistivity evolution curves, with the WFA mixture reaching up to 27 kΩ·cm at 70 days, followed by NFA at 21 kΩ·cm, and finally the WFA mixture at 13 kΩ·cm.
Figure 9.
Electrical resistivity values obtained from the Standard ASTM G57-20 [31] test method for concrete items.
The analysis of the electrical resistivity values indicates that the items with CGFA in the concrete place the material in a durability criterion with moderate risk, on day 30 of its manufacture [50]. That is, the risk of corrosion that the structure has is low. However, performing a general analysis on day 38, all the concrete items reach the durability criterion of moderate risk, with electrical resistivity values of 10.2 kΩ for the CWFA items, 13 kΩ with CNFA, and 16.1 kΩ with CGFA, the latter being those that show the highest resistivity to the passage of electric current, 19.51% higher than that of the CNFA concrete items and 36.59% higher than that of the CWFA mixtures. This indicates that the mixtures with GFA continued to react during the curing period. The high electrical resistance compared to the CWFA mixtures is due to the high Si and Al content of the fly ash; however, the difference between the CNFA and CGFA content is attributed to the fact that the fly ash contains impurities of unburned carbon, which causes an increase in electrical conductivity and consequently decreases the electrical resistivity values.
On the other hand, the CGFA shows better resistivity values due to the chemical reactivity caused by the pozzolan when reacting with the free calcium oxide released during setting to form C-S-H gel, causing greater packing of the structure and thus lower porosity, resulting in better opposition to the passage of electric current [51]. These results are favorable for the incorporation of GFA into concrete. Therefore, it can be concluded that in concrete items with GFA, the efficiency is 28.16% higher compared to the CWFA and 16.50% higher compared to the CNFA content.
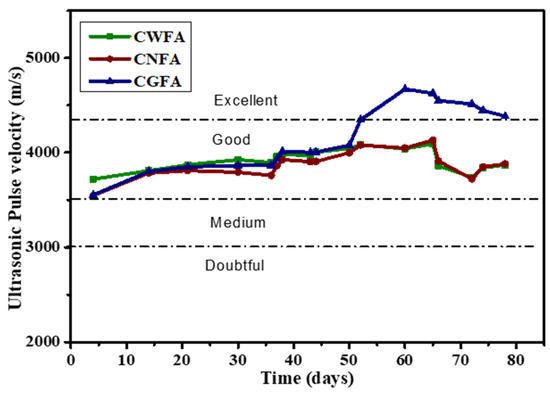
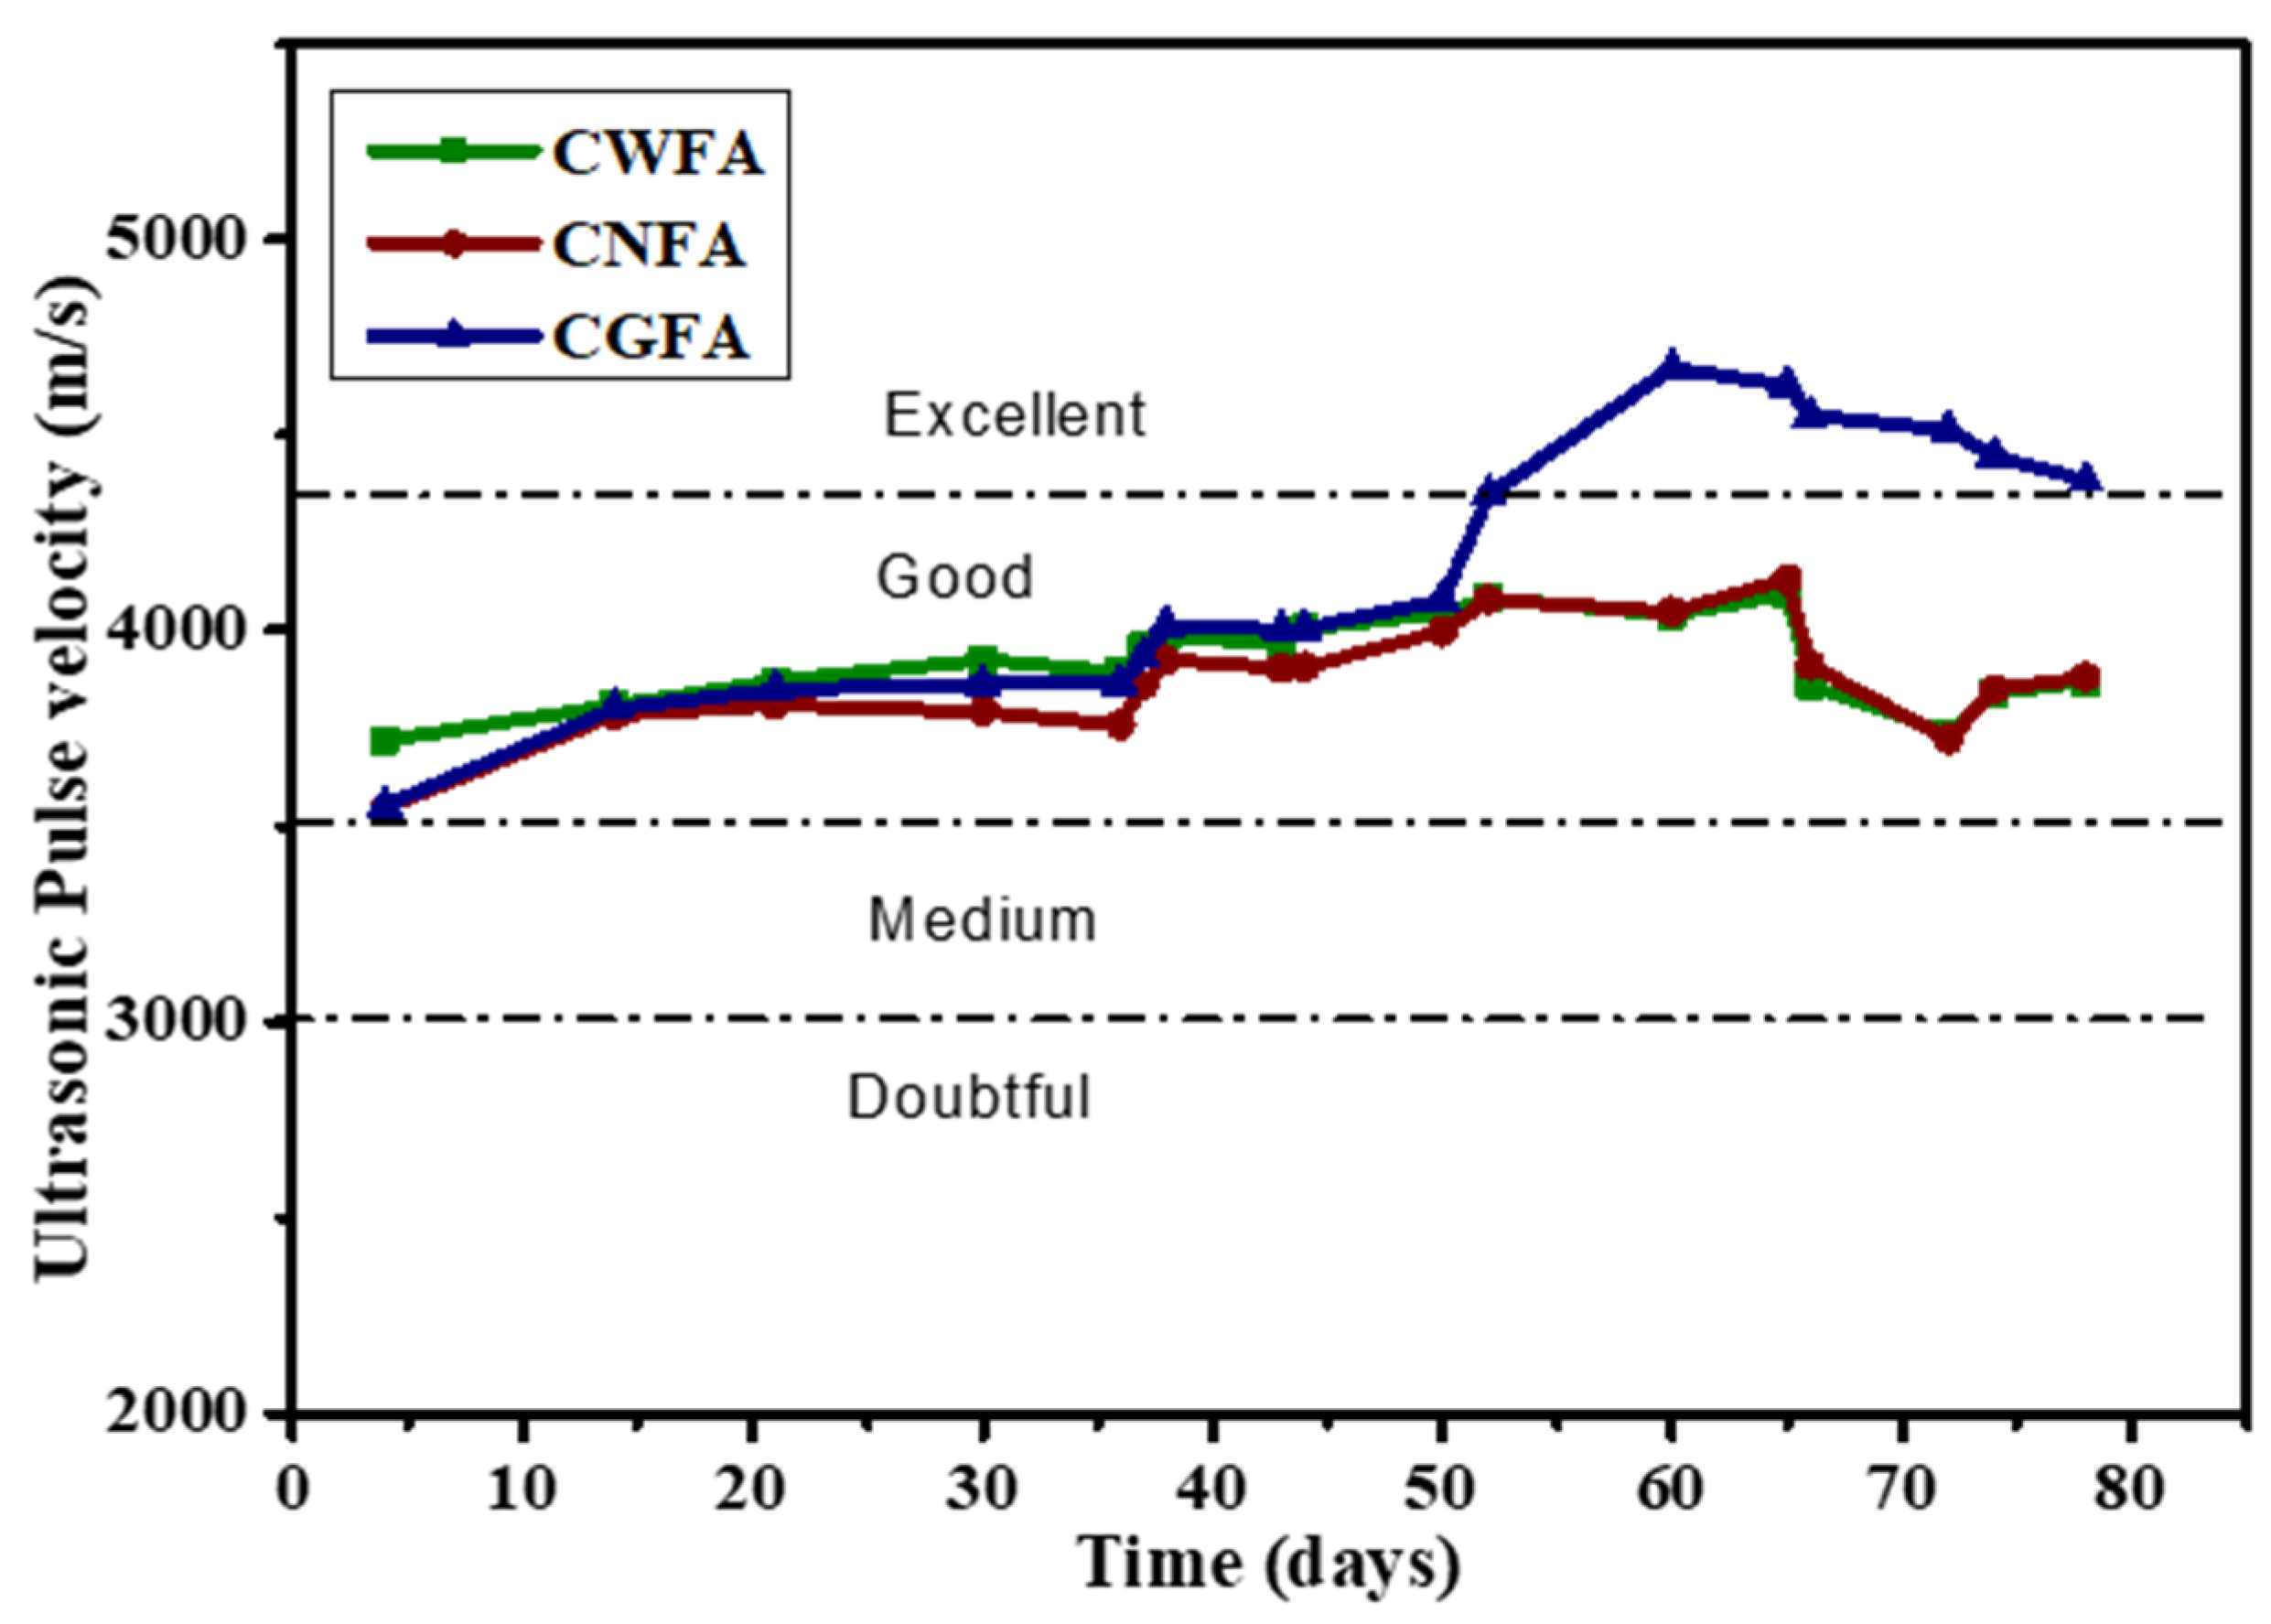
Figure 10 presents the UPV results for concrete items according to the days of manufacture and the type of cement substitute. The concrete shows a UPV on day 38 of manufacture of: 3984.06 m/s, 3925.42 m/s, and 4013.65 m/s for the CWFA, CNFA, and CGFA, respectively, with the CGFA allowing the pulse to pass through the specimen more quickly by 2.2% compared to the CNFA items and by 0.7% compared to the CWFA.
Figure 10.
Ultrasonic pulse velocity values obtained from the Standard ASTM C-597 [33].
Table 6 presents the results of porosity and total water absorption of the concrete items, and these corroborate the quality level of the material, comparing it with the criteria mentioned in the standards. In this way, it is indicated that the mixtures with GFA are those with lower porosity and therefore lower absorption, placing the concrete in the criterion of moderate quality and good quality and compactness; that is, they are less susceptible to allowing a steel corrosion process. According to [52], the low water absorption is an indication of good compaction achieved by the filling effect of the CGFA. The difference between the percentages of porosity and capillary absorption in the concrete is due to the w/b ratio used, since it was 0.62; according to [53], the amount of water permeability depth and porosity increased as the w/b ratio increased. Similarly, the high surface activity of fly ash particles as a nucleus can improve the hydration reaction rate, leading to the rapid accumulation of hydration products in the microstructure, resulting in a more uniform distribution of these; on the other hand, the particles reduce the amount of free water in the mixture and therefore cause a denser packing, thus reducing porosity [54].
Table 6.
Porosity and total water absorption percentages for the mixtures.
Table 7 presents the Fagerlund kinetic parameters describing the capillary absorption and sorptivity of the mixtures. To determine the saturation time, i.e., the total saturation of the mixture (z = H), the minimum difference between the last weights was taken.
Table 7.
Values of water penetration resistance, capillary absorption coefficient, and sorptivity.
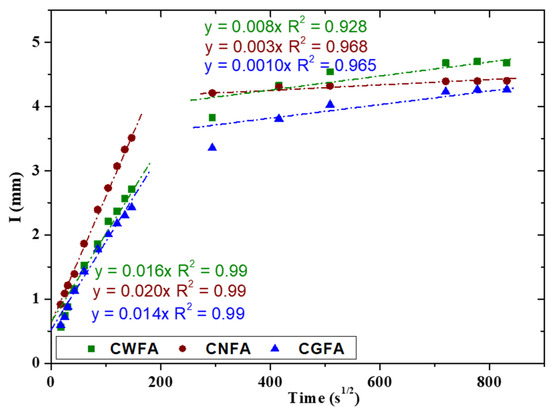
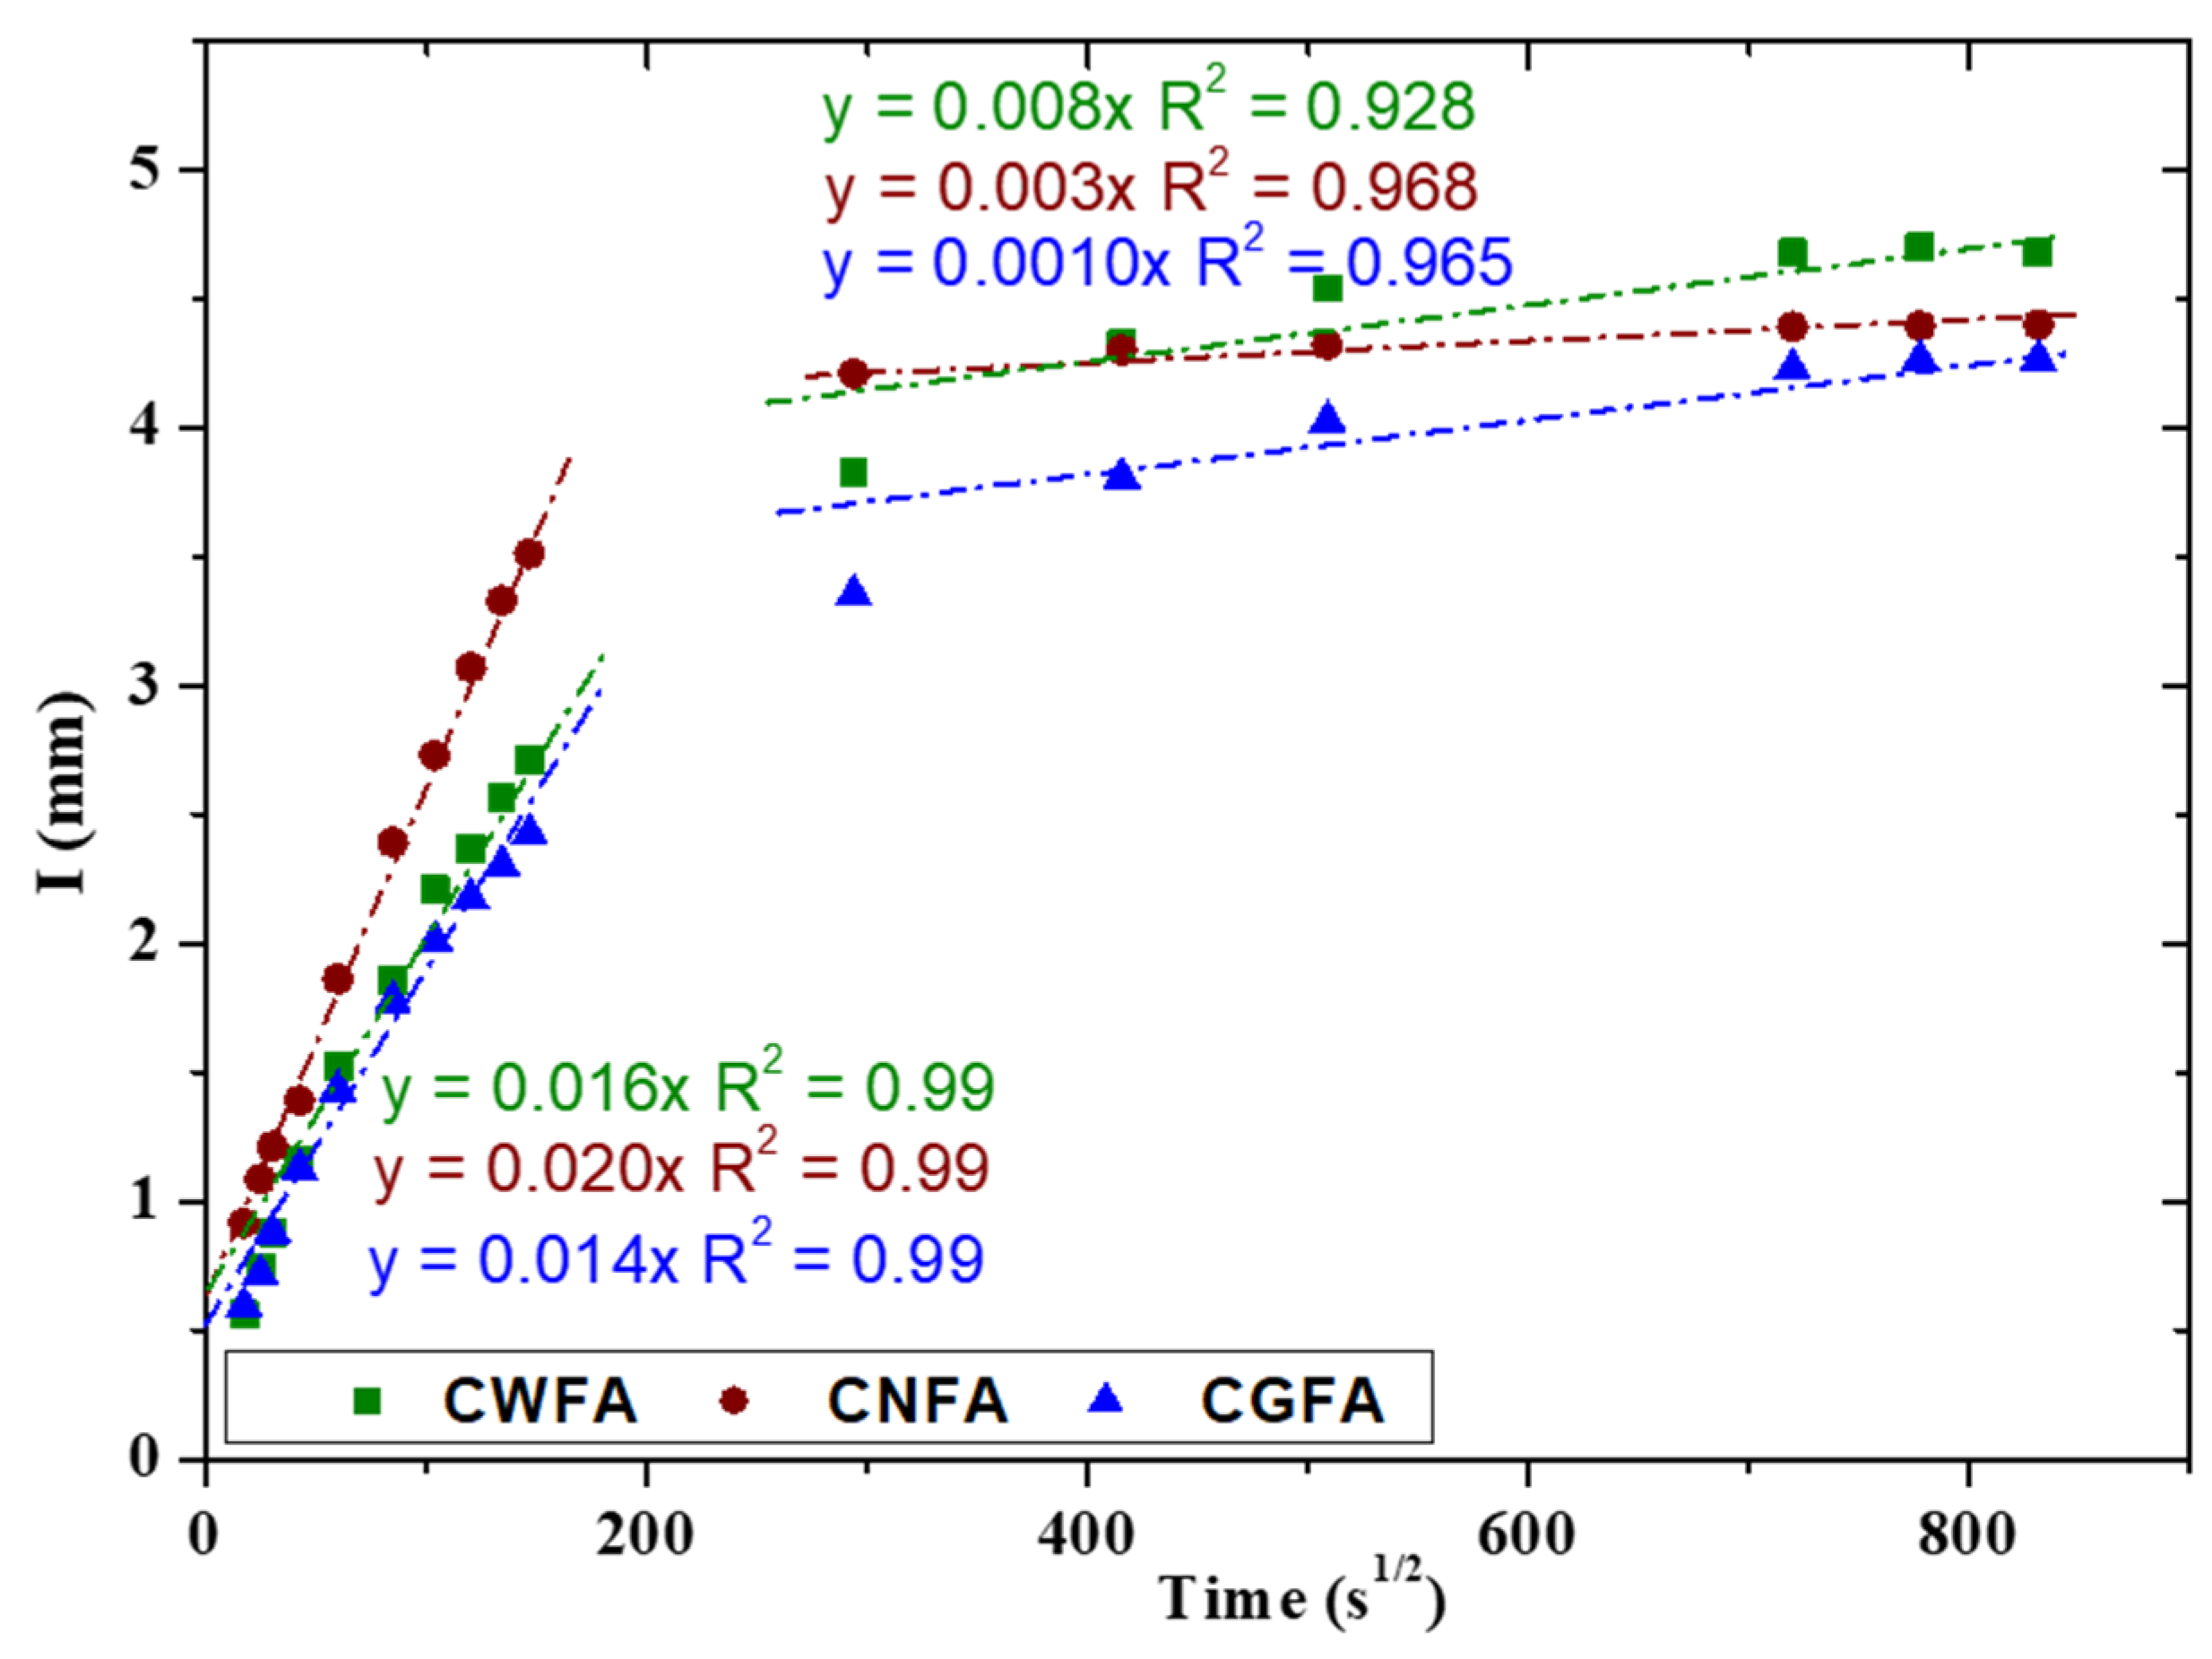
Figure 11 presents the average graph corresponding to the absorption (I) in mm, as a function of the square root of time, where the saturation of the mixtures by capillary absorption is clearly observed. The behavior exhibits two clearly distinct stages: an initial stage of rapid capillary absorption and a second stage in which the absorption rate decreases considerably until it approaches a nearly steady state.
Figure 11.
Capillary absorption on CWFA, CNFA, and CGFA.
During the initial stage (0–200 s1/2), all mixtures exhibit a linear relationship between penetration depth and the square root of time, with high coefficients of determination (R2 = 0.99), confirming that water transport is governed by the capillary absorption mechanism. These results indicate that CNFA absorbed water more rapidly, while the CGFA exhibited the lowest absorption rate. When comparing the results of these mixtures, the initial CGFA sorptivity was approximately 30% lower than that of CNFA, indicating a significant reduction in capillary transport capacity. In the second test stage (300–850 s1/2), the slopes of the straight lines decreased, indicating a reduction in the rate of water ingress as the capillary pores became saturated. Although the mixtures tended to stabilize, CGFA continued to exhibit the lowest absorption rate. Figure 11 clearly shows a decrease in capillary absorption in the CGFA. This can be explained because the reduction in particle size contributes to decreasing the number of pores or cavities in the concrete mix, as indicated by the results presented in Table 6. This is clearly exemplified by observing that the mixture with WFA has the highest capillary absorption, and when fly ash (unground) is added, it decreases significantly, and it is improved in the mixture with GFA. Table 8 clearly shows the similarity in the initial absorption rate for the different mixtures. The initial absorption is related to the initial hydration state of the cement paste, so it is similar in the three cases with a high reliability level, since the three mixtures were subjected to the same drying process at constant weight. However, the secondary absorption rate for the CWFA is notably higher than for the mixtures with fly ash, even exceeding 100%.
Table 8.
Initial and secondary absorption rates of concrete mixes.
Table 9 shows the decrement in the absorption rate for the CGFA; this can be attributed to the filling effect presented by the GFA particles. A similar behavior is reported in [55], additionally indicating that the hydration reactions are favored by the amount of Si and Al content.
Table 9.
Depth of carbonation for concrete mixture.
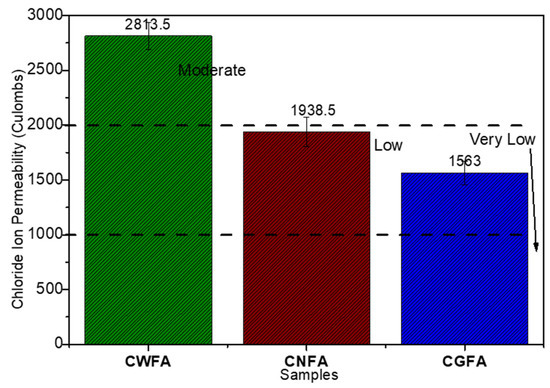
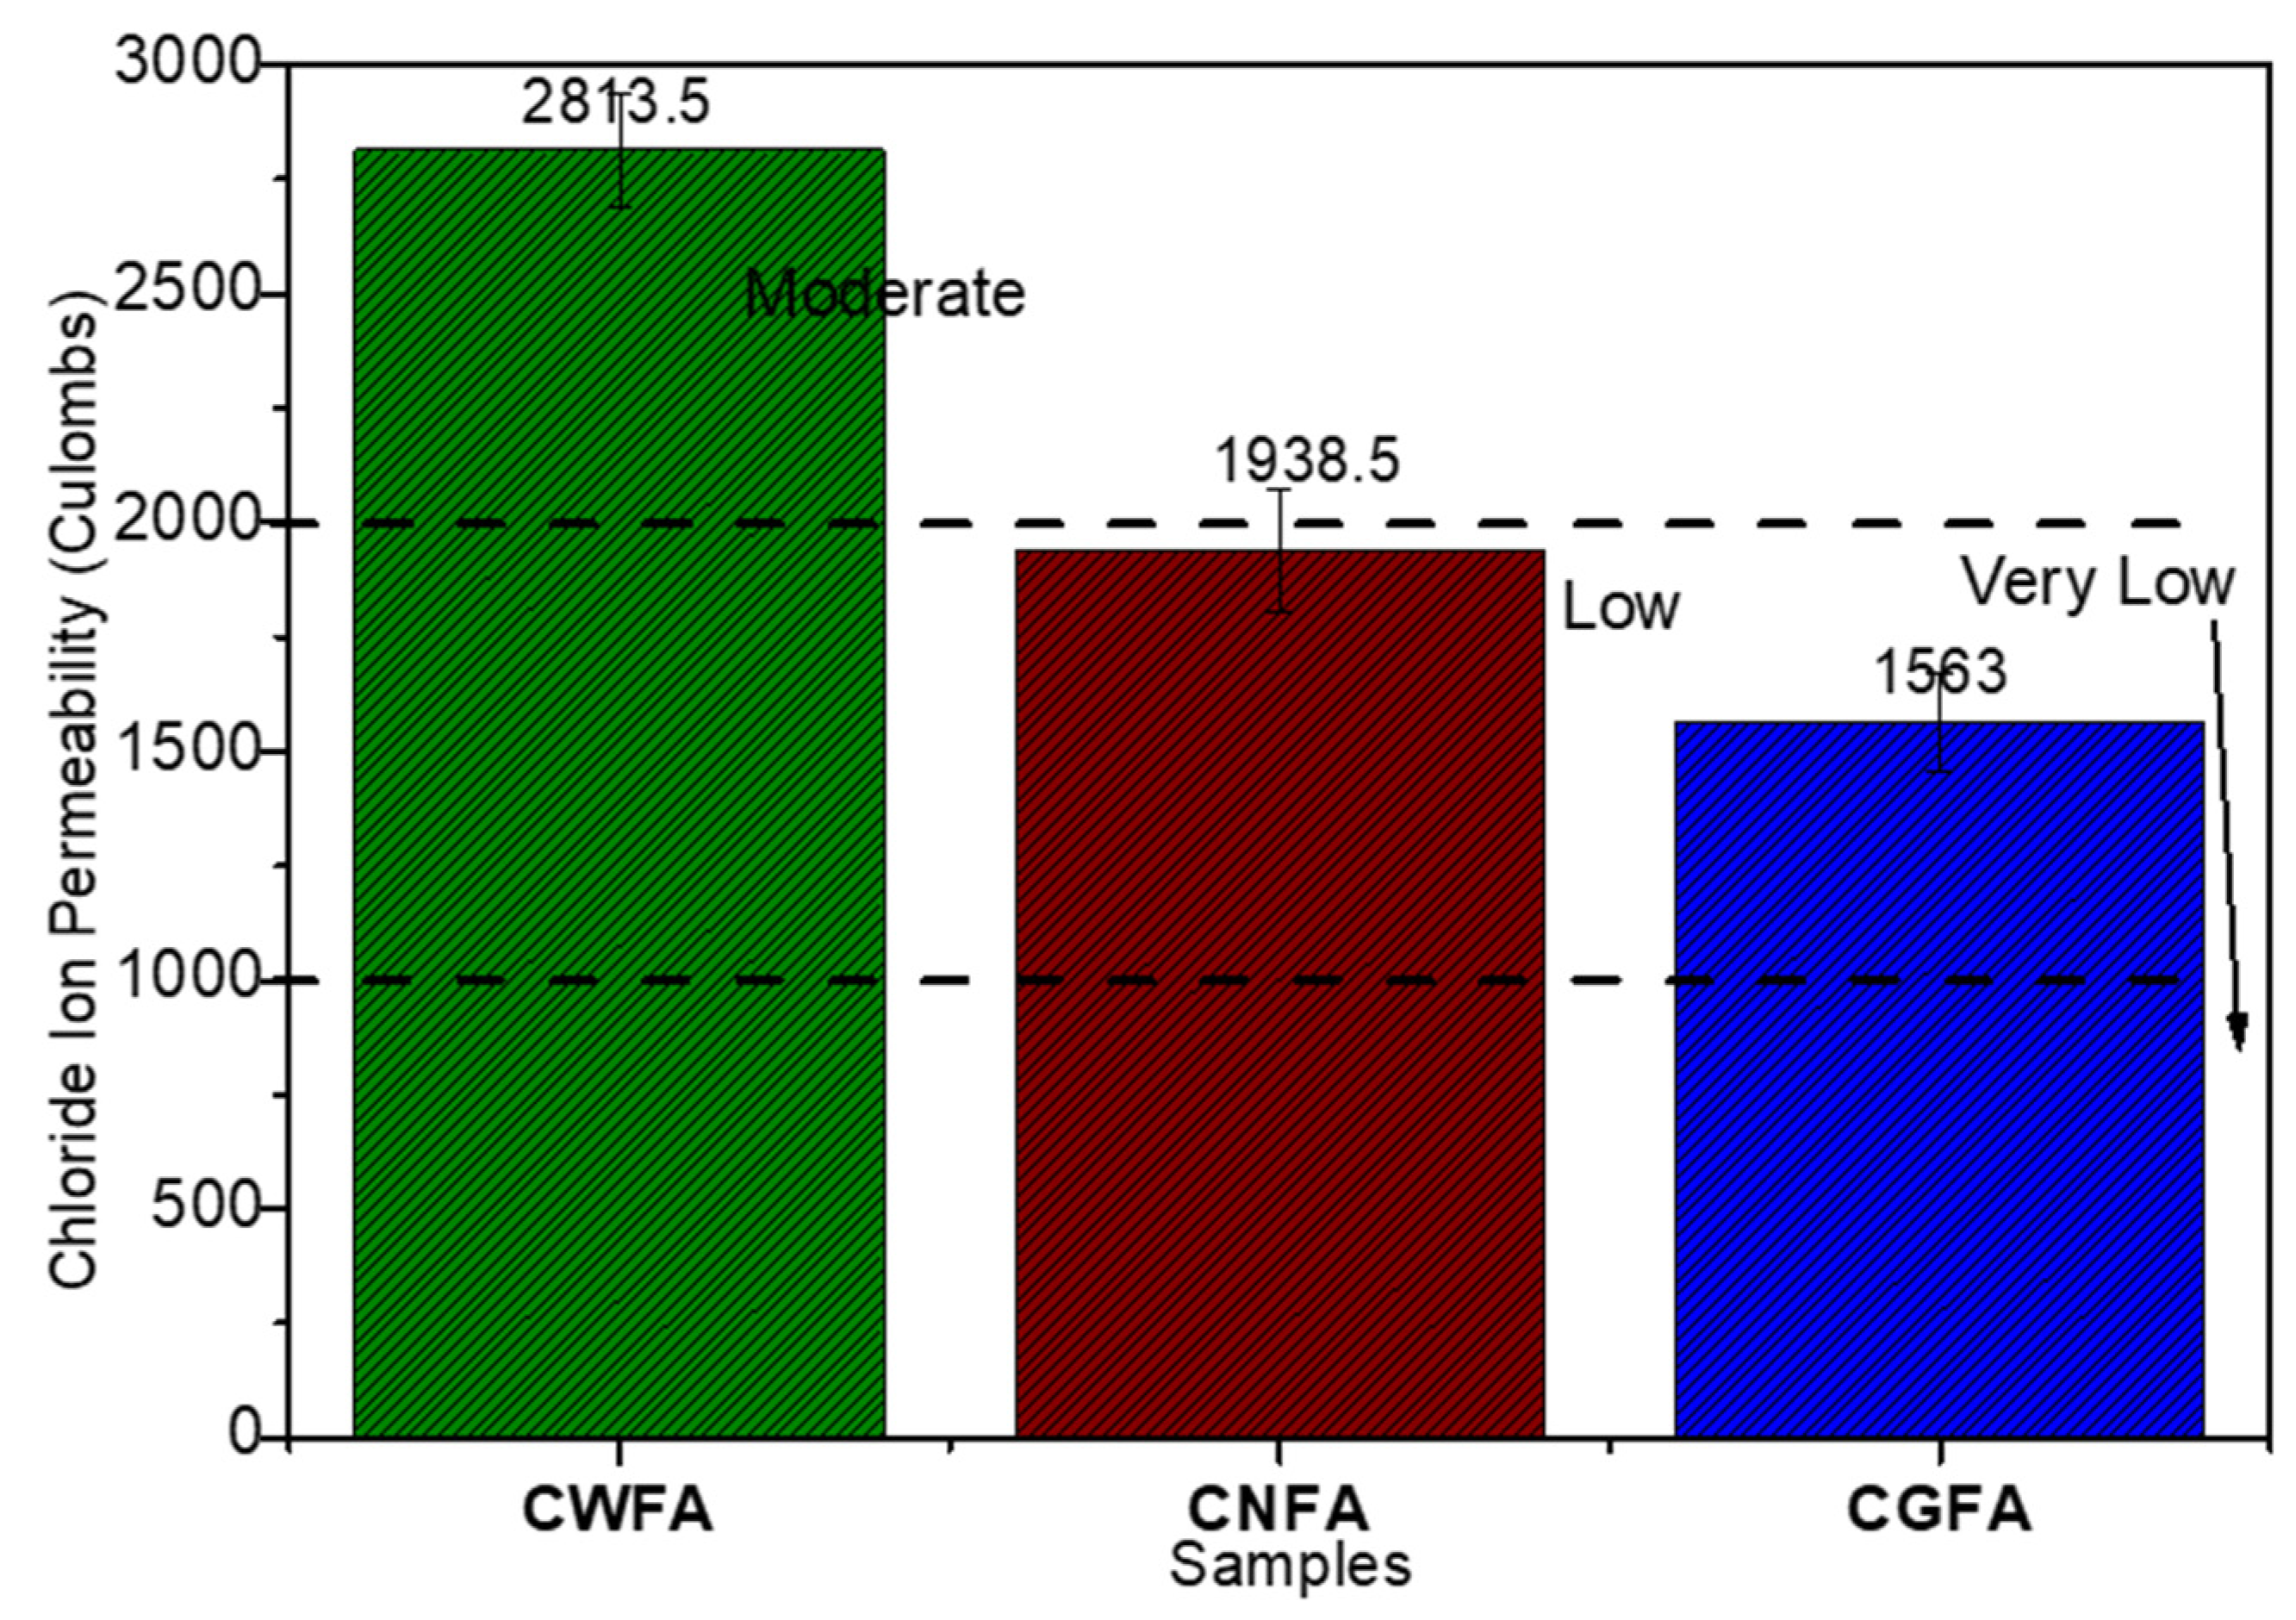
Figure 12 shows the RCPT results. It is observed that the chloride ion load penetrated was 2813.5 ± 121.29 C, 1938 ± 136.27 C, and 1563 ± 105.98 C for the CWFA, mixtures with CNFA, and CGFA, respectively; thus, demonstrating that the CGFA exerts 39.64% opposition to the passage of chloride ions with respect to the CWFA. Therefore, the items with CGFA are in the low permeability durability criterion as well as the CNFA; however, the latter has a percentage of opposition to the passage of chloride ions of 31% with respect to the CWFA, which is in the moderate ion penetrability criterion. According to these criteria, the CGFA is the one with the lowest permeability.
Figure 12.
RCPT for concrete mixes and ASTM C1202 permeability classification.
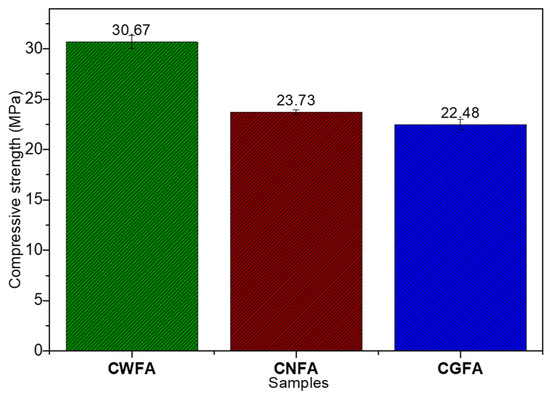
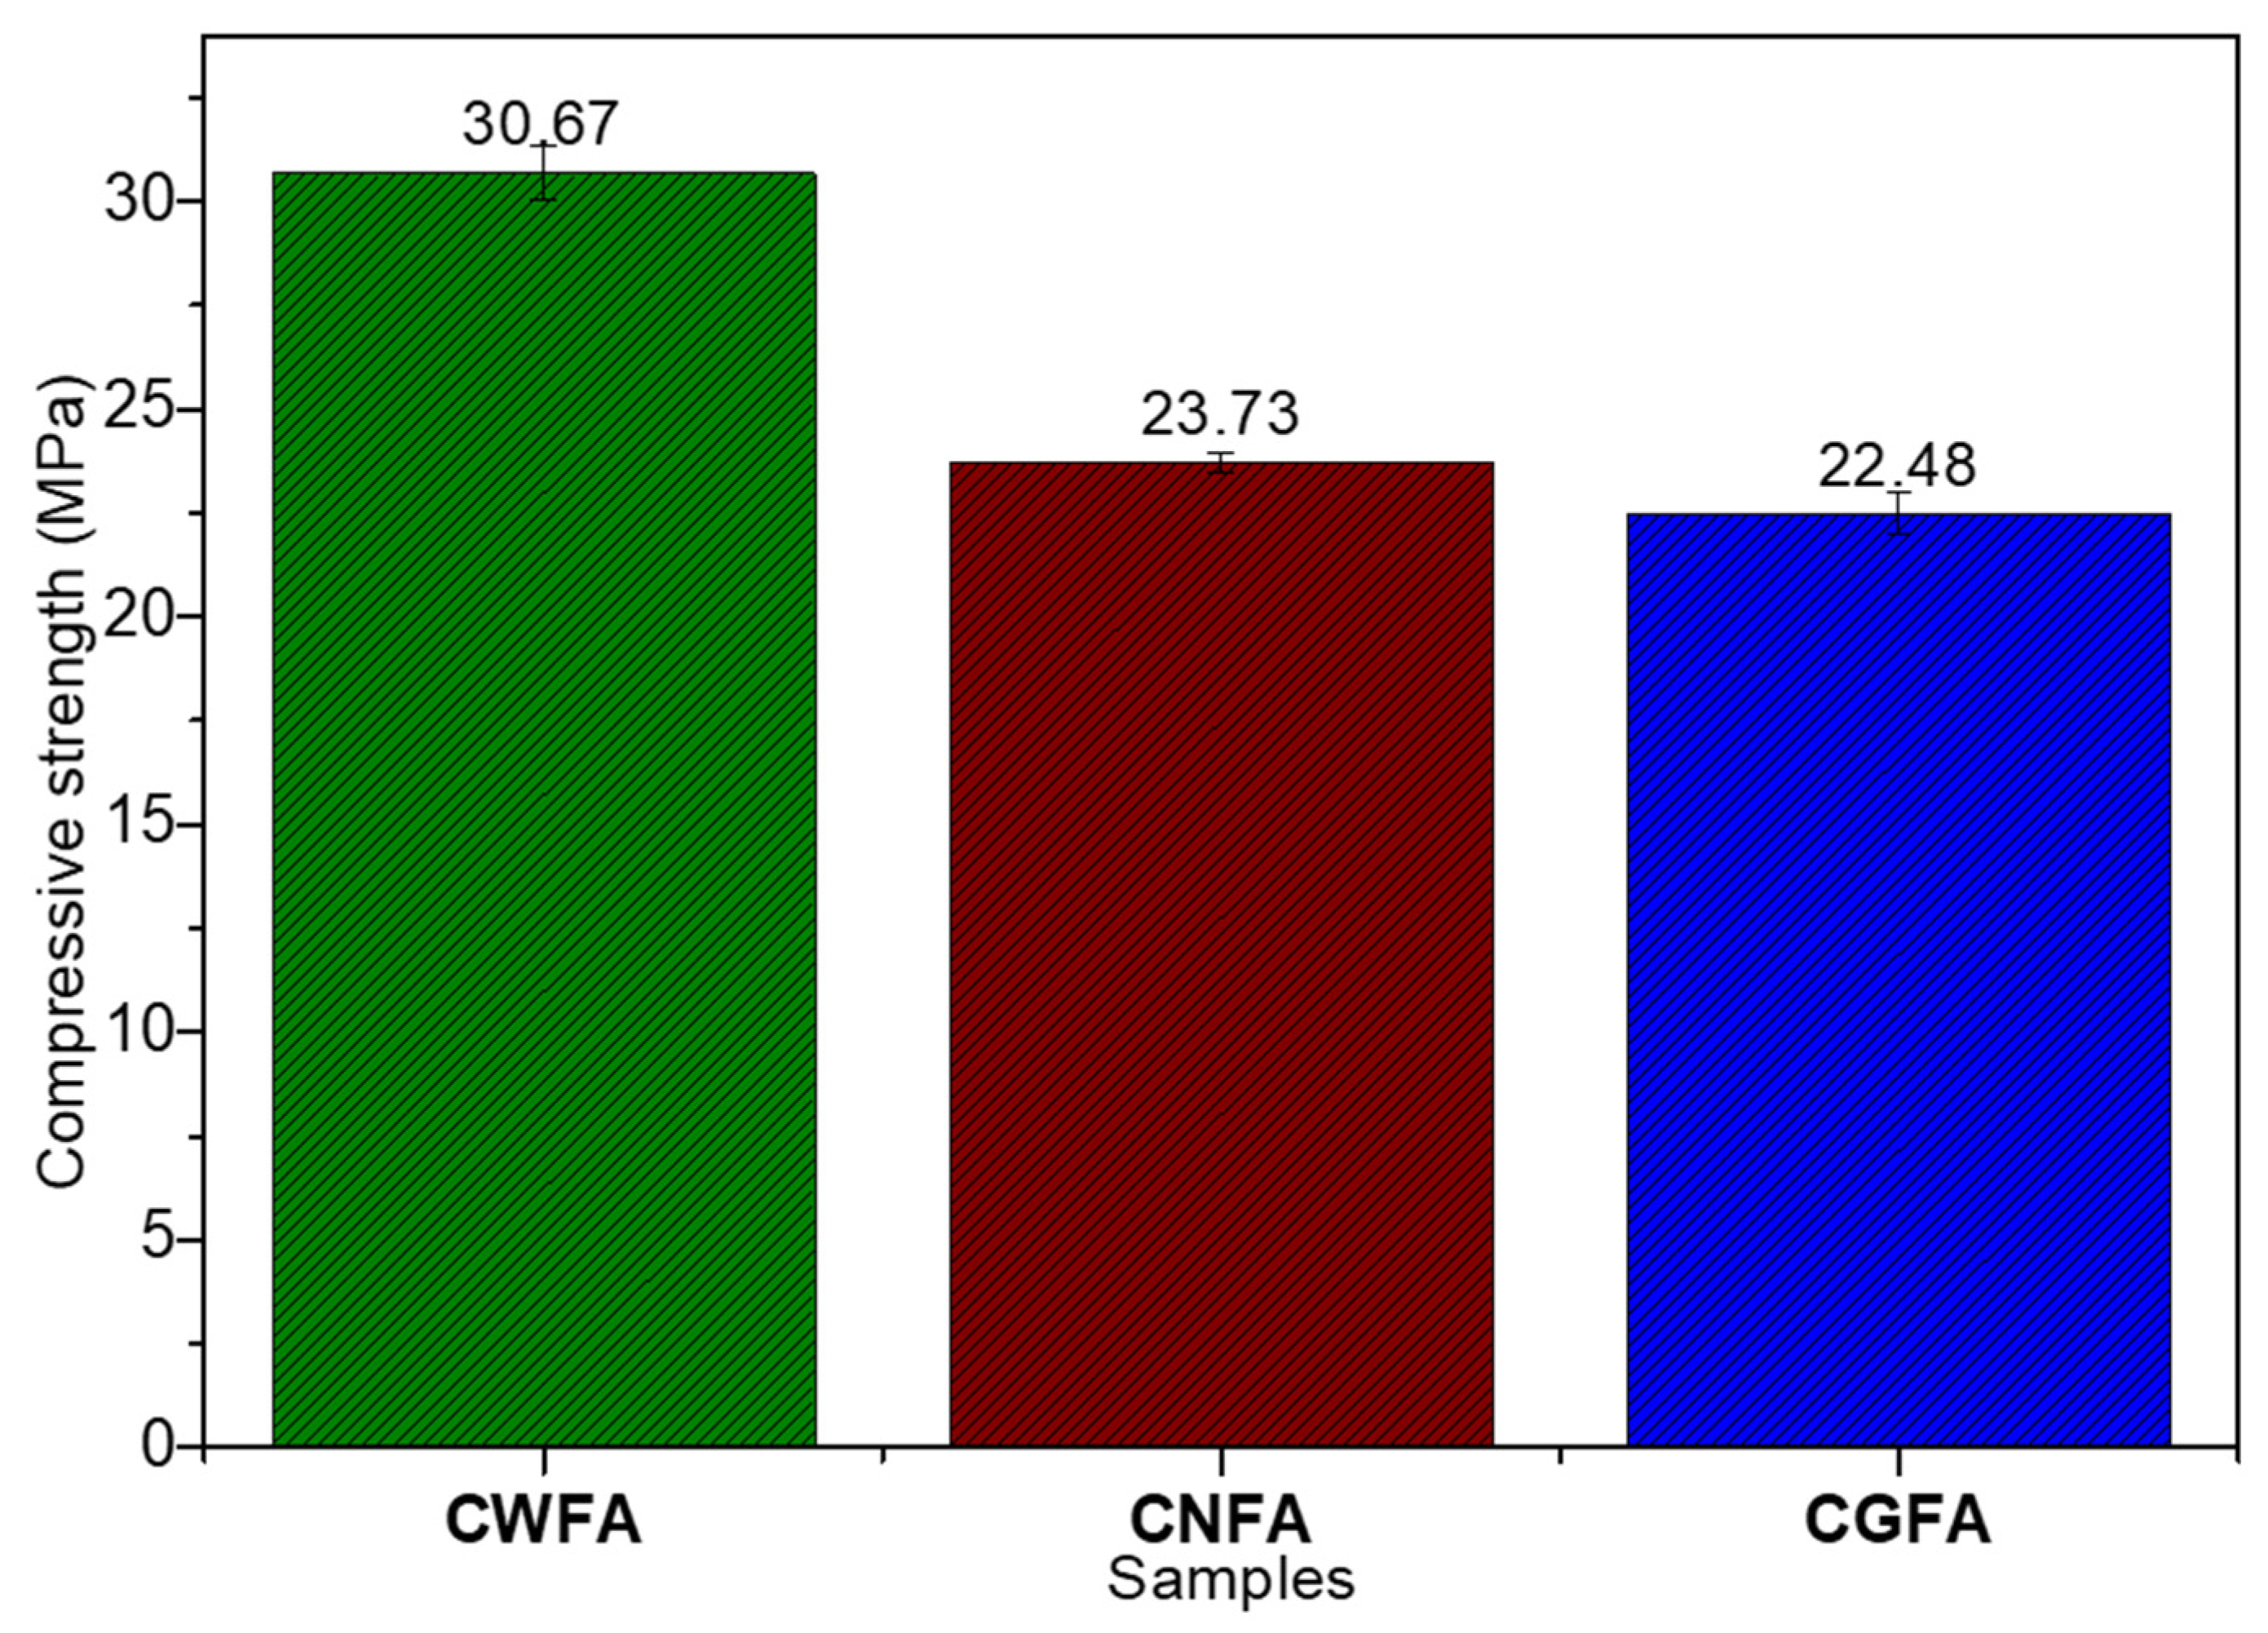
According to [56], the reason for the good performance of CGFA items in terms of chloride permeability is related to the chloride binding capacity of the constituent materials, i.e., chlorides often permeate into concrete through open pores; however, some of these chlorides can react with tricalcium aluminates (C3A) present in GFA and cement, allowing them to form stable chlorine complexes. Moreover, the large amounts of aluminosilicates released as a result of grinding lead to a high increase in S-C-H gel content. As a consequence, the CGFA increased its resistance to chloride ion penetration. Likewise, the use of mineral additives increases the concrete PRC since the pores become finer and reduce microcracks [57]. The results of the compressive strength of the concrete items are presented in Figure 13; these were obtained after the curing period of 65 days and show that the highest f`c was obtained for the CWFA specimen, that is, the CWFA with 30.67 ± 0.65 MPa, while the CNFA and CGFA items had an f`c of 23.73 ± 0.25 MPa and 22.48 ±0.50 MPa, respectively.
Figure 13.
Compressive strength test for concrete mixes.
The results reveal that the CGFA does not achieve the strength offered by the CWFA, showing even a lower strength than the CNFA. This is clearly due to the lower cement content in this mixture and could also be attributed to the potential agglomeration of GFA particles, which prevented proper particle distribution throughout the mixture, thereby resulting in a slow reaction for improving this property. In the literature [58], it is reported that concrete mixtures with NFA do not reach the strength values provided by mixtures with WFA. This improvement in compressive strength is due to the increase in the content of SiO and AlO, which optimize hydration reactions. GFA has an effect on the pozzolanic reaction by intensifying the cement hydration process through incorporation; this can be explained by the theory of free energy of nucleation, where the number of nucleation points can increase when the particle size decreases, which leads to an increase in the specific surface area, allowing greater reactions with aluminosilicates and higher formation of C-S-H, increasing the compressive strength [59]. In this case study, the cement was mixed with the ash microparticles prior to the fabrication of the specimens in order to achieve homogenization; however, it is evident that this effect was not achieved. Table 9 presents the results of carbonation depth and carbonation constant for each mixture evaluated.
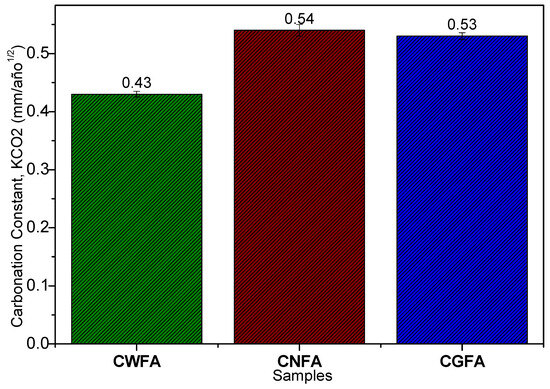
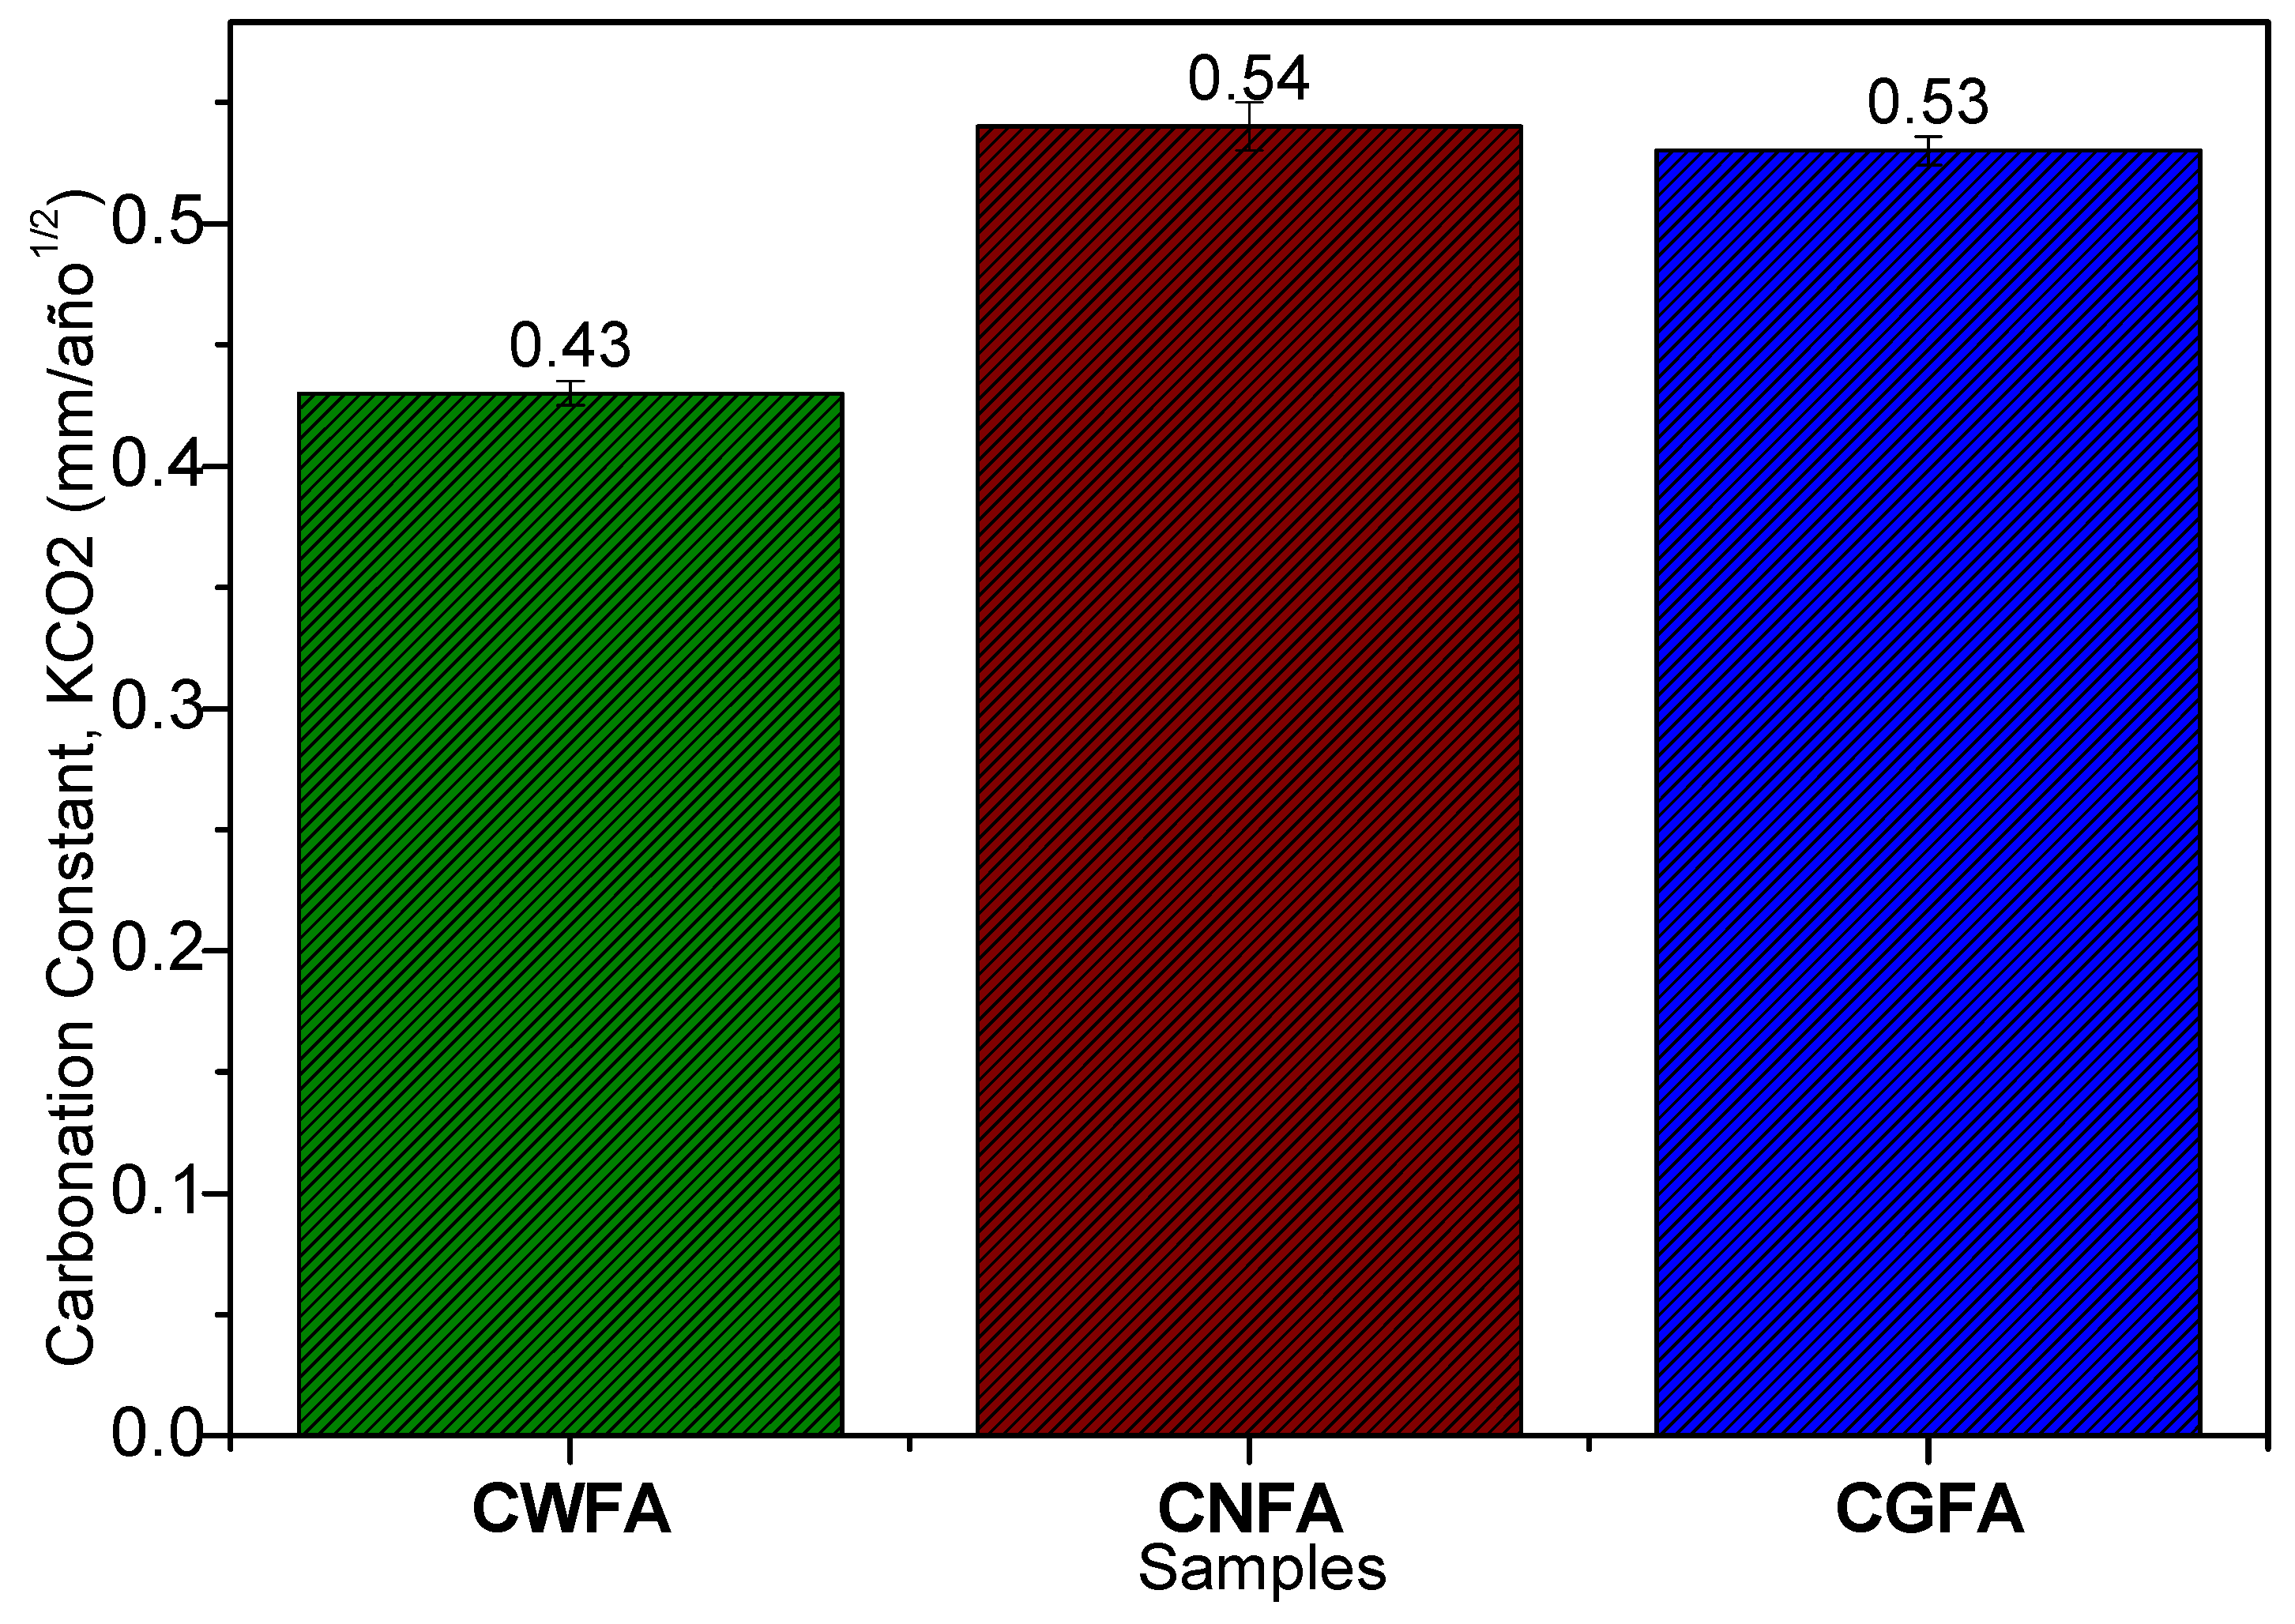
The carbonation constant results are presented in Figure 14; for the concrete mixtures, WFA 0.43 ± 0.005 reveals greater carbonation in the mixtures containing fly ash (CNFA 0.54 ± 0.01 and CGFA 0.53 ±0.005). The CNFA is up to 23% higher than the CWFA, whereas the CGFA is up to 21% higher than the CWFA. The carbonation constant is very similar to the concrete mixtures containing fly ash; however, it is lower for the CWFA.
Figure 14.
Behavior of the carbonation constant in concrete mixtures.
The carbonation results of concrete mixtures reveal greater carbonation of the mixtures with fly ash; this can be attributed to two aspects: high porosity of concrete due to the w/b ratio = 0.62 (easy gas permeability), and the water trapped in these pores reacts with the gaseous CO2, converting it into carbonic acid and subsequently the ionization of carbonic acid to form carbonate during the carbonation reaction. Ahmad E, Wang et al. and Belayneh et al. [60,61,62] reported greater penetration depth in concrete mixtures (w/b = 0.4) with fly ash compared to the CWFA, so they attribute the increase in carbonation of the concrete to the fact that the mixtures with fly ash presented high water absorption. Aguayo F. et al. [63] reported that the increase in carbonation depth is favored by the increase in fly ash in concrete mixtures.
4. Conclusions
This study evaluated the influence of a waste material, fly ash, on the durability criteria of concrete mixtures. Its incorporation helps to reduce cement consumption and, consequently, the CO2 emissions associated with its manufacture. This promotes the circular economy by providing appropriate and beneficial final disposal. Therefore, it can be concluded that:
The size reduction in fly ash through a mechanical grinding process released silicon and aluminum contained inside the fly ash; these elements favored the hydration reactions of the concrete mixture. The durability properties of concrete mixtures with the addition of GFA improved their electrical resistivity by up to 39% compared with CWFA. In terms of homogeneity, density, and compactness, this resulted in “good concrete quality,” surpassing the other mixtures by up to 2.2% with respect to the CNFA and 0.7% with respect to the CWFA. The concrete porosity percentage decreased by up to 5.3% with respect to the CWFA; consequently, the percentage of total water absorption decreased by 6.45%. The capillary absorption of CGFA decreased significantly, decreasing the penetration rate of aggressive ions transported by water into the concrete. Grinding has no effect on the crystalline phases present.
Chloride ion permeability decreased by 39% vs. the CWFA, while the CNFA decreased by 31%. The compressive strength results reveal that CWFA achieves a compressive strength exceeding 20% compared to CNFA and CGFA. Mixes with the addition of fly ash (natural and grounded) are not useful to improve the carbonation resistance of concrete, carbonating the concrete up to 23.3% with respect to the CWFA; however, the CGFA decreased carbonation up to 6.4% compared to CNFA.
The results obtained from concrete mixtures with a high w/b ratio provide solid evidences of the material’s potential to improve the performance and durability of concrete mixtures containing ground fly ash, indicating that results will be more optimal in mixtures with a low w/b ratio; therefore, the evaluation should be carried out on concrete mixtures with a low water-to-binder ratio and adding a particle dispersing agent to the mixtures for homogeneous distribution throughout the mixture and to optimize its compressive strength.
Author Contributions
Conceptualization, A.L.-M. and J.T.P.-Q.; methodology, A.L.-M., J.A.C.-M. and S.F.G.-G.; validation, A.L.-M., J.A.C.-M., J.T.P.-Q., J.M.M.-L. and D.F.-C.; formal analysis, A.L.-M., S.F.G.-G. and J.T.P.-Q.; investigation, A.L.-M., J.A.C.-M., S.F.G.-G., J.T.P.-Q., J.M.M.-L., I.Z.-T., M.H.-G. and D.F.-C.; resources, A.L.-M., J.A.C.-M., J.T.P.-Q. and D.F.-C.; data curation, A.L.-M. and S.F.G.-G.; writing—original draft preparation, A.L.-M., J.A.C.-M. and J.M.M.-L.; writing—review and editing, A.L.-M., J.A.C.-M., S.F.G.-G., J.T.P.-Q., J.M.M.-L., I.Z.-T., M.H.-G. and D.F.-C.; visualization, A.L.-M. and J.T.P.-Q.; supervision, A.L.-M.; project administration, A.L.-M.; funding acquisition, A.L.-M. All authors have read and agreed to the published version of the manuscript.
Funding
This work was supported by the Secretariat of Science, Humanities, Technology, and Innovation (Secretaría de Ciencia, Humanidades, Tecnología e Innovación, SECIHTI-México) through the scholarships 517148, 864068, 91805, and 161138 awarded to Abraham Lopez-Miguel, Jose A. Cabello-Mendez, Jose T. Perez-Quiroz, and Jose M. Machorro-Lopez, respectively, through “Sistema Nacional de Investigadoras e Investigadores” (SNII)-SECIHTI-México.
Data Availability Statement
The original contributions presented in this study are included in the article. Further inquiries can be directed to the corresponding author.
Acknowledgments
The authors thank the Mexican Institute of Transportation’s staff members who supported the processes necessary to carry out the projects and laboratory activities: Martha Elva Pérez Ramos of the Universidad Autónoma de Querétaro for her support with de grinding of the fly ash, Mario Antonio Pérez González for the preparation of the concrete items, the support of Carlos Daniel Martínez Martínez for carrying out the compressive strength tests, and the technical assistance of Maura Arroyo Olvera in the SEM analyses.
Conflicts of Interest
The authors declare no conflicts of interest.
Abbreviations
The following abbreviations are used in this manuscript:
| WFA | Without Fly Ash |
| NFA | Natural Fly Ash |
| GFA | Ground Fly Ash |
References
- Marvila, M.T.; de Azevedo, A.R.G.; de Matos, P.R.; Monteiro, S.N.; Vieira, C.M.F. Materials for Production of High and Ultra-High Performance Concrete: Review and Perspective of Possible Novel Materials. Materials 2021, 14, 4304. [Google Scholar] [CrossRef] [Scilit]
- Akarsh, P.K.; Shrinidhi, D.; Marathe, S.; Bhat, A.K. Graphene Oxide as Nano-Material in Developing Sustainable Concrete—A Brief Review. Mater. Today Proc. 2022, 60, 234–246. [Google Scholar] [CrossRef] [Scilit]
- Ye, J.; Cui, C.; Yu, J.; Yu, K.; Dong, F. Effect of Polyethylene Fiber Content on Workability and Mechanical-Anisotropic Properties of 3D Printed Ultra-High Ductile Concrete. Constr. Build. Mater. 2021, 281, 122586. [Google Scholar] [CrossRef] [Scilit]
- Tamanna, K.; Raman, S.N.; Jamil, M.; Hamid, R. Coal Bottom Ash as Supplementary Material for Sustainable Construction: A Comprehensive Review. Constr. Build. Mater. 2023, 389, 131679. [Google Scholar] [CrossRef] [Scilit]
- Al-Jabari, M. Concrete Durability Problems: Physicochemical and Transport Mechanisms. In Integral Waterproofing of Concrete Structures; Elsevier: Amsterdam, The Netherlands, 2022; pp. 69–107. [Google Scholar]
- Bayliss, C.R.; Hardy, B.J. Substation and Overhead Line Foundations. In Transmission and Distribution Electrical Engineering; Elsevier: Amsterdam, The Netherlands, 2012; pp. 615–632. [Google Scholar]
- Bai, J. Durability of Sustainable Concrete Materials. In Sustainability of Construction Materials; Elsevier: Amsterdam, The Netherlands, 2009; pp. 239–253. [Google Scholar]
- Tang, S.W.; Yao, Y.; Andrade, C.; Li, Z.J. Recent Durability Studies on Concrete Structure. Cem. Concr. Res. 2015, 78, 143–154. [Google Scholar] [CrossRef] [Scilit]
- Son, D.-H.; Bae, B.-I.; Choi, C.-S. Shear Strength Evaluation of Diagonally Reinforced Concrete Coupling Beams with Steel Fibers. ACI Struct. J. 2022, 119, 291. [Google Scholar] [CrossRef] [Scilit]
- Xu, L.; Li, B.; Ding, X.; Chi, Y.; Li, C.; Huang, B.; Shi, Y. Experimental Investigation on Damage Behavior of Polypropylene Fiber Reinforced Concrete under Compression. Int. J. Concr. Struct. Mater. 2018, 12, 68. [Google Scholar] [CrossRef] [Scilit]
- Son, D.-H.; Bae, B.-I.; Lee, M.-S.; Lee, M.-S.; Choi, C.-S. Flexural Strength of Composite Deck Slab with Macro Synthetic Fiber Reinforced Concrete. Appl. Sci. 2021, 11, 1662. [Google Scholar] [CrossRef] [Scilit]
- Reches, Y. Nanoparticles as Concrete Additives: Review and Perspectives. Constr. Build. Mater. 2018, 175, 483–495. [Google Scholar] [CrossRef] [Scilit]
- Gamal, H.A.; El-Feky, M.S.; Alharbi, Y.R.; Abadel, A.A.; Kohail, M. Enhancement of the Concrete Durability with Hybrid Nano Materials. Sustainability 2021, 13, 1373. [Google Scholar] [CrossRef] [Scilit]
- Sridhar, R.; Aosai, P.; Imjai, T.; Setkit, M.; Shirkol, A.; Laory, I. Influence of Nanoparticles and PVA Fibers on Concrete and Mortar on Microstructural and Durability Properties. Fibers 2024, 12, 54. [Google Scholar] [CrossRef] [Scilit]
- Jenima, J.; Priya Dharshini, M.; Ajin, M.L.; Jebeen Moses, J.; Retnam, K.P.; Arunachalam, K.P.; Avudaiappan, S.; Arrue Munoz, R.F. A Comprehensive Review of Titanium Dioxide Nanoparticles in Cementitious Composites. Heliyon 2024, 10, e39238. [Google Scholar] [CrossRef] [Scilit]
- Saloma; Nasution, A.; Imran, I.; Abdullah, M. Improvement of Concrete Durability by Nanomaterials. Procedia Eng. 2015, 125, 608–612. [Google Scholar] [CrossRef] [Scilit]
- Raveendran, N.; Krishnan, V. Engineering Performance and Environmental Assessment of Sustainable Concrete Incorporating Nano Silica and Metakaolin as Cementitious Materials. Sci. Rep. 2025, 15, 1482. [Google Scholar] [CrossRef] [Scilit]
- Ma, J.; Wang, D.; Zhao, S.; Duan, P.; Yang, S. Influence of Particle Morphology of Ground Fly Ash on the Fluidity and Strength of Cement Paste. Materials 2021, 14, 283. [Google Scholar] [CrossRef] [Scilit] [PubMed]
- Ma, J.; Zhang, H.; Wang, D.; Wang, H.; Chen, G. Rheological Properties of Cement Paste Containing Ground Fly Ash Based on Particle Morphology Analysis. Crystals 2022, 12, 524. [Google Scholar] [CrossRef] [Scilit]
- Amran, M.; Fediuk, R.; Murali, G.; Avudaiappan, S.; Ozbakkaloglu, T.; Vatin, N.; Karelina, M.; Klyuev, S.; Gholampour, A. Fly Ash-Based Eco-Efficient Concretes: A Comprehensive Review of the Short-Term Properties. Materials 2021, 14, 4264. [Google Scholar] [CrossRef] [Scilit] [PubMed]
- Liu, J.; Liu, J.; Huang, Z.; Zhu, J.; Liu, W.; Zhang, W. Effect of Fly Ash as Cement Replacement on Chloride Diffusion, Chloride Binding Capacity, and Micro-Properties of Concrete in a Water Soaking Environment. Appl. Sci. 2020, 10, 6271. [Google Scholar] [CrossRef] [Scilit]
- Sugandhini, H.K.; Nayak, G.; Shetty, K.K.; Kudva, L.P. The Durability of High-Volume Fly Ash-Based Cement Composites with Synthetic Fibers in a Corrosive Environment: A Long-Term Study. Sustainability 2023, 15, 11481. [Google Scholar] [CrossRef] [Scilit]
- Kumar, M.; Sinha, A.K.; Kujur, J. Mechanical and Durability Studies on High-volume Fly-ash Concrete. Struct. Concr. 2021, 22, E1036–E1049. [Google Scholar] [CrossRef] [Scilit]
- Sivasundaram, V.; Carette, G.G.; Malhotra, V.M. Long-Term Strength Development of High-Volume Fly Ash Concrete. Cem. Concr. Compos. 1990, 12, 263–270. [Google Scholar] [CrossRef] [Scilit]
- Choi, Y.-C. Hydration and Mechanical Properties of High-Volume Fly Ash Cement under Different Curing Temperatures. Materials 2024, 17, 4716. [Google Scholar] [CrossRef] [Scilit]
- ASTM C150; ASTM Standard ASTM C150 Standard Specification for Portland Cement. ASTM: West Conshohocken, PA, USA, 2020.
- Belmonte, M.R.; Fernández Jiménez, A.; Palomo Sanchez, Á.; Martínez Madrid, M.; Torres Acosta, A.; Pérez Quiroz, J.T. Desarrollo de Nuevos Cementos “Cementos Alcalinos y Cementos Híbridos”; Instituto Mexicano del Transporte: San Fandila, Mexico, 2015.
- ASTM C311; Standard Test Methods for Sampling and Testing Fly Ash or Natural Puzzolans for Use in Portland-Cement Concrete. ASTM: West Conshohocken, PA, USA, 2018.
- ASTM C192/192M-19; Practice for Making and Curing Concrete Test Specimens in the Laboratory. ASTM International: West Conshohocken, PA, USA, 2019.
- ONNCCE. NMX-C-159-ONNCCE-2016 Industria de La Construcción—Concreto -Elaboración y Curado de Especímenes de Ensayo-Building Industry-Concrete-Making and Curing Test Specimens; ONNCCE: Benito Juárez, Mexico, 2016. [Google Scholar]
- ASTM G57-20; Standard Test Method for Measurement of Soil Resistivity Using the Wenner Four-Electrode Method. ASTM: West Conshohocken, PA, USA, 2020.
- Neville, A.M. Propierties of Concrete, 5th ed.; Pearson Education: London, UK, 2013. [Google Scholar]
- ASTM C 597-02; Standard Test Method for Pulse Velocity Through Concrete. ASTM: West Conshohocken, PA, USA, 2002.
- ONNCE. NMX-C-275-ONNCCE-2019 Determinación de La Velocidad de Pulso Ultrasónico a Través Del Concreto. Método de Ensayo; ONNCCE: Benito Juárez, Mexico, 2019. [Google Scholar]
- ASTM C642-21; Standard Test Method for Density, Absorption, and Voids in Hardened Concrete. ASTM: West Conshohocken, PA, USA, 2021.
- Jiménez, L.F.; Moreno, E.I. Durability Indicators in High Absorption Recycled Aggregate Concrete. Adv. Mater. Sci. Eng. 2015, 2015, 505423. [Google Scholar] [CrossRef] [Scilit]
- CEB. Strategies for Testing and Assessment of Concrete Structures Affected by Reinforcement Corrosion; CEB: Lausanne, Switzerland, 1998. [Google Scholar]
- Trocolis de Rincon, O.; Romero de Carruyo, A.; Andrade, C.; Helene, P.; Diaz, I. Manual de Inspección, Evaluación y Diagnóstico de Corrosión En Estructuras de Hormigón Armado, 3rd ed.; CYTED: Cambridge, UK, 2000. [Google Scholar]
- ASTM C1585-20; Standard Test Method for Measurement of Rate of Absorption of Water by Hydraulic-Cement Concretes. ASTM: West Conshohocken, PA, USA, 2020.
- ASTM C39/C39M-21; Standard Test Method for Compressive Strength of Cylindrical Concrete Specimens. ASTM: West Conshohocken, PA, USA, 2021.
- Roberts, M.H. Carbonation of Concrete Made with Dense Natural Aggregates; BRE Archive: Herts, UK, 1981; Volume 86. [Google Scholar]
- RILEM TC. RILEM Recommendations for the Testing and Use of Constructions Materials/CPC 18 Measurement of Hardened Concrete Carbonation Depth, 1988; RILEM: Pasay, Philippines, 1994. [Google Scholar]
- ONNCCE. Normas mexicanas NMX-C-515-ONNCCE-2016. Determinación de La Profundidad de Carbonatación En Concreto Hidraulico-Especificaciones y Método de Ensayo; ONNCCE: Benito Juárez, Mexico, 2016. [Google Scholar]
- ASTM C1202-22; Standard Test Method for Electrical Indication of Concrete’s Ability to Resist Chloride Ion Penetration. ASTM: West Conshohocken, PA, USA, 2022.
- Bautista-Ruiz, W.A.; Díaz-Lagos, M.; Martínez-Ovalle, S.A. Caracterización de Las Cenizas Volantes de Una Planta Termoeléctrica Para Su Posible Uso Como Aditivo En La Fabricación de Cemento. Rev. de Investig. Desarro. e Innov. 2017, 8, 135–146. [Google Scholar] [CrossRef] [Scilit]
- Zhuang, C.; Chen, Y. The Effect of Nano-SiO2 on Concrete Properties: A Review. Nanotechnol. Rev. 2019, 8, 562–572. [Google Scholar] [CrossRef] [Scilit]
- Golewski, G.L. The Role of Pozzolanic Activity of Siliceous Fly Ash in the Formation of the Structure of Sustainable Cementitious Composites. Sustain. Chem. 2022, 3, 520–534. [Google Scholar] [CrossRef] [Scilit]
- Fernández-Jiménez, A.; Palomo, A. Characterisation of Fly Ashes. Potential Reactivity as Alkaline Cements. Fuel 2003, 82, 2259–2265. [Google Scholar] [CrossRef] [Scilit]
- Peña Rodríguez, G.; Ortega Triana, L.R. Caracterización Morfológica y Estructural de Polvos de Cenizas Volantes. Ing. Investig. y Desarro. 2014, 14, 14. [Google Scholar] [CrossRef] [Scilit]
- ONNCCE. Normas Mexicanas NMX-C-514-ONNCCE-2019 Industria de La Construcción-Resistividad Eléctrica Del Concreto Hidráulico-Especificaciones y Métodos de Ensayo; ONNCCE: Benito Juárez, Mexico, 2019. [Google Scholar]
- Saraswathy, V.; Muralidharan, S.; Thangavel, K.; Srinivasan, S. Influence of Activated Fly Ash on Corrosion-Resistance and Strength of Concrete. Cem. Concr. Compos. 2003, 25, 673–680. [Google Scholar] [CrossRef] [Scilit]
- Khatib, J.M. Performance of Self-Compacting Concrete Containing Fly Ash. Constr. Build. Mater. 2008, 22, 1963–1971. [Google Scholar] [CrossRef] [Scilit]
- Guevara Fallas, G.; Hidalgo Madrigal, C.; Pizarro García, M.; Rodríguez Valenciano, I.; Rojas Vega, L.D.; Segura Guzmán, G. Efecto de La Variación Agua/Cemento En El Concreto. Rev. Tecnol. en Marcha 2012, 25, 80. [Google Scholar] [CrossRef] [Scilit]
- Ltifi; Guefrech, A.; Mounanga, P.; Khelidj, A. Experimental Study of the Effect of Addition of Nano-Silica on the Behaviour of Cement Mortars Mounir. Procedia Eng. 2011, 10, 900–905. [Google Scholar] [CrossRef] [Scilit]
- Yuan, Y.; Niu, K.; Tian, B.; Li, L.; Ji, J.; Feng, Y. Effect of Metakaolin on the Microstructural and Chloride Ion Transport Properties of Concrete in Ocean Wave Splashing Zones. Materials 2022, 16, 7. [Google Scholar] [CrossRef] [Scilit]
- Dinakar, P.; Kartik Reddy, M.; Sharma, M. Behaviour of Self Compacting Concrete Using Portland Pozzolana Cement with Different Levels of Fly Ash. Mater. Des. (1980–2015) 2013, 46, 609–616. [Google Scholar] [CrossRef] [Scilit]
- López, M.; Castro, J.T. Efecto de Las Puzolanas Naturales En La Porosidad y Conectividad de Poros Del Hormigón Con El Tiempo. Rev. Ing. de Constr. 2010, 25, 419–431. [Google Scholar] [CrossRef] [Scilit]
- Kim, S.-S.; Hooton, R.D.; Cho, T.-J.; Lee, J.-B. Comparison of Innovative Nano Fly Ash with Conventional Fly Ash and Nano-Silica. Can. J. Civ. Eng. 2014, 41, 396–402. [Google Scholar] [CrossRef] [Scilit]
- Huaquisto Cáceres, S.; Belizario Quispe, G. Utilización de La Ceniza Volante En La Dosificación Del Concreto Como Sustituto Del Cemento. Rev. Investig. Altoandinas J. High Andean Res. 2018, 20, 225–234. [Google Scholar] [CrossRef] [Scilit]
- Ahmad, S.; Assaggaf, R.A.; Maslehuddin, M.; Al-Amoudi, O.S.B.; Adekunle, S.K.; Ali, S.I. Effects of Carbonation Pressure and Duration on Strength Evolution of Concrete Subjected to Accelerated Carbonation Curing. Constr. Build. Mater. 2017, 136, 565–573. [Google Scholar] [CrossRef] [Scilit]
- Wang, X.; Guo, M.-Z.; Ling, T.-C. Review on CO2 Curing of Non-Hydraulic Calcium Silicates Cements: Mechanism, Carbonation and Performance. Cem. Concr. Compos. 2022, 133, 104641. [Google Scholar] [CrossRef] [Scilit]
- Belayneh, G.B.; Kim, N.; Seo, J.; Kim, H.; Park, S.; Son, H.M.; Park, S. Effect of Fly Ash on Hydration and Carbonation of Carbonation-Cured Portland Cements. J. CO2 Util. 2024, 88, 102943. [Google Scholar] [CrossRef] [Scilit]
- Aguayo, F.; Torres, A.; Kim, Y.-J.; Thombare, O. Accelerated Carbonation Assessment of High-Volume Fly Ash Concrete. J. Mater. Sci. Chem. Eng. 2020, 8, 23–38. [Google Scholar] [CrossRef]

Disclaimer/Publisher’s Note: The statements, opinions and data contained in all publications are solely those of the individual author(s) and contributor(s) and not of MDPI and/or the editor(s). MDPI and/or the editor(s) disclaim responsibility for any injury to people or property resulting from any ideas, methods, instructions or products referred to in the content. |
© 2026 by the authors. Licensee MDPI, Basel, Switzerland. This article is an open access article distributed under the terms and conditions of the Creative Commons Attribution (CC BY) license.