


Abstract
The abrupt failure of shear-deficient RC beams may lead to harmful consequences under dynamic loading. The use of Carbon Fiber Reinforced Polymers (CFRP) aims to convert this brittle fracture into a ductile one. However, the complexity of the multiple damage mechanisms makes it difficult to assess their condition using conventional testing methods. In this study, the damage evolution of a shear-critical reference beam and its CFRP-strengthened counterpart was monitored using the acoustic emission (AE) technique. After correcting attenuated AE amplitudes, damage analysis was performed using the Shannon entropy approach based on true source amplitudes. The entropy analysis performed with these corrected data clearly revealed the shear failure in the reference beam through abrupt drops in entropy, indicating damage homogenization. In contrast, the entropy remaining high and dynamically varying over a much longer deflection range in the CFRP-strengthened beam demonstrated that CFRP distributes damage over a wider region and that different damage mechanisms, such as debonding and fiber breakage, in addition to concrete cracking, were simultaneously active.
1. Introduction
One of the most critical structural deficiencies of reinforced concrete (RC) members under seismic effects is brittle shear failure primarily induced by insufficient transverse reinforcement. Structures designed in accordance with older seismic codes or characterized by deficient detailing are highly susceptible to sudden and catastrophic collapse during earthquakes. Inadequate shear reinforcement, in particular, stands out as one of the most critical structural deficiencies leading to sudden and brittle fracture in RC beams without any prior warning [1]. The application of Carbon Fiber Reinforced Polymer (CFRP) provides an effective strengthening strategy [2,3,4]. Effects of CFRP strengthening on mechanical behavior are multifaceted. Experimental studies show that CFRP application significantly increases load-carrying capacity, initial rigidity, and energy absorption capacity [5]. In addition, CFRP strengthening also functions to transform the fracture mechanism to ductile failure due to reinforcement yielding becoming dominant, resulting in distributed damage. However, the most commonly observed fracture mode in CFRP material bonded to the external surface is debonding or delamination resulting from incompatibility at the CFRP–concrete interface. This prevents the full utilization of CFRP’s potential mechanical capacity and negatively affects strengthening efficiency [6]. However, since the failure of CFRP-strengthened components is complex and consists of multiple damage mechanisms such as concrete cracking, interfacial debonding, and fiber breakage, conventional test methodologies are often insufficient to provide a comprehensive evaluation of these types of damage progression [7,8].
Acoustic Emission (AE) technology stands out as an effective non-destructive testing method in structural health monitoring, enabling real-time and continuous monitoring of damage mechanisms. The method is frequently used in different fields such as civil and mechanical engineering, aircraft, nuclear, and pressure vessel industries to detect cracks, delaminations, or leakages [9,10,11]. Different sources of damage in composite materials, such as matrix cracking, delamination, and fiber breakage, can be distinguished from one another through the characteristics of the recorded AE signals [12,13,14,15,16,17]. However, the heterogeneous nature of materials like concrete causes significant wave dispersion and attenuation, leading to signal deterioration and velocity changes that reduce inspection accuracy [18,19]. Studies indicate that aggregate geometry [20], interface bonding conditions [21], and void ratios [22,23] directly influence wave attenuation. Furthermore, increased volume fractions of inclusions lead to higher dispersion and reduced wave velocities [24]. Despite existing research, the current literature remains insufficient in fully mitigating these propagation challenges for robust damage detection [25,26]. Therefore, the parameter correction approach [27,28,29] can be implemented using Tayfur and Alver’s 3D development for concrete to improve the accuracy of the method [30,31].
In addition to evaluating the basic parameters to quantify the complexity of AE and the damage state of the material tested, various approaches have begun to be used for AE analysis [32,33,34]. As one of these, Shannon entropy is a statistical quantifier used to measure the degree of disorder and randomness of a system [35]. When this theory is integrated with AE signals, which are the output of the stochastic nature of the AE technique, the accumulation of damage in the material can be monitored. Significant changes in entropy values serve as an indicator to predict the failure of the material [36]. Studies have proven that Shannon entropy is a more reliable and consistent parameter in separating damage stages compared to classical AE features [37]. However, its effectiveness on AE signals in concrete is still open to investigation with its limited number of applications [38,39,40,41,42,43]. Moreover, unlike existing studies relying on raw amplitude values, which are inherently biased by sensor proximity, the Parameter Correction Technique (PCT) was also integrated into this study to ensure that the entropy index represents the damage mechanism rather than geometric signal loss.
To fill the gaps in the existing literature, this study investigates the failure mechanisms and damage evolution of a shear-deficient RC beam and its CFRP-strengthened counterpart using AE. The novelty in this study is the application of the Shannon entropy approach not to raw AE data obtained directly from sensors, but to corrected AE data released from attenuation effects. This approach aims to quantitatively characterize how CFRP strengthening transforms the failure behavior of RC beams from brittle shear to a distributed ductile failure.
2. Materials and Methods
2.1. Acoustic Emission (AE)
AE is based on the detection of transient elastic waves emitted by the release of energy due to local fractures within the stressed materials [44]. Sensors placed on the surface of the tested material are utilized to detect these elastic waves. Some parameters used for AE analyses are: hit—a signal that the system records; duration—a time interval between the first and last threshold crossings; count—the number of crossings of the threshold within the duration-; amplitude—a peak voltage of the signal; rise time—a time interval between the triggering time and the time of the peak amplitude; energy—measured area under the rectified signal envelope; and average frequency—a feature obtained from count divided by duration [45].
2.2. 3D Parameter Correction Technique (3D-PCT)
PCT was implemented through a systematic four-stage workflow: (i) Initially, the region of interest is discretized into a mesh, defining the boundaries where the correction procedure will be applied. (ii) To characterize the medium’s attenuation map, artificial AE sources with varying known amplitudes are generated at each node, and the resulting AE parameters are recorded by the sensor array. (iii) Relationships for each sensor are constructed by correlating the known input amplitudes of the artificial sources with the parameters recorded. Required amplitude values can subsequently be estimated through interpolation based on the transmitted–received data obtained from the artificial sources. (iv) During structural testing, real AE events are localized in the PCT mesh. AE events recorded during the actual tests are then localized, and their corresponding input–output relationships are taken from the contour maps. Finally, the recorded AE signal parameters are corrected by applying the appropriate attenuation relationships according to the event location and the relevant sensor.
2.3. Shannon’s Entropy
Introduced by Claude E. Shannon in 1948 within the context of information theory, Shannon entropy quantifies the degree of uncertainty or randomness within a distribution and is widely used as a scalar descriptor of data complexity in various disciplines [35]. For a random sequence , Shannon’s entropy is calculated using Equation (1):
where H is Shannon’s entropy, is the probability mass, and c is a positive constant.
In this context, since AE signals are also random discrete signals, applying Shannon entropy to AE data makes it possible to evaluate the release of damage energy during the structural damage process and thus, to determine statistical variability during the progressive damage evolution. Here, the AE amplitude distribution is discretized with a uniform width spanning. To measure signal complexity, the AE amplitude distribution was decomposed into 10 classes by generating probability distribution functions. This number was chosen to provide an optimal balance between statistical stability and distribution resolution, and to prevent entropy fluctuations that might arise from over-partitioning sparse data. The classification process was performed using a sliding window model, where 20 hits were shifted forward for every 100 AE hits, ensuring an 80% data overlap between sequence windows. This overlap rate was chosen to be high in order to capture transitions in rapid activity formations without losing information. This allowed for continuous monitoring of physical transitions between different damage mechanisms. Finally, x-axis synchronization was performed to relate these hit-based entropy values to structural behavior responses. The entropy value calculated for each window was mapped to the horizontal axis by taking the arithmetic mean of the deflections of corresponding AE hits.
3. Experimental Details
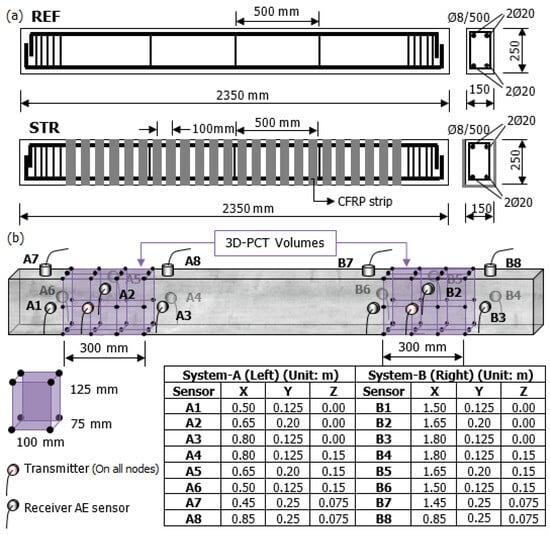
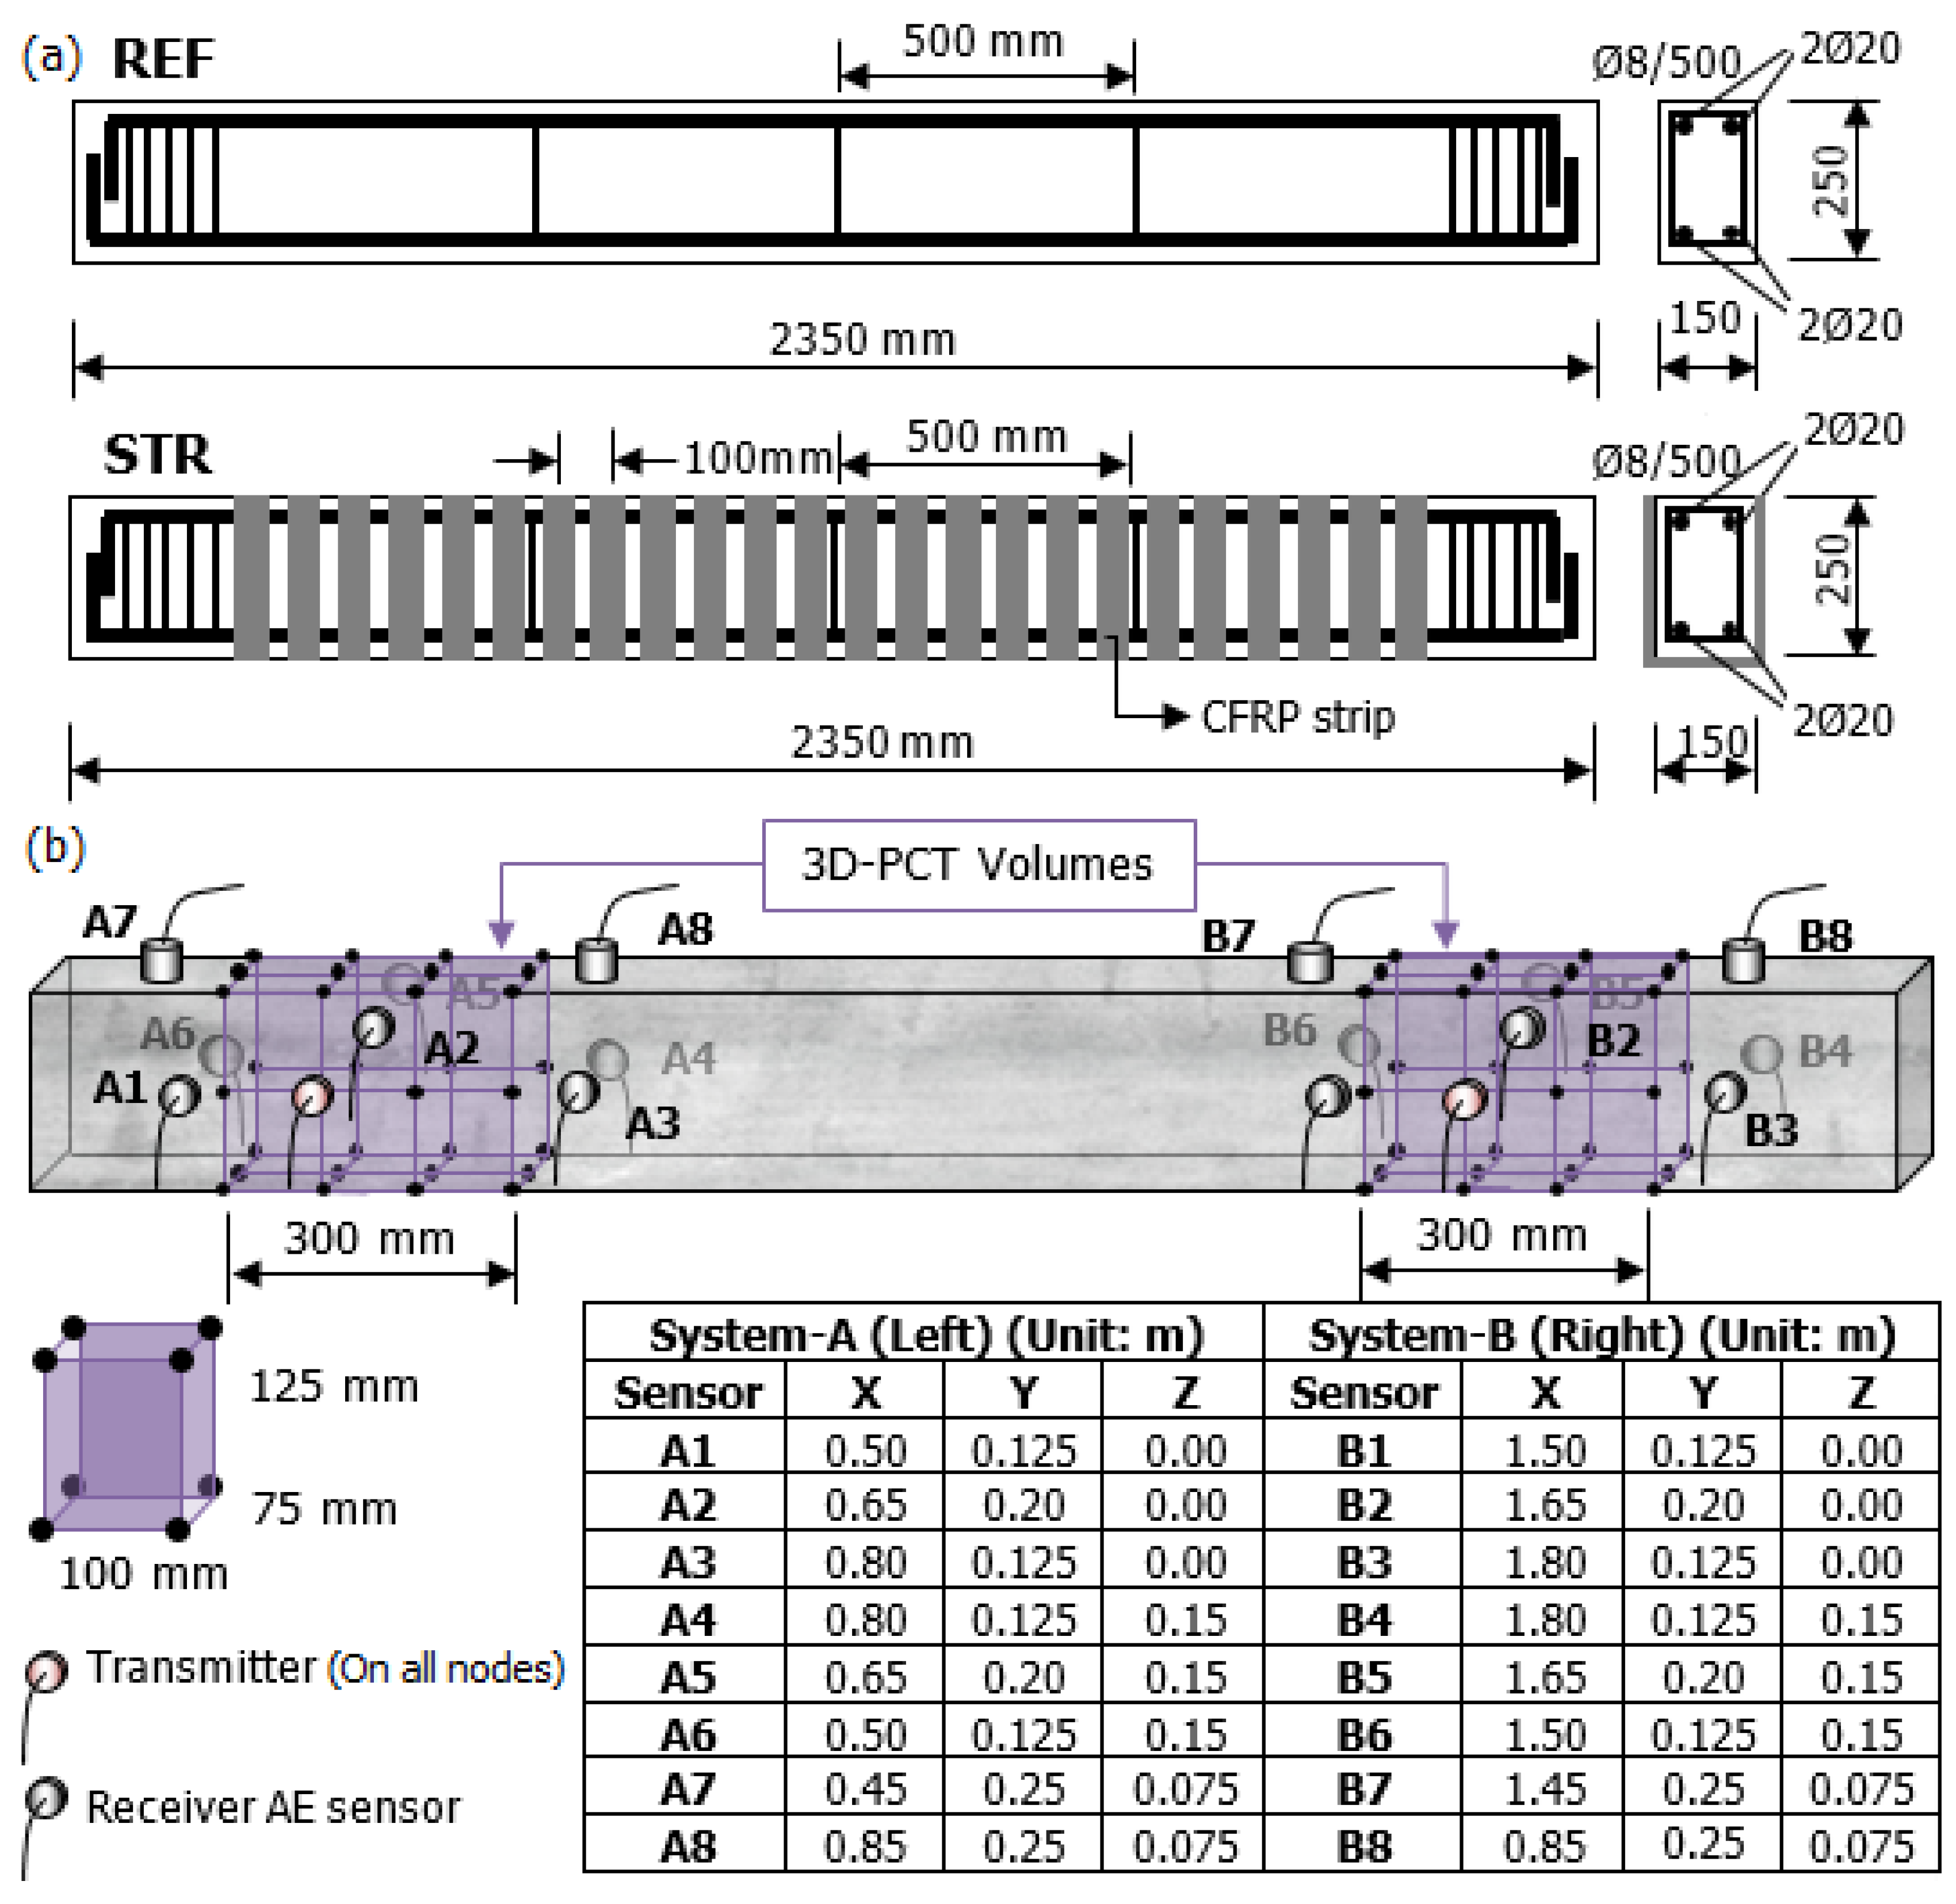
Two 2350 × 250 × 150 mm shear–deficient RC beams were produced and tested under three-point bending. Concrete mix design used for production of the beams (W/C = 0.66) is presented in Table 1. Compressive strength of the standard cylinder concrete was 25 MPa, and S420 steel bars were used as reinforcing bars. The beams were designed for shear failure, containing a total of four 20 mm in diameter longitudinal rebars and 8 mm in diameter stirrups with a spacing of 500 mm. While one of the specimens (REF) was plain RC, the other one (STR) was strengthened with U-shaped CFRP strips having a 50 mm width with a spacing of 100 mm. After sanding the concrete surface, notches were made to ensure mechanical bonding. Then, MasterBrace FIB 300/50 CFS CFRP strips (Master Builders Solutions, Mannheim, Germany) having a tensile strength of 4900 MPa were bonded to the concrete surface in two layers using MasterBrace SAT 4500 (Master Builders Solutions, Mannheim, Germany) two-component epoxy resin (viscosity of 1500–2500 MPa·s) and left to cure at room temperature for 7 days. Reinforcement details of the beams are given in Figure 1a.
Table 1.
Concrete mix design.
Figure 1.
(a) Reinforcement details of the beams, (b) 3D-PCT test setup and locations of AE sensors.
Two 300 mm × 250 mm × 150 mm PCT volumes were created at shear spans of both beams, and 3D-PCT tests were conducted on these volumes, which were divided into 100 mm × 125 mm × 75 mm grids. 1 V, 5 V, 10 V, and 24 V artificial sine wave sources (frequency of 50 kHz) were generated on each test node (64 nodes) by the PCI-5412 Signal Generator (National Instruments, Austin, TX, USA). All artificial sources were recorded by two 8-channel AE systems with sixteen AE sensors by Mistras Group (Princeton Junction, NJ, USA), and the relationships between generated and recorded amplitudes were used to correct AE parameters obtained from three-point bending tests. All sensors were amplified with preamplifiers having 40 dB gain, and the threshold was set as 40 dB to eliminate ambient noise.
4. Results
4.1. Structural Responses
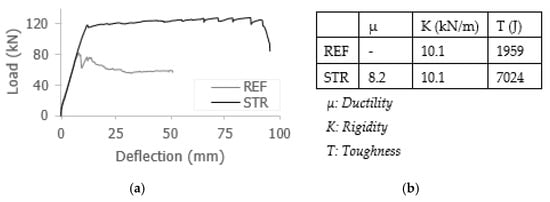
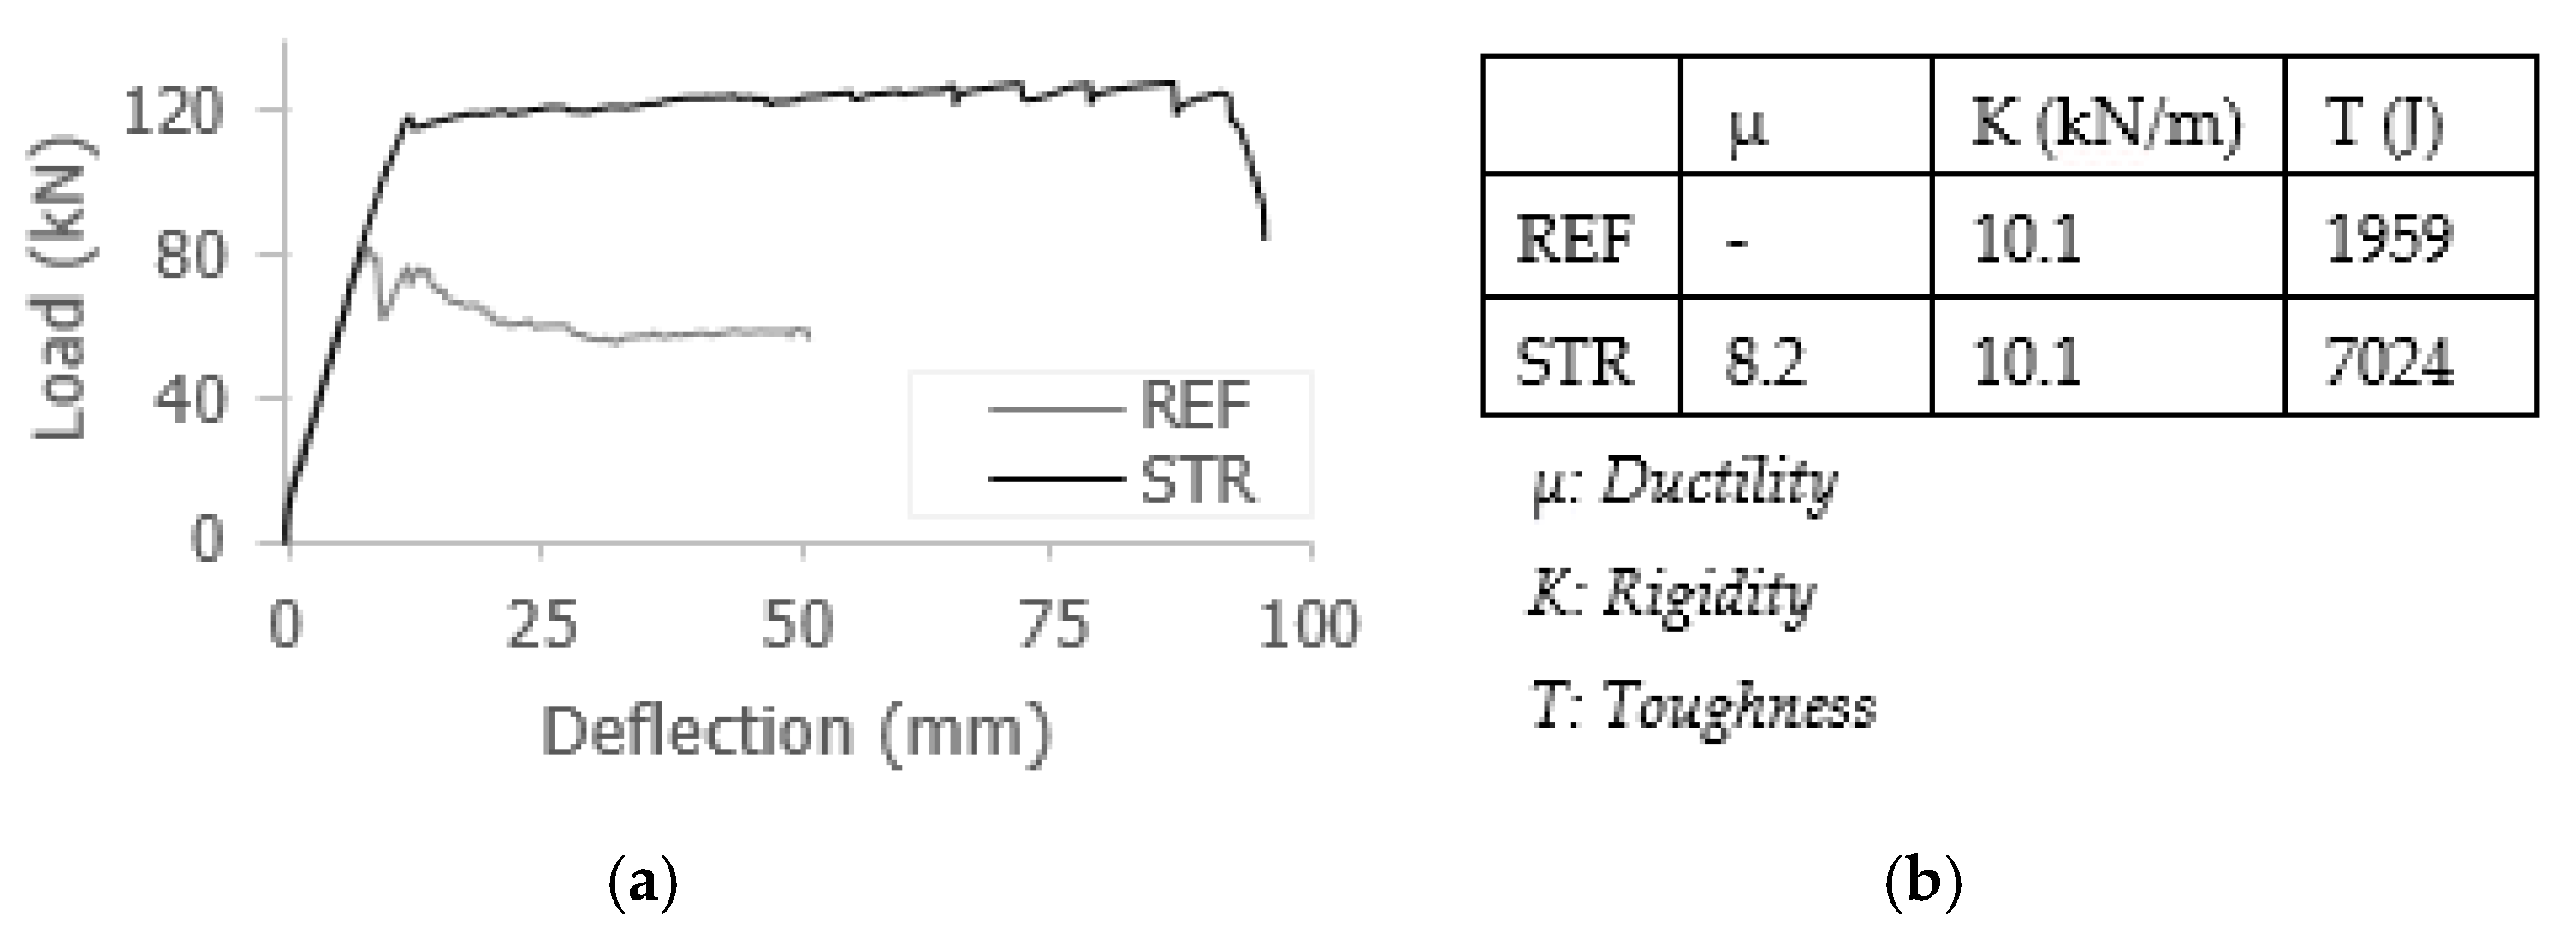
Load-deflection responses of the beams are presented in Figure 2a. In REF, the first flexural crack was observed at a load level of 11 kN and a deflection of 1.4 mm. With increasing load, new cracks formed and existing cracks propagated. The first shear cracks at the left and right shear spans appeared at a load of 79.8 kN and a deflection of 7.6 mm. At a deflection of 49.51 mm, the main shear crack in the left shear span widened significantly, and severe damage developed in this region. The shear-deficient REF beam ultimately failed in shear without yielding, with a maximum deflection of 51 mm.
Figure 2.
(a) Load–displacement curves, (b) mechanical features of the RC beams.
In STR, the first flexural crack was observed at 57 kN load and 5 mm deflection level. As loading progressed, additional cracks formed, and the CFRP strips began to engage. Hairline shear cracks appeared when the load reached approximately 100 kN. The longitudinal reinforcement yielded when the load was measured as 115.95 kN with a corresponding deflection of 11.5 mm. Beyond this stage, CFRP activity intensified, and audible cracking sounds were detected. A CFRP strip located at the mid-span debonded from the concrete surface when the load was 122.30 kN. Subsequently, new cracks formed in the compression zone of this section, and additional strips debonded. A new shear crack developed in the left shear span at a deflection of 95 mm, and the test was terminated due to the deflection limit of the hydraulic jack. Mechanical features of the beams are tabulated in Figure 2b.
4.2. AE Responses
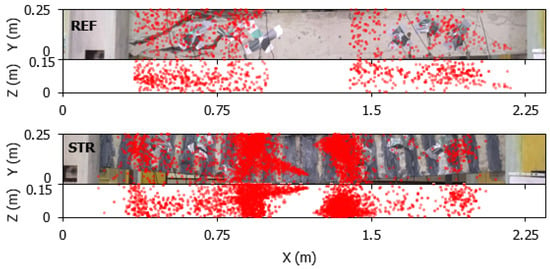
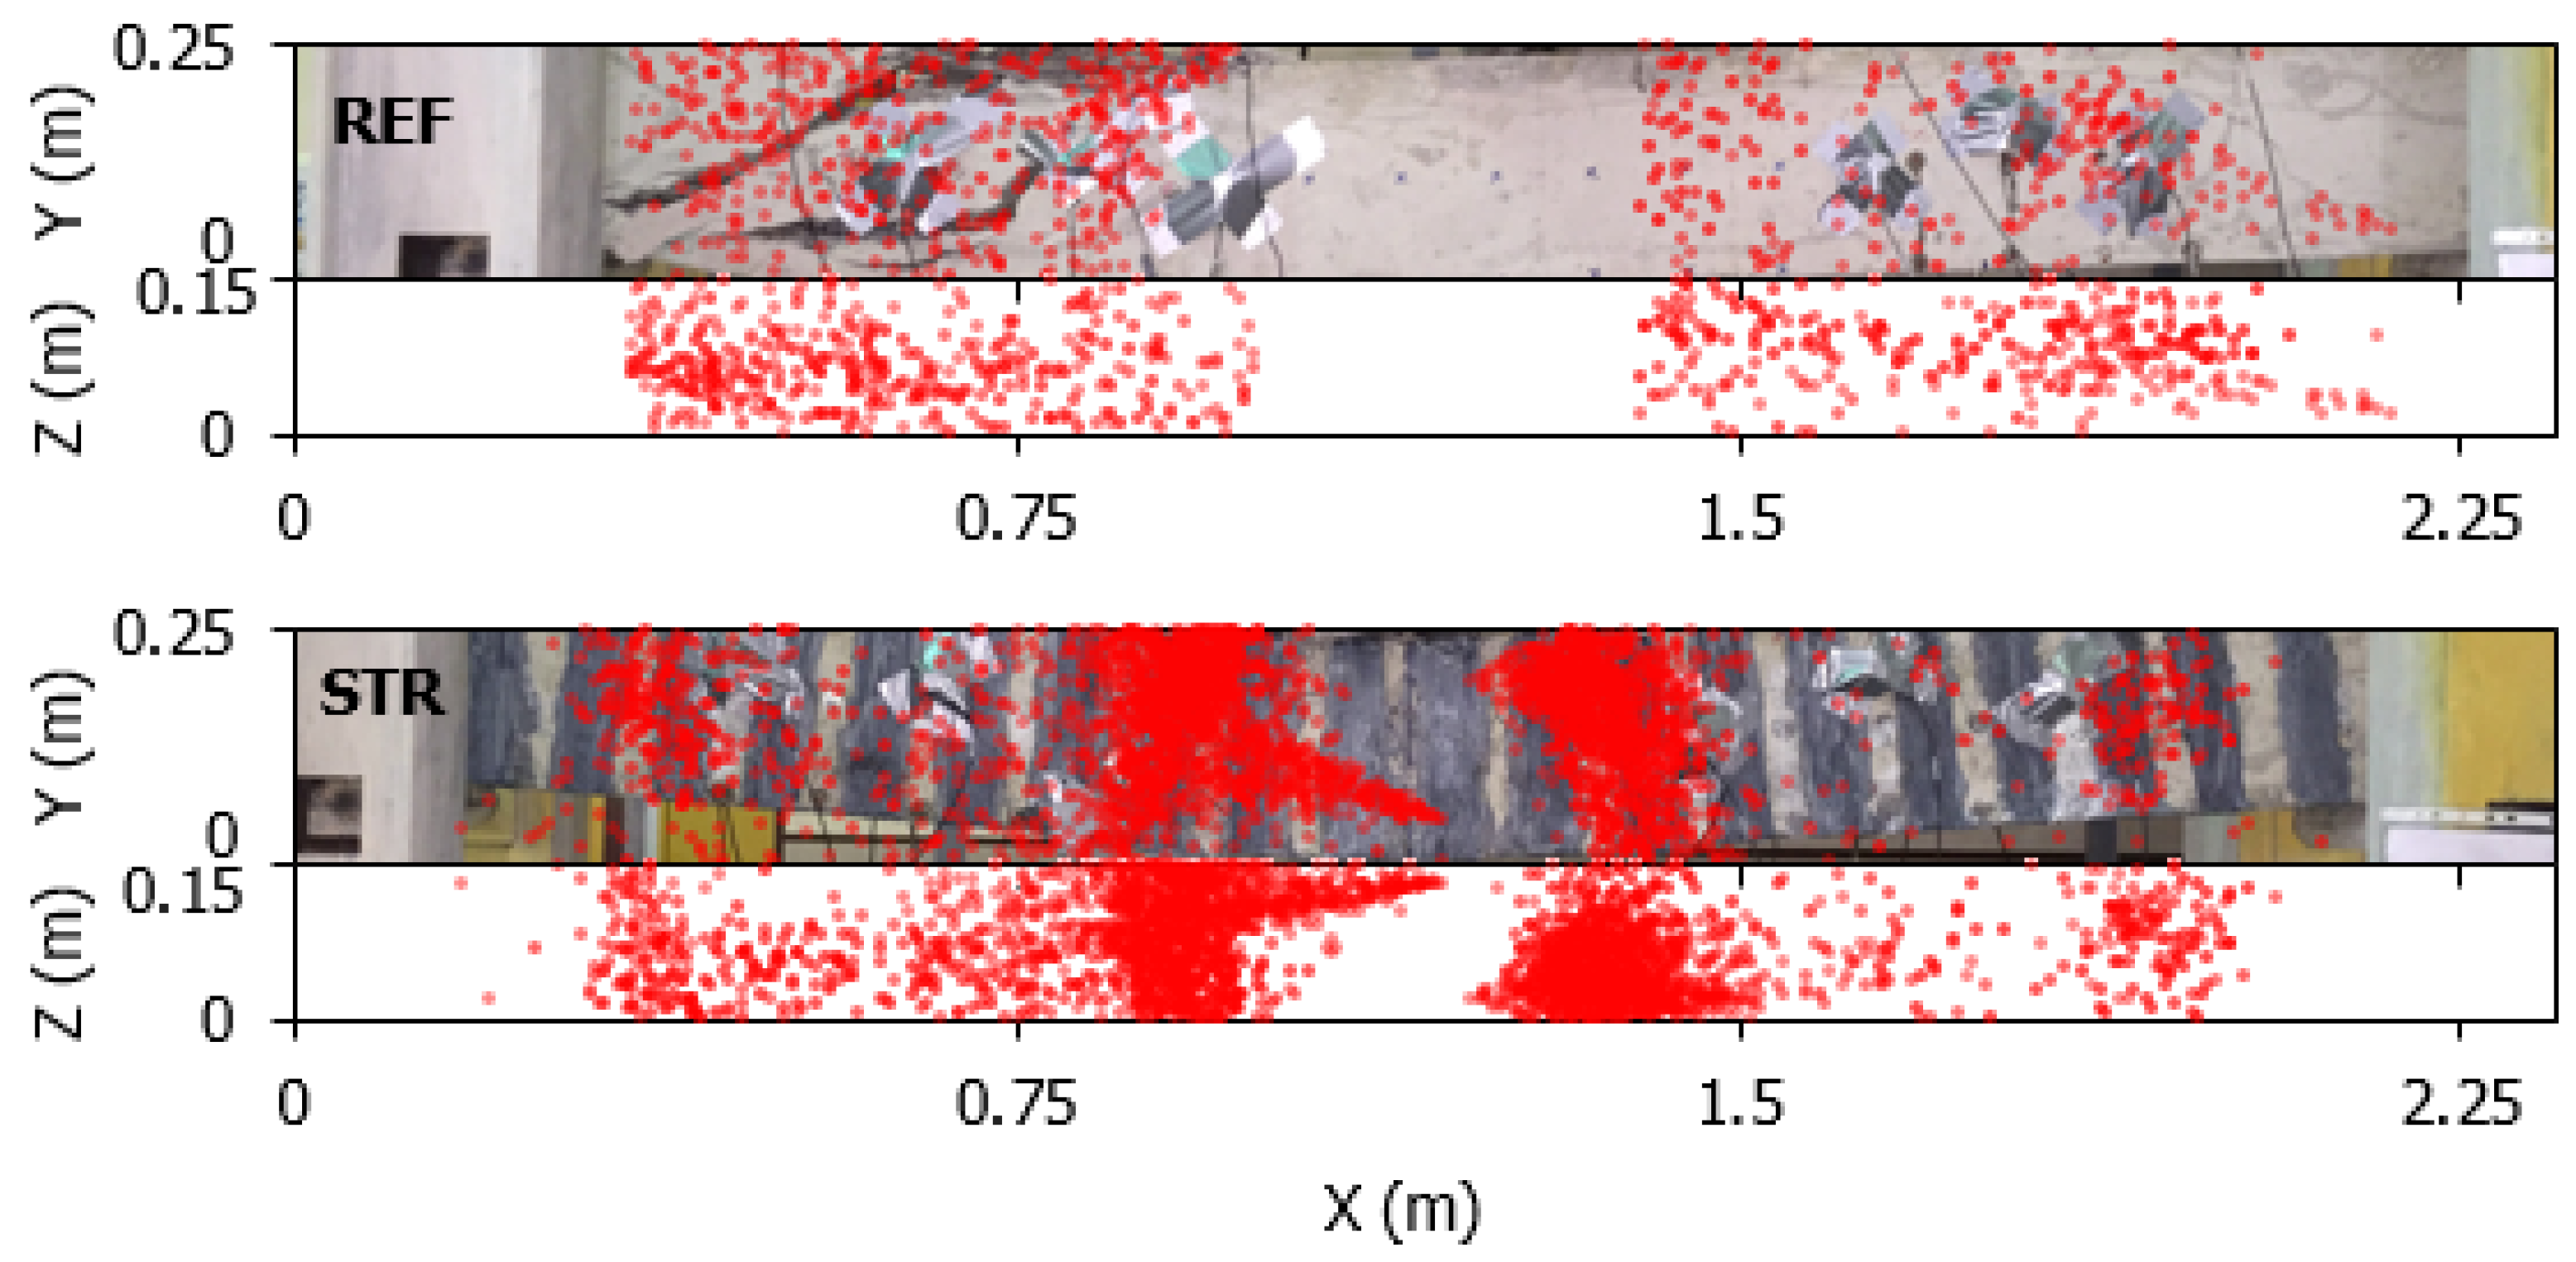
Since the main crack in REF formed on the left side, only the AE data from System A located on that side were analyzed. A total of 4300 and 5722 AE hits were recorded from REF and STR, respectively. Figure 3 presents the failure states of the beams and their damage patterns determined using a 3D AE source localization algorithm using time of arrivals of the signals based on Geiger’s iterative method. Only events recorded by at least four sensors were analyzed for localization. Unlike conventional localization methods, a varying elastic wave velocity model caused by progressive cracking is developed in this study. The wave velocity was initially calibrated through pencil leak break tests and then updated at each calculation step to reflect the degradation of the beam. Consequently, the identified crack locations closely match the visually observed damage. As seen from the figures, AE activity concentrates in regions of high stress, as expected. The AE sources calculated for the REF specimen are located very close to the observed crack locations, whereas the STR specimen exhibits a greater number of AE sources due to its higher energy absorption capacity. These locations of the AE events were used for correction relations.
Figure 3.
Damage patterns of the RC beams: camera shot and 3D AE source localization results.
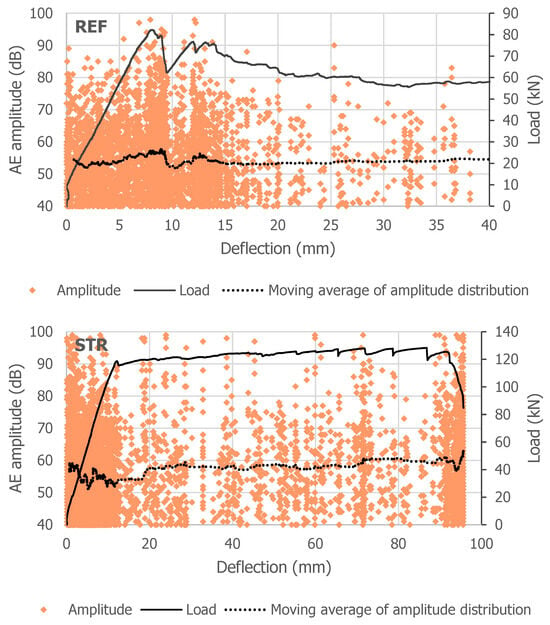
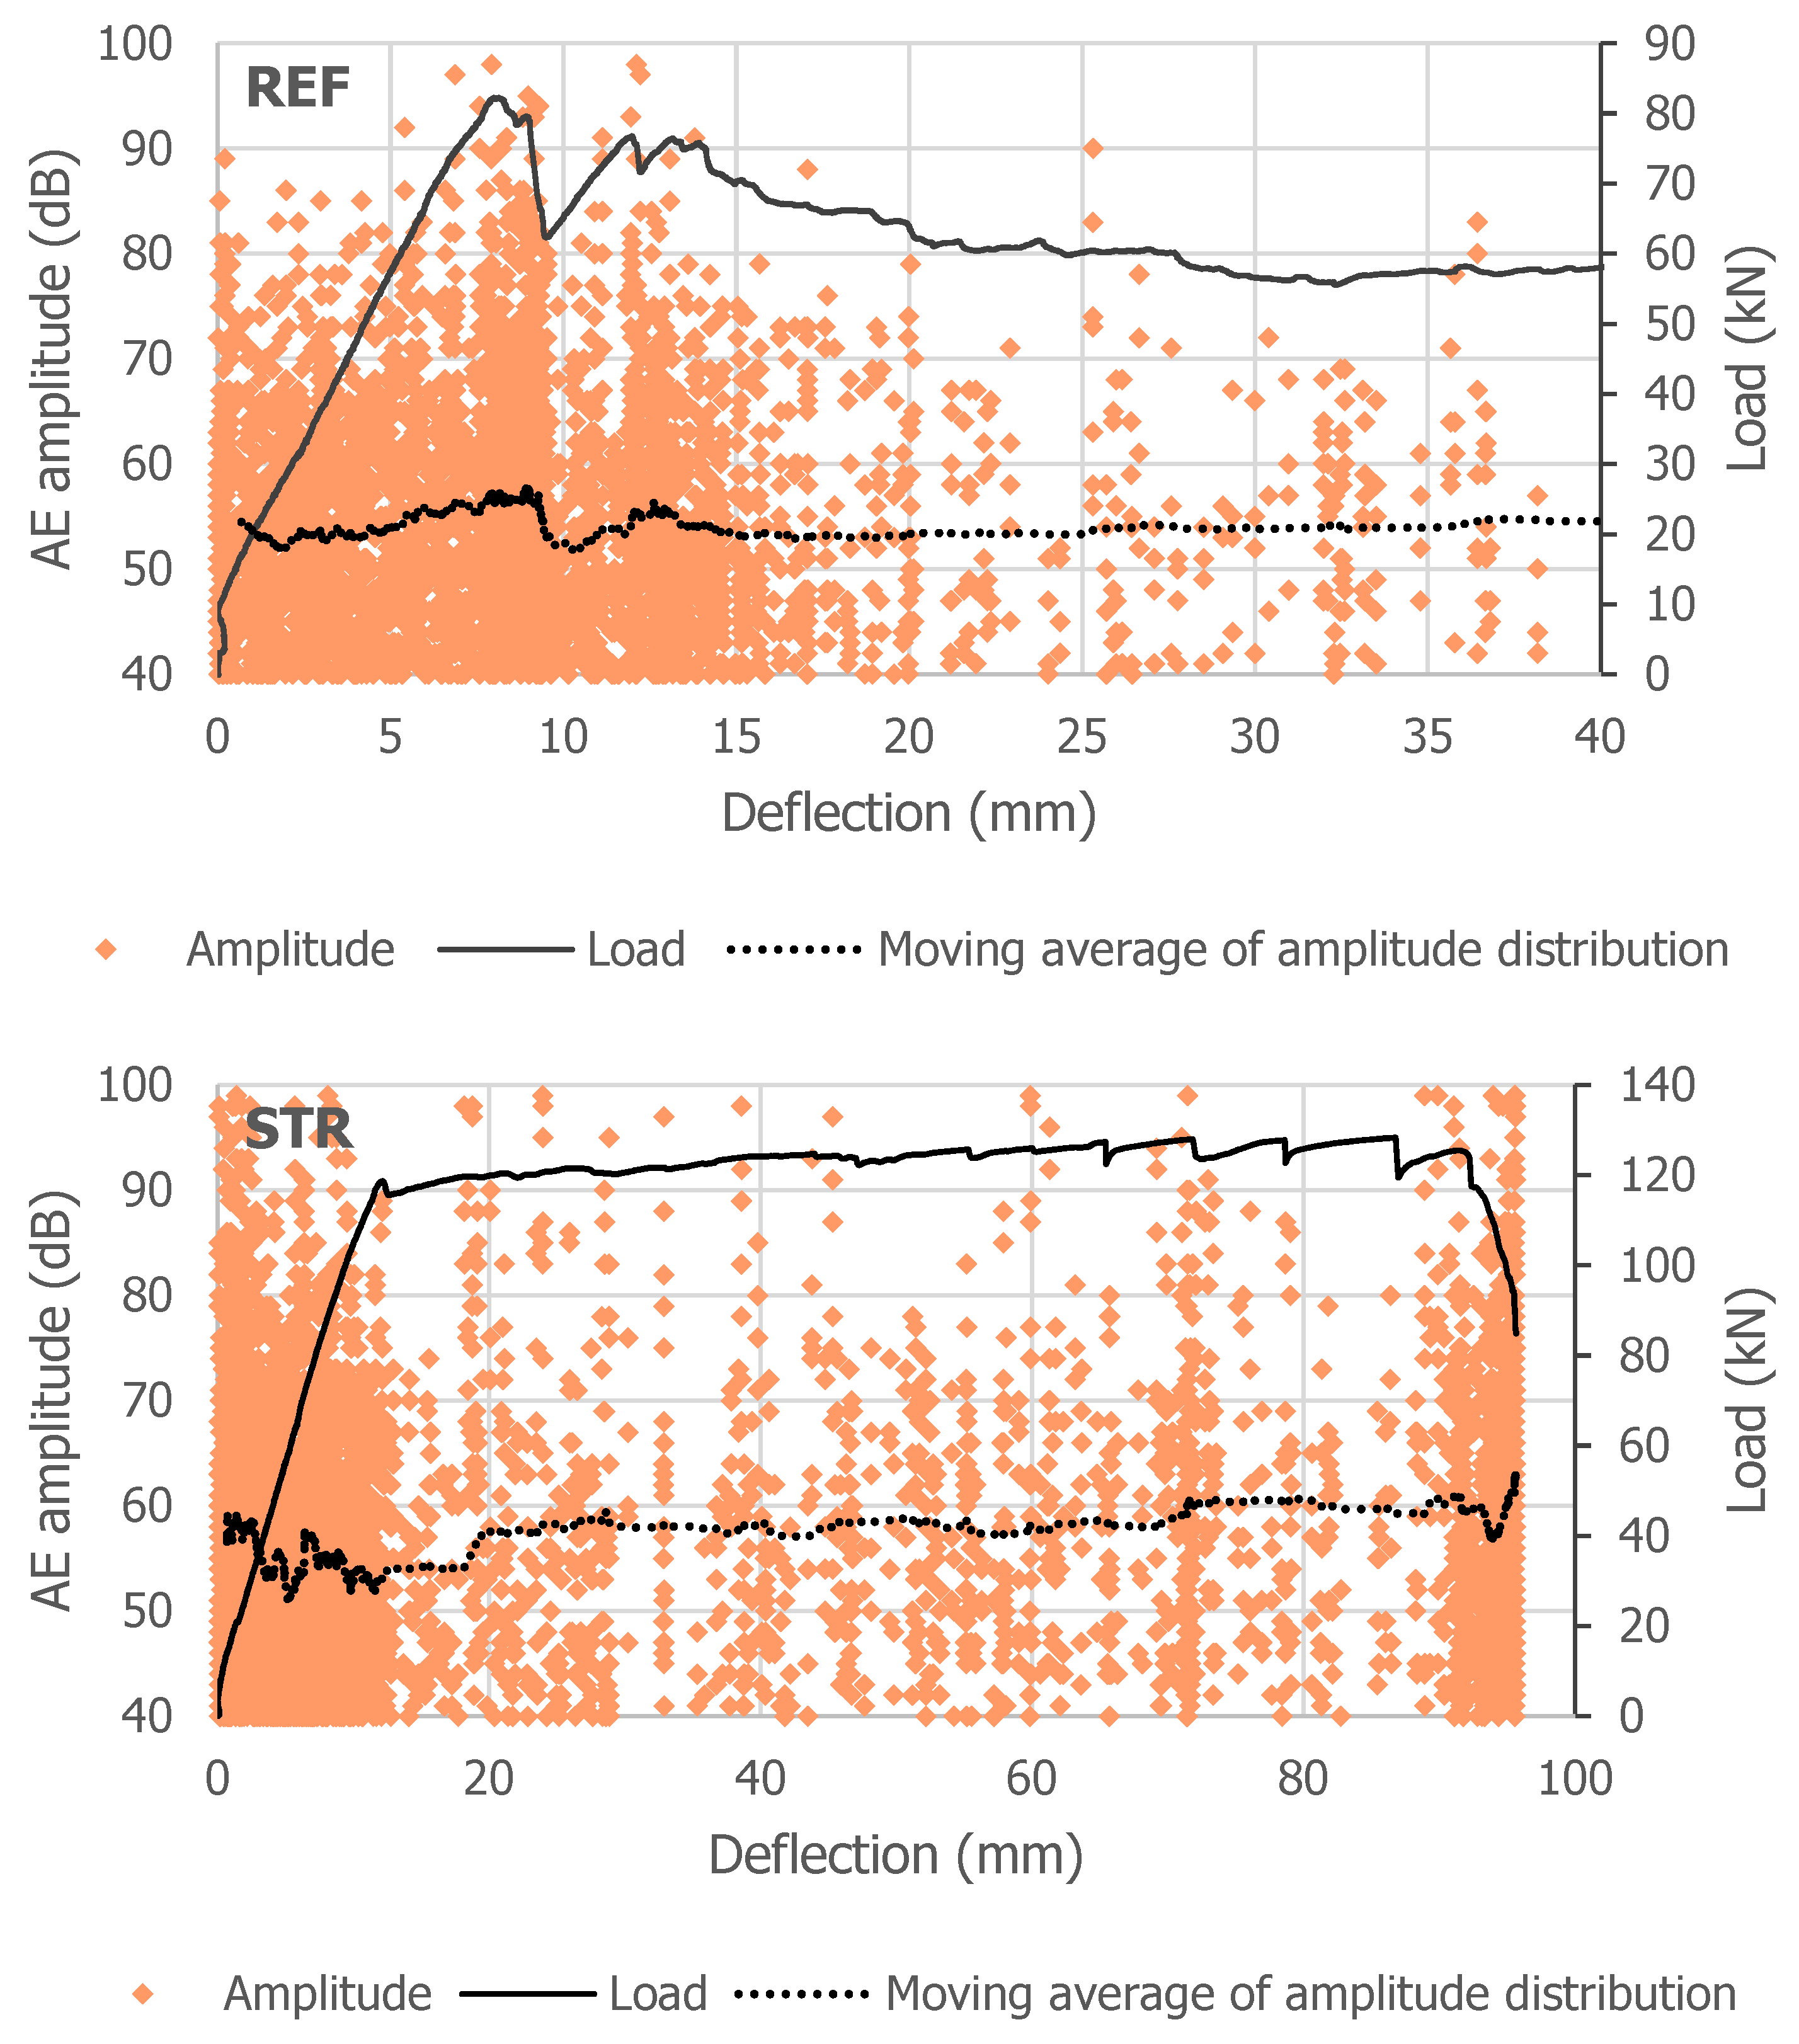
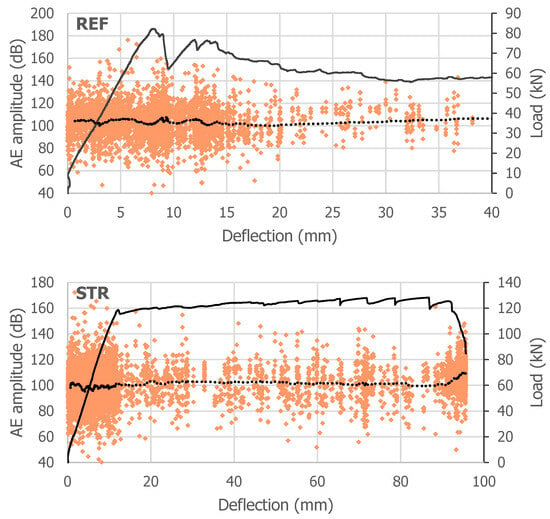
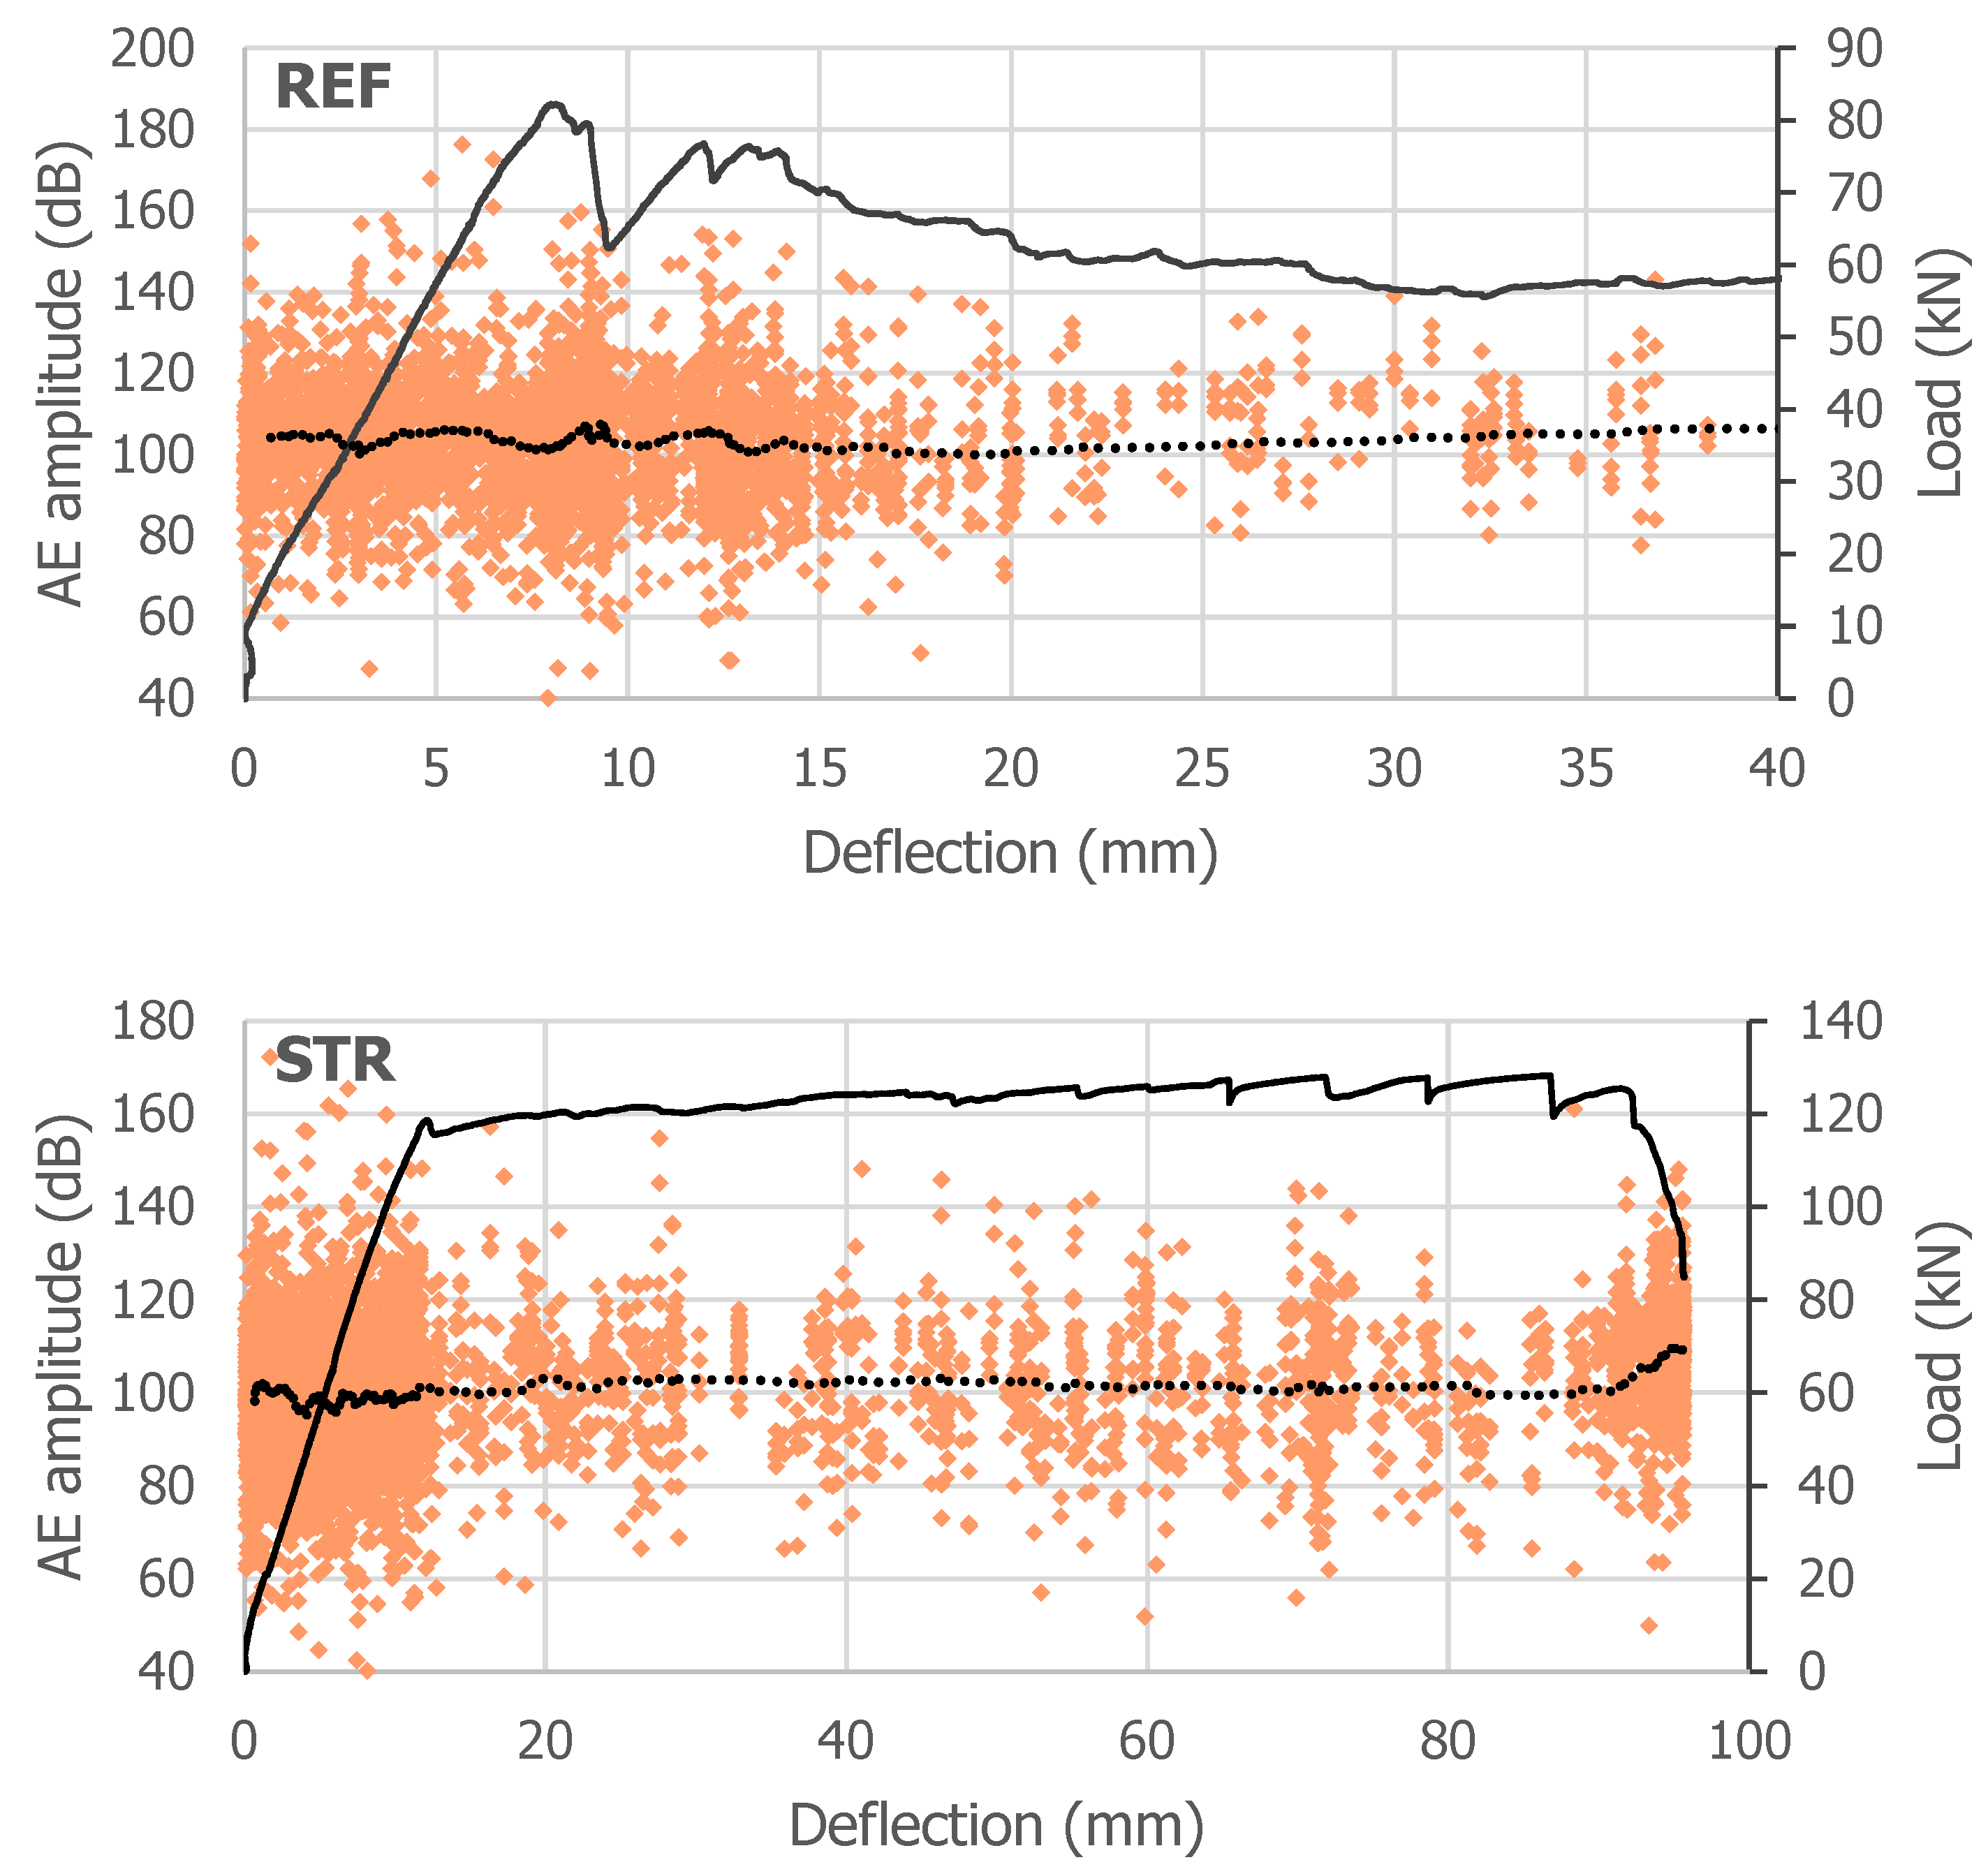
In AE analysis, amplitude is one of the fundamental signal parameters directly associated with the size, severity, and energy released by damage. Microcracking and frictional effects typically generate low-amplitude signals, whereas critical mechanisms such as macro crack propagation, reinforcement yielding, and CFRP delamination are characterized by high-amplitude signals. Therefore, AE amplitude was selected as the primary input for the Shannon entropy analysis to monitor damage evolution of the beams and to identify transitions between damage mechanisms. The recorded amplitude distributions for both beams are presented in Figure 4.
Figure 4.
Raw amplitude distributions of AE activities.
However, since AE waves propagating through concrete undergo significant attenuation depending on the distance between the source and the sensors, distance-related effects can mask the true source characteristics and lead to misleading interpretations. To eliminate this, a parameter-correction procedure based on preliminary 3D-PCT experiments before loading tests was applied to the recorded signals, allowing the true source amplitude of each damage event to be estimated. The resulting corrected dataset is expected to improve the reliability of the Shannon entropy analysis, which will be used in the next stage to quantitatively characterize damage complexity in the beams.
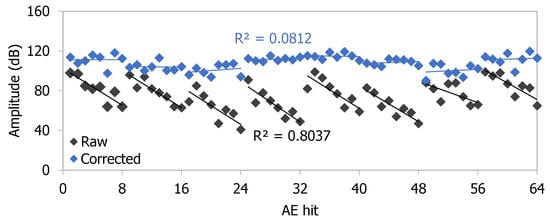
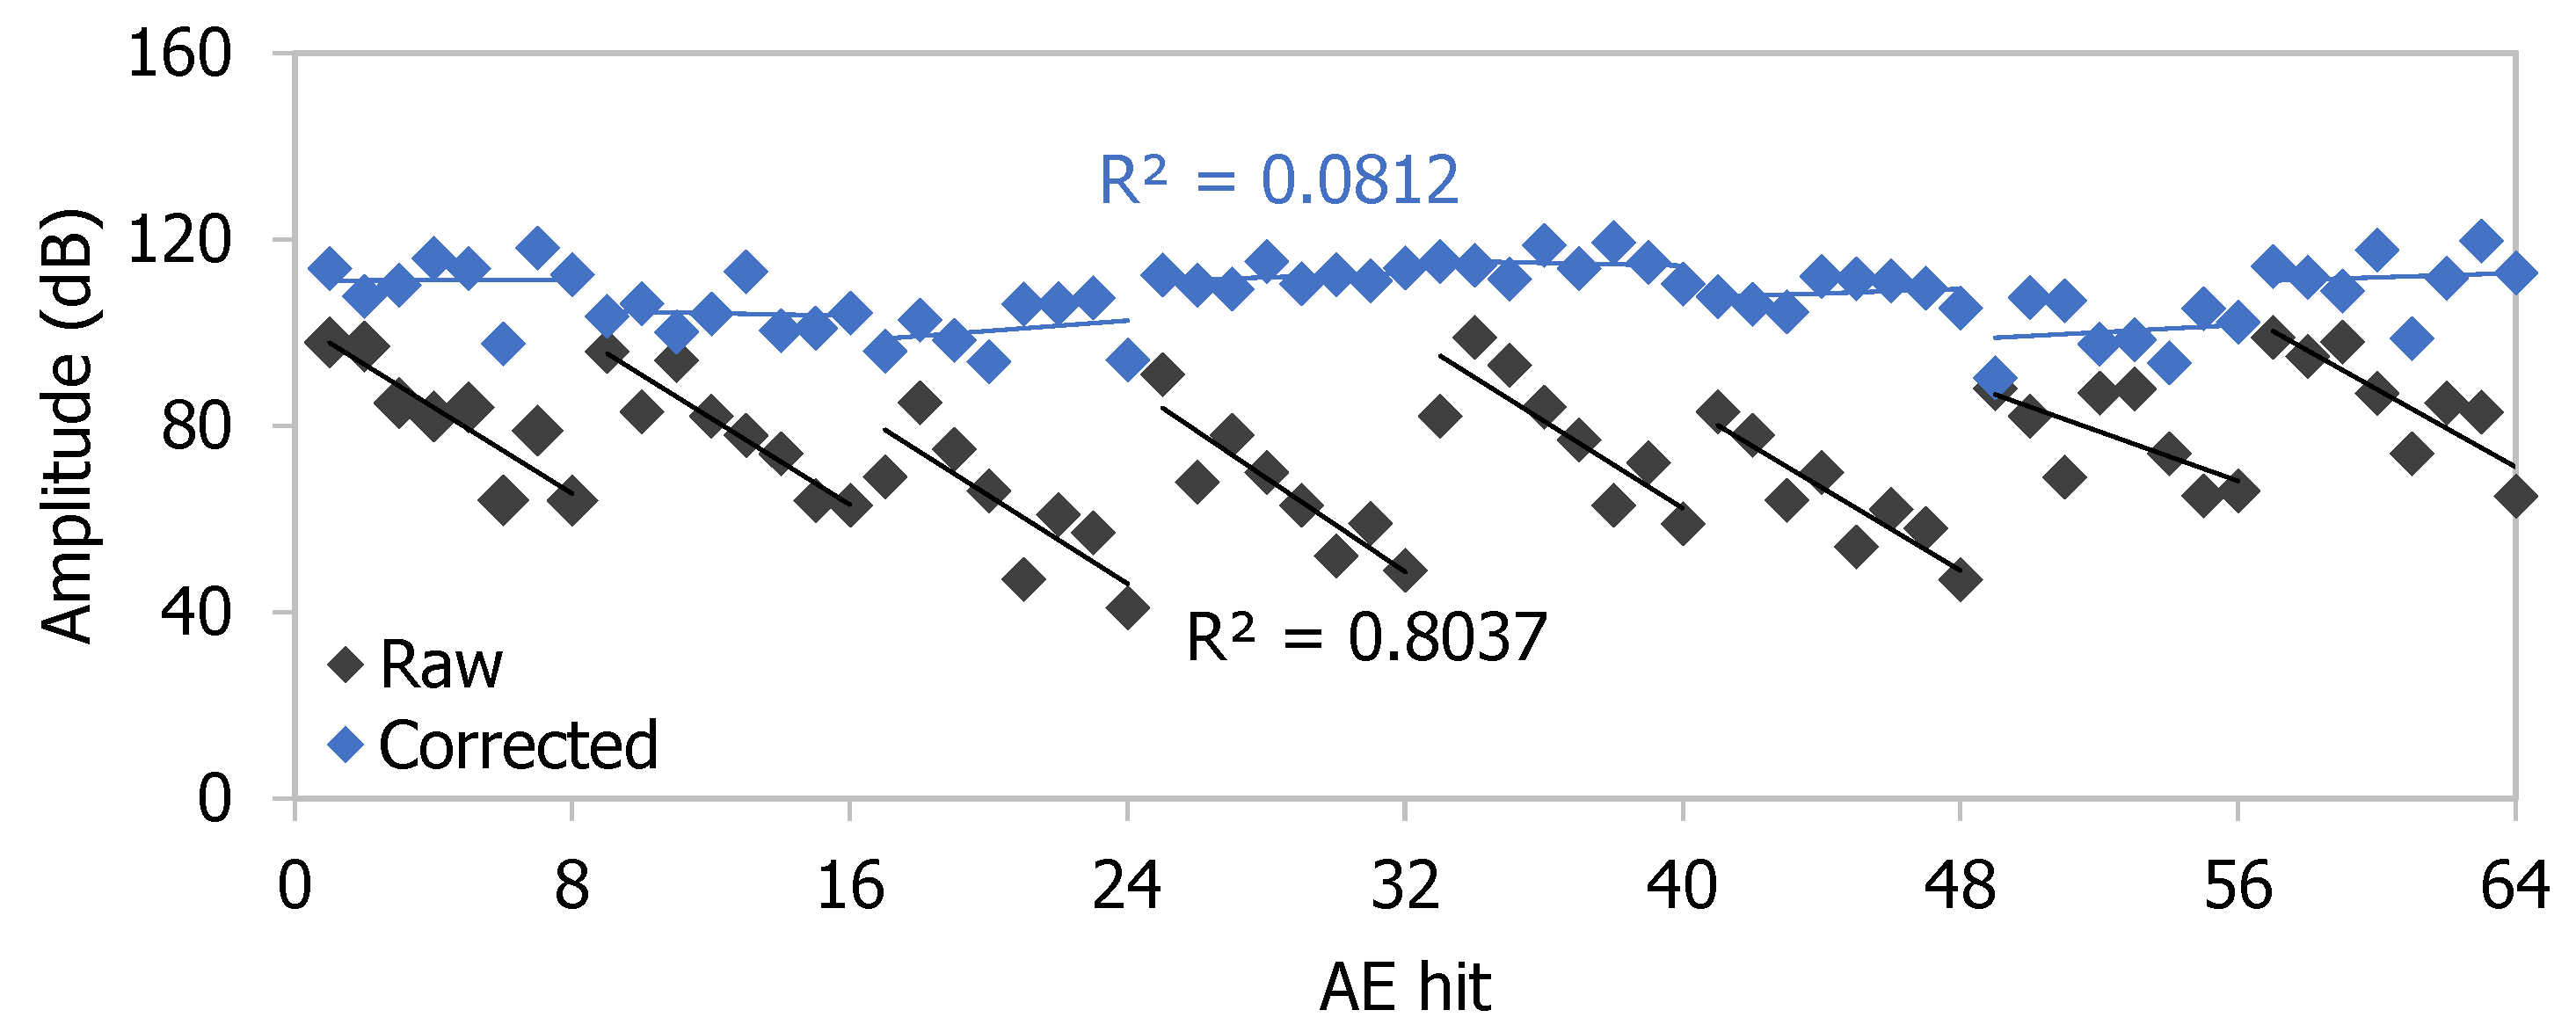
Figure 5 shows corrected AE amplitude distributions for both beams. As given in some examples in Figure 6, results from eight randomly selected events illustrate the performance of the correction procedure. As shown, each sensor recorded different amplitude values for the same event due to signal attenuation; however, the amplitudes converged within an acceptable error range after correction. As the origin time of the event is delayed and damage progresses, correction factors vary, and the spread in corrected values increases. The trend lines fitted to the corrected amplitude values do not represent a consistently decreasing relationship. Moreover, the R2 values of the lines corresponding to the corrected data are reduced to much lower levels compared to the R2 values of the lines representing the raw data. This finding suggests that events with different true amplitudes may be perceived as similar by a given sensor due to attenuation effects. Moreover, the probability of accurate detection improves as the actual amplitude of the activity increases.
Figure 5.
Corrected amplitude distributions of AE activities.
Figure 6.
Examples of amplitude correction of AE events.
4.3. Shannon Entropy Indices
Shannon entropy indices were used as an analytical indicator that measures the complexity of damage in the beams [40,41,42,43]. While basic AE parameters are reliable indicators of the extent, time, location, and type of damage, they are limited in distinguishing simultaneous damage mechanisms because they treat each signal as a separate count. Therefore, Shannon entropy aids in a more advanced characterization than basic AE features, especially for complex systems where the nature of the damage is as important as its frequency.
In the context of AE analysis, a high Shannon entropy value, which quantifies the distributional complexity of AE amplitude data, indicates that the recorded signals are spread over a wide amplitude range, suggesting the simultaneous activity of multiple and diverse damage mechanisms. In contrast, a low Shannon entropy value, or a sharply decreasing entropy curve, reflects the concentration of energy release within a narrow amplitude range, which is characteristic of a dominant and localized damage mode. Therefore, Shannon entropy can be considered not only as an indicator of damage intensity but also as a descriptor of damage complexity. Consequently, it can be used to distinguish between progressive damage and sudden damage.
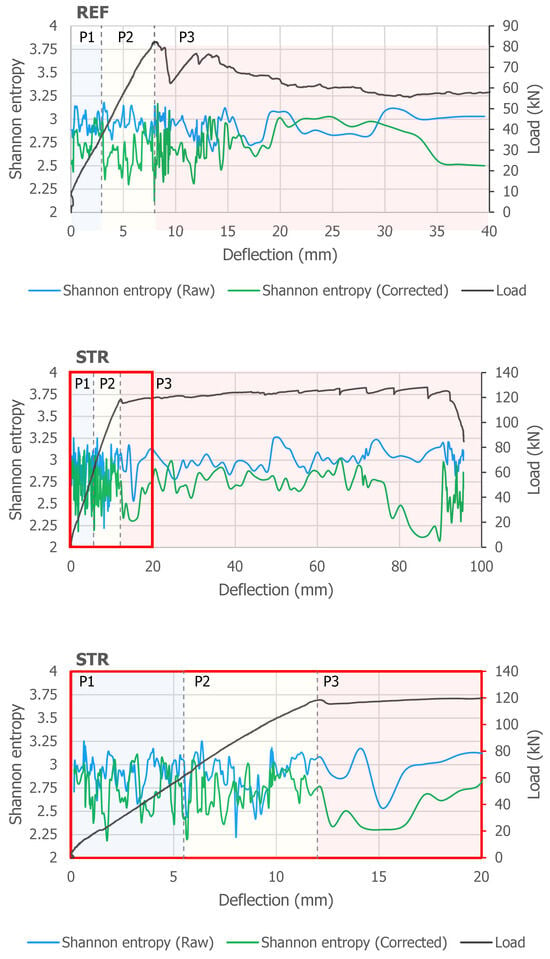
The obtained results are useful for evaluating both the effects of parameter correction and the distribution of mechanical behavior of CFRP-strengthened concrete. As seen from Figure 7, in both beams, the raw curves vary between approximately 2.5 and 3.2 without a clear distinction, presenting practical difficulties in structural assessment. On the other hand, 3D-PCT served to produce a smoother and more physically interpretable corrected entropy curve by eliminating wave attenuation, boundary reflections, and sensor effects in the concrete. The entropy values calculated using raw amplitude data, which are quite similar across both REF and STR throughout the loading, ranging from approximately 2.90 to 3.0, indicate that the attenuation effect can mask the true damage behavior. In contrast, corrected entropy values ranging from 2.60 to 2.75 reveal beam-specific trends: the reference beam exhibits a lower and progressively decreasing entropy, consistent with damage localization and brittle shear damage. On the other hand, the CFRP-strengthened beam maintains a higher and less variable entropy, confirming the simultaneous activation of the multiple damage mechanisms described above.
Figure 7.
Shannon entropy analysis results of the beams before and after parameter correction.
In the phase-by-phase evaluation, during P1 in both beams, corresponding to the elastic region, the entropy peaks circularly at 3.0–3.2, reflecting the distributed nature of early-stage micro-cracking events occurring in heterogeneous source regions with highly varied AE amplitude values. During P2, which expands with more stable flexural crack propagation, the entropy decreases particularly at the load decreases between P1–P2 and P2–P3. In the REF beam, the abrupt drop in entropy from approximately 2.73 to 2.64 is a numerical indication that random microcracks are merging into a main diagonal shear crack, revealing that the damage is localized and tending towards brittle failure. Following the P3, these curves show signs of a decrease to 2.5. This indicates a narrowing of the AE variant as a result of concentrated damage localization in the diagonal shear plane.
In the beam STR, the difference is more dominant in P3 after parameter correction: the corrected entropy remains constant and oscillates around 2.5–3.0 throughout the post-peak plateau. This confirms that the CFRP maintains distributed and multi-mechanism damage development throughout the ductile behavior. The corrected curve shows significant entropy decreases beyond the 90 mm deflection level, which are visible in the load-deflection response and not observed in the raw entropy curve. Overall, while the raw entropy curves of both beams exhibit similar fluctuation ranges (approximately 2.5–3.2) throughout loading, making it difficult to distinguish beam-specific damage behavior, the 3D-PCT corrected entropy curves reveal physically consistent trends. In the REF beam, the corrected curve is consistent with damage localization by a single dominant shear failure mechanism in the final phase; in the STR beam, however, it shows a post-fall recovery, suggesting reactivation of CFRP-related mechanisms with ongoing concrete cracking.
To mathematically evaluate the variations, Table 2 summarizes the mean and standard deviations of entropy change rate per unit deflection in each damage phase before and after correction. The raw entropy change rate in phase P1 of REF exhibits a narrow distribution with a lower standard deviation, indicating regularity of AE sources consistent with micro-cracking in the elastic region. 3D-PCT correction slightly lowers the mean in this phase while increasing the standard deviation from 0.16 to 1.07. This increase is the first indication that source variability, previously hidden in the raw data, is revealed by the correction.
Table 2.
Phase-based entropy statistics and damage interpretation.
While the average rate of change remained almost the same during phase P2, its standard deviation increased to 1.59, and this effect became even more pronounced in the corrected value, where the standard deviation reached 3.13. The effect of the correction on the average also increased compared to phase P1. This situation is consistent with increased diversity due to both crack propagation and the formation of new cracks.
In phase P3, the table reveals the most critical numerical finding regarding the damage behavior of the REF beam. While the average of the raw rate of change remains similar, its standard deviation reaches 4.31 and 4.73 for raw and corrected data, respectively. While the standard deviation is seen to exceed the average even further, the effect of the correction on the average narrows compared to P2, and the standard deviation remains almost unchanged. This narrowing indicates that the sources of damage are localized to the diagonal shear plane.
On the other hand, the fact that the average rate of change is close to zero in all phases of the STR indicates that the increase and decrease within the phases balance each other. This is evident from the extremely high standard deviation values in all phases of the STR, as well as after correction, despite this low average value. Even under balanced change, the fact that the activities exhibit different characteristics from each other indicates that multiple damage mechanisms are alternately and continuously active in STR. In particular, phase P1 has the greatest effect on the average. Physically, this shows that the early stress transfer events at the CFRP–concrete interface are supported by the corrected Shannon entropy, with high-amplitude and sudden AE bursts—a behavior absent in REF-P1—observed in the early phase (Figure 6). In other words, it has been numerically determined that simultaneous concrete micro-cracking and CFRP activation are exhibited in the STR P1 phase, unlike REF. This pattern was observed across all loading phases of the STR beam, where the near-zero phase-averaged mean rates combined with high post-correction standard deviation values provide a numerical basis for distinguishing CFRP-induced AE events from those observed in plain RC behavior. Collectively, these statistics confirm that the STR beam progresses toward failure through distributed, multi-mechanism damage accumulation rather than localization onto a single failure plane, and that this distinction is resolved through 3D-PCT correction.
5. Conclusions
In this study, the ductile behavior and transformation of damage mechanisms in an RC beam strengthened with CFRP against shear were investigated using the Shannon entropy approach based on AE amplitude data corrected for attenuation effects. The analyses revealed that the Shannon entropy calculated from the raw AE data was obscured by wave attenuation and other effects, such as wave dispersion in concrete. This situation leads to similar entropy fluctuation ranges in both the reference and CFRP-strengthened beams, masking the true damage behavior. By applying parameter correction, this problem was eliminated, reducing the uncertainty regarding the mechanical behavior of the member.
Phase-based analysis of the entropy change rate confirmed that the difference between the raw and corrected metrics serves as a quantitative discriminator between brittle shear localization and ductile multi-mechanism damage. Statistical changes undetectable in the raw entropy metric were observed after parameter correction. Corrected entropy curves yielded more distinct results for each beam and were more consistent with their damage evolution phases. In the reference beam, the sustained entropy drop observed after the peak load phase has a potential validation of brittle fracture, reflecting the transformation of microcracks into a dominant diagonal shear crack. In contrast, the CFRP-strengthened beam exhibited high and dynamically varying entropy throughout the post-peak plateau, providing a quantitative basis for confirming the simultaneous activation of multiple damage mechanisms, including concrete cracking and CFRP activities. Furthermore, the entropy recovery observed in the final phase indicates the reactivation of CFRP-dependent mechanisms, highlighting the complexity of the damage process in the CFRP-strengthened beam. This enabled differentiation between the sudden brittle failure of the plain RC beam and the more ductile failure with distributed damage induced by CFRP wrapping, thereby quantifying the strengthening effectiveness of CFRP and the associated shift in damage mechanisms.
Author Contributions
Conceptualization, methodology, formal analysis, visualization S.T.; investigation, writing—original draft preparation, reviewing, editing S.T. and N.A. All authors have read and agreed to the published version of the manuscript.
Funding
This research received no external funding.
Data Availability Statement
The raw data supporting the conclusions of this article will be made available by the authors on request.
Acknowledgments
During the preparation of this study, the authors used Gemini for the purposes of programming some analyses. The authors have reviewed and edited the output and take full responsibility for the content of this publication.
Conflicts of Interest
The authors declare no conflicts of interest.
References
- Caliskan, Ö.; Aras, M.; Yılmaz, T.; Anıl, Ö. Experimental and numerical investigation of low-velocity impact behavior and failure mode of shear deficient RC beam strengthened with CFRP strips. Struct. Concr. 2024, 26, 856–878. [Google Scholar]
- Selezneva, M.; Swolfs, Y.; Katalagarianakis, A.; Ichikawa, T.; Hirano, N.; Taketa, I.; Karaki, T.; Verpoest, I.; Gorbatikh, L. The brittle-to-ductile transition in tensile and impact behavior of hybrid carbon fibre/self-reinforced polypropylene composites. Compos. Part A Appl. Sci. Manuf. 2018, 109, 20–30. [Google Scholar]
- Hegde, S.; Shenoy, B.S.; Chethan, K.N. Review on carbon fiber reinforced polymer (CFRP) and their mechanical performance. Mater. Today Proc. 2019, 19, 658–662. [Google Scholar]
- Mercimek, Ö.; Anıl, Ö.; Akkaya, S.T.; Erdem, R.T.; Çelik, A.; Kopraman, Y.; Abukan, A. Experimental behavior of shear deficient RC beams strengthened with CFRP strips against reversible cyclic earthquake load. Struct. Concr. 2025, 26, 6424–6447. [Google Scholar] [CrossRef] [Scilit]
- Papadopoulos, N.A.; Naoum, M.C.; Sapidis, G.M.; Chalioris, C.E. Cracking and Fiber Debonding Identification of Concrete Deep Beams Reinforced with C-FRP Ropes against Shear Using a Real-Time Monitoring System. Polymers 2023, 15, 473. [Google Scholar] [CrossRef] [Scilit]
- Golias, E.; Zapris, A.G.; Kytinou, V.K.; Kalogeropoulos, G.I.; Chalioris, C.E.; Karayannis, C.G. Effectiveness of the Novel Rehabilitation Method of Seismically Damaged RC Joints Using C-FRP Ropes and Comparison with Widely Applied Method Using C-FRP Sheets—Experimental Investigation. Sustainability 2021, 13, 6454. [Google Scholar]
- Zapris, A.G.; Kytinou, V.K.; Chalioris, C.E. Innovative Fiber-Reinforced Polymer Rope-Based Closed-Form Retrofitting Methods Applied in Reinforced Concrete T-Shaped Beams under Torsion. Polymers 2024, 16, 2634. [Google Scholar]
- Mandal, D.D.; Bentahar, M.; El Mahi, A.; Brouste, A.; Guerjouma, R.E.; Montresor, S.; Cartiaux, F.-B.; Semiao, J. Acoustic emission monitoring of damage modes in reinforced concrete beams by using narrow partial power bands. Sci. Rep. 2024, 14, 27082. [Google Scholar] [CrossRef] [Scilit]
- Maidi, M.; Sherzer, G.L.; Gal, E. Multiscale Numerical Study of Enhanced Ductility Ratios and Capacity in Carbon Fiber-Reinforced Polymer Concrete Beams for Safety Design. Polymers 2025, 17, 234. [Google Scholar] [CrossRef] [Scilit]
- Cremona, C.F.; Germain, D.; Houel, A. Damage Characterization and Rehabilitation of the Teil Bridge, Ardèche, France. Transp. Res. Rec. J. Transp. Res. Board 2015, 2481, 107–114. [Google Scholar] [CrossRef] [Scilit]
- Li, Z.; Zhang, H.; Tan, D.; Chen, X.; Lei, H. A Novel Acoustic Emission Detection Module for Leakage Recognition in a Gas Pipeline Valve. Process Saf. Environ. Prot. 2017, 105, 32–40. [Google Scholar] [CrossRef] [Scilit]
- Droubi, M.G.; Faisal, N.H.; Orr, F.; Steel, J.A.; El-Sahib, M. Acoustic Emission Method for Defect Detection and Identification in Carbon Steel Welded Joints. J. Constr. Steel Res. 2017, 134, 28–37. [Google Scholar] [CrossRef] [Scilit]
- Yilmaz, C. A Comprehensive Analysis of Acoustic Emission Signals to Distinguish the Different Damage Types for Fiber-Reinforced Polymers: A Review. Polym. Compos. 2026, 47, 4929–4948. [Google Scholar] [CrossRef] [Scilit]
- Zhu, Y.; Li, W.; Lin, J.; Gao, F.; Liu, Z. A multi-mode coupling damage classification method for composite structures based on acoustic emission signal decomposition. Ultrasonics 2025, 160, 107886. [Google Scholar] [CrossRef] [Scilit]
- Hamam, Z.; Godin, N.; Fusco, C.; Doitrand, A.; Monnier, T. Acoustic Emission Signal Due to Fiber Break and Fiber Matrix Debonding in Model Composite: A Computational Study. Appl. Sci. 2021, 11, 8406. [Google Scholar] [CrossRef] [Scilit]
- Gaydecki, P.A.; Burdekin, F.M.; Damaj, W.; John, D.G.; Payne, P.A. The Propagation and Attenuation of Medium-Frequency Ultrasonic Waves in Concrete: A Signal Analytical Approach. Meas. Sci. Technol. 1992, 3, 126–134. [Google Scholar] [CrossRef] [Scilit]
- Jacobs, L.J.; Owino, J.O. Effect of Aggregate Size on Attenuation of Rayleigh Surface Waves in Cement-Based Materials. J. Eng. Mech. 2000, 126, 1124–1130. [Google Scholar] [CrossRef] [Scilit]
- Asadollahi, A.; Khazaovich, L. Numerical investigation of the effect of heterogeneity on the attenuation of shear waves in concrete. Ultrasonics 2019, 91, 34–44. [Google Scholar] [CrossRef] [Scilit]
- Song, H.; Popovics, J.S. Characterization of steel-concrete interface bonding conditions using attenuation characteristics of guided waves. Cem. Concr. Compos. 2017, 83, 111–124. [Google Scholar] [CrossRef] [Scilit]
- Wu, C.; Pan, Y.; Ueda, T. Characterization of the abrasion resistance and the acoustic wave attenuation of the engineered cementitious composites for runway pavement. Constr. Build. Mater. 2018, 174, 537–546. [Google Scholar] [CrossRef] [Scilit]
- Thirumalaiselvi, A.; Sasmal, S. Acoustic emission monitoring and classification of signals in cement composites during early-age hydration. Constr. Build. Mater. 2019, 196, 411–427. [Google Scholar] [CrossRef] [Scilit]
- Nogueira, C.L.; Rens, K.L. Ultrasonic wave propagation in EPS lightweight concrete and effective elastic properties. Constr. Build. Mater. 2018, 184, 634–642. [Google Scholar] [CrossRef] [Scilit]
- Carpinteri, A.; Lacidogna, G.; Accornero, F.; Mpalaskas, A.C.; Matikas, T.E.; Aggelis, D.G. Influence of Damage in the Acoustic Emission Parameters. Cem. Concr. Compos. 2013, 44, 9–16. [Google Scholar] [CrossRef] [Scilit]
- Feng, H.; Yi, W. Propagation Characteristics of Acoustic Emission Wave in Reinforced Concrete. Results Phys. 2017, 7, 3815–3819. [Google Scholar] [CrossRef] [Scilit]
- Al-Jumaili, S.K.; Eaton, M.; Holford, K.; Pullin, R. A Parameter Correction Technique (PCT) for Acoustic Emission Characterisation in Large-Scale Composites. In Proceedings of the 31st Conference of the European Working Group on Acoustic Emission (EWGAE), Dresden, Germany, 3–5 September 2014. [Google Scholar]
- Al-Jumaili, S.K.; Holford, K.M.; Eaton, M.J.; Pullin, R. Parameter Correction Technique (PCT): A Novel Method for Acoustic Emission Characterisation in Large-Scale Composites. Compos. Part B Eng. 2015, 75, 336–344. [Google Scholar] [CrossRef] [Scilit]
- Al-Jumaili, S.K.; Eaton, M.J.; Holford, K.M.; Pearson, M.R.; Crivelli, D.; Pullin, R. Characterisation of Fatigue Damage in Composites Using Acoustic Emission Parameter Correction Technique. Compos. Part B Eng. 2018, 151, 237–244. [Google Scholar]
- Tayfur, S.; Alver, N. Correction of Acoustic Emission Parameters for Damage Detection in Concrete. In Proceedings of the NDE/NDT for Highway and Bridges: Structural Materials Technology (SMT 2018) & International Symposium Non-Destructive Testing in Civil Engineering (NDT-CE 2018), New Brunswick, NJ, USA, 27–29 August 2018. [Google Scholar]
- Tayfur, S.; Alver, N. A 3D Parameter Correction Technique for Damage Assessment of Structural Reinforced Concrete Beams by Acoustic Emission. Constr. Build. Mater. 2019, 215, 148–161. [Google Scholar] [CrossRef] [Scilit]
- Tayfur, S.; Alver, N. 3D Parameter Correction Technique for Identifying Effects of Inclusions on Attenuation Properties of Concrete. In Proceedings of the 62nd Acoustic Emission Working Group Meeting (AEWG-62), Houston, TX, USA (Virtual), 27–29 May 2020. [Google Scholar]
- Tayfur, S.; Alver, N. Attenuation and Frequency Characteristics of Acoustic Waves in Steel and Synthetic Fiber-Reinforced Concrete: 3D-PCT and Unsupervised Pattern Recognition. Appl. Sci. 2022, 12, 12976. [Google Scholar] [CrossRef] [Scilit]
- Tayfur, S.; Alver, N.; Abdi, S.; Saatcı, S.; Ghiami, A. Characterization of concrete matrix/steel fiber de-bonding in an SFRC beam: Principal component analysis and k-mean algorithm for clustering AE data. Eng. Fract. Mech. 2018, 194, 73–85. [Google Scholar]
- Tayfur, S.; Alver, N.; Türk, E.; Menteşoğlu, M.; Ercan, E. Failure behavior of CFRP-strengthened reinforced concrete beam–column joints under reversed-cyclic lateral loading: Mechanical and acoustic emission observations. Struct. Eng. Int. 2024, 34, 141–152. [Google Scholar]
- Inderyas, O.; Alver, N.; Tayfur, S.; Shimamoto, Y.; Suzuki, T. Deep learning-based acoustic emission signal filtration model in reinforced concrete. Arab. J. Sci. Eng. 2024, 50, 1885–1903. [Google Scholar] [CrossRef] [Scilit]
- Shannon, C. A Mathematical Theory of Communication. Bell Syst. Tech. J. 1948, 27, 623–656. [Google Scholar] [CrossRef] [Scilit]
- Deng, X.; Shen, M.; Zhao, Y.; Bi, J.; Wang, C.; Zhang, Y.; Li, Y.; Ning, L.; Zheng, K. Study on Mode I Fracture Characteristics and Fracture Surface Morphology of Concrete–Sandstone Under Different Loading Rates. Fatigue Fract. Eng. Mater. Struct. 2025, 48, 1183–1199. [Google Scholar] [CrossRef] [Scilit]
- Karimian, S.F.; Modarres, M. Acoustic emission signal clustering in CFRP laminates using a new feature set based on waveform analysis and information entropy analysis. Compos. Struct. 2021, 268, 113987. [Google Scholar] [CrossRef] [Scilit]
- Zhang, J.; Kang, Z.; Hou, D.; Dong, B.; Ma, H. Wavelet Power and Shannon Entropy Applied to Acoustic Emission Signals for Corrosion Detection and Evaluation of Reinforced Concrete. ES Mater. Manuf. 2022, 16, 46–55. [Google Scholar] [CrossRef] [Scilit]
- Das, S.; Datta, A.K.; Topdar, P.; Sengupta, S. Advanced Damage Detection In Reinforced Concrete Applying Acoustic Emission, Wavelet Transform And Shannon Entropy. Silpakorn Univ. J. Sci. Tech. 2024, 31, 010334. [Google Scholar] [CrossRef] [Scilit]
- D’Angela, D.; Magliulo, G.; Losanno, D.; Parisi, F.; Prota, A. Development and validation of acoustic emission criteria for cracking assessment of prestressed RC girders. Struct. Health Monit. 2025, 14759217251378024. [Google Scholar] [CrossRef] [Scilit]
- Ahmed, M.A.; Dutta, S. Acoustic emission entropy as an indicator of damage at fiber–matrix interface in UHPC during fiber pull-out. J. Build. Eng. 2025, 114, 114345. [Google Scholar] [CrossRef] [Scilit]
- Jiang, Z.; Zhu, Z.; Friedrich, L.F.; Cezar, E.S.; Chen, J.; Lacidogna, G.; Iturrioz, I. Multi-technical analysis of damage process in GFRP-bar reinforced concrete beam. Eng. Struct. 2026, 34, 121803. [Google Scholar] [CrossRef] [Scilit]
- D’Angela, D.; Magliulo, G. Acoustic emission testing of prestressed RC bridge girders: Methodology, results, and dataset. Mater. Struct. 2026, 59, 85. [Google Scholar] [CrossRef] [Scilit]
- ASTM E 1316; Standard Terminology for Nondestructive Examinations. ASTM International: West Conshohocken, PA, USA, 2002.
- Grosse, C.U.; Ohtsu, M. Acoustic Emission Testing; Springer: Berlin, Germany, 2008. [Google Scholar]

Disclaimer/Publisher’s Note: The statements, opinions and data contained in all publications are solely those of the individual author(s) and contributor(s) and not of MDPI and/or the editor(s). MDPI and/or the editor(s) disclaim responsibility for any injury to people or property resulting from any ideas, methods, instructions or products referred to in the content. |
© 2026 by the authors. Licensee MDPI, Basel, Switzerland. This article is an open access article distributed under the terms and conditions of the Creative Commons Attribution (CC BY) license.