1. Introduction
In recent years, increasing attention has been directed toward the development and application of innovative construction materials aimed at producing structural and non-structural components with enhanced mechanical performance, durability, and resistance to adverse environmental conditions. Among these emerging materials, textile-reinforced cementitious composites (TRCCs) have gained significant interest. TRCCs consist of multiple layers of textile reinforcements such as basalt, carbon, polyvinyl alcohol (PVA), and alkali-resistant (AR) glass fibers arranged in biaxial or multiaxial configurations [
1,
2] embedded within a polymer-modified, fine-grained cementitious matrix. Owing to their favorable mechanical and durability-related properties, TRCCs have been applied in a wide range of construction applications, including permanent formwork systems, load-bearing sandwich panels, non-load-bearing cladding panels, underground drainage pipelines, and the external strengthening or retrofitting of structural elements such as beams, columns, and infill walls. TRCCs exhibit notable advantages, including cost efficiency, high tensile and flexural strength, sufficient ductility and energy dissipation capacity, excellent bond performance with cement-based substrates, enhanced durability against corrosion and environmental degradation, and stable mechanical performance at elevated temperatures.
The recent development of textile-reinforced cementitious composites (TRCCs), also referred to in the literature as textile-reinforced mortar (TRM), fabric-reinforced cementitious matrix (FRCM), or textile-reinforced concrete (TRC), has attracted considerable attention as an alternative strengthening and structural material for concrete and masonry applications [
3,
4,
5,
6,
7]. These systems generally consist of high-strength textile reinforcements embedded within inorganic cement- or lime-based matrices, providing improved compatibility with existing substrates, enhanced fire resistance, vapor permeability, corrosion resistance, and applicability under harsh environmental conditions compared with conventional fiber-reinforced polymer (FRP) systems [
3,
4,
5,
6]. Due to these advantages, TRCC systems have increasingly been investigated for strengthening, retrofitting, confinement, seismic rehabilitation, thin-shell applications, and lightweight structural components [
1,
2,
5,
6,
7].
Previous studies demonstrated that the mechanical behavior of TRCC systems is strongly influenced by textile configuration, matrix composition, interfacial bond characteristics, and loading conditions. Experimental investigations showed that TRCCs generally exhibit strain-hardening behavior, distributed cracking response, improved energy dissipation, and enhanced tensile and flexural performance compared with conventional cementitious composites [
5,
6,
7]. In particular, the incorporation of short polymer fibers together with continuous textile reinforcement was shown to improve crack control, ductility, and energy absorption capacity under monotonic and impact loading conditions [
6]. Similarly, previous studies on lightweight and layered TRCC systems reported that textile arrangement, coating conditions, prestressing level, and matrix modification significantly affect cracking characteristics, stiffness, tensile response, and flexural performance [
1,
2,
5].
Recent studies by Azimi, Oliveira, Lourenço, and co-workers investigated the bond behavior, tensile response, durability performance, and environmental degradation mechanisms of TRM/FRCM systems under acidic, saline, and alkaline exposure conditions [
8,
9,
10,
11]. These studies highlighted the critical role of textile-to-mortar and TRM-to-substrate bond behavior in governing the overall mechanical response and long-term durability of the composite systems. In addition, recent investigations concerning TRCC strengthening systems and layered composite configurations demonstrated that the effectiveness of these systems is governed not only by textile reinforcement properties but also by crack propagation mechanisms, interface interaction, and matrix confinement behavior under tension and shear loading conditions [
1,
5,
8,
9,
10,
11].
The following section provides a concise review of previous studies reported in the literature, with particular emphasis on the mechanical performance and manufacturing techniques of TRCC-based elements.
Abbas et al. [
12] conducted an experimental and numerical investigation on composite concrete–steel plate shear walls subjected to axial loading. The results showed that increasing the compressive strength of concrete significantly improved the axial load-carrying capacity of the walls. In contrast, larger wall aspect ratios reduced the load capacity and increased both lateral displacement and axial shortening. The observed failure mode was primarily characterized by local buckling of the steel plates, followed by cracking and crushing of the concrete infill.
Daskiran et al. [
13] developed TRCC panels using a novel pull–pour–roll (PPR) manufacturing technique in combination with polymer-modified mortar and various textile reinforcements, including PVA, basalt, and AR glass fibers. Their study examined the influence of textile type and number of textile layers on composite panel performance under wetting–drying exposure and pull-out testing. In addition, diagonal compression tests were conducted on infill walls strengthened with these TRCC panels. The results indicated that increasing the number of PVA textile layers enhanced pull-out strength, whereas AR glass and basalt reinforcements exhibited no significant improvement. Moreover, degradation was observed in AR glass- and basalt-reinforced panels, while PVA-based composites remained largely unaffected. The strengthened infill walls demonstrated increased shear modulus, strength, and ductility, highlighting the effectiveness of TRCC panels for strengthening applications.
Dönmez et al. [
14] experimentally investigated the behavior of cylindrical, tube-shaped TRCC elements subjected to monotonic and cyclic lateral loading. The Microplane Model (M7) was employed to describe mortar damage behavior, and finite element simulations were performed to model the composite tube specimens. The findings revealed that textile type, number of layers, specimen thickness, and mortar properties significantly influenced stiffness, ductility, and energy dissipation capacity. Furthermore, the TRCC tubes exhibited stable crack propagation without pronounced brittle failure, indicating their suitability for infrastructure applications such as sewer and pipeline systems.
Dönmez [
15] evaluated the lateral monotonic compression behavior of cylindrical TRCC tubes using finite element analysis. The results demonstrated that textile type, mortar characteristics, reinforcement layer number, and tube thickness play critical roles in determining load-carrying capacity, ductility, and energy absorption performance. Based on these findings, TRCCs were proposed as viable alternatives to conventional drainage pipes due to their corrosion resistance, ductility, and manufacturing efficiency.
Ho et al. [
16] investigated the tensile strength reduction in curved AR glass and carbon textile reinforcements embedded in hollow-shaped textile-reinforced concrete specimens subjected to tensile and compressive loading with varying curvature diameters. The study showed that bending of externally bonded textile fibers at corner regions leads to a reduction in tensile strength under complex loading conditions. The results revealed a strong dependency of tensile strength on curvature diameter, with failure predominantly occurring in mid-curved regions or transition zones. In addition, AR glass textiles exhibited greater strength degradation compared with carbon fibers.
Ahmed et al. [
17] conducted an experimental study on composite circular concrete columns reinforced with encased steel and GFRP I-sections under different loading conditions. The results showed that the inclusion of encased I-sections improved the load-carrying capacity compared with conventional columns. Steel I-sections provided greater strength enhancement than GFRP I-sections. Furthermore, load eccentricity significantly affected the structural response, where increasing eccentricity reduced the axial load capacity and increased deformation.
Daskiran et al. [
18] assessed the seismic performance of reinforced concrete columns incorporating circular permanent formwork produced from four- and six-layer PVA-based TRCCs under constant axial load and cyclic lateral loading. The experimental results demonstrated that columns utilizing composite permanent formwork achieved higher lateral load capacity, ductility, initial stiffness, energy dissipation, and confinement efficiency compared with specimens using conventional temporary formwork, emphasizing the structural advantages of TRCC-based formwork systems.
Ali et al. [
19] reviewed previous experimental and numerical studies related to the mechanical behavior of GFRP composites under elevated temperature conditions. The results indicated that when temperatures approach or exceed the glass transition temperature (Tg), the resin matrix softens and begins to degrade, leading to significant reductions in tensile and compressive strengths. At higher temperatures, thermal degradation weakens the bond between the fibers and the resin. However, the elastic modulus of GFRP composites is less affected, as it primarily depends on the stiffness of the fibers rather than the resin matrix.
Finally, Dönmez et al. [
20] examined strengthening techniques for clay brick and concrete block masonry walls using hybrid fiber-reinforced and textile-reinforced cement-based mortars subjected to cyclic lateral loading. The retrofitted masonry walls exhibited notable improvements in initial stiffness, lateral load capacity, and ductility. Furthermore, the hybrid composite system demonstrated superior bonding performance when applied to damaged concrete masonry walls compared with clay brick masonry, indicating its effectiveness for masonry retrofitting applications.
Alongside experimental studies, increasing attention has recently been directed toward advanced numerical and fracture-informed modeling approaches for simulating crack initiation, crack propagation, stiffness degradation, and damage evolution in cement-based composite systems. Numerical investigations based on concrete damage plasticity (CDP), cohesive fracture mechanics, and physics-based damage formulations have been employed to investigate distributed cracking and nonlinear response of TRM-strengthened structural members [
21]. In addition, damage-identification and fracture-informed approaches capable of parametrically considering damage location and severity have recently been proposed to evaluate crack evolution and structural degradation in concrete members [
22]. These approaches provide a more detailed representation of localized fracture mechanisms and damage progression compared with conventional global-response-based numerical methods. Nevertheless, although such advanced fracture-informed numerical techniques provide valuable insight into local damage evolution and crack propagation mechanisms, simplified CDP-based numerical approaches remain effective for reproducing the global nonlinear response, stiffness degradation, and overall damage characteristics of cement-based composite systems.
A wide range of manufacturing techniques has been developed for the production of textile-reinforced composite materials. Among the most commonly employed methods for fabricating composite elements are pultrusion, filament winding, compression molding, liquid composite molding (LCM), and lamination techniques. Pultrusion is a continuous manufacturing process used to produce composite profiles with constant cross-sectional geometry. In this method, reinforcing fibers such as glass, carbon, or aramid are impregnated with a polymeric matrix (e.g., polyester or epoxy) in a feed zone and subsequently cured within a heated die. The cured profiles are then cooled and cut to the required lengths using a traveling crosscut saw [
23,
24].
Filament winding is widely utilized for manufacturing cylindrical or tubular composite elements with open or closed ends. In this process, resin-impregnated reinforcement filaments are wound at predetermined angles onto a rotating mandrel, while a horizontal carriage system ensures accurate fiber placement. Curing may be performed at ambient or elevated temperatures, making this technique particularly suitable for tubular structural components [
23,
24,
25,
26].
Compression molding is a closed-mold manufacturing method that applies elevated pressure and temperature to form composite elements using either thermosetting or thermoplastic polymer matrices. In this process, the reinforcement and resin are placed in a metallic mold, where the resin flows under heat and pressure, conforms to the mold geometry, and subsequently hardens. After cooling, the molded product is demolded, with curing continuing during the cooling stage. Typical resins employed include phenolic, epoxy, and polyester systems [
23,
24,
25].
Liquid composite molding (LCM) refers to a group of closed-mold processes in which a liquid thermoset resin is injected into a dry fiber preform to achieve full fiber impregnation [
25,
26,
27]. LCM techniques can be classified into several categories, including resin transfer molding (RTM), compression resin transfer molding (CRTM), RTM Light, and vacuum-assisted resin transfer molding (VARTM). In conventional RTM, resin is injected at low pressure into a preform positioned within a closed mold [
25]. CRTM, a modified form of RTM, utilizes a partially open mold that compresses the preform after resin injection to improve impregnation quality [
25,
28]. RTM Light employs a semi-rigid counter-mold that allows controlled deformation during resin infusion [
25], whereas VARTM relies on vacuum pressure to compact the dry reinforcement and facilitate resin flow throughout the preform [
29]. In lamination processes, reinforcement textiles are impregnated with resin on a moving conveyor, followed by curing and cutting to obtain the final composite components [
29].
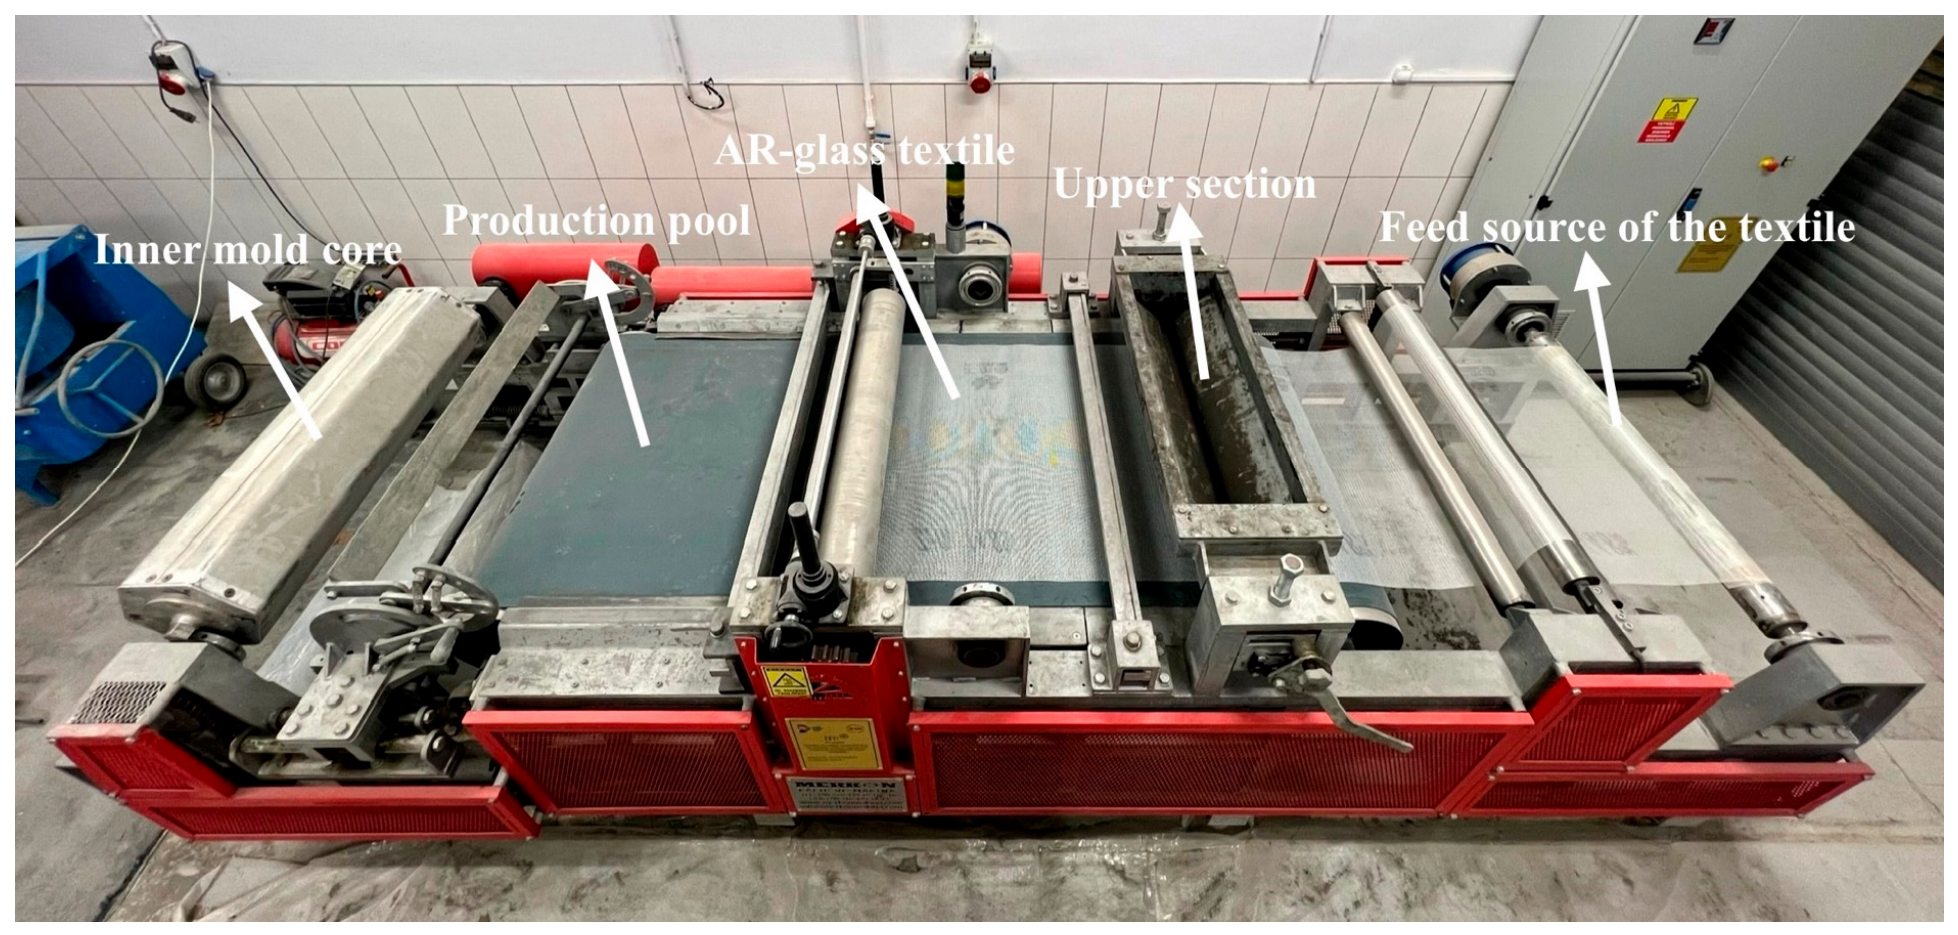
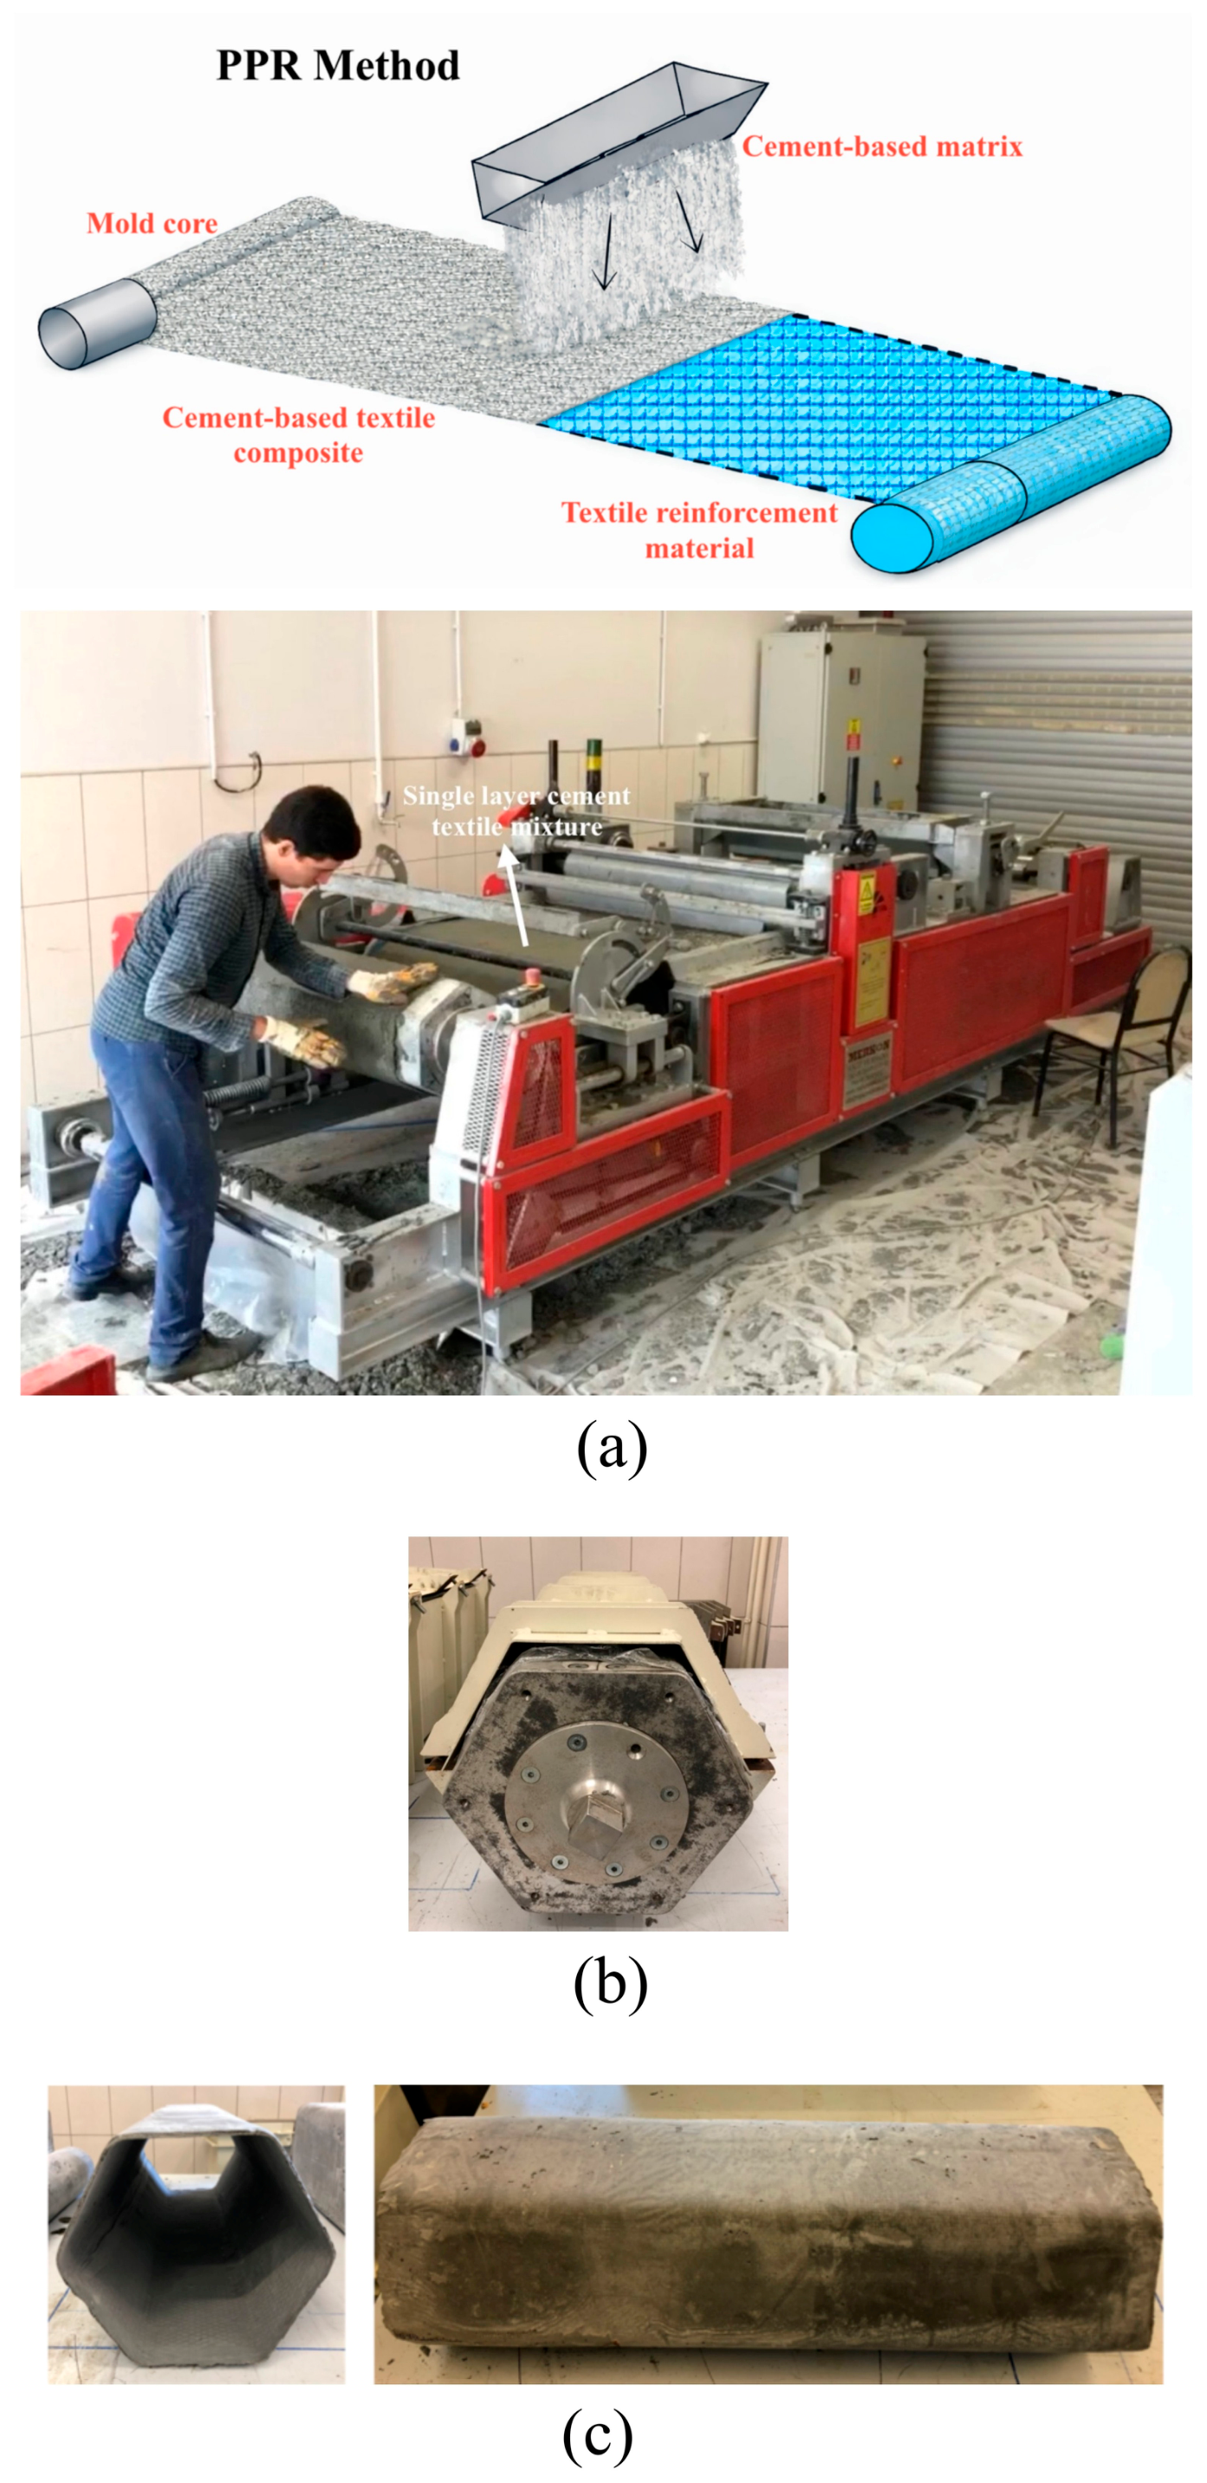
The pull–pour–roll (PPR) manufacturing technique, introduced by Daskiran et al. [
13], integrates features of pultrusion and lamination processes to fabricate textile-reinforced cement-based composite elements. The procedure begins with placing the textile reinforcement in a production bed, where cementitious mortar is poured to ensure thorough saturation of the fibers. The resulting semi-plastic cement–textile composite is then shaped using a mold, and multiple layers can be formed by wrapping the material around the mold. Hydrostatic pressure applied by the outer mold ensures uniform thickness and material consistency, followed by curing and cutting to the desired lengths. This innovative technique overcomes several limitations of conventional manufacturing methods and enables the efficient production of more uniform, practical, and rapidly fabricated composite elements using a specially developed manufacturing system.
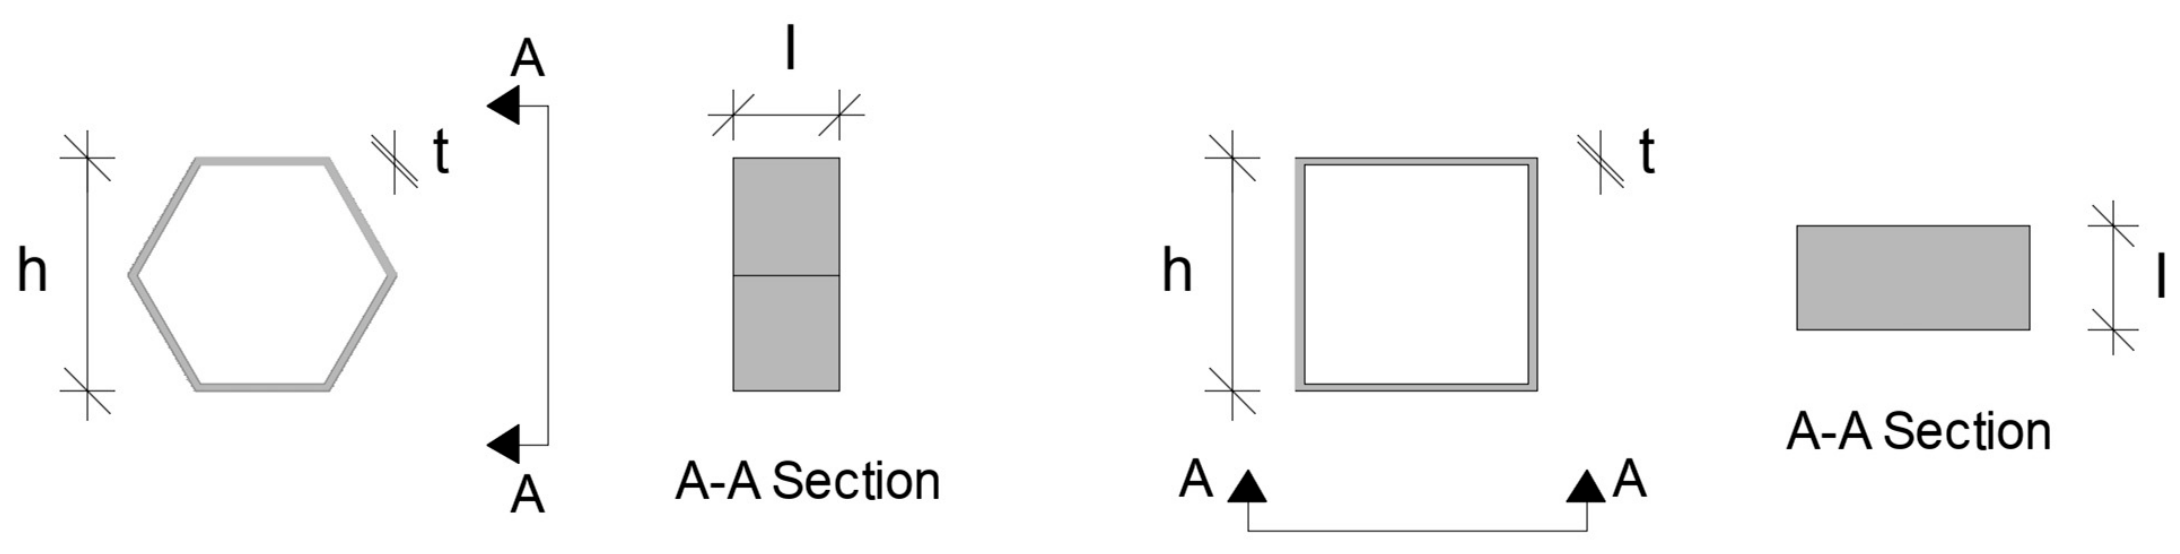
In addition to material development, the geometry of composite elements plays a critical role in their structural performance and practical applicability. In this study, hexagonal and square geometries are investigated as representative forms of modular hollow TRCC units. Each geometry exhibits distinct mechanical and practical characteristics under different loading conditions. The inclined edges of hexagonal units may provide alternative load-transfer paths, particularly under diagonal tension and shear-dominated loading conditions. In addition, their multi-sided configuration can facilitate more compact packing and interaction between adjacent elements in modular assemblies, which may be advantageous in panelized construction systems. The reduced presence of orthogonal corners may also contribute to a more distributed stress field compared with square geometries. In contrast, square units offer a simpler geometric configuration, which enables easier fabrication and more straightforward alignment within structural systems. Structurally, square geometries provide direct orthogonal load paths, which may result in higher stiffness under certain loading conditions. However, stress concentrations may develop at sharp corners, potentially influencing local damage behavior. Overall, each geometry presents specific advantages and limitations depending on the loading conditions and intended application. Therefore, both hexagonal and square configurations are considered in this study to evaluate the influence of geometric form on the mechanical behavior of TRCC elements, with square specimens investigated under selected loading conditions to provide a comparative reference.
Although significant progress has been achieved in understanding the mechanical and durability behavior of TRCC systems, limited research has focused on hollow hexagonal and square textile-reinforced cementitious composite elements together with their mechanical connector systems under different loading conditions. In addition, although advanced fracture-informed numerical approaches have recently been developed for damage simulation in cementitious materials, experimental studies capable of identifying global mechanical response, crack localization characteristics, and connector interaction mechanisms remain essential for validating and supporting such advanced modeling techniques.
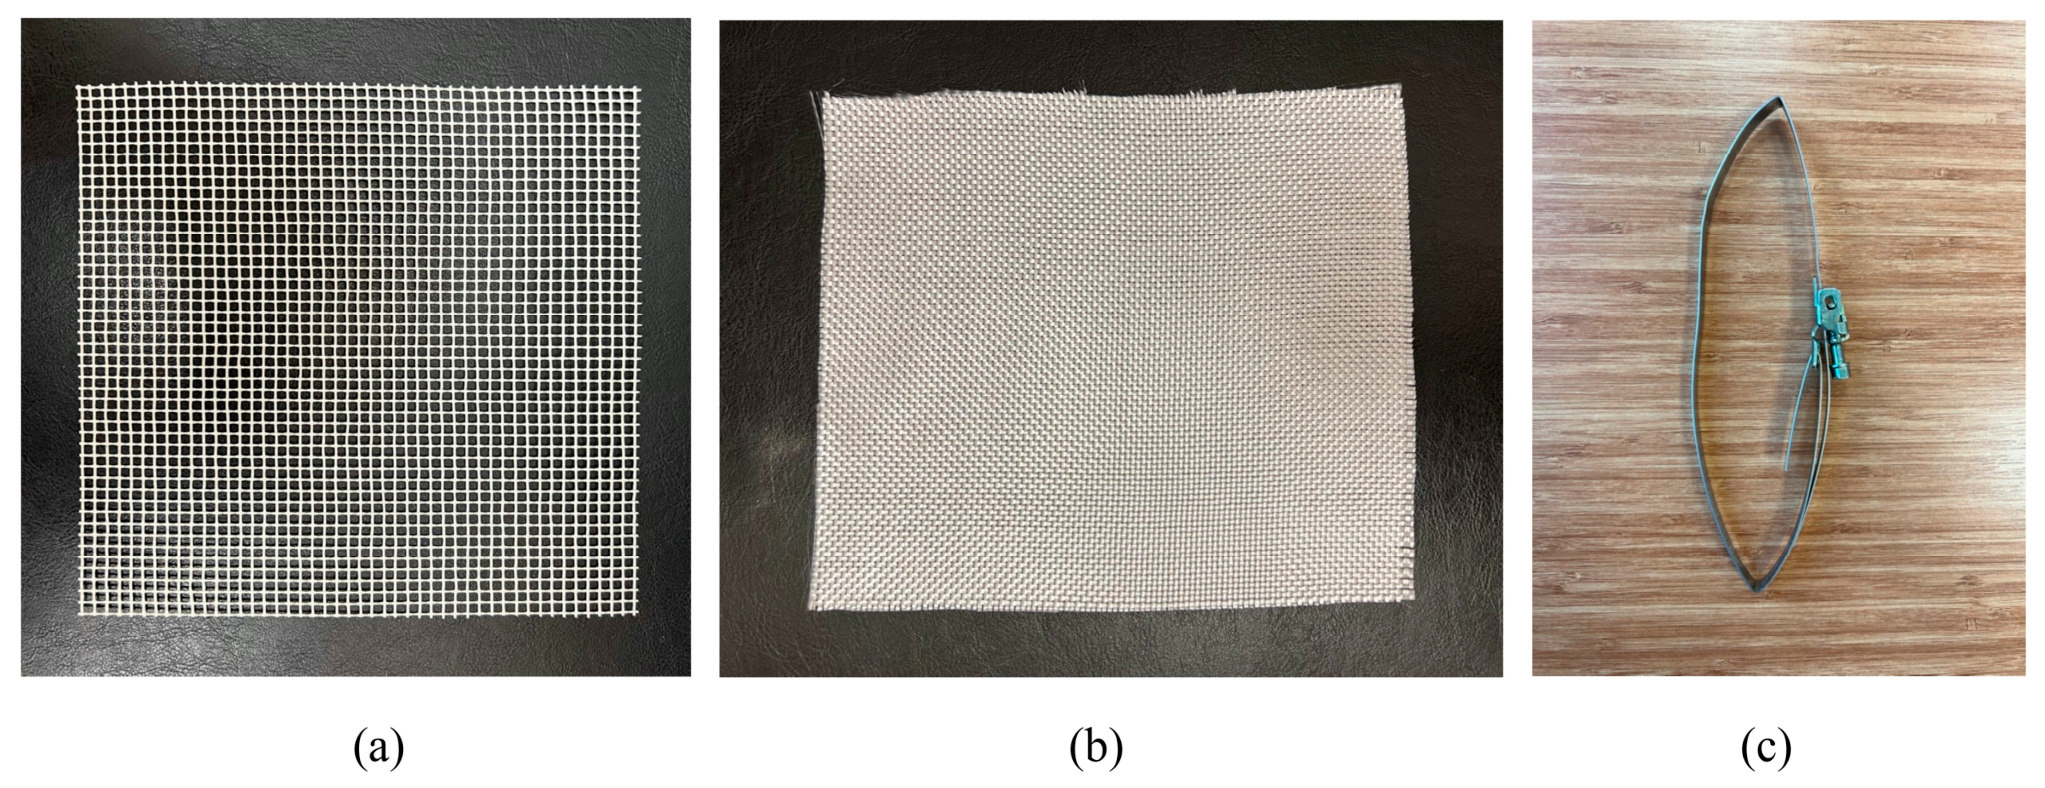
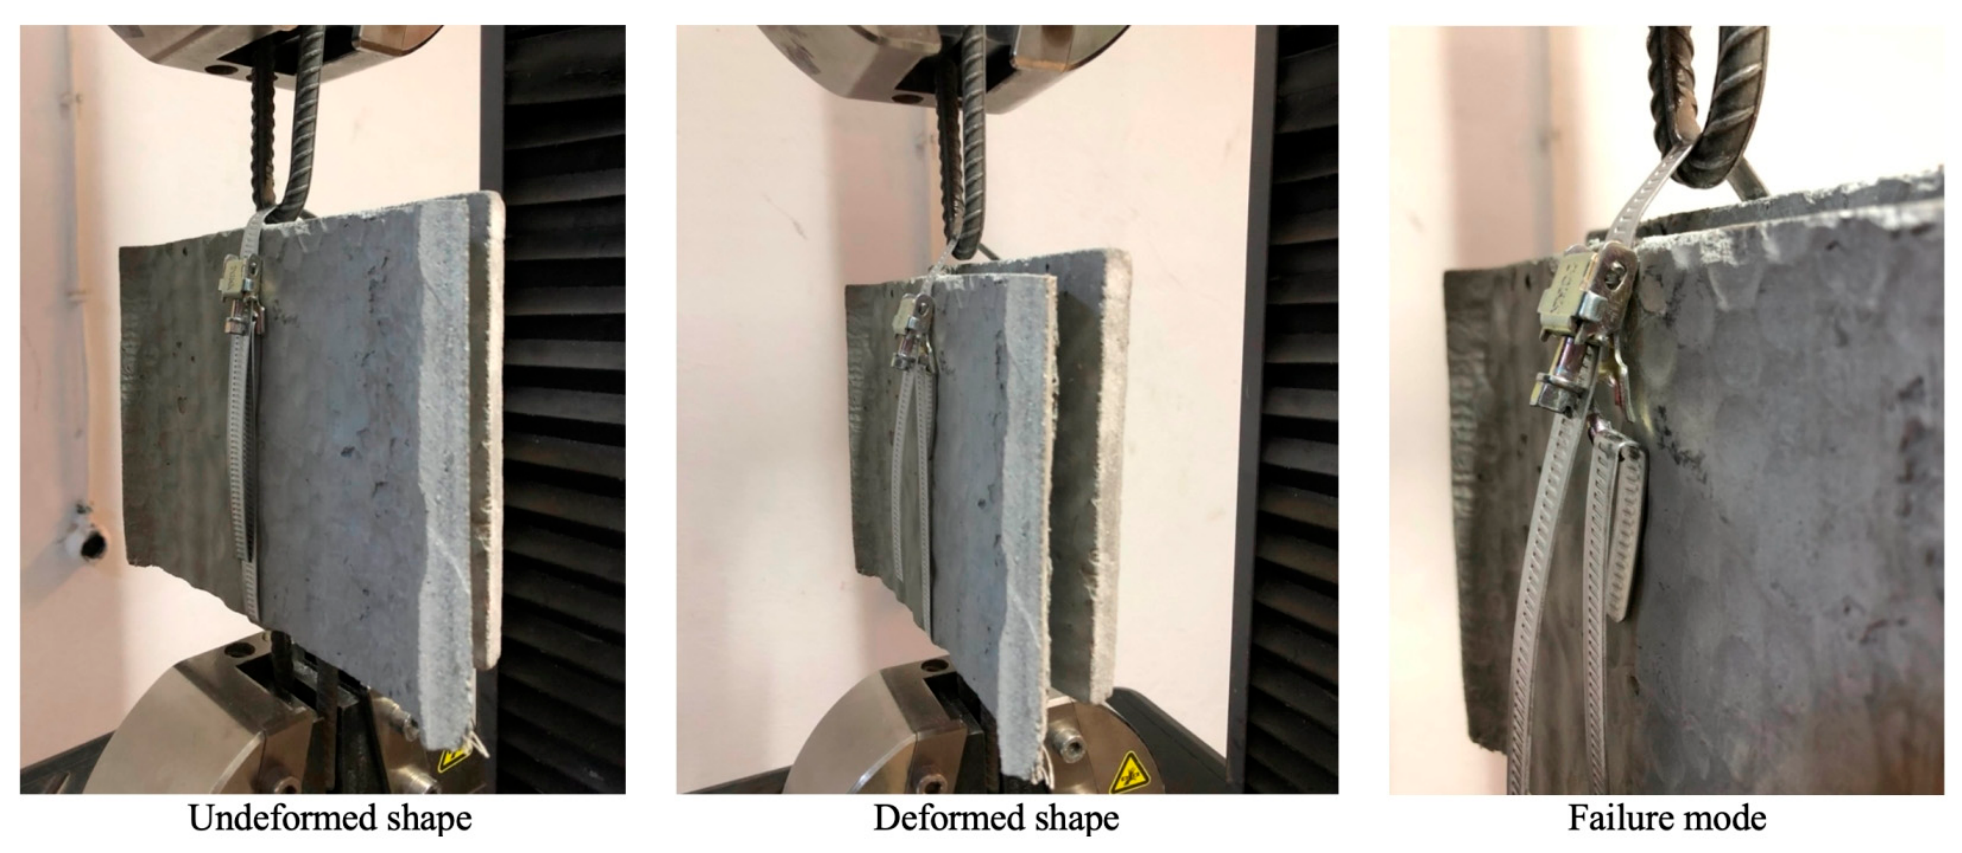
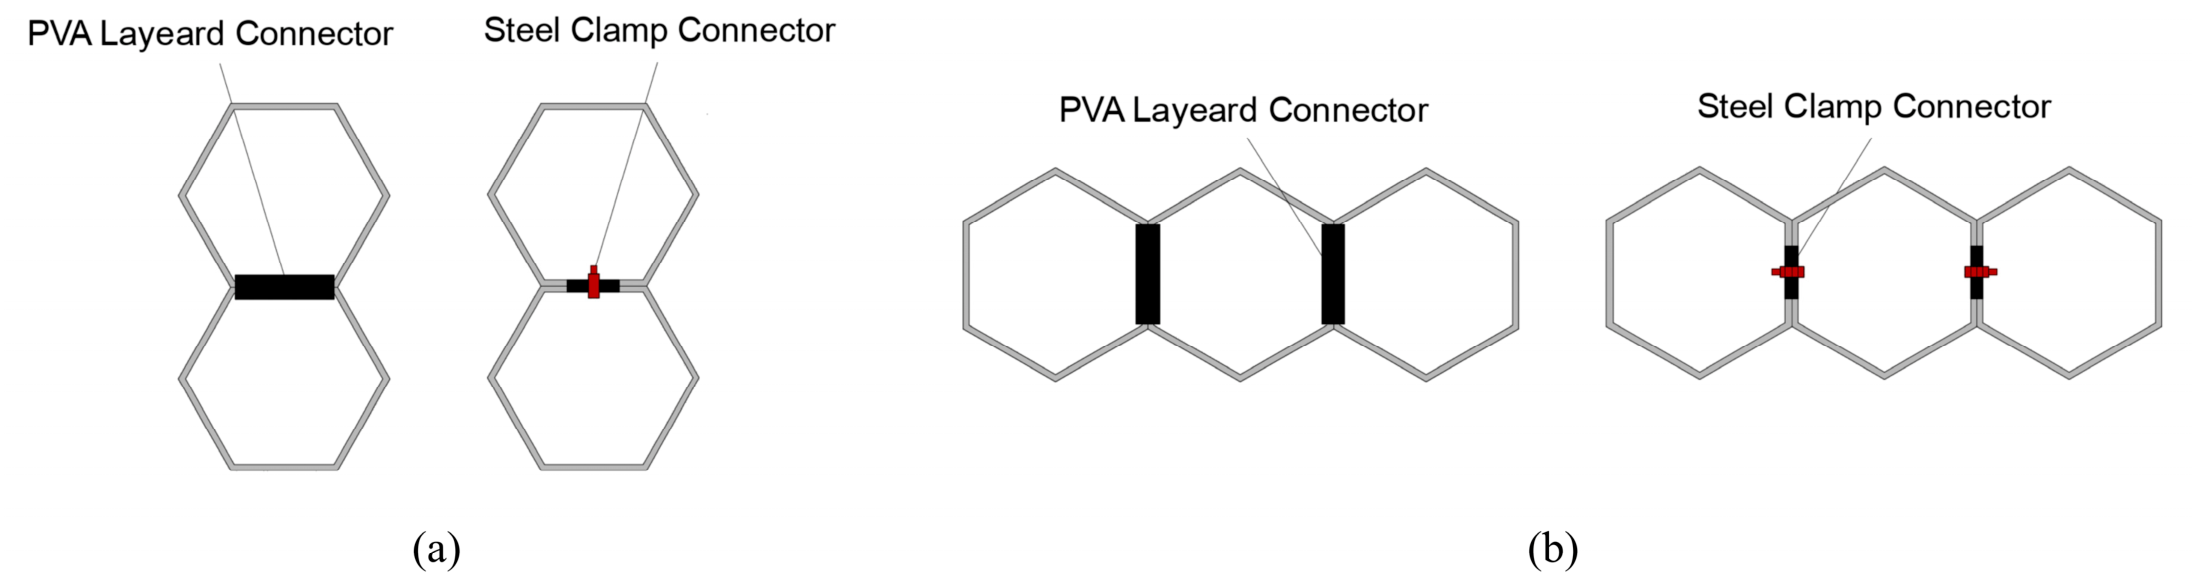
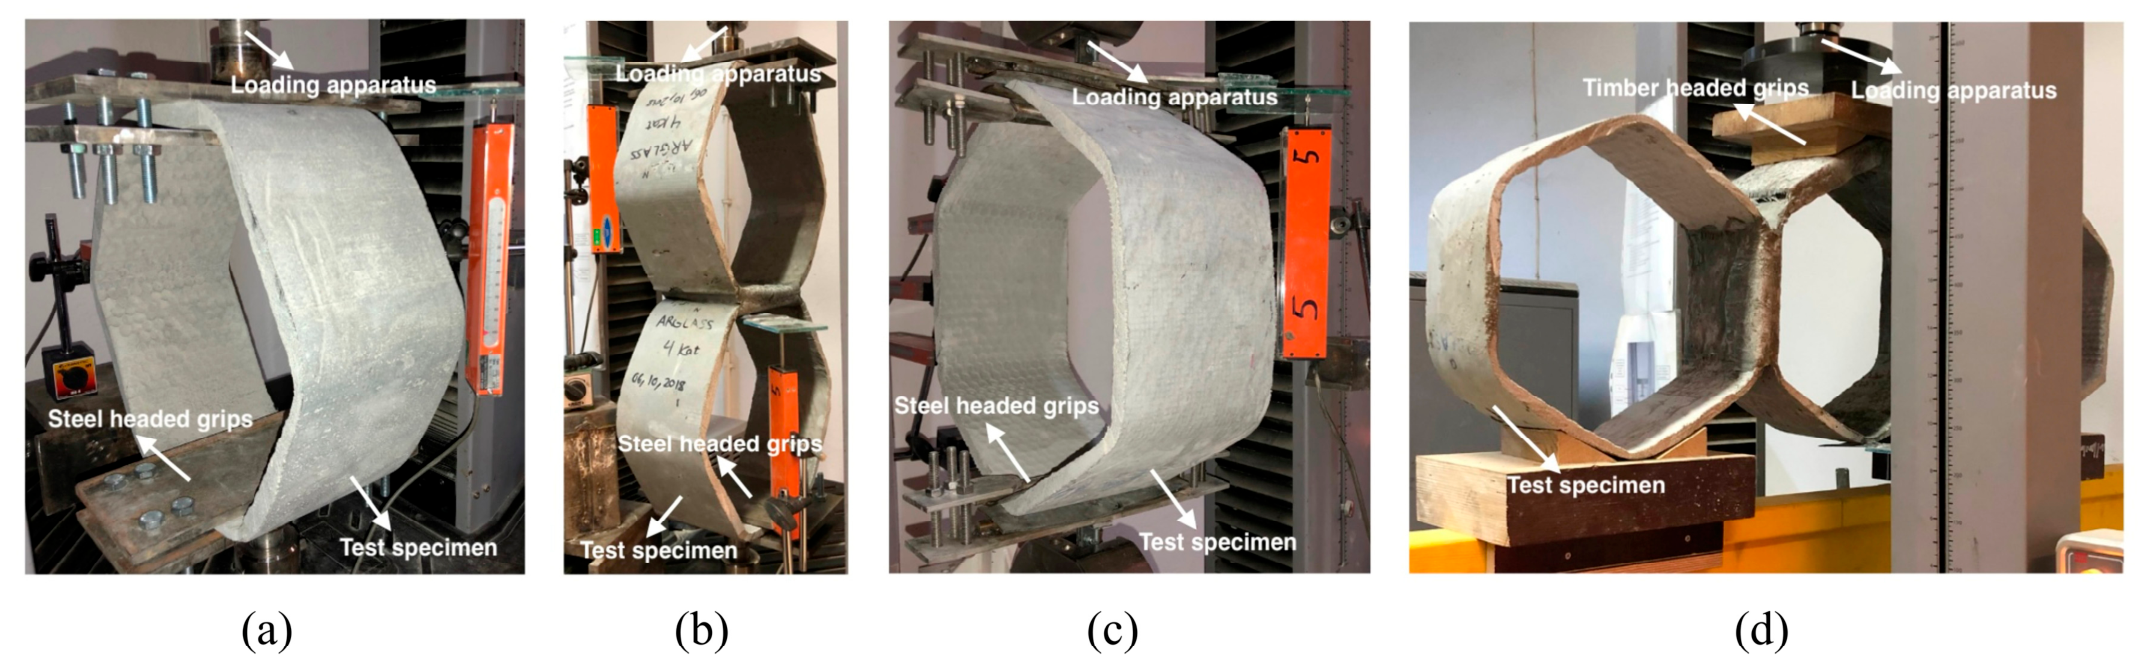
In this study, the structural performance of hexagonal and square alkali-resistant glass (HAG and SAG) textile-reinforced cementitious composite (TRCC) specimens, incorporating varying numbers of AR glass textile layers, was experimentally investigated under monotonic vertical compression, vertical tension, and diagonal tension loading. The specimens were fabricated using the pull–pour–roll (PPR) manufacturing technique and were developed for potential applications as infill wall elements, external cladding panels, and sandwich panel systems. In addition, the mechanical performance of the connecting elements, comprising polyvinyl alcohol (PVA) fiber-layered composite connectors and steel clamp connectors, was experimentally evaluated. These connecting systems were installed at the intersections of HAG specimens arranged in vertical and horizontal configurations and were subjected to vertical tension and lateral shear loading, respectively. Finally, finite element models of the HAG specimens were developed using Abaqus (Version 2020) [
30]. The established models were validated against the experimental results, and the adopted modeling strategies and underlying assumptions are presented in detail.
5. Experimental Results and Discussion
In this section, the experimental results are presented and discussed in two stages. In the first stage, the force–displacement responses, cracking patterns, damage modes, and energy dissipation capacities of the specimens are evaluated. The force–displacement relationships were obtained directly from the experimental measurements, whereas cracking patterns and damage modes were identified through visual observations during testing. The energy dissipation capacity was quantified by calculating the area enclosed by the force–displacement curves. In the second stage, key mechanical parameters, including the first cracking load and displacement, peak load and displacement, initial stiffness, post-cracking stiffness, and ductility ratio, are presented in numerical form. The first cracking load and first cracking displacement are denoted as Pcr and Dcr, respectively. The peak load (maximum load-carrying capacity) and the corresponding peak displacement (maximum displacement capacity) are denoted as Pp and Dp, respectively. The initial stiffness and post-cracking stiffness are represented by ki and kpc, respectively.
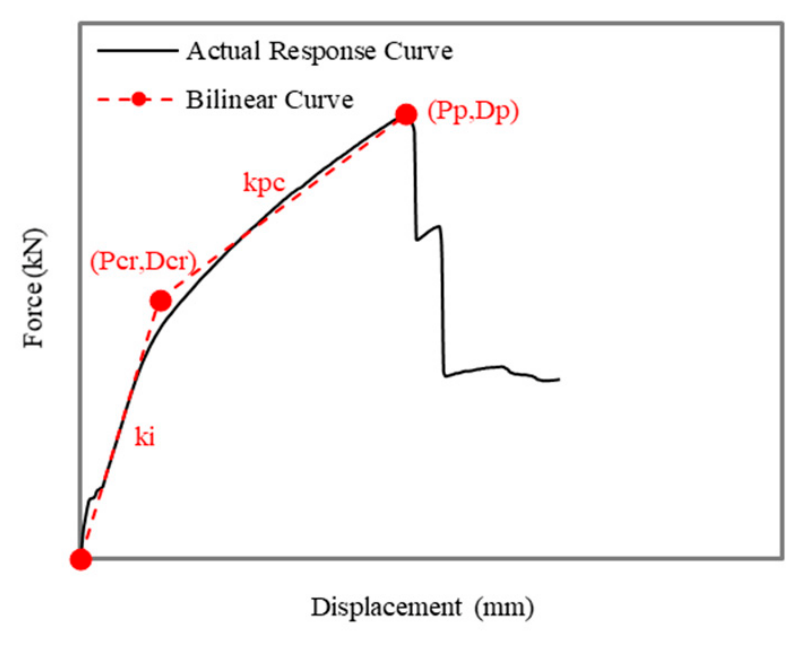
To accurately determine the cracking point, Uang’s method [
37], based on the equal-energy principle, was adopted for all loading scenarios to idealize the nonlinear force–displacement response using a bilinear approximation, as shown in
Figure 11. According to this method, the cracking point (Pcr, Dcr) is identified such that the energy dissipated by the actual response curve is approximately equal to that of the bilinear idealization. As illustrated in
Figure 11, the first segment of the bilinear curve passes through the origin (0,0) and the cracking point (Pcr, Dcr), while the second segment connects the cracking point (Pcr, Dcr) to the peak point (Pp, Dp). The cracking point represents the initiation of the first visible crack, whereas the peak point corresponds to the ultimate state of the force–displacement response.
Furthermore, the peak displacement (Dp) corresponds to the displacement at the peak load (Pp), while the peak load represents the maximum force attained on the force–displacement curve, as illustrated in
Figure 11. The initial stiffness (ki) was calculated as the ratio of the cracking load (Pcr) to the cracking displacement (Dcr). The post-cracking stiffness (kpc) was defined as the slope of the line connecting the cracking point (Pcr, Dcr) and the peak point (Pp, Dp). The ductility ratio was determined as the ratio of the peak displacement (Dp) to the cracking displacement (Dcr).
The initial stiffness was determined based on the assumption of approximately linear elastic behavior up to the first cracking point. This assumption was supported by the experimental observations, where the force–displacement responses exhibited an approximately linear trend prior to the onset of visible cracking, as identified using Uang’s equal-energy bilinear idealization method. Although minor localized nonlinearities, such as microcracking or matrix–textile interfacial effects, may occur before the formation of the first visible crack, these effects did not significantly influence the global force–displacement response of the specimens and were therefore not explicitly considered in the stiffness calculations. Accordingly, the adopted bilinear idealization was considered a practical engineering approximation for evaluating the global stiffness characteristics and deformation parameters of the quasi-brittle composite specimens investigated in this study. The comparison between hexagonal and square geometries also enables assessment of geometric influence on mechanical response parameters, including stiffness, load-carrying capacity, and energy dissipation.
5.1. Single Specimen Tests
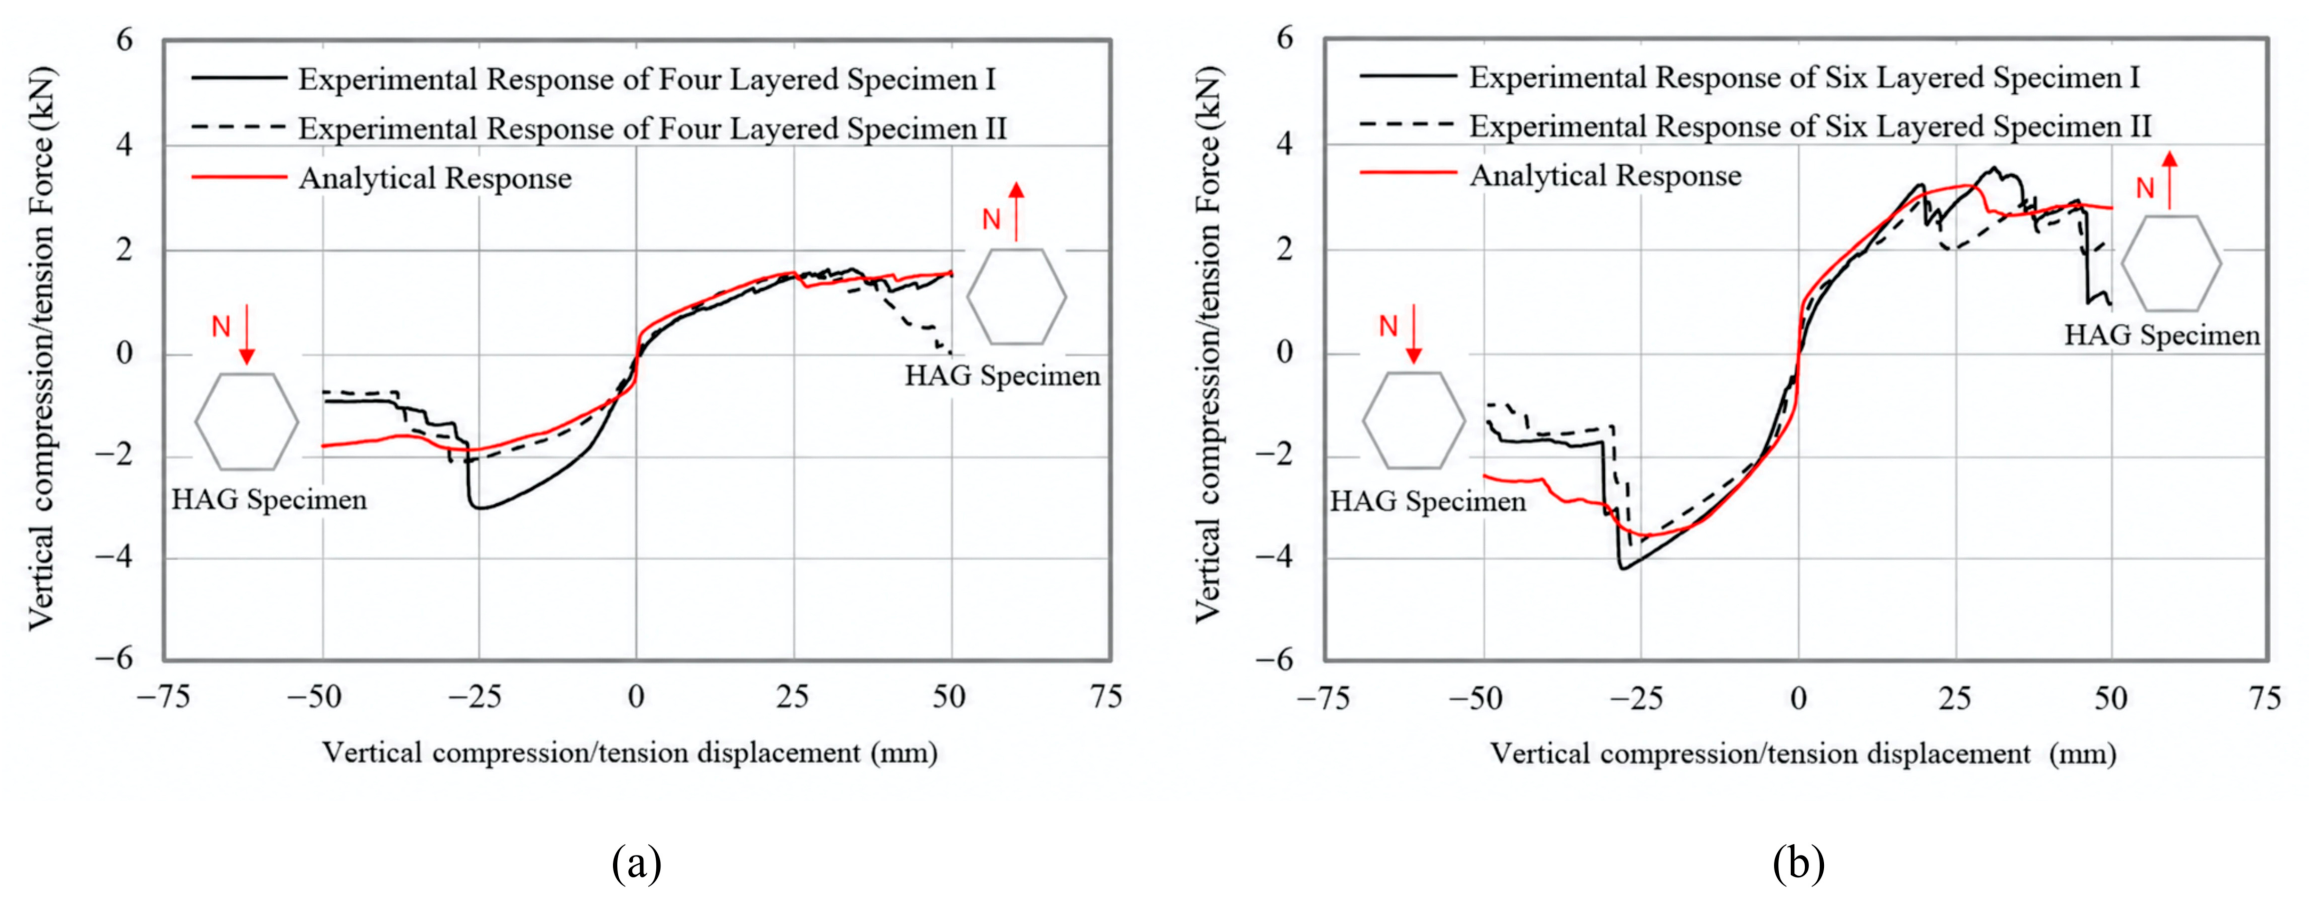
At this part, the experimental results of HAG and SAG specimens with different numbers of layers subjected to vertical compression/tension and diagonal tension effects are presented and evaluated. Also, the experimental results of tested specimens are presented in numerical format. As shown in
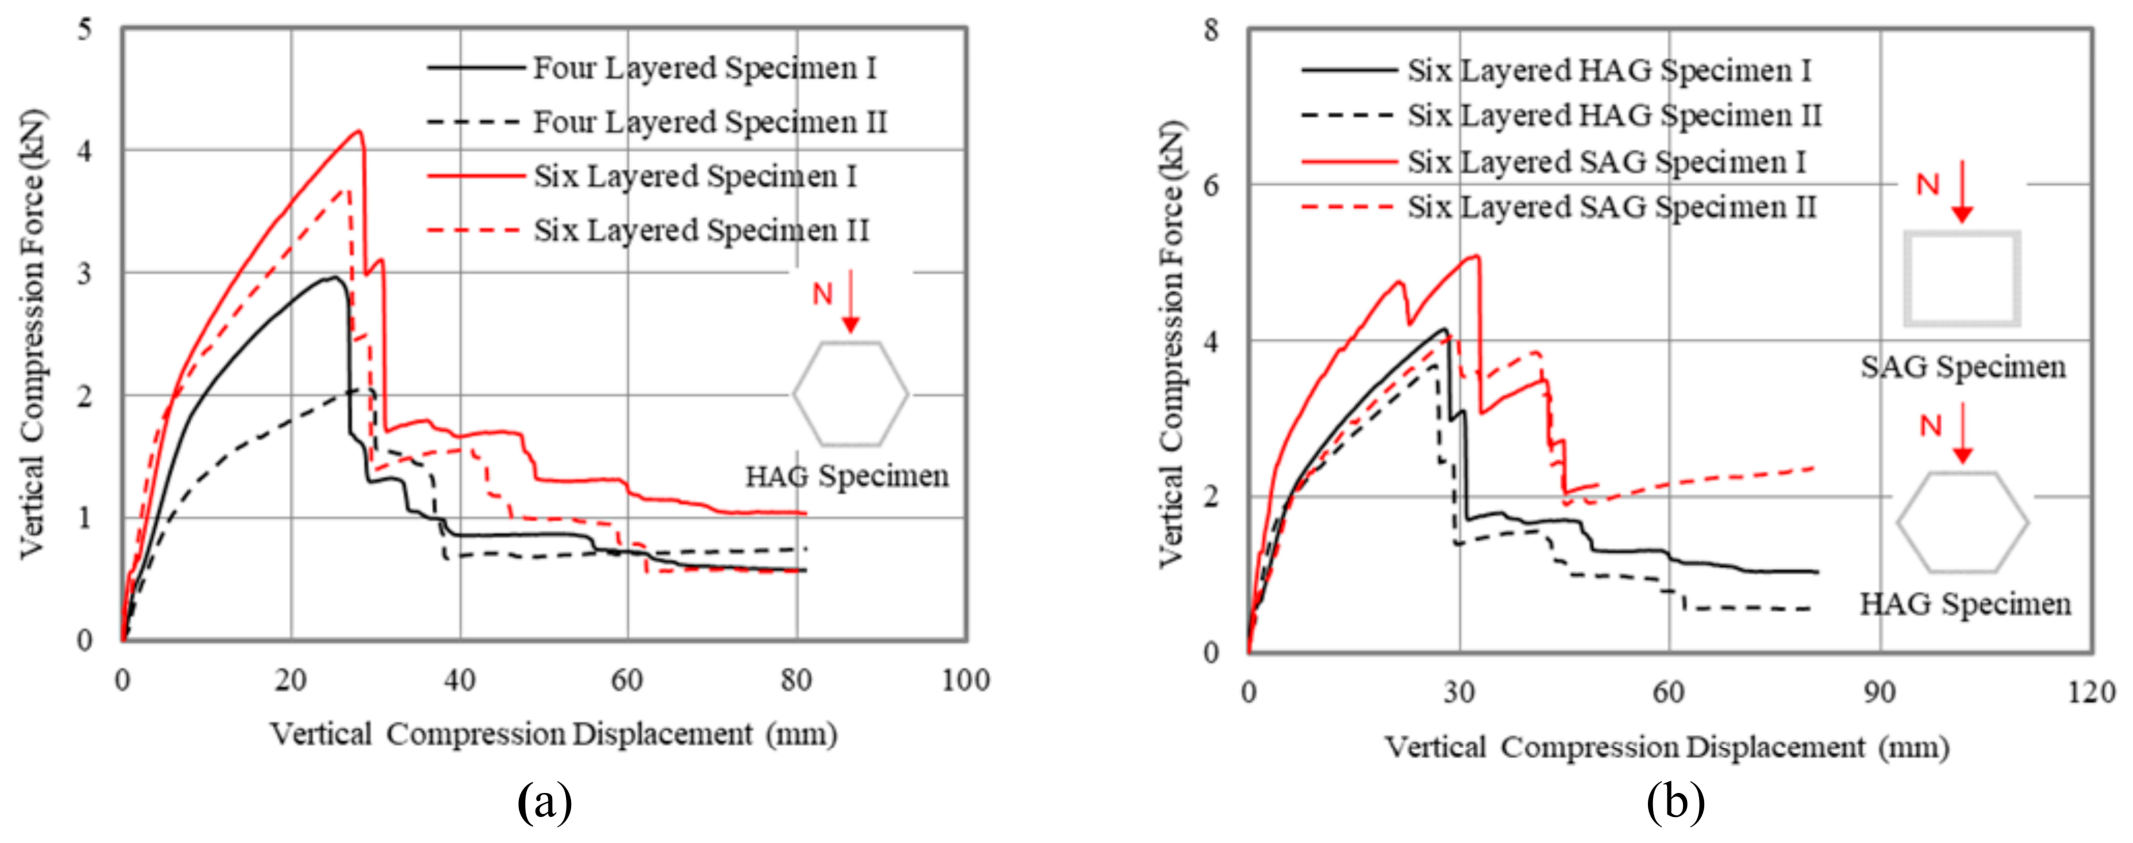
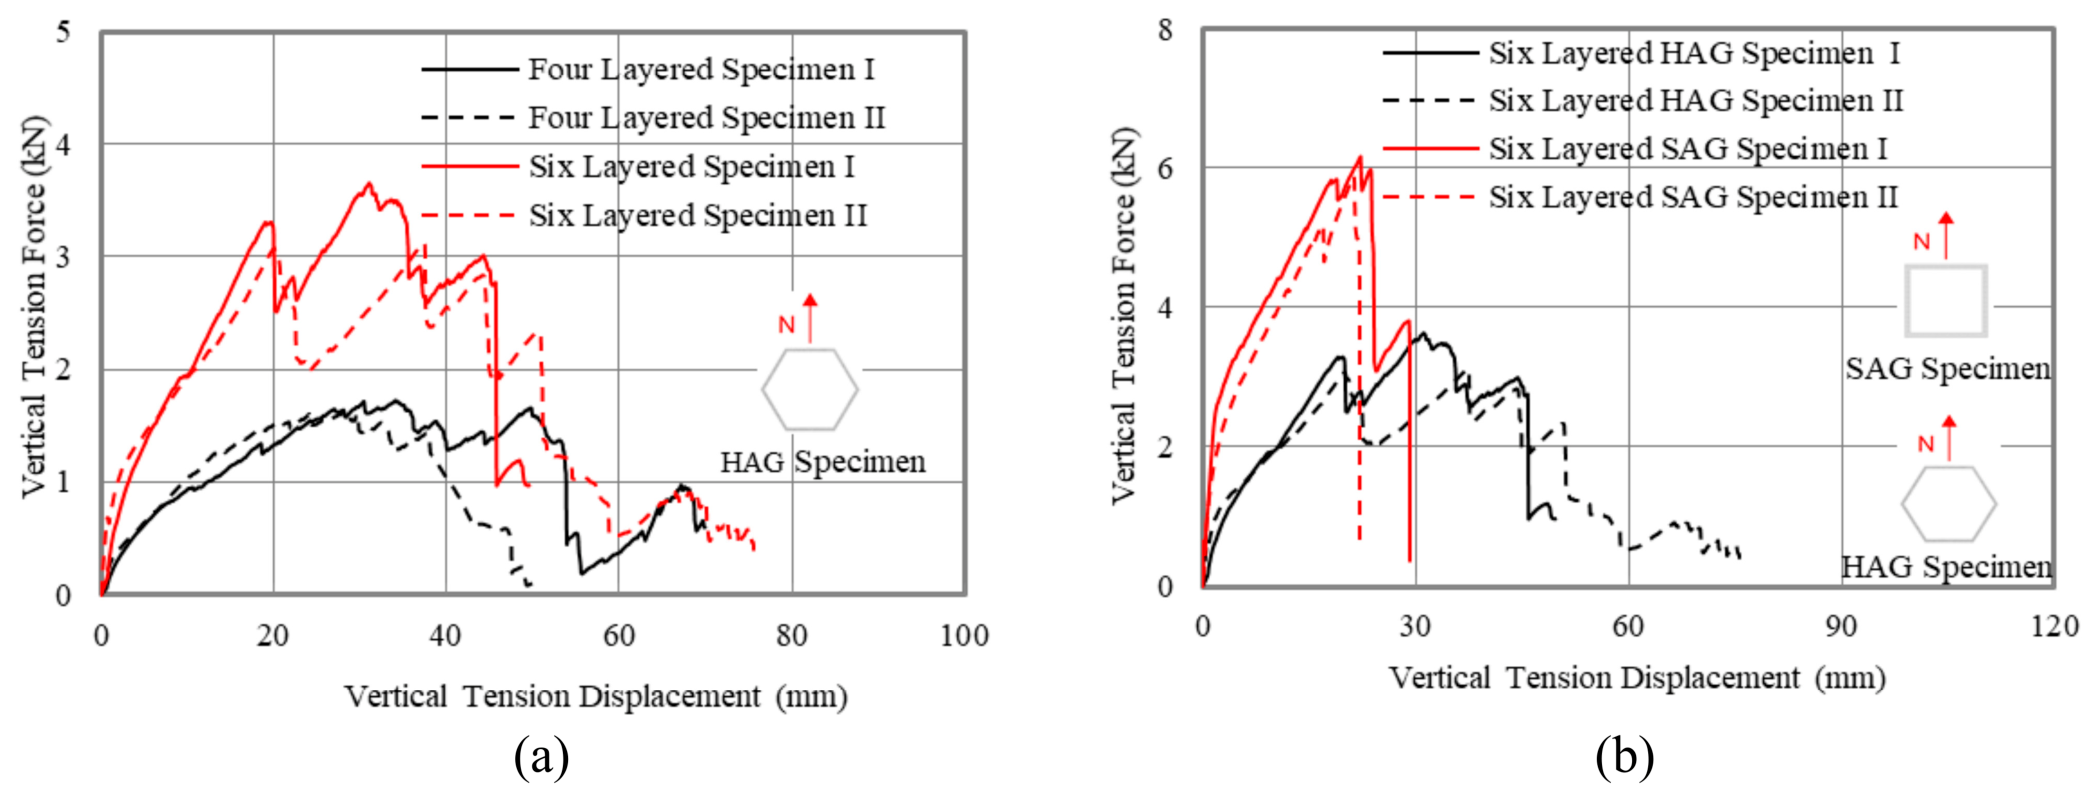
Figure 12,
Figure 13 and
Figure 14, the behavior mechanism of HAG and SAG specimens with different number of layers under vertical compression/tension and diagonal tension displacements was the same. The response curves of the test specimens in terms of force-displacement relationship consisted of three stages: linear elastic stage, initiation of crack formation in mortar composites along with post-cracking stage and failure stage. In the first stage, the specimens demonstrated linear elastic behavior without any cracking in the mortar. The second stage, which began with the occurrence of cracks, continued with the propagation and growth of the width of the cracks throughout this stage under applied displacements. Also at the end of this stage, the mortar was separated from the textile layers and the textile layers became the main components that could withstand the applied effects resulting in strain hardening of the response curve. However, the sudden drop and subsequent rise of the curve at the end of the second stage under the vertical tensile effect was mostly due to the redistribution of stress, which was more pronounced in the HAG specimen than in the SAG specimen. Finally, at the beginning of the third stage, a sudden drop in the force-displacement curve occurred due to fiber rupture.
Due to practical constraints related to specimen preparation and testing time, each configuration was evaluated using two specimens. Accordingly, the reported results are based on average values, and the corresponding percentage differences are intended to indicate general behavioral trends rather than statistically significant variations. Although a rigorous statistical assessment could not be performed, the observed responses were consistent across the tested specimens, supporting the reliability of the identified trends.
5.1.1. Force-Displacement Relations
Vertical Compression Effect
The experimental results indicate that both the average cracking load and the average peak load increased with an increasing number of textile layers under vertical compression, as shown in
Figure 12a. For the four-layer HAG specimens, the average cracking and peak loads were 1.69 kN and 2.52 kN, respectively. In contrast, the six-layer HAG specimens exhibited average cracking and peak loads of 2.19 kN and 3.93 kN, respectively. An increase of 50% in the number of textile layers resulted in a 30.0% increase in the average cracking load and a 56.0% increase in the average peak load, as summarized in
Table 4.
In addition, the average cracking and peak loads increased when the specimen geometry was changed from hexagonal to square under vertical compression, as illustrated in
Figure 12b. For the six-layer specimens, the HAG configuration exhibited average cracking and peak loads of 2.19 kN and 3.93 kN, respectively, whereas the six-layer SAG specimens reached 2.83 kN and 4.59 kN, respectively. This geometric modification resulted in a 29.0% increase in the average cracking load and a 16.8% increase in the average peak load, as summarized in
Table 4.
Some variability was observed between nominally identical specimens, particularly in ductility-related parameters. This variation is mainly attributed to the inherent heterogeneity of quasi-brittle composite materials, local differences in textile impregnation and mortar distribution, manufacturing tolerances, and the sensitivity of crack initiation and propagation mechanisms. Since each configuration was represented by two specimens, the evaluation of the results was primarily based on average response values and overall behavioral trends rather than detailed statistical assessment.
Vertical Tension Effect
As illustrated in
Figure 13a, both the average cracking load and the average peak load increased with an increase in the number of textile layers under vertical tension. For the four-layer HAG specimens, the average cracking and peak loads were 0.81 kN and 1.66 kN, respectively. In comparison, the six-layer HAG specimens exhibited average cracking and peak loads of 1.48 kN and 3.39 kN, respectively. An increase of 50% in the number of textile layers resulted in an 82.7% increase in the average cracking load and a 104.2% increase in the average peak load, as summarized in
Table 5.
Moreover, a significant increase in both the average cracking load and the average peak load was observed when the specimen geometry was changed from hexagonal to square under vertical tension, as shown in
Figure 13b. For the six-layer specimens, the HAG configuration exhibited average cracking and peak loads of 1.48 kN and 3.39 kN, respectively, whereas the six-layer SAG specimens achieved 2.60 kN and 6.03 kN, respectively. This change in geometry resulted in increases of 75.7% in the average cracking load and 77.9% in the average peak load, as summarized in
Table 5.
Diagonal Tension Effect
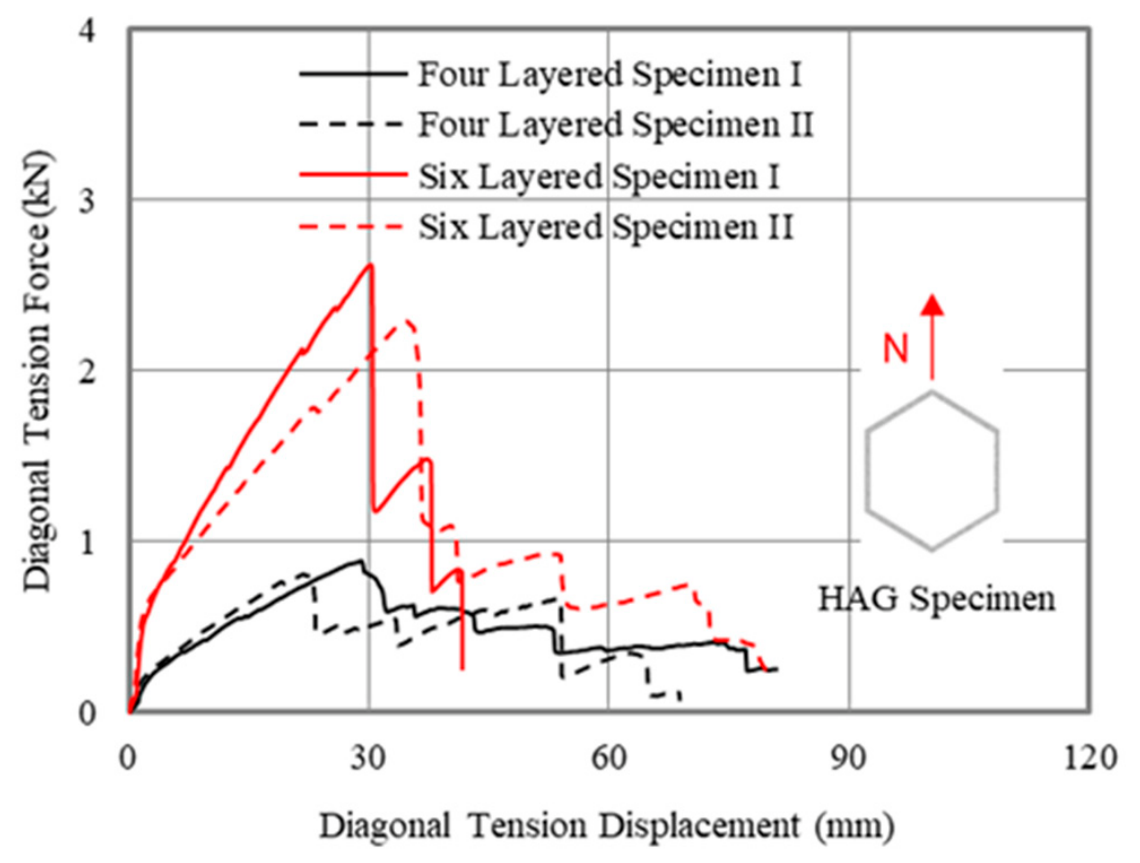
As illustrated in
Figure 14, the average cracking load and average peak load increased substantially with an increase in the number of textile layers under diagonal tension. For the four-layer HAG specimens, the average cracking and peak loads were 0.29 kN and 0.79 kN, respectively. In comparison, the six-layer HAG specimens exhibited average cracking and peak loads of 0.85 kN and 2.50 kN, respectively. A 50% increase in the number of textile layers resulted in a 193.1% increase in the average cracking load and a 216.4% increase in the average peak load, as summarized in
Table 6.
5.1.2. Cracking Displacement, Peak Displacement and Ductility
Vertical Compression Effect
Under vertical compression, the average cracking displacement decreased with an increasing number of textile layers, as shown in
Figure 12a. The average cracking displacement was 7.4 mm for the four-layer HAG specimens and 5.4 mm for the six-layer HAG specimens, corresponding to a reduction of approximately 27.0% with a 50.0% increase in the number of layers. In contrast, both configurations exhibited nearly identical average peak displacements of approximately 27.0 mm, indicating that the peak displacement was not significantly influenced by the number of layers. Owing to the reduced cracking displacement and similar peak displacement, the six-layer specimens exhibited a more ductile response, with an approximate 42.0% increase in average ductility compared to the four-layer specimens (
Table 4). Furthermore, when the specimen geometry was changed from hexagonal to square under vertical compression, slight increases were observed in both cracking and peak displacements, resulting in a comparable ductility ratio of approximately 5.0 for both configurations (
Figure 12b). For the six-layer specimens, the HAG configuration exhibited average cracking and peak displacements of 5.4 mm and 27.2 mm, respectively, whereas the SAG configuration reached 6.38 mm and 31.0 mm, respectively. This corresponds to increases of 18.2% in cracking displacement and 14.0% in peak displacement for the SAG specimens relative to the HAG specimens, as summarized in
Table 4.
Vertical Tension Effect
Under vertical tension, the average cracking displacement decreased, whereas the average peak displacement increased with an increasing number of textile layers, as shown in
Figure 13a. The average cracking and peak displacements for the four-layer HAG specimens were 4.0 mm and 31.0 mm, respectively, while the corresponding values for the six-layer HAG specimens were 3.3 mm and 34.3 mm. This corresponds to a reduction of approximately 17.5% in cracking displacement and an increase of 10.6% in peak displacement with a 50% increase in the number of layers. Consequently, the average ductility increased by approximately 36.5%, as summarized in
Table 5. Furthermore, when the specimen geometry was changed from hexagonal to square under vertical tension, both the average cracking and peak displacements decreased, as illustrated in
Figure 13b. For the six-layer specimens, the HAG configuration exhibited average cracking and peak displacements of 3.4 mm and 34.3 mm, respectively, whereas the SAG configuration showed values of 1.8 mm and 21.8 mm, respectively. These results indicate reductions of approximately 47.0% in cracking displacement and 36.4% in peak displacement for the SAG specimens compared to the HAG specimens. Despite the reduction in displacement capacities, the ductility ratio increased by approximately 13.0% with the change in specimen geometry (
Table 5).
Diagonal Tension Effect
As illustrated in
Figure 14, under diagonal tension, the average cracking displacement remained nearly unchanged with an increasing number of textile layers, whereas the average peak displacement increased by approximately 27.5%. The average cracking and peak displacements were 3.0 mm and 25.5 mm, respectively, for the four-layer HAG specimens, and 2.8 mm and 32.5 mm, respectively, for the six-layer HAG specimens (
Table 6). Consequently, increasing the number of textile layers resulted in an approximate 20.3% increase in ductility.
5.1.3. Cracking Pattern and Damage Mode
Vertical Compression/Tension Effect
The observed differences between the hexagonal (HAG) and square (SAG) specimens can be attributed to geometry-dependent load transfer mechanisms and stress distribution. In the SAG specimens, the orthogonal faces are more directly aligned with the vertical loading direction, resulting in a more direct load path and contributing to higher stiffness and load-carrying capacity under vertical compression and tension. This interpretation is consistent with the experimental results, where the six-layer SAG specimens exhibited higher cracking load, peak load, and stiffness than the corresponding six-layer HAG specimens. In contrast, the inclined faces of the HAG specimens promote multidirectional load transfer and stress redistribution, contributing to more gradual deformation development and different cracking characteristics.
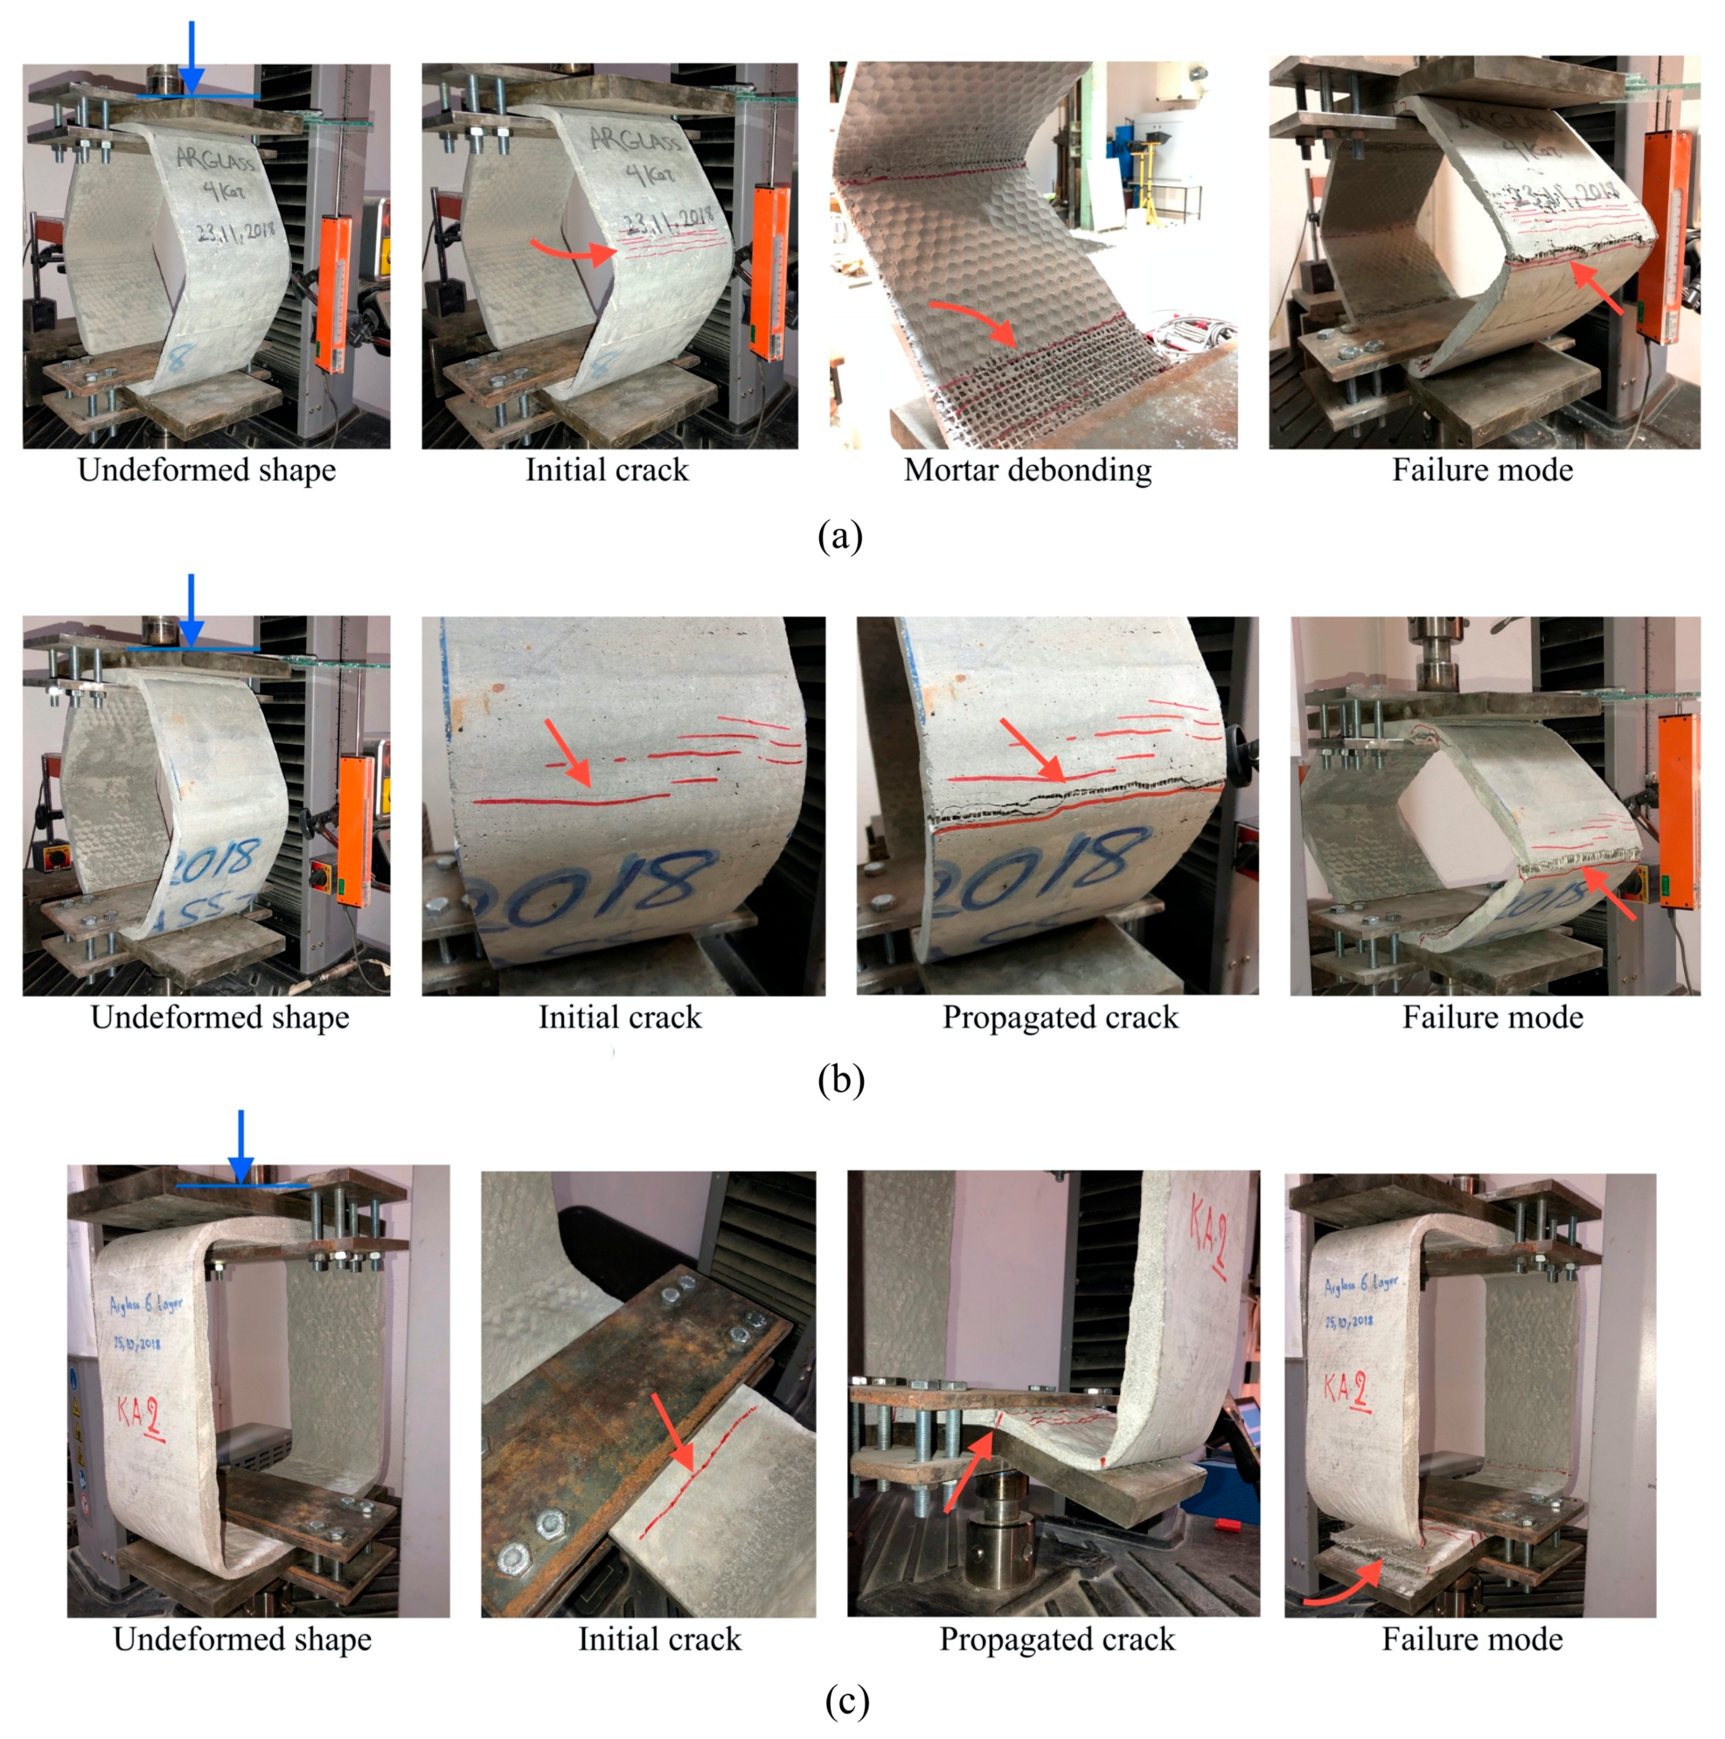
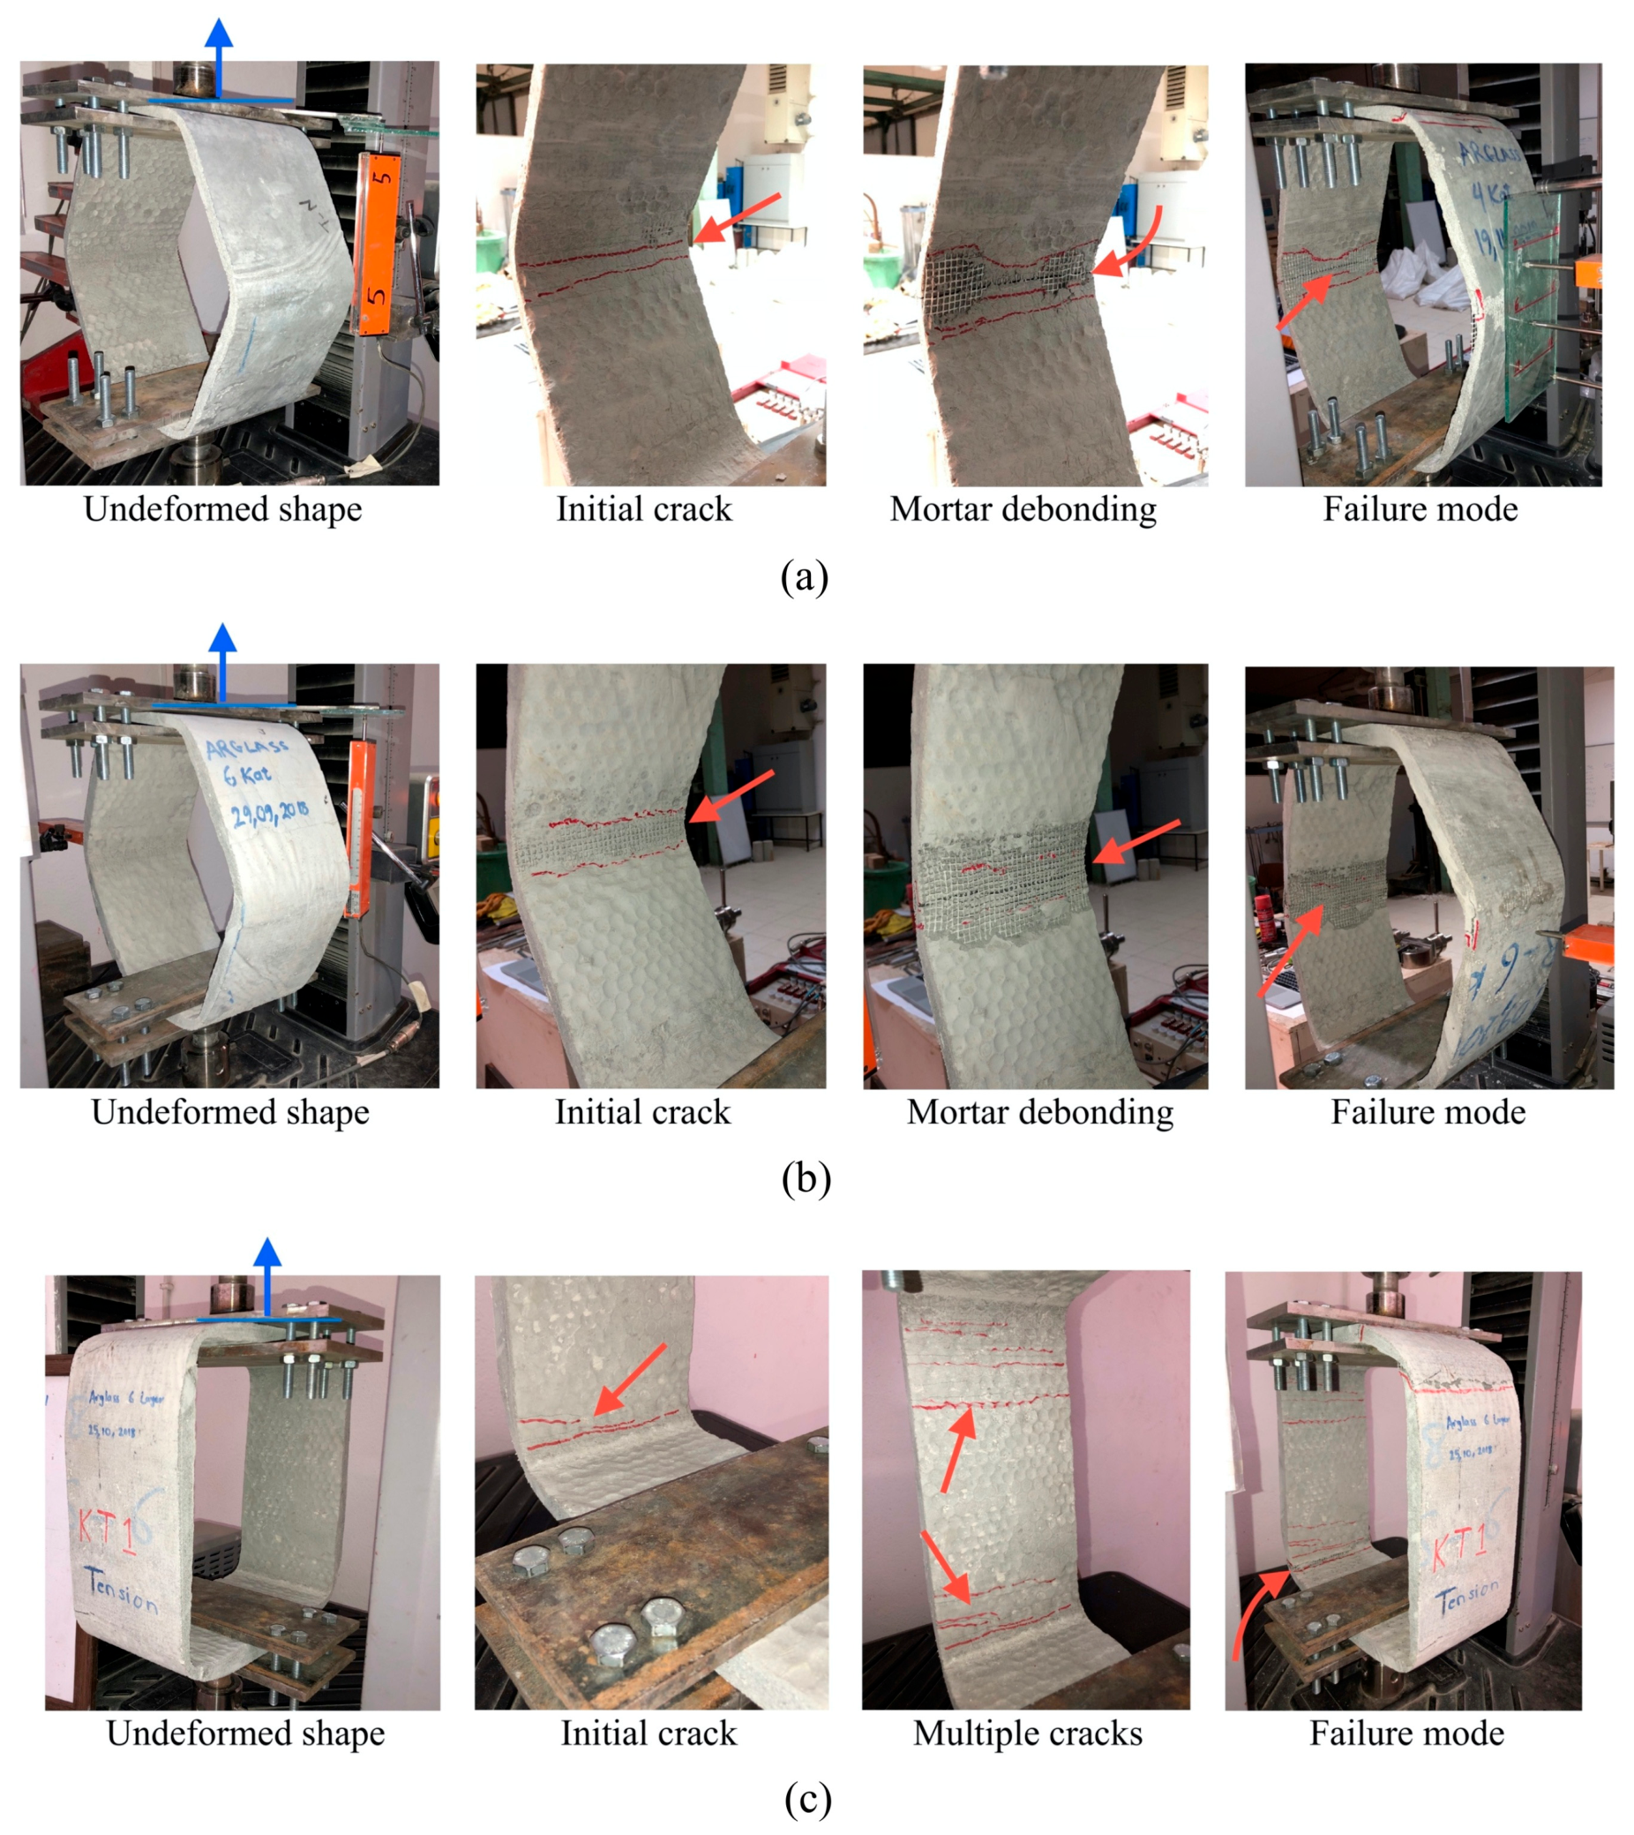
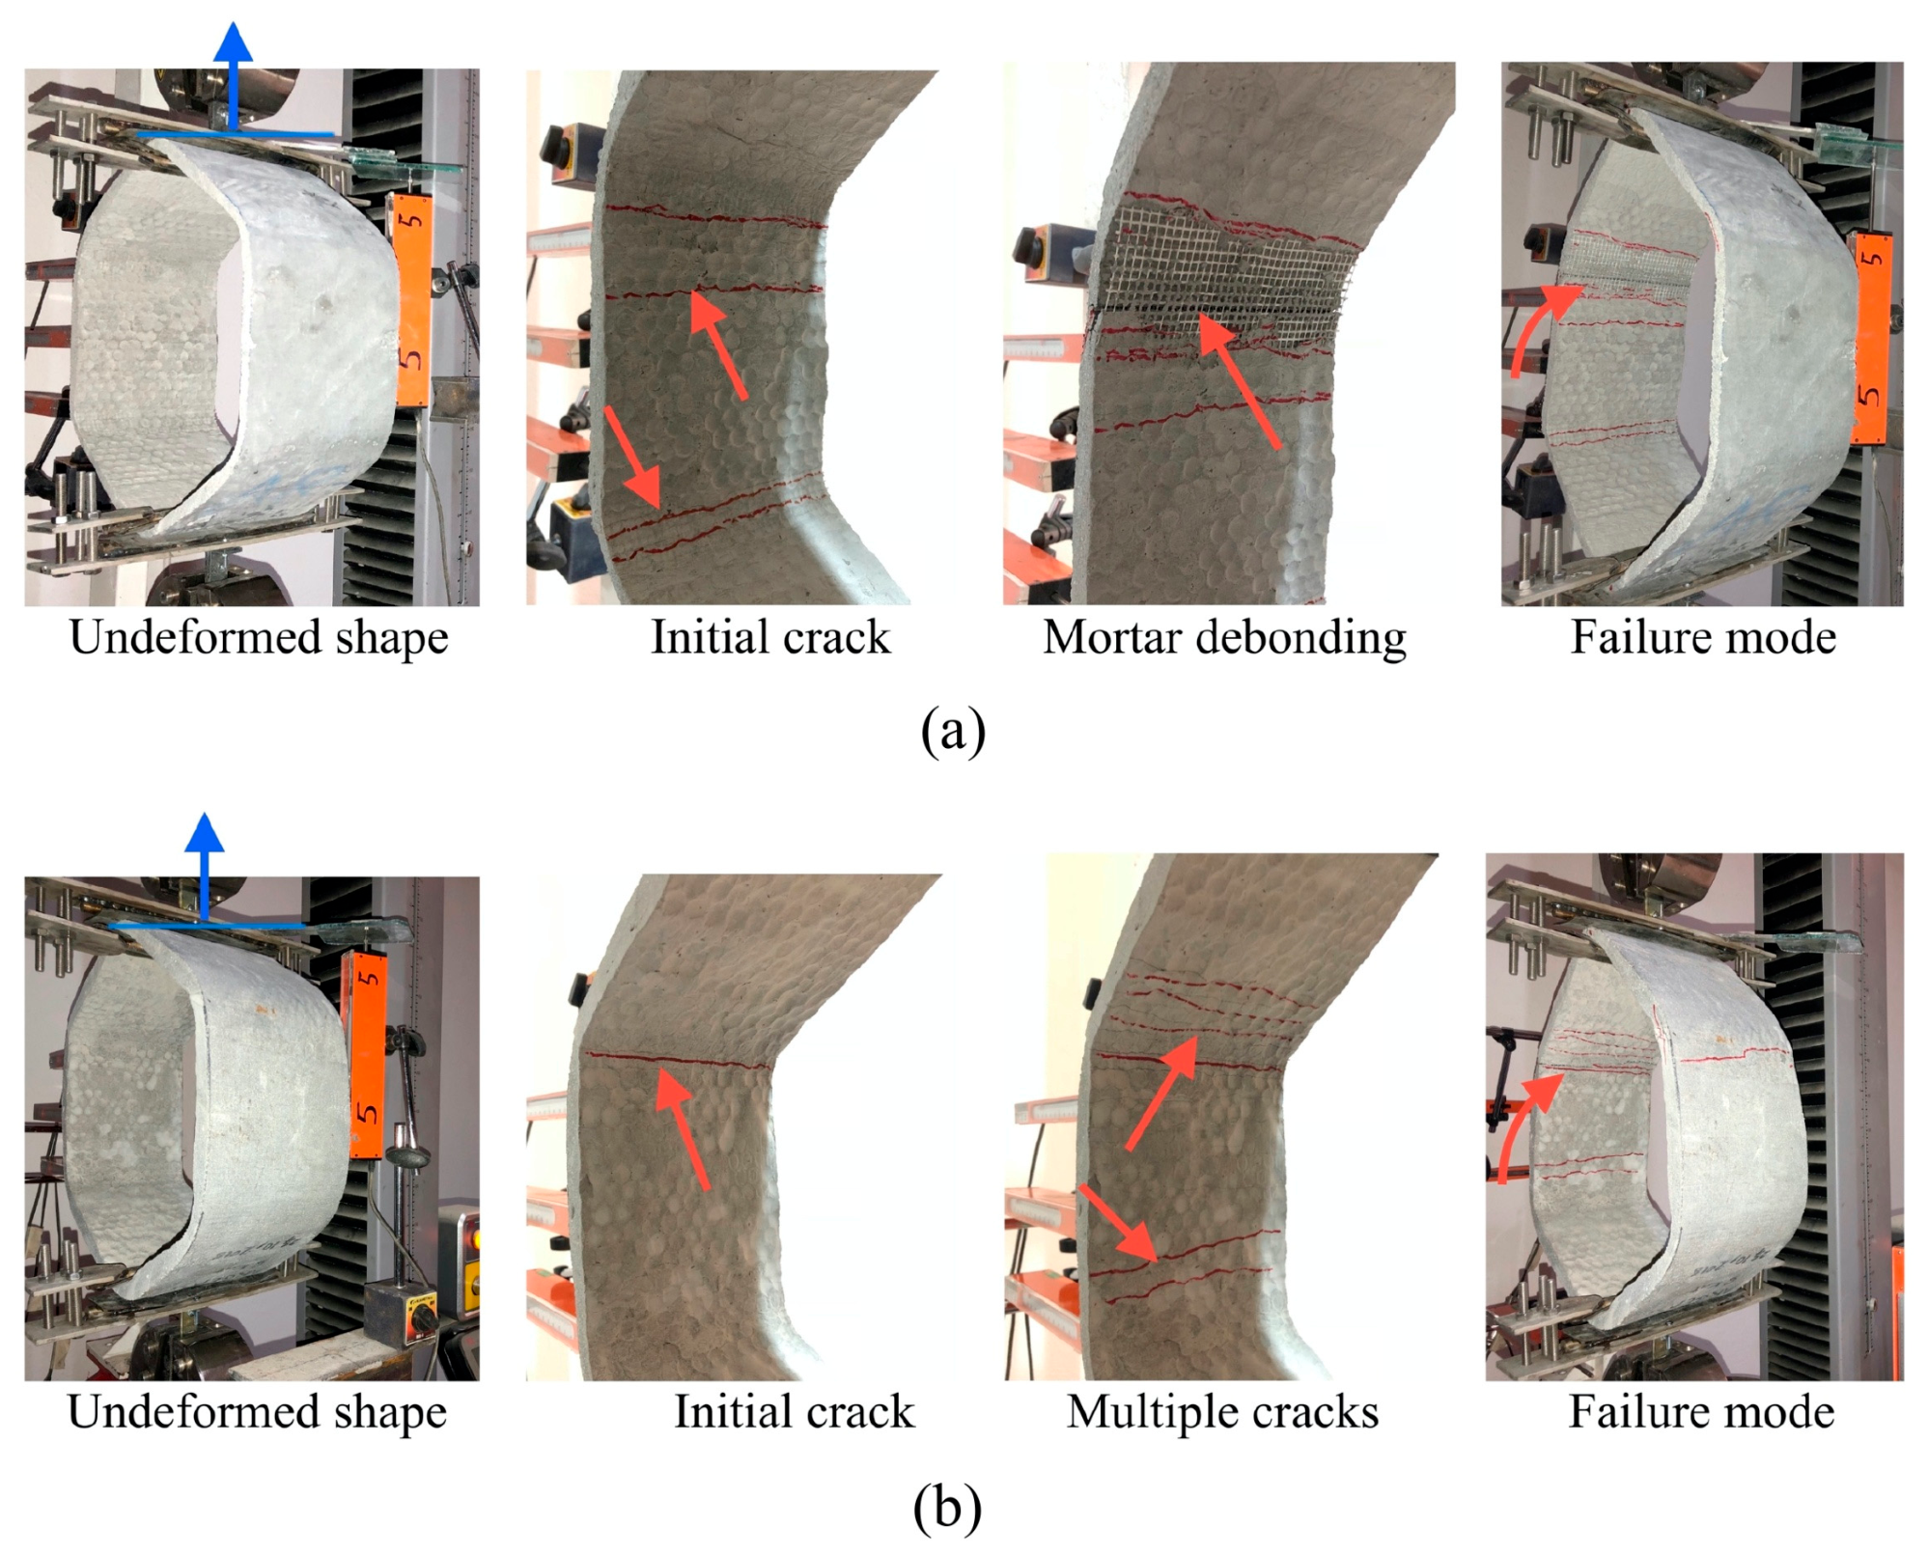
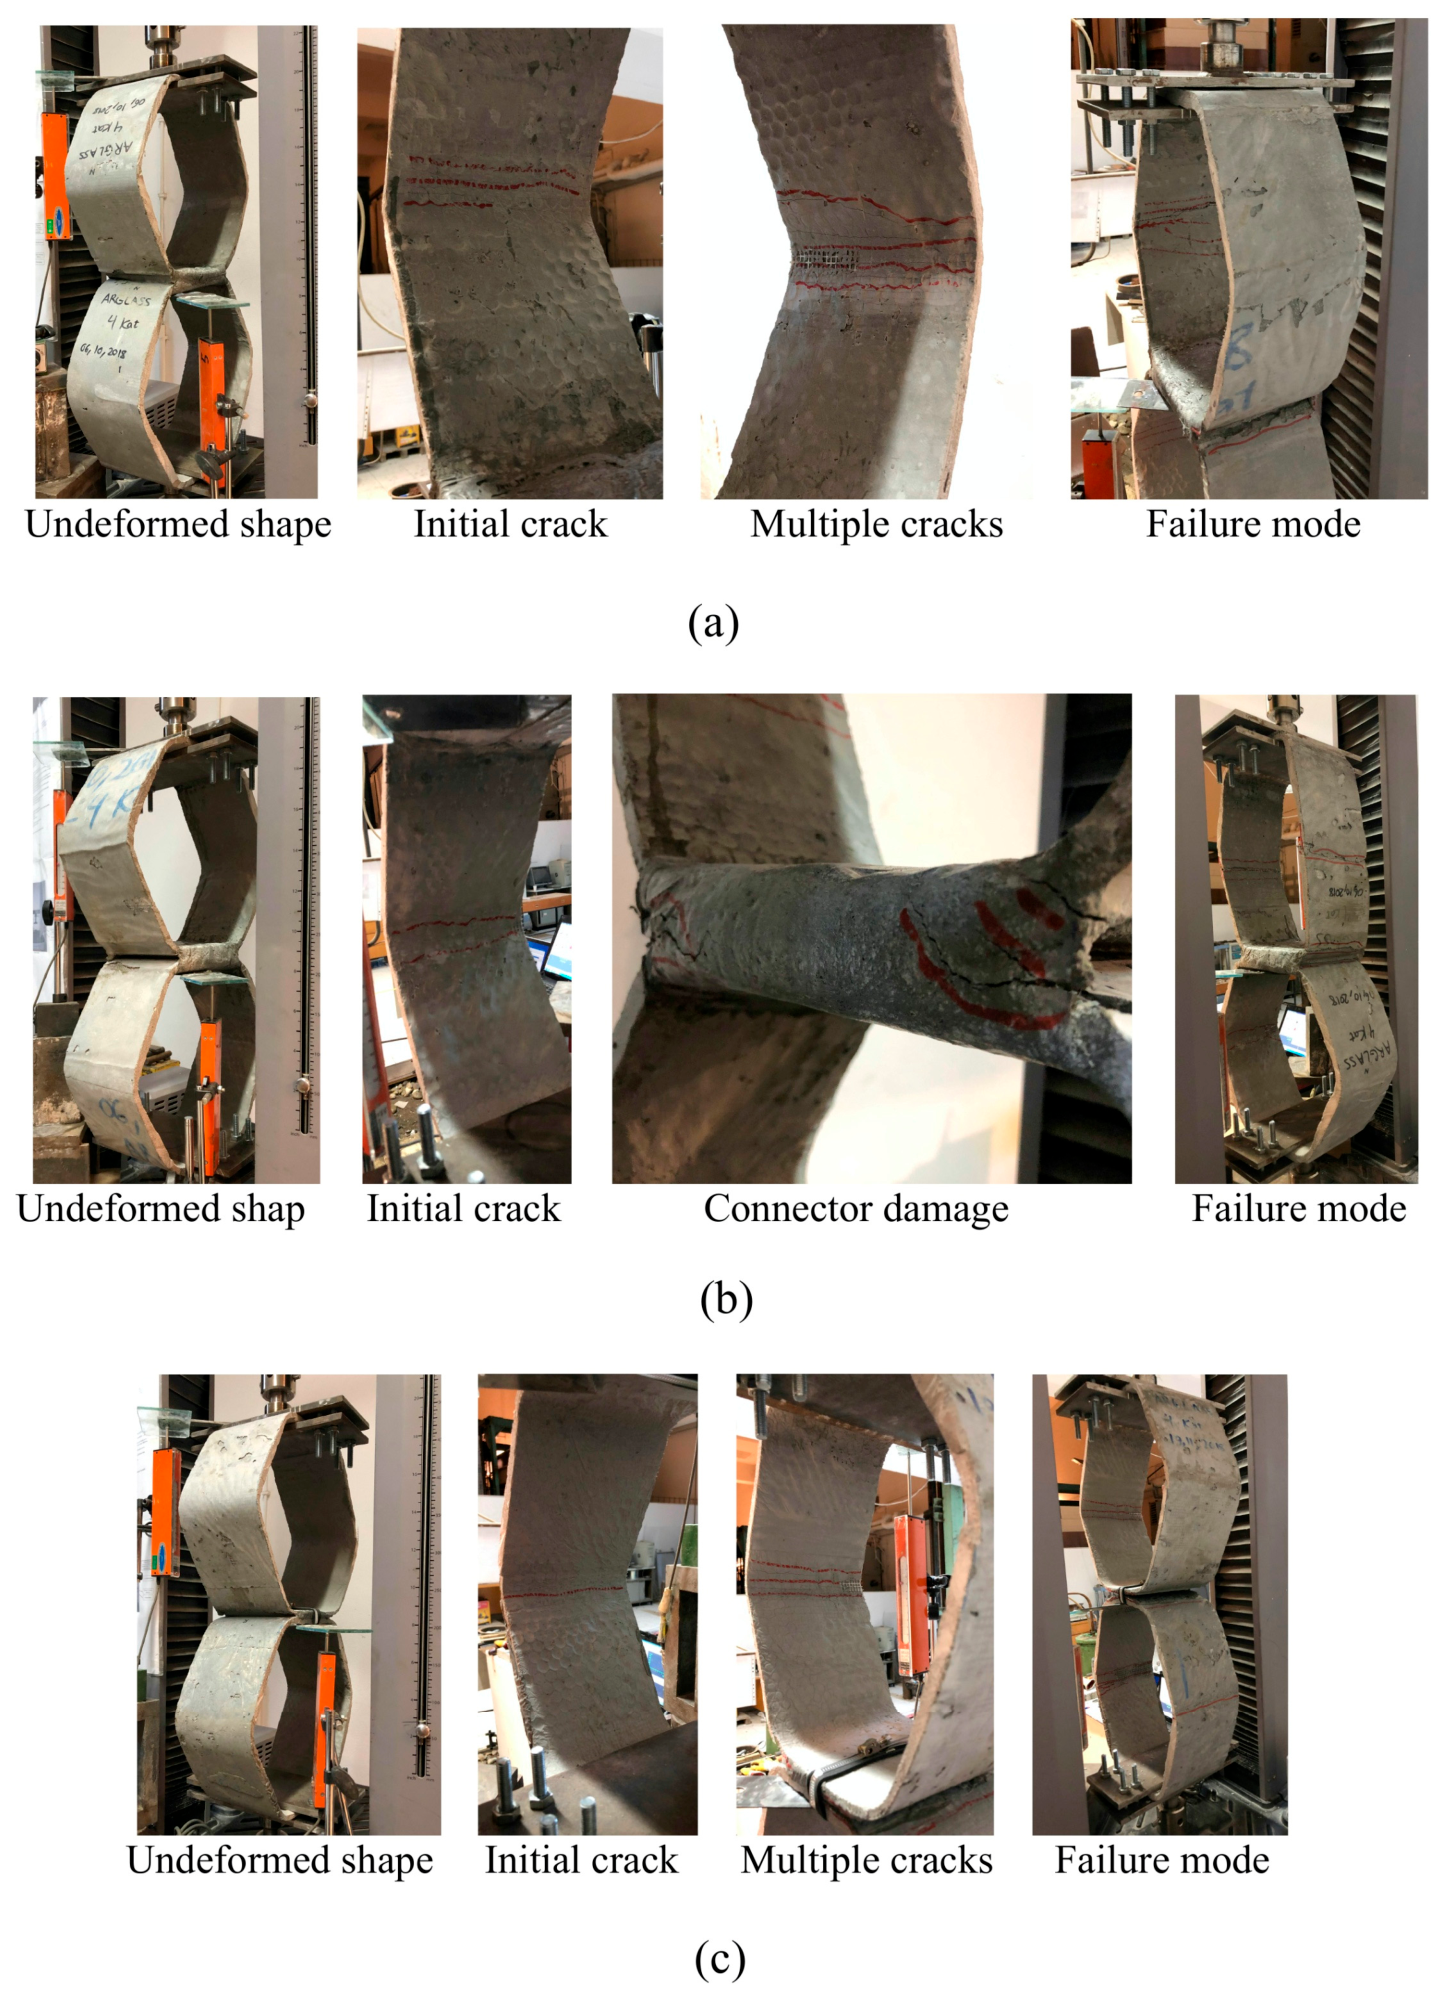
The cracking patterns and damage modes presented in
Figure 15,
Figure 16 and
Figure 17 were evaluated qualitatively based on visual observations during testing and post-test inspection. Therefore, the discussion primarily focuses on the dominant crack initiation locations, crack propagation paths, and final failure modes of the investigated specimens. Quantitative crack measurements, such as crack width evolution, crack spacing, and crack density, were not continuously recorded in the present experimental program. Future studies may include digital image correlation or image-based crack monitoring techniques to quantify crack development more precisely.
As illustrated in
Figure 15a,b, under vertical compression, the initial flexural crack (0° orientation) in both the four- and six-layer HAG specimens initiated at the outer surface of the mid-apex region. This crack subsequently propagated toward the inner surface of the same apex, while multiple cracks developed at the inner apex regions of the sides connected to the steel-headed grips. With increasing displacement, crack propagation intensified, leading to mortar separation and rupture of the textile layers. Final failure occurred at the mid-apex region due to complete separation of the matrix and fiber fracture. In contrast, under vertical tension, crack initiation, propagation, and ultimate failure in both four- and six-layer HAG specimens occurred at similar locations but on opposite faces of the specimen, primarily on the outer surfaces rather than the inner surfaces, as shown in
Figure 16a,b. For the SAG specimens subjected to vertical compression, the initial crack formed on the inner surface of the side connected to the upper steel-headed grip, as presented in
Figure 15c. This was followed by multiple cracks on the outer surfaces of the upper and lower sides, as well as on the inner surface of the lower side attached to the lower steel-headed grip. Progressive crack growth led to mortar separation and eventual fiber rupture at the inner surface of the side connected to the steel-headed grip, resulting in specimen failure. Similarly, under vertical tension, the six-layer SAG specimen exhibited crack initiation, crack propagation, and final failure at corresponding locations on opposite faces of the specimen, as illustrated in
Figure 16c.
Diagonal Tension Effect
As illustrated in
Figure 17a,b, under diagonal tension, the initial flexural crack in both the four- and six-layer HAG specimens formed on the inner surface of the lateral apex at the loading location. Subsequently, multiple cracks developed along the inner surface of the adjacent side near the initial crack region. With increasing displacement, the primary crack propagated from the inner surface toward the outer surface of the lateral apex.
Progressive crack growth ultimately led to complete delamination of the mortar matrix and rupture of the textile layers, resulting in specimen failure for both HAG configurations (
Figure 17a,b).
5.1.4. Stiffness Variation
Vertical Compression Effect
As illustrated in
Figure 12a, both the average initial stiffness and the average post-cracking stiffness increased substantially with an increasing number of textile layers under vertical compression. For the four-layer HAG specimens, the average initial stiffness and post-cracking stiffness were 0.23 kN/mm and 0.04 kN/mm, respectively. In comparison, the six-layer HAG specimens exhibited corresponding values of 0.42 kN/mm and 0.08 kN/mm. Thus, a 50% increase in the number of textile layers resulted in approximately 82.6% and 100% increases in the average initial stiffness and post-cracking stiffness, respectively, as summarized in
Table 4. Furthermore, when the specimen geometry was modified from hexagonal to square under vertical compression, the average initial stiffness values were comparable, measuring 0.42 kN/mm and 0.46 kN/mm for the HAG and SAG specimens, respectively. Similarly, the average post-cracking stiffness values were 0.08 kN/mm and 0.07 kN/mm, respectively (
Figure 12b and
Table 4). These results indicate that specimen geometry had a limited influence on stiffness under vertical compression.
Vertical Tension Effect
As illustrated in
Figure 13a, both the average initial stiffness and the average post-cracking stiffness increased with the increasing number of textile layers under vertical tension loading. For the four-layer HAG specimens, the average initial stiffness and post-cracking stiffness were 0.21 kN/mm and 0.03 kN/mm, respectively. In contrast, the six-layer HAG specimens exhibited corresponding values of 0.46 kN/mm and 0.05 kN/mm. Accordingly, a 50% increase in the number of layers resulted in approximately 119.0% and 66.0% increases in the average initial stiffness and post-cracking stiffness, respectively (
Table 5). Furthermore, when the specimen geometry was changed from hexagonal to square under vertical tension loading, the stiffness values increased markedly (
Figure 13b). The average initial and post-cracking stiffness values were 0.46 kN/mm and 0.05 kN/mm for the six-layer HAG specimen, whereas they reached 1.43 kN/mm and 0.17 kN/mm for the six-layer SAG specimen. This corresponds to increases of approximately 210.0% and 240.0% in the average initial and post-cracking stiffness, respectively (
Table 5).
Diagonal Tension Effect
Under diagonal tension loading, the average initial stiffness and post-cracking stiffness increased significantly with the increase in the number of layers (
Figure 14). For the four-layer HAG specimens, the average initial stiffness and post-cracking stiffness were 0.10 kN/mm and 0.03 kN/mm, respectively. In comparison, the six-layer HAG specimens exhibited values of 0.29 kN/mm and 0.06 kN/mm, respectively. These results indicate that increasing the number of layers by 50% led to approximately 190.0% and 100% increases in the average initial stiffness and post-cracking stiffness, respectively (
Table 6).
5.1.5. Dissipative Energy
Vertical Compression Effect
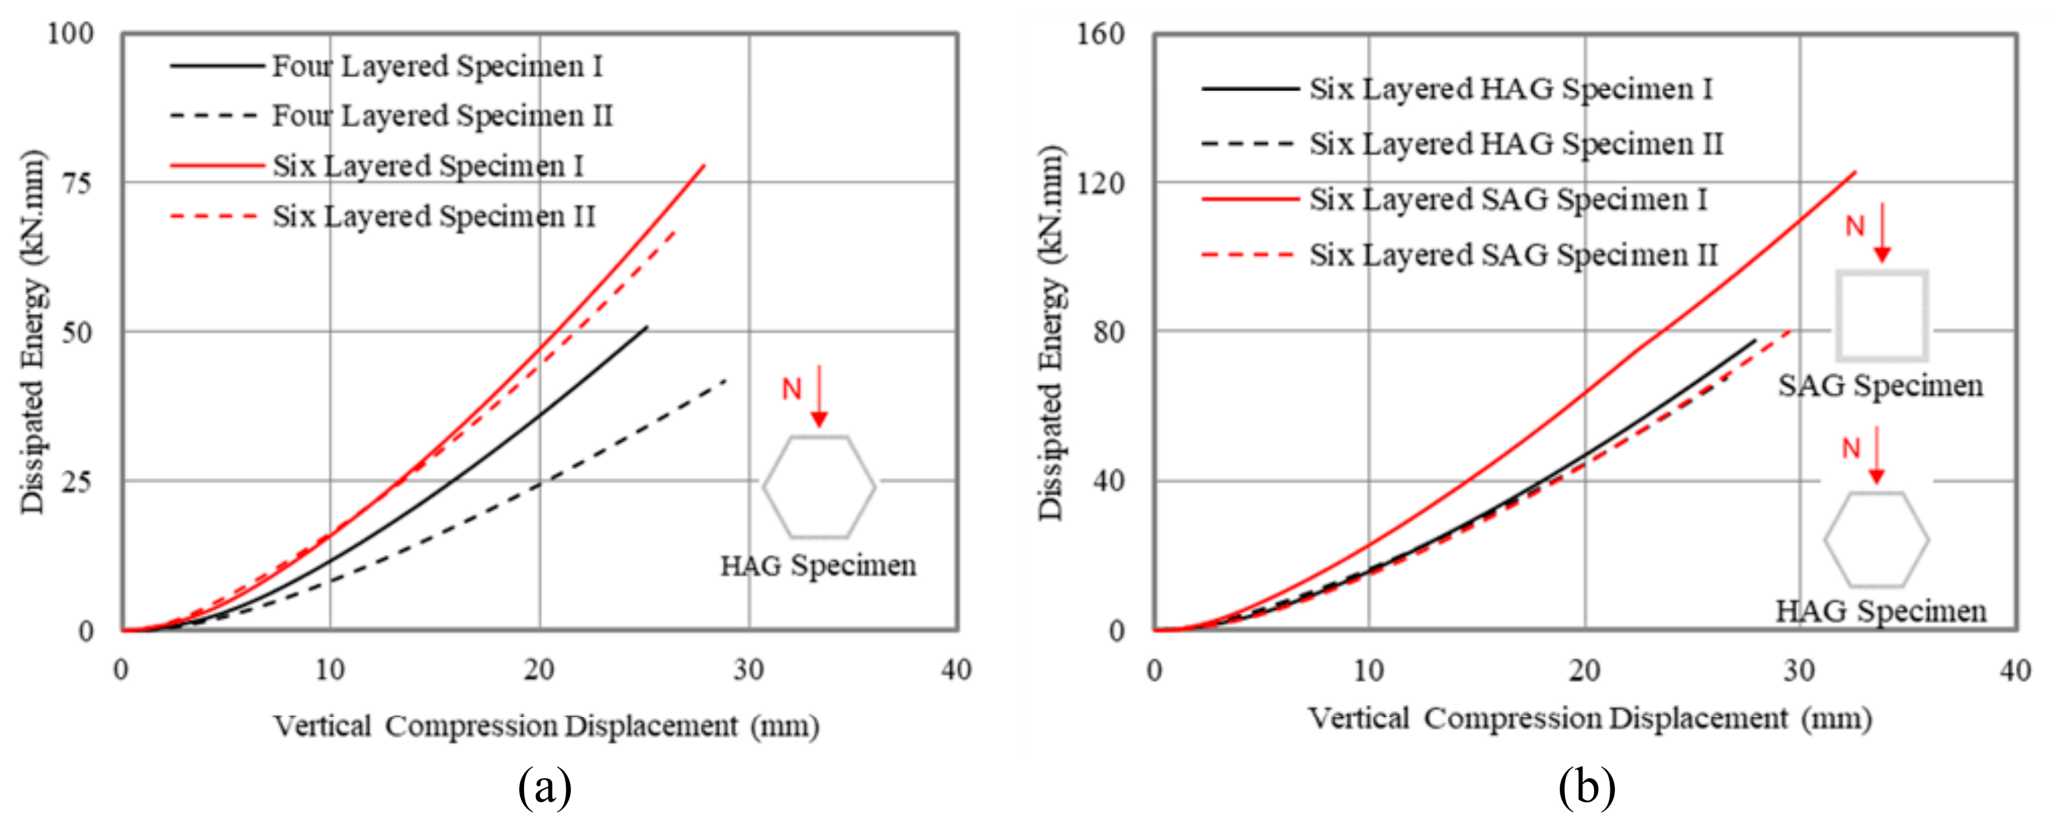
As illustrated in
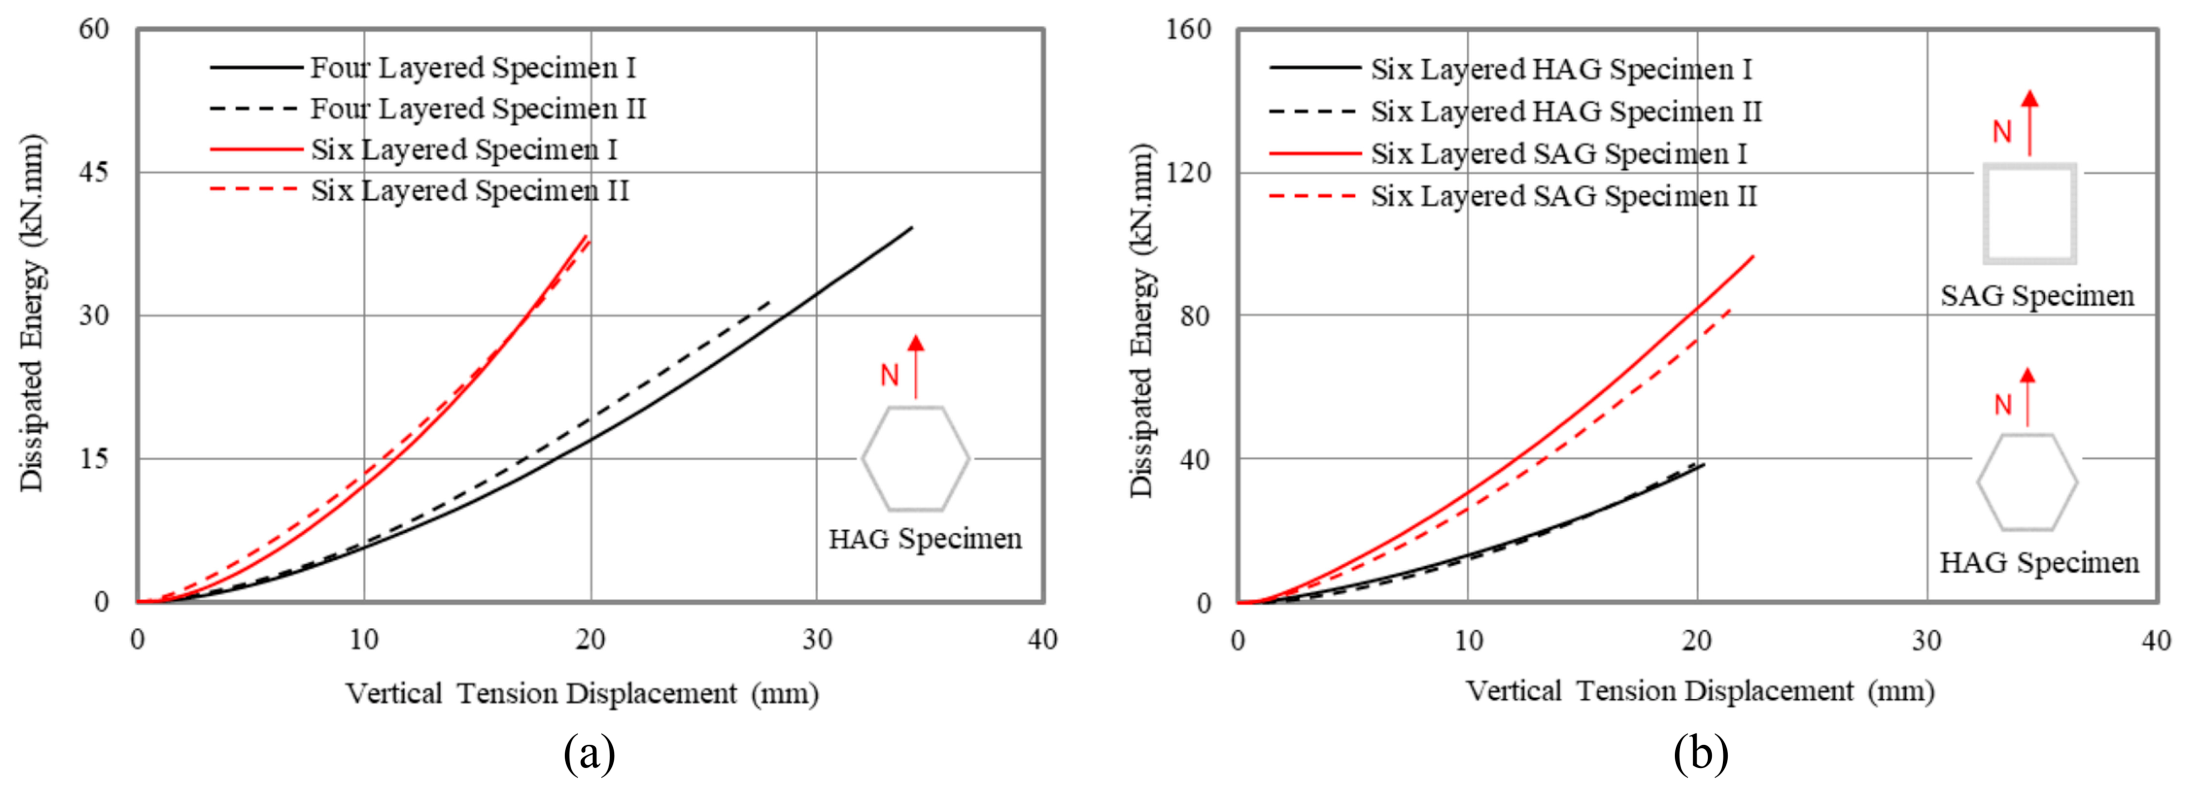
Figure 18a, the energy dissipation capacity increased with the increase in the number of layers in HAG specimens under vertical compression loading. The average maximum dissipated energy was 46.3 kN·mm for the four-layer HAG specimens and 72.5 kN·mm for the six-layer HAG specimens. This corresponds to an average increase of 56.5% in energy dissipation capacity with a 50% increase in the number of layers. Furthermore, under vertical compression loading, the energy dissipation capacity increased when the specimen geometry was changed from hexagonal to square (
Figure 18b). The average maximum dissipated energy values were 72.5 kN·mm and 101.3 kN·mm for the six-layer HAG and SAG specimens, respectively, indicating a 39.7% increase in energy dissipation capacity for the square specimens.
Vertical Tension Effect
As illustrated in
Figure 19a, the energy dissipation capacity increased significantly with the increase in the number of layers in HAG specimens under vertical tension loading. The average maximum dissipated energy was 35.2 kN·mm for the four-layer HAG specimens and 77.3 kN·mm for the six-layer HAG specimens. This corresponds to an increase of approximately 119.7% in energy dissipation capacity with a 50% increase in the number of layers. Moreover, when the specimen geometry was changed from hexagonal to square under vertical tension loading, the energy dissipation capacity increased by 14.8%, as shown in
Figure 19b. The average maximum dissipated energy values were 77.3 kN·mm and 88.77 kN·mm for the six-layer HAG and SAG specimens, respectively.
Diagonal Tension Effect
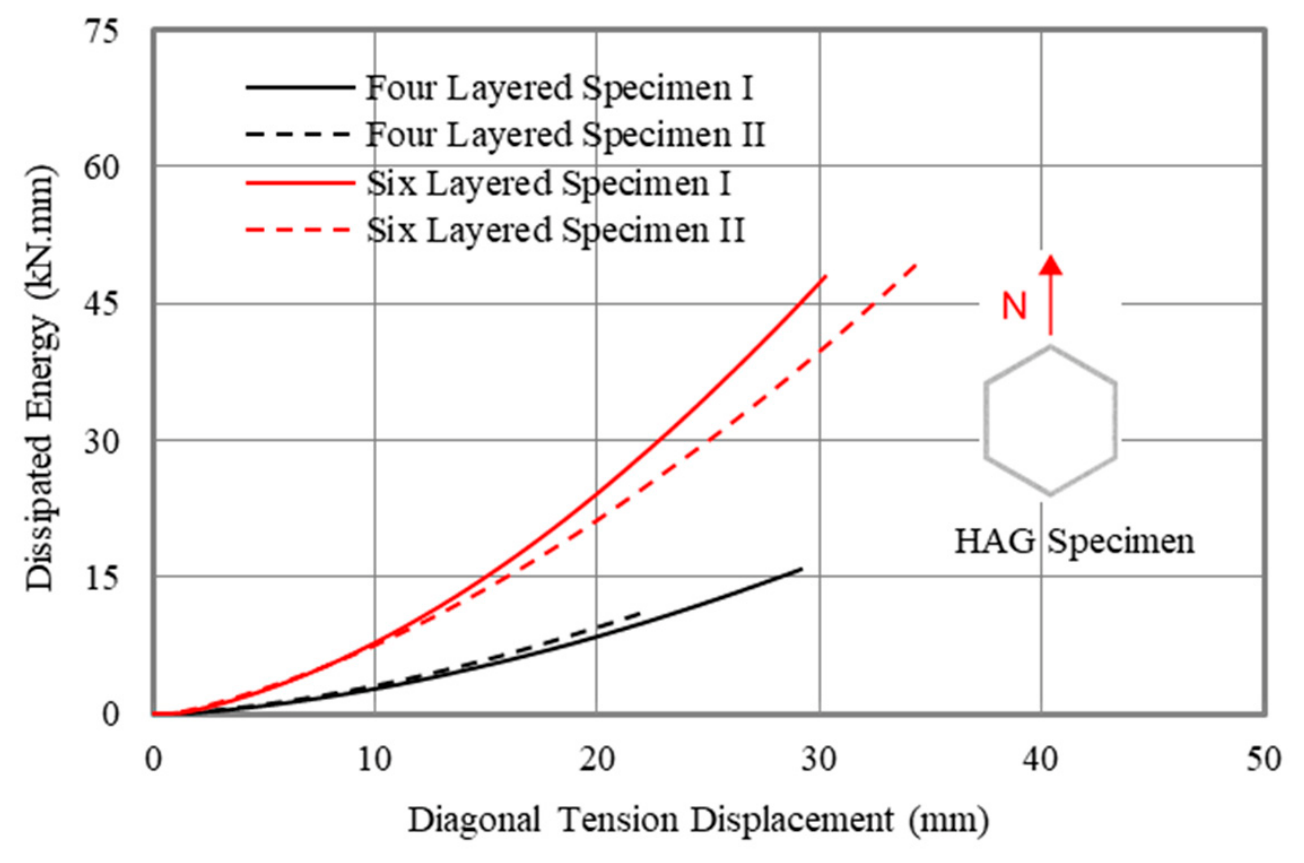
As shown in
Figure 20, the energy dissipation capacity increased substantially with the increase in the number of layers in HAG specimens under diagonal tension loading. The average maximum dissipated energy was 13.4 kN·mm for the four-layer HAG specimens and 49.1 kN·mm for the six-layer HAG specimens. This corresponds to an increase of approximately 266.0% in energy dissipation capacity with a 50% increase in the number of layers.
Although direct quantitative comparison of dissipated energy values with previously reported TRCC systems is difficult due to differences in specimen geometry, dimensions, textile configurations, loading conditions, and boundary conditions, the overall behavioral trends observed in the present study are consistent with previous investigations on TRCC systems [
14,
18,
20]. Previous studies have similarly reported that increasing the number of textile layers improves the energy absorption capacity, ductility, and overall dissipative behavior of cementitious composite systems. In addition, textile reinforcement has been identified as a governing parameter influencing the energy dissipation mechanism and deformation capacity of TRCC elements under monotonic and cyclic loading conditions [
14,
18,
20].
5.1.6. Response Comparison of Test Specimens Under Different Applied Effects
In this section, the influence of different loading conditions on the principal response parameters of the test specimens is examined. For this purpose, the mechanical performance of the six-layered specimens subjected to various loading scenarios is comparatively evaluated.
HAG Specimen
For the six-layered HAG specimen, the load-carrying capacity was observed to be highest under vertical compression, followed by vertical tension, and lowest under diagonal tension loading conditions (
Table 4,
Table 5 and
Table 6). This indicates that compressive action enhances the structural resistance of the hexagonal composite configuration, whereas diagonal tensile action governs the weakest response in terms of ultimate capacity. Conversely, the ductility ratio demonstrated an opposite trend depending on the type of applied loading. The specimen exhibited a more ductile behavior under tensile loading compared to compressive loading, with the highest ductility obtained under diagonal tension. This behavior can be attributed to the progressive crack development and distributed damage mechanism activated under tensile-dominated stress states. In terms of energy dissipation capacity, the six-layered HAG specimen achieved the greatest energy absorption under vertical compression. Although the energy dissipation under diagonal tension exceeded that under vertical tension, both tensile loading cases resulted in lower dissipative capacity compared to vertical compression (
Figure 18a,
Figure 19a and
Figure 20).
SAG Specimen
In contrast to the HAG configuration, the six-layered SAG specimen exhibited a higher load-carrying capacity under vertical tension than under vertical compression (
Table 4 and
Table 5). This behavior may be attributed to the more effective contribution of the AR glass textile reinforcement under tensile stress conditions, where fiber engagement and stress transfer mechanisms become more pronounced. Regarding deformation capacity, the SAG specimen demonstrated a higher ductility ratio under vertical tension compared to vertical compression. However, despite this increased ductility, the energy dissipation capacity under vertical tension remained lower than that observed under vertical compression, consistent with the trend identified for the HAG specimen (
Figure 18b and
Figure 19b). This indicates that although tensile loading enhances deformation capacity, compressive loading provides a more favorable condition for overall energy absorption in the composite system.
5.2. Connection Tests
In this section, the experimental findings obtained from twin and triplet HAG specimens incorporating different types of connectors and subjected to vertical tension and lateral shear loading, respectively, are presented and discussed. The corresponding test results are also summarized in numerical form.
As illustrated in
Figure 21 and
Figure 22, the twin and triplet HAG specimens exhibited comparable response mechanisms in terms of force–displacement behavior, irrespective of the connector type and number of textile layers, under both vertical tension and lateral shear loading conditions. Similar to the single-specimen tests, the force–displacement curves can be characterized by three distinct stages. The first stage corresponds to a linear elastic response prior to cracking. The second stage represents a strain-hardening phase initiated by first cracking, followed by the formation of multiple cracks and progressive crack propagation accompanied by an increase in crack width. The third and final stage is marked by a reduction in load-carrying capacity due to mortar delamination and subsequent rupture of the textile layers.
5.2.1. Force-Displacement Relations
Vertical Tension Effect
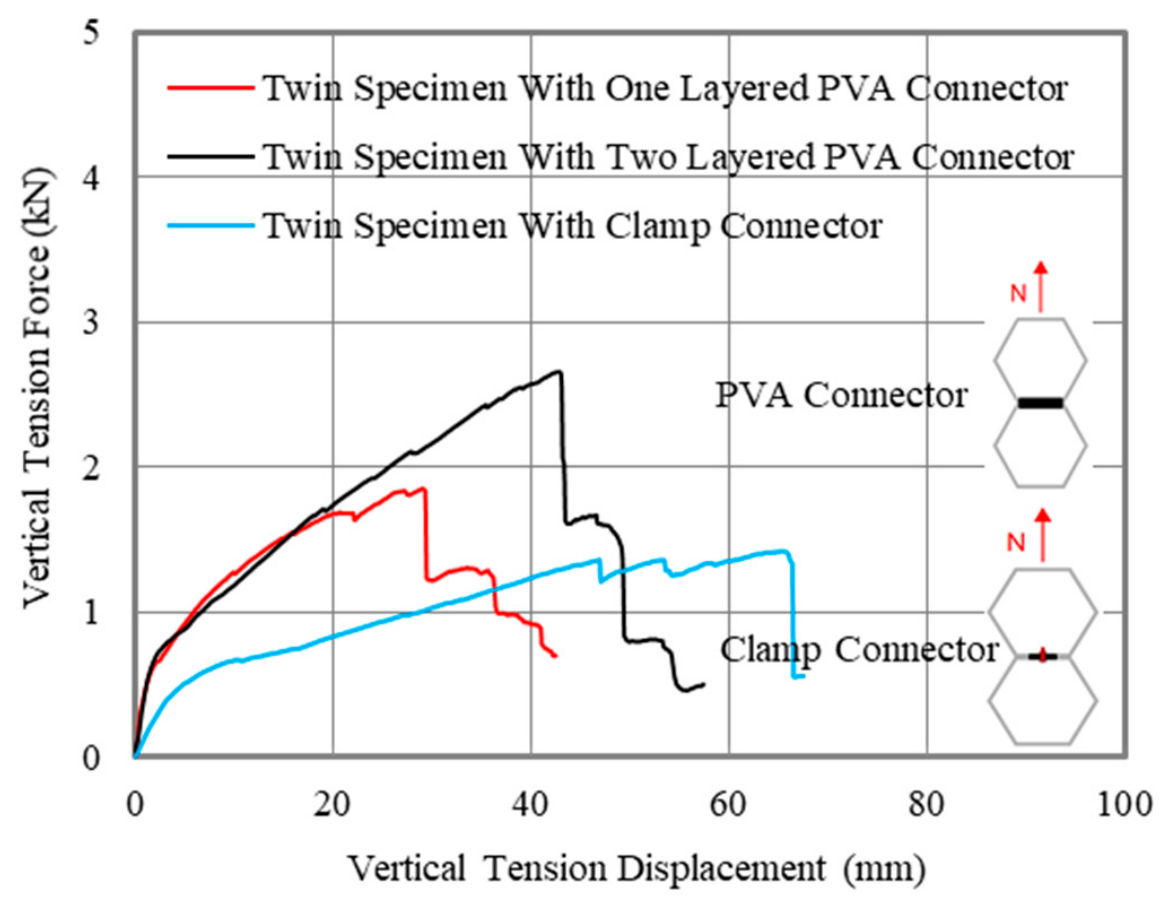
As illustrated in
Figure 21, the peak load increased with an increasing number of PVA textile layers in the connection under vertical tensile displacement, whereas the cracking load remained nearly unchanged for both configurations. The cracking and peak load values were 0.95 kN and 2.7 kN, respectively, for specimens incorporating a two-layered PVA composite connector, and 1.0 kN and 1.9 kN, respectively, for specimens with a single-layered PVA connector (
Table 7). These results indicate that doubling the number of PVA connection layers led to an approximately 42.1% increase in peak load capacity. In contrast, for specimens connected using a steel clamp, the cracking and peak load values were 0.72 kN and 1.4 kN, respectively. Compared with the two-layer PVA composite connection, the clamp connection exhibited reductions of approximately 24.2% in cracking load and 48.1% in peak load under vertical tensile displacement (
Figure 21 and
Table 7). These findings demonstrate the superior load-carrying performance of the PVA layered composite connector relative to the mechanical clamp system under tensile loading conditions.
Lateral Shear Effect
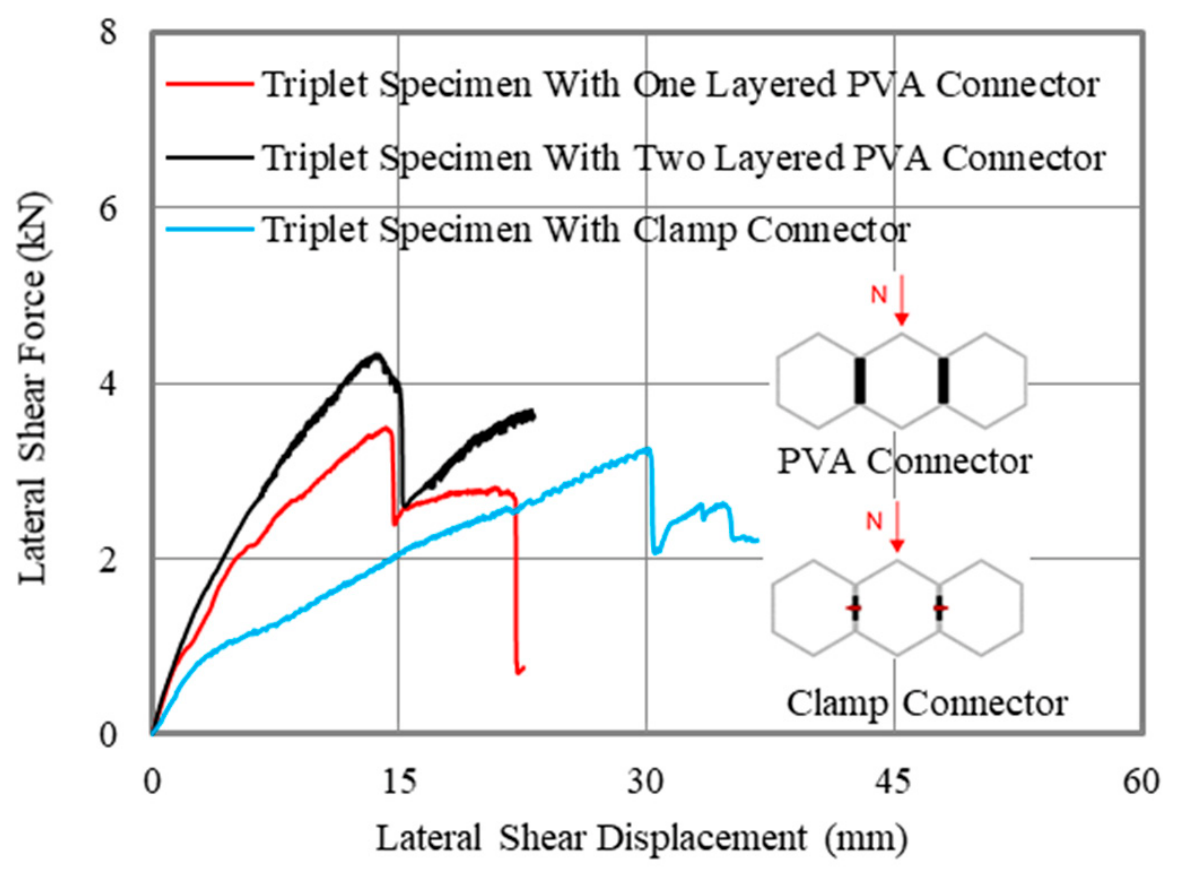
As illustrated in
Figure 22, increasing the number of PVA textile layers within the connection led to a noticeable enhancement in both cracking and peak loads under lateral shear displacement. For specimens incorporating a two-layered PVA composite connector, the cracking and peak load values were 2.0 kN and 4.3 kN, respectively. In comparison, specimens with a single-layered PVA connector exhibited cracking and peak loads of 1.6 kN and 3.5 kN, respectively (
Table 8). Accordingly, doubling the number of PVA connection layers resulted in increases of approximately 25% in cracking load and 22.9% in peak load. When the steel clamp connector was employed, the cracking and peak load values were 0.97 kN and 3.3 kN, respectively, under lateral shear loading. Relative to the two-layered PVA composite connection, these values correspond to reductions of approximately 51.5% in cracking load and 23.2% in peak load (
Figure 22 and
Table 8). These results further confirm the superior mechanical performance of the PVA layered composite connector compared to the clamp connection under shear-dominated loading conditions.
5.2.2. Cracking Displacement, Peak Displacement and Ductility
Vertical Tension Effect
As illustrated in
Figure 21, increasing the number of PVA layers in the connection under vertical tensile loading had a limited influence on the cracking displacement, which remained nearly unchanged. In contrast, the peak displacement increased by approximately 47.3% when the number of PVA layers was doubled (
Table 7). Consequently, the ductility ratio exhibited an increase of about 50.4% with a 100% increase in the number of connection layers, indicating a more pronounced deformation capacity prior to failure. When the steel clamp connector was employed, both the cracking and peak displacements increased under vertical tension. However, despite this increase in displacement capacity, the corresponding ductility ratio was lower than that of specimens connected with either one or two PVA layers (
Figure 21). Specifically, compared with the specimens incorporating a two-layered PVA connector, the ductility ratio of the clamp-connected specimens decreased by approximately 38.6% (
Table 7). These findings demonstrate the superior deformation capacity provided by the layered PVA composite connector under tensile-dominated loading conditions.
Lateral Shear Effect
As illustrated in
Figure 22, for specimens incorporating PVA-layered connectors and subjected to lateral shear loading, the cracking displacement increased by approximately 18.9% with the increase in the number of connection layers, whereas the peak displacement remained nearly unchanged (
Table 8). As a result, the ductility ratio of the specimen with a two-layered PVA connector decreased by about 18.4% compared to that of the specimen with a single-layered PVA connector. Moreover, the specimens connected using steel clamps exhibited a comparable cracking displacement but a substantially higher peak displacement than those connected with one- and two-layered PVA connectors under lateral shear loading (
Figure 22). This enhanced deformation capacity translated into a significantly improved ductility performance. For instance, replacing the two-layered PVA connector with a clamp connector resulted in an increase of approximately 136.7% in the ductility ratio (
Table 8). These results indicate that, under shear-dominated loading conditions, the clamp connector provides superior deformation capacity relative to the layered PVA composite connection.
5.2.3. Cracking Pattern and Damage Mode
Vertical Tension Effect
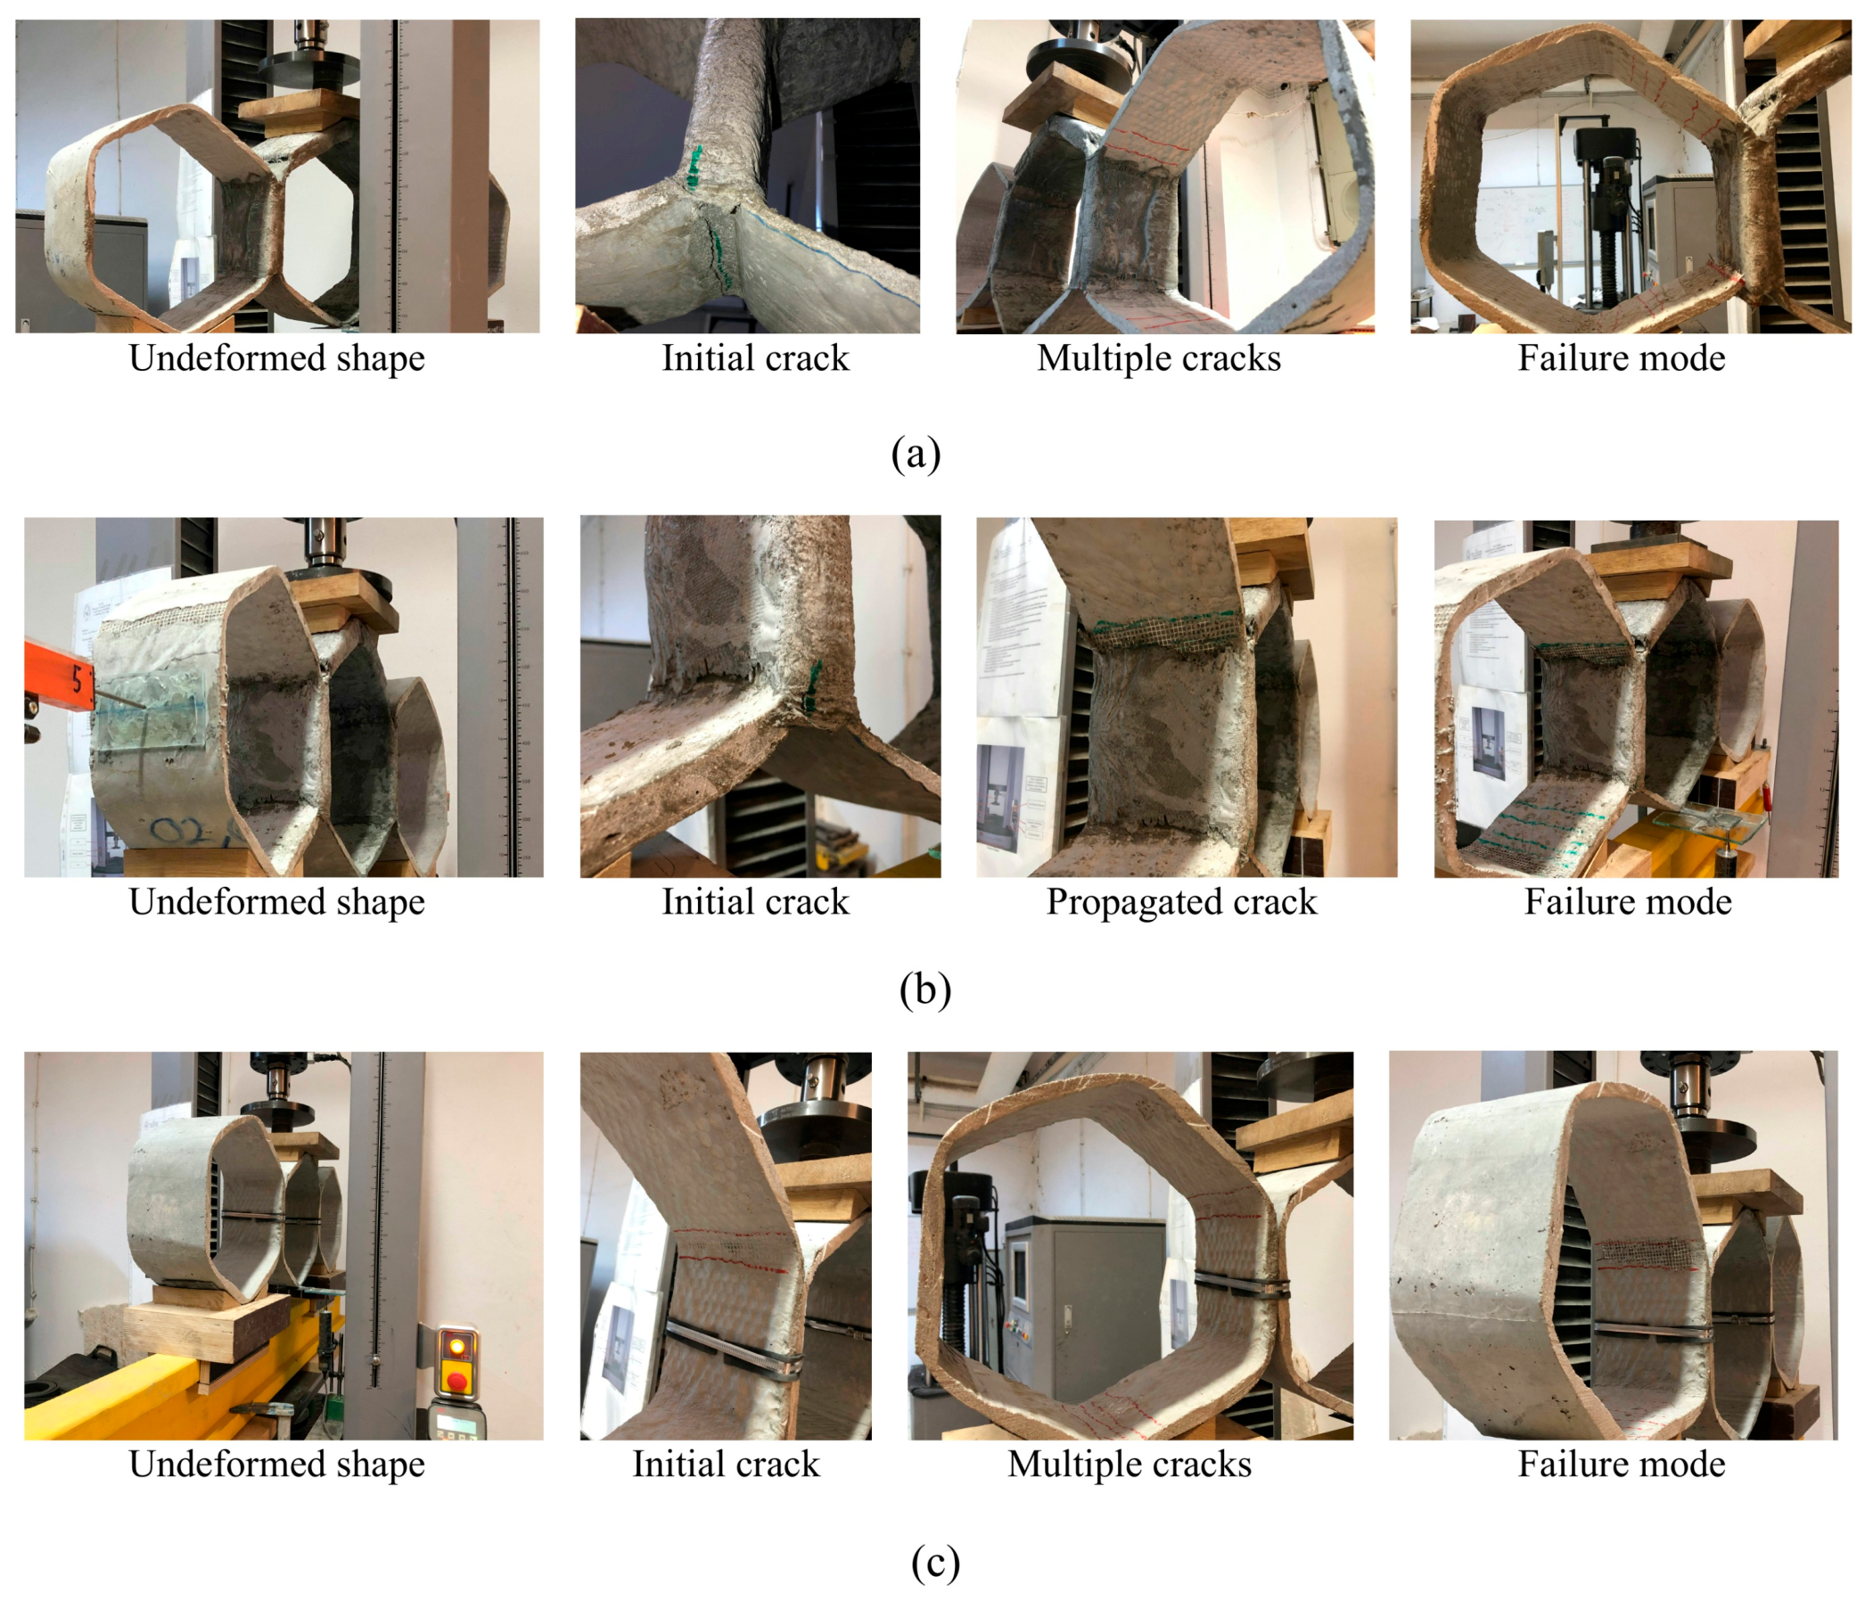
As illustrated in
Figure 23a,b, under vertical tensile loading, the initial flexural cracks in both one- and two-layered PVA-connected HAG specimens initiated on the inner surface of the middle apex of the upper specimen. Subsequently, the primary crack propagated toward the outer surface of the same apex. In addition, minor cracking was observed within the mortar layer at the interface between the upper and lower specimens, as well as at the middle apexes of the lower specimen. Ultimately, failure occurred at the location of the initial crack (i.e., the middle apex of the upper specimen), following complete debonding of the mortar from the textile reinforcement.
In the specimens incorporating two-layered PVA connectors, partial damage was also detected within the PVA connection region and adjacent sides, which can be attributed to the higher stiffness of the two-layered PVA connector compared to the single-layered configuration (
Figure 23a,b). For the clamp-connected specimens, the crack initiation and propagation patterns were generally similar to those observed in the single-layered PVA-connected specimens. However, in this case, rupture of the textile layers occurred at the middle apex of the lower specimen, as shown in
Figure 23c.
Lateral Shear Effect
As illustrated in
Figure 24a,b, under lateral shear loading, the specimens incorporating one- and two-layered PVA connectors exhibited comparable crack patterns, crack propagation characteristics, and failure mechanisms. The initial crack formed on the inner surface of the lateral specimen, adjacent to the connecting element. Crack propagation subsequently progressed along these sides, accompanied by the formation of minor cracks within the PVA connecting region. Ultimately, failure occurred due to complete separation of the mortar matrix and rupture of the textile fibers at the side immediately adjacent to the connector. In the clamp-connected specimens, the crack pattern and failure mechanism were generally similar under lateral shear loading. The first crack, followed by multiple cracks, developed on the inner surface of the sides directly next to the clamp connection. As loading progressed, crack propagation and merging from the inner to the outer surface of the side adjacent to the connector resulted in loss of load-bearing capacity and fiber rupture. Notably, no damage was observed in the steel clamp elements during failure, as shown in
Figure 24c.
5.2.4. Stiffness Variation
Vertical Tension Effect
As illustrated in
Figure 21, under vertical tension loading, increasing the number of PVA layers in the specimen connections led to a noticeable enhancement in post-cracking stiffness, whereas the initial stiffness remained nearly unchanged for both configurations. For the specimens incorporating two-layered PVA connections, the initial and post-cracking stiffness values were 0.41 kN/mm and 0.04 kN/mm, respectively. In comparison, the corresponding values for specimens with a single-layer PVA connection were 0.42 kN/mm and 0.03 kN/mm, respectively (
Table 7). This corresponds to an approximately 33.3% increase in post-cracking stiffness when the number of connection layers was doubled. In contrast, specimens connected using steel clamps exhibited substantially lower stiffness values under vertical tension. The initial and post-cracking stiffness values were 0.12 kN/mm and 0.01 kN/mm, respectively, representing reductions of approximately 70.7% and 73.8%, respectively, compared to the two-layered PVA-connected specimens (
Figure 21 and
Table 7). These findings highlight the superior stiffness performance of PVA-based composite connections relative to mechanical clamp connections under tensile loading conditions.
Lateral Shear Effect
Under lateral shear loading, both the initial and post-cracking stiffness values increased with the increase in the number of PVA layers used in the specimen connections, as presented in
Figure 22. For specimens incorporating two-layered PVA connections, the initial and post-cracking stiffness values were 0.60 kN/mm and 0.23 kN/mm, respectively. In comparison, specimens with a single-layer PVA connection exhibited initial and post-cracking stiffness values of 0.55 kN/mm and 0.17 kN/mm, respectively (
Table 8). These results indicate increases of approximately 9.1% in initial stiffness and 35.3% in post-cracking stiffness when the number of connection layers was doubled.
Conversely, specimens connected using steel clamps demonstrated significantly lower stiffness values under lateral shear loading. The initial and post-cracking stiffness values were 0.31 kN/mm and 0.08 kN/mm, respectively, corresponding to reductions of approximately 48.3% and 63.5%, respectively, compared to the specimens with two-layered PVA connections (
Figure 22 and
Table 8). These findings confirm that PVA-based composite connections provide superior stiffness performance relative to clamp-type mechanical connections under shear loading conditions.
5.2.5. Dissipated Energy
Vertical Tension Effect
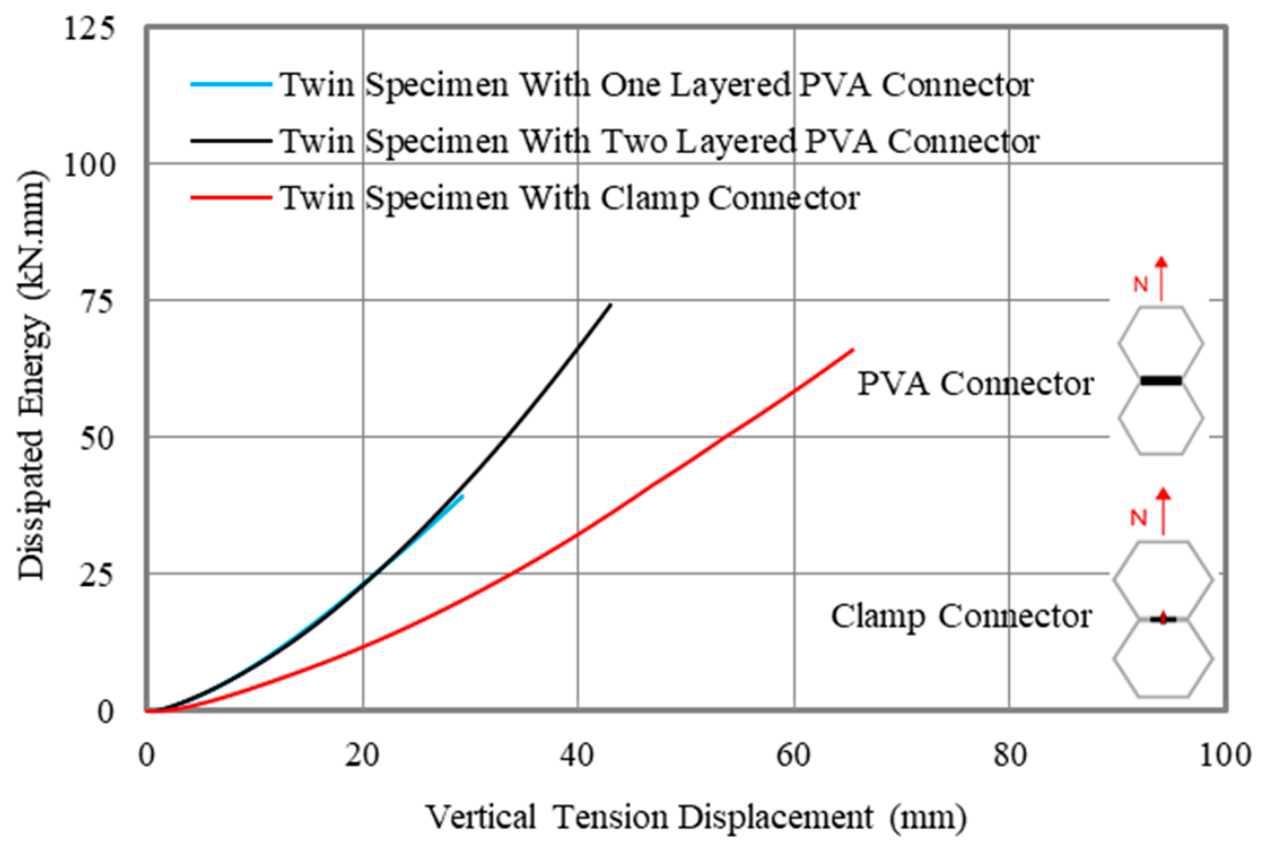
As illustrated in
Figure 25, under vertical tension loading, the energy dissipation capacity increased with the increase in the number of PVA layers in the specimen connections. The total dissipated energy was 74.3 kN·mm for specimens incorporating two-layered PVA connections, whereas it was 39.4 kN·mm for specimens with a single-layer PVA connection. This corresponds to an approximate 88.7% increase in energy dissipation when the number of connection layers was doubled. For specimens connected using steel clamps, the dissipated energy was measured as 65.9 kN·mm. This value represents an 11.3% reduction compared to the two-layered PVA-connected specimens under vertical tension loading (
Figure 25). These results indicate that although clamp connections provide relatively high energy absorption, multilayer PVA composite connections offer superior energy dissipation performance under tensile loading conditions.
Lateral Shear Effect
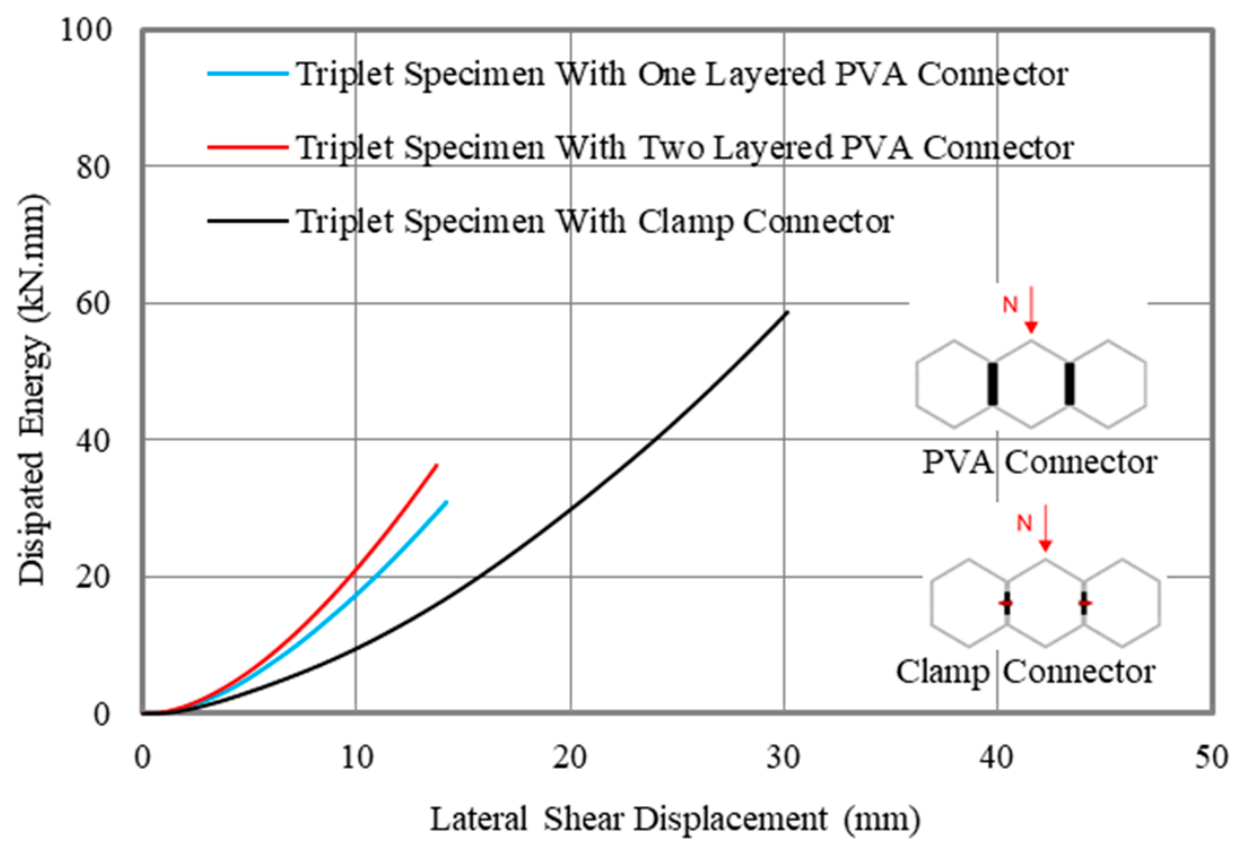
As presented in
Figure 26, under lateral shear loading, the energy dissipation capacity increased with the increase in the number of PVA layers in the specimen connections. The total dissipated energy was 36.2 kN·mm for specimens incorporating two-layered PVA connections and 30.9 kN·mm for those with a single-layer PVA connection. This corresponds to an approximate 17.1% increase in energy dissipation when the number of connection layers was doubled. Furthermore, specimens connected using steel clamps exhibited a substantially higher energy dissipation capacity under lateral shear. The dissipated energy reached 58.7 kN·mm, representing a 62.1% increase compared to the two-layered PVA-connected specimens (
Figure 26). These findings indicate that, while multilayer PVA connections moderately enhance energy absorption under shear loading, clamp-type mechanical connections provide significantly greater energy dissipation capacity in this loading scenario.