


Abstract
The geographical presence of infertility treatment providers does not by itself establish access or utilization. This cross-sectional ecological study compared December 2025 provider inventories for intrauterine insemination (IUI) and in vitro fertilization (IVF) across 252 harmonized second-level analytical units in the Republic of Korea. The IUI and IVF files contained 264 and 154 geocoded sites, respectively; all IVF-listed sites also appeared in the IUI inventory. Provider density was calculated per 100,000 women aged 20–45 years. Distributional inequality was summarized with Gini and Theil indices. Global and Local Moran statistics used row-standardized Queen weights, 99,999 permutations, and Benjamini–Hochberg false-discovery-rate correction for local tests. IUI and IVF providers were absent from 141 (56.0%) and 176 (69.8%) units. Equal-municipality Gini coefficients were 0.7153 for IUI and 0.8067 for IVF. Raw-density Global Moran’s I was 0.0723 for IUI (p = 0.0791) and 0.0366 for IVF (p = 0.2833). Thirteen IUI local classifications were significant before multiplicity correction, but none remained significant after correction. A two-part sensitivity analysis showed that the binary presence of IUI providers was spatially clustered globally (I = 0.2660, p = 0.0002), whereas raw density was not, indicating that conclusions depend on the indicator used. Raw-density conclusions were stable across alternative age denominators and Queen, Rook, and k-nearest-neighbor specifications. These findings describe provider availability and its spatial distribution, not travel-time accessibility, treatment capacity, or patient use.
1. Introduction
Infertility care has a geographic dimension as well as a clinical one. Provider location determines where treatment can be offered, but a nearby institution does not necessarily imply timely or affordable care, and a provider-free municipality does not mean that residents cannot obtain treatment elsewhere. The World Health Organization has emphasized both the prevalence of infertility and the need for equitable access to diagnosis and treatment [1,2].
IUI and IVF are clinically distinct procedures and place different demands on staff, laboratory functions, equipment, and quality management. Korean evaluation frameworks also distinguish the two services [3]. HIRA provider records were therefore analyzed separately by treatment type. Because a single institution may be registered for more than one service, the IUI and IVF categories were not assumed to be mutually exclusive. Procedure-specific distributions provide a more informative description of local service availability than a single undifferentiated count of infertility treatment institutions.
Availability, geographical accessibility, and utilization are separate concepts. Availability concerns whether providers are present and how provider supply compares with a reference population. Geographical accessibility adds travel impedance and competition for capacity, while utilization requires observed attendance or treatment. Cost, waiting time, referral arrangements, provider reputation, and individual preferences may also affect where patients seek care [4,5]. A municipality-based provider density can therefore describe local availability without measuring realized access.
Previous work has shown that distance and local socioeconomic conditions can shape the use of reproductive health services. Residential proximity has been associated with ART and IUI utilization in Australia [6], and studies in the United States have documented substantial variation in geographic coverage by ART and oncofertility providers [7,8,9]. Korean research has likewise reported spatial differences in healthcare accessibility and in the distribution of obstetric services [10,11]. Bartolomeo et al. further showed, in a different reproductive-health setting, that distance and socioeconomic disadvantage can influence realized service use beyond simple provider presence [12]. These studies support a cautious distinction between where services are located and who actually uses them.
Spatial statistics adds another distinction. A zero-provider municipality indicates administrative absence. Gini and Theil indices summarize inequality in a distribution. Moran statistics assess whether values in neighboring areas are more similar than expected under a specified spatial model. Local Moran classifications additionally involve multiple simultaneous tests and can change with the neighborhood definition [13,14,15,16,17]. Treating these measures as interchangeable can overstate both the extent and the location of service gaps.
This study therefore examines four questions: how IUI and IVF providers are distributed across a common municipal geography; how unequal their population-adjusted densities are; whether raw provider density shows global or local spatial association after appropriate multiplicity correction; and whether the conclusions change when provider presence, population denominators, or spatial weights are altered. The purpose is to establish a reproducible baseline of provider availability, not to identify medically underserved areas or to estimate patient travel.
2. Materials and Methods
2.1. Study Design, Data Sources, and Spatial Units
The study used a cross-sectional ecological design based on national provider and population data for December 2025. Information on designated infertility treatment institutions was obtained from the Health Insurance Review and Assessment Service (HIRA) and classified by treatment type as IUI or IVF. The final geocoded dataset comprised 264 IUI provider sites and 154 IVF provider sites. A service location was identified by institution name and full street address; same-named institutions at different addresses were retained as separate locations. Records belonging to more than one service category were included in each relevant service-specific analysis.
The reference population was obtained from KOSIS table DT_1B04006 and consisted of December 2025 female resident counts by single year of age [18]. Women aged 20–45 years were used as the primary reference population, consistent with the age range defined for population standardization in the study. This denominator was used only to standardize provider supply and was not interpreted as infertility prevalence, treatment eligibility, or realized demand. To assess sensitivity to the age definition, all analyses were repeated using women aged 20–44, 15–49, and 20–49 years; the broader age ranges also reflect commonly used reproductive-age definitions and the current Korean policy context [19,20].
Provider, population, and administrative boundary data were harmonized to 252 mutually exclusive second-level administrative units (si, gun, and gu). Bucheon was represented as a single city-level unit, and population records were aggregated accordingly. Administrative code changes, including those affecting Jeonbuk, were reconciled before data linkage. The resulting 252-unit geography was used consistently for all descriptive and spatial analyses. Population totals were reconciled against the 17 province-level totals (Table 1).
Table 1.
Diagnostic characteristics of the spatial weight matrices.
All spatial layers were reprojected to Korea 2000/Unified CS (EPSG:5179). Provider coordinates recorded in longitude and latitude were transformed from WGS 84 (EPSG:4326) to EPSG:5179. Polygon geometry validity was checked before spatial operations and corrected where necessary. Provider locations were assigned to municipalities using a point-in-polygon spatial join, and the resulting assignments were cross-checked against municipality information in provider addresses. Table 2 summarizes the data sources, reference dates, key variables, and preprocessing procedures used in the analysis.
Table 2.
Data sources and preprocessing used in the analysis.
2.2. Provider Availability, Density, and Distributional Inequality
For service type s in administrative unit i, provider density was defined as the number of listed providers per 100,000 women in the selected age range (Equation (1)):
where Fi,s is the provider count and pi,a is the female reference population. A binary presence indicator was also coded as 1 when at least one provider was present and 0 otherwise. The main descriptive summaries include zero-provider units. Because many units had zero counts, positive-provider municipalities were additionally summarized separately; this is the second component of the two-part description and avoids treating a zero and a low positive density as the same condition.
Municipal inequality in density was summarized with the Gini coefficient and Theil T index. Equal-municipality versions weight each unit equally, while population-weighted versions weight each municipal density by its share of the reference population. These indices are descriptive ecological measures of provider-to-population ratios; they do not measure inequality in individual treatment received.
2.3. Spatial Weights and Moran Statistics
Primary spatial relationships were defined using Queen contiguity, in which municipalities were considered neighbors when their boundaries shared either a segment or a vertex. A 1 m coordinate-precision tolerance was applied during topology construction to avoid numerical gaps along shared borders, and the resulting binary weight matrix was row-standardized. Seven municipalities had no contiguous neighbors; they were retained in global analyses with zero-weight rows and were not assigned Local Moran statistics. Rook contiguity and symmetric 4- and 8-nearest-neighbor (KNN4 and KNN8) matrices were used in sensitivity analyses. The structural characteristics of the spatial weight matrices used in the primary and sensitivity analyses are summarized in Table 3.
Table 3.
Provider network, two-part descriptive statistics, and provider-presence results for women aged 20–45 years.
Global Moran’s I was calculated as Equation (2):
where n = 252, wᵢⱼ is the spatial weight, and S0 is the sum of weights. Under the randomization expectation, E[I] = −1/(n − 1) = −0.003984 for the primary analysis. Global inference used unconditional randomization of observed values over the fixed graph. Local Moran inference used conditional randomization with the focal value held fixed and neighboring values sampled without replacement from the remaining units [14,15].
Primary global and local analyses used 99,999 permutations with base random seed 20260918. Two-sided empirical p-values used a plus-one correction and included ties. Local p-values were adjusted separately for the IUI and IVF density analyses using the Benjamini–Hochberg false-discovery-rate procedure at q ≤ 0.05 [16]. Benjamini–Yekutieli adjustment and a joint 504-test correction across the two primary service layers were retained as supplementary checks [17].
2.4. Two-Part and Sensitivity Analyses
The high frequency of zero counts was addressed in two ways. First, provider presence was analyzed as a binary variable, with Global Moran statistics and fixed-prevalence join-count tests. Second, the density distribution among municipalities with at least one provider was reported separately. Raw density over all municipalities remained the primary continuous outcome because dropping zero-provider municipalities would change the spatial support and remove a substantive part of the availability pattern.
Additional sensitivity analyses used log(1 + density), nonspatial empirical-Bayes rate smoothing [21], alternative age denominators (20–44, 15–49, and 20–49 years), and Queen, Rook, KNN4, and KNN8 weights. Empirical-Bayes smoothing was used as a diagnostic for rate instability rather than as a replacement for observed provider absence. Secondary specifications were evaluated to determine whether the main conclusions depended on indicator definition, population denominator, or neighborhood structure.
Data preparation, spatial processing, and statistical analyses were performed in Python 3.13.5 (Python Software Foundation, Beaverton, OR, USA) using NumPy 2.3.5 (NumPy Developers; NumFOCUS, Inc., Austin, TX, USA), SciPy 1.17.0 (SciPy Developers; NumFOCUS, Inc., Austin, TX, USA), GeoPandas 1.1.2 (GeoPandas Developers; NumFOCUS, Inc., Austin, TX, USA), Shapely 2.1.2 (Shapely Contributors), PyProj 3.7.2 (pyproj Contributors), Pyogrio 0.12.1 (pyogrio Contributors), and Numba 0.65.1 (Anaconda, Inc., Austin, TX, USA). All primary analytical settings needed to reproduce the reported results are specified above, including the analytical geography, coordinate reference system, neighborhood definitions, row standardization, treatment of no-neighbor units, randomization models, permutation counts, random seed, p-value construction, and multiple-testing correction. The harmonized municipality-level analytical dataset, analysis code, spatial weights, and derived outputs are available from the corresponding author upon reasonable request; the source population data are publicly available through KOSIS.
3. Results
3.1. Provider Network and Administrative Absence
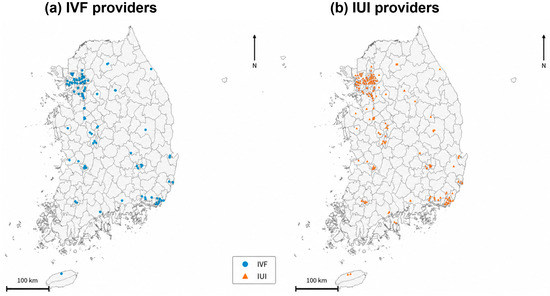
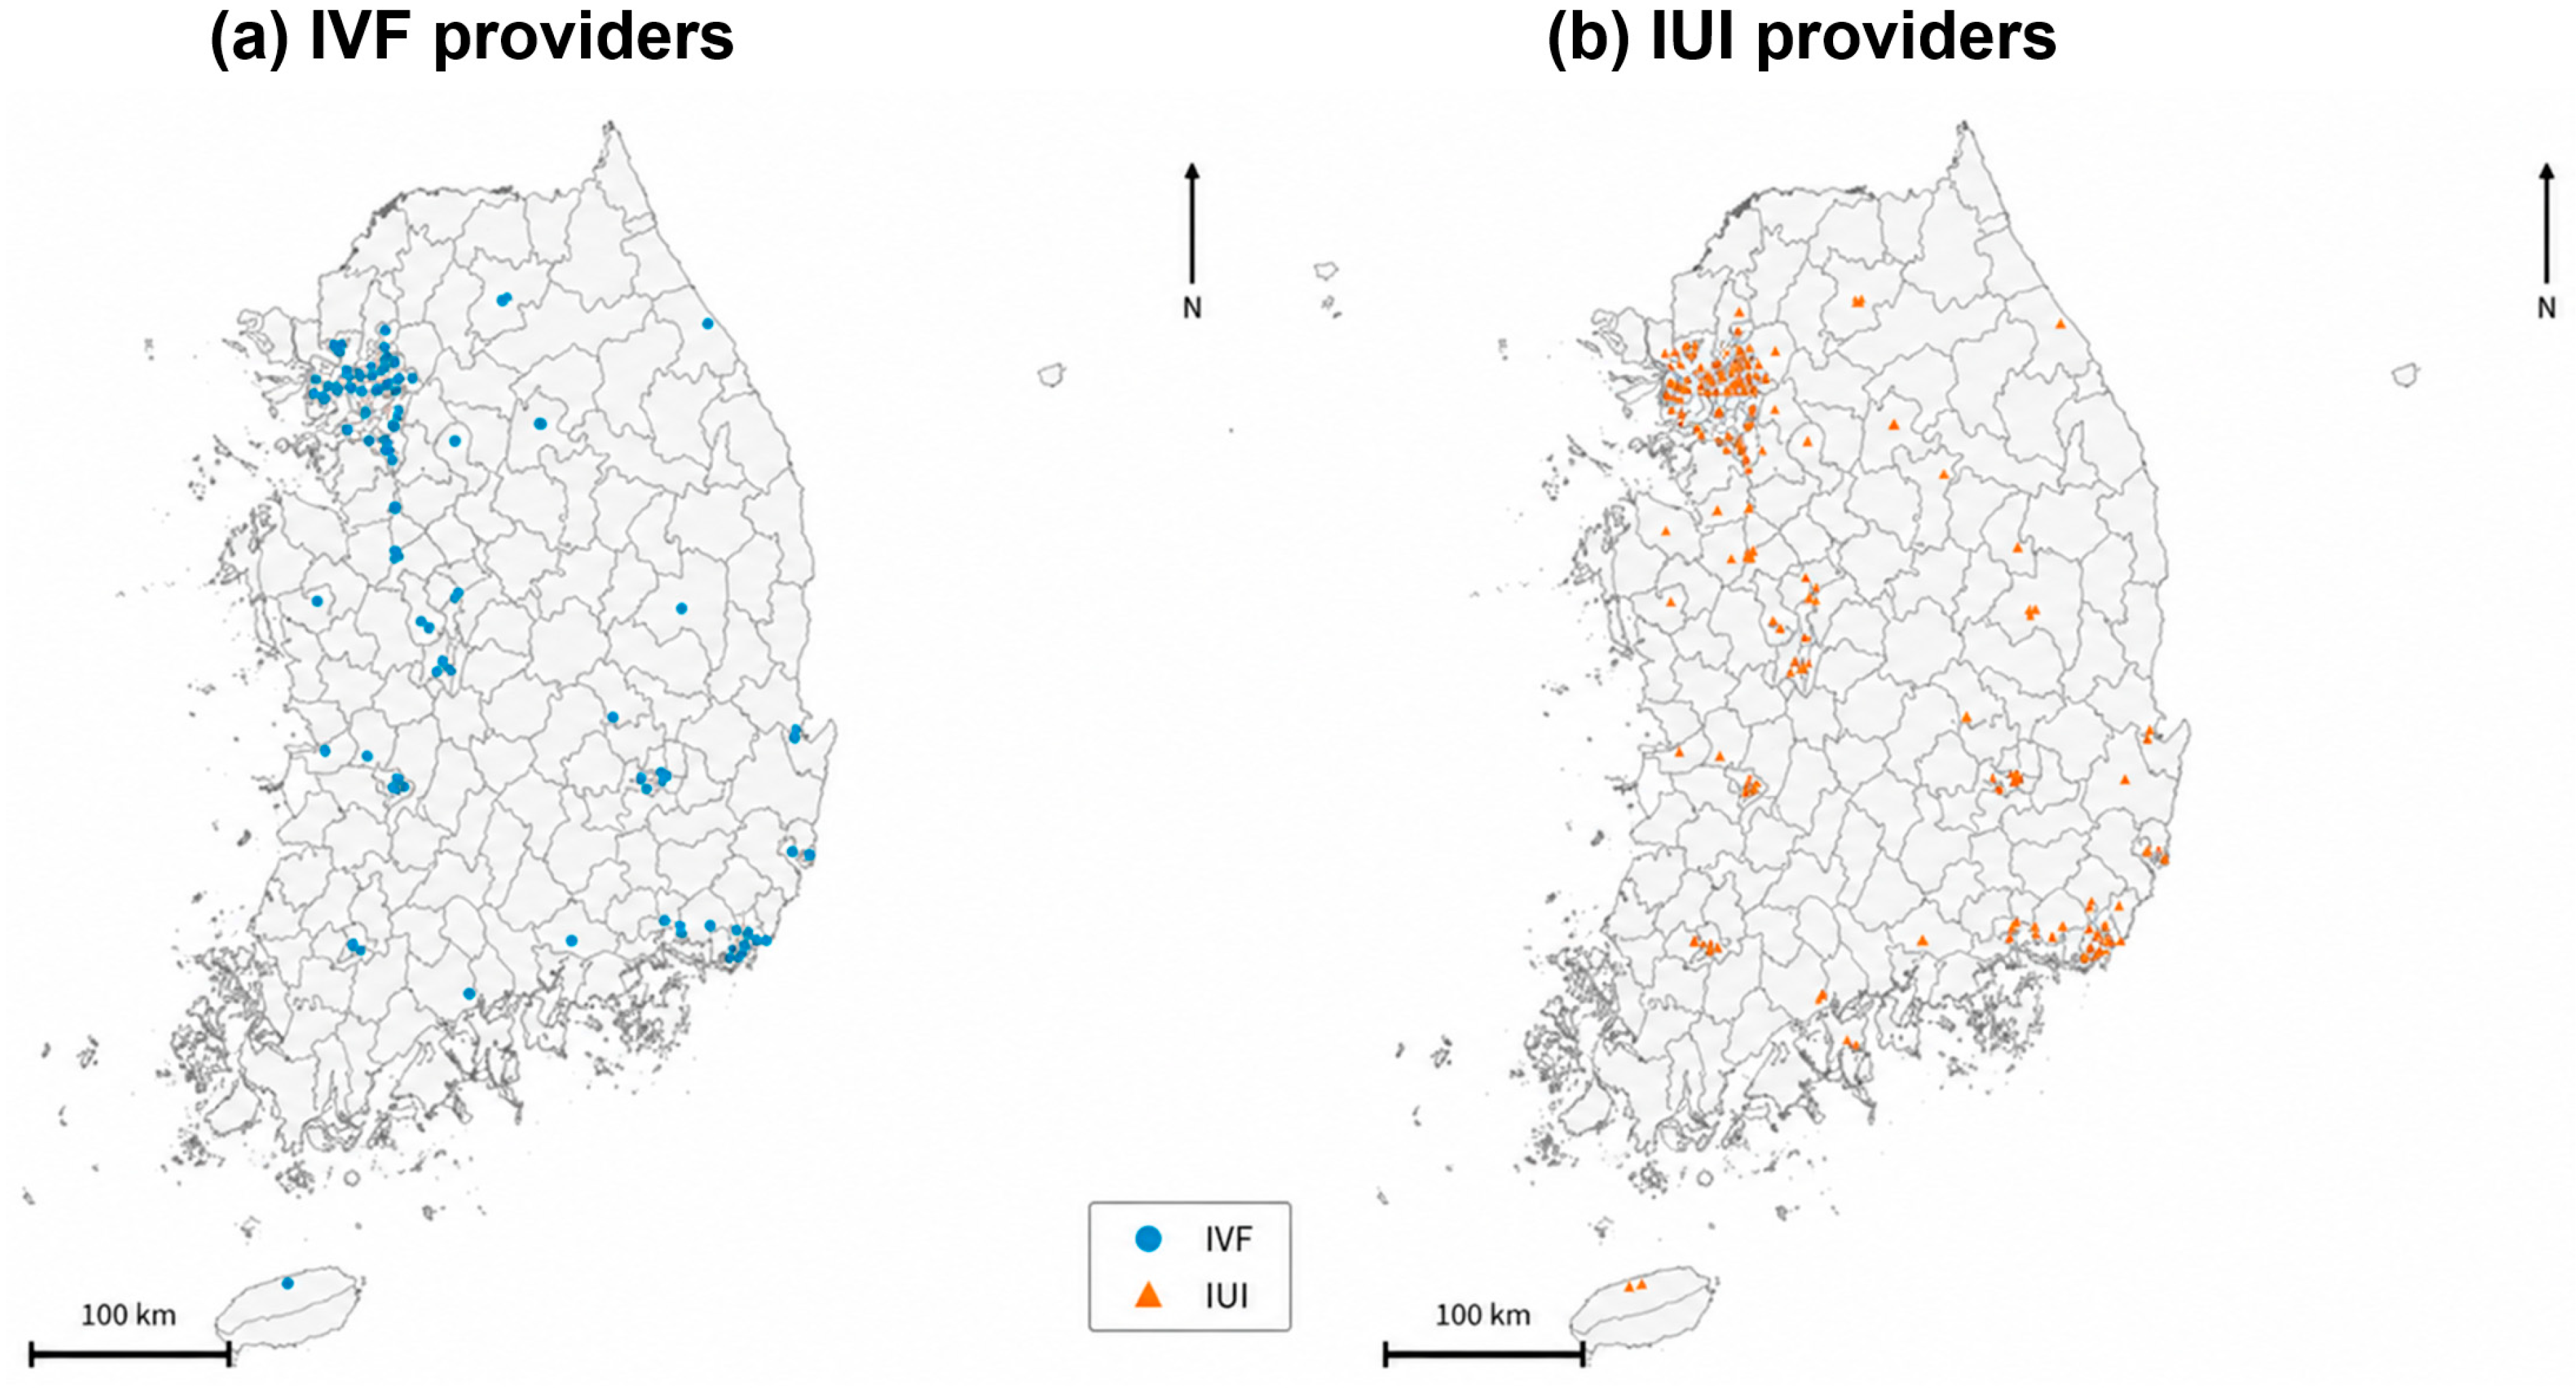
The IUI dataset comprised 264 provider sites distributed across 111 of the 252 analytical units, whereas the IVF dataset comprised 154 provider sites across 76 units. All 154 IVF-listed sites also appeared in the IUI inventory, while 110 sites appeared only in the IUI inventory. The two service categories were therefore not mutually exclusive. Figure 1 shows the national distribution of provider locations by treatment type.
Figure 1.
Distribution of designated infertility treatment providers in December 2025: (a) IVF providers (n = 154); (b) IUI providers (n = 264). All IVF-listed sites also appeared in the IUI inventory; the categories are not mutually exclusive.
IUI providers were absent from 141 units (56.0%), and IVF providers were absent from 176 units (69.8%). The 20–45-year female reference population residing in zero-provider units was 2,096,948 for IUI (25.8% of the national reference population) and 3,734,665 for IVF (45.9%). These percentages describe residence in administrative units without a listed provider; they do not estimate the proportion unable to obtain or use treatment. The corresponding two-part descriptive results for provider absence, provider presence, and positive provider density are summarized in Table 4.
Table 4.
Provider network and two-part descriptive results, women aged 20–45 years.
3.2. Population-Adjusted Density and Inequality
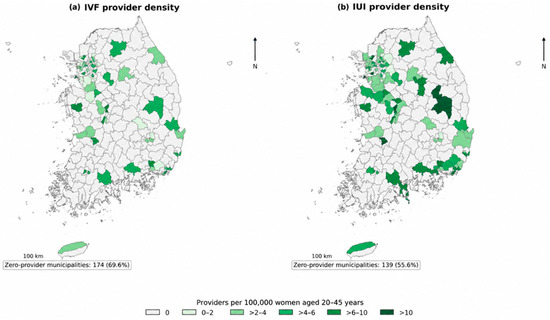
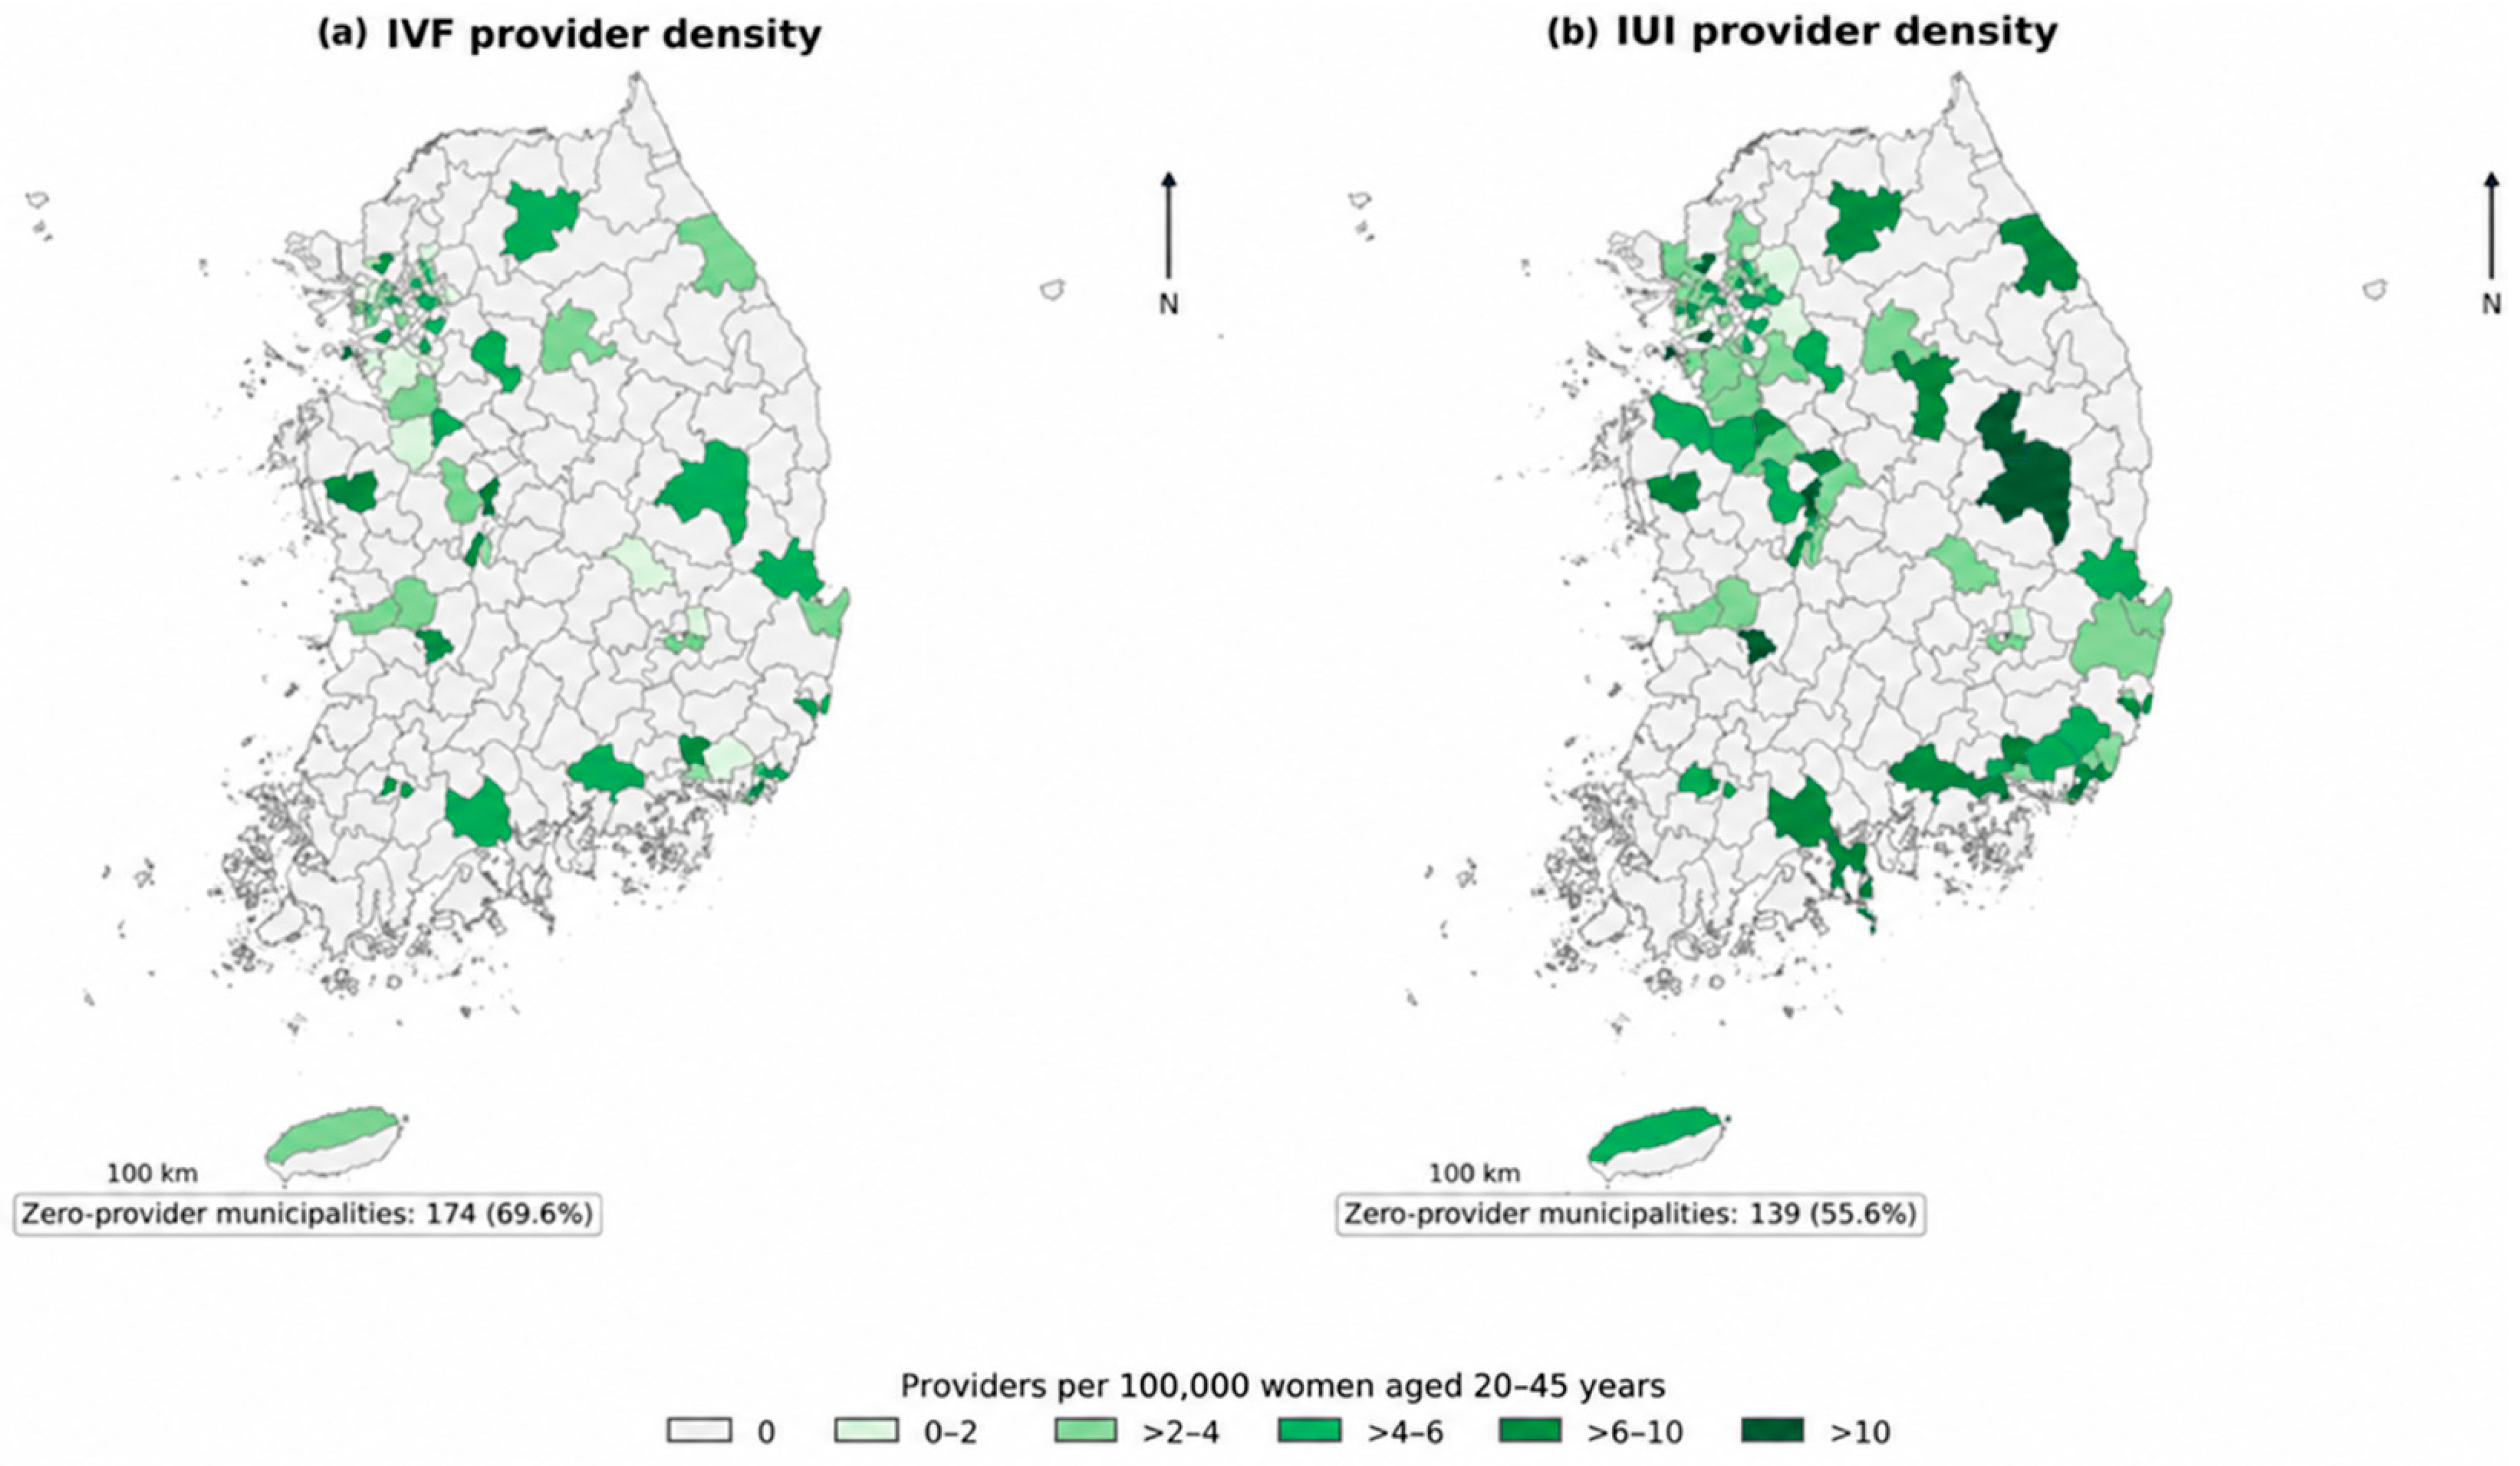
Using a common legend with zero shown as a separate class, both density maps show substantial administrative absence, although IUI providers were present in more units, and more units fell in the highest IUI density class (Figure 2). Identical class boundaries were applied to IUI and IVF so that zero supply was not conflated with low positive density. The number of analytical units falling within each common density class is reported in Table 5.
Figure 2.
IVF (a) and IUI (b) provider density per 100,000 women aged 20–45 years. Both panels use the same class boundaries, and zero-provider municipalities are displayed as a separate class.
Table 5.
Number of analytical units in each common provider density class, women aged 20–45 years.
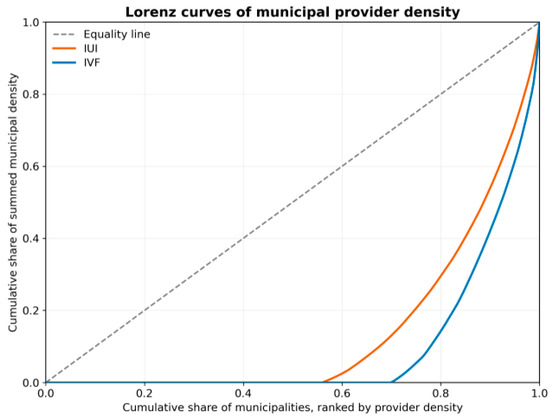
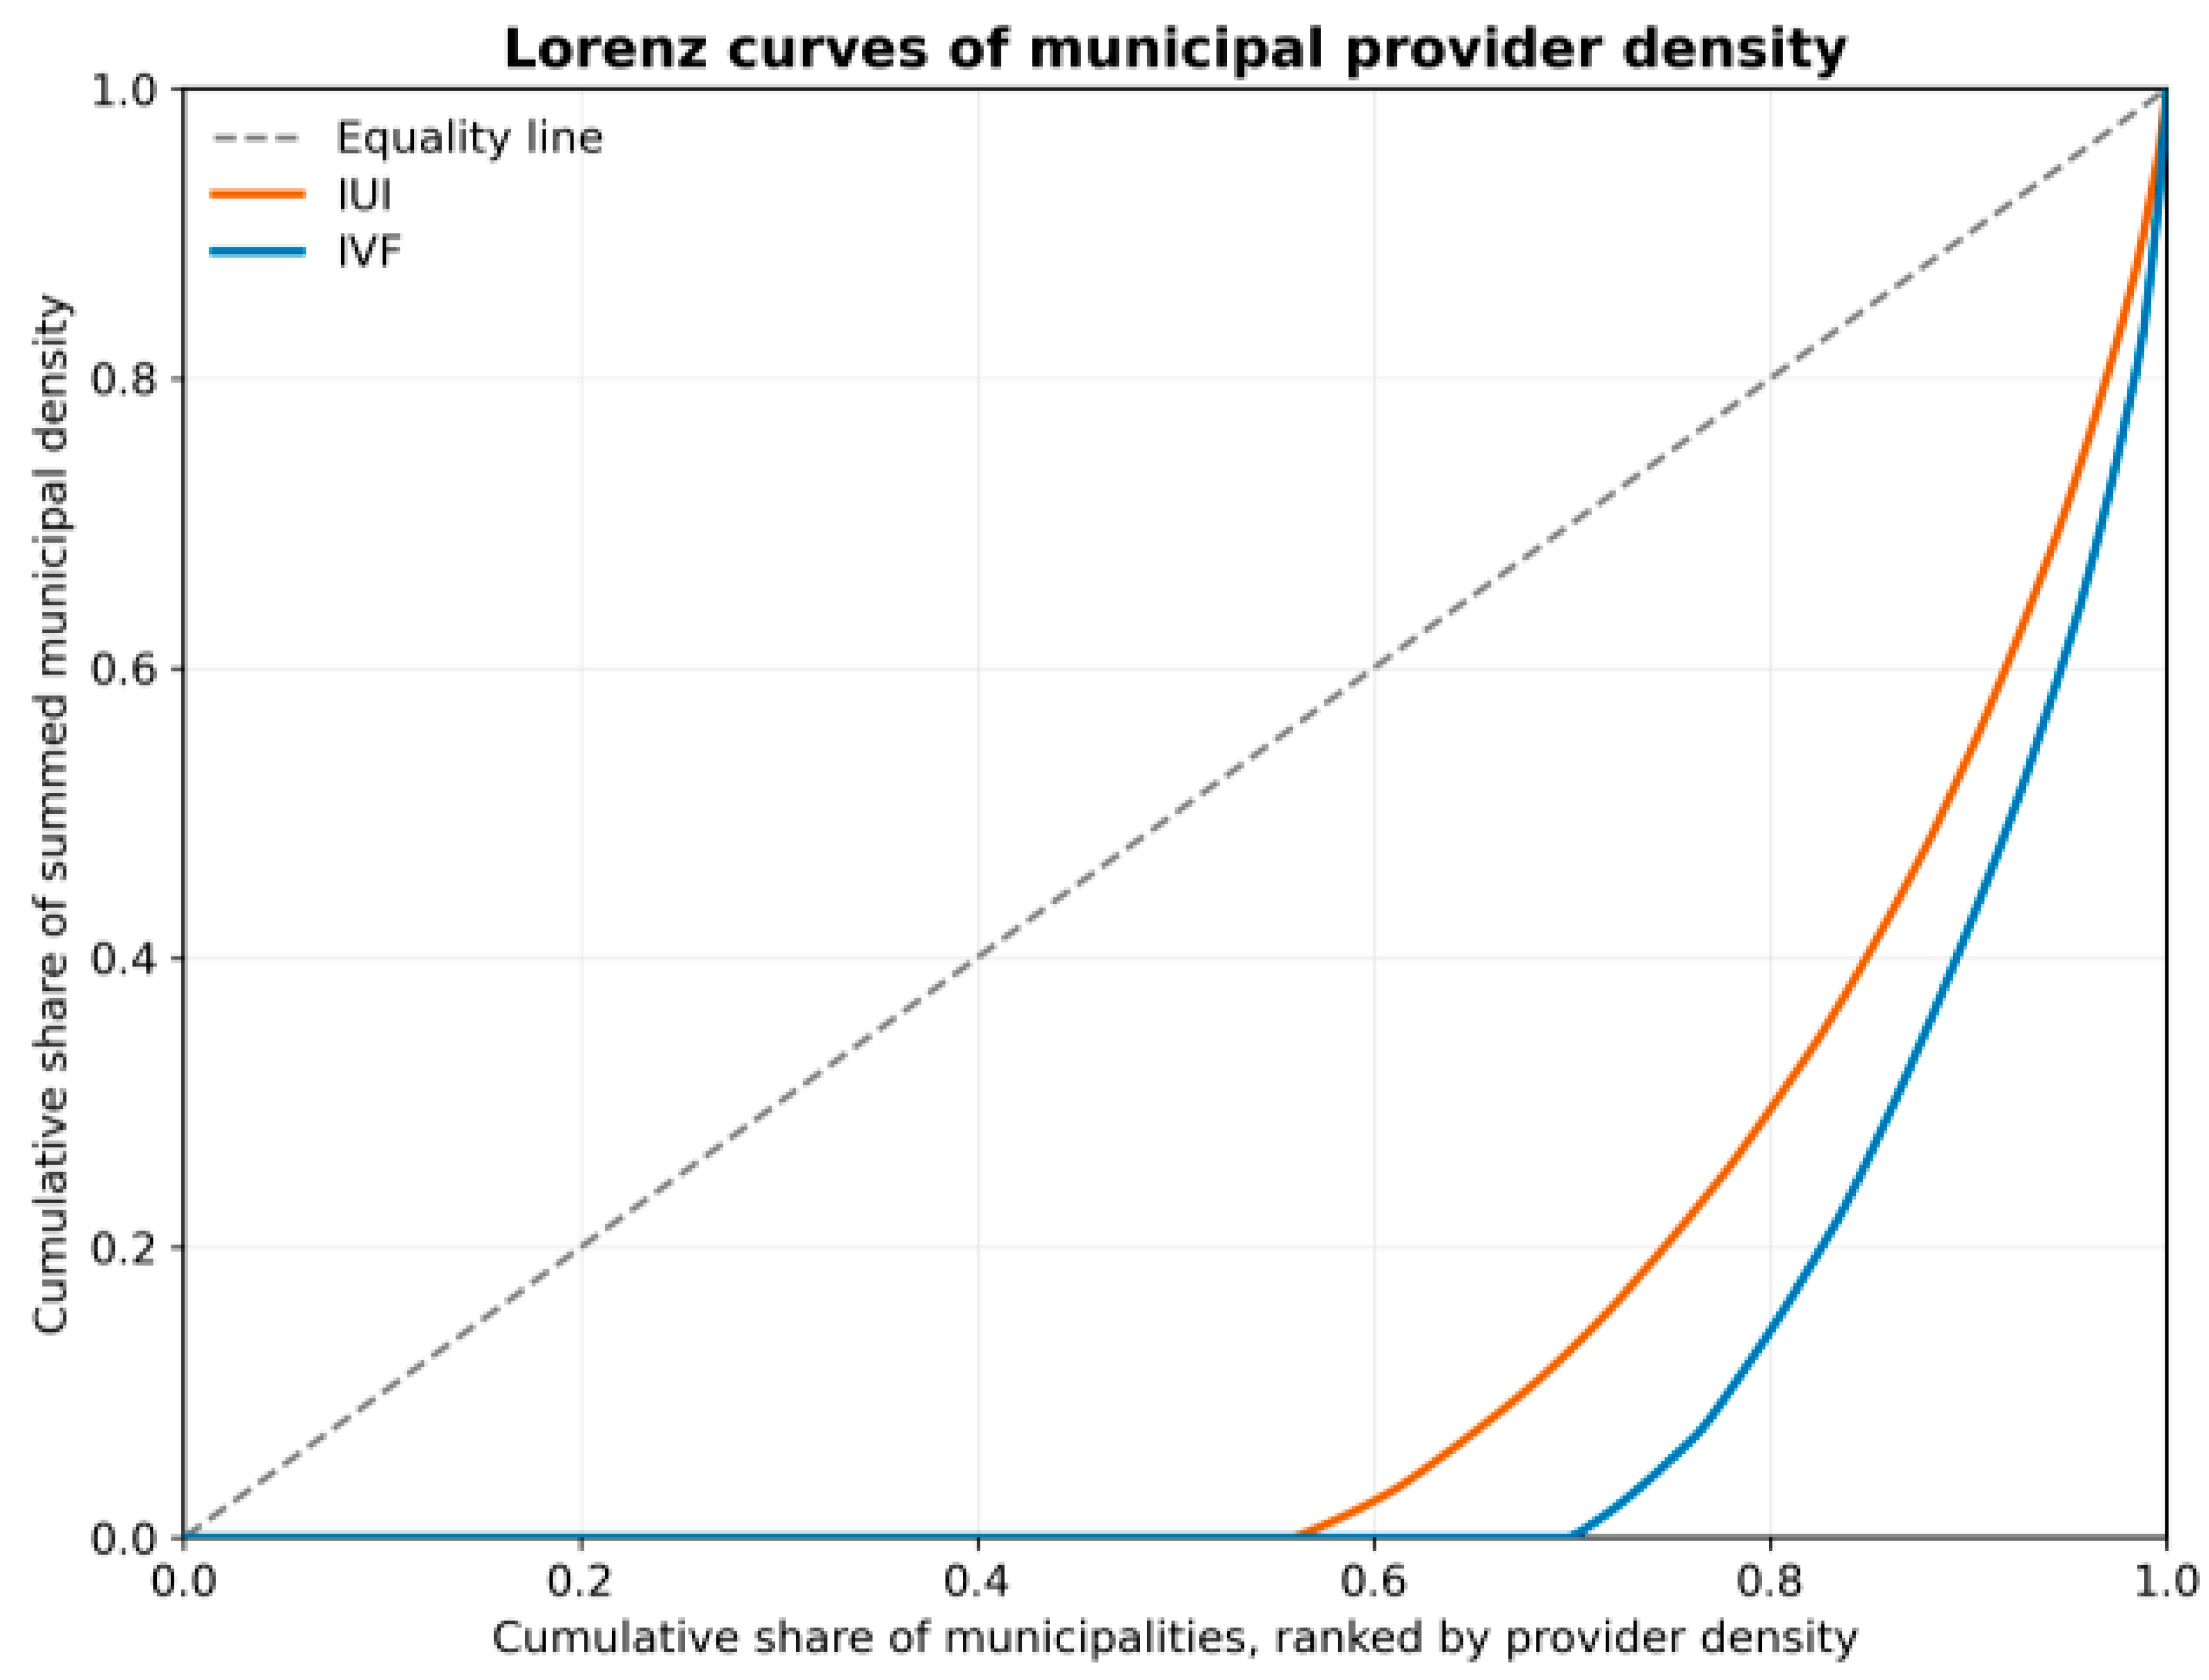
IVF density was more unequal than IUI density under both equal-municipality and reference-population weighting (Table 6). The same ordering was observed with the 20–44, 15–49, and 20–49 denominators (Table 7). These indices describe concentration of municipal provider-to-population ratios and are not tests of patient-level inequality. The Lorenz curves in Figure 3 provide a visual representation of this difference, with the IVF curve showing a greater departure from the line of equality than the IUI curve.
Table 6.
Gini and Theil T indices for the primary 20–45-year reference population.
Table 7.
Gini and Theil T indices under the primary and alternative population denominators.
Figure 3.
Lorenz curves of municipal IUI and IVF provider density using women aged 20–45 years as the reference population. Greater departure from the equality line indicates greater inequality in municipal density.
3.3. Global and Local Spatial Association
For raw provider density under the primary Queen weights, Global Moran’s I was 0.07231 for IUI and 0.03660 for IVF. Neither association was statistically significant in the 99,999-permutation two-sided test (p = 0.07910 and p = 0.28332, respectively). The corresponding expected value under randomization was −0.003984 (Table 8).
Table 8.
Primary Global Moran results for raw provider density.
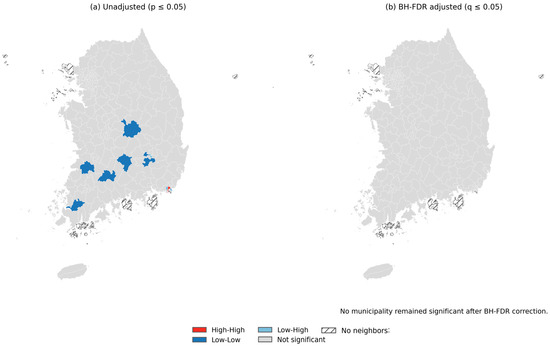
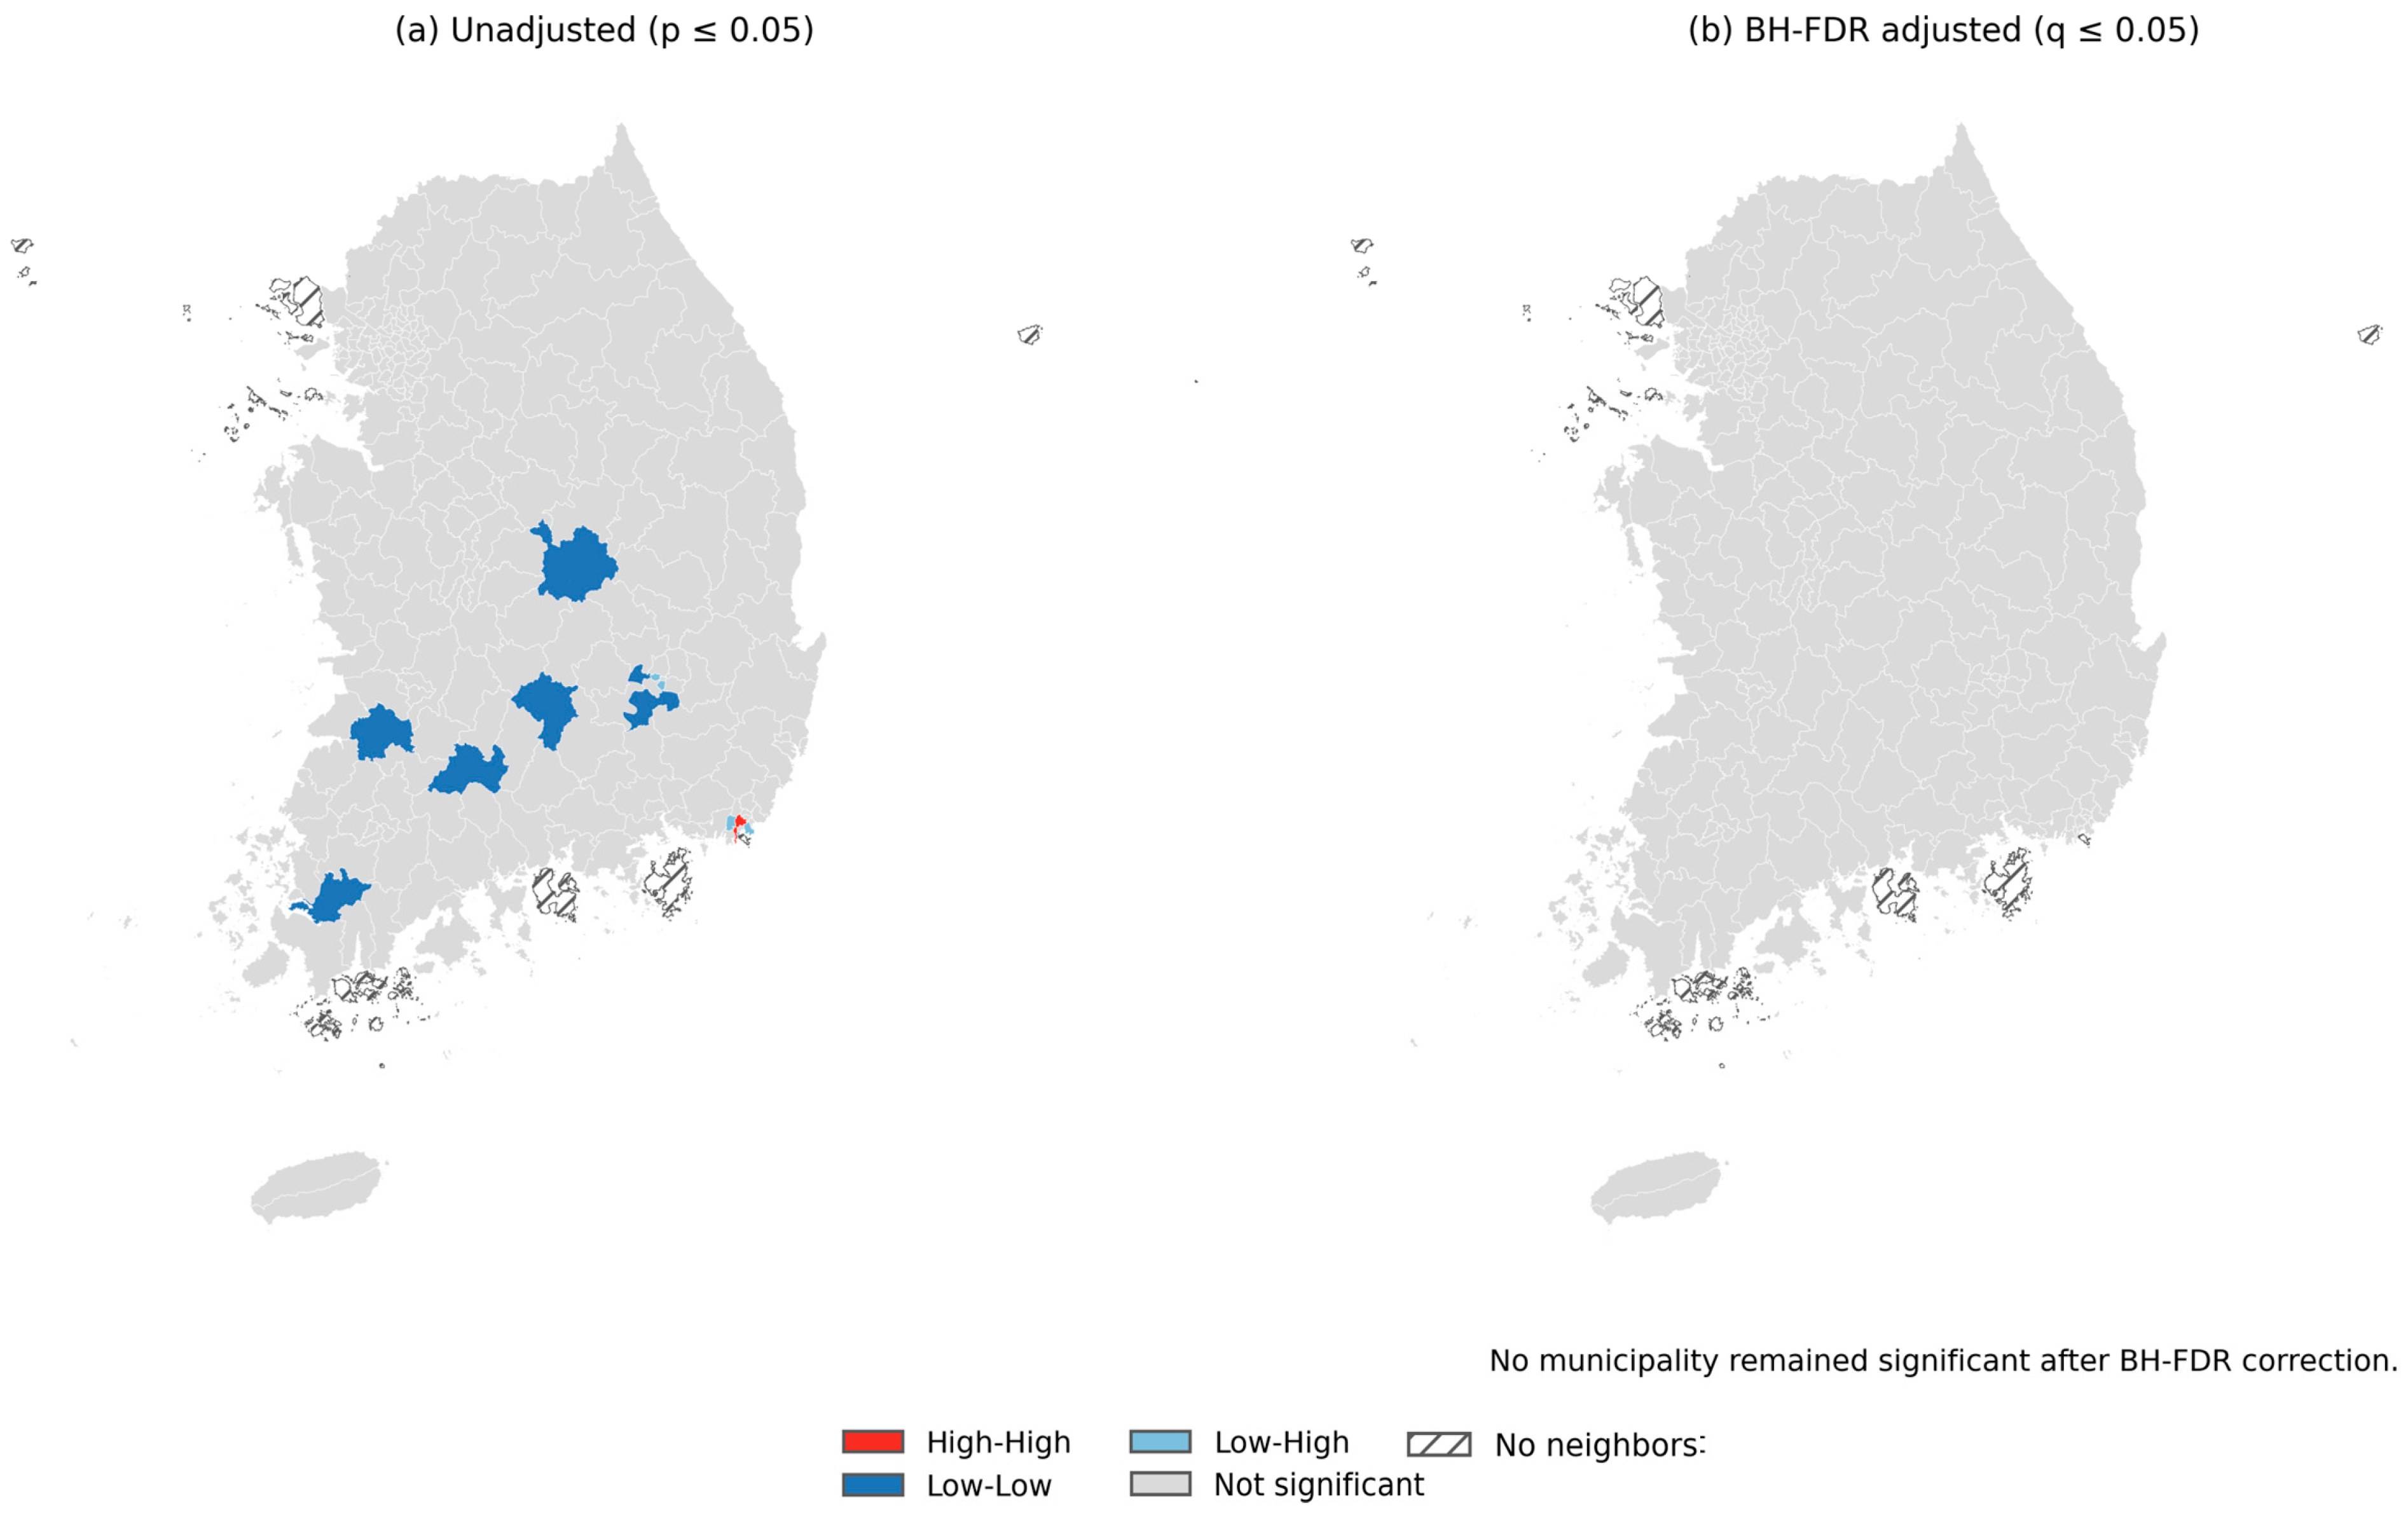
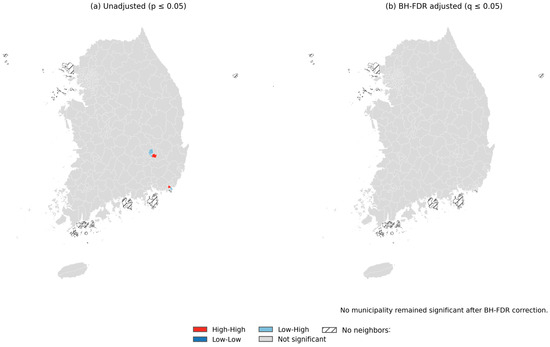
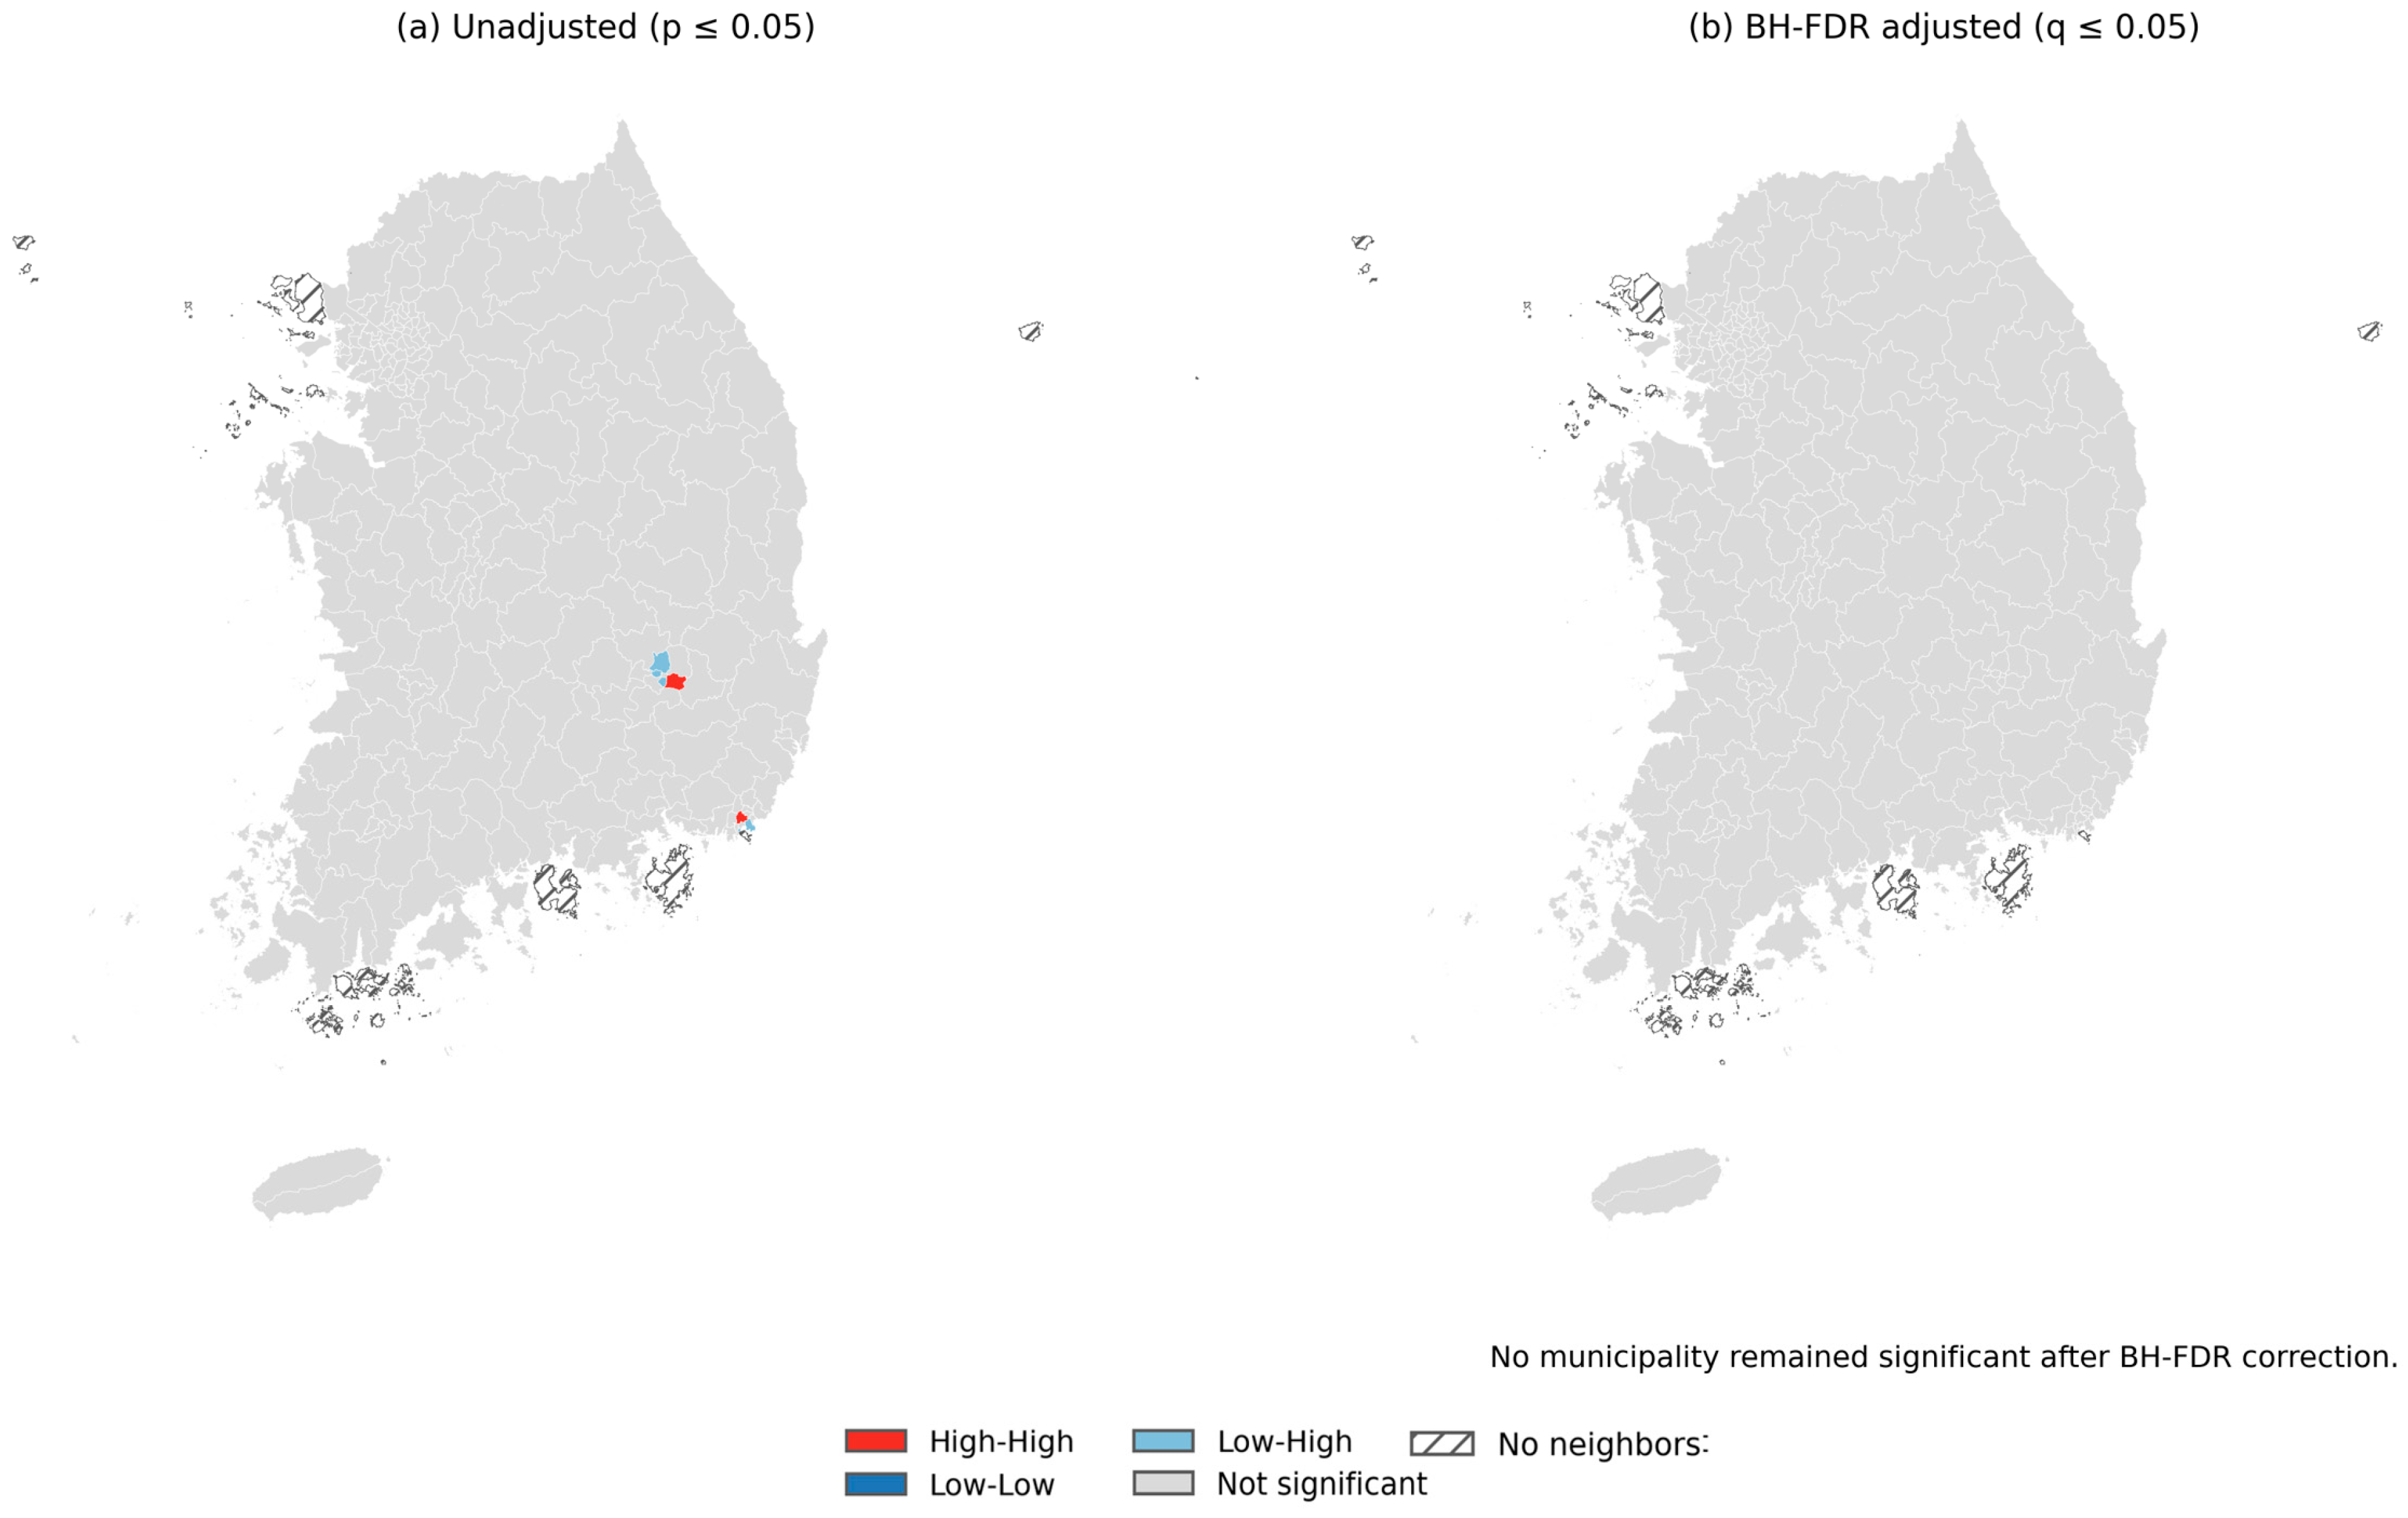
Before multiplicity correction, Local Moran tests for IUI density classified 2 units as High–High, 6 as Low–Low, and 5 as Low–High; seven units had no contiguous neighbor. None of the 13 unadjusted IUI classifications remained significant after BH-FDR correction. IVF likewise had 2 High–High and 5 Low–High unadjusted classifications, with none remaining significant after correction (Table 9). The spatial distribution of the unadjusted and BH-FDR-adjusted Local Moran classifications is shown for IUI in Figure 4 and for IVF in Figure 5. In both services, the adjusted panels contain no statistically significant local clusters or spatial outliers because none of the unadjusted classifications remained significant after FDR correction. The neutral appearance of the adjusted panels in Figure 4 and Figure 5 is the corrected statistical result rather than missing map information. The maps show that visually notable unadjusted local patterns did not survive control of the false discovery rate.
Table 9.
Local Moran classifications for the primary raw-density analysis.
Figure 4.
Local Moran results for raw IUI provider density. (a) Unadjusted two-sided local tests at p ≤ 0.05. (b) Benjamini–Hochberg FDR-adjusted results at q ≤ 0.05. No local association remained significant after adjustment, and seven units had no contiguous neighbor in the Queen graph.
Figure 5.
Local Moran results for raw IVF provider density. Unadjusted classifications are shown in the (a) and BH-FDR-adjusted results in the (b). No local association remained significant after adjustment.
3.4. Two-Part and Robustness Analyses
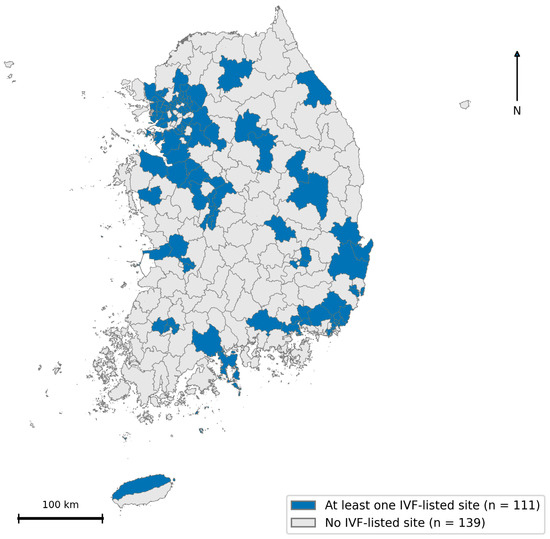
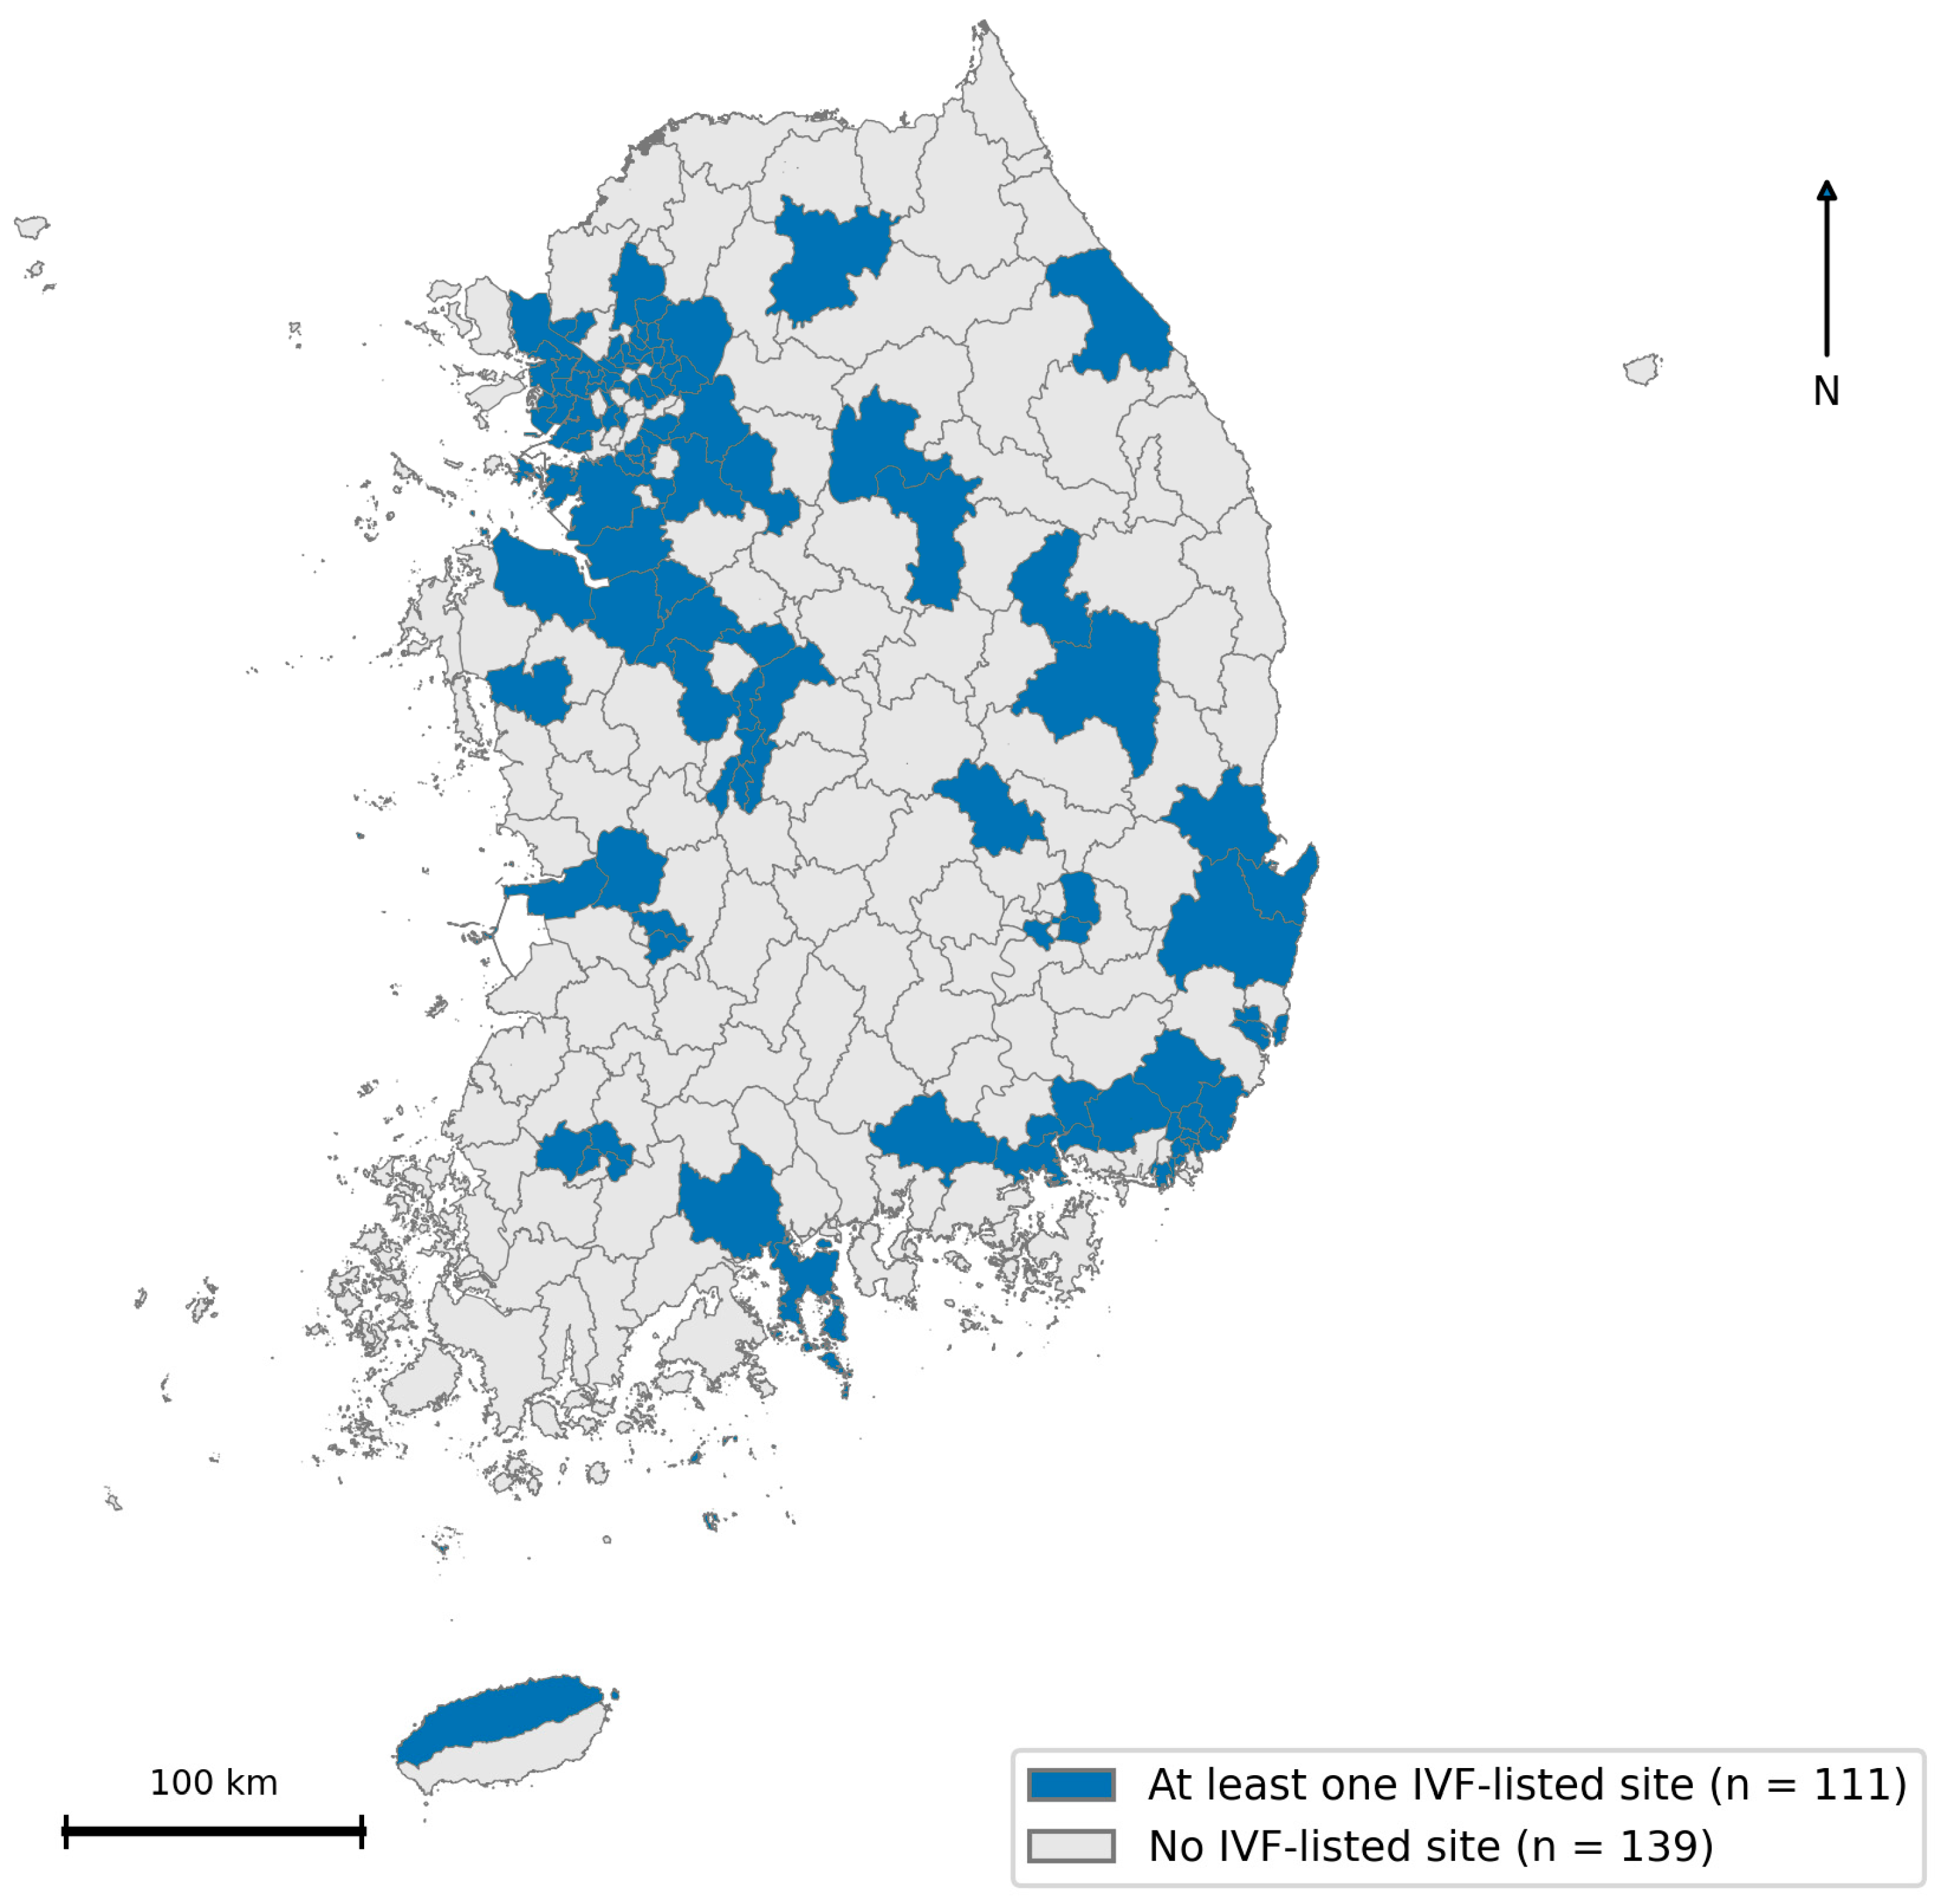
The binary presence analysis produced a different result from raw density. Under Queen weights, IUI presence showed positive global spatial association (Moran’s I = 0.26601, p = 0.00020), whereas IVF presence did not meet the 0.05 threshold (I = 0.07921, p = 0.05120). Fixed-prevalence join counts gave the same qualitative distinction: IUI present–present joins were more frequent than expected after Holm correction, whereas the IVF result was not significant. Figure 6 maps IUI provider presence by analytical unit.
Figure 6.
Municipality-level presence and absence of IUI providers. This is an administrative provider-presence indicator and does not represent travel-time accessibility.
The raw-density conclusion was stable across all four age denominators and the core Queen, Rook, KNN4, and KNN8 weights. In the 32 service-age-weight combinations, all global permutation p-values exceeded 0.05, and no BH-adjusted local detection occurred. Table 10 summarizes the range of Moran statistics and p-values across the four age denominators for each graph. Primary Queen results with 99,999 permutations are reported separately in Table 8; Table 10 uses 9999 permutations for the sensitivity runs.
Table 10.
Selected robustness results relevant to the zero-heavy distribution.
Alternative indicators were less uniform. Log-transformed IUI density under Queen weights showed significant positive global association (I = 0.15634, p = 0.0010), although no Queen-based local classification survived BH adjustment. Under KNN8, the log-density specification produced five BH-adjusted local detections (4 High–High and 1 Low–High), but none survived the more conservative BY adjustment. IVF empirical-Bayes density showed negative global association under Queen weights (I = −0.10030, p = 0.0104). Under the empirical-Bayes specification used here, IUI-smoothed rates converged to a constant across units, so Moran’s I was not estimable.
4. Discussion
4.1. Main Findings
Across the harmonized 252-unit geography, IVF providers were present in fewer units than IUI providers, and IVF provider density was more unequal by both Gini and Theil measures. These results show that service-specific geographical distributions should be evaluated empirically rather than inferred from the procedural hierarchy of IUI and IVF.
A large number of zero-provider units did not translate into robust Local Moran clusters of raw density. The unadjusted IUI map contained several apparent High–High, Low–Low, and Low–High classifications, but all disappeared after control of the false discovery rate. The same was true for IVF. The corrected result is more conservative and avoids assigning substantive meaning to local classifications that are not robust to multiple testing.
4.2. Presence, Inequality, and Spatial Association Answer Different Questions
The two-part analysis explains why the spatial findings are not contradictory. IUI provider presence was globally clustered, whereas raw IUI density was not statistically significant under the primary Moran test. Presence asks whether neighboring units tend to share a zero/non-zero status; raw density additionally reflects the number of providers and the size of the reference population. Gini and Theil indices answer a third question, namely how unequal municipal density values are. A service can therefore have many zero-provider areas and a concentrated distribution without exhibiting robust Local Moran clusters after multiplicity correction.
The sensitivity analyses also caution against treating one spatial transformation as definitive. The log-transformed IUI rate and the binary presence indicator yielded stronger global spatial structure than raw density. One KNN8/log-density specification produced BH-adjusted local detections, while the primary raw-density analyses did not, and those KNN8 detections did not survive BY adjustment. These secondary findings are therefore reported as evidence of specification dependence rather than as confirmed clusters.
4.3. Administrative Geography, MAUP, and Cross-Boundary Care
The use of si, gun, and gu units provides a consistent framework for linking provider and population data, but it imposes administrative boundaries on a healthcare market that is not closed. This limitation is especially important in metropolitan areas, where a provider across a district boundary may be closer than one within the patient’s own district. The 252-unit analytical framework also represents Bucheon at the city level while retaining district-level units elsewhere, illustrating how zoning choices can alter denominators, adjacency, and local statistics.
This is an instance of the modifiable areal unit problem (MAUP) [22]. The Queen, Rook, and k-nearest-neighbor sensitivity analyses alter neighbor relations while retaining the same zones; they therefore test graph dependence but do not solve MAUP. A stronger accessibility design would compare administrative results with road-network travel-time catchments, service areas, or floating-catchment measures and would incorporate provider capacity and competition for care [5,23].
Cross-boundary utilization cannot be inferred from the present data. Residents of a zero-provider unit may use a nearby provider, travel to a high-volume center, delay care, or not seek treatment. Conversely, residents of a provider-containing unit may bypass the local site because of waiting time, cost, referral arrangements, or perceived quality. Patient origins, provider destinations, travel mode, and treatment volumes are required to distinguish these possibilities. For this reason, the study uses the terms administrative absence and provider availability rather than inaccessibility or medically underserved areas.
4.4. Interpretation, Policy Relevance, and Limitations
The results support a descriptive conclusion rather than a direct planning prescription. IUI and IVF provider availability is uneven across analytical units, and the two service inventories have different degrees of concentration. These findings identify where more detailed accessibility analysis may be warranted, but they do not establish where a new provider should be located or whether current capacity is insufficient. Travel time, treatment-cycle volume, specialist and embryology staffing, waiting time, and referral flows would be required for that assessment.
Several limitations remain. The 20–45-year female population is a standardization denominator, not observed infertility prevalence or treatment need; male-factor infertility, partnership status, clinical eligibility, and treatment intention are not represented. Provider sites are equally weighted even though capacity may differ substantially. Small municipal denominators can produce large densities from a single provider, which is why alternative age definitions, positive-only summaries, log transformation, and empirical-Bayes smoothing were examined. The study is cross-sectional and cannot describe openings, closures, or temporal changes. Finally, the numerical findings are specific to the Korean provider distribution and the analytical geography used here and should not be transferred directly to health systems with different administrative or referral structures.
5. Conclusions
In December 2025, the national provider data included 264 IUI provider sites and 154 IVF provider sites across 252 harmonized analytical units. IUI providers were absent from 56.0% of units and IVF providers from 69.8%. Municipal provider density was more unequal for IVF than for IUI, with equal-weight Gini coefficients of 0.8067 and 0.7153, respectively.
Neither raw-density layer showed significant global spatial autocorrelation under the primary Queen model, and no Local Moran classification remained significant after BH-FDR correction. The IUI presence indicator, however, showed significant global clustering, demonstrating that provider presence and provider density capture different spatial features. The study therefore provides a reproducible description of municipal availability and inequality, not a measure of realized access. Travel-time, capacity, and patient-flow analyses are the appropriate next steps for evaluating functional healthcare access.
Author Contributions
Conceptualization, J.L. and K.L.; methodology, J.L., N.C. and K.L.; formal analysis, J.L. and N.C.; investigation, J.L. and J.C.; data curation, J.L. and N.C.; visualization, J.L. and N.C.; validation, N.C., J.C. and K.L.; writing—original draft preparation, J.L.; writing—review and editing, N.C., J.C. and K.L.; supervision, K.L. All authors have read and agreed to the published version of the manuscript.
Funding
This research received no external funding.
Institutional Review Board Statement
Not applicable. This study used publicly available institution-level information and aggregated population statistics and did not involve individual participants or identifiable patient data.
Informed Consent Statement
Not applicable.
Data Availability Statement
The harmonized municipality-level analytical dataset, analysis code, spatial weights, and derived outputs are available from the corresponding author upon reasonable request. Population data are publicly available through KOSIS, and provider information was obtained from HIRA. Access to the original source data is subject to the terms of the respective data providers.
Acknowledgments
The authors acknowledge the Health Insurance Review and Assessment Service and the public agencies maintaining the resident population statistics used in this study.
Conflicts of Interest
Author J.L. was employed by the company Dabeeo Co., Ltd. The remaining authors declare that the research was conducted in the absence of any commercial or financial relationships that could be construed as potential conflicts of interest.
Abbreviations
The following abbreviations are used in this manuscript:
| BH | Benjamini–Hochberg |
| BY | Benjamini–Yekutieli |
| CRS | Coordinate reference System |
| EB | Epirical Bayes |
| FDR | False Discovery Rate |
| HIRA | Health Insurance Review and Assessment Service |
| HH | High–High |
| HL | High–Low |
| IUI | Intrauterine Insemination |
| IVF | In Vitro Fertilization |
| kNN | k-Nearest Neighbors |
| KOSIS | Korean Statistical Information Service |
| LH | Low–High |
| LISA | Local Indicators of Spatial Association |
| MAUP | Modifiable Areal Unit Problem |
References
- World Health Organization. Infertility Prevalence Estimates, 1990–2021; World Health Organization: Geneva, Switzerland, 2023. [Google Scholar]
- World Health Organization. Guideline for the Prevention, Diagnosis and Treatment of Infertility; World Health Organization: Geneva, Switzerland, 2025. [Google Scholar]
- Lee, S.H.; Kang, J.W.; Yoo, J.H.; Hwang, N.M.; Yoon, J.W.; Wang, S.H.; Choi, S.J. Study to Improve the Quality-Management Evaluation System for Infertility Treatment Institutions; Research Report; Health Insurance Review and Assessment Service: Wonju, Republic of Korea, 2024. [Google Scholar]
- Penchansky, R.; Thomas, J.W. The concept of access: Definition and relationship to consumer satisfaction. Med. Care 1981, 19, 127–140. [Google Scholar] [CrossRef] [Scilit] [PubMed]
- Luo, W.; Wang, F. Measures of spatial accessibility to health care in a GIS environment: Synthesis and a case study in the Chicago region. Environ. Plan. B Plan. Des. 2003, 30, 865–884. [Google Scholar] [CrossRef] [Scilit] [PubMed]
- Lazzari, E.; Baffour, B.; Chambers, G.M. Residential proximity to a fertility clinic is independently associated with likelihood of women having ART and IUI treatment. Hum. Reprod. 2022, 37, 2662–2671. [Google Scholar] [CrossRef] [Scilit] [PubMed]
- Harris, J.A.; Menke, M.N.; Haefner, J.K.; Moniz, M.H.; Perumalswami, C.R. Geographic access to assisted reproductive technology health care in the United States: A population-based cross-sectional study. Fertil. Steril. 2017, 107, 1023–1027. [Google Scholar] [CrossRef] [Scilit] [PubMed]
- Tierney, K.I. Geographic distribution of assisted reproductive technology clinics in the USA: A multilevel sociodemographic analysis. J. Assist. Reprod. Genet. 2022, 39, 2505–2519. [Google Scholar] [CrossRef] [Scilit] [PubMed]
- Peipert, B.J.; Potapragada, N.R.; Lantos, P.M.; Harris, B.S.; Reinecke, J.; Goldman, K.N. A geospatial analysis of disparities in access to oncofertility services. JAMA Oncol. 2023, 9, 1364–1370. [Google Scholar] [CrossRef] [Scilit] [PubMed]
- Lee, S. Spatial and socioeconomic inequalities in accessibility to healthcare services in South Korea. Healthcare 2022, 10, 2049. [Google Scholar] [CrossRef] [Scilit] [PubMed]
- Ko, H.; Ock, M.; Lee, S.; Park, J.W.; Kwak, M.Y.; Jang, W.M. Supply-side impact of supporting obstetrically underserved areas: A nationwide cross-sectional study. J. Korean Med. Sci. 2025, 40, e186. [Google Scholar] [CrossRef] [Scilit] [PubMed]
- Bartolomeo, N.; Lorusso, L.; Carella, M.; Pace, R.; Trerotoli, P. Geographical Distance, Socioeconomic Deprivation, and Educational Level Shape Access to Voluntary Termination of Pregnancy in a Southern Region of Italy. Healthcare 2025, 13, 2160. [Google Scholar] [CrossRef] [Scilit] [PubMed]
- Bivand, R.S.; Wong, D.W.S. Comparing implementations of global and local indicators of spatial association. TEST 2018, 27, 716–748. [Google Scholar] [CrossRef] [Scilit]
- Moran, P.A.P. Notes on continuous stochastic phenomena. Biometrika 1950, 37, 17–23. [Google Scholar] [CrossRef] [Scilit]
- Anselin, L. Local Indicators of Spatial Association-LISA. Geogr. Anal. 1995, 27, 93–115. [Google Scholar] [CrossRef] [Scilit]
- Benjamini, Y.; Hochberg, Y. Controlling the false discovery rate: A practical and powerful approach to multiple testing. J. R. Stat. Soc. Ser. B 1995, 57, 289–300. [Google Scholar] [CrossRef] [Scilit]
- Benjamini, Y.; Yekutieli, D. The control of the false discovery rate in multiple testing under dependency. Ann. Stat. 2001, 29, 1165–1188. [Google Scholar] [CrossRef] [Scilit]
- Ministry of the Interior and Safety. Resident Population by Administrative District (Si/Gun/Gu) and Single Year of Age, December 2025; Korean Statistical Information Service, Table DT_1B04006. Available online: https://kosis.kr/statHtml/statHtml.do?orgId=101&tblId=DT_1B04006&conn_path=I3 (accessed on 19 September 2026).
- Ministry of Health and Welfare. Pregnancy and Childbirth Support: Preconception Health Management. Available online: https://www.mohw.go.kr/menu.es?mid=a10711020100 (accessed on 19 September 2026).
- Ministry of Health and Welfare. 23rd Health Insurance Policy Deliberation Committee Meeting of 2021. 28 October 2021. Available online: https://www.mohw.go.kr/board.es?act=view&bid=0027&cg_code=&list_no=368286&mid=a10503010100&tag= (accessed on 19 September 2026).
- Bivand, R.; Berke, O. Global Empirical Bayes Estimator-EBest. spdep Reference Documentation. Available online: https://r-spatial.github.io/spdep/reference/EBest.html (accessed on 19 September 2026).
- Openshaw, S. The Modifiable Areal Unit Problem; Geo Books: Norwich, UK, 1984. [Google Scholar]
- Luo, W.; Qi, Y. An enhanced two-step floating catchment area (E2SFCA) method for measuring spatial accessibility to primary care physicians. Health Place 2009, 15, 1100–1107. [Google Scholar] [CrossRef] [Scilit] [PubMed]

Disclaimer/Publisher’s Note: The statements, opinions and data contained in all publications are solely those of the individual author(s) and contributor(s) and not of MDPI and/or the editor(s). MDPI and/or the editor(s) disclaim responsibility for any injury to people or property resulting from any ideas, methods, instructions or products referred to in the content. |
© 2026 by the authors. Licensee MDPI, Basel, Switzerland. This article is an open access article distributed under the terms and conditions of the Creative Commons Attribution (CC BY) license.