


Abstract
Integrated Water Resources Management requires decision-support approaches capable of combining hydrologic, climatic, social, economic, technical, and governance dimensions. This effort evaluates the transferability and structural robustness of an already developed composite-index framework for drought, water stress, water scarcity, and changing water conditions in the Regional Unit of Karditsa, Thessaly, Greece. The published COROADO index structure was transferred in its original form to show its local applicability to the reference year 2016. The Drought Vulnerability Index (DVI) had a regional mean of 1.20 and ranged from 0.18 to 2.13, while the Water Stress Vulnerability Index (WSTVI) had a mean of 1.01 and ranged from 0.54 to 2.20. DVI showed strong spatial concordance with the independently formulated Standardized Drought Vulnerability Index (r = 0.823), which was interpreted as convergent evidence rather than independent validation. Within the inherited WCCVI formulation, WSTVI has the largest component weight (0.408), followed by DVI (0.298) and WSCVI (0.294), while the higher vulnerability classes were concentrated mainly in the eastern and northeastern lowlands. Global structural sensitivity analysis based on 250,000 realizations showed high rank stability under ±20% weight perturbations (minimum Spearman ρ = 0.992) and limited sensitivity to moderate shifts in the final class boundaries (maximum class reassignment = 3.40%). In contrast, leave-one-indicator-out experiments produced changes of up to 59.24%. The results support the operational transferability of the COROADO framework as a regional screening approach, leading towards its broader applicability across contrasting hydrological, climatic social and economic settings.
1. Introduction
Water resource management is more than just a scientific process. It is a collective effort involving scientists, policy makers, and communities, since water is central to environmental and anthropogenic sustainability [1,2,3]. In recent decades, the fast pace of socio-economic changes, along with increasingly variable climate, has made water resources management even more complicated [4,5,6,7,8,9]. Throughout much of the world, the increasing population, together with the slow advancing deterioration in water resources and ecosystems, exerts pressure on both aquatic habitats and access to clean water [10,11,12]. From this perspective, it may be deduced that there are significant geographical inequalities when it comes to water allocation [13,14,15]. Nevertheless, industrialization, population growth, and poor efforts for water management have led to millions of people facing the looming risk of water shortages [1,6,16,17,18,19]. The extent to which a particular area is affected by such factors is, generally, determined by the local climate and economy [20,21,22]. Countries with advanced economies possess the resources to invest in high-quality infrastructure and management systems, a capacity often unavailable to developing nations [23,24,25,26]. Moreover, the fact that rainfall does not usually occur regularly, either time- or location-wise, makes it extremely challenging to fairly manage water across different areas [27,28,29,30]. Depending on latitude and the presence of geographical features such as mountain ranges, environmental changes may either support or undermine water resources use in a particular area [31,32]. The effects may be present in the form of heatwaves, reduced winter snowfall, and increased evaporation rates [33,34]. Such patterns are particularly alarming for Mediterranean climates, such as Greece, which, according to certain scenarios, is forecasted to experience near-catastrophic changes in its water resources in the predicted future [29,35,36,37,38,39].
The threat suggested by such scenarios of more frequent and severe droughts comes with harsh implications for both nature and society [18,40,41]. However, recent studies indicate that there are no noteworthy trends for more or less frequent droughts and their characteristics in the last fifty years for Europe [29,30]. Such existing tendencies reinforce the stochastic nature of drought and call for a continuous contingency planning posture to confront any potential occurrence of these natural hazards [42,43,44]. Droughts often trigger a domino effect of disasters, including dying forests, crop failures, health crises, food shortages, and even infant mortality, while destroying energy infrastructure and contaminating what little water remains [45,46,47,48,49,50]. Nonetheless, scarcity itself is a different phenomenon, which is further exacerbated by human interference [27,30,51,52,53]. Another challenge that water management must face is the rapid growth of urban areas, particularly those situated near rivers and other water bodies [54,55,56]. Such urbanization makes agriculture and business operations vulnerable to droughts and floods, thus endangering both people and their economy [57,58]. In case climate change results in scenarios of extreme weather conditions, it may also place immense pressure on health care, emergency services, tourism, and transportation sectors [1,30,35,59,60]. Simply enhancing water supply measures will no longer suffice when addressing such challenges [61,62,63,64]. Therefore, IWRM is mostly the only way to achieve an equilibrium between ecological necessities and societal demands [61,65,66]. Achieving this objective requires the active involvement of all relevant stakeholders, including scientists, public authorities, business representatives, environmental organizations, and the most crucial political will. This is not a “one and done” situation; it is a dynamic process that begins with public outreach and evolves into a long-term solution that everyone seeks [61,67,68].
Actual progress in water management is often derailed by a simple lack of understanding of how the system works or by undervaluing the damage caused by human activities. Resolving conflicts of interest among parties who all seek the same resource requires a “big picture” approach that addresses these conflicts from the individual scale to the international one. On top of this, data are often iffy, and measurement uncertainty makes it difficult to use water accurately [45,46,47,51]. These errors occur at every level, from faulty sensors to human data-entry errors, exacerbated by the fact that many stations in many parts of the world are literally falling apart. Where there are no stations at all, estimations based on nearby readings are used, which introduces even more errors. Such measurement gaps represent a significant challenge for estimating future water availability under changing climatic conditions and directly affect the development of effective management plans [47,52,53,59,60,65,66].
Ultimately, smart water-resources management aims to strengthen resilience, thus reducing vulnerability to changing water conditions. In the present study, resilience to changing water conditions, as originally developed, is the capacity of a natural and anthropogenic system to absorb, adapt to, and recover from water-related disturbances while maintaining its essential functions [69,70]. Resilience is not quantified here as a separate composite index and is treated as a function of the additive inverse of vulnerability [70]. Thus, resilience-related capacity is represented directly through the institutional, governance, infrastructure, water-supply, wastewater-management, social and economic dimensions characterizing the vulnerability framework [61,67,68,69,71,72]. Identifying where these systems are vulnerable has become the number one concern for scientists, who give policymakers the blueprints to follow [18,27,68,70,72,73,74,75,76,77]. Within scientific literature, vulnerability is commonly used as an analytical concept for examining risk, societal resilience, and the impacts of extreme weather events. However, its interpretation may vary considerably across disciplines, depending on the theoretical perspective and professional background of the researcher [71,78,79,80,81,82,83,84]. In order to support the assessment of such complex conditions, indicators and indices are widely used as decision-support tools [27,71]. An indicator may be understood as a means that condenses information into a form that is observable, comparable, and usually more suitable for analysis. In this way, indicators or their combination in indices contribute to the simplification, interpretation, and communication of complex systems that would otherwise be difficult to evaluate [68,70,85,86,87,88,89,90]. Ultimately, smart water-resources management aims to strengthen resilience, thereby reducing vulnerability to changing water conditions. In the present study, resilience to changing water conditions is understood as originally developed, as the capacity of a socio-hydrologic natural and anthropogenic system to absorb, adapt to, and recover from water-related disturbances while maintaining its essential functions [69,70]. Resilience is not quantified here as a separate composite index and is treated as a function of the simple additive inverse of vulnerability [70]. Thus, resilience-related capacity is represented indirectly through the institutional, governance, infrastructure, water-supply, wastewater-management, social and economic dimensions incorporated into characterizing the vulnerability framework. Ultimately, smart water resources management is all about developing resilience, thus working towards minimizing vulnerability to changing conditions by building systems that can absorb shocks, adapt to environmental vagaries, and keep everything working [61,67,68,69,71,72]. Identifying where these systems are vulnerable has become the number one concern for scientists, who give policymakers the blueprints to follow [18,27,68,70,72,73,74,75,76,77]. Within scientific literature, vulnerability is commonly used as an analytical concept for examining risk, societal resilience, and the impacts of extreme weather events. However, its interpretation may vary considerably across disciplines, depending on the theoretical perspective and professional background of the researcher [71,78,79,80,81,82,83,84]. In order to support the assessment of such complex conditions, indicators and indices are widely used as decision-support tools [27,71]. An indicator may be understood as a means that condenses information into a form that is observable, comparable, and usually more suitable for analysis. In this way, indicators or their combination in indices contribute to the simplification, interpretation, and communication of complex systems that would otherwise be difficult to evaluate [68,70,85,86,87,88,89,90].
The present study considers water resource management using watershed analysis, combining environmental data with socio-economic ones obtained directly from research. The main purpose of this research was to create composite indicators, which may determine more accurately why the efficiency of the IWRM approach is hampered in the actual environment. This paper rests heavily upon an extensive research effort based on the COROADO project-eu. The COROADO project -eu, financed by the Seventh Framework Program (FP7), was a large international collaboration involving thirteen universities and research centers in both Europe and Latin America [91]. The general objectives and empirical results obtained during the course of the COROADO project-eu greatly influenced the choice of analysis conducted in this research [91]. In addition, field survey data collected in the Latin American case-study regions provided deeper insight into practical water management challenges. These findings not only highlighted common difficulties across study sites but also revealed underlying structural barriers that hinder the effective operationalization of IWRM principles. Karavitis et al. presented the overall process in detail and asserted its applicability [71].
Against this background, the contribution of the present study should be distinguished from the original development of the indices. DVI, WSTVI, WSCVI, and WCCVI were formulated and weighted in previous work within the COROADO Project, and no claim is made here regarding their original derivation [71,91]. The contribution of the present study is threefold [66,89]. First, the published weighting structure is transferred without local recalibration to a European Mediterranean agricultural setting, providing also an out-of-sample assessment of its operational transferability. The framework is applied for the first time outside the context in which it was calibrated, with the same equations, since for their derivation more than ten million data points were acquired in the COROADO Project databases, in its five-year duration on similar locations also presented in Figure 1 [71]. Second, the resulting DVI is compared with an independently formulated drought-vulnerability index based on a different indicator structure, providing convergent evidence on the resulting spatial pattern [27]. Third, a global structural sensitivity analysis quantifies the robustness of the transferred weighting structure and the composite-index class boundaries. The study therefore evaluates transferability and structural robustness rather than developing a locally forced new composite-index framework.
Figure 1.
Global Köppen–Geiger climate classification and location of the study area and COROADO data sites [92]. (a) Lower Rio Bravo/Rio Grande basin, Mexico; (b) Copiapó River Basin, Chile; (c) Suquía Basin, Argentina; (d) Upper Tiete River Basin, Sao Paulo, Brazil; and (e) Karditsa Regional Unit, Greece.
2. Materials and Methods
The present study describes composite-index applications already developed within the COROADO Project-eu to the Karditsa dataset. The original framework was developed using socially and -hydrologically diverse Latin American river basins [71,91]. Hence, the fixed indicator definitions, classifications, and weights are transferred to the Regional Unit of Karditsa in order to evaluate their operational applicability in a European Mediterranean agricultural setting. The location and physiographic context of the study area in relation to the already applied similar areas in the world are presented in Figure 1. This methodological background rests upon the fact that the COROADO project –eu selected river basins represent different geographical, hydrological, environmental, social, and economic contexts, thereby providing a suitable basis for comparative assessment and further calibration of the methodology [71,91]. While these basins vary significantly with respect to geographies and socio-economic contexts, the selected cases are characterized by similar challenges: the Upper Tietê and Suquía basins suffer from water-related problems associated with urbanization, whereas the Copiapó and Rio Bravo/Rio Grande basins are characterized by persistent water deficiencies under semi-arid conditions [71,91]. Hence, these original case studies provide the required background for applying and evaluating the methodology also in other social, economic, hydrological, and climatic regions of the world and thus further testing the produced indices for a universal application [71,91]. In the present effort, the previously described methodology is applied for the first time to Thessaly, and specifically to the Regional Unit of Karditsa, Greece.
2.1. Study Site
The Regional Unit (RU) of Karditsa (the smallest of the four in the Region of Thessaly) has a specific characteristic lying between the contrast of the mountainous and the plain areas. Its capital is the city of the same name (Karditsa), and it is a single administrative unit. The RU of Karditsa is in the center not only of the prefecture, but also of Greece. According to the latest population census (2021), the RU of Karditsa has 106,305 permanent residents (from 113,544 residents in 2011). The prefecture’s total area is 2636 km2, which corresponds to 18.8% of Thessaly’s total area and approximately 2% of the country’s total area. The mountainous mass, the semi-mountainous, and the lowland occupy 42%, 9%, and 49%, respectively. The mountainous area is covered with rich flora, dominated by oak and fir forests, scrublands, and pastures, and, in combination with the existing fauna, forms a natural environment of particular beauty. A characteristic morphological feature of the prefecture is the contrast between the mountainous western and southern parts and the plain northern and eastern parts, which is part of the great plain of Trikala. The western and southern parts of the Regional Unit are dominated by the Southern Pindus and Agrafa mountain ranges, with elevations exceeding 2000 m, whereas the northern and eastern sectors form part of the Thessalian plain. The main drainage network, together with the Plasteras and Smokovo reservoirs, is shown in Figure 1 [93].
Between the parallel north-to-south mountain ranges in the western part, narrow valleys are formed with several riverbeds (such as the Tauropos, Pamissos, Platanias, and Kalentzes Rivers. In the Karditsa RU, the water potential is substantial, characterized by large rivers and high precipitation. Regarding water reservoirs, a dam has been built on the Tauropos River, between the Itamos and Voutsikaki mountains, forming reservoir/lake Plastiras. From this reservoir, water is first channeled to the hydropower station for energy production and then to the Karditsa plain, for irrigation as well as for domestic needs. Then, the equally important Smokovo dam is on the Onochonos River,, a tributary of Peneios. Its reservoir irrigates the southern part of the prefecture. Overall, almost 700 Km2 are irrigated within the RU of Karditsa. Cotton dominates the crops, covering almost half (45.5%) of the cultivated land, while other crops such as wheat, maize, tobacco, and vegetables supplement the production, and livestock (mainly sheep) is of minor importance [94,95].
2.2. Methodology
The pertinent literature clearly indicates that such indices have a lot of potential and may provide great assistance to decision-making, planning, developing policies, and managing various natural, social and economic resources [18,71,96,97,98,99]. Provided that they are applied using a proper methodological framework, indicators may be considered as an analytical toolkit that helps translate complicated technical, social, economic, and environmental data into usable knowledge [27,71,87,100,101]. The usefulness of composite indices lies in their ability to summarize multi-dimensional processes; however, they are dependent on their hypothesis selection and construction [71,89,102]. Decisions taken at each stage of composite indices development can significantly influence them and their applicability as information and visualization tools. Therefore, the present study uses a methodology developed for the EU-funded FP7 COROADO project-eu, Technologies for Water Recycling and Reuse in Latin American Context: Assessment, Decision Tools and Implementable Strategies under an Uncertain Future, that demonstrated the potential of composite indicators in the sphere of water-policy assessment and planning [91]. This effort was presented in detail and tested in Latin America, from Mexico to Argentina [71,91]. Thus, the prime objective of this effort is to provide water resource specialists, stakeholders and decision-makers worldwide with a set of holistically applicable recommendations on how to plan, develop and disseminate the vulnerability to changing water conditions status through the results of the presented indices. Pertinent findings in the literature demonstrated that composite indices are prone to assist in policymaking [71,91,103,104,105]. To achieve this objective, the methodology demonstrated by Karavitis et al. [71,91] for the development and application of composite indices was also followed to test such a methodological procedure in another part of the world and thus contributing to its universality. In this context, the objective is not only to calculate vulnerability to changing water conditions indices, but also to provide water-resource specialists and decision-makers with another potentially useful tool. Emphasis is therefore placed on methodological clarity during the application of such composite indices, in an effort to avoid ambiguity and the production of misleading or oversimplified conclusions [18,28,71].
Drought, water stress, and water scarcity are interrelated. All such concepts are used to exemplify the prevailing misperception among terms that denote “dry environments” or water deficiencies. Such terms are crucial to separating the types of water deficiencies in relation to anthropogenic interventions [9,19,27,29,68,71,77,106]; they describe different dimensions of water-resource vulnerability to water deficiencies; thus, they are used as separate diagnostic elements [71]. Drought primarily represents a hydrologic climatic deficiency associated with anomalous precipitation and therefore reduced water availability. Water stress describes the pressure exerted on the water-resource system when demand, supply, infrastructure and governance conditions constrain its capacity to satisfy competing required uses. Water scarcity represents a broader imbalance between available water resources and societal demand and therefore incorporates demographic, economic, institutional, and water-availability dimensions. The three concepts may interact, and some indicators are consequently shared among the component indices, but they are not treated as interchangeable. Maintaining separate DVI, WSTVI, and WSCVI components preserves information on the different mechanisms contributing to vulnerability to water deficiencies [34,50,106,107,108,109]. Their subsequent integration into the WCCVI provides an overall screening measure of vulnerability to changing water conditions (Figure 2).
Figure 2.
Analytical workflow followed for the construction and application of the composite indices [71,91].
The methodological process began with data collection, followed by the classification of indicators within the COROADO project framework [71,91]. The selected indicators were then used to construct composite indices addressing three main dimensions of water-resource vulnerabilityto: drought, water stress and water scarcity. These component indices subsequently contributed to the development of an integrated index, namely vulnerability to changing water conditions [71,91]. According to the process described by Karavitis et al. [71], data from the study regions were collected, harmonized, and processed in order to support the development of vulnerability-assessment models. In the initial stage, 93 potential indicators were examined. After evaluation and refinement, the final indicator set was reduced to seven indicators for the Drought Vulnerability Index, nine for the Water Stress Vulnerability Index, and seven for the Water Scarcity Vulnerability Index. Indicators were intentionally included in more than one index, reflecting their relevance to multiple dimensions of vulnerability to changing conditions. This overlap allowed the methodology to capture interconnections among hydrological, technical, environmental, social and economic factors within a unified composite-index framework. Thus, it could more accurately track and evaluate shifts both in the hydrological and anthropogenic landscape (Figure 2). The collected data were subsequently cleaned, harmonized, and evaluated, forming the basis for the development of robust vulnerability-assessment models [71,91]. The final step of the work is to test the performance of the indices in the context of their reliability. However, the final phase of the current approach is the application and validation process of the already developed indices portraying vulnerability to drought, to water scarcity, and to water stress [71,91]. The application area is the Karditsa Regional Unit. Prior to the spatial comparison, the DVI and SDVI rasters were projected to the same coordinate reference system (GGRS87/Greek State Grid), aligned to a common 30 m grid using a common snap raster, and clipped to an identical valid-data mask. Resampling was performed using interpolation (EBK Regression Prediction). Only cells containing valid values in both rasters were retained. Descriptive raster statistics were obtained using ArcGIS Pro 3.7.0. Pearson’s correlation coefficient was subsequently calculated from all paired valid cell values using Python language programming (Python 3.13.2 and SciPy 1.15.3.). Because neighboring raster cells are not statistically independent, the analysis was repeated after aggregating both rasters into non-overlapping 1 km × 1 km spatial blocks. The value assigned to each block corresponded to the meaning of its valid constituent cells, and blocks containing less than 50% valid coverage were excluded. Pearson’s correlation coefficient and its two-sided p-value were calculated from the paired block-level values, while the corresponding 95% confidence interval was estimated using Fisher’s z transformation.
2.3. Spatial Interpolation of the Climatic Variables
The climatic variables used in the vulnerability indices were derived from the ERA5-Land reanalysis for the period 1981–2020. ERA5-Land data were obtained at a native spatial resolution of 0.1° × 0.1°, corresponding approximately to 8.6 km in the east–west direction and 11.1 km in the north–south direction at the latitude of the study area. Hourly data were aggregated to monthly values, using totals for precipitation and runoff and mean values for the temperature variables. These data were used to derive the reference distributions required for the Standardized Precipitation Index at the 6- and 12-month accumulation scales. Relative humidity was calculated from mean air temperature and dew-point temperature using Equation (1), while potential evapotranspiration was estimated using the daily Copais Method [110].
For the spatial assessment presented in this study, the climatic variables for 2016 were spatially downscaled using the EBK Regression Prediction method implemented in ArcGIS Pro Geostatistical Analyst. The procedure was applied separately to precipitation, runoff, solar radiation, relative humidity, potential evapotranspiration, mean air temperature and dew-point temperature. Elevation was derived from the Shuttle Radar Topography Mission (SRTM) Digital Elevation Model at approximately 30 m spatial resolution and was used as the explanatory raster in the EBK Regression Prediction procedure. EBK Regression Prediction combines regression with Empirical Bayesian Kriging, allowing the explanatory variable to account for the deterministic component of spatial variation while the kriging component represents spatially correlated residual variation.
A total of 26 ERA5-Land grid cells whose footprints intersected the Regional Unit of Karditsa were used as the primary climatic data support. For each ERA5-Land cell, the corresponding footprint was defined using a half-cell width of 0.05° in both longitude and latitude, resulting in a 0.1° × 0.1° spatial support. Mean elevation was calculated from the SRTM DEM within each corresponding ERA5-Land grid-cell footprint. This approach ensured that elevation and the climatic variables were initially compared at consistent spatial support rather than associating a point centroid directly with a single DEM pixel. The suitability of elevation as an explanatory variable was evaluated by examining its relationship with the 2016 climatic variables across the 26 ERA5-Land cells. Pearson correlation coefficients indicated strong and statistically significant relationships between elevation and all climatic variables examined (Table 1). Elevation was positively correlated with precipitation (r = 0.865), runoff (r = 0.844) and relative humidity (r = 0.914), whereas negative relationships were observed for potential evapotranspiration (r = −0.856), mean air temperature (r = −0.921), solar radiation (r = −0.751) and dew-point temperature (r = −0.755). All correlations were statistically significant at p < 0.001. Overall, these relationships supported the use of elevation as an explanatory terrain variable in the spatial downscaling procedure.
Table 1.
Correlation between mean elevation and the 2016 ERA5-Land climatic variables.
EBK Regression Prediction combines regression with Empirical Bayesian Kriging, with the regression component representing the relationship between the climatic variable and elevation and the kriging component accounting for spatially correlated residual variation. Cross-validation indicated limited systematic bias across all climatic variables, with mean standardized errors ranging from −0.0159 to 0.0035 and therefore remaining close to zero. RMSSE values ranged from 0.473 for precipitation to 0.775 for dew-point temperature and were consistently below the reference value of 1. Average standard errors were also higher than the corresponding RMSE values for all variables. Together with the high coverage of the prediction intervals, with 96.15–100% of observations falling within the nominal 90% intervals and 96.15–100% within the 95% intervals, these results indicate relatively conservative estimates of prediction uncertainty. In particular, Table 2 depicts that the RMSSE values below 1 and the interval coverage above the nominal levels indicate that the prediction standard errors tended to be overestimated. Given the limited number of ERA5-Land cells, however, these coverage percentages should be interpreted cautiously, as a single observation corresponds to approximately 3.85 percentage points.
Table 2.
Cross-validation statistics of the EBK Regression Prediction models used for spatial downscaling of the 2016 climatic variables.
The resulting climatic projection surfaces were represented on a common 50 m analysis grid. The selection of this grid size does not imply the availability of independent climatic observations at 50 m resolution. Rather, it provides a common spatial framework for integrating the downscaled climatic variables with thematic datasets available at finer spatial resolutions, including land-cover, population and remotely sensed indicators. Apparent fine-scale spatial variability in the resulting climatic surfaces therefore reflects the relationship with the elevation covariate together with the spatial structure represented by the EBK Regression Prediction model and should not be interpreted as newly observed climatic information at 50 m resolution.
Accordingly, the 50 m products are interpreted as terrain-assisted spatial downscaling of the original ERA5-Land fields. Their use assumes that the relationship between climate and elevation identified at the ERA5-Land support scale remains informative at finer spatial scales. This assumption cannot be independently validated using the reanalysis data alone and represents an important source of spatial uncertainty. The fine-resolution outputs were therefore used primarily to ensure consistent spatial support among the variables entering the composite vulnerability indices rather than to imply a corresponding increase in the intrinsic resolution of the underlying climatic information.
No separate Monte Carlo uncertainty propagation or sequential geostatistical simulation was applied to the final composite vulnerability indices. The simulations performed internally within the EBK framework were used for semivariogram estimation and associated spatial prediction rather than for ensemble propagation of uncertainty through the composite indices. Consequently, interpolation uncertainty was assessed through cross-validation, but it was not propagated through an ensemble of alternative composite-index realizations [111,112]. Full probabilistic characterization of the final vulnerability classes, including exceedance probabilities, was therefore beyond the scope of the present analysis and represents a potential direction for further research.
2.4. Treatment of the Weights Derived by Principal Component Analysis
The Principal Component Analysis concerning the index weights was not performed using the Karditsa region dataset. The published PCA-derived weights were transferred unchanged from the original COROADO project-eu and its Latin American application [71,91]. Accordingly, the PCA factor structure reported in the source studies refers to the original calibration datasets and should not be interpreted as a local factor analysis for Karditsa. Retaining the original weights was a deliberate methodological choice intended to evaluate the transferability of the existing composite-index framework in a another study area without local recalibration, as commonly performed when established indices are transferred to new study areas for evaluation [106,107,108,109,113,114]. Thus, re-estimating the weights using the Karditsa indicator matrix would instead constitute local recalibration of the indices and would address a different research question. The transferred weights should therefore not be interpreted as locally optimized for Karditsa, since a locally fitted PCA may or may not yield a different ordering of indicator importance [9,19,34]. The implications of using fixed transferred weights are considered in the sensitivity analysis and in the potential limitations of the study.
2.5. Classification of the Indicators and Definition of the Class Intervals
The indicators entering the composite indices are heterogeneous in both type and unit. Some are continuous variables without a fixed upper bound, such as population density and gross domestic product per capita, while others are percentages or proportions with defined ranges, such as distribution network efficiency and access to sanitation. In addition, several indicators represent qualitative assessments of institutional, governance, or infrastructure conditions and therefore have an ordinal rather than a continuous numerical structure [19,108,109]. In the COROADO Project-eu, from the various study sites, more than ten million data points were gathered as technical, hydrological, economic, social and legal data [91]. These data were used to synthesize the indicators. To enable their combination within the composite indices, all indicators were transformed to the common six-level vulnerability scale reported in Table A1 [91].
The class boundaries were not derived from the empirical distribution of the Karditsa data. Instead, they were adopted unchanged from the published COROADO project-eu. Where established reference classifications were available, such as for the Standardized Precipitation Index, these were retained within the original framework, while the remaining social, economic, infrastructure, governance, and water-resource indicators followed the previously published classification scheme [91]. No class thresholds were statistically optimized or recalibrated using the Karditsa dataset. Retaining the original classification rules preserved consistency with the initial framework and allowed the present study to examine its transferability to another environmental, social and economic context [106,108].
Three vulnerability indices to drought, water stress, and water scarcity were calculated first. Then, they were combined to derive the Water Changing Conditions Vulnerability Index (WCCVI). The original classification structure was retained throughout this process so that the Thessaly application remained directly comparable with the original formulation [71]. Discretization nevertheless involves some loss of information. Differences between observations falling within the same class are not reflected in the assigned score, while observations located close to a class boundary may receive different scores despite having similar underlying values. Alternative approaches, including direct normalization or fuzzy membership functions, could represent gradual transitions more explicitly. Their application, however, would require additional assumptions regarding normalization functions or membership shapes, particularly for the qualitative indicators, which are ordinal by construction. The original classification system was therefore retained in the present application, and its influence on the resulting composite indices was examined through the sensitivity analysis described in Section 2.6.
2.6. Sensitivity Analysis of the Composite Indices
Sensitivity analysis is widely recommended as an integral component of composite-indicator development and evaluation because it allows the robustness of the resulting index to methodological assumptions, particularly weighting and classification choices, to be examined explicitly [111,115,116]. Previous studies have demonstrated that both weighting schemes and classification thresholds may affect composite-index outcomes [68,102,116,117,118,119]. The sensitivity analysis was designed to evaluate the robustness of the transferred composite-index structure without recalibrating the published weights or indicator classifications to the Karditsa dataset. A distribution-free global sensitivity experiment was therefore conducted across the complete admissible indicator-score domain. Each indicator was represented by the six scores of the original COROADO project-eu, ranging from 0 to 5, and 250,000 combinations were generated using a fixed random seed. Equal representation of the scoring domain was used solely for structural sensitivity testing and should not be interpreted as the empirical frequency distribution of indicator values in Karditsa RU. No empirical dependence structure was imposed among the indicators, since the purpose of the experiment was to examine the mathematical behavior of the transferred framework over its full scoring domain rather than to reproduce the local joint distribution of the input variables. Sensitivity analysis is widely recommended as an integral component of composite-index development and evaluation because it allows the robustness of the resulting index to methodological assumptions, particularly weighting and classification choices, to be examined explicitly [111,115,116]. Previous studies have demonstrated that both weighting schemes and classification thresholds may affect composite-index outcomes [68,102,116,117,118,119]. The sensitivity analysis was designed to evaluate the robustness of the transferred composite-index structure without recalibrating the published weights or indicator classifications to the Karditsa dataset. A distribution-free global sensitivity experiment was therefore conducted across the complete admissible indicator-score domain. Each indicator was represented by the six scores of the original COROADO project-eu, ranging from 0 to 5, and 250,000 combinations were generated using a fixed random seed. Equal representation of the scoring domain was used solely for structural sensitivity testing and should not be interpreted as the empirical frequency distribution of indicator values in Karditsa RU. No empirical dependence structure was imposed among the indicators, since the purpose of the experiment was to examine the mathematical behavior of the transferred framework over its full scoring domain rather than to reproduce the local joint distribution of the input variables.
First, each nominal indicator weight was independently increased and decreased by 20%. Following each perturbation, all weights within the corresponding composite index were proportionally rescaled so that their sum remained equal to unity. The same procedure was applied to the DVI, WSTVI, and WSCVI component weights entering the WCCVI. The response was quantified using the mean absolute change in the continuous index value, Spearman’s rank correlation coefficient between the perturbed and nominal index values, the proportion of simulated realizations assigned to a different vulnerability class, and a mean absolute response elasticity. The latter was calculated as the absolute proportional change in the index divided by the actual proportional change in the perturbed weight after renormalization. Second, a leave-one-indicator-out analysis was performed by removing each indicator in turn and proportionally rescaling the remaining weights to sum to unity. At the WCCVI level, DVI, WSTVI, and WSCVI were similarly removed one at a time. This experiment represents a stronger structural perturbation and was used to identify whether the resulting indices depend disproportionately on individual indicators or component indices. Third, the sensitivity of the final categorical interpretation was examined by independently shifting each finite composite-index class boundary by ±10% of the width of the nearest adjacent class interval while preserving the original ordering of the thresholds. The proportion of realizations changing vulnerability class was recorded for each perturbation.
The simulation size was checked for numerical stability, with the principal sensitivity diagnostics showing negligible changes as the number of realizations increased. This analysis represents a global model-structure sensitivity test rather than a local recalibration or a probabilistic estimate of pixel-level uncertainty in Karditsa RU. Monte Carlo sampling was used only to span the admissible indicator-score domain for the sensitivity experiment and was not used to propagate climatic interpolation or measurement uncertainty through the composite indices. The simulation size was checked for numerical stability, with the principal sensitivity diagnostics showing negligible changes as the number of realizations increased. Since the number of Monte Carlo realizations can influence convergence and the numerical stability of simulation outputs, such stability checks are an important component of Monte Carlo-based analyses [120,121]. This analysis represents a global model-structure sensitivity test rather than a local recalibration or a probabilistic estimate of pixel-level uncertainty in Karditsa RU.
3. Results
A comparative evaluation was executed across the four designated research sites in Latin America and presented [71,91]. In this regard, to utilize the data produced, they organized it through a structured classification system. This involved assigning values on a scale from 0 (representing “Non-Vulnerable”) to 5 (indicating “Exceptionally Vulnerable”). The effort did not apply these scores randomly; instead, they were carefully mapped against both unique environmental triggers and resident circumstances found at each specific location to produce a holistic outcome [71,91]. The application of this standardized scoring method supported the development of specific algorithms for the measurement and quantification of vulnerability to changing water conditions. This allowed for a precise vulnerability analysis to three critical hydrological deficiencies: drought, water stress, and water scarcity. These individual metrics were ultimately integrated into a comprehensive final algorithm designed to assess overall vulnerability to changing water conditions. It was the first time that this methodological procedure was applied in Latin America using the COROADO project-eu study sites [71,91]. The statistical method used to create the indices is Principal Components Analysis (PCA). The pertinent, developed indices were applied for the first time outside Latin America in the current effort. Thus, the already developed fixed weights were transferred from the original calibration and used without local re-estimation as stated.
3.1. Development of Vulnerability Indices
The PCA for drought vulnerability provided eighteen components as described in COROADO project-eu [71,91]. Based on those results, only the first three components, with a cumulative percentage of explained variance that reaches 82.461%, have been selected for the calculation of the Drought Vulnerability Index (DVI) weights. The indicator aims to present a comprehensive assessment of drought vulnerability, including its various aspects, such as meteorological (SPI6 and SPI12), hydrological (Change in stored water), and social and economic (Change in agricultural and industrial production (%). Seven different indicators have been selected to compose the final equation, as shown in the weights (Table 3). Despite the extraction of multiple factors, the determination of the index weights was restricted exclusively to the three primary principal components. Furthermore, as a formal validation criterion for the weighting procedure, the summation of all weights within each principal component was constrained to unity, thereby ensuring mathematical consistency and rigor in the model’s calibration [19].
Table 3.
Drought vulnerability indicators with their weights accordingly [71,91].
Based on the outcome of the computation of the composite drought vulnerability index, Changes in Stored Water and Precipitation indicators (SPI 6 and 12) are given more importance, while the effects on agriculture and industrial production are less important, respectively. In the same manner, the process used in this situation involved generating the principal components using data from the indicators, followed by estimating the weight of each component based on its percentage of variation [71,91].
With respect to the mathematical formulation of Table 4 that describes the Water Stress Vulnerability Index (WSTVI), the sensitivity of the model depends predominantly on the population density, Wastewater Governance, and the Status of Water Supply Infrastructure, as also reported [71,91]. In contrast, variables such as agricultural productivity and Access to Sanitation exert a marginal influence on the index.
Table 4.
Water Stress vulnerability indicators with their weights accordingly [71,91].
As shown in Table 5, the Institutional Framework, Gross Domestic Product, and Institutional Framework are the most significant in the equation. However, also essential are the Population Growth and Status of Wastewater Treatment and Supply Infrastructure. In contrast, Groundwater development stress, Runoff Changes and Change in Stored Water appear with less importance [71,91].
Table 5.
Water Scarcity vulnerability indicators with their weights accordingly [71,91].
Since the status of available water resources is a dynamic property that may vary from period to period and with future potential changes in climate time series and human behavior, an approach that assesses vulnerability to water scarcity may provide useful insights for future outcomes. In general, sets of indicators have been selected to calculate vulnerability (to drought, to water stress, and to water scarcity) at the basin level. Based on that, the composite index of vulnerability to Water Changing Conditions was developed [71,91]. These indicators may characterize potential vulnerability to climatic vagaries, land use, water use change and impacts from variations in water supplies. Watershed conditions can change over time due to natural processes and anthropogenic influences. The most widespread impacts on watershed status may also be expected to come from population growth (generating changes in land and water use). Furthermore, future-oriented modeling efforts may provide significant aid in an attempt to evaluate the potential repercussions of forecasted climatic change on precipitation patterns. The index developed provides a clear window into how specific watersheds stand up against various environmental and anthropogenic pressures [71,91]. At the same time, they may serve as a means for the ongoing attempt among the scientific community to confront uncertainty about the potential impacts of forecasted future climate change on the hydrological cycle of a locale. Finally, the capacity of the watershed to cope with any form of change that may arise due to any natural variability or anthropogenic activities is significantly enhanced through the careful integration of infrastructure within the natural setting.
The Water Changing Conditions Vulnerability Index (WCCVI) was calculated from three component indices: the WSCVI, WSTVI, and DVI, using the PCA-derived weights reported in previous studies and presented in Table 6 [71,91].
Table 6.
Water Changing Conditions Vulnerability Index (WCCVI) component weights [71,91].
Testing the index in a Mediterranean European setting provides a transferable instrument for evaluating the efficiency of water allocation while maintaining the ecological status of river basins (Table 7). It may give a clear view of any potential water resources extraction, and thus provide a solid, evidence-based foundation for improving how water management policies are produced and enforced. Among the three indices analyzed, vulnerability to “Water Stress” emerged as the most critical factor, accounting for a significant 40.8% of the total impact [71,91].
Table 7.
Vulnerability classification ranges for the developed composite indices [71,91].
3.2. Validation Process of Drought Vulnerability Index
In this phase, the Regional Unit of Karditsa was selected for the implementation and evaluation of the developed composite indices. The choice was made because this region shares a certain number of common characteristics with the areas where the indices were initially developed in its environmental, social, and economic context. Thus, the primary objective of this phase is to evaluate the functional performance and robustness of the proposed vulnerability index to changing water conditions in another setting, with a specific focus on its consistency and predictive reliability towards its worldwide application. However, this hypothesis is critical, since it aims to assess whether such approaches (vulnerability to drought, to water scarcity, and to water stress), generated from different contexts (although with a wide range of values of the indicators) and characterized by a generally similar Latin American setting, may be applied to regions with also various other characteristics of the input data. Thus, the area of application is the regional section of Karditsa (Prefecture of Thessaly) for the year 2016, which is a reference application year selected to examine the framework under non-extreme conditions. The indices testing in such an average year would succinctly portray the applicability of the approach, since an extreme year may force the results towards extreme values as well. As presented, the regional section of Karditsa is located in the western part of Thessaly and is bordered by the Peneios River. According to the census of the Hellenic Statistical Authority, in 2021, the city of Karditsa had about 56,000 inhabitants, while the whole Regional Unit had about 106,500 inhabitants [93]. The regional economy is close to the Greek average indices and exhibits greater variation in its locales than the study areas in Latin America.
Factors that influence the region’s climate include temperature, rainfall, atmospheric pressure, winds, and humidity. In terms of climate, Thessaly is divided into three regions: the eastern, coastal and mountainous one with an overall Mediterranean climate. The central lowland region has mostly a continental Mediterranean climate, and the western mountainous region has an alpine one, as it has peaks over 2500 m asl [122]. The average annual precipitation ranges from 2485 mm to 492 mm in a west to east direction for the period 1991–2020. The average annual temperature ranges from 16 to 17 °C. The annual thermometric range exceeds 22 °C. The hottest months are July and August, and the coldest are January, February, and December. Frosts are frequent and occur from November to April. The calculations for the indices were carried out in the regional unit of Karditsa due to high water demand and water resources problems. To test the index performance and reliability, comparisons were made with other relevant composite indices [27]. The application was performed for the year 2016 at a spatial scale of 50 m. The climate variables (ERA5-Land Hourly–ECMWF Climate Reanalysis from 1981 to 2020) with a spatial resolution of 11.132 km for 2016 are depicted in Figure 3. Specifically, the EBK Regression Prediction method was used to convert the point values for all parameters, along with the elevation (DEM) of the area. In addition, solar radiation was calculated, but there was no variation in the values: the sample average is 182.2 W/m2, the maximum is 183.6 W/m2, and the minimum is 180.9 W/m2. The daily Copais method was used to calculate the potential evapotranspiration (ETp), which considers the average temperature, average relative humidity, and radiation (Figure 3c) [110]. In addition, because the ECWMF data do not provide relative humidity, a calculation was made from the dew point temperature (T dewpoint) using the equation [123].
RH ≈ 100 − 5 × (Tmean − Tdewpoint)
Figure 3.
Spatial distribution of climatic parameters from ERA5-Land Hourly–ECMWF Climate Reanalysis 1981–2020: (a) precipitation, (b) runoff, (c) potential evapotranspiration, (d) relative humidity, (e) dew point, (f) mean temperature.
All data required to calculate the indicators, including the SDVI (Standardized Drought Vulnerability Index) used for validation, are detailed in Table A1 and Table A2, along with their respective sources. As discussed, drought is a multifaceted hazard with a plethora of environmental, social and economic consequences, impacting regions worldwide [27,30,71,91]. Assessing vulnerability to drought, however, is a complex task, heavily influenced by both the study area and its overall context. The DVI (Drought Vulnerability Index) reflects the outcomes of a methodology that assigns weights to drought vulnerability indicators based on their significance (Figure 4). The above-mentioned indices include a variety of dimensions such as social, infrastructural, environmental, agricultural, urban and industrial dimensions [27,71]. The provenance, native spatial and temporal support, reference period and pre-processing of every dataset used in the computation of the indices, including those entering the Water Stress Vulnerability Index, are summarized in Table 8; the classification thresholds and the indicator-to-index correspondence are given in Table A1 and Table A2, respectively.
Figure 4.
Drought Vulnerability for 2016 based on DVI.
Table 8.
Source, native support, reference period and pre-processing of the datasets used in the computation of the composite indices.
Then, for the calculation of SDVI (Figure 5), the SPI for 6 and 12 months was used for all points, as reflected in the precipitation data (Figure 3a). The indicators of Supply, Demand and Infrastructure in water resources were calculated according to the River Basin Management Plan of the Hydrological Region of Thessaly (EL08). Finally, for Impacts, the same methodology was followed as for the DVI calculation [27,68,71,124]. Then, for the calculation of SDVI (Figure 5), the SPI for 6 and 12 months was used for all points, as reflected in precipitation data (Figure 3a). The indicators of Supply Demand and Infrastructure in water resources were calculated according to the River Basin Management Plan of the Hydrological Region of Thessaly (EL08). Finally, for Impacts, the same methodology was followed as for the DVI calculation [27,68,71,124].
Figure 5.
Drought Vulnerability for 2016 based on SDVI.
Forming the DVI composite index had a clear goal: to create a flexible, scalable tool that can pinpoint drought risks regardless of geography, environmental conditions and water usage as reported [71,91]. To prove its reliability, a comparative assessment was conducted against the SDVI. The SDVI was adopted as the reference because it was constructed independently of the present framework and has been evaluated in several settings. It was originally developed by the Drought Management Center for Southeastern Europe (DMCSEE) and has since been applied in Southeastern Europe and in Colorado, U.S.A. [77,124]. It therefore constitutes an appropriate external reference for a convergent comparison, although, as pointed out below, agreement between two indices establishes consistency rather than accuracy. For the final spatial analysis, the indices were processed in ArcGIS. The “Band Collection Statistics” tool was used to compute per-pixel correlations and to compare the two composite indices in raster format. The quantitative outputs of this statistical correlation are detailed in Table 9.
Table 9.
Spatial statistics for DVI and SDVI.
A strong raster-wise correlation was observed between DVI and SDVI (r = 0.823). Using all valid 30 m pixels, the association was highly significant (p < 10−16). The agreement reported in Table 9 indicates that the two indices describe substantially the same spatial signal, and it should be read as convergent evidence rather than as a demonstration that either index is superior. A high correlation is to some extent expected by construction, since both indices draw on precipitation-derived inputs; it establishes consistency, not accuracy. A claim of superior performance would require confrontation with independent records of realized drought impact, such as declared emergencies, irrigation restriction orders, reservoir drawdown or documented yield anomalies, and such records were not available for the Regional Unit at the spatial resolution used here. Additionally, no drought was recorded for the year 2016 for any area in Greece, thus no impacts were produced [30]. The coefficient obtained corresponds to a shared variance of approximately 68 percent, so that about one third of the spatial variance remains unexplained; the remaining variation reflects differences in the indicator sets, weighting structures, and conceptual construction of the two indices, and it is precisely the component of the signal that the present framework adds. The comparison was carried out on the continuous index values and not on the classified maps, so that the result does not depend on the class boundaries adopted by either scheme. The two indices do, however, differ in the granularity of their reporting scales. In particular, the DVI is reported on a finer partition of its range. For DVI sub-indices, the range is 0 to 5; for SDVI, it is 0 to 3 [27,71].
This difference in granularity affects the resolution at which results are communicated; it does not constitute evidence of greater sensitivity, and no such claim is advanced here. Whether the finer scale conveys additional information, rather than a finer partition of the same information, is a question that the present comparison cannot settle and that is left open for future research.
3.3. Water Stress and Water Scarcity Vulnerability Indices
Water stress has usually arisen when the demand for water surpasses the available supply or when water quality is inadequate for its intended use [71,91]. Water stress becomes critical when demand exceeds the sustainable supply, which is pronounced in areas with low rainfall and thus naturally more susceptible. Additional anthropogenic factors, such as high population density, increase competition for limited water resources, especially in urban areas, contributing to water stress and its implications [71,91]. Water management measures, infrastructure, and the utilization of treated wastewater hold 56.2% of the importance in the Water Stress Vulnerability Index. Furthermore, overexploitation of water resources, especially groundwater in areas with lower surface water availability, increases the systemic vulnerability to water stress. In such areas, the groundwater development stress indicator (GDSI) may be a significant parameter of the composite water stress index. However, the development of WSTVI attempts to define this term as a separate issue to be addressed by integrated water resources management. Vulnerability to water stress is depicted for the case area. For the calculation of the WSTVI component indicators, the pertinent data were collected from the Thessaly River Basin Management Plan (EL08) and the Hellenic Statistical Authority [32]. The WSTVI from the reported data, their respective transformation according to their categorization, and their corresponding values are presented in Figure 6. A similar outcome for WSTVI and DVI is observed, with milder values in both the rural and urban areas of the study area, as located in the eastern area. The region exhibits a minimum value of 0.542 (No Vulnerability), an average value of 1.009 (Very Low Vulnerability) and a maximum value of 2.195 (High Vulnerability). This composite index offers the advantage of illustrating the variability of vulnerability to water stress, and it follows this satisfactorily in the study area, as depicted in Figure 6.
Figure 6.
Water Stress Vulnerability for 2016 based on WSTVI.
Water scarcity (Figure 7) has emerged as a significant impediment to social and economic development in an increasing number of regions worldwide. Since the late 1980s, there has been a noteworthy surge in political attention towards researching water scarcity. This effort also involved examining a wide range of indicators designed to capture the different dimensions of vulnerability to water scarcity. At the core of such indicators are key variables such as population size, water availability, and water use patterns. Much of the progress achieved to date, consistent with findings in the existing literature, has focused on measuring vulnerability to water scarcity and mapping its spatial distribution [71,91]. At the same time, understanding water scarcity over time requires careful assessment of both inter-annual and intra-annual variations in water availability and consumption. As is the case with broader water deficiency phenomena, the complexity of water scarcity cannot be addressed from a single disciplinary perspective. Instead, it calls for coordinated collaboration across hydrology, economics, social and environmental sciences, and related policies. The overarching aim is to develop integrated methodological approaches that can fully reflect the multiple and interconnected dimensions of vulnerability to water scarcity. It is pointed out that the indicators applied in the calculation of the index follow the methodological framework as presented in [71,91].
Figure 7.
Water Scarcity Vulnerability for 2016 based on WSCVI.
3.4. Water Changing Conditions Vulnerability Index
The Water Changing Conditions Vulnerability Index (WCCVI) was calculated by combining the Water Scarcity Vulnerability Index, Water Stress Vulnerability Index, and Drought Vulnerability Index using the transferred weights presented in Table 6. The resulting 2016 WCCVI surface is shown in Figure 8. Higher vulnerability values are concentrated mainly in the eastern and northeastern lowland sectors of the Regional Unit, whereas the western mountainous area is predominantly characterized by lower vulnerability classes.
Figure 8.
Water Changing Conditions Vulnerability for 2016 based on WCCVI.
Such higher WCCVI values concentrations are, particularly observed within Palamas, Sofades, and the eastern part of the Municipality of Karditsa. This sector also contains much of the Regional Unit’s irrigated agriculture, higher population densities, and the water demand majority, groundwater-exploitation, infrastructure, and governance conditions represented within WSTVI and WSCVI. This spatial coincidence should be interpreted as an index-based association rather than as evidence that any single factor independently determines the resulting vulnerability class. Five of the seven possible WCCVI vulnerability classes were represented in the 2016 map. No Vulnerability and Very Low Vulnerability occur primarily in the western and southwestern mountainous sectors and around Lake Plastiras, while Low Vulnerability extends across much of the central part of the Regional Unit. Medium Vulnerability becomes increasingly prevalent toward the eastern and north-eastern lowlands. High Vulnerability is limited to scattered local patches, mainly within the eastern and northeastern lowland sector. The spatial pattern is therefore dominated by the low to medium classes, and High Vulnerability occurs as isolated patches rather than as a continuous zone. Very High and Extreme vulnerability were not represented in the 2016 WCCVI map.
This spatial differentiation is consistent with the contrast between the more sparsely populated mountainous western part of Karditsa and the more intensively cultivated and settled eastern plain. The eastern lowlands include the main urban and agricultural areas and contain a substantial proportion of the Regional Unit’s population. According to the 2021 Population and Housing Census, the Municipality of Karditsa had 55,979 permanent residents, Sofades 16,927, Palamas 13,424, Mouzaki 11,245, Lake Plastiras 5234, and Argithea 3496. These municipal population totals are provided as demographic context and should not be interpreted directly as the population exposed to a particular WCCVI class, since the vulnerability classes do not coincide exactly with municipal boundaries. The interpretation of the WCCVI should also reflect the structure of the underlying component indices. Population density was represented in the index using the spatially distributed JRC GHS-POP dataset rather than municipal census totals, while distribution-network efficiency was incorporated as an indicator derived from the Thessaly River Basin Management Plan. Accordingly, the concentration of moderate and locally high WCCVI values in the eastern lowlands should be interpreted as the combined outcome of drought, water stress, water scarcity, population, agricultural demand, infrastructure, and governance components, rather than being attributed to a single variable. The WCCVI therefore identifies areas where several dimensions of pertinent vulnerability coincide, but it does not constitute a direct observation of water deficit or social or economic impact.
3.5. Structural Sensitivity of the Composite Indices
The global sensitivity analysis showed that the overall ranking generated by the composite indices was highly stable under moderate perturbations of the transferred weights (Table 10). Across all ±20% weight perturbations, the minimum Spearman correlation with the nominal formulation was 0.992 for DVI, 0.997 for WSTVI, 0.994 for WSCVI, and 0.996 for WCCVI (Figure 9). Thus, moderate changes in individual weights did not materially alter the overall ordering of vulnerability across the admissible indicator-score domain. The DVI was most responsive to Change in Stored Water. A ±20% perturbation of its weight produced a maximum mean absolute index change of 0.084 and changed the final vulnerability class in 13.04% of the simulated realizations. RSPI12 and RSPI6 followed, with maximum class-change rates of 10.85% and 8.92%, respectively. In contrast, perturbations of Change in Agricultural Productivity and Change in Industrial Productivity changed the final class in less than 0.5% of the realizations. These results confirm that the structural behavior of the transferred DVI is governed primarily by its hydrological and meteorological components rather than by the two low-weight productivity indicators. WSTVI showed a more distributed sensitivity pattern. Status of Water Supply Infrastructure produced the largest response to weight perturbation, with a maximum mean absolute change of 0.040 and a class-change rate of 7.03%. Wastewater Governance, Water Governance, and Status of Wastewater Treatment and Supply Infrastructure produced similar responses, with class-change rates between 6.75% and 6.88%. Agricultural Productivity had the smallest effect, changing the final class in only 1.82% of the realizations. The WSCVI was most sensitive to Institutional Framework and Gross Domestic Product, which produced maximum class-change rates of 10.36% and 10.13%, respectively. Runoff Changes showed the smallest influence, with less than 0.92% of the simulated realizations changing class.
Table 10.
Summary of the global structural sensitivity analysis of the transferred composite-index framework.
Figure 9.
Structural sensitivity of the composite vulnerability indices.
At the WCCVI level, perturbations of the DVI and WSTVI component weights produced similarly small absolute responses. WSTVI exhibited the highest mean absolute response elasticity (0.109), whereas perturbation of DVI produced the slightly larger maximum mean absolute index change (0.034) and class-change rate (6.21%). The corresponding class-change rate for WSTVI was 6.05%, while that for WSCVI was 4.86%. In all cases, Spearman’s correlation with the nominal WCCVI remained above 0.995.
The leave-one-indicator-out experiment, which represents a substantially stronger perturbation, revealed more clearly the structural dependence of the indices on their dominant components. Removal of the Change in Stored Water indicator from DVI changed the vulnerability class for 59.24% of the realizations and reduced Spearman’s correlation to 0.667. Removal of RSPI12 and RSPI6 changed 50.12% and 44.29% of the classifications, respectively. For WSTVI, the largest effect resulted from removing Status of Water Supply Infrastructure, which changed 39.75% of the classifications, followed closely by the governance and wastewater-infrastructure indicators. WSCVI was most strongly affected by the removal of the Institutional Framework and Gross Domestic Product indicators, producing class changes of 59.09% and 57.98%, respectively. At the WCCVI component level, removal of WSTVI changed 40.37% of the final classifications, while removal of DVI and WSCVI changed 39.12% and 31.39%, respectively. The corresponding rank correlations were 0.858, 0.830, and 0.901. These results indicate that both WSTVI and DVI are important for maintaining the structure of the combined index, although they influence their categorical and rank-based behavior in slightly different ways. Finally, the class-boundary stress test indicated considerably lower sensitivity than the indicator-removal experiment. The largest proportion of simulated realizations changing vulnerability class following a ±10% shift in a single class boundary was 1.83% for DVI, 3.33% for WSTVI, 3.02% for WSCVI, and 3.40% for WCCVI. The categorical interpretation is therefore comparatively stable to modest changes in the final class cutoffs, whereas the choice and relative influence of the dominant indicators have a stronger effect on the model structure.
Overall, the sensitivity analysis supports the internal robustness of the transferred weighting scheme to moderate weight perturbations while also demonstrating that the framework is not neutral with respect to indicator selection (Table 10). DVI depends most strongly on stored water and the two SPI terms, WSTVI on water-supply, governance, and infrastructure conditions, and WSCVI on institutional and economic conditions. These findings do not demonstrate that the inherited weights are locally optimal for the Regional Unit of Karditsa RU, nor do they quantify pixel-level spatial uncertainty. Rather, they identify the components of the transferred framework to which the composite indices are most responsive and provide a quantitative basis for interpreting their application outside the original calibration regions.
For WCCVI, perturbation of the DVI weight produced the largest mean absolute change and class-reassignment rate, whereas WSTVI exhibited the highest mean absolute response elasticity (0.109). Individual indicators or component weights were perturbed by ±20%, followed by proportional renormalization of the complete weight vector to unity. In the leave-one-out analysis, one indicator, or one component at the WCCVI level, was removed and the remaining weights were renormalized. For the class-boundary test, each finite final composite-index boundary was independently shifted downward by 10% of the lower adjacent interval width and upward by 10% of the upper adjacent interval width, while preserving threshold ordering. Results are based on 250,000 realizations sampled across the admissible 0–5 indicator-score domain.
4. Discussion
The effectiveness of composite index methods for vulnerability assessment to various water deficiencies in a dynamic hydrologic, social and economic context is portrayed in this effort. The presented approach combines environmental, technical, social and economic factors into a comprehensive vulnerability assessment framework to changing water conditions, in line with the principles of Integrated Water Resources Management. The outcomes of the study show that hydrological factors and infrastructure-related variables are the most important drivers. Specifically, the weights of changes in stored water and precipitation-related indicators, as developed, were the highest in the Drought Vulnerability Index [71,91]. These results are in line with other studies in related Mediterranean drought research, where meteorological and hydrological factors were found to be the main factors affecting drought vulnerability [27,29,30,125]. The effectiveness of composite index methods for vulnerability to various water deficiencies assessment in a dynamic hydrologic, social and economic context is portrayed in this effort.
The Water Stress Vulnerability Index again highlights the importance of water governance and the status of water supply infrastructure. Such results support the existing literature that has shown the importance of effective institutional performance, water governance, and water infrastructure in improving adaptive capacity and decreasing vulnerability to water deficiency stressors [126,127,128,129]. At the same time, efforts to improve water infrastructure through enhanced water supply infrastructure, reduced water leakages, and efficient wastewater treatment practices have been widely acknowledged as essential in managing both short- and long-term water-related deficiencies [25,27,30,71,123,130]. The Water Stress Vulnerability Index again highlights the importance of water governance and the status of water supply infrastructure. Such results support the existing literature that has shown the importance of effective institutional performance, water governance, and water infrastructure in improving adaptive capacity and decreasing vulnerability to water deficiency stressors [126,127,128,129]. At the same time, efforts to improve water infrastructure through enhanced water supply infrastructure, reduced water leakages, and efficient wastewater treatment practices have been widely acknowledged as essential in managing both short- and long-term water-related deficiencies [25,27,30,71,123,130].
The application to Karditsa illustrates how the transferred composite-index framework integrates hydrological, climatic, technical, social, economic, infrastructure, and governance dimensions within a normal vulnerability to changing water conditions assessment. Within the inherited DVI weighting structure, the greatest nominal influence is assigned to Change in Stored Water and the precipitation-related indicators, while the structural sensitivity analysis identifies the same components as those exerting the strongest influence on DVI. This pattern is consistent with Mediterranean drought studies emphasizing the importance of meteorological and hydrological controls on drought vulnerability. WSTVI displayed a more distributed structural sensitivity pattern, with the strongest responses associated with water-supply infrastructure and governance-related indicators. WSCVI was most responsive to Institutional Framework and Gross Domestic Product. The integrated drought assessment therefore reflects more than meteorological water deficiency alone and incorporates institutional, infrastructural, economic, and demand-related dimensions. These findings should nevertheless be interpreted structurally: they identify the components with the greatest influence within the inherited index formulation and do not demonstrate that these variables are independently causal drivers of vulnerability in Karditsa. The spatial correlation between DVI and SDVI (r = 0.823) provides convergent evidence that the transferred DVI reproduces a broad spatial pattern similar to that obtained from an independently formulated drought-vulnerability index. It does not constitute a complete external validation, since both indices share precipitation-related information and neither represents an observed drought-impact record. The contribution of the Karditsa application is therefore best interpreted as an assessment of operational transferability and structural robustness in a European Mediterranean agricultural setting. Extension to other Greek regions appears technically feasible in terms of data availability and analytical workflow, but broader generalization may require testing across also contrasting hydrological and climatic conditions, as well as additional environmental, social and economic contexts.
Application Discussion
The most consequential concern of the present assessment may be temporal. The analysis followed a single reference year, 2016, selected for the spatial transferability assessment of a previously calibrated framework. Overall, this choice demonstrates that 2016 represents a regular hydrological and climatic year in Thessaly; it tests the response of the indices under typical conditions, and it refers to a normal supply and demand year. Although the 1981–2020 ERA5-Land record was used to establish the climatic reference series required by the meteorological indicators, only the 2016 conditions were propagated through the complete framework. Consequently, the dynamic range of the indices and their ability were concentrated to successfully describe vulnerability to normal conditions. Extension to a multi-year assessment, particularly including recognized drought and wet episodes, is therefore a priority for future work in the region.
A second concern revolves around the spatial support of the climatic inputs, discussed in Section 2.3. The climatic fields carry no independent information below approximately eleven kilometers. The variability visible at fifty meters in Figure 3, Figure 4, Figure 5, Figure 6, Figure 7 and Figure 8 is generated by the elevation covariate and inherits both the uncertainty of the kriging prediction and the assumption that the relationship between the climatic variable and elevation observed at the coarse support continues to hold at the fine support. That assumption cannot be fully verified with the data used here, and it is less likely to hold in the mountainous western part of the study area, where relief is strongest and the density of the primary support is lowest relative to the topographic gradient, since no other reliable data sources exist. Vulnerability to changing water conditions values reported for the western mountain zone should also be regarded as carrying greater uncertainty than those reported for the eastern lowland. No stochastic propagation of interpolation uncertainty through the final composite indices application was performed; consequently, exceedance probabilities for the final pertinent vulnerability classes could not be derived.
Third, the weights are external to the study area. As set out in Section 2.4, this is deliberate, but it entails that the relative importance attributed to each indicator reflects the covariance structure of the Latin American case study basins’ temperate zone, similar to that of the Thessaly area. It is established that a framework in which it does so produces a spatial pattern consistent with an independently constructed drought index.
Fourth, the validation is convergent rather than external. The comparison presented in Section 3.2 confronts one index with another, not with observed impact. Both indices are built in part from precipitation-derived inputs, so that a portion of their agreement is structural rather than evidential. Comparison with recorded impacts, such as irrigation restrictions, declared emergencies, drawdown of the Plasteras and Smokovo reservoirs, or municipal-level anomalies in cotton yield, remains necessary before predictive reliability needs to be examined, particularly in a drought year. Such records exist for the study area, and their compilation is a tractable, if laborious, extension.
Fifth, the discretization of continuous indicators into six ordinal classes introduces discontinuities that the underlying phenomena do not possess, with the consequences quantified in Section 3.5. The framework has also been shown to be applicable in one Regional Unit of one Greek region, apart from a rather extensive area such as Latin America. The indicator set is defined at a support (municipality, water body, reanalysis cell) that is available throughout Greece; thus, that extension to other Regional Units is technically straightforward, and the method may reasonably be described as nationally applicable in that operational sense. The classification thresholds of Table A1 were also designed and tested against insular or peri-urban settings in a variety of localities dominated also by tourism-driven seasonal demand or by inter-basin transfer.
Rising societal demand, seasonal fluctuations, long-term climate variations and wider environmental pressures all interact to shape both water availability and water-use patterns. In many regions, these pressures are already becoming critical, as communities face persistent shortages, recurring droughts, and major changes in their water systems. More broadly, there is an urgent need to address the growing impacts of human activities and the rapidly increasing demand for water across all sectors. Within the framework of Integrated Water Resources Management (IWRM), understanding when and where a system is vulnerable to water deficiencies is essential for supporting sustainable development, reducing disaster risk, and improving environmental governance from the local basin scale to the transboundary level. Such challenges highlight the need to examine the factors that control water-resources systems, especially in relation to planning, management, and long-term resilience to pertinent hazards. Such an assessment must consider both natural processes and human interventions as closely linked influences. Greater emphasis should also be placed on the reliability of data, including the use of modern monitoring technologies, measurement accuracy, and the relationships between hydrological cycles and ecosystem processes. At the same time, it is important to systematically monitor how human behavior can intensify drought impacts, accelerate water stress, and deplete available reserves. Finally, robust modeling methods are needed to identify and quantify the combined effects of these overlapping pressures. Future work should aim at incorporating potential climate change scenarios and social and economic projections in order to improve the future-oriented capacity of the proposed methodology. Scenario-based methods are considered a potential aid for long-term water resource management contingency planning under climate uncertainty [82]. In conclusion, the proposed methodology offers a reliable decision-support tool that can be used for regional water resource management and related hazards contingency planning.
5. Conclusions
This study evaluated the transferability and structural robustness of a previously developed composite-index framework for drought, water stress, water scarcity, and changing water conditions in the Regional Unit of Karditsa. Four main findings emerge. First, the transferred DVI showed strong spatial concordance with the independently formulated SDVI (r = 0.823), supporting consistency between the two assessments without constituting independent validation. Second, the higher WCCVI classes were concentrated mainly in the eastern and northeastern lowlands, whereas the western mountainous sector was predominantly characterized by lower vulnerability. Third, the inherited WCCVI structure assigns the largest component weight to WSTVI (0.408), followed by DVI (0.298) and WSCVI (0.294), emphasizing that infrastructure, governance, demand, and groundwater-pressure dimensions contribute alongside meteorological drought. Fourth, the structural sensitivity analysis showed high rank stability under ±20% weight perturbations and limited sensitivity to moderate shifts in the final composite-index class boundaries, whereas leave-one-indicator-out experiments revealed substantially greater dependence on a limited number of dominant indicators.
The results support the operational transferability of the framework as a regional screening approach, pointing towards potential universal applicability in similar locales. However, future work should also be applied in a multi-year testing across a variety of hydrological and climatic conditions, including independent validation against observed drought and water-resources impacts, and application to additional regions similar and/or with different characteristics.
The present effort has mostly focused on assessing current issues for integrated water resources management, using environmental and social indicators. However, changes at different levels (environment, land use, culture, and legislation) affect vulnerabilities to water deficiency profiles. Therefore, understanding how vulnerability to changing water conditions may change over time is an important part of assessing and addressing them. To manage such challenges, contingency planning and the development of proactive management efforts are essential. An important factor in the equation is the ability of decision-makers and the state to participate in contingency planning and proactive decision making for natural resources. This depends on the previous decisions and policies that have been implemented, especially in terms of technological development, construction of water resources infrastructure, but also the creation of research and management programs, with a particular focus on the development and protection of natural resources and the environment. To shield a study area, at a local or national level, from drought, water stress and scarcity, it is vital to adopt a focused action plan following the objectives of integrated water resources management. Scenario analysis is a method for potentially managing uncertainty and is a promising exercise for potential future assessment of vagaries related to climate, population, land use, and water. In a general context, it is important that scenarios are not forecasts or predictions, but represent possible future histories, due to high uncertainty. Therefore, the composite indices developed may potentially be used in a future-oriented effort for different scenario cases for both 2030 and 2050 to potentially formulate how vulnerability to water deficiencies may transform in another region under consideration. The proposed recommendations for such a study should be based on the set of various climatic zones, land use, social and economic conditions, as well as contingency planning tools.
Author Contributions
K.G.V., C.A.K., S.K., P.D.O., and D.E.T. conceived and designed the experiments; K.G.V., D.E.T., K.K., P.D.O., and S.K. performed the experiments, analyzed the data, K.G.V., C.A.K., P.D.O., S.K., D.E.T., K.K., A.T., K.T., and P.E.B. writing—review and editing. All authors have read and agreed to the published version of the manuscript.
Funding
This research was partially supported by the European Union’s Seventh Framework Programme for Research, Technological Development and Demonstration (FP7) through the COROADO project, “Technologies for Water Recycling and Reuse in Latin American Context: Assessment, Decision Tools and Implementable Strategies under an Uncertain Future”, under Grant Agreement No. 283025, Project Coordinator: C. A. Karavitis, https://cordis.europa.eu.
Institutional Review Board Statement
Not applicable.
Informed Consent Statement
Not applicable.
Data Availability Statement
The primary datasets used in this study are publicly available from the sources reported in Table 8 and Appendix A. Derived index rasters, EBK Regression Prediction diagnostics, and cross-validation outputs are available from the corresponding author upon reasonable request.
Conflicts of Interest
The authors declare no conflicts of interest.
Appendix A
Table A1.
Classification of the indicators into the six-level ordinal scale used in the construction of the composite indices [71,91].
Table A2.
Calculation data for indices, application year—2016.
References
- Tsatsaris, A.; Kalogeropoulos, K.; Stathopoulos, N.; Louka, P.; Tsanakas, K.; Tsesmelis, D.E.; Krassanakis, V.; Petropoulos, G.P.; Pappas, V.; Chalkias, C. Geoinformation Technologies in Support of Environmental Hazards Monitoring under Climate Change: An Extensive Review. ISPRS Int. J. Geo-Inf. 2021, 10, 94. [Google Scholar] [CrossRef] [Scilit]
- Loucks, D.P. Sustainable Water Resources Management. Water Int. 2000, 25, 3–10. [Google Scholar] [CrossRef] [Scilit]
- Makanda, K.; Nzama, S.; Kanyerere, T. Assessing the Role of Water Resources Protection Practice for Sustainable Water Resources Management: A Review. Water 2022, 14, 3153. [Google Scholar] [CrossRef] [Scilit]
- Veldkamp, T.I.E.; Wada, Y.; de Moel, H.; Kummu, M.; Eisner, S.; Aerts, J.C.J.H.; Ward, P.J. Changing Mechanism of Global Water Scarcity Events: Impacts of Socioeconomic Changes and Inter-Annual Hydro-Climatic Variability. Glob. Environ. Change 2015, 32, 18–29. [Google Scholar] [CrossRef] [Scilit]
- Spiliotis, K.; Voudouris, K.; Vangelis, H.; Spiliotis, M. Analysis of Annual Drought Episodes Using Complex Networks. Sustainability 2025, 17, 1441. [Google Scholar] [CrossRef] [Scilit]
- Vörösmarty, C.J.; Green, P.; Salisbury, J.; Lammers, R.B. Global Water Resources: Vulnerability from Climate Change and Population Growth. Science 2000, 289, 284–288. [Google Scholar] [CrossRef] [Scilit] [PubMed]
- Milly, P.C.D.; Betancourt, J.; Falkenmark, M.; Hirsch, R.M.; Kundzewicz, Z.W.; Lettenmaier, D.P.; Stouffer, R.J. Stationarity Is Dead: Whither Water Management? Science 2008, 319, 573–574. [Google Scholar] [CrossRef] [Scilit] [PubMed]
- Haddeland, I.; Heinke, J.; Biemans, H.; Eisner, S.; Flörke, M.; Hanasaki, N.; Konzmann, M.; Ludwig, F.; Masaki, Y.; Schewe, J.; et al. Global Water Resources Affected by Human Interventions and Climate Change. Proc. Natl. Acad. Sci. USA 2014, 111, 3251–3256. [Google Scholar] [CrossRef] [Scilit] [PubMed]
- Salvati, L.; Zitti, M.; Ceccarelli, T.; Perini, L. Developing a Synthetic Index of Land Vulnerability to Drought and Desertification. Geogr. Res. 2009, 47, 280–291. [Google Scholar] [CrossRef] [Scilit]
- El Moll, A. Chapter 23—Water Resources and Climate Change: Regional, National and International Perspective. In Sustainable and Circular Management of Resources and Waste Towards a Green Deal; Vara Prasad, M.N., Smol, M., Eds.; Elsevier: Amsterdam, The Netherlands, 2023; pp. 309–336. [Google Scholar]
- McDonald, R.I.; Green, P.; Balk, D.; Fekete, B.M.; Revenga, C.; Todd, M.; Montgomery, M. Urban Growth, Climate Change, and Freshwater Availability. Proc. Natl. Acad. Sci. USA 2011, 108, 6312–6317. [Google Scholar] [CrossRef] [Scilit] [PubMed]
- Dudgeon, D.; Arthington, A.H.; Gessner, M.O.; Kawabata, Z.-I.; Knowler, D.J.; Lévêque, C.; Naiman, R.J.; Prieur-Richard, A.-H.; Soto, D.; Stiassny, M.L.J.; et al. Freshwater Biodiversity: Importance, Threats, Status and Conservation Challenges. Biol. Rev. 2006, 81, 163–182. [Google Scholar] [CrossRef] [Scilit] [PubMed]
- Cosgrove, W.J.; Loucks, D.P. Water Management: Current and Future Challenges and Research Directions. Water Resour. Res. 2015, 51, 4823–4839. [Google Scholar] [CrossRef] [Scilit]
- Faye, C. Water Resources and Their Management in an Increasing Urban Demography: The Case of Dakar City in Senegal; IntechOpen: London, UK, 2021. [Google Scholar]
- Savelli, E.; Mazzoleni, M.; Di Baldassarre, G.; Cloke, H.; Rusca, M. Urban Water Crises Driven by Elites’ Unsustainable Consumption. Nat. Sustain. 2023, 6, 929–940. [Google Scholar] [CrossRef] [Scilit]
- Aven, T. On Some Recent Definitions and Analysis Frameworks for Risk, Vulnerability, and Resilience: On Some Recent Definitions and Analysis Frameworks. Risk Anal. 2011, 31, 515–522. [Google Scholar] [CrossRef] [Scilit] [PubMed]
- UN Water. The United Nations World Water Development Report 2021: Valuing Water; UN Water: Geneva, Switzerland, 2021. [Google Scholar]
- Tsesmelis, D.E.; Karavitis, C.A.; Oikonomou, P.D.; Alexandris, S.; Kosmas, C. Assessment of the Vulnerability to Drought and Desertification Characteristics Using the Standardized Drought Vulnerability Index (SDVI) and the Environmentally Sensitive Areas Index (ESAI). Resources 2019, 8, 6. [Google Scholar] [CrossRef] [Scilit]
- Salvati, L.; Carlucci, M. A Composite Index of Sustainable Development at the Local Scale: Italy as a Case Study. Ecol. Indic. 2014, 43, 162–171. [Google Scholar] [CrossRef] [Scilit]
- Arnell, N.W.; Lloyd-Hughes, B. The Global-Scale Impacts of Climate Change on Water Resources and Flooding under New Climate and Socio-Economic Scenarios. Clim. Change 2014, 122, 127–140. [Google Scholar] [CrossRef] [Scilit]
- Hanasaki, N.; Fujimori, S.; Yamamoto, T.; Yoshikawa, S.; Masaki, Y.; Hijioka, Y.; Kainuma, M.; Kanamori, Y.; Masui, T.; Takahashi, K.; et al. A Global Water Scarcity Assessment under Shared Socio-Economic Pathways—Part 2: Water Availability and Scarcity. Hydrol. Earth Syst. Sci. 2013, 17, 2393–2413. [Google Scholar] [CrossRef] [Scilit]
- Wang, Y.; Li, X.; Jin, G.; Luo, Z.; Sun, M.; Fu, Y.; Wu, T.; Liu, K.; Wang, Y.; Li, X.; et al. Towards a Global Water Use Scarcity Risk Assessment Framework: Integration of Remote Sensing and Geospatial Datasets. Remote Sens. 2025, 17, 3999. [Google Scholar] [CrossRef] [Scilit]
- Grey, D.; Sadoff, C.W. Sink or Swim? Water Security for Growth and Development. Water Policy 2007, 9, 545–571. [Google Scholar] [CrossRef] [Scilit]
- Brown, C.; Lall, U. Water and Economic Development: The Role of Variability and a Framework for Resilience. Nat. Resour. Forum 2006, 30, 306–317. [Google Scholar] [CrossRef] [Scilit]
- Grigg, N.S. Water, Wastewater, and Stormwater Infrastructure Management, 2nd ed.; CRC Press: Boca Raton, FL, USA, 2012. [Google Scholar]
- McDonald, R.I.; Weber, K.; Padowski, J.; Flörke, M.; Schneider, C.; Green, P.A.; Gleeson, T.; Eckman, S.; Lehner, B.; Balk, D.; et al. Water on an Urban Planet: Urbanization and the Reach of Urban Water Infrastructure. Glob. Environ. Change 2014, 27, 96–105. [Google Scholar] [CrossRef] [Scilit]
- Karavitis, C.A.; Tsesmelis, D.E.; Skondras, N.A.; Stamatakos, D.; Alexandris, S.; Fassouli, V.; Vasilakou, C.G.; Oikonomou, P.D.; Gregorič, G.; Grigg, N.S.; et al. Linking Drought Characteristics to Impacts on a Spatial and Temporal Scale. Water Policy 2014, 16, 1172–1197. [Google Scholar] [CrossRef] [Scilit]
- Tsesmelis, D.E.; Karavitis, C.A.; Kalogeropoulos, K.; Zervas, E.; Vasilakou, C.G.; Skondras, N.A.; Oikonomou, P.D.; Stathopoulos, N.; Alexandris, S.G.; Tsatsaris, A.; et al. Evaluating the Degradation of Natural Resources in the Mediterranean Environment Using the Water and Land Resources Degradation Index, the Case of Crete Island. Atmosphere 2022, 13, 135. [Google Scholar] [CrossRef] [Scilit]
- Tsesmelis, D.E.; Leveidioti, I.; Karavitis, C.A.; Kalogeropoulos, K.; Vasilakou, C.G.; Tsatsaris, A.; Zervas, E. Spatiotemporal Application of the Standardized Precipitation Index (SPI) in the Eastern Mediterranean. Climate 2023, 11, 95. [Google Scholar] [CrossRef] [Scilit]
- Oikonomou, P.D.; Karavitis, C.A.; Tsesmelis, D.E.; Kolokytha, E.; Maia, R. Drought Characteristics Assessment in Europe over the Past 50 Years. Water Resour. Manag. 2020, 34, 4757–4772. [Google Scholar] [CrossRef] [Scilit]
- Willmott, C.J.; Wicks, D.E. An Empirical Method for the Spatial Interpolation of Monthly Precipitation within California. Phys. Geogr. 1980, 1, 59–73. [Google Scholar] [CrossRef] [Scilit]
- Hu, Z.; Hu, Q.; Zhang, C.; Chen, X.; Li, Q. Evaluation of Reanalysis, Spatially Interpolated and Satellite Remotely Sensed Precipitation Data Sets in Central Asia. J. Geophys. Res. Atmos. 2016, 121, 5648–5663. [Google Scholar] [CrossRef] [Scilit]
- Milly, P.C.D.; Dunne, K.A. Colorado River Flow Dwindles as Warming-Driven Loss of Reflective Snow Energizes Evaporation. Science 2020, 367, 1252–1255. [Google Scholar] [CrossRef] [Scilit] [PubMed]
- Colantoni, A.; Ferrara, C.; Perini, L.; Salvati, L. Assessing Trends in Climate Aridity and Vulnerability to Soil Degradation in Italy. Ecol. Indic. 2015, 48, 599–604. [Google Scholar] [CrossRef] [Scilit]
- Depraetere, C.; Soulis, K.X.; Tsesmelis, D.E.; Avgoustidis, G.; Spilanis, I. Impacts of Climate Change on the Evolution of Water Resources in the Context of the Mediterranean Islands Using as an Example Two Aegean Sea Islands: Consequences for Touristic Activities in the Future. In The Anthropocene and Islands: Vulnerability, Adaptation and Resilience to Natural Hazards and Climate Change; Il Sileno: Lago, Italy, 2020; p. 143. [Google Scholar]
- Geeson, N.A.; Brandt, C.J.; Thornes, J.B. Mediterranean Desertification: A Mosaic of Processes and Responses; John Wiley & Sons: Hoboken, NJ, USA, 2003. [Google Scholar]
- Makondo, C.C.; Chola, K.; Moonga, B. Climate Change Adaptation and Vulnerability: A Case of Rain Dependent Small-Holder Farmers in Selected Districts in Zambia. Am. J. Clim. Change 2014, 03, 388–403. [Google Scholar] [CrossRef]
- Tesso, G.; Emana, B.; Ketema, M. Analysis of Vulnerability and Resilience to Climate Change Induced Shocks in North Shewa, Ethiopia. Agric. Sci. 2012, 03, 871–888. [Google Scholar] [CrossRef]
- Tsesmelis, D.E.; Vasilakou, C.G.; Kalogeropoulos, K.; Stathopoulos, N.; Alexandris, S.G.; Zervas, E.; Oikonomou, P.D.; Karavitis, C.A. Chapter 46—Drought Assessment Using the Standardized Precipitation Index (SPI) in GIS Environment in Greece. In Computers in Earth and Environmental Sciences; Pourghasemi, H.R., Ed.; Elsevier: Amsterdam, The Netherlands, 2022; pp. 619–633. [Google Scholar]
- Crausbay, S.D.; Ramirez, A.R.; Carter, S.L.; Cross, M.S.; Hall, K.R.; Bathke, D.J.; Betancourt, J.L.; Colt, S.; Cravens, A.E.; Dalton, M.S.; et al. Defining Ecological Drought for the Twenty-First Century. Bull. Am. Meteorol. Soc. 2017, 98, 2543–2550. [Google Scholar] [CrossRef] [Scilit]
- Van Loon, A.F.; Gleeson, T.; Clark, J.; Van Dijk, A.I.J.M.; Stahl, K.; Hannaford, J.; Di Baldassarre, G.; Teuling, A.J.; Tallaksen, L.M.; Uijlenhoet, R.; et al. Drought in the Anthropocene. Nat. Geosci. 2016, 9, 89–91. [Google Scholar] [CrossRef] [Scilit]
- Eludoyin, A.O.; Idowu, M.A.; Oyinloye, M.E.; Eludoyin, O.M.; Eslamian, S. Chapter 13—Drought Risk Management and Contingency Planning. In Handbook of Nature-Based Drought Solutions; Eslamian, S., Eslamian, F., Eds.; Elsevier: Amsterdam, The Netherlands, 2025; pp. 279–294. [Google Scholar]
- Wilhite, D.A. Chapter 1 Drought as a Natural Hazard: Concepts and Definitions; Drought Mitigation Center Faculty Publications; Routledge: London, UK, 2000. [Google Scholar]
- Wens, M.; Johnson, J.M.; Zagaria, C.; Veldkamp, T.I.E. Integrating Human Behavior Dynamics into Drought Risk Assessment—A Sociohydrologic, Agent-Based Approach. WIREs Water 2019, 6, e1345. [Google Scholar] [CrossRef] [Scilit]
- Born, S.M.; Sonzogni, W.C. Integrated Environmental Management: Strengthening the Conceptualization. Environ. Manag. 1995, 19, 167–181. [Google Scholar] [CrossRef] [Scilit]
- Xie, M. Integrated Water Resources Management (IWRM)—Introduction to Principles and Practices, World Bank Institute (WBI). Available online: http://www.pacificwater.org/userfiles/file/IWRM/Toolboxes/introduction%20to%20iwrm/IWRM%20Introduction.pdf (accessed on 27 November 2016).
- Grigg, N.S. Integrated Water Resources Management: Balancing Views and Improving Practice. Water Int. 2008, 33, 279–292. [Google Scholar] [CrossRef] [Scilit]
- AghaKouchak, A.; Mirchi, A.; Madani, K.; Di Baldassarre, G.; Nazemi, A.; Alborzi, A.; Anjileli, H.; Azarderakhsh, M.; Chiang, F.; Hassanzadeh, E.; et al. Anthropogenic Drought: Definition, Challenges, and Opportunities. Rev. Geophys. 2021, 59, e2019RG000683. [Google Scholar] [CrossRef] [Scilit]
- Chai, Q.; Gan, Y.; Zhao, C.; Xu, H.-L.; Waskom, R.M.; Niu, Y.; Siddique, K.H.M. Regulated Deficit Irrigation for Crop Production under Drought Stress. A Review. Agron. Sustain. Dev. 2015, 36, 3. [Google Scholar] [CrossRef] [Scilit]
- Grigg, N.S. The 2011–2012 Drought in the United States: New Lessons from a Record Event. Int. J. Water Resour. Dev. 2014, 30, 183–199. [Google Scholar] [CrossRef] [Scilit]
- Stålnacke, P.; Gooch, G.D. Integrated Water Resources Management. Irrig. Drain. Syst. 2010, 24, 155–159. [Google Scholar] [CrossRef] [Scilit]
- Grigg, N.S. Water Resources Management. In Water Encyclopedia; John Wiley & Sons, Inc.: Hoboken, NJ, USA, 1996. [Google Scholar]
- Rahaman, M.M.; Varis, O. Integrated Water Resources Management: Evolution, Prospects and Future Challenges. Sustain. Sci. Pract. Policy 2005, 1, 15–21. [Google Scholar] [CrossRef] [Scilit]
- Niemczynowicz, J. Urban Hydrology and Water Management—Present and Future Challenges. Urban Water 1999, 1, 1–14. [Google Scholar] [CrossRef] [Scilit]
- van den Brandeler, F.; Gupta, J.; Hordijk, M. Megacities and Rivers: Scalar Mismatches between Urban Water Management and River Basin Management. J. Hydrol. 2019, 573, 1067–1074. [Google Scholar] [CrossRef] [Scilit]
- Bao, C.; Fang, C. Water Resources Flows Related to Urbanization in China: Challenges and Perspectives for Water Management and Urban Development. Water Resour. Manag. 2012, 26, 531–552. [Google Scholar] [CrossRef] [Scilit]
- Das, S.; Choudhury, M.R.; Chatterjee, B.; Das, P.; Bagri, S.; Paul, D.; Bera, M.; Dutta, S. Unraveling the Urban Climate Crisis: Exploring the Nexus of Urbanization, Climate Change, and Their Impacts on the Environment and Human Well-Being—A Global Perspective. AIMS Public Health 2024, 11, 963–1001. [Google Scholar] [CrossRef] [Scilit] [PubMed]
- Saleem, A.; Anwar, S.; Nawaz, T.; Fahad, S.; Saud, S.; Ur Rahman, T.; Khan, M.N.R.; Nawaz, T. Securing a Sustainable Future: The Climate Change Threat to Agriculture, Food Security, and Sustainable Development Goals. J. Umm Al-Qura Univ. Appl. Sci. 2025, 11, 595–611. [Google Scholar] [CrossRef] [Scilit]
- Smakhtin, V.; Hughes, D. Automated Estimation and Analyses of Meteorological Drought Characteristics from Monthly Rainfall Data. Environ. Model. Softw. 2007, 22, 880–890. [Google Scholar] [CrossRef] [Scilit]
- WMO. Guide to Meteorological Instruments and Methods of Observation; WMO: Geneva, Switzerland, 2010; p. 716. [Google Scholar]
- Karavitis, C.A. Drought and Urban Water Supplies: The Case of Metropolitan Athens. Water Policy 1998, 1, 505–524. [Google Scholar] [CrossRef] [Scilit]
- Cai, X.; Rosegrant, M.W. Global Water Demand and Supply Projections. Water Int. 2002, 27, 159–169. [Google Scholar] [CrossRef] [Scilit]
- Grigg, N.S.; Vlachos, E.C. Drought and Water-Supply Management: Roles and Responsibilities. J. Water Resour. Plan. Manag. 1993, 119, 531–541. [Google Scholar] [CrossRef] [Scilit]
- Tzanakakis, V.A.; Paranychianakis, N.V.; Angelakis, A.N. Water Supply and Water Scarcity. Water 2020, 12, 2347. [Google Scholar] [CrossRef] [Scilit]
- Loucks, D.P.; van Beek, E. Water Resources Planning and Management: An Overview. In Water Resource Systems Planning and Management: An Introduction to Methods, Models, and Applications; Loucks, D.P., van Beek, E., Eds.; Springer International Publishing: Cham, Switzerland, 2017; pp. 1–49. [Google Scholar]
- Galatoulas, N.-F.; Tsesmelis, D.E.; Kavga, A.; Kalogeropoulos, K.; Barouchas, P.E. Development of High-Resolution Agroclimatic Zoning Method to Determine Micro-Agroclimatic Zones in Greece. Earth 2026, 7, 61. [Google Scholar] [CrossRef] [Scilit]
- Johannessen, Å.; Rosemarin, A.; Thomalla, F.; Gerger Swartling, Å.; Axel Stenström, T.; Vulturius, G. Strategies for Building Resilience to Hazards in Water, Sanitation and Hygiene (WASH) Systems: The Role of Public Private Partnerships. Int. J. Disaster Risk Reduct. 2014, 10, 102–115. [Google Scholar] [CrossRef] [Scilit]
- Tsesmelis, D.E.; Oikonomou, P.D.; Vasilakou, C.G.; Skondras, N.A.; Fassouli, V.; Alexandris, S.G.; Grigg, N.S.; Karavitis, C.A. Assessing Structural Uncertainty Caused by Different Weighting Methods on the Standardized Drought Vulnerability Index (SDVI). Stoch. Environ. Res. Risk Assess. 2019, 33, 515–533. [Google Scholar] [CrossRef] [Scilit]
- Folke, C. Resilience: The Emergence of a Perspective for Social–Ecological Systems Analyses. Glob. Environ. Change 2006, 16, 253–267. [Google Scholar] [CrossRef] [Scilit]
- Skondras, N.A.; Tsesmelis, D.E.; Vasilakou, C.G.; Karavitis, C.A. Resilience–Vulnerability Analysis: A Decision-Making Framework for Systems Assessment. Sustainability 2020, 12, 9306. [Google Scholar] [CrossRef] [Scilit]
- Karavitis, C.A.; Vasilakou, C.; Tsesmelis, D.E.; Skondras, N.A.; Oikonomou, P.D.; Kalogeropoulos, K.; Balabanis, P.A.; Maia, R.; Playán, E.; Zapata, N.; et al. Assessing Existing and Potential Future Vulnerability to Water Resources Changing Conditions Using Dynamic Composite Indices in Latin America. Earth 2026, 7, 81. [Google Scholar] [CrossRef] [Scilit]
- Miller, F.; Osbahr, H.; Boyd, E.; Thomalla, F.; Bharwani, S.; Ziervogel, G.; Walker, B.; Birkmann, J.; van der Leeuw, S.; Rockström, J.; et al. Resilience and Vulnerability: Complementary or Conflicting Concepts? Ecol. Soc. 2010, 15, 3. [Google Scholar] [CrossRef] [Scilit]
- European Environment Agency. Water Resources in Europe in the Context of Vulnerability—European Environment Agency; European Environment Agency: Copenhagen, Denmark, 2012. [Google Scholar]
- IPCC. Climate Change 2014—Impacts, Adaptation and Vulnerability: Regional Aspects, Intergovernmental Panel on Climate Change; Cambridge University Press: Cambridge, UK, 2014.
- Janssen, M.A.; Schoon, M.L.; Ke, W.; Börner, K. Scholarly Networks on Resilience, Vulnerability and Adaptation within the Human Dimensions of Global Environmental Change. Glob. Environ. Change 2006, 16, 240–252. [Google Scholar] [CrossRef] [Scilit]
- Janssen, W.; Goldsworthy, P. Multidisciplinary Research for Natural Resource Management: Conceptual and Practical Implications. Agric. Syst. 1996, 51, 259–279. [Google Scholar] [CrossRef] [Scilit]
- Oikonomou, P.D.; Tsesmelis, D.E.; Waskom, R.M.; Grigg, N.S.; Karavitis, C.A. Enhancing the Standardized Drought Vulnerability Index by Integrating Spatiotemporal Information from Satellite and In Situ Data. J. Hydrol. 2019, 569, 265–277. [Google Scholar] [CrossRef] [Scilit]
- Adger, N.W. Social Vulnerability to Climate Change and Extremes in Coastal Vietnam. World Dev. 1999, 27, 249–269. [Google Scholar] [CrossRef] [Scilit]
- Adger, W.N.; Kelly, P.M. Social Vulnerability to Climate Change and the Architecture of Entitlements. Mitig. Adapt. Strateg. Glob. Change 1999, 4, 253–266. [Google Scholar] [CrossRef] [Scilit]
- Blaikie, P.; Cannon, T.; Davis, I.; Wisner, B. At Risk: Natural Hazards, People’s Vulnerability and Disasters; Routledge: London, UK, 1994. [Google Scholar]
- Burton, I.; Huq, S.; Lim, B.; Pilifosova, O.; Schipper, E.L. From Impacts Assessment to Adaptation Priorities: The Shaping of Adaptation Policy. Clim. Policy 2002, 2, 145–159. [Google Scholar] [CrossRef] [Scilit][Green Version]
- Choat, B.; Jansen, S.; Brodribb, T.J.; Cochard, H.; Delzon, S.; Bhaskar, R.; Bucci, S.J.; Feild, T.S.; Gleason, S.M.; Hacke, U.G.; et al. Global Convergence in the Vulnerability of Forests to Drought. Nature 2012, 491, 752–755. [Google Scholar] [CrossRef] [Scilit] [PubMed]
- Downing, T.E.; Moss, S.; Pahl-Wostl, C. Understanding Climate Policy Using Participatory Agent-Based Social Simulation. In Multi-Agent-Based Simulation; Moss, S., Davidsson, P., Eds.; Springer: Berlin/Heidelberg, Germany, 2000; Volume 1979, pp. 198–213. [Google Scholar]
- Jun, K.S.; Chung, E.-S.; Sung, J.-Y.; Lee, K.S. Development of Spatial Water Resources Vulnerability Index Considering Climate Change Impacts. Sci. Total Environ. 2011, 409, 5228–5242. [Google Scholar] [CrossRef] [Scilit] [PubMed]
- Dahl, A.L. Achievements and Gaps in Indicators for Sustainability. Ecol. Indic. 2012, 17, 14–19. [Google Scholar] [CrossRef] [Scilit]
- European Environment Agency. Climate Change Adaptation in the Agriculture Sector in Europe—European Environment Agency; European Environment Agency: Copenhagen, Denmark, 2019; pp. 1–112. [Google Scholar]
- European Environment Agency. EEA Core Set of Indicators: Guide; Publications Office: Luxembourg, 2005. [Google Scholar]
- Segnestam, L. Indicators of Environment and Sustainable Development; The International Bank for Reconstruction and Development/The World Bank: Washington, DC, USA, 2002; Volume 66. [Google Scholar]
- Tsesmelis, D.E.; Karavitis, C.A.; Kalogeropoulos, K.; Tsatsaris, A.; Zervas, E.; Vasilakou, C.G.; Stathopoulos, N.; Skondras, N.A.; Alexandris, S.G.; Chalkias, C.; et al. Development and Application of Water and Land Resources Degradation Index (WLDI). Earth 2021, 2, 515–531. [Google Scholar] [CrossRef] [Scilit]
- Skondras, N.A.; Karavitis, C.A. Evaluation and Comparison of DPSIR Framework and the Combined SWOT–DPSIR Analysis Approach: Towards Embracing Complexity. Glob. NEST J. 2014, 17, 198–209. [Google Scholar] [CrossRef] [Scilit]
- COROADO Technologies for Water Recycling and Reuse in Latin American Context: Assessment, Decision Tools and Implementable Strategies Under an Uncertain Future|FP7. Available online: https://cordis.europa.eu/project/id/283025/reporting (accessed on 10 November 2025).
- Cui, D.; Liang, S.; Wang, D.; Liu, Z. A Global Dataset of Historical (1979–2013) and Future (2020–2100) Köppen–Geiger Climate Classification and Bioclimatic Variables. Earth Syst. Sci. Data 2021, 13, 5087–5114. [Google Scholar] [CrossRef] [Scilit]
- Hellenic Statistical Authority. Results of the 2021 Population and Housing Census: Resident Population. Available online: https://www.statistics.gr/en/2021-census-res-pop-results (accessed on 21 March 2024).
- Zarokosta, H.; Koutsouris, A. The Landscape of Creation and Facilitation of Dairy Sheep-Farmers’ Discussion Groups in Stables in Karditsa, Greece. Int. J. Agric. Ext. 2018, 6, 99–110. [Google Scholar]
- Dota, A.; Theodossiou, N. Estimation of Green and Blue Water Footprint. Application in the Agricultural Sector of Karditsa Prefecture. In Proceedings of the 12th International Conference on Protection and Restoration of the Environment, Skiathos Island, Greece, 29 June–7 March 2014. [Google Scholar]
- Sébastien, L.; Bauler, T. Use and Influence of Composite Indicators for Sustainable Development at the EU-Level. Ecol. Indic. 2013, 35, 3–12. [Google Scholar] [CrossRef] [Scilit]
- Greco, S.; Ishizaka, A.; Tasiou, M.; Torrisi, G. On the Methodological Framework of Composite Indices: A Review of the Issues of Weighting, Aggregation, and Robustness. Soc. Indic. Res. 2019, 141, 61–94. [Google Scholar] [CrossRef] [Scilit]
- Brown, A.; Matlock, M.D. A Review of Water Scarcity Indices and Methodologies. White Pap. 2011, 106, 19. [Google Scholar]
- Adair, J. Decision Making and Problem Solving Strategies; Kogan Page: The Sunday Times: London, UK; Philadelphia, PA, USA; New Delhi, India, 2010. [Google Scholar]
- Haines-Young, R.; Potschin, M.; Kienast, F. Indicators of Ecosystem Service Potential at European Scales: Mapping Marginal Changes and Trade-Offs. Ecol. Indic. 2012, 21, 39–53. [Google Scholar] [CrossRef] [Scilit]
- Smeets, E.; Weterings, R. Environmental Indicators: Typology and Overview, Edith Smeets and Rob Weterings; European Environment Agency: Copenhagen, Denmark, 1999; p. 19. [Google Scholar]
- OECD. Handbook on Constructing Composite Indicators: Methodology and User Guide; Organization for Economic Co-operation and Development: Paris, France, 2008. [Google Scholar]
- Al-Saidi, M. Conflicts and Security in Integrated Water Resources Management. Environ. Sci. Policy 2017, 73, 38–44. [Google Scholar] [CrossRef] [Scilit]
- Das, A.; Mishra, S. Smart and Sustainable Water Management: Policy, Technology, and Innovation Pathways for Resource Resilience. Green Technol. Resil. Sustain. 2025, 5, 5. [Google Scholar] [CrossRef] [Scilit]
- Tscherning, K.; Helming, K.; Krippner, B.; Sieber, S.; Paloma, S.G. y Does Research Applying the DPSIR Framework Support Decision Making? Land Use Policy 2012, 29, 102–110. [Google Scholar] [CrossRef] [Scilit]
- Karavitis, C.A. Decision Support Systems for Drought Management Strategies in Metropolitan Athens. Water Int. 1999, 24, 10–21. [Google Scholar] [CrossRef] [Scilit]
- Kosmas, C.; Kairis, O.; Karavitis, C.; Ritsema, C.; Salvati, L.; Acikalin, S.; Alcalá, M.; Alfama, P.; Atlhopheng, J.; Barrera, J.; et al. Evaluation and Selection of Indicators for Land Degradation and Desertification Monitoring: Methodological Approach. Environ. Manag. 2014, 54, 951–970. [Google Scholar] [CrossRef] [Scilit] [PubMed]
- Karavitis, C.A.; Tsesmelis, D.E.; Oikonomou, P.D.; Kairis, O.; Kosmas, C.; Fassouli, V.; Ritsema, C.; Hessel, R.; Jetten, V.; Moustakas, N.; et al. A Desertification Risk Assessment Decision Support Tool (DRAST). CATENA 2020, 187, 104413. [Google Scholar] [CrossRef] [Scilit]
- Salvati, L.; Kosmas, C.; Kairis, O.; Karavitis, C.; Acikalin, S.; Belgacem, A.; Solé-Benet, A.; Chaker, M.; Fassouli, V.; Gokceoglu, C.; et al. Unveiling Soil Degradation and Desertification Risk in the Mediterranean Basin: A Data Mining Analysis of the Relationships between Biophysical and Socioeconomic Factors in Agro-Forest Landscapes. J. Environ. Plan. Manag. 2015, 58, 1789–1803. [Google Scholar] [CrossRef] [Scilit]
- Alexandris, S.; Kerkides, P.; Liakatas, A. Daily Reference Evapotranspiration Estimates by the “Copais” Approach. Agric. Water Manag. 2006, 82, 371–386. [Google Scholar] [CrossRef] [Scilit]
- Jolaosho, T.L.; Mustapha, A.A.; Hundeyin, S.T. Hydrogeochemical Evolution and Heavy Metal Characterization of Groundwater from Southwestern, Nigeria: An Integrated Assessment Using Spatial, Indexical, Irrigation, Chemometric, and Health Risk Models. Heliyon 2024, 10, e38364. [Google Scholar] [CrossRef] [Scilit] [PubMed]
- Schiavo, M.; Colombani, N.; Mastrocicco, M. Modeling Stochastic Saline Groundwater Occurrence in Coastal Aquifers. Water Res. 2023, 235, 119885. [Google Scholar] [CrossRef] [Scilit] [PubMed]
- McKee, T.B.; Doesken, N.J.; Kleist, J. The Relationship of Drought Frequency and Duration to Time Scales; American Meteorological Society: Anaheim, CA, USA, 1993; pp. 179–184. [Google Scholar]
- Monteith, J.L. Evaporation and Environment. Symp. Soc. Exp. Biolology 1965, 19, 205–234. [Google Scholar]
- Dobbie, M.J.; Dail, D. Robustness and Sensitivity of Weighting and Aggregation in Constructing Composite Indices. Ecol. Indic. 2013, 29, 270–277. [Google Scholar] [CrossRef] [Scilit]
- Saisana, M.; Saltelli, A.; Tarantola, S. Uncertainty and Sensitivity Analysis Techniques as Tools for the Quality Assessment of Composite Indicators. J. R. Stat. Soc. Ser. A Stat. Soc. 2005, 168, 307–323. [Google Scholar] [CrossRef] [Scilit]
- Newman, K.B.; Naha, S.; Jackson-Blake, L.A.; Topp, C.; Glendell, M.; Butler, A. Global Sensitivity Analysis Workflows and Rankings: A Practical Comparison for Researchers. Environ. Model. Softw. 2026, 200, 106956. [Google Scholar] [CrossRef] [Scilit]
- Becker, W.; Saisana, M.; Paruolo, P.; Vandecasteele, I. Weights and Importance in Composite Indicators: Closing the Gap. Ecol. Indic. 2017, 80, 12–22. [Google Scholar] [CrossRef] [Scilit] [PubMed]
- Kelemen, A.; Szabó, Z.K.; Bozóki, S.; Szádoczki, Z.; Hartvig, Á.D. A Sensitivity Analysis of Composite Indicators: Min/Max Thresholds. Environ. Sustain. Indic. 2024, 23, 100453. [Google Scholar] [CrossRef] [Scilit]
- Ballio, F.; Guadagnini, A. Convergence Assessment of Numerical Monte Carlo Simulations in Groundwater Hydrology. Water Resour. Res. 2004, 40, W04603. [Google Scholar] [CrossRef] [Scilit]
- Schiavo, M. Numerical Impact of Variable Volumes of Monte Carlo Simulations of Heterogeneous Conductivity Fields in Groundwater Flow Models. J. Hydrol. 2024, 634, 131072. [Google Scholar] [CrossRef] [Scilit]
- Karavitis, C.A.; Oikonomou, P.D. Water Resources Management and Policy in Greece: Challenges and Options. In The Geography of Greece: Managing Crises and Building Resilience; Darques, R., Sidiropoulos, G., Kalabokidis, K., Eds.; World Regional Geography Book Series; Springer International Publishing: Cham, Switzerland, 2024; pp. 113–128. [Google Scholar]
- Lawrence, M.G. The Relationship between Relative Humidity and the Dewpoint Temperature in Moist Air: A Simple Conversion and Applications. Bull. Am. Meteorol. Soc. 2005, 86, 225–234. [Google Scholar] [CrossRef] [Scilit]
- Karavitis, C.A.; Alexandris, S.G.; Fassouli, V.P.; Stamatakos, D.V.; Vasilakou, C.G.; Tsesmelis, D.E.; Skondras, N.A.; Gregoric, G. Assessing Drought Vulnerability under Alternative Water Demand Deficit Scenarios in South-Eastern Europe. In Proceedings of the 8th International Conference of EWRA “Water Resources Management in an Interdisciplinary and Changing Context”, Porto, Portugal, 26–29 June 2013. [Google Scholar]
- Blauhut, V.; Stahl, K.; Stagge, J.H.; Tallaksen, L.M.; De Stefano, L.; Vogt, J. Estimating Drought Risk across Europe from Reported Drought Impacts, Drought Indices, and Vulnerability Factors. Hydrol. Earth Syst. Sci. 2016, 20, 2779–2800. [Google Scholar] [CrossRef] [Scilit]
- OECD. The OECD Principles on Water Governance and Implementation Strategy; OECD: Paris, France, 2015. [Google Scholar]
- Chahed, J. Hydro-Climatic Modelling for Water Resources: From Processes to Adaptive Management and Governance. Hydrol. Process. 2025, 39, e70348. [Google Scholar] [CrossRef] [Scilit]
- Scott, C.A.; Shrestha, P.P.; Lutz-Ley, A.N. The Re-Adaptation Challenge: Limits and Opportunities of Existing Infrastructure and Institutions in Adaptive Water Governance. Curr. Opin. Environ. Sustain. 2020, 44, 104–112. [Google Scholar] [CrossRef] [Scilit]
- Akamani, K. Adaptive Water Governance: Integrating the Human Dimensions into Water Resource Governance. J. Contemp. Water Res. Educ. 2016, 158, 2–18. [Google Scholar] [CrossRef] [Scilit]
- Truchado, P.; Gil, M.I.; López, C.; Garre, A.; López-Aragón, R.F.; Böhme, K.; Allende, A. New Standards at European Union Level on Water Reuse for Agricultural Irrigation: Are the Spanish Wastewater Treatment Plants Ready to Produce and Distribute Reclaimed Water within the Minimum Quality Requirements? Int. J. Food Microbiol. 2021, 356, 109352. [Google Scholar] [CrossRef] [Scilit] [PubMed]
- Schiavina, M.; Freire, S.; Carioli, A.; MacManus, K. GHS-POP R2023A—GHS Population Grid Multitemporal (1975–2030); European Commission, Joint Research Centre (JRC): Ispra, Italy, 2023. [CrossRef]
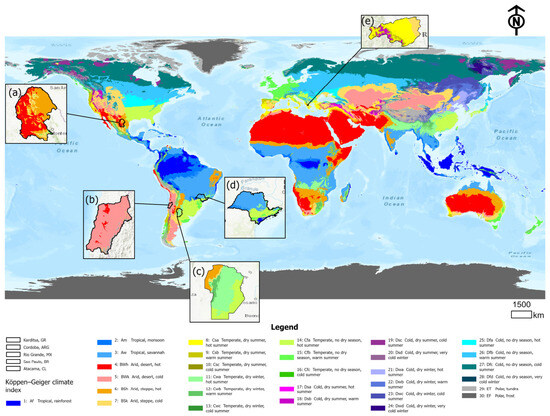
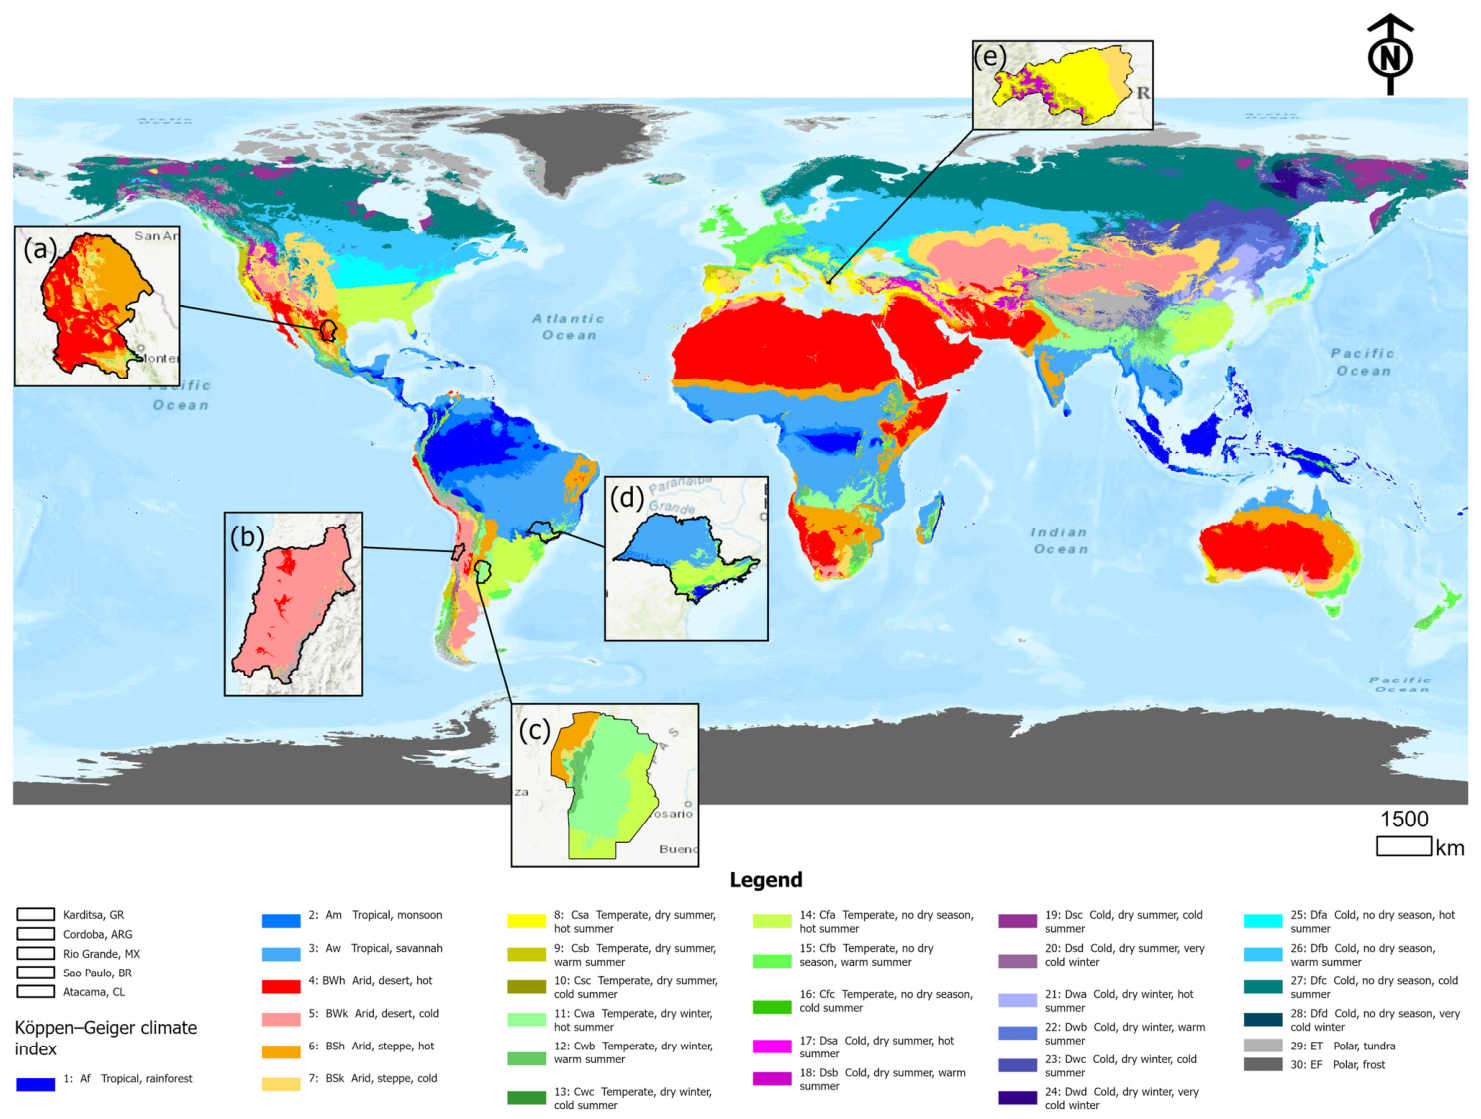
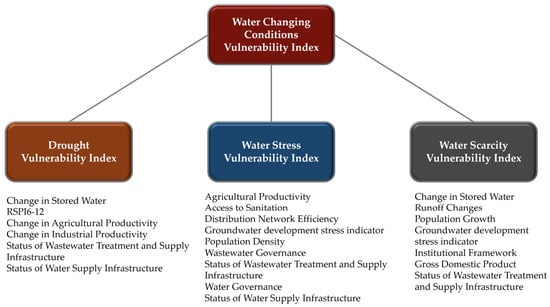
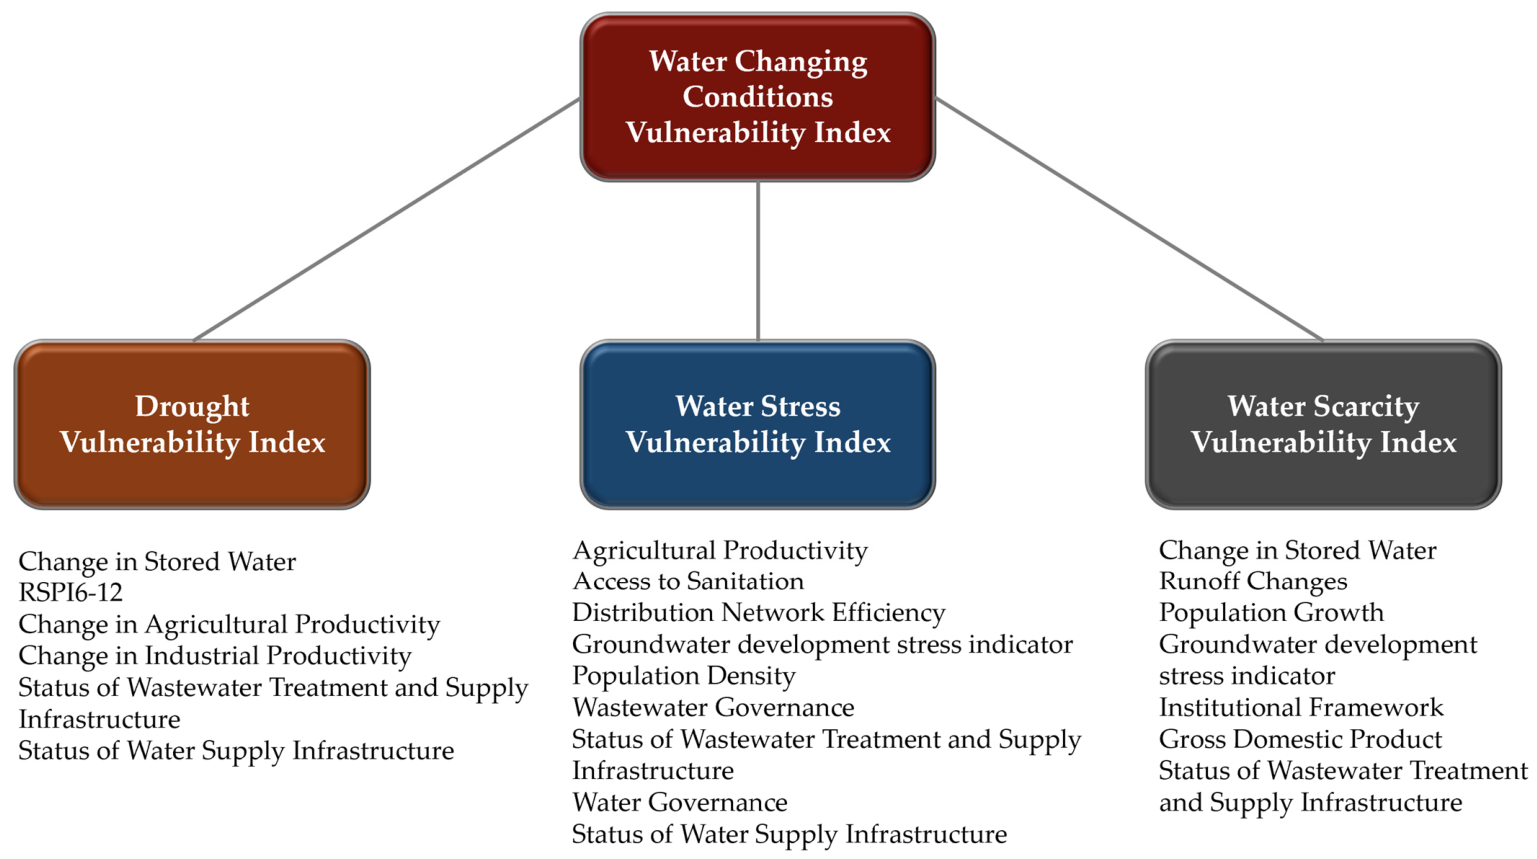
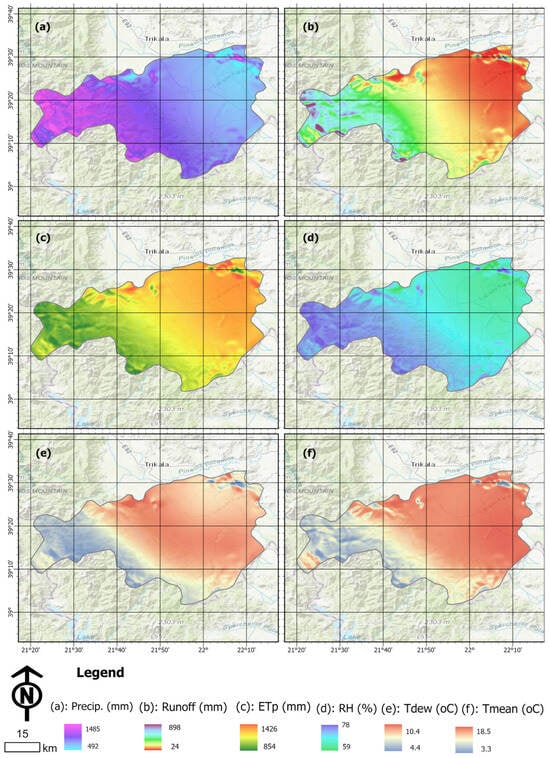
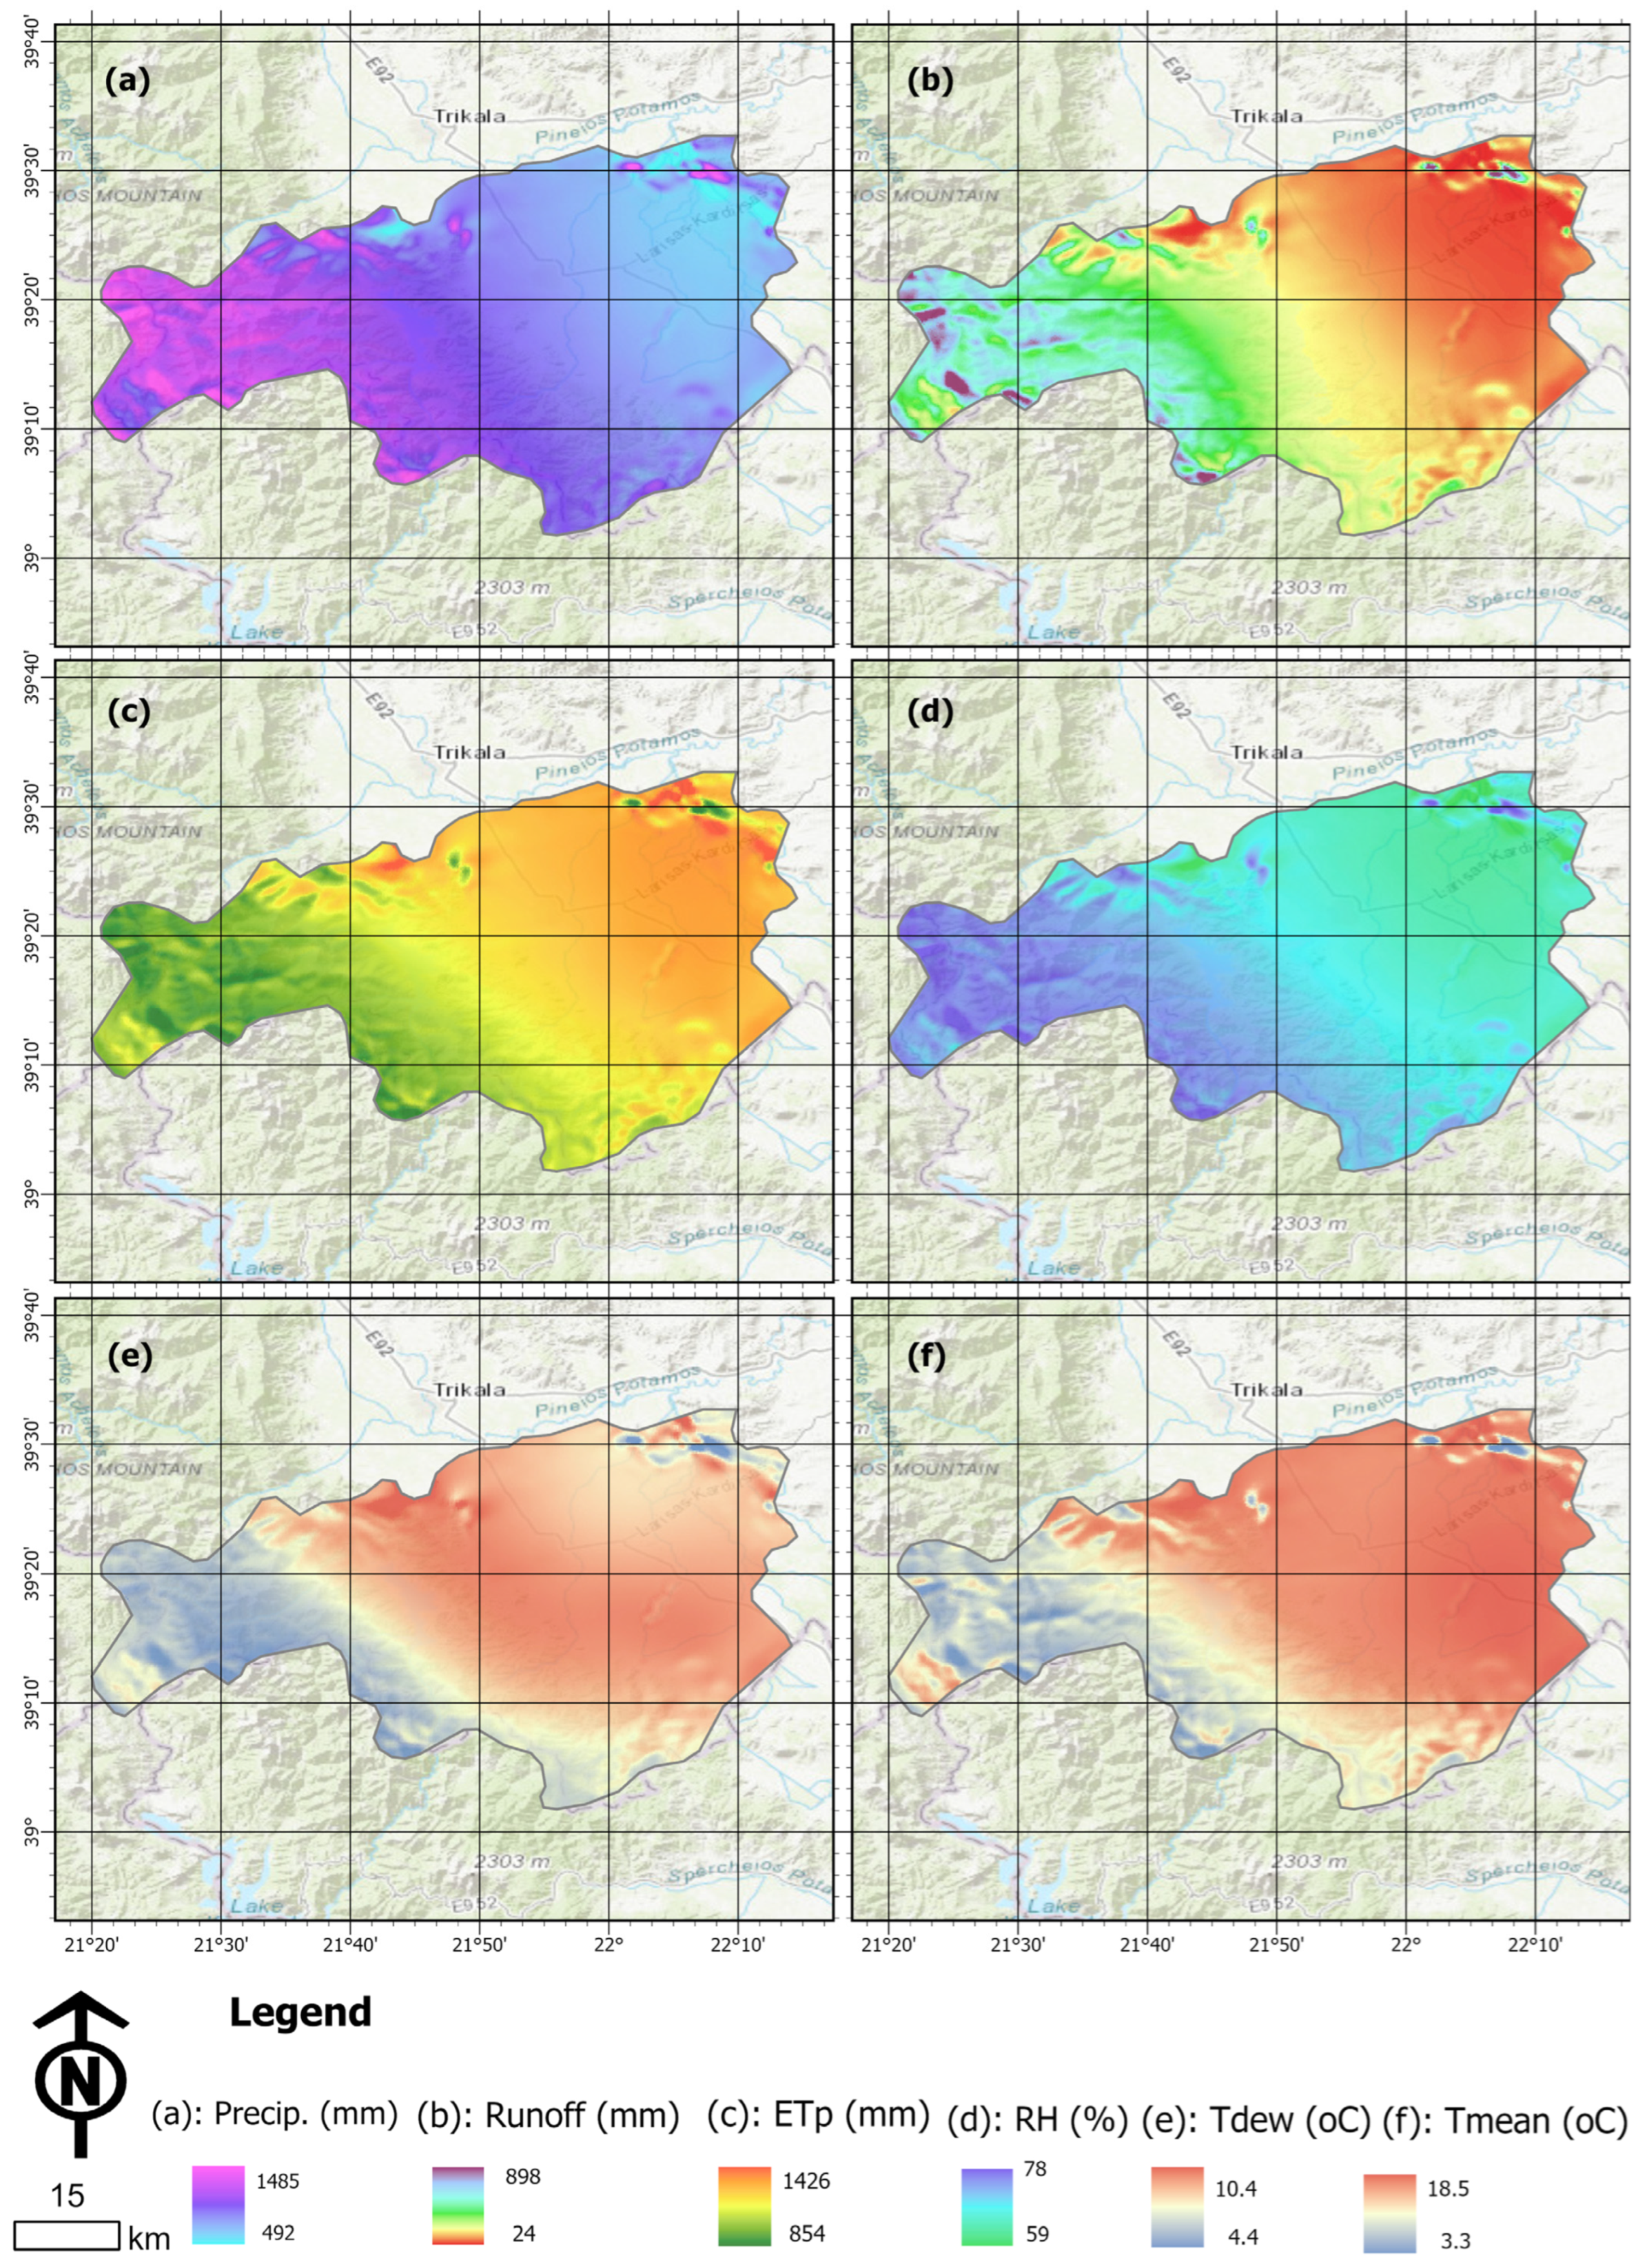
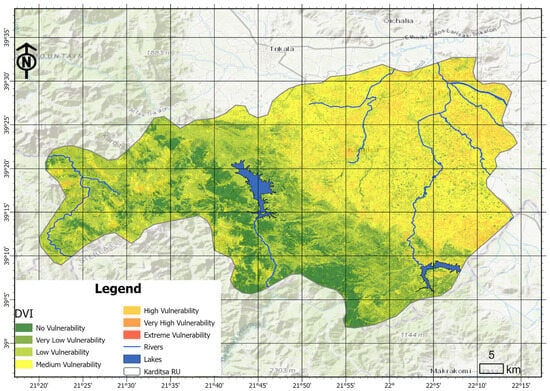
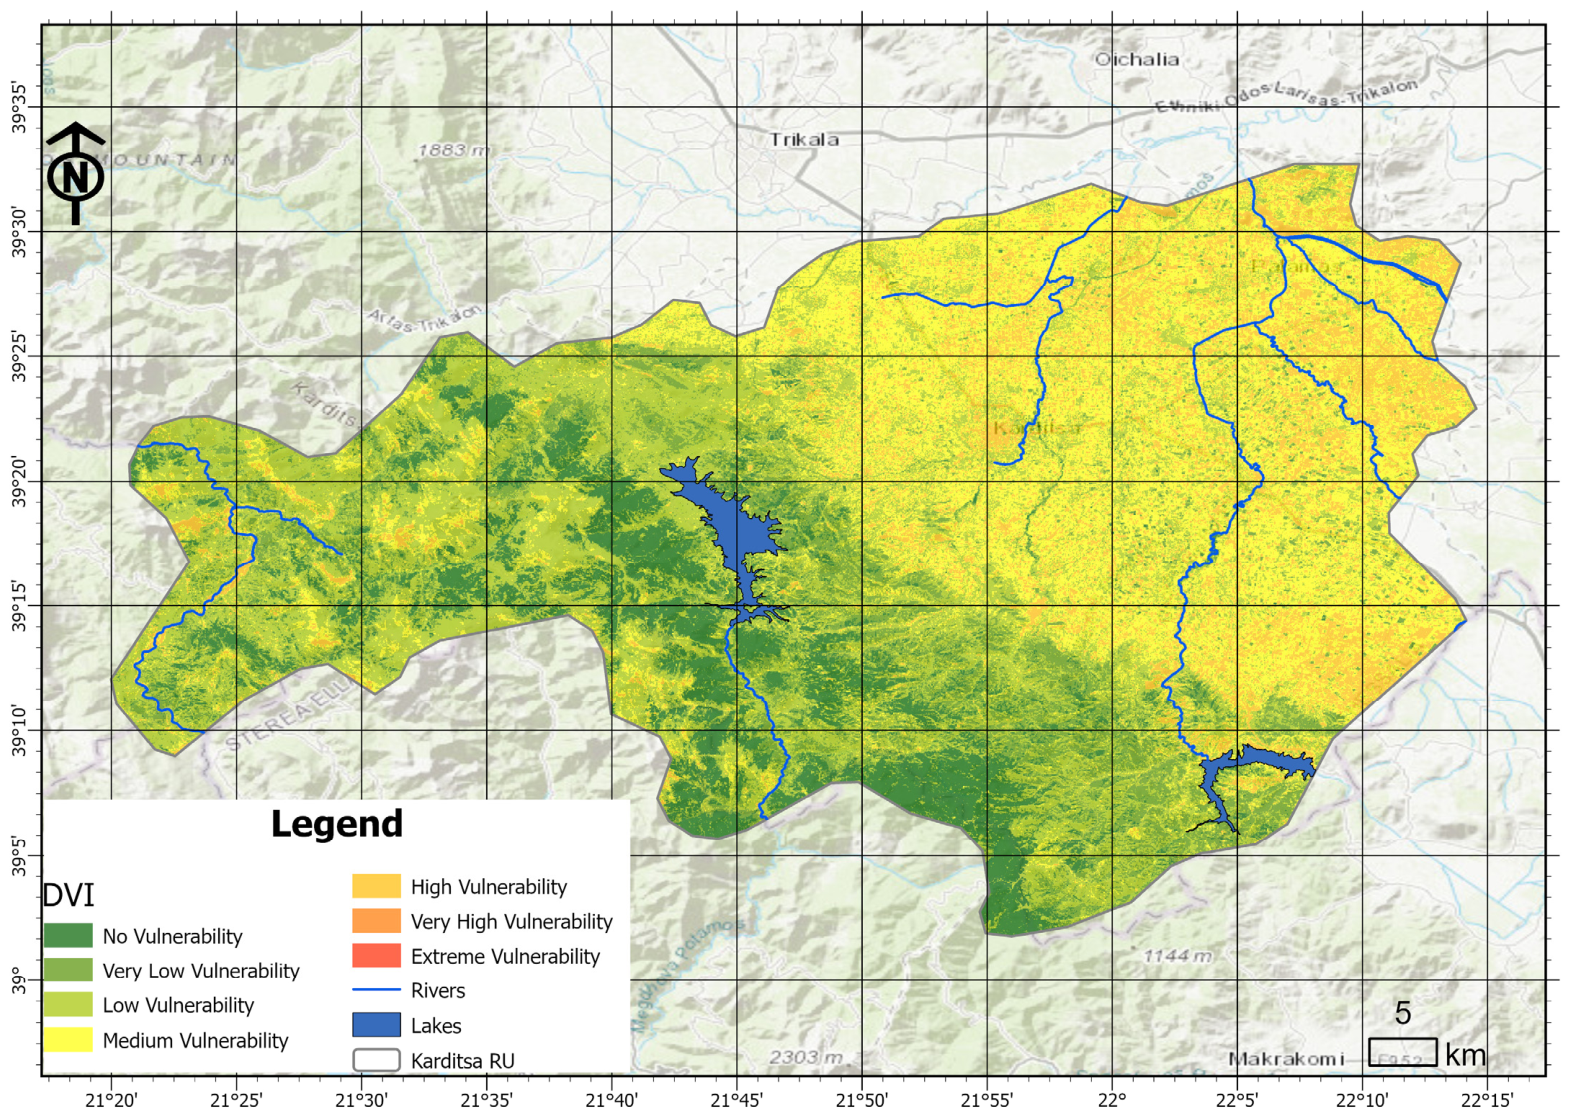
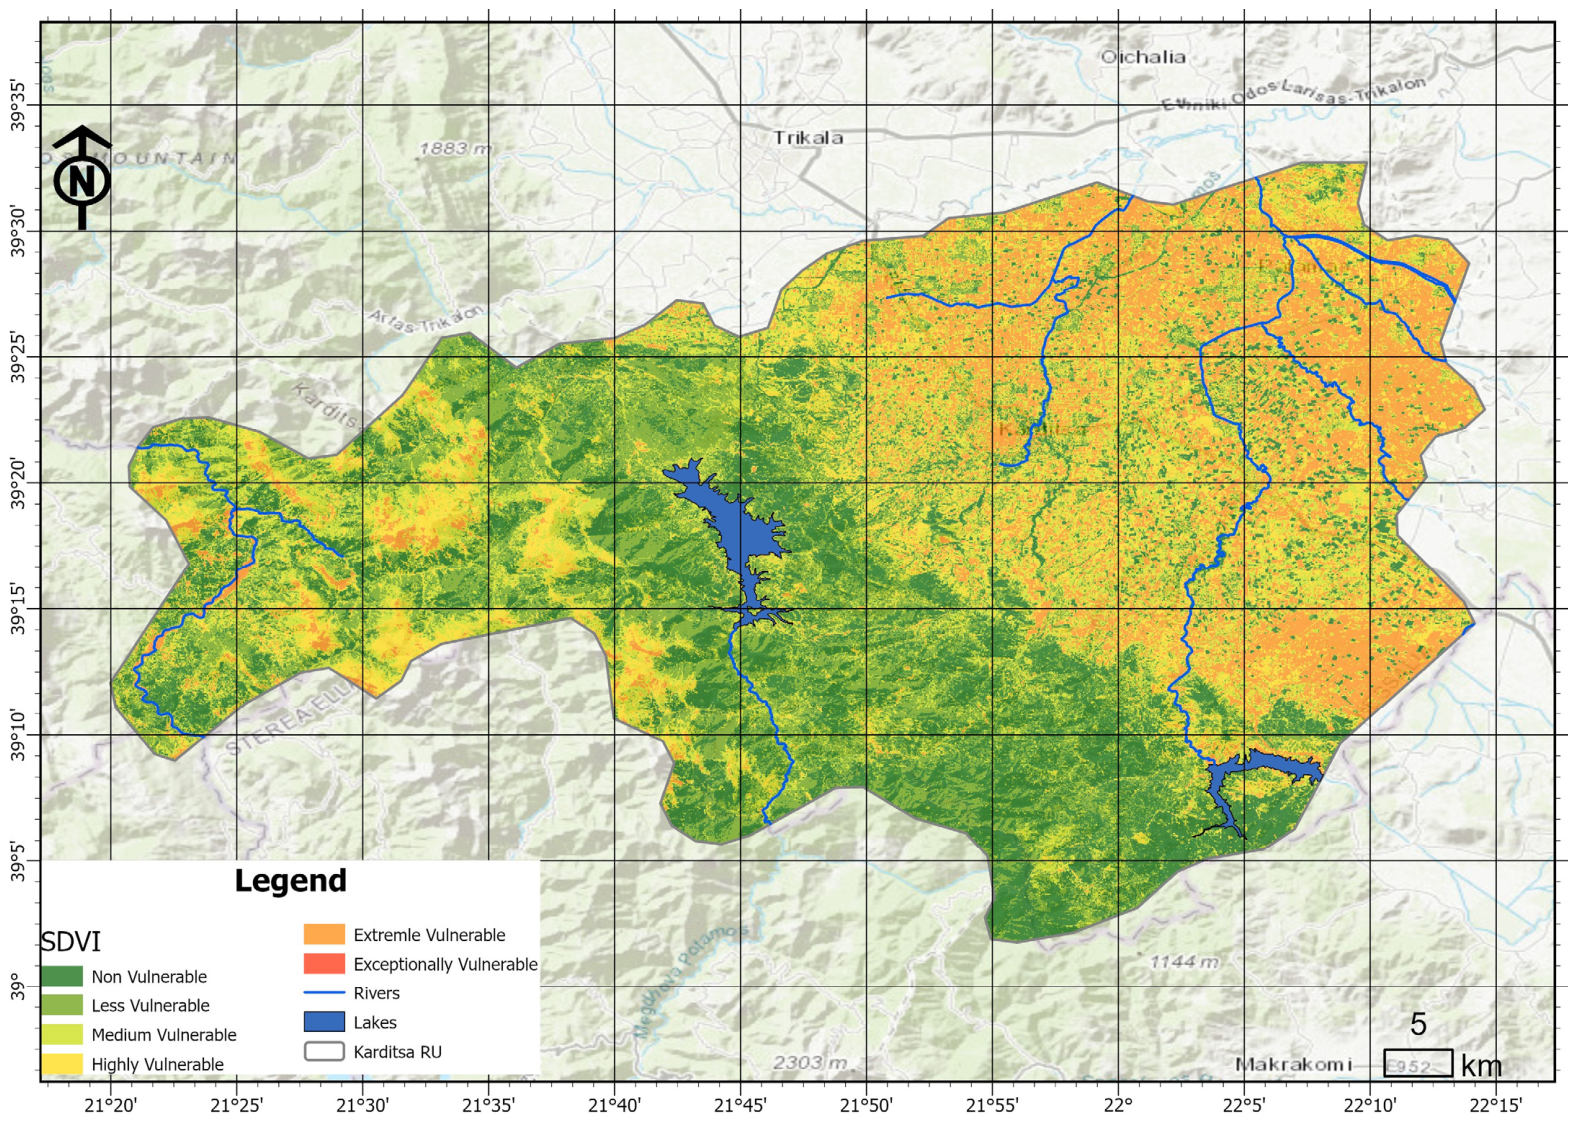
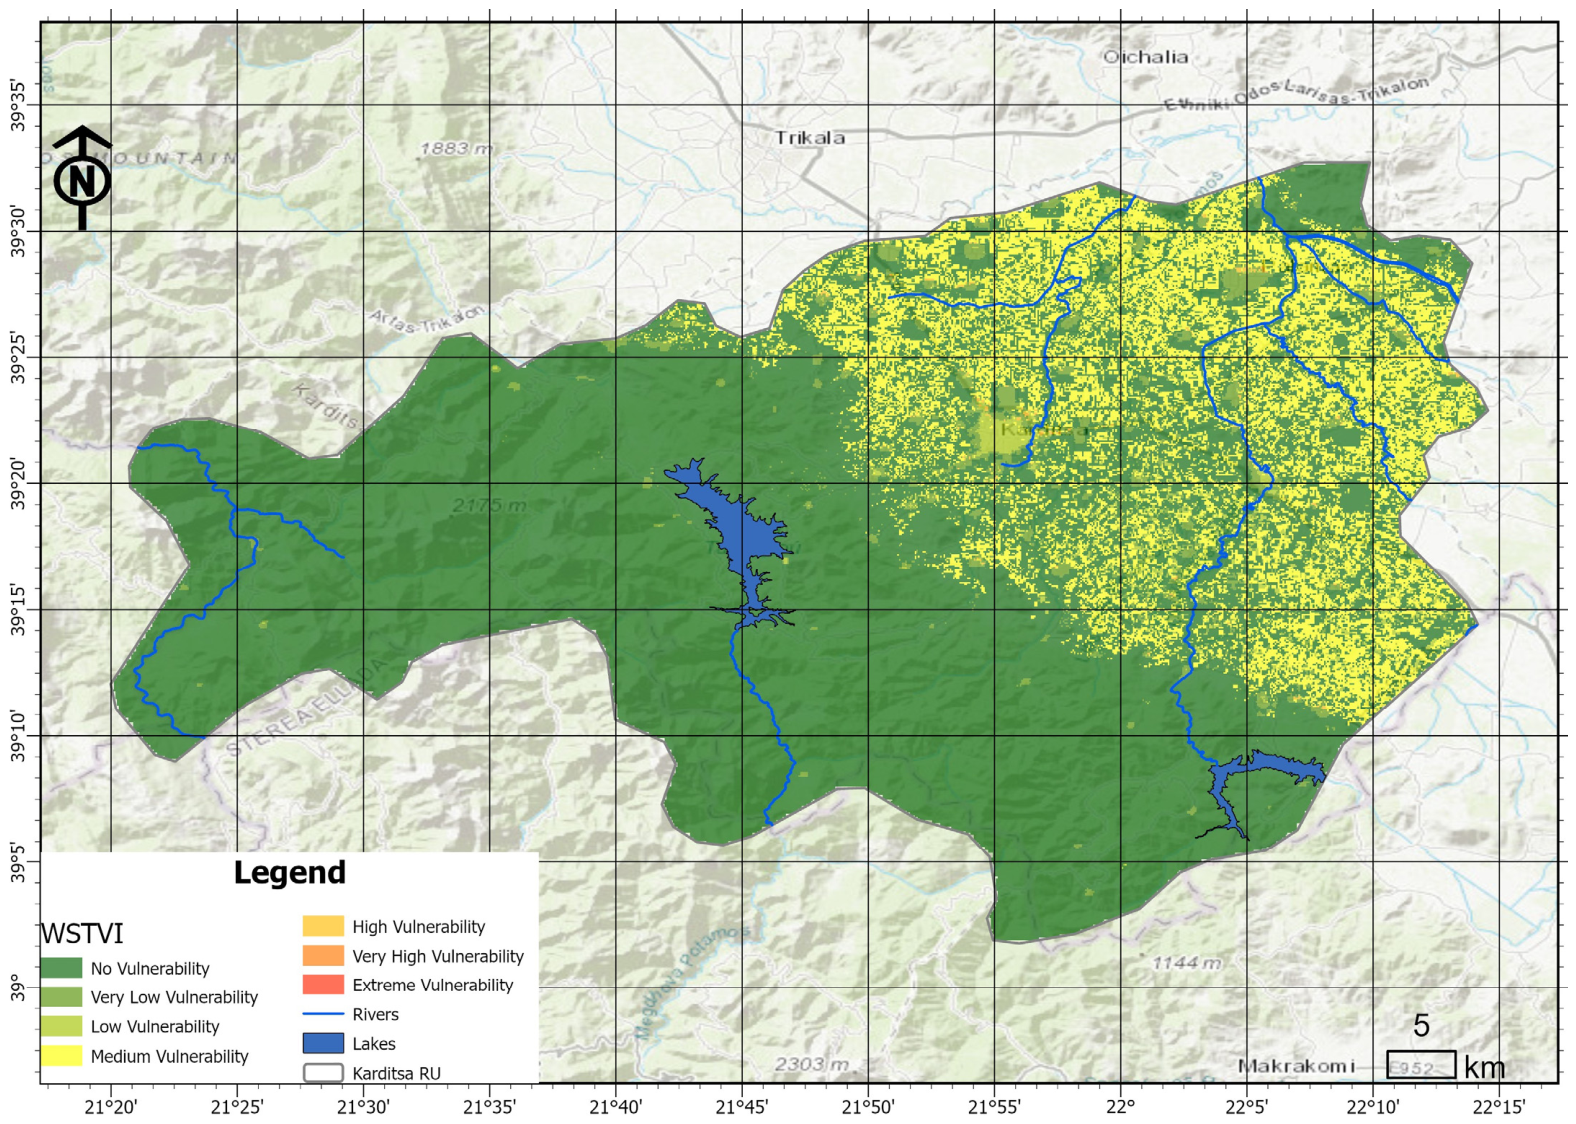
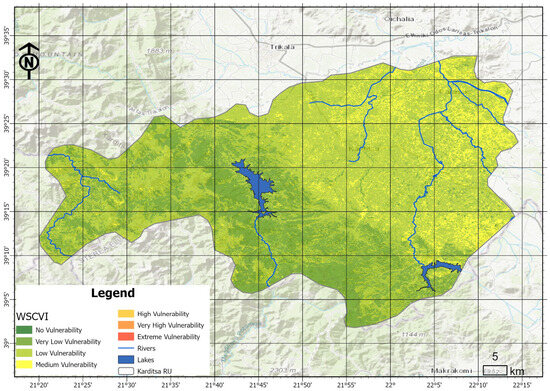
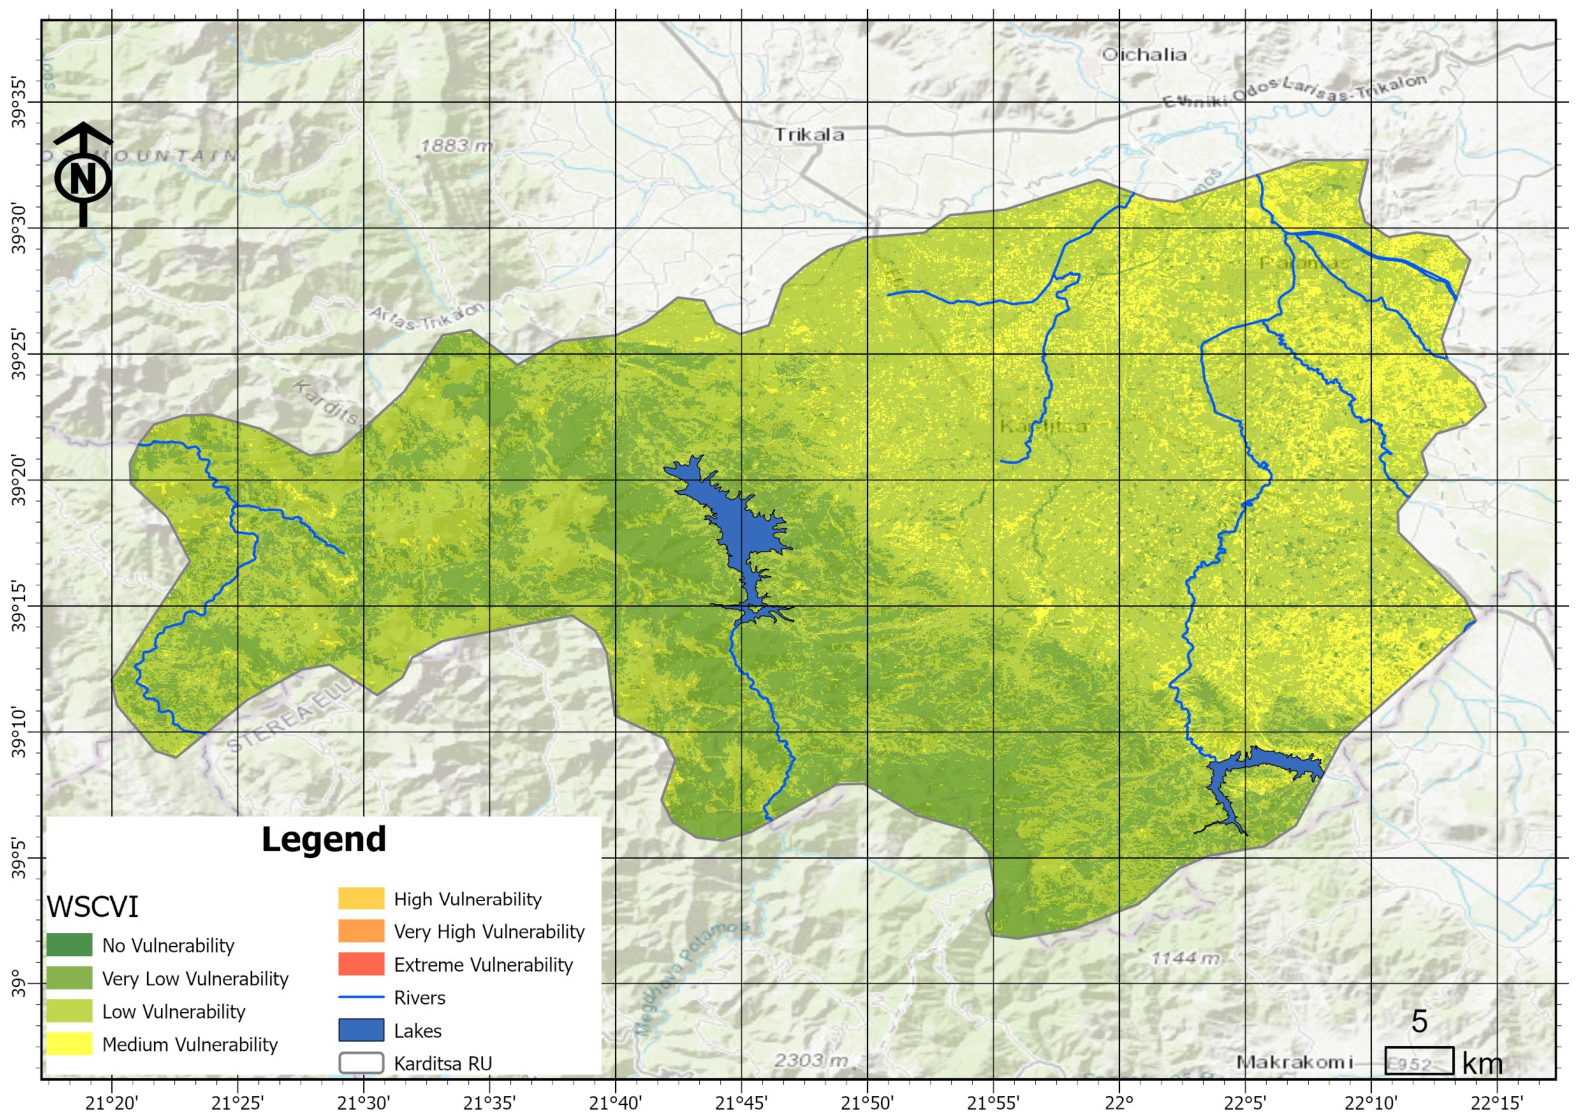
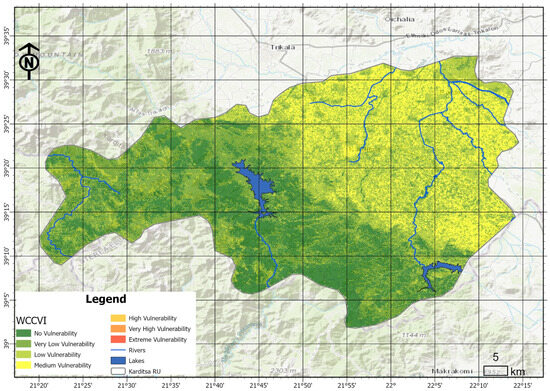
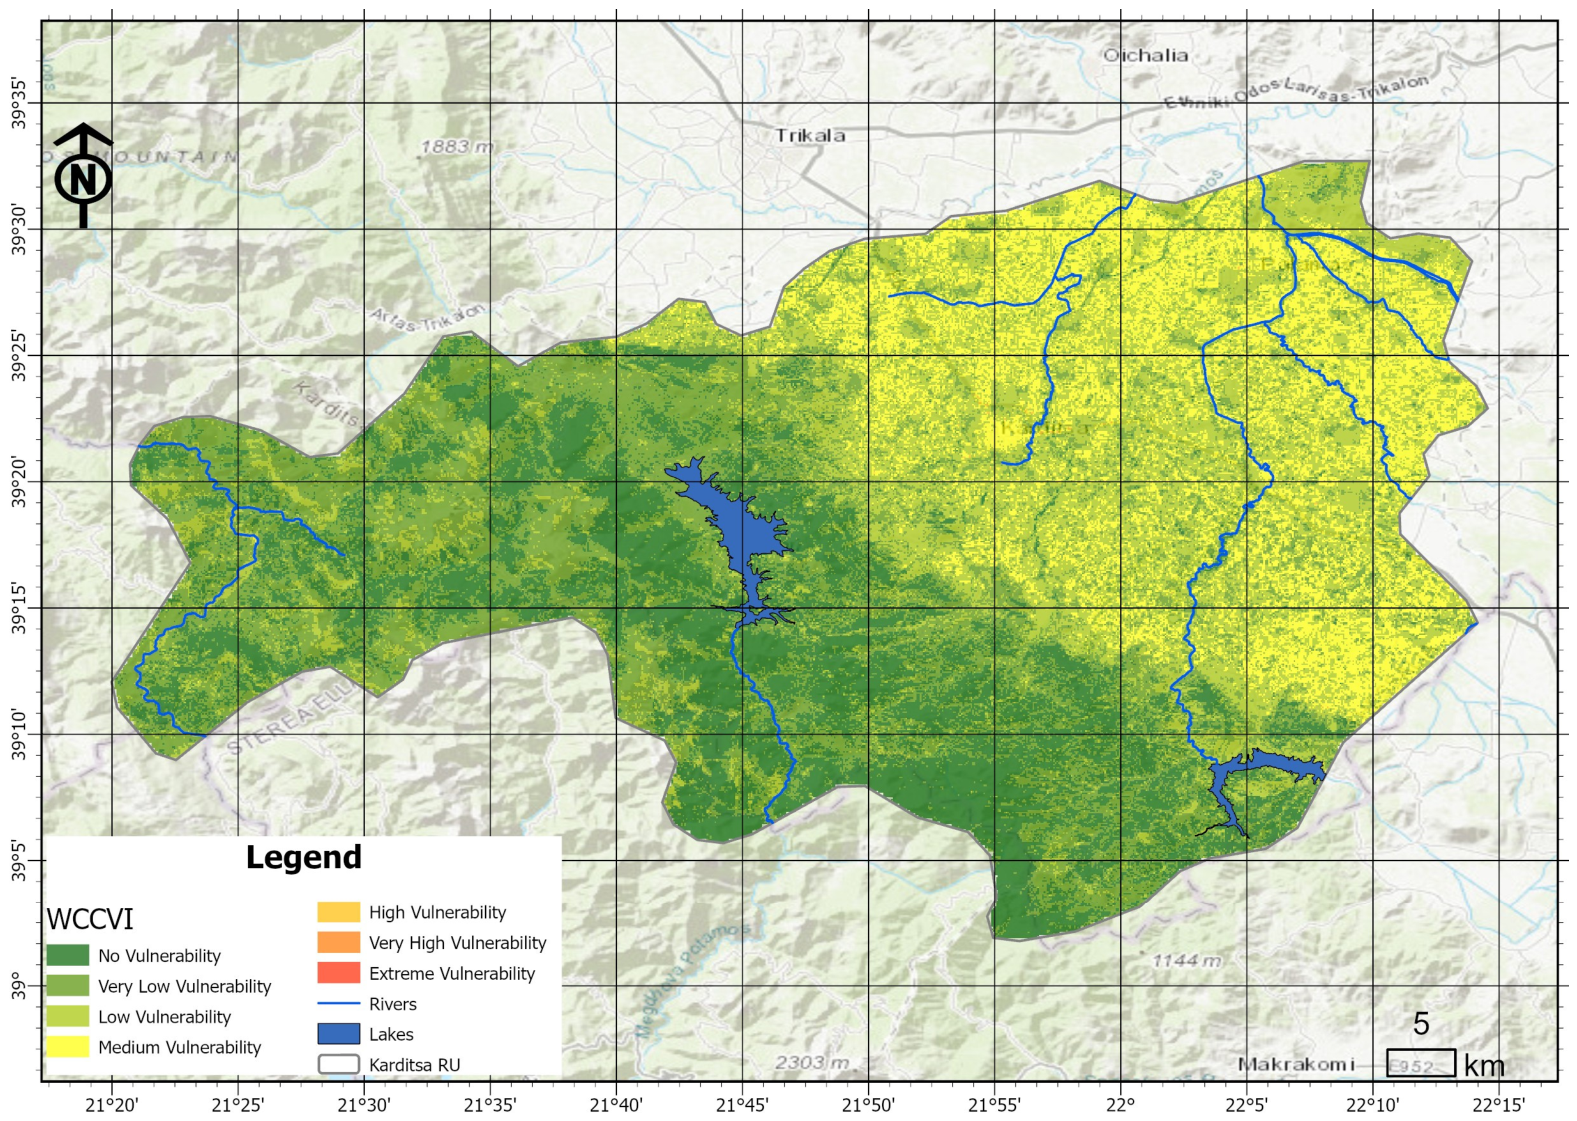
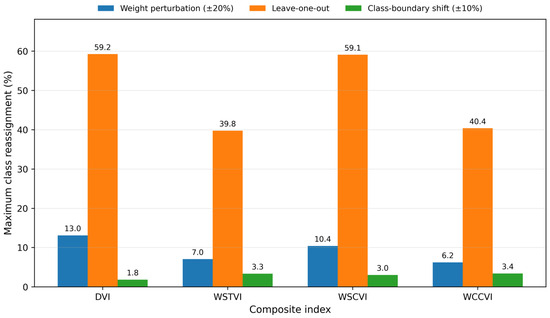
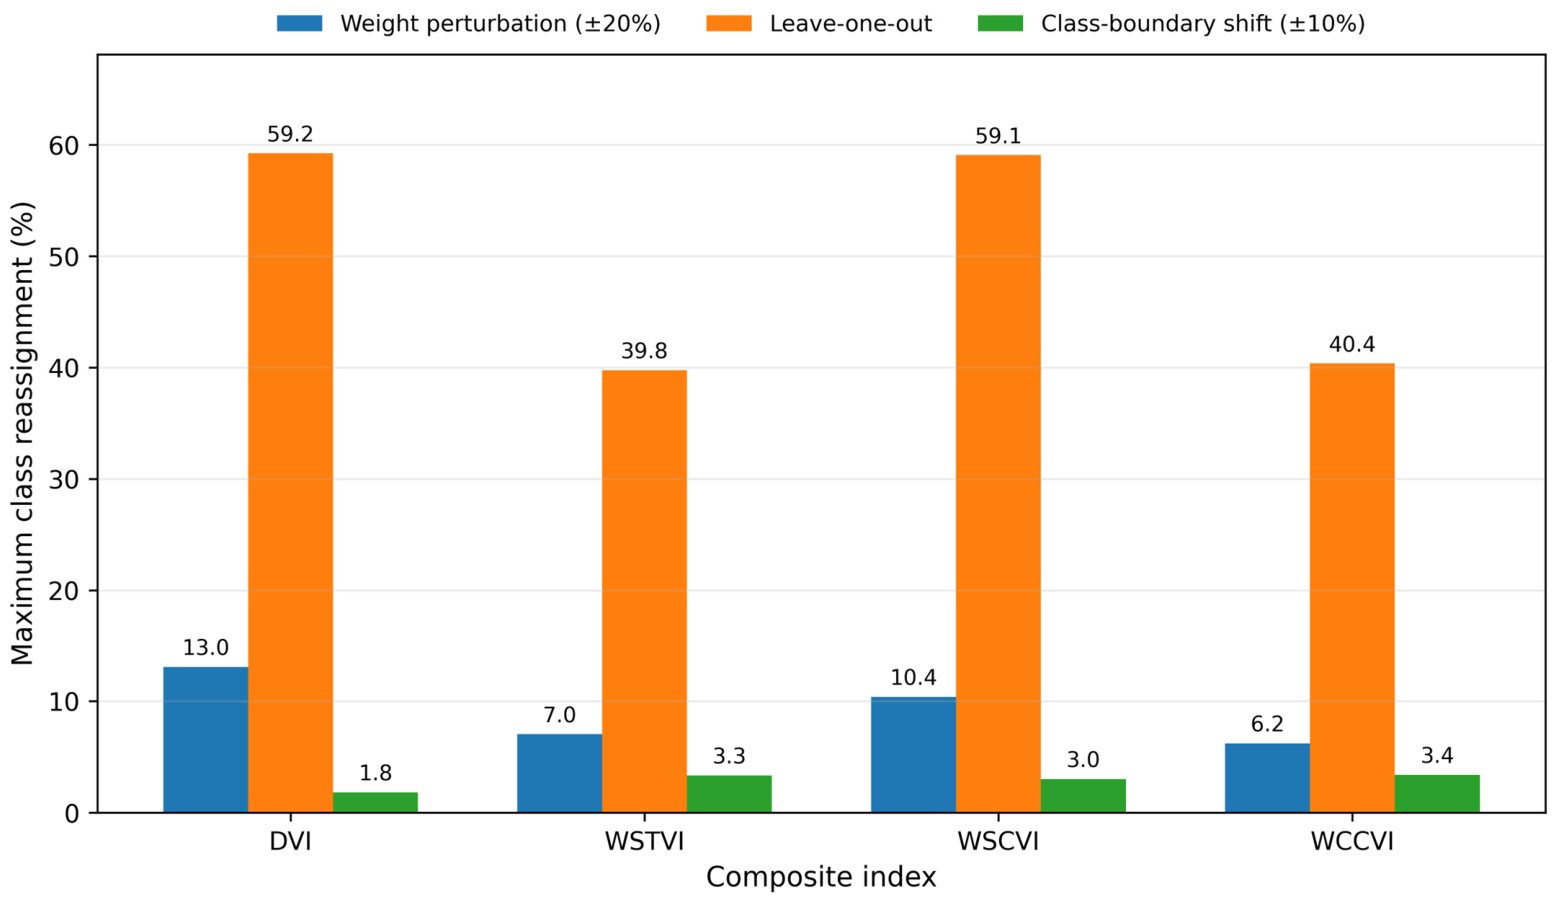

Disclaimer/Publisher’s Note: The statements, opinions and data contained in all publications are solely those of the individual author(s) and contributor(s) and not of MDPI and/or the editor(s). MDPI and/or the editor(s) disclaim responsibility for any injury to people or property resulting from any ideas, methods, instructions or products referred to in the content. |
© 2026 by the authors. Licensee MDPI, Basel, Switzerland. This article is an open access article distributed under the terms and conditions of the Creative Commons Attribution (CC BY) license.