


Abstract
Rapid urbanization across global South megacities has accelerated the overexploitation of urban aquifers, creating complex socio-hydrological crises that threaten long-term water resilience for a vast population. Conventional urban-water management frequently relies on uniform, city-wide regulatory mandates that fail to account for localized hydrogeological heterogeneities and the socio-economic drivers of private extraction. This study performed a seasonal assessment (post- and pre-monsoon) of groundwater levels (GWLs), across the National Capital Territory of Delhi, India, using a 13-year archival dataset (2010–2022) of 77 ‘common’ wells, with a sequential spatial–statistical framework. No statistically significant ‘seasonality’ was found in GWLs, except for isolated years. About 13% of the observations appeared as ‘deep outliers’, the call for more process-level hydrogeologic investigations. Spatial interpolation via the Inverse Distance Weighting (IDW) interpolation technique, alongside Global Moran’s I, Local Indicators of Spatial Association (LISA), and spatially Constrained Hierarchical Cluster Analysis (sHCA), revealed a recurrent spatial pattern: persistent, deep GWLs, within the fracture-dominated, low-yielding Alwar Quartzite (Delhi Ridge) of South and Southeast Delhi. The spatial clustering demonstrates the migration of the deep-GWL hotspots toward the unconfined alluvial aquifers of the Yamuna River floodplains to the east, threatening future baseflow stability. These spatial drawdown patterns represent a structural response to municipal Drinking Water Services Framework (DWSF) deficits, where intermittent supply and informal water markets incentivize the growth of more unregulated and unrestricted private pumping of groundwater. Achieving sustainable urban groundwater governance requires replacing blanket administrative mandates with a more data-driven, micro-zoned socio-hydrological framework across the city—combining area-specific extraction caps, economic instruments for geologically targeted aquifer storage and recovery, informal market regulation, and facilitating more participatory, community-based (Water users Associations, WUA) initiatives in the future to protect groundwater resources in Delhi. However, it requires specialized monitoring data, which is still largely lacking, and detailed investigations involving the aquifer hydrogeology and groundwater pumping patterns.
1. Introduction
Urban water security has emerged as a major concern in India [1,2], endangering a vast fraction of the population for health and well-being (UN Sustainable Development Goal 3), clean water and sanitation (UN SDG 6), and economic opportunities (UN SDG 9). According to the latest estimates of the NITI Aayog, a government think tank in India, at least 21 Indian megacities (population > 10 million) could face dire water shortages by 2030 [3,4]. To that end, there is a growing urgency to bolster the urban drinking-water supply framework (DWSF) to plan for providing clean and safe drinking water to all (UN SDG 3), while building resilient cities and communities (UN SDG 11). In this regard, groundwater reserves have become a key element in DWSF planning and decision making, especially where the DWSF services fail to meet growing demands [5]. This is especially critical in view of the remarks of [6] ‘This century is the century of cities’; underscoring an urgency to ensure a sustainable DWSF, one that caters adequate and safe drinking-water supplies to all.
India being the current global leader of groundwater extraction [7,8,9], groundwater plays a pivotal role promoting economic growth and development [7,10,11,12,13]. In recent years, groundwater has also emerged as a key component of the urban DWSF in several growing Indian megacities [14,15]. However, several studies have also reported on unregulated pumping of groundwater, leading to widespread declines in groundwater levels (GWLs) including the cities [16], including the National Capital Territory (NCT) of Delhi [17,18,19].
For Delhi, the capital city of India, groundwater extraction has reached the level of undermining future agendas of urban sustainable development [20,21,22,23,24], with the rate of groundwater extraction far exceeding that of natural recharge [22]. As a more confounding issue, Biswas and Gangwar [20] pointed out that the urban domestic-drinking-water crises in Delhi cannot be taken as a hydrogeological problem, but a socio-hydrological issue, brought upon by unregulated pumping by vast urban populaces, mostly in the informal settlement of the peri-urban areas. These areas lack sustainable municipal water supplies (e.g., piped connections, tanker services), thus relying heavily on alternate sources, such as groundwater [25,26]. Persistence of such a situation in Delhi could undermine the time-bound attainment of global sustainability targets, such as clean and affordable domestic drinking water for all (UN SDG 6), building sustainable cities and resilient communities (UN SDG 11).
In view of the above, we present a spatio-temporal evaluation of groundwater levels (GWLs) in the Delhi-NCT area based on archival records from the Central Ground Water Board (CGWB) for the pre-monsoon and post-monsoon seasons between 2010 and 2022 (we realize that dropping, or persistently deep, groundwater tables could raise undesired water quality issues (like naturally occurring, geogenic contaminant mobilization from deeper aquifer horizons) [27,28,29], that add to the domestic-drinking-water concerns for the urbanites (SDG 6: Clean water for all) and additional challenges for the urban authorities (SDG 11: Building resilient cities; SDG 3: Health and well-being). However, in this study, we solely focused on groundwater levels.). Utilizing this multi-decade municipal archive allows us to examine underlying temporal trends, that would be impossible to capture through short-term primary sampling. To address critical gaps in urban-water management, the narrative is developed, focusing on three specific aspects of groundwater in Delhi as follows:
- Temporal and Outlier Assessment: To evaluate inter-annual and seasonal variations in GWLs across Delhi while identifying the localized ‘outlier’ locations (monitoring wells) over the 13-year study period (2010–2022). For the outliers, the main idea was to identify regions in the city that have recorded persistent occurrences of deep GWLs observations that substantially deviate from the central tendency (median) for each year.
- Spatial Pattern Recognition: To quantify the evolving spatial structure and clustering of GWL depletion zones using sequential geostatistical modeling (IDW, Moran’s I, LISA, and sHCA).
- Socio-Hydrogeological Implications: To examine the impact of migrating groundwater depletion on the Yamuna River floodplains and identify structural deficits within the current urban drinking water services framework (DWSF) driving unregulated civic reliance on groundwater.
By strategically integrating the geostatistical tools with an analysis of urban-water governance, this study provides actionable, spatially customized baselines to assist regulatory authorities in managing sustainable urban-groundwater resources.
In the process, this research attempts to bridge the gap between theoretical hydrogeology and actionable municipal governance:
- Methodological Innovation: Rather than relying on isolated spatial tools, this study employed a four-stage, sequential geostatistical approach—beginning with the initial appraisal of GWL contour surfaces (Inverse Distance Weighted; IDW contouring), and moving on to more rigorous statistical techniques (Global Moran’s I), to pinpoint exact locations of GWL hotspots (LISA), and finally, an area-wise spatial appraisal for the water authorities by computing the sHCA. In the process, this research also depicts how these spatial structures (IDW, Global Moran’s I, sHCA) have evolved over time across the study area.
- Foundations for Data-Driven Decision-Making: Such a sequential framework of spatial analytics equips urban-water authorities with the mathematical proof required to confidently transition from city-wide ‘blanket’ policies to more focused policy enactment.
- Socio-Hydrogeological Aspects of Groundwater Pumping: The study departs from traditional, purely hydrogeological assessments, with its discourse on social, economic, psychological issues of a vast section of urban residents that rely on groundwater for their main domestic-drinking-water source. Moreover, it links the long-term (2010–2022) groundwater levels in Delhi to systemic infrastructural failures in the municipal Drinking Water Services Framework (DWSF), exposing how unreliable public services drive the behavioral economics of unregulated private pumping.
Overall, the spatial and statistical tools/techniques used in this study, due to their generic nature, could also be used in other cities in India or the world, with minor contextual modifications, to investigate the urban groundwater situation. In addition, we also briefly outline the areas within the urban groundwater sphere that calls for more monitoring for new data creation to support future research and policymaking.
2. Materials and Methods
The Delhi-NCT region (28°37′58″ N, 77°13′12″ E) borders the adjoining states of Haryana (North, West and South) and Uttar Pradesh (east-bound). It comprises 11 districts, with an approximate area of 1483 sq.km [30] (Figure 1a). By the 2011 census estimates, the Delhi-NCT has a total population of about 16,753,235, with urban populace comprising the majority. The population density is about 11,296, with about 87.6% literacy rate [30].
Figure 1.
(a) The districts, river Yamuna, and groundwater monitoring stations in Delhi-NCT region, and (b) prime groundwater used in Delhi-NCT region (Data source: CWGB [21]; Authors’ own illustration).
2.1. Urban Water-Supply Sources
The drinking water supply framework (DWSF) in Delhi-NCT comprise a diverse source, broadly falling under the following categories [31]:
- Various carrier-line channels (CLC), Delhi sub-branch (DSB), and Yamuna River, supplying a total of about 612 million gallons per day (MGD)
- River Ganga Canal and Murad Nagar Regulator (~254.08 MGD)
- Groundwater (Ranney wells and tube wells) (~117 MGD)
Minor sources include rainwater harvesting systems (RWH) and treated wastewater. Water is supplied to various parts of Delhi-NCT by the DJB through a network of 15,473 km of municipal water supply connections, aside from over 1000 government-hired water tankers [32]. In this backdrop, groundwater is a highly prized commodity in Delhi-NCT, furnishing about 50–95% of all domestic-drinking-water needs [21], while the rest goes mostly to feed the farm sector, sustaining lives and livelihoods of a large community of urban residents (Figure 1b). A large fraction of groundwater supplies are sourced to the municipal wells of the Delhi Jal Board (DJB), while the rest come from the numerous private wells, owned by the residents of the city, as their own self-supply domestic-drinking-water sources.
2.2. Broad Hydrogeological Makeup
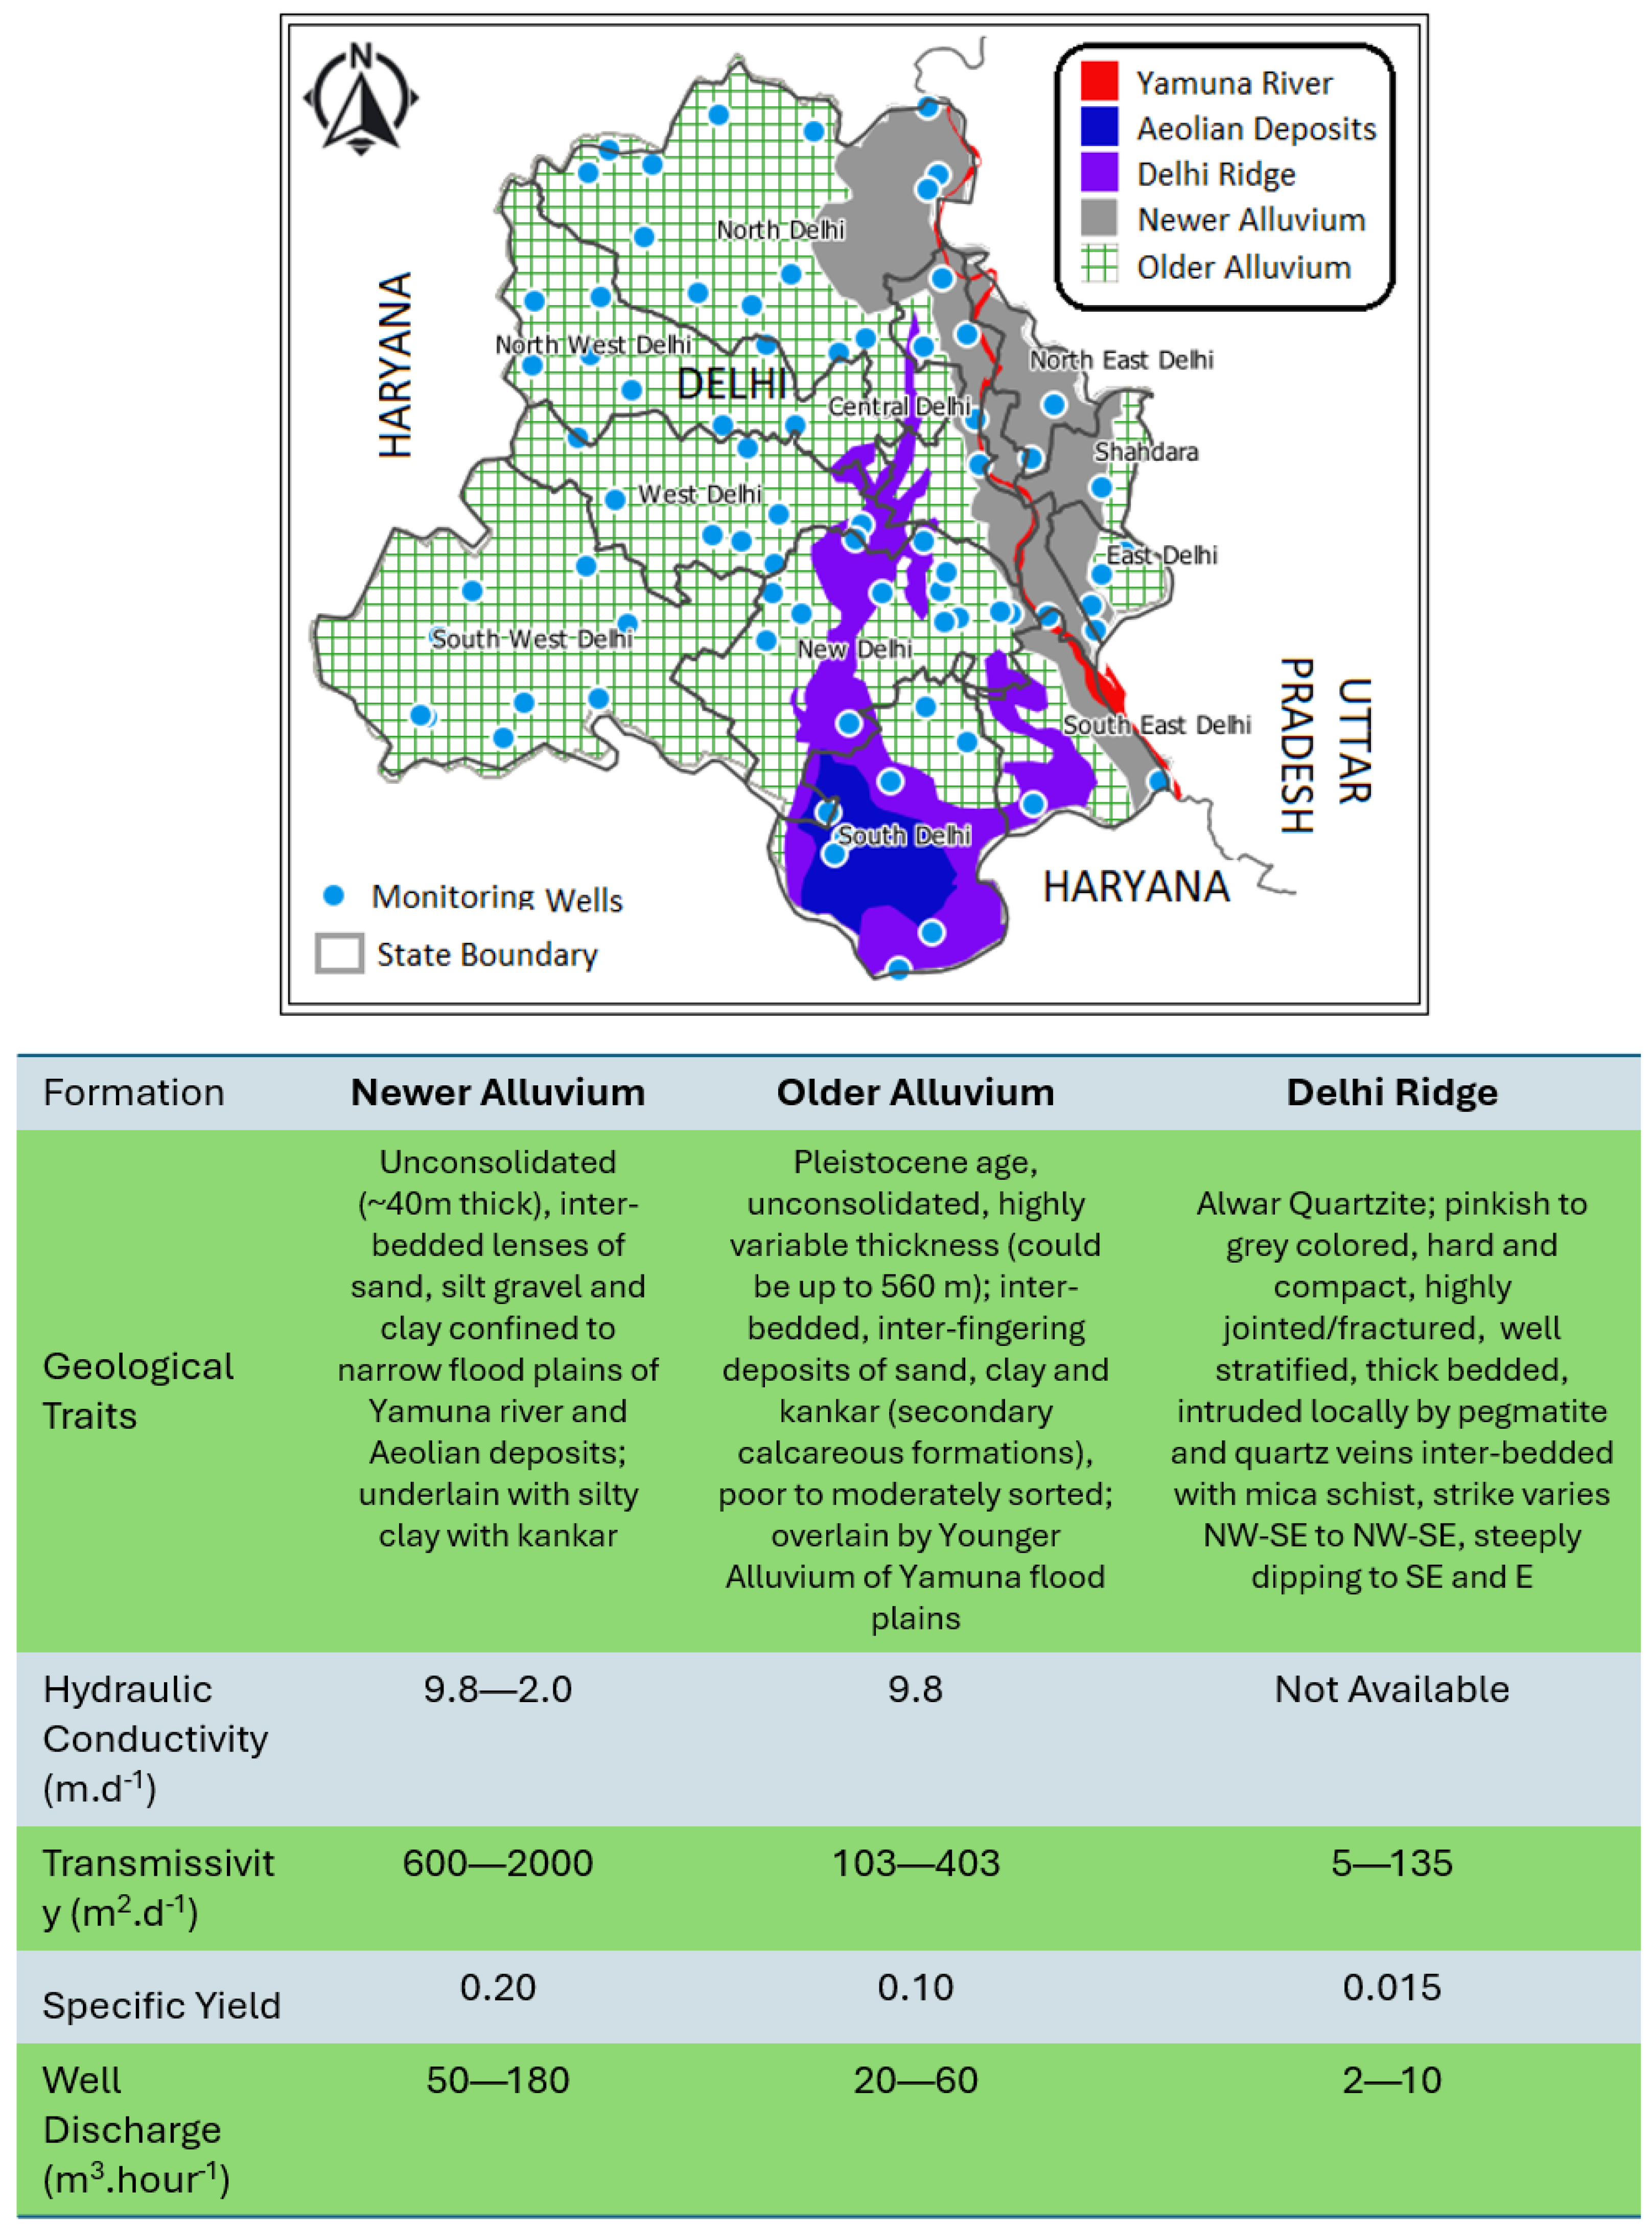
The geologic history of the Delhi-NCT region comprises of three main hydrostratigraphic units: (1) Delhi Ridge (Proterozoic age), to the south-southcentral parts, (2) alluvium deposits (older and new) of the Quaternary age, and (3) Yamuna flood plains (eastern flanks), and minor aeolian deposits, each with formation having distinct hydrogeological characteristics [16,22,33] (Figure 2). While the Delhi Ridge is represented by highly fractured–faulted formations (with secondary porosity), the alluvial deposits (e.g., new alluviums of Yamuna Flood Plains) form the main water-bearing formations producing large quantities of groundwater [34]. Quantitatively, the unconfined Quaternary Newer Alluvium along the Yamuna floodplains exhibits high hydraulic conductivity () and specific yield (Sy ≈ 0.10–0.20). In contrast, the Proterozoic Alwar Quartzite formations of the Delhi Ridge (underlying most of the southern parts of the city) are typically the low yielding formation, with secondary fracture porosity, low hydraulic conductivity (K < 0.1–0.5 m/day), and low specific yield (Sy < 0.01–0.03), which make them highly sensitive to localized over-pumping of groundwater.
2.3. Data Pre-Processing: Seasonal GWLs
While compiling the GWL information across Delhi, the primary objective was to ensure strict temporal completeness of GWL measurements across the study period for a well-by-well assessment. In other words, the vision was to conduct a reliable 13-year GWL temporal analysis (2010–2022) without introducing artificial temporal gaps or missing well information.
The initial data preprocessing and compilation stage was divided into three broad steps as follows:
- –
- Data Cleaning and Compilation: We constructed the 2010–2022 baseline dataset for Delhi by merging two separate regional blocks from the Central Ground-Water Board portal: the 1991–2020 tracking file [35] and the subsequent 2021–2025 monitoring block [36]. Isolating the pre-monsoon (March–May) and post-monsoon (October–December) water levels required extensive manual reconstruction. Because standard database software frequently misread the mixed text-and-date strings in the raw ‘data acquisition time column’, as the first step of data preprocessing, we manually partitioned the timestamps into individual day, month, and year components to ensure exact seasonal targeting.
- –
- Data Aggregation: Following this initial step, we ‘grouped’ the GWL readings by the months, on well-by-well basis for each year between 2010 and 2022, to obtain the seasonal GWLs. In effect, out of the broader CGWB observational grid across Delhi-NCT, a strict ‘temporal auditing filter’ was applied to eliminate station(s) with missing seasonal blocks, and/or altered spatial tracking coordinates between 2010 and 2022. In the process, we carefully scrutinized the data records, and excluded any monitoring station from subsequent analyses, that showed >10% of the quarterly GWL data missing.
- –
- Sample Size Selection: The above step of ‘filtering’, isolated a continuous baseline cohort of ‘common’ groundwater monitoring wells across the study area, that maintained uninterrupted pre-monsoon and post-monsoon records across all 13 consecutive years (2010–2022), providing consistent spatial–statistical representation across all 11 administrative districts and major hydrogeological units. Although, given the total area of Delhi, this set of 77 ‘common wells’ might appear small, but it also offered us the confidence to carry out an uninterrupted (well-by-well, year-by-year), high-quality pre-monsoon and post-monsoon analysis strength throughout the entire 13-year study period.
In the final stage of data preprocessing, we compiled this well-level data into a Geographic Information System (GIS) environment to perform the subsequent quantitative and spatial analysis (IDW interpolation, Moran’s I/LISA, and hierarchical cluster analysis (sHCA)).
2.3.1. Temporal Analysis of GWLs
To assess the changes in GWLs on a (1) year-on-year basis and (2) within year (between pre- and post-monsoon seasons), we performed the Mann–Whitney U Test [37]:
where
X and Y = Median Groundwater Levels (GWLs)
n and m = Sample sizes of X and Y
We identified any ‘aberrant’ GWL observations (too deep or too shallow), and we computed the outlier values for each seasons using the following equations:
‘Shallow’ Outlier (too shallow GWLs) = Quartile 1 − 1.5 × [Quartile 3 − Quartile 1]
‘Deep’ Outlier (too deep GWLs) = Quartile 3 + 1.5 × [Quartile 3 − Quartile 1]
‘Deep’ Outlier (too deep GWLs) = Quartile 3 + 1.5 × [Quartile 3 − Quartile 1]
2.3.2. Inverse Distance Weighted (IDW) Interpolation
To obtain the initial clue into the spatial structure in water levels, we deployed the Inverse Distance Weighted (IDW) technique, with a power weight of p = 2, to contour the GWLs across the study for both seasons. To minimize ‘edge effects’ and artificial data skewing along the state borders of Haryana and Uttar Pradesh, the IDW interpolation parameters utilized an optimized, variable search radius, and the final mapping outputs were strictly clipped to the Delhi-NCT administrative boundaries. In this regard, the Yamuna River axis functions as a major natural hydrogeological boundary; the sharp spatial gradients observed near the river corridor capture actual localized recharge and drainage dynamics rather than being artifacts of interpolation error.
The IDW interpolation accuracy was assessed using Leave-One-Out Cross-Validation (LOOCV). Across the benchmark years (2010, 2016, and 2022), the Root Mean Square Error (RMSE) values ranged from 2.15 m to 3.35 m, while the Mean Absolute Error (MAE) ranged from 1.58 m to 2.51 m. The MAE remained consistently lower than the corresponding RMSE (MAE was about 60–70% of the RMSE) across all years, confirming normal residual distributions without extreme spatial distortions. Seasonally, pre-monsoon errors were slightly elevated, probably due to aggressive summer extraction, resulting in localized cones of depressions in groundwater levels. Post-monsoon recharge moderated regional groundwater table gradients, lowering interpolation error. The minor upward error drift observed between 2010 and 2022 reflected expanding head differentials between the hard-rock ridge areas and adjacent alluvial plains.
Figure 2.
Broad layout of the principal hydrogeologic formations across Delhi-NCT (Authors’ own illustration based on various sources including [16,22,34,38]).
2.3.3. Global Indicator of Spatial Autocorrelations in GWLs
Next, the degree of spatial autocorrelation/clustering in GWLs over the study period (2010–2022) was assessed by computing Global Moran’s I, using well-level GWL information. The latter was computed as follows [28]:
where
N = Number of spatial units (groundwater wells)
xi = Water level at groundwater well ‘i’
xj = Water level at groundwater well ‘j’
x = Spatial mean
wij = Weights of spatial matrix, given as below
Theoretically, the values of Global Moran’s I could range from −1 (negative spatial autocorrelation), to 0 (random pattern), to +1 (positive spatial autocorrelation among water levels in adjacent wells) that offer an estimate of the spatial structure and how it evolved over time.
2.3.4. Local Indicators of Spatial Association (LISA) in GWLs
While Global Moran’s I evaluates the overall presence or absence of spatial clustering across the study area, it fails to isolate specific spatial locations or patterns of these clusters. To overcome this limitation and pinpoint localized spatial patterns of groundwater level (GWL) depletion and recovery, Local Indicators of Spatial Association (LISA), was computed for each monitoring well [28,39]:
where
zi = GWL at each monitoring location
= Mean GWL calculated across all locations (N = 77)
wij = Spatial weight matrix defining the topological proximity between ‘i’ and ‘j’ locations
s2 = Standard variance of all GWLs across the network, formulated as:
The LISA produces maps, classifying association patters into five distinct spatial clusters (p < 0.05):
- I.
- High–High (Hotspots): Monitoring locations with deep GWLs surrounded by adjacent wells with deep GWLs
- II.
- Low–Low (Coldspots): Monitoring locations with shallow GWLs situated next to wells with similarly shallow water tables
- III.
- High–Low (Spatial Outlier): Isolated deep GWL wells surrounded by shallow GWL
- IV.
- Low–High (Spatial Outlier): A shallow GWL well encircled by deep GWLs
- V.
- Not significant = The LISA also identifies location, where no ‘significant’ spatial clustering (p < 0.05) is observed among the GWLs
To prevent false-positive spatial hotspots resulting from simultaneous hypothesis testing across N = 77 locations, empirical p-values were adjusted using the Benjamini–Hochberg False Discovery Rate (FDR) procedure at a significance threshold of α = 0.05.
2.3.5. Spatial Hierarchical Cluster Analysis (sHCA)
To further assess the temporal changes in GWLs across the parts of the city, we performed hierarchical cluster analysis (sHCA) using well-level GWL information for 2010 and 2022. The idea was to obtain a holistic insight into the state of groundwater resources using integrating multiple parameters. The HCA was performed using the Ward’s Minimum Variance algorithm [29,40] as follows:
Prior to running the cluster algorithm, multi-decadal depth-to-water time series were Z-score standardized (μ = 0, σ = 1). This eliminated baseline static-water elevation bias and ensured clustering was driven purely by coherent depletion rates and seasonal trajectory trends. The hierarchical cluster analysis (HCA) was performed by the Ward’s Minimum Variance algorithm using the squared Euclidean distance [18,41].
The Ward’s method tends to minimize the total intra-cluster variances as follows:
where ESS = Error Sum of Squares
xi = Score of ith entity.
Alongside, squared Euclidean distance was computed to determine the total sum of squared deviations from the mean of each cluster [41]:
where a = Squared Euclidean distance
rth, sth = Rows of the data matrix ‘x’ will be denoted by (xr1, xr2, xr3…xrp) and (xs1, xs2, xs3…xsp), respectively. These two rows correspond to the observations on two objects for all p variables. The quantity will be referred to as the squared Euclidean distance.
The clusters were tested for statistical significance when Dlink/Dmax × 100 < 50. The HCA outputs were presented in the form of spatial district maps across Delhi-NCT.
3. Results
3.1. GWL: Seasonality and Variability
Between 2010 and 2022, the GWLs varied between 0.45 and 67 m below ground level (mbgl). The median GWLs for the pre-monsoon season ranged between 6.82 and 12.5 mbgl, while that for the post-monsoon ranged between 8.01 and 13.06 mbgl (Figure 3). The Mann–Whitney U test results indicated absence of any statistically discernible, and consistent seasonal pattern in the median GWLs over the study period (2010–2022), excepting in few isolated years. For example, the pre-monsoon GWLs were deeper (p < 0.001) than that of post-monsoon in 2010 (median of 9.72 and 7.35 mbgl, respectively, in the pre-and post-monsoon seasons), 2013 (9.98 and 8.01 mbgl, respectively), and 2017 (11.89 and 8.76 mbgl, respectively), which is hydrogeologically expected—groundwater water levels are deeper before the rainy events, while ‘recovering’ through the months following the rains (i.e., post-monsoon season).
Figure 3.
Distribution of GWLs in the pre- and post-monsoon seasons over the years. NOTE: Values on the y-axis are presented in reverse order from the top to denote water levels in meters below ground level (mbgl); for each year, p-values represent the Mann–Whitney U test results performed between the seasons, with significant differences (0.0001 < p < 0.05) in median groundwater levels between seasons for each year are marked by red; ‘outliers’ for each season are given by hollow spheres. (Data source: various CGWB yearbooks for Delhi-NCT; Authors’ own illustration).
However, the Mann–Whitney U test results also revealed that in 2014, the median post-monsoon GWL (9.90 mbgl) was deeper (p < 0.0001) than the corresponding pre-monsoon period (pre-monsoon GWL (8.11 mbgl), which counters the general observation: GWLs are shallower after rains (natural recharge of underlying aquifers) than before them. Such ‘anomalous’ behavior in 2014 could have resulted due to a confluence of anthropogenic and natural factors:
- Urbanization Factor (concretization): Rapid, unplanned land-use and land-cover (LULC) changes have replaced natural pervious recharge zones with highly impervious built-up infrastructure [42,43]. This widespread ‘surface sealing’ potentially diverts intense monsoon precipitation into immediate surface runoff, reducing opportunities of infiltration required to replenish unconfined systems [34].
- Social Factor (unregulated groundwater pumping): A large fraction of the urban households in Delhi relies on groundwater through private pumping [44]. This pumping process operates year-round, including post-monsoon times as well, overwhelming the recharge. Because the rainfall is converted to surface runoff rather than infiltrating into the ground, extraction rates outpace natural recharge by over 127% in some blocks, pushing water tables lower by the end of the year [43].
- Irrigation Abstraction: Parallel time-series studies in neighboring parts of the NCR [45], demonstrate that intensive rice-wheat cropping cycles cause the post-monsoon water level decline rate (≈0.267 m/year) to outpace the pre-monsoon decline rate (≈0.228 m/year), proving that post-monsoon stress can be worse than pre-monsoon stress in high-demand pockets.
- Lithological Factor (hydrogeological lag): Another possibility could be that, the underlying Alwar Quartzite of the Delhi Ridge (highly fractured with secondary porosity), exhibits anisotropic hydraulic conductivity [33,46]. Under the circumstances, for the infiltration of surface water (e.g., urban stormwater runoff), through the unsaturated zone, to drip down and replenish the underlying aquifer systems, could have ‘lag’ periods [47]. In other words, for areas with thicker vadose zone (20–40 m below ground level), the transit time of the infiltration wetting front could be significantly prolonged. Consequently, standard post-monsoon monitoring schedules (October–December) capture a time window when the water tables continue to decline under the influence of delayed systemic response—just prior to the physical arrival of the vertical recharge pulse. As a result, the post-monsoon GWLs reveal the peak of cumulative summer overdraft, while the pre-monsoon water levels reflect the delayed arrival of the previous year’s monsoon recharge.
The above mechanisms are operational across distinct spatial domains: extensive surface sealing and urban imperviousness dominate the built environment, suppressing direct infiltration and diverting rainfall as overland, stormwater runoff. On the other hand, the hydraulic lag, in the unsaturated vadose zone, operates mainly in the peri-urban areas of the city (yet not extensively paved with impervious built-up covers) where deep water tables (20–40 mbgl) delay diffuse percolation by several months.
The box-and-whisker plot (Figure 3) represented the entire spectrum of GWL variability during the study period. In general, over time, the GWLs have become ‘variable’ for Delhi, with the water levels ranging (computed as maximum − minimum GWL depth) from about 31 to 35 mbgl between 2010 and 2014, to about 45 to 52 mbgl between 2016 and 2020, and about 40 ± 3 mbgl in 2022. Variability appeared higher in pre-monsoon (wider spreads) than post-monsoon, probably due to rainfall/infiltration processes. On a well-by-well basis, each year, about 70–77% of the monitoring wells occurred within the shallow (<10 mbgl) and intermediate (10–20 mbgl) ranges, while about 10%, always falls within the deeper category (20–40 mbgl) (Figure 3).
3.2. GWLl Changes
3.2.1. Temporal Heterogeneity
A year-on-year, well-by-well comparative assessment of groundwater levels (GWLs) between 2010 and 2022 revealed stark, multi-scale spatio-temporal heterogeneity across the National Capital Territory (NCT) of Delhi. Out of baseline monitoring wells, 29 locations exhibited statistically significant piezometric drawdowns in 2022 relative to 2010 () (Figure 4). Within this declining cohort, 19 monitoring locations experienced moderate water table declines exceeding 1.15 m whereas the remaining 10 locations suffered severe, pronounced drawdowns exceeding 4 m (p < 0.01). This severe depletion group is geographically distributed across key urban and peri-urban centers, including the Bankner, Birla Mandir, CBD Shahdara, Chilla Sarod, Gadaipur, Gokulpur, Delhi Cant. (Cvd Depot Cant. Deep), Khera Kalan, Kabul Lines, Sultanpur IMS, and Tagore Garden sites. For the fraction of the urban populations directly reliant on self-supplied groundwater (private well) for daily domestic-drinking needs, such GWL drops could severely undermine household water security (SDG 6), besides the infrastructure operational lifespans. On the other hand, 48 monitoring locations registered net GWL recoveries in 2022 relative to 2010. Notably, at the Shashtri Park, Shikarpur, Safdarjung, Jamali Kamali, J N U, Jaunapur, Nizampur, and Daulatpur monitoring stations, water tables rose by more than 5 m (p < 0.05). This pronounced spatial dichotomy highlights a bifurcated hydrogeological regime across the capital, where localized recovery and severe overdraft co-occur in close spatial proximity.
Figure 4.
Monitoring station-wise heterogeneity in GWLs. Note: +ve values on the X-axis represents the stations where GWLs dropped in 2022 w.r.t 2010 (Data source: Various CGWB yearbooks; Authors’ own illustration.
3.2.2. GWL Outliers
From the water regulatory perspective (e.g., Delhi Jal Board (DJB), Central Ground Water Board (CGWB), and various Delhi city Municipal Authorities), the persistent occurrence of localized extreme drawdowns presents a critical resource-management challenge. Quantitative-outlier screening utilizing interquartile-distribution thresholds (Equation (2)) revealed that about 13% of the wells in monitoring network () consistently were deemed as ‘deep outliers’—places in the city where the GWLs occurred at high depths (>35 mbgl) throughout the entire 13-year study period (Figure 5):
Figure 5.
Stations labeled as ‘deep outlier’ observations (following Equation (2)) for the pre- and post-monsoon seasons over the study period (2010–2022). NOTE: Values on the y-axis are presented in reverse order from the top to denote water levels in meters below ground level (mbgl CGWB yearbooks for Delhi-NCT; Authors’ own illustration).
- Asola (Southeast district)
- Bhatti (South Delhi district)
- Gadaipur (South Delhi district)
- Hauz Khas (South Delhi district)
- Jaunapur (South Delhi district)
- Jheel Khoh (South Delhi district)
- Mayapuri (West Delhi district)
- Pushp Vihar (South Delhi district)
- Shekwati Line (New Delhi district)
- Sultanpur IMS (New Delhi district)
The geographic clustering of these persistent deep outliers provides vital hydrogeological context for regional management. The overwhelming majority of these extreme depletion nodes are anchored in the South and Southeast districts of Delhi—geological domains underlain by the Proterozoic Alwar Quartzite of the Delhi Ridge (Figure 2). Characterized by dense hard-rock lithology with secondary fracture porosity, low transmissivity, and minimal hydraulic conductivity, these quarzitic formations possess inherently restricted storage capacities and slow vertical recharge kinetics. When subjected to intense, unregulated private extraction driven by systemic municipal Drinking Water Services Framework (DWSF) deficits, these hydrogeologically constrained units experience severe cone-of-depression deepening. Consequently, these outlier trends represent not statistical noise, but a structural socio-hydrological response: physical hydrogeological limitations coupled with unmitigated localized extraction.
These physical insights highlight that GWL concerns cannot be addressed with blanket policies, which is still the common practice of the urban-water authorities, but will require more targeted interventions:
- Establishing Mandatory Pumping Capping Limits: Institutional enforcement (via DJB and CGWB) of strict, metered volumetric abstraction limits targeted specifically at localized high-density extraction clusters and persistent deep outlier zones (>35 mbgl).
- Stricter Well-Drilling Scrutiny and Permitting Controls: Directing strict regulatory oversight toward new borehole approvals in hydrogeologically vulnerable zones, strictly prohibition of unmitigated deep drilling within low-transmissivity hard-rock formations, and sensitive clay-lens alluvial micro-environments.
Overall, persistent occurrence of GWLs at deeper geologic horizons in certain areas of the city should be investigated an integrated fashion, incorporating the urbanization patterns (e.g., temporal growths in the relative percentages of impervious/built-up to natural surfaces, as well as inherent hydrogeological makeup of the underlying aquifer). This is necessary for drafting targeted policies for these regions, to protect groundwater resources from over-depletion.
3.3. GWL: Underlying Spatial Structure
3.3.1. Inverse Distance Weighted (IDW)
Spatial contouring, using the IDW approach, indicated a distinct north–south divide in GWLs across Delhi-NCT (Figure 6a–c). For example, shallower GWLs (<10 mbgl) were more common in the north and northwestern districts, while the deep (>20 mbgl) and deeper (>40 mbgl) GWLs were concentrated more in the south, southeast, east, and New Delhi districts. From hydrogeologic perspectives, such spatial heterogeneity in GWLs across the city reveals fundamental differences in subsurface aquifer properties (Figure 2) [16,34]. The southern parts, characterized by the deep and deeper GWLs, are mostly underlain by the Alwar Quartzite of the Delhi Ridge—intensely folded and faulted, having mostly secondary porosity, having low specific yield, hydraulic conductivity, transmissivity, and average well discharge. Moreover, the Delhi Ridge, located at a higher elevation than the rest of area, acts as a regional ‘water divide’, marked by ‘diverging’ groundwater flow patterns on the east and west. On the other hand, the north and northwest parts are underlain by the alluvial formations [22] that have ‘better’ hydrogeologic properties (higher transmissivity, hydraulic conductivity).
Figure 6.
Contour plots depicting spatial patterns of GWLs (meters below ground level, mbgl), for pre- and post-monsoon in (a) 2010, (b) 2016, and (c) 2022. NOTE: Open circles represent monitoring locations; values in the parantheses indicate apprroximate geographic area of Delhi-NCT under corresponding contour interval, also showing the district boundaries (white) and Yamuna River (dark blue, east side) (Data source: Various CGWB yearbooks; Authors’ own illustration).
However, for this study, we also acknowledge that the continuous spatial contours generated by IDW interpolation should be viewed with caution. The reason for this is that the Proterozoic Alwar Quartzite ridge in the south and southeastern parts of the city acts as a localized structural divide between the western alluvium and eastern Yamuna floodplains. Therefore, these IDW contours illustrate the broad spatial gradients of hydraulic heads across the study area. However, the usefulness of the IDW is that it offers a visual appraisal of spatial GWL distributions across the city for the urban-water authorities (DJB, CGWB, various Delhi municipalities), as a first step of spatial decision making (e.g., areas where caps on pumping should be considered in the first round of decision making).
3.3.2. Moran’s I (Global Spatial Autocorrelation)
Interestingly, we observed statistically significant spatial associations (0.05 < p < 0.0001) among the GWLs, marked by positive Global Moran’s I (Table 1). Global Moran’s I offers a holistic sense of the overall spatial autocorrelation/clustering phenomena (like-clustering-with-like), with positive values indicating high–high (deep GWLs in proximity with similar deep GWLs). Interestingly the increasing trends in the Moran’s I values revealed increasing spatial associations among the GWLs over time, which could aid the concerned urban-water authorities (e.g., Delhi Jal Board, State/Central Ground Water Board) in future groundwater decision making (protection-conservation) efforts. Global Moran’s I statistic could be of immense use to the urban-water regulatory bodies (e.g., DJB, CGWB). For example, the statistical significance values, not readily apparent with traditional contour mapping (e.g., IDW offers a degree of ‘confidence’ to start contemplating targeted hydrogeologic interventions) represent a similar action for a group of wells occurring within a spatial cluster rather than as implementing blanket intervention (uniform) throughout the city.
Table 1.
Global Moran’s I for selected years for pre- and post-monsoon groundwater levels, using the well-level GWL information (Authors’ own computation).
3.3.3. LISA (Local Indicators of Spatial Autocorrelation)
While the Global Moran’s I statistic offers a broad, overall impression of the underlying spatial clustering in GWLs, the LISA Hotspot map helps the authorities further zero in on exact locations of the spatial clustering phenomenon (a group of wells displaying statistically similar GWL patterns, thus requiring similar interventions). This comes in terms of identifying the main ‘types’ of spatial association/clustering that has policy significance (future location-specific decision-making for groundwater protection) (Figure 7):
Figure 7.
Identification of LISA hotspot analysis, identifying various ‘GWL clusters’ across the study area for post-monsoon times in 2022 (Data source: Various CGWB yearbooks; Authors’ own illustration).
- High–High Clusters (GWL Depletion Hotspots): Centered in South and Southeast Delhi’s low-yielding Proterozoic quartzites (Delhi Ridge), and expanding into the Yamuna floodplains, this LISA spatial clustering type marked the deepest GWLs in the areas. These could have resulted from the combination of inherently poor hydrogeologic characteristics of the underlying aquifers, coupled with unregulated (unmonitored) groundwater pumping by private tubewells. For example, in case of Alwar Quartzite in south and southeastern Delhi, low specific yield (Sy < 0.01) causes pronounced piezometric drops even under moderate extraction. In contrast, within the Alluvium formations of the Yamuna floodplains (Sy: 0.10–0.20), drawdown is flux-dominated, driven by intensive, continuous pumping that exceeds local dynamic recharge rates. For the concerned urban-water regulatory authorities (e.g., DJB, CGWB), this cluster, in essence, also represented the most critical, high-risk zones in the city, of localized groundwater over-exploitation. We expect the authorities to potentially designate these wells (and the adjacent areas) as ‘Groundwater Protection Areas’. Globally, LISA has proven highly effective at identifying hydrogeological stress zones to guide municipal pumping policies [48]. For these high–high cluster areas, the following measures could be considered:
- –
- Strategic capping of private tubewell pumping volumes aligned with localized sustainable yields
- –
- Moratorium on issuing new private well-drilling permits, except for public-utility backup infrastructure
- –
- Mandatory deployment of macro-scale artificial aquifer recharge structures
- –
- Strategic decentralized rainwater harvesting (RWH) scheme
- –
- Potentially, active wastewater recycling infrastructure to aggressively shift the local consumption profile away from groundwater reliance.
- Low–Low Clusters (Hydrological Buffer Zones): Conversely, statistically validated Low–low clusters (coldspots of depletion where shallow GWLs < 10 mbgl persist) are mostly concentrated across the north and northwestern districts. These clusters align with thick alluvial formations that benefit from favorable transmissivity, high storage coefficients, and continuous irrigation return flows. Consisting of stable spatial zones, coldspots identify areas where resources remain relatively robust. Policy makers should formally zone these areas as strategic groundwater preservation reserves in terms of natural unpaved recharge pathways against the threat of rapid urban soil sealing and concrete cover. In India, sub-national spatial analysis has increasingly shown that identifying localized coldspots prevents systemic supply inequalities from being obscured by misleadingly optimistic municipal averages [49]. However, in this regard, a precautionary measure for the urban water authorities whould be to frequently assess the geochemical and biological quality of groundwater in these areas, to shield these highly vulnerable, shallow water table areas from urban industrial run-off and/or sewage line exfiltration.
- High–Low/Low–High (Spatial Outliers): These transitional boundaries are arguably the most valuable for early-warning systems. A low–high outlier indicates a stable water resource pocket immediately bordered by heavy depletion, signaling imminent lateral-depletion spillovers. By pinpointing these spatial outlier wells, the urban-water authorities can implement micro-zoning restrictions and manage localized agricultural or industrial nonpoint source pressures before degradation spreads across the wider basin [50].
The north–south spatial divide in the GWLs, as evident from the clustering of the LISA hotspots in the southern and southwestern parts of the study area should not be viewed solely as impacts of growing urbanization (localized increases in groundwater pumping) across the city, and surging demands for domestic drinking water, translating into growing reliance on groundwater. The spatial analysis rather pointed to the need of viewing this geographic GWL divide in context of the underlying aquifer lithology. For example, the southern parts overlay the fractured, hard-rock formations of the Alwar Quartzite. Unlike the highly permeable alluvial deposits underlying the Yamuna floodplains to the north and east, this quartzite bedrock exhibits substantially lower specific yield, restricted secondary porosity, lower hydraulic conductivity, and transmissivity. Collectively, due to them, even a moderate intensity but sustained pumping activities over time within these hard-rock aquifers trigger rapid GWL changes/declines. This lithological constraint furthermore renders the southern areas of the city highly sensitive to groundwater extraction, besides severely limiting natural aquifer recharge capacity. As a result, the hotspots continue to persist in these regions over time, something that the urban-water authorities should be aware of for future decision-making.
3.3.4. Spatial Hierarchical Cluster Analysis (sHCA)
Results of the spatial hierarchical cluster analysis (sHCA) revealed a distinct change in the spatial patterns in GWL distributions, emerging over the study period: from four GWL clusters in 2010 to three in 2022 (Figure 8). A closer investigation revealed that for both periods, one set of wells (HCA-1) stands apart with the deepest GWLs (>47 mbgl), while another set (HCA-4 in 2010; HCA-3 in 2022) occurs with significantly shallow GWLs (<5.5 mbgl). In other words, the GWL profile is characterized by a spatial heterogeneity in GWLs, with simultaneous occurrences of deep and shallow GWLs across the city. Interestingly, the deepest GWL clusters (HCA-1) occurred in the southern parts persistently through the study period, while appearing in parts of the eastern flank, around the Yamuna River, in the more recent times (e.g., 2022).
Figure 8.
Well-wise hierarchical cluster analysis (HCA) results for (a) 2010 and (b) 2022. NOTE: numbers in the paratheses following cluster notations (HCA-1…n) represent the GWL median N = number of GWL observations; p-values = statistical significance by Man–Whitney U test between clusters (Authors’ own illustration).
Such emerging patterns probably calls for a more data-driven, and spatially-customized, decision making (e.g., regular GWL monitoring and benchmarking in the south and eastern parts, imposing stringent pumping restrictions, alongside identifying locations for artificial groundwater recharge, conjunctive use of surface and groundwater, rejuvenation of tanks/pools, initiating more rainwater harvesting schemes, recycling wastewater, improved urban stormwater management) instead of uniform blanket measure (e.g., same pumping restrictions all across the city), which is still a customary practice in the policy circles.
High-stress clusters identified by sHCA require micro-zoned management interventions, prioritizing managed aquifer recharge (MAR) structures designed specifically for fractured quartzite terrain, alongside strict volumetric monitoring (Figure 4).
3.3.5. Methodological Synthesis: From Spatial Association to Targeted Policy and Process Research
While we realized that the IDW contours and/or Global Moran’s I and LISA were the outcome of a set of 77 wells across the entire study area, (one monitoring well per 19 sq km), this cohort of ‘common wells’ across a 13-year study period, however, was mathematically necessary to eliminate any undesired ‘edge effects’ and interpolation artifacts caused by missing temporal data. Applying these spatial statistical indices to a temporally complete dataset yields higher statistical confidence than using a denser but temporally fragmented network. Furthermore, our deployment of Global Moran’s I and LISA proves that this density successfully captures statistically significant spatial autocorrelation (p < 0.05), demonstrating that the network is dense enough to capture regional drawdown clustering despite the exclusion of intermittent monitoring nodes.
Isolating each geostatistical tool yields only a partial view of Delhi’s groundwater stress. A simple contour plot offers quick visual trends but lacks statistical validation. Conversely, a global autocorrelation value tells us a pattern exists but hides where the problems are concentrated. To give the Delhi Jal Board (DJB) and Central Ground Water Board (CGWB) an operational framework, these four methods could be used in sequence as a single decision pipeline (Figure 9). For a starter, the IDW provides a bird’s eye view of the overall spatial patterns (contours) of GWL across the study area—distinct north–south divide of shallow and deeper GWLS. In the next stage, computation of Global Moran’s I provides the mathematical proof of the existence of ‘spatial autocorrelation’ in GWLs across the study and, the association has grown more apparent (statistically significant) over time. In the next stage, the LISA zoomed into the exact locations of this spatial association patterns—marking them with various local cluster types, ranging from the high to the high (Alwar Quartzites in the south, extending into the over-pumped Yamuna floodplain sectors to the east). Finally, the sHCA groups the wells (N = 77) in smaller spatial clusters that could be used for future regulatory decision-making (e.g., imposing strict localized pumping caps, freezing new drilling permits in high–high areas, and site artificial recharge structures where the subsurface can actually absorb water). Such a sequential spatial mapping exercise could also remove the risk of ‘guesswork’ from field research. Instead of funding expensive, broad-scale fieldwork across the capital, researchers can target these verified hotspots for isotope tracer tests to locate actual recharge pathways or run localized pumping tests to determine exact aquifer boundaries.
Figure 9.
Integrated geostatistical and spatial analysis workflow for urban groundwater governance (Authors’ own illustration).
3.4. Yamuna Floodplains: Pumping and Potential Changes in Natural Groundwater–Surface Water Interactions
The emerging GWL patterns in the Yamuna floodplains along the eastern flanks of the city should be a growing concern for urban-water institutions (e.g., Delhi Jal Board, Delhi Municipality, state and central groundwater boards). Hydrogeologically, it warrants research attention that despite being underlain by newer alluvium with significantly better hydrogeologic characteristics, deeper GWLs have begun appearing in these floodplains in recent times—a trend that could threaten the city’s entire domestic water supply framework (DWSF).
In contrast to the low-yielding quarzitic formation (Delhi Ridge) in the south, the floodplain area comprises thick, highly porous quaternary alluvium dominated by sand, silt, and gravel layers with higher specific yields (). However, continuous multi-year drawdown in wells adjacent to the river has altered the natural local hydraulic gradient. Historically, the river functioned as a gaining stream, receiving baseflow discharge from the unconfined alluvial aquifer. Current piezometric gradients show that localized pumping cones along the floodplain have inverted this relationship, inducing streamflow capture where river water recharges the depressed aquifer. This aligns with global evidence that groundwater and surface water systems are dynamics-driven and hydraulically connected [51]. Such pumping-induced hydraulic shifts risk accelerating baseflow depletion over time—especially during dry seasons—directly impacting the ecological health of the river corridor.
Between 2017 and 2022, the eastern districts (East, Northeast, Southeast) registered a significant rise in groundwater extraction, primarily driven by domestic drinking water demand (Figure 10a). Over the same period, total groundwater extraction city-wide (domestic + irrigation + industrial) also expanded (Figure 10b). Under the Indian Central Ground Water Board classification scheme, most Delhi districts remain in ‘critical’ (extraction > 90% of natural recharge) or ‘over-exploited’ (extraction > 100%) states, while the proportion of sub-district administrative blocks in the ‘safe’ category (<75%) remains dangerously low (Figure 10c). Overall, groundwater extraction far outpaces natural recharge rates.
Figure 10.
District-wise estimates of (a) percentages of domestic-drinking-water extraction, (b) total groundwater extraction, and (c) district-wise percentages of blocks falling under various categories in 2022 (hectare area meter; HAM) in 2017 and 2022 (Source: CGWB, [21]; Authors’ own illustration).
Consequently, falling GWLs adjacent to the Yamuna River could trigger baseflow recession events in the future [52]. Such a reduction in streamflow, in turn, could lower the surface-water availability in the river, eventually undermining the entire city’s DWSF domestic-drinking-water supply-chain network, endangering a vast urban populace for water demand and supply. Moreover, for the urban-water authorities, this supply-demand gap could widen sharply during the drier drought periods, when low river flows force a large fraction of the population to rely on private groundwater wells. During such situations, there will be further spikes in groundwater abstraction exacerbating the GWL declines. If unmitigated, the Yamuna floodplain risks transitioning into a permanently ‘losing’ stream [51,53], further depleting surface flows and widening the municipal water deficit.
4. Discussion
4.1. Why Groundwater? Prime Urban DWSF Issues
The decline in GWLs in Delhi, coupled with distinct a north–south divide water table, cannot be understood purely by the science of groundwater hydrogeology [47]. Instead, spatio-temporal changes in GWLs in Delhi is also an expression of residents’ behavioral choices, to address the city’s institutional shortfalls to provide all with sustainable supply of domestic drinking water [44]. Persistent occurrences of the deep outliers (>38 mbgl) in the southern quartzite ridges and their gradual emergence in the high-yielding Yamuna floodplains, therefore, require a social-hydrological lens.
Over the recent past, the city has vastly expanded in population as well as spatial extent, incorporating large swathes of the peri-urban areas. The latter are marked by unregulated growth of informal settlements, that frequently fall outside the existing spatial coverages [25] of the city’s DWSF grid (e.g., piped water supply networks, and/or water tanker services). Such situations force the residents to seek out alternative domestic-drinking sources, such as groundwater.
Moreover, the present capacity and efficiency of existing DWSF services in the city falls short of expectations to provide adequate water to all (SDG 6), due to multiple structural, and infrastructural shortcomings. The latter could be grouped under four major areas (Table 2):
Table 2.
A comparative overview of various water supply sources within the DWSF in Delhi-NCT, with respect to the private wells (Authors’ own conceptualization).
- Lack of spatial coverage across the city (e.g., piped water networks)
- Reliability of DWSF water services (e.g., 24 × 7 water connections)
- Accessibility for all (at-home domestic piped water supplies)
- Affordability (financially viable supplies for all sections of the urban society)
4.2. Why Groundwater? DWSF Affordability and Water Tariffs
Regarding the affordability of the at-home piped water connection from DJB, as part of the city’s DWSF, a critical issue about the piped connections is the water-tariff structure [31,32,57]. Water tarrifs for household water connections have two components [58]:
- I.
- Service Tariff
- II.
- Volumetric Charge
- III.
- Penalties (Unauthorized/Illegal Connections)
For all metered connections, this tariff scheme is as follows [58]:
- 20 kiloliters (Kl): INR (INR (Indian National Rupee); INR 1 = USD 84 (as of July 21, the time of writing this article)) 146.61 (service) + INR 5.27 (volumetric)
- 20–30 Kl: INR 219.62 (service) + INR 26.36 (volumetric)
- >30 Kl: INR 292.82 (service) + INR 49.93 (volumetric)
However, properties having area of ≤500 square meter would receive (1) a 10% rebate on the water bill there is a functional rainwater harvesting system (RWHS), or wastewater recycling system; and (2) 15% if both the above are in place and functional. The ZRO would perform periodic audit checks to ensure functionality and decide accordingly.
What deters the urban residents from DWSF facilities is that the DJB has rules for ‘un-sanctioned’ water connections (illegal connection), in which cases the consumer would have to regularize the connection by paying:
- –
- Penalty (INR 3000/per unauthorized connection)
- –
- Water charges for three years
- –
- Any water development charges
- –
- Infrastructure Charges (if plot-size is ≥200 square meter)
- –
- Initial charges (e.g., opening fee, water advance and R.R. charges)
Together, these create mental blocks in the minds of the urbanites regarding DWSF, while skewing them more towards groundwater, which is free for all.
Crucially, addressing these tariff and infrastructural barriers requires recognizing that household reluctance to connect to municipal networks is often driven by perceived unreliability rather than an absolute unwillingness to pay (WTP) for utility services. Empirical evidence from major South Asian urban contexts—including Karachi [59], Jaffna [60], and Khulna [61]—demonstrates that urban households express a significant ‘Willingness to Pay’ (WTP) for improved, continuous, and safe drinking-water services. When public utilities guarantee improved service quality, continuous supply, and transparent billing, households are generally willing to absorb higher tariffs, as this offsets the higher cumulative hidden costs of private groundwater extraction, pump maintenance, and private water-tanker reliance. Integrating WTP dynamics into Delhi’s DWSF policy framework could thus enable municipal utilities like the Delhi Jal Board to restructure water tariffs sustainably—financing grid expansions in unserved peri-urban areas while reducing private groundwater overdraft.
4.3. Why Groundwater? Age-Old Attitudinal Aspects
Collectively, these issues have deterred the urban residents away from DWSF, and more towards groundwater that overcomes most of the structural and economic barriers posed by the DWSF (Table 3). However, the above, groundwater has been an ‘alternative’ water source to the urban residents, due to a confluence of age-old perceptional/attitudinal factors:
- My Land, My Water: This implies that whatever exists underneath a plot of land belongs to the landowner [11,13,62]. This becomes starkly apparent for the urban housing colonies in the city’s marginal areas, that, in most cases, lack at-home piped water connections, relying almost entirely on the private groundwater extraction. This issue is further compounded by India’s legacy legal framework—rooted in the Indian Easements Act of 1882, where groundwater rights are tied to the land ownership (what lies below my ground is mine), granting private property owners unrestricted extraction rights regardless of underlying aquifer constraints [63]. In other words, by the same token, groundwater becomes the property of the landowner who is free to exploit it without, and permission/approval of any urban authority concerned. To stall this tendency, a major task (and challenge), is for the policy/decision-makers to first address the socio-economic drivers of over-extraction alongside hydrogeological realities.
- Out Of Sight, Out of Mind: As groundwater is shielded by the land, compared to its surface counterpart [6], there is little care/worry about its conditions, and how it is changing over space and time (e.g., water-level drops)
- An Infinite Resource: Leading from the above, as the conditions of groundwater (deep or shallow) are not readily apparent to the naked eye, it is taken as an inexhaustible resource ([64]).
- Negligible Logistics: Harnessing surface water bodies (rivers) require significant inputs (capital, technology, land), besides a robust institutional support mechanism (finance, manpower, technology, infrastructure, legal framework). On the other hand, Groundwater users do not require any institutional support. Aside from this, falling costs of well-drilling and heavy-duty pump-sets coupled with power subsidies (e.g., diesel), have collectively made groundwater more ‘accessible’ to all.
In view of the above, the urban residents pump groundwater whenever, wherever, and in whatever quantity they like. Such practices are further ‘facilitated’ by the lack of monitoring of these wells [14,65], and lack of established and transparent groundwater metering/tariffing efforts [66].
Table 3.
A comparative overview of various water supply sources within the DWSF, with respect to the ‘opportunities’ offered by accessing groundwater (Authors’ own conceptualization).
4.4. Strategic Policy Vision: Potential Socio-Hydrological Approach
4.4.1. Socio-Economic Drivers of Groundwater Depletion
Addressing the acute spatial drawdowns documented across the National Capital Territory (NCT) of Delhi requires moving beyond hydrogeological metrics to evaluate the coupled human-water dynamics shaping the subsurface regime [69,70]. The severe depletion hotspots observed within the low-yielding Alwar Quartzite formations of South and Southeast Delhi cannot be isolated from the systemic failures of the DWSF. This is as Maria [44] observed, urban groundwater abstraction functions primarily as an adaptive response to spatial inequities in public infrastructure.
The socio-hydrological dynamics of the city operate across a stark socio-economic divide. In the more affluent southern blocks, where public piped water is characterized by low pressure and intermittent supply, private groundwater extraction is driven by high per-capita amenity consumption (e.g., intensive residential landscaping and automated storage pumping). Wealthier property owners leverage private capital to sink deep boreholes into fractured quarzitic bedrock. This localized hyper-extraction deepens cones of depression and reduces water availability in adjacent shallower wells [11,12]. As a result, private well owners with shallower wells often find their wells dry out over time, which adds to their daily domestic-drinking-water crises, despite having their own water sources (their own wells).
Conversely, in low-income informal settlements, peri-urban villages, and unauthorized colonies (locally often designated as the Jhuggi Jhopri cluster settlements in Delhi), structural DWSF deficits create severe water insecurity. Similar observations have been reported by Narain [71,72,73], from various other urban habitats of India. Lacking piped municipal connections, the peri-urban households are forced to rely on groundwater via shallow handpumps [74], or buy water from unregulated private tanker vendors at inflated prices [75]. This creates a dual socio-hydrological burden: low-income communities suffer extreme financial and health vulnerabilities due to unsafe or expensive supply, while localized private extraction from dense, shallow handpumps further accelerates local phreatic table drawdowns.
4.4.2. Establishing Micro-Zoned Governance and Groundwater Pumping Limits (Caps)
Uniform, city-wide regulatory mandates have proven ineffective because they fail to account for spatial heterogeneity in both geology and economic capacity [21]. Regulatory oversight could consider transitioning from macro-level mandates to hyper-local, block-specific governance calibrated directly to the spatial clusters identified via Local Indicators of Spatial Association (LISA).
Within the identified ‘High–High’ depletion hotspots in south, southeast, and southwest districts, the Central Ground Water Authority (CGWA) and the Delhi Jal Board (DJB) might consider establishing area-based capping limits on groundwater pumping, based on the contextual recharge rates. Pumping in these constrained quarzitic formations should be restricted strictly to essential domestic needs, whereas higher volumetric allowances may be permitted in northern alluvial blocks subject to continuous piezometric monitoring.
Enforcement requires mandating telemetry-enabled smart meters on all high-capacity commercial, industrial, and multi-story residential boreholes. Integrating this data into a centralized municipal platform enables real-time monitoring of pumping stresses. To curb non-essential consumption in affluent, geologically vulnerable areas of the city, the urban municipal authorities might think about devising a reasonable and progressive tariff structure. For example, where groundwater pumping exceeds the basic human-need thresholds [76], this could incur rising volumetric surcharges. Revenues generated from these surcharges should be ring-fenced to fund public water infrastructure in under-serviced informal settlements. Additionally, experts should be consulted to implement a legally binding moratorium on new private borehole permits, (e.g., within the Alwar Quartzite formations), excepting critical public utility projects serving un-piped communities.
4.4.3. Economic Mechanisms for Targeted Aquifer Storage and Recovery
Command-and-control mandates for Rainwater Harvesting (RWH) have suffered from low compliance and poor operational maintenance across Delhi [25]. Translating statutory requirements into active recharge requires pairing financial mechanisms with hydrogeologically targeted Aquifer Storage and Recovery (ASR). In this regard, the municipal agencies could restructure property tax frameworks to offer recurring tax rebates (10% to 15%) for residential welfare associations and commercial complexes that maintain functionally verified ASR systems. Compliance should be audited annually using remote pressure sensors or piezometric indicators rather than static paper certifications. On the other hand, commercial entities and large residential estates in the city’s prime groundwater depletion hotspots (LISA High-High cluster zones) that fail to meet statutory recharge targets should be subject to an annual Groundwater Severance Levy to internalize the environmental cost of their extraction. Coupled with this, there should be conscious deliberation as to how to align the capital allocation for macro-scale recharge infrastructure with subsurface permeability rather than administrative boundaries. The latter is, however, the current practice still. Municipal investment should prioritize injection structures along the permeable unconfined aquifers of the Yamuna floodplains and the Older Alluvium margins, while avoiding dense, low-permeability quarzitic bedrock where natural infiltration rates are minimal [21].
4.4.4. Restructuring Alternate Urban-Water Delivery Systems
A prime area for action for the urban-water authorities will be to moderate/leash down the informal water tanker services [25]. This is a daunting task. In Delhi, a major issue around the water tankers is that they exploit the DWSF demand–supply gap, selling water to the residents at high prices. Ironically, many of these informal water tankers abstract groundwater for their business. For the Delhi Jal Board (DJB), this means creating dedicated investment funds and drawing up special infrastructural support plans for expanding piped surface water connection networks into peripheral settlements and unauthorized colonies. This is essential to cut down on groundwater pumping. Alongside network expansion, private water tanker fleets should be brought under a digital regulatory framework, with mandatory GPS tracking, volumetric flow meters, and extraction permits tied strictly to designated municipal well-fields in non-stressed alluvial zones.
A more difficult challenge for municipal water authorities is protecting the water access for economically vulnerable colonies, especially during drier spells when water demand is high while DWSF supply (e.g., piped at-home services) is low. Here, some thoughts might be invested in imposing seasonal price caps on commercial water deliveries while levying volumetric abstraction fees on private operators. Implementing any price or extraction controls, however, is another complex problem for the authorities. It requires installation of automated, transparent groundwater meters, which are still non-existent or negligible on ground.
In this regard, a critical step ahead will be to designate the Yamuna Floodplains as a protected hydrogeological area. Commercial extraction should be highly moderated. For example, restricting within at least 1.5 km of the riverbank. The key ideas should be:
- Keeping the alluvium groundwater storage from depleting beyond the point of recovery through natural recharge.
- Preserving the natural groundwater–surface water interactions (natural baseflow conditions).
- Strictly regulating further urban build-up (growth of impervious surfaces), to protect riverbank filtration capacity (natural groundwater recharge potential).
- Safeguarding the floodplain’s role as a strategic municipal supply buffer during drought periods.
4.4.5. Towards a Decentralized Participatory Action Around Groundwater
At the community level, a gamechanger action could be—operationalizing a polycentric mode of domestic-drinking-water governance. In other words, establishing robust and functional Water users’ Associations (WUA), formed by the residents (water users), for the residents. However, such efforts could face multiple challenges [13]. For example, the idea of WUA only works if is strategically embedded within existing civic bodies, for example, Resident Welfare Associations (RWAs) [70]. Centralized command-and-control enforcement routinely breaks down across expanding urban centers. Regulatory agencies face multiple barriers, including monitoring difficulties, lack of information (often disinformation), and administrative conflicts ([71]). Shifting oversight down to neighborhood entities addresses this enforcement deficit directly. By integrating participatory monitoring protocols into daily RWA functions, municipal utilities can delegate routine volumetric tracking, local water-level monitoring, and rainwater harvesting maintenance to the very residents who depend on the underlying aquifer [77,78].
However, a call for ‘voluntary stewardship’ would not sustain this framework. Over time; it would require direct financial incentives. Municipalities should tie performance-based infrastructure grants—allocating priority capital for piped network expansion, drainage upgrades, and civic infrastructure—directly to a neighborhood’s verified reduction in net groundwater drawdown [79,80]. Municipal utilities can also introduce progressive bulk-water tariff discounts for RWAs that hit seasonal extraction reduction targets. Aligning local financial self-interest with common-pool resource management activates peer enforcement on the ground, helping suppress illegal borewell drilling and unmetered commercial extraction from within the neighborhood itself [59,60,61]. Formalizing these decentralized nodes turns urban residents from uncoordinated, competing extractors into accountable co-managers of a shared aquifer.
5. Current Study Constraints
5.1. Archival Data Integrity and Geostatistical Noise Filtering
Although the CGWB archives offered the multi-decadal GWL records (2010–2022), we found that there exist constraints. For example, the data records lacked any information about the standardized metadata detailing site-specific measurement instruments (e.g., variation between manual steel-tape sounders and calibrated electric depth gauges), wellhead elevation survey datum precision, or routine sensor recalibration–validation methods and intervals. However, rather than treating these as barriers, we employed the spatial autocorrelation techniques as an analytical filter. By evaluating distance-decay weight matrices across 77 common-well monitoring nodes, the combined deployment of Global Moran’s I and Local Indicators of Spatial Association (LISA) distinguished the localized measurement noise from coherent regional GWL signatures. Here, the geostatistical workflow isolated the genuine regional trend vectors from station-level measurement noise, preserving spatial integrity across the long-term GWL records.
5.2. Hydrostratigraphic Aggregation and Vertical Screening Limits
A major physical constraint of the municipal monitoring grid that we realized during the data collection–compilation process was the vertical aggregation of GWL observations [81,82] Water-level measurements are mostly reported as a single, combined phreatic table. At the same time, the monitoring network lacked depth-discrete screen-interval records [83]. Consequently, this resulted in shallow unconfined alluvium with deeper semi-confined to confined flow systems in the fractured Alwar quartzite bedrock. Such issues pose major concerns to analysis. In complex transition zones like the Delhi Ridge margin, static GWLs represent an integrated hydraulic head rather than a discrete horizon pressure. This single-layer representation was an explicit boundary condition of our study. While multi-depth monitoring wells are required to isolate vertical head gradients, this 2D planar baseline remains necessary [84]. It defines the regional spatial boundary conditions needed to parameterize future 3D numerical groundwater models (such as MODFLOW) once lithological borehole logs across municipal sites are digitized.
5.3. Deterministic Interpolation and Boundary-Edge Effects
Deterministic spatial interpolation via Inverse Distance Weighting (IDW) assumes isotropic spatial continuity across the target domain [85]. However, in our case, for a geologically diverse urban setting such as Delhi, any a priori assumptions about isotropic features can introduce smoothing artifacts near administrative borders or across sharp lithological boundaries (e.g., interface between the alluvial floodplains and the quartzite Delhi Ridge). Therefore, as mentioned earlier (Section 3.3.1), the IDW maps should be used mostly for spatial depiction. All quantitative statistical inferences, clustering protocols, and trend evaluations were executed directly at discrete well coordinates using non-parametric LISA statistics and Spatial Hierarchical Cluster Analysis (sHCA) [39,86]. However, future hydrogeological modeling should employ domain-segmented kriging or boundary-constrained numerical models to isolate crystalline rock boundaries (Delhi Ridge) from surrounding alluvial aquifers [87].
5.4. Vadose Zone Hydraulic Lags and Telemetry Transitions
The most inherent problem encountered in our analysis was the seasonal sampling schedule, risking the introduction of temporal timing uncertainties. For example, in areas where the deep GWLs exceed 30–40 mbgl, the percolation time through the unsaturated zone could take from weeks to several months. Consequently, fixed post-monsoon monitoring windows (October–November), as is the present custom with CGWB, present only an intermediate snapshot, where shallow water tables show rapid recovery while deep GWLs continue to decline. Such situations can lead to temporary recharge lag. However, this phenomenon is an outcome of the physical vadose-zone process rather than an observational error. To bypass this situation, we see the need of transitioning from manual soundings to continuous, automated digital water-level recorders (DWLR) paired with stable isotopic analysis (, ) [88,89,90]. Such an integrated approach could help decouple the vadose travel time complexities from the actual groundwater pumping rates [88,91].
To bridge present analytical mitigations with long-term urban-water management, Table 4 synthesizes the structural data limitations encountered in this work alongside the technical benchmarks required for future high-resolution observational networks.
Table 4.
Strategic transition matrix: archival constraints, present methodological mitigations, and future high-resolution observational requirements for urban groundwater governance (Authors’ own conceptualization through).
6. Potential Future Research Directions
6.1. Need for Improved Characterization of Spatio-Temporal Changes in GWLs
Occurrence of spatial heterogeneity in GWLs, coupled with persistent occurrence of deep outliers in the southern parts of the study area, calls for area-specific regulatory interventions. For example, aside from more detailed well-level characterization of the local hydrogeology around the outlier wells and the assessment of adjoining urban built-up structures (e.g., paved surfaces), the regulatory actions could include punitive measures such as capping groundwater pumping to certain levels (e.g., according to the sustainable yields of the underlying aquifer system), increasing conjunctive use of groundwater, surface water, and recycled water, and scrutinizing future well-drilling permits and private pumping (e.g., in the vicinity of deep outliers).
Moreover, there is a need for conducting more process-level, context-specific hydrogeological investigation exercises to understand the ‘anomalous’ seasonality in GWLs (e.g., post-monsoon GWLs deeper than pre-monsoon) in certain years:
- Isotope Tracer Tests: To conclusively resolve the exact velocity and transit times of the monsoon recharge front, future investigations should deploy stable environmental isotope tracers (18O, 2H) along deep vadose zone profiles. This hydrogeological tracing will establish distinct seasonal isotopic fingerprints, allowing researchers to mathematically decouple immediate, localized urban runoff infiltration from delayed, multi-month vertical percolation.
- High-Frequency Spatiotemporal Monitoring: Expanding the existing monitoring grid into a high-density, automated telemetry network. The idea should be to capture real-time, and localized GWL drawdown caused by aggressive private well-pumping events between seasons.
- Targeted Numerical Modeling: Developing integrated surface–subsurface hydrological models (e.g., modified MODFLOW-Hydro) that explicitly simulate localized urban runoff dynamics alongside pumping rules.
6.2. Yamuna Floodplains: Decoding Hydrogeology and Groundwater Anthropology
For the Yamuna Floodplains area, there is need of undertaking coupled hydrogeologic–hydrometeorological modeling investigations to assess the potential negative impacts of groundwater pumping ([51]). The Yamuna River itself is the prime source of domestic drinking water to the city, supporting majority of the urban population for their daily water needs. Under the circumstances, deepening GWLs over time could undermine water supply for a vast population that lack DWSF connections (piped water supply at home) and solely rely on groundwater. Here, we identify certain broad areas of research regarding groundwater pumping:
- –
- Conducting a strategic pump test to assess the seasonal variations in the natural streamflow patterns
- –
- Impacts of baseflow recession on environmental flow in Yamuna, that is, the causal effects on riverine aquatic biodiversity
- –
- Impacts of baseflow recession on hydrogeochemical signatures in Yamuna
However, much remains to be decided about how to characterize the above. However, while thinking about means to maintain/restore GWLs, there could be several challenges requiring more detailed field-scale, targeted hydrogeological studies:
- Density and spatial distribution of wells (pumping in one well could affect water levels in all others in the vicinity based on the spatial–temporal dimensions of the cones of depression)
- Presence of physical ‘barrier’, such sewers, fill material, foundations, pipelines, surface cover (% of built area aboveground), and topography
- Climatic variability/uncertainty (e.g., rainfall intensity, surface runoff, evapotranspiration) affecting accurate quantification groundwater recharge patterns at the well-level
6.3. Improved GWL Monitoring for Informed Modeling/Simulation
A prime expectation from the urban-water authorities is to adopt proactive measures to bridge the gap between hydrogeological research and urban policy making. The first requirement for this, however, is more GWL information, from a spatially extensive network (wells and piezometers) that is ‘representative’ of the city. However, at the same time, the data such obtained should be made easily accessible to the research community to conduct independent investigation and offer recommendations to the authorities. Historical reliance on traditional hydrograph measurements should be replaced with an expanded, for example, automated IoT piezometer network. Water-level data should be published via an open-access spatial platform to inform public planning and academic research. At the same time, there should be efforts for predictive groundwater modeling—undertaken by the urban-water regulatory bodies (CGWB and DJB) and strategically integrated with the socio-economic datasets alongside physical hydrogeological parameters. Pairing transmissivity and storage metrics with census demographics, income levels, and municipal supply schedules in dynamic numerical models (e.g., MODFLOW) will allow planners to simulate the localized impacts of proposed tariffs, land-use changes, and infrastructure expansions prior to implementation.
7. Conclusions
In recent times, building a robust DWSF to provide clean domestic drinking water to all has been a key area of emphasis in urban sustainable planning and development agendas around the world. In this regard, groundwater is a main water source to the population. However, overreliance and unregulated pumping, resulting in a decline in the GWLs has become a growing menace to the urban-water-supply regulatory bodies. The present study assessed long-term (2010–2022) spatio-temporal patterns in groundwater levels (GWLs) in the megacity Delhi, India, for the post- and pre-monsoon seasons. Results indicated no consistent seasonal patterns in GWLs, except for certain years, which could occur due to a combination of natural (hydrogeological) and anthropogenic drivers (urbanization, groundwater pumping), that should be researched/modeled at the process level, by incorporating more hydrogeological details.
With a cohort of spatial tools (e.g., IDW, Global Moran’s I, LISA spatial hierarchical clustering), employed in a sequential fashion, this study identified the southern parts of the city as the prime hotspot of deep GWLs. The northern and north-western parts of the city sit in contrast with the southern parts, and are marked with shallower GWLs (<10 m), displaying a spatial north–south divide in GWLs across Delhi. Interestingly, our study also revealed a gradual emergence of deep GWLs in the Yamuna floodplains, on the eastern side of the city, over time. This calls for more hydrogeological research as the alluvium formations of the Yamuna River floodplains are high yielding formations with better hydrogeological characteristics (as compared to the quartzite formations of the southern parts). We discuss the hydrogeological significance of occurrence of deep GWLs in the Yamuna floodplains, as water supplies from the Yamuna River are the mainstay of the city’s DWSF framework.
Discussing the urban-water situation in Delhi, the study highlights the shortcomings of the existing DWSF, coupled with the residents’ age-old perceptions about groundwater that led to a rapidly growing preference for groundwater as the choice alternative for domestic-drinking-water sources. Such attitudes have led to unregulated groundwater pumping, lowering of GWLs across the city. To that end, the study emphasized the need of adopting a thorough socio-hydrological lens (e.g., setting up micro-zoned groundwater management and groundwater pumping caps, alternative water delivery system, and establishment of water users’ associations), coupled with in-depth understanding of the local hydrogeology, to strengthen the overall DWSF framework. To approach the situation, however, there is need for more monitoring and information, regarding the underlying aquifer systems, groundwater-surface water interactions in the Yamuna River floodplains, as well as sound understanding of the urban pumping patterns.
Overall, the perspectives offered in this narrative could lay down foundational stones for future groundwater investigations and guiding policymakers and urban sustainability planners in their future agendas of building resilient cities and communities. Moreover, the tools and techniques used in the study could also be used in other urban areas with minimal modifications.
Author Contributions
Conceptualization: S.C. and M.R.; methodology: M.R. and S.C.; software: S.C.; validation: M.R. and S.C.; formal analysis: S.C. and M.R.; investigation: M.R. and S.C.; data curation: M.R. and S.C.; resources: S.C. and M.R.; writing—original draft: M.R. and S.C.; writing—review and editing: S.C. and M.R.; visualization: S.C. and M.R.; supervision: S.C.; project administration: S.C. and M.R. All authors have read and agreed to the published version of the manuscript.
Funding
This research received no external funding.
Institutional Review Board Statement
Not applicable.
Informed Consent Statement
Not applicable.
Data Availability Statement
All information is available on open sources; no new data was generated. The raw, uncompiled groundwater level datasets utilized in this study are publicly available through the National Water Data Portal (NWDP) of India. The historical baseline data block (1991–2020) can be accessed at: https://nwdp.nwic.gov.in/dataset/gwl-manual-quarterly-central-ground-water-board-department/resource/9a04b453-b6b2-418b-b185-9cf20862821f (accessed on 12 May 2025). The subsequent multi-year monitoring data block (2021–2025) can be accessed at: https://nwdp.nwic.gov.in/dataset/gwl-manual-quarterly-central-ground-water-board-department/resource/f9d6022f-934e-4835-a0ff-8abd30d20ed9 (accessed on 12 May 2025). The curated and filtered final subset of N = 77 common monitoring wells used for year-on-year comparisons supporting the conclusions of this article will be made available by the authors on request.
Acknowledgments
The authors cordially thank the Jindal School of Liberal Arts and Humanities, O.P. Jindal Global University, and the research staff of the Centre for Environment, Sustainability and Human Development (CESH), O.P. Jindal Global University for providing assistance in performing the research.
Conflicts of Interest
The authors declare no conflicts of interest.
References
- Bandari, A.; Sadhukhan, S. Investigating the Relations between Performance Indicators of Urban Water Supply in India. Urban Water J. 2022, 19, 999–1014. [Google Scholar] [CrossRef] [Scilit]
- Mishra, B.K.; Chakraborty, S.; Kumar, P.; Saraswat, C. Urban Water Security: Background and Concepts. In Sustainable Solutions for Urban Water Security; Water Science and Technology Library; Springer International Publishing: Cham, Switzerland, 2020; Volume 93, pp. 1–24. [Google Scholar]
- Sengupta, S. Cities across India Have Started Water Rationing. 2018. Available online: https://www.downtoearth.org.in/water/cities-across-india-have-started-water-rationing-62187 (accessed on 12 May 2025).
- Ghosh, P. Water Stress and Water Crisis in Large Cities of India. In Sustainable Climate Action and Water Management; Mishra, R.K., Singh, R.B., Dubey, A., Eds.; Advances in Geographical and Environmental Sciences; Springer: Singapore, 2021; pp. 131–138. [Google Scholar]
- Grönwall, J.; Oduro-Kwarteng, S. Groundwater as a Strategic Resource for Improved Resilience: A Case Study from Peri-Urban Accra. Environ. Earth Sci. 2018, 77, 6. [Google Scholar] [CrossRef] [Scilit]
- Coaffee, J.; Lee, P. Urban Resilience: Planning for Risk, Crisis and Uncertainty; Red Globe Press: London, UK, 2016. [Google Scholar]
- Bajaj, A.; Singh, S.P.; Nayak, D.; Nagar, A. Economic Perspectives on Groundwater Conservation: Insights from Farmers in Western Uttar Pradesh, India. Groundw. Sustain. Dev. 2025, 29, 101412. [Google Scholar] [CrossRef] [Scilit]
- Singh, C.K.; Dey, M.K. A Critical Review of India’s Latest Groundwater Policy: Impacts on Groundwater Resource Planning and Management. J. Landsc. Ecol. 2024, 17, 39–59. [Google Scholar] [CrossRef] [Scilit]
- Saha, D.; Dwivedi, S.N.; Ali, S. Research on Groundwater Science and Management in India. Proc. Indian Natl. Sci. Acad. 2024, 90, 468–481. [Google Scholar] [CrossRef] [Scilit]
- Chaudhuri, S.; Parakh, D.; Roy, M.; Kaur, H. Groundwater-Sourced Irrigation and Agro-Power Subsidies: Boon or Bane for Small/Marginal Farmers in India? Groundw. Sustain. Dev. 2021, 15, 100690. [Google Scholar] [CrossRef] [Scilit]
- Ankita; Padvetnaya, V.U.; Chaudhuri, S. What Do Farmers Don’t Know? A Generic Index to Summarize Cognitive Awareness of Ground Water Sourced. Ecol. Environ. Conserv. 2022, 28, 179–192. [Google Scholar] [CrossRef] [Scilit]
- Parakh, D.; Chaudhuri, S. Groundwater Regulation Bills in Haryana—A Call for Groundwater Conservation and Management for Sustainable Irrigation Supply Services—Opportunities and Challenges. Ecol. Environ. Conserv. 2022, 28, 147–164. [Google Scholar] [CrossRef] [Scilit]
- Parakh, D.; Chaudhuri, S. Groundwater Markets in South Asia: A Bibliometric Assessment of Challenges and Opportunities for Sustainable Irrigation Development. J. South Asian Dev. 2023, 18, 265–294. [Google Scholar] [CrossRef] [Scilit]
- Boken, V.K. Groundwater Crisis of a Mega City: A Case Study of New Delhi, India. In Balanced Urban Development: Options and Strategies for Liveable Cities; Maheshwari, B., Thoradeniya, B., Singh, V.P., Eds.; Water Science and Technology Library; Springer International Publishing: Cham, Switzerland, 2016; Volume 72, pp. 211–219. [Google Scholar]
- Bose, S.; Mazumdar, A.; Halder, S. Groundwater Sustainability in the Face of Urban Expansion: A Case Study on Kolkata’s Ongoing Challenge. Groundw. Sustain. Dev. 2024, 25, 101162. [Google Scholar] [CrossRef] [Scilit]
- Shekhar, S.; Mao, R.S.K.; Imchen, E.B. Groundwater Management Options in North District of Delhi, India: A Groundwater Surplus Region in over-Exploited Aquifers. J. Hydrol. Reg. Stud. 2015, 4, 212–226. [Google Scholar] [CrossRef] [Scilit]
- Agarwal, V.; Kumar, A.; Gee, D.; Grebby, S.; Gomes, R.L.; Marsh, S. Comparative Study of Groundwater-Induced Subsidence for London and Delhi Using PSInSAR. Remote Sens. 2021, 13, 4741. [Google Scholar] [CrossRef] [Scilit]
- Chaudhuri, S.; Roy, M. Reflections on Groundwater Quality and Urban-Rural Disparity in Drinking Water Sources in the State of Haryana, India. Int. J. Sci. Res. Dev. 2017, 4, 837–843. [Google Scholar]
- Mukherjee, A.; Rai, S. Possible Neo-Tectonic Cause of Depleting Water Resources in Delhi–NCR, India. Discov. Geosci. 2026, 4, 243. [Google Scholar] [CrossRef] [Scilit]
- Biswas, A.; Gangwar, D. Studying the Water Crisis in Delhi Due to Rapid Urbanisation and Land Use Transformation. Int. J. Urban Sustain. Dev. 2021, 13, 199–213. [Google Scholar] [CrossRef] [Scilit]
- CGWB. Dynamic Ground Water Resources of NCT Delhi; Central Ground Water Board, Ministry of Jal Shakti: New Delhi, India, 2023. [Google Scholar]
- Chatterjee, R.; Gupta, B.K.; Mohiddin, S.K.; Singh, P.N.; Shekhar, S.; Purohit, R. Dynamic Groundwater Resources of National Capital Territory, Delhi: Assessment, Development and Management Options. Environ. Earth Sci. 2009, 59, 669–686. [Google Scholar] [CrossRef] [Scilit]
- Gupta, P.; Sarma, K. Spatial Distribution of Various Parameters in Groundwater of Delhi, India. Cogent Eng. 2016, 3, 1138596. [Google Scholar] [CrossRef] [Scilit]
- Sarma, R.; Singh, S.K. Temporal Variation of Groundwater Levels by Time Series Analysis for NCT of Delhi, India. In Advances in Water Resources and Transportation Engineering; Mehta, Y.A., Carnacina, I., Kumar, D.N., Rao, K.R., Kumari, M., Eds.; Lecture Notes in Civil Engineering; Springer: Singapore, 2021; Volume 149, pp. 191–203. [Google Scholar]
- Chaudhuri, S.; Roy, M. Three-Tier Spatial Assessment of Groundwater Levels in Megacity Delhi, India: A Call to Improve the Urban Water Supply Services (UWSS). Sustain. Water Resour. Manag. 2025, 11, 121. [Google Scholar] [CrossRef] [Scilit]
- Chaudhuri, S.; Kaur, H. Delhi Is on the Verge of a Groundwater Crisis—And It’s Time We Stopped Ignoring It. 2017. Available online: https://science.thewire.in/politics/groundwater-crisis-delhi/ (accessed on 12 May 2025).
- Chaudhuri, S.; Ale, S. Characterization of Groundwater Resources in the Trinity and Woodbine Aquifers in Texas. Sci. Total Environ. 2013, 452–453, 333–348. [Google Scholar] [CrossRef] [Scilit] [PubMed]
- Chaudhuri, S.; Ale, S. Evaluation of Long-Term (1960–2010) Groundwater Fluoride Contamination in Texas. J. Environ. Qual. 2014, 43, 1404–1416. [Google Scholar] [CrossRef] [Scilit] [PubMed]
- Chaudhuri, S.; Ale, S. Long-Term (1930–2010) Trends in Groundwater Levels in Texas: Influences of Soils, Landcover and Water Use. Sci. Total Environ. 2014, 490, 379–390. [Google Scholar] [CrossRef] [Scilit] [PubMed]
- Guin, P.; Rajeshwari, B.; Mahajan, B. What Determines How Governance Indicators Shape Policy Processes? Evidence from Three Environmental Issues in India. Environ. Policy Gov. 2024, 34, 691–708. [Google Scholar] [CrossRef] [Scilit]
- Aijaz, R. Water Supply in Delhi: Five Key Issues; Observer Research Foundation (ORF): New Delhi, India, 2020. [Google Scholar]
- Aijaz, R. Exploring Ways to Fill Delhi’s Unmet Water Needs; Observer Research Foundation (ORF): New Delhi, India, 2024. [Google Scholar]
- Shekhar, S.; Purohit, R.R.; Kaushik, Y.B. Groundwater Management in NCT Delhi. In Proceedings of the 5th Asian Regional Conference of Indian National Committee on Irrigation and Drainage (INCID), New Delhi, India, 6–11 November 2009. [Google Scholar] [CrossRef] [Scilit]
- Sarkar, A.; Ali, S.; Kumar, S.; Shekhar, S.; Rao, S.V.N. Groundwater Environment in Delhi, India. In Groundwater Environment in Asian Cities; Elsevier: Amsterdam, The Netherlands, 2016; pp. 77–108. [Google Scholar]
- CGWB. Ground Water Level (Manual–Quarterly): Delhi (1991–2020); National Water Data Portal, National Water Informatics Centre, Ministry of Jal Shakti: New Delhi, India, 2025. [Google Scholar]
- CGWB. Ground Water Level (Manual–Quarterly): Delhi (2021–2025); National Water Data Portal, National Water Informatics Centre, Ministry of Jal Shakti: New Delhi, India, 2025. [Google Scholar]
- Kumar, A.; Chaudhuri, S. Improving Urban Air Quality Monitoring in Delhi, India: Reflections on Low-Cost Air Quality Sensors (LCAQS) and Participatory Engagement. Environ. Urban. Asia 2022, 13, 265–283. [Google Scholar] [CrossRef] [Scilit]
- Shekhar, S.; Prasad, R.K. The Groundwater in the Yamuna Flood Plain of Delhi (India) and the Management Options. Hydrogeol. J. 2009, 17, 1557–1560. [Google Scholar] [CrossRef] [Scilit]
- Anselin, L. Local Indicators of Spatial Association—LISA. Geogr. Anal. 1995, 27, 93–115. [Google Scholar] [CrossRef] [Scilit]
- Chaudhuri, S.; Roy, M. Rural-Urban Spatial Inequality in Water and Sanitation Facilities in India: A Cross-Sectional Study from Household to National Level. Appl. Geogr. 2017, 85, 27–38. [Google Scholar] [CrossRef] [Scilit]
- Chaudhuri, S.; Roy, M.; Jain, A. Appraisal of WaSH (Water-Sanitation-Hygiene) Infrastructure Using a Composite Index, Spatial Algorithms and Sociodemographic Correlates in Rural India. J. Environ. Inform. 2018, 35, 1–22. [Google Scholar] [CrossRef] [Scilit]
- Naikoo, M.W.; Rihan, M.; Ishtiaque, M.; Shahfahad. Analyses of Land Use Land Cover (LULC) Change and Built-up Expansion in the Suburb of a Metropolitan City: Spatio-Temporal Analysis of Delhi NCR Using Landsat Datasets. J. Urban Manag. 2020, 9, 347–359. [Google Scholar] [CrossRef] [Scilit]
- Roy, S.S.; Rahman, A.; Ahmed, S.; Shahfahad; Ahmad, I.A. Alarming Groundwater Depletion in the Delhi Metropolitan Region: A Long-Term Assessment. Environ. Monit. Assess. 2020, 192, 620. [Google Scholar] [CrossRef] [Scilit] [PubMed]
- Maria, A. Urban Water Crisis in Delhi: Stakeholders’ Responses and Potential Scenarios of Evolution; Iddri: Paris, France, 2008. [Google Scholar]
- Patle, G.T.; Singh, D.K.; Sarangi, A.; Rai, A.; Khanna, M.; Sahoo, R.N. Time Series Analysis of Groundwater Levels and Projection of Future Trend. J. Geol. Soc. India 2015, 85, 232–242. [Google Scholar] [CrossRef] [Scilit]
- Shekhar, S. An Approach to Interpretation of Step Drawdown Tests. Hydrogeol. J. 2006, 14, 1018–1027. [Google Scholar] [CrossRef] [Scilit]
- CGWB. Ground Water Year Book: National Capital Territory of Delhi, 2020–2021; Ministry of Jal Shakti, Government of India: New Delhi, India, 2021. [Google Scholar]
- Yeh, H.-F.; Chang, J.-C.; Huang, C.-C.; Chen, H.-Y. Spatial Correlation of Groundwater Level with Natural Factors Using Geographically Weighted Regression Model in the Choushui River Alluvial Fan, Taiwan. Front. Earth Sci. 2022, 10, 977611. [Google Scholar] [CrossRef] [Scilit]
- Biswas, S.; Adhikary, M.; Alam, A.; Islam, N.; Roy, R. Disparities in Access to Water, Sanitation, and Hygiene (WASH) Services and the Status of SDG-6 Implementation across Districts and States in India. Heliyon 2024, 10, e37646. [Google Scholar] [CrossRef] [Scilit] [PubMed]
- Xie, W.-F.; Li, J.-K.; Peng, K.; Zhang, K.; Ullah, Z. The Application of Local Moran’s I and Getis–Ord Gi* to Identify Spatial Patterns and Critical Source Areas of Agricultural Nonpoint Source Pollution. J. Environ. Eng. 2024, 150, 04024011. [Google Scholar] [CrossRef] [Scilit]
- Gleeson, T.; Richter, B. How Much Groundwater Can We Pump and Protect Environmental Flows through Time? Presumptive Standards for Conjunctive Management of Aquifers and Rivers. River Res. Appl. 2018, 34, 83–92. [Google Scholar] [CrossRef] [Scilit]
- Barlow, P.M.; Leake, S.A.; Fienen, M.N. Capture Versus Capture Zones: Clarifying Terminology Related to Sources of Water to Wells. Groundwater 2018, 56, 694–704. [Google Scholar] [CrossRef] [Scilit] [PubMed]
- Lapides, D.A.; Zipper, S.; Hammond, J.C. Identifying Hydrologic Signatures Associated with Streamflow Depletion Caused by Groundwater Pumping. Hydrol. Process. 2023, 37, e14877. [Google Scholar] [CrossRef] [Scilit]
- Syvrud, A.; Pohlner, H.; Punthakey, J.F.; Grant, M.; Green, T. Advancing Urban Water Security in the Indus Basin, Pakistan—Priority Actions for Karachi and Lahore. Water 2021, 13, 3399. [Google Scholar] [CrossRef] [Scilit]
- Satpathy, S.; Jha, R. Intermittent Water Supply in Indian Cities: Considering the Intermittency beyond Demand and Supply. J. Water Supply Res. Technol.-Aqua 2022, 71, 1395–1407. [Google Scholar] [CrossRef] [Scilit]
- Khan, U.; Faheem, H.; Jiang, Z.; Wajid, M.; Younas, M.; Zhang, B. Integrating a GIS-Based Multi-Influence Factors Model with Hydro-Geophysical Exploration for Groundwater Potential and Hydrogeological Assessment: A Case Study in the Karak Watershed, Northern Pakistan. Water 2021, 13, 1255. [Google Scholar] [CrossRef] [Scilit]
- Grönwall, J.; Mulenga, M.; McGranahan, G. Groundwater, Self-Supply and Poor Urban Dwellers: A Review with Case Studies of Bangalore and Lusaka; International Institute for Environment and Development (IIED): London, UK, 2010. [Google Scholar]
- Government of National Capital Territory of Delhi. Economic Survey of Delhi 2023–2024: Water Supply and Sewerage; Government of National Capital Territory of Delhi: New Delhi, India, 2023. [Google Scholar]
- Khalil, S.; Bader Sheikh, S.; Jamal, U.; Khan, H.F. Household Water Insecurities and Willingness to Pay in Karachi. Water Policy 2023, 25, 1139–1160. [Google Scholar] [CrossRef] [Scilit]
- Krishnapillai, S.; Perinpanathan, S.; Sivakumar, S. Households’ Willingness to Pay for Quality of Drinking Water in Jaffna Area of Sri Lanka. J. Water Supply Res. Technol.-Aqua 2020, 69, 629–638. [Google Scholar] [CrossRef] [Scilit]
- Islam, M.K.; Akter, R.; Haider, M.Z. Willingness to Pay for Improved Water Supply Service in Coastal Urban Settings: Evidence from Khulna, Bangladesh. J. Water Supply Res. Technol.-Aqua 2022, 71, 1039–1053. [Google Scholar] [CrossRef] [Scilit]
- Narasimhan, T.N. Water, Law, Science. J. Hydrol. 2008, 349, 125–138. [Google Scholar] [CrossRef] [Scilit]
- Suhag, R. Overview of Ground Water in India; PRS: New Delhi, India, 2016. [Google Scholar]
- Singh, N.P. Space and Ground Water Problem in Delhi. Procedia Environ. Sci. 2010, 2, 407–415. [Google Scholar] [CrossRef] [Scilit]
- Shah, M. Urban Water Systems in India: A Way Forward; Indian Council for Research on International Economic Relations (ICRIER): New Delhi, India, 2016. [Google Scholar]
- Chaudhuri, S.; Roy, M. Irrigation Water Pricing in India as a Means to Conserve Water Resources: Challenges and Potential Future Opportunities. Environ. Conserv. 2019, 46, 99–102. [Google Scholar] [CrossRef] [Scilit]
- Bansal, A. Private Tankers: A Legitimate Solution to Delhi’s Water Woes? SSRN J. 2012. [Google Scholar] [CrossRef] [Scilit]
- Kicklighter, C.E.; Scott Thomas, W.; Kicklighter, J.C. Water, Creativity and Meaning: Multidisciplinary Understandings of Human–Water Relationships, 1st ed.; Roberts, L., Phillips, K., Eds.; Routledge: Abingdon, UK; New York, NY, USA, 2018. [Google Scholar]
- Di Baldassarre, G.; Sivapalan, M.; Rusca, M.; Cudennec, C.; Garcia, M.; Kreibich, H.; Konar, M.; Mondino, E.; Mård, J.; Pande, S.; et al. Sociohydrology: Scientific Challenges in Addressing the Sustainable Development Goals. Water Resour. Res. 2019, 55, 6327–6355. [Google Scholar] [CrossRef] [Scilit] [PubMed]
- Sivapalan, M.; Savenije, H.H.G.; Blöschl, G. Socio-hydrology: A New Science of People and Water. Hydrol. Process. 2012, 26, 1270–1276. [Google Scholar] [CrossRef] [Scilit]
- Narain, V. Peri-Urban Water (In)Security in India: A Review. Water Altern. 2019, 19, 253–270. [Google Scholar]
- Narain, V. Whose Land? Whose Water? Water Rights, Equity and Justice in a Peri-Urban Context. Local Environ. 2014, 19, 974–989. [Google Scholar] [CrossRef] [Scilit]
- Narain, V.; Singh, A.K. Flowing against the Current: The Socio-Technical Mediation of Water (in)Security in Periurban Gurgaon, India. Geoforum 2017, 81, 66–75. [Google Scholar] [CrossRef] [Scilit]
- Packialakshmi, S.; K Ambujam, N.; Nelliyat, P. Groundwater Market and Its Implications on Water Resources and Agriculture in the Southern Peri-Urban Interface, Chennai, India. Environ. Dev. Sustain. 2011, 13, 423–438. [Google Scholar] [CrossRef] [Scilit]
- Prakash, A. The Periurban Water Security Problem: A Case Study of Hyderabad in Southern India. Water Policy 2014, 16, 454–469. [Google Scholar] [CrossRef] [Scilit]
- Chaudhuri, S.; Roy, M.; McDonald, L.M.; Emendack, Y. Water for All (Har Ghar Jal): Rural Water Supply Services (RWSS) in India (2013–2018), Challenges and Opportunities. Int. J. Rural Manag. 2020, 16, 254–284. [Google Scholar] [CrossRef] [Scilit]
- Mollinga, P.P.; Meinzen-Dick, R. Water, Politics and Development: The Framing of a Water Security Research Agenda; Center for Development Research, University of Bonn: Bonn, Germany, 2006. [Google Scholar]
- Raju, K.; Gulat, A.; Meinzen-Dick, R. Participatory Irrigation Management in India: Analysis of Institutional Performance in Selected States; Centre for Development Alternatives: Ahmedabad, India, 2008. [Google Scholar]
- Pahl-Wostl, C. A Conceptual Framework for Analysing Adaptive Capacity and Multi-Level Learning Processes in Resource Governance Regimes. Glob. Environ. Change 2009, 19, 354–365. [Google Scholar] [CrossRef] [Scilit]
- Shah, T. Taming the Anarchy: Groundwater Governance in South Asia; Resources for the Future (RFF) and International Water Management Institute (IWMI): Colombo, Sri Lanka, 2009. [Google Scholar]
- Elci, A.; Molz, F.J.; Waldrop, W.R. Implications of Observed and Simulated Ambient Flow in Monitoring Wells. Groundwater 2001, 39, 853–862. [Google Scholar] [CrossRef] [Scilit] [PubMed]
- Post, V.; Kooi, H.; Simmons, C. Using Hydraulic Head Measurements in Variable-Density Ground Water Flow Analyses. Groundwater 2007, 45, 664–671. [Google Scholar] [CrossRef] [Scilit] [PubMed]
- Sterling, S.N.; Parker, B.L.; Cherry, J.A.; Williams, J.H.; Lane, J.W.; Haeni, F.P. Vertical Cross Contamination of Trichloroethylene in a Borehole in Fractured Sandstone. Groundwater 2005, 43, 557–573. [Google Scholar] [CrossRef] [Scilit] [PubMed]
- Anderson, M.; Wossner, W.; Hunt, R. Applied Groundwater Modeling: Simulation of Flow and Advective Transport; Academic Press: San Diego, CA, USA, 2015. [Google Scholar]
- Li, J.; Heap, A.D. A Review of Comparative Studies of Spatial Interpolation Methods in Environmental Sciences: Performance and Impact Factors. Ecol. Inform. 2011, 6, 228–241. [Google Scholar] [CrossRef] [Scilit]
- Lu, G.Y.; Wong, D.W. An Adaptive Inverse-Distance Weighting Spatial Interpolation Technique. Comput. Geosci. 2008, 34, 1044–1055. [Google Scholar] [CrossRef] [Scilit]
- Dash, C.J.; Sarangi, A.; Singh, D.K. Spatial variability of groundwater depth and quality parameters in the National Capital Territory of Delhi. Environ. Manag. 2010, 45, 640–650. [Google Scholar] [CrossRef] [Scilit] [PubMed]
- Becke, A.L.; Solórzano-Rivas, S.C.; Werner, A.D. The Watertable Fluctuation Method of Recharge Estimation: A Review. Adv. Water Resour. 2024, 189, 104635. [Google Scholar] [CrossRef] [Scilit]
- Boumaiza, L.; Chesnaux, R.; Drias, T.; Walter, J.; Stumpp, C. Using Vadose-Zone Water Stable Isotope Profiles for Assessing Groundwater Recharge under Different Climatic Conditions. Hydrol. Sci. J. 2021, 66, 1597–1609. [Google Scholar] [CrossRef] [Scilit]
- Sahraei, A.; Kraft, P.; Windhorst, D.; Breuer, L. High-Resolution, In Situ Monitoring of Stable Isotopes of Water Revealed Insight into Hydrological Response Behavior. Water 2020, 12, 565. [Google Scholar] [CrossRef] [Scilit]
- Abiye, T.A.; Demlie, M.B.; Mengistu, H. An Overview of Aquifer Physiognomies and the δ18O and δ2H Distribution in the South African Groundwaters. Hydrology 2021, 8, 68. [Google Scholar] [CrossRef] [Scilit]
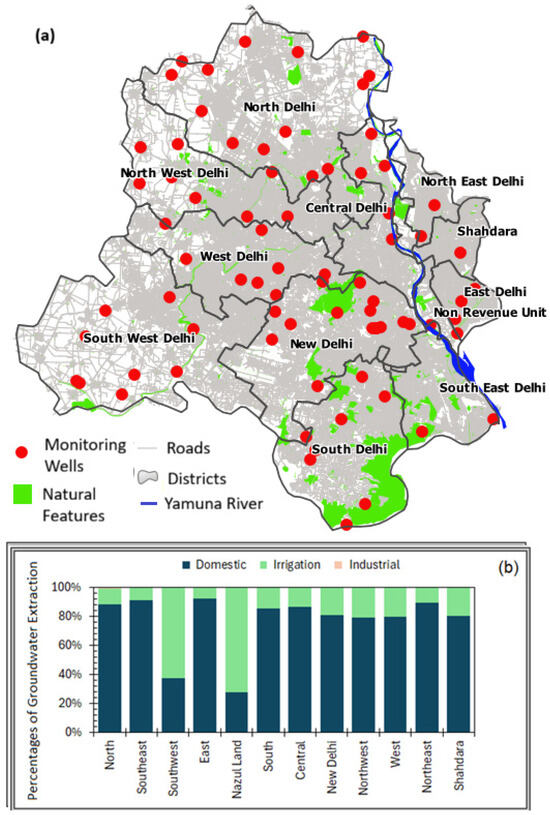
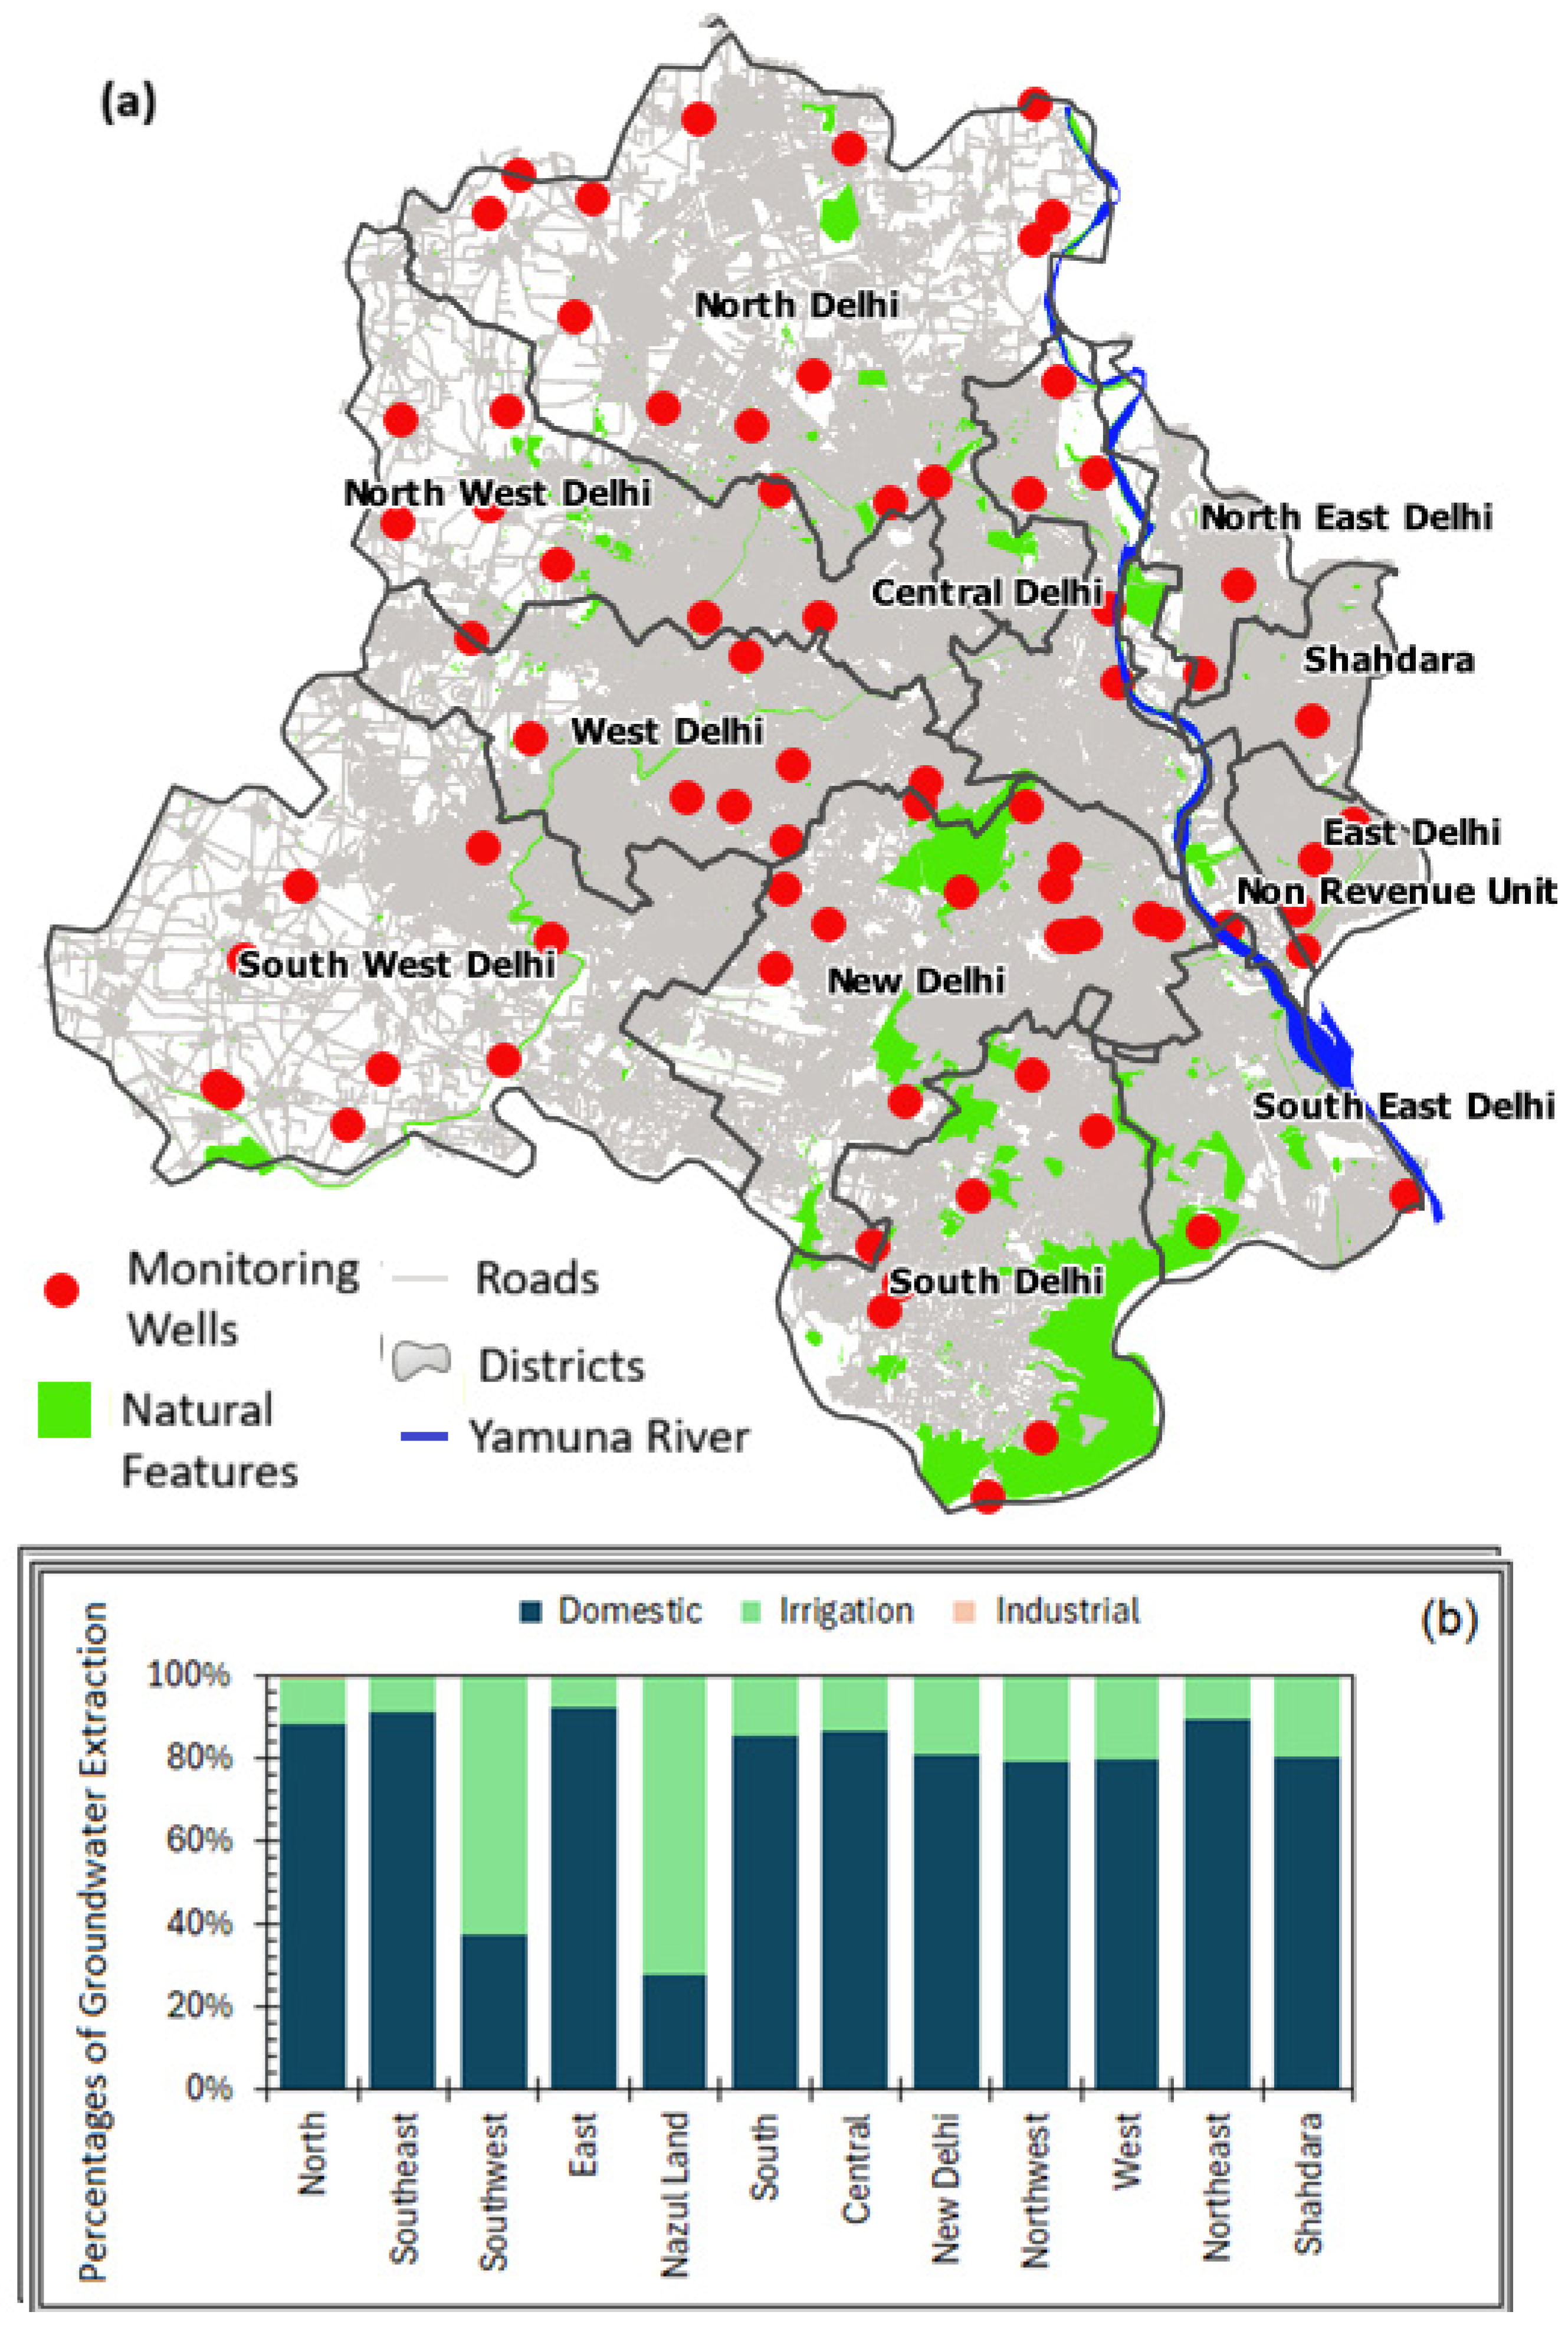
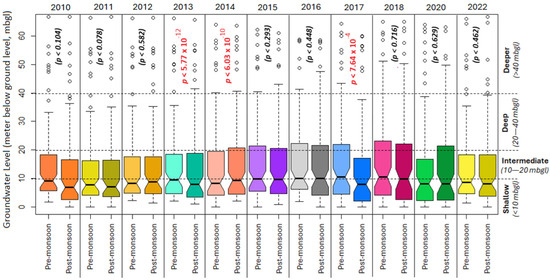
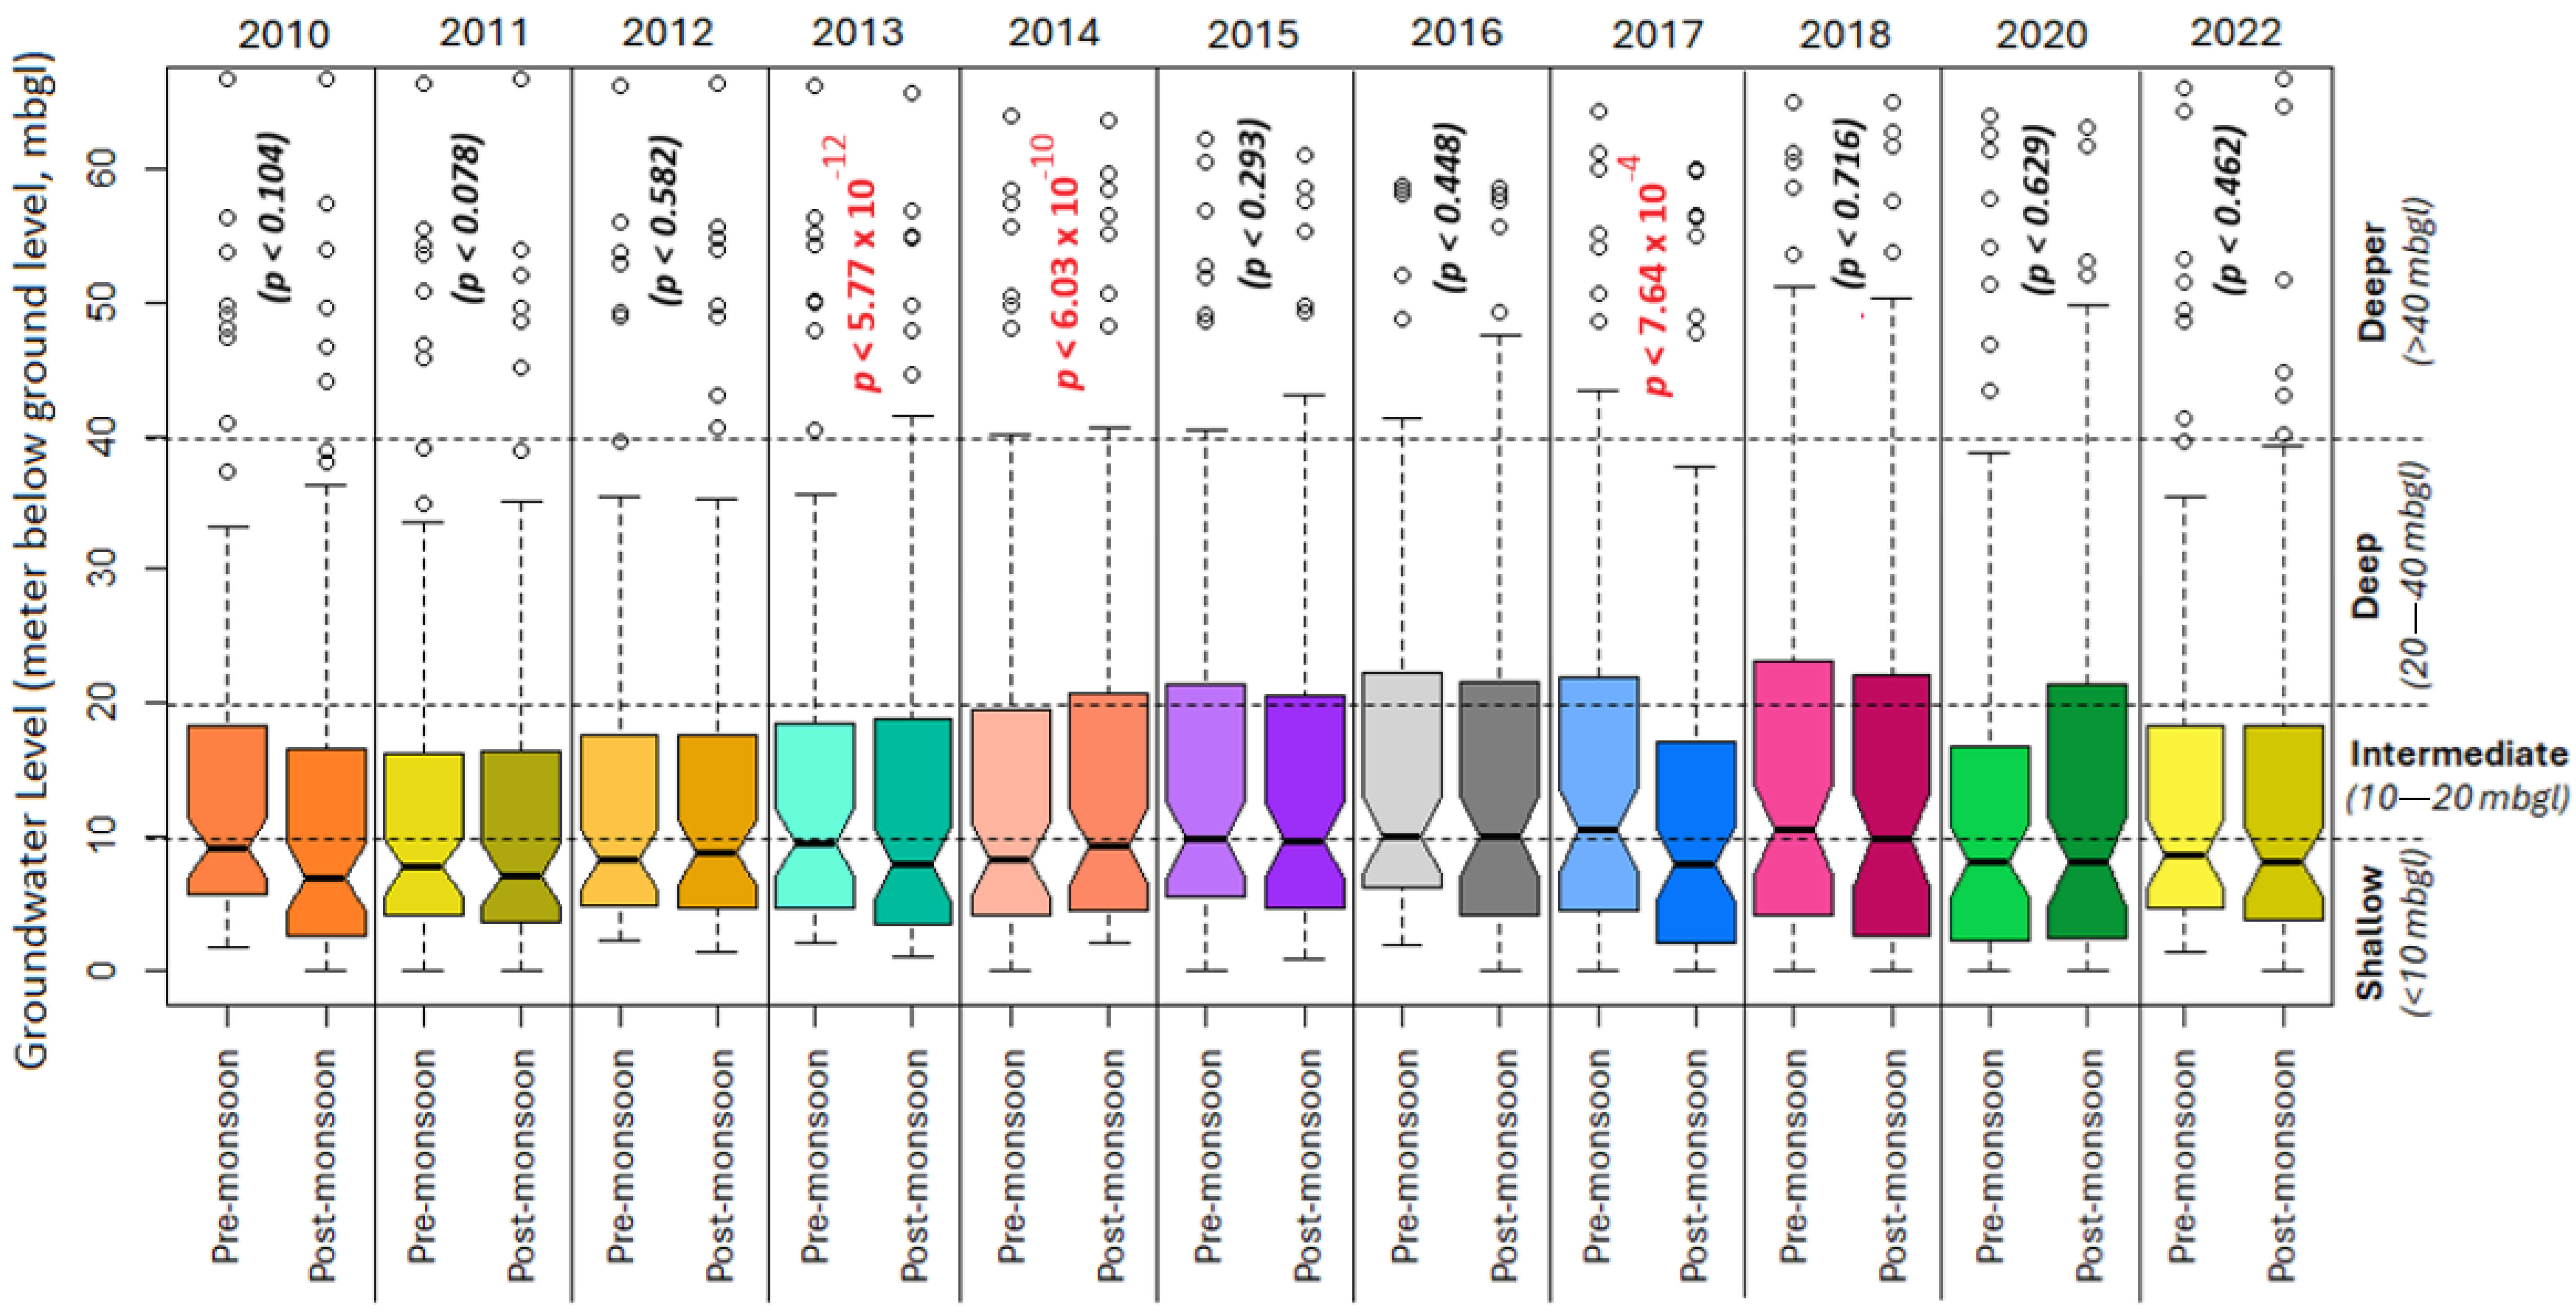
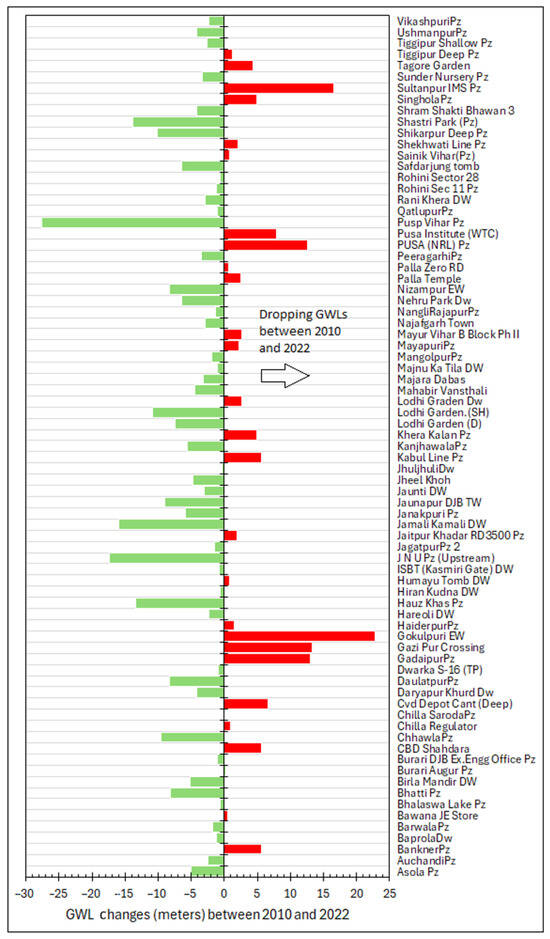
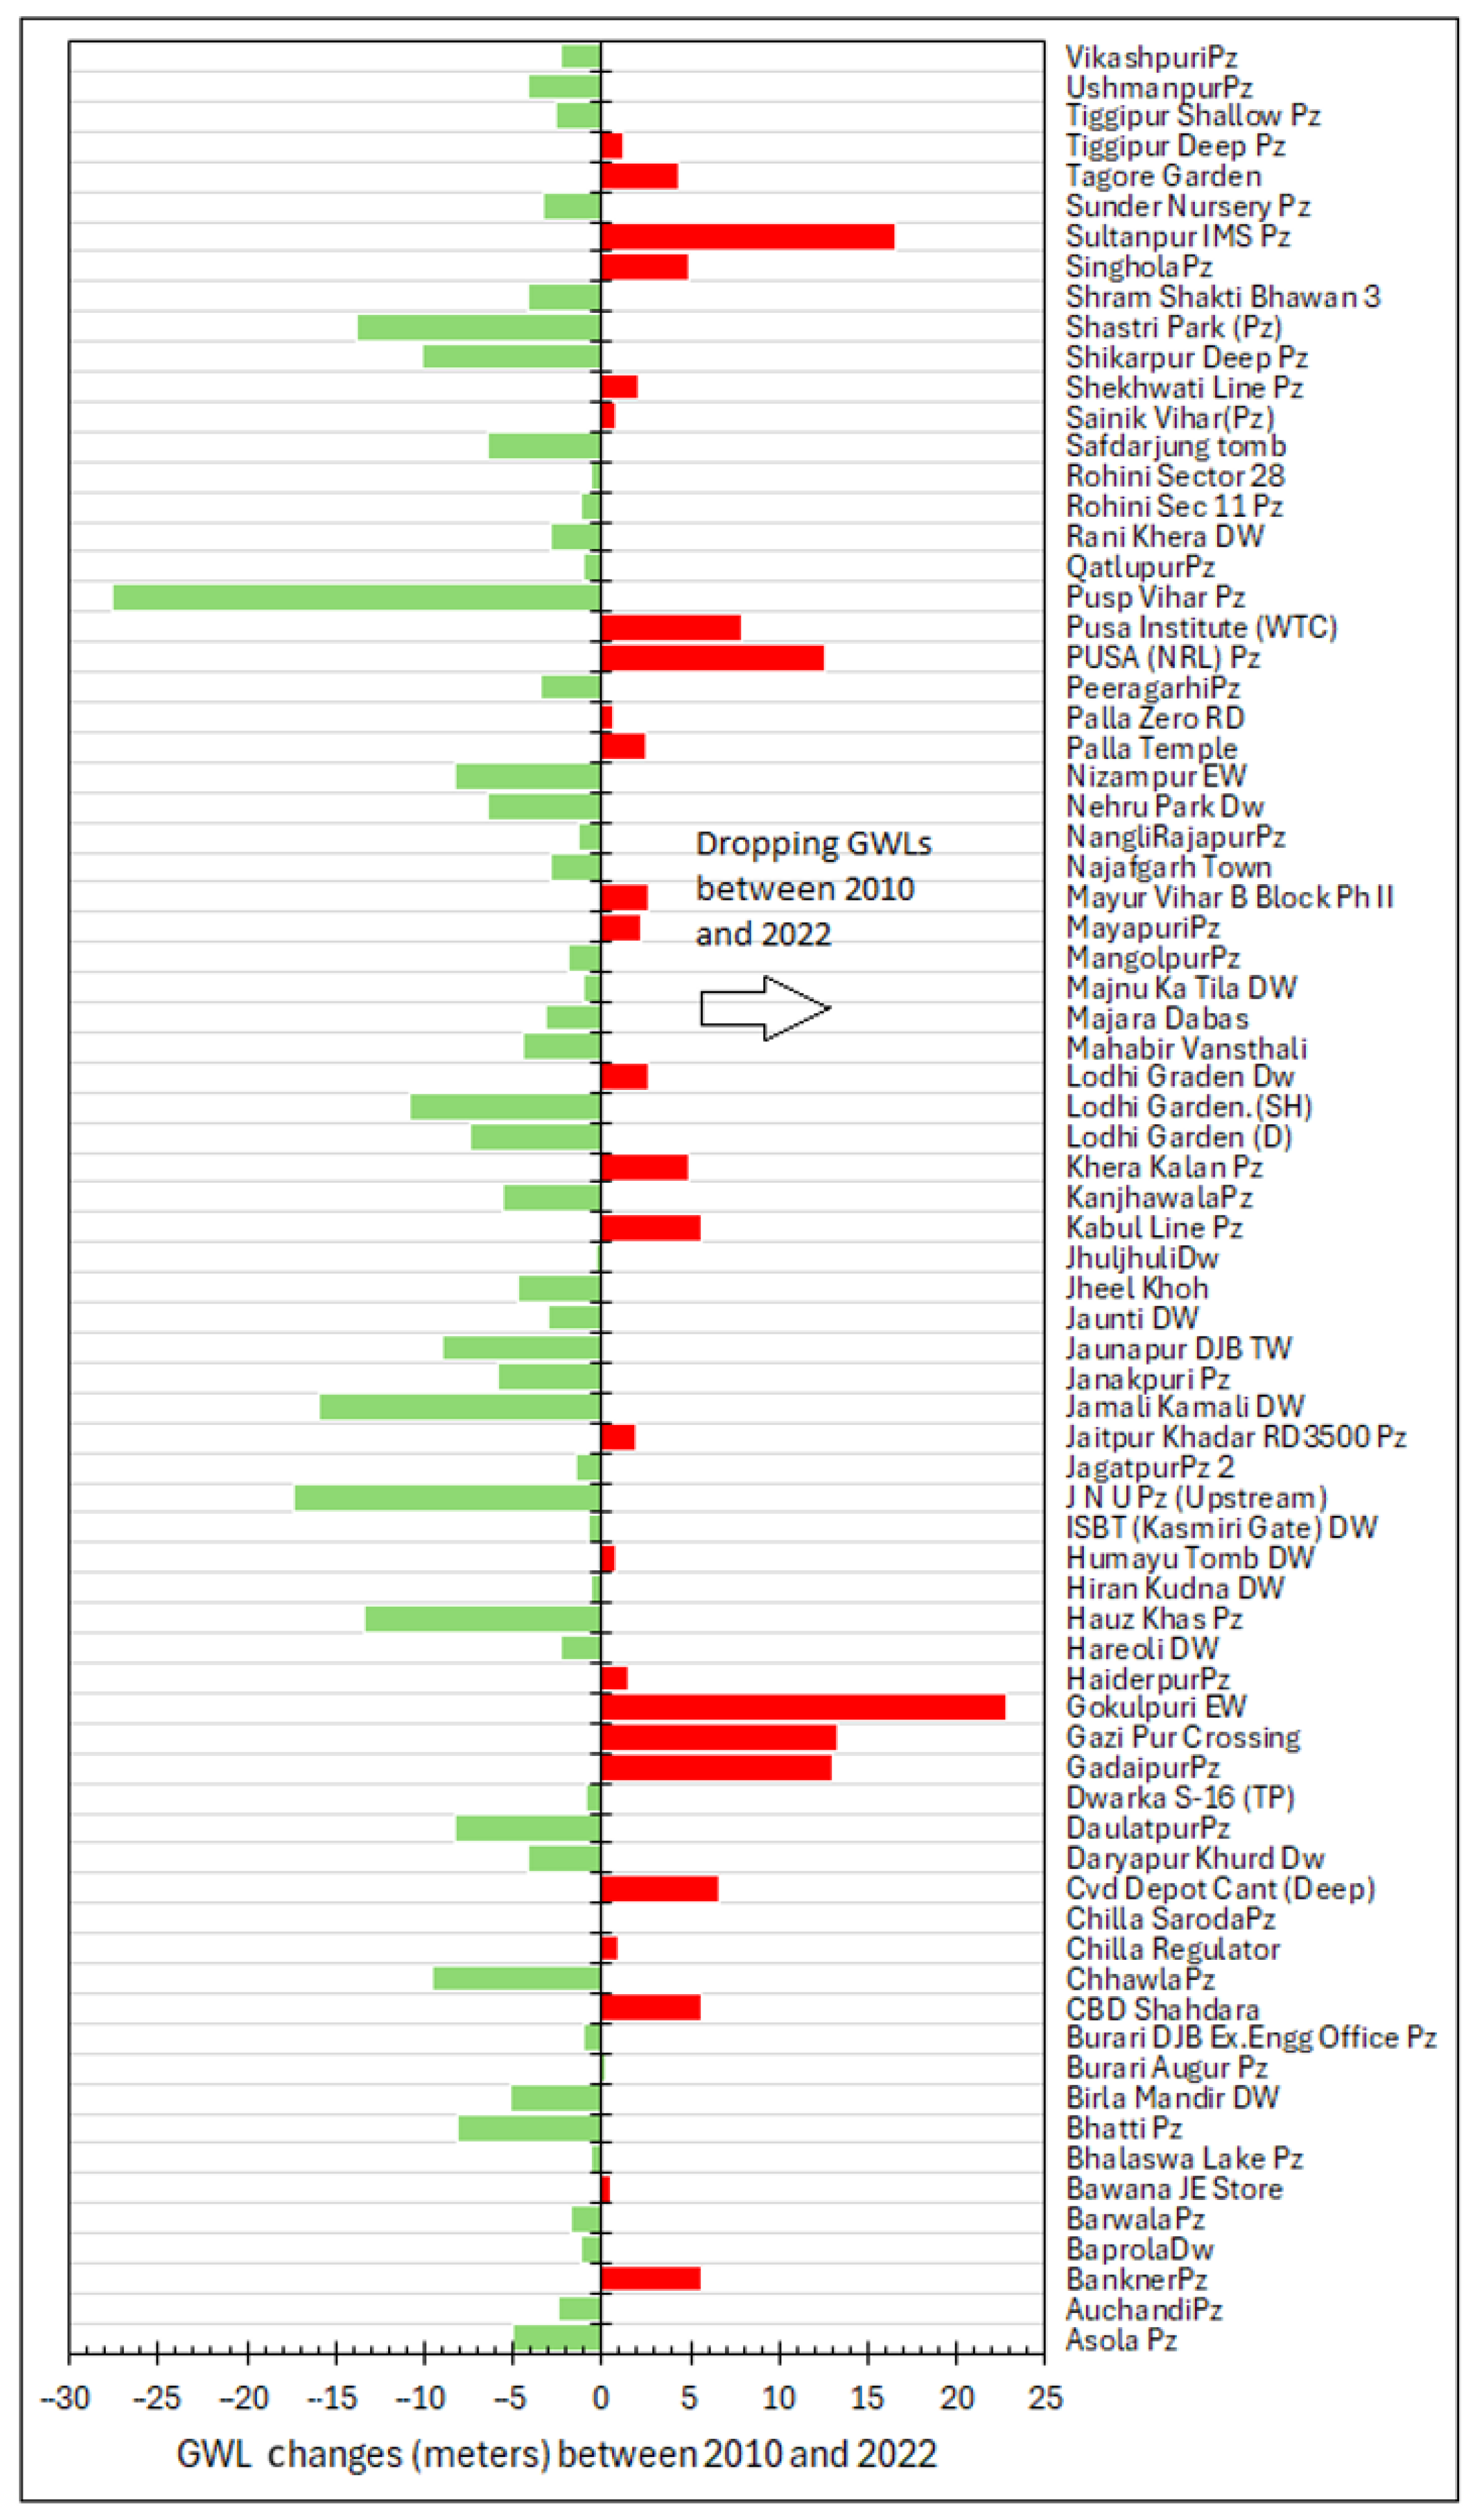
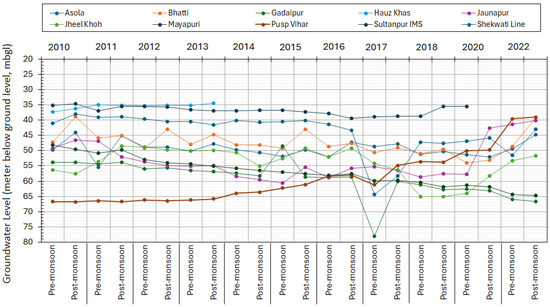
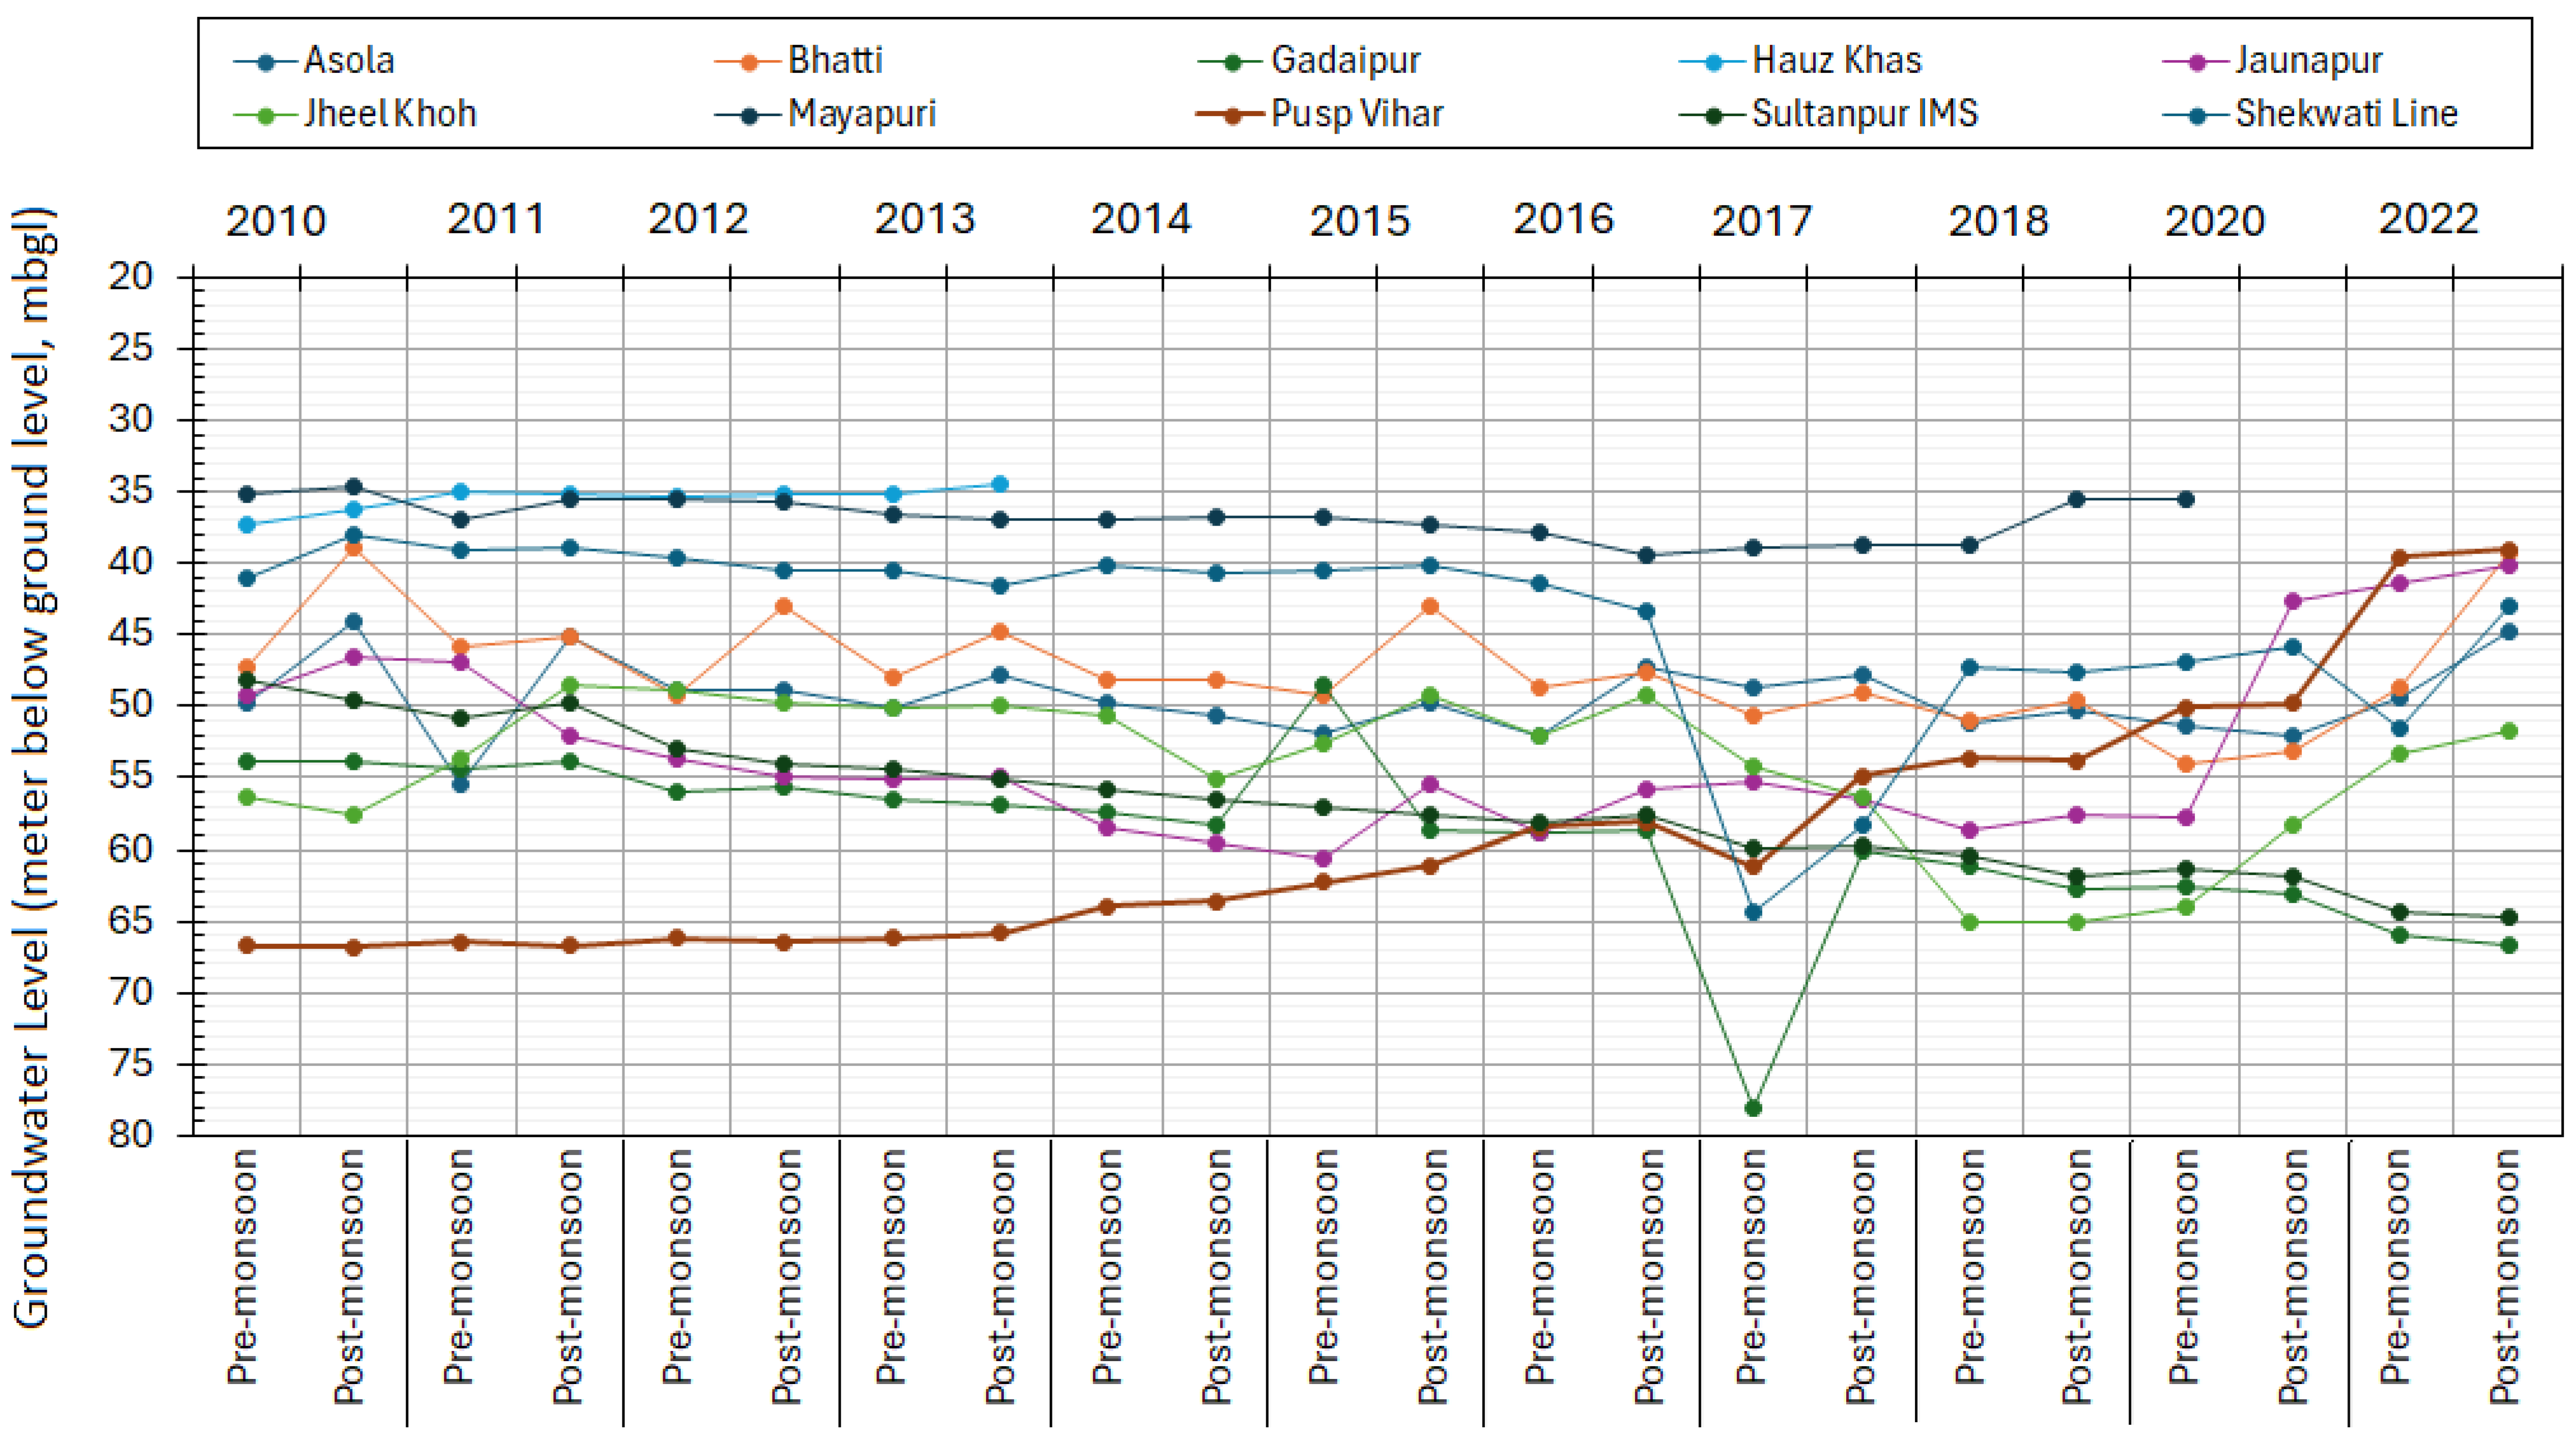
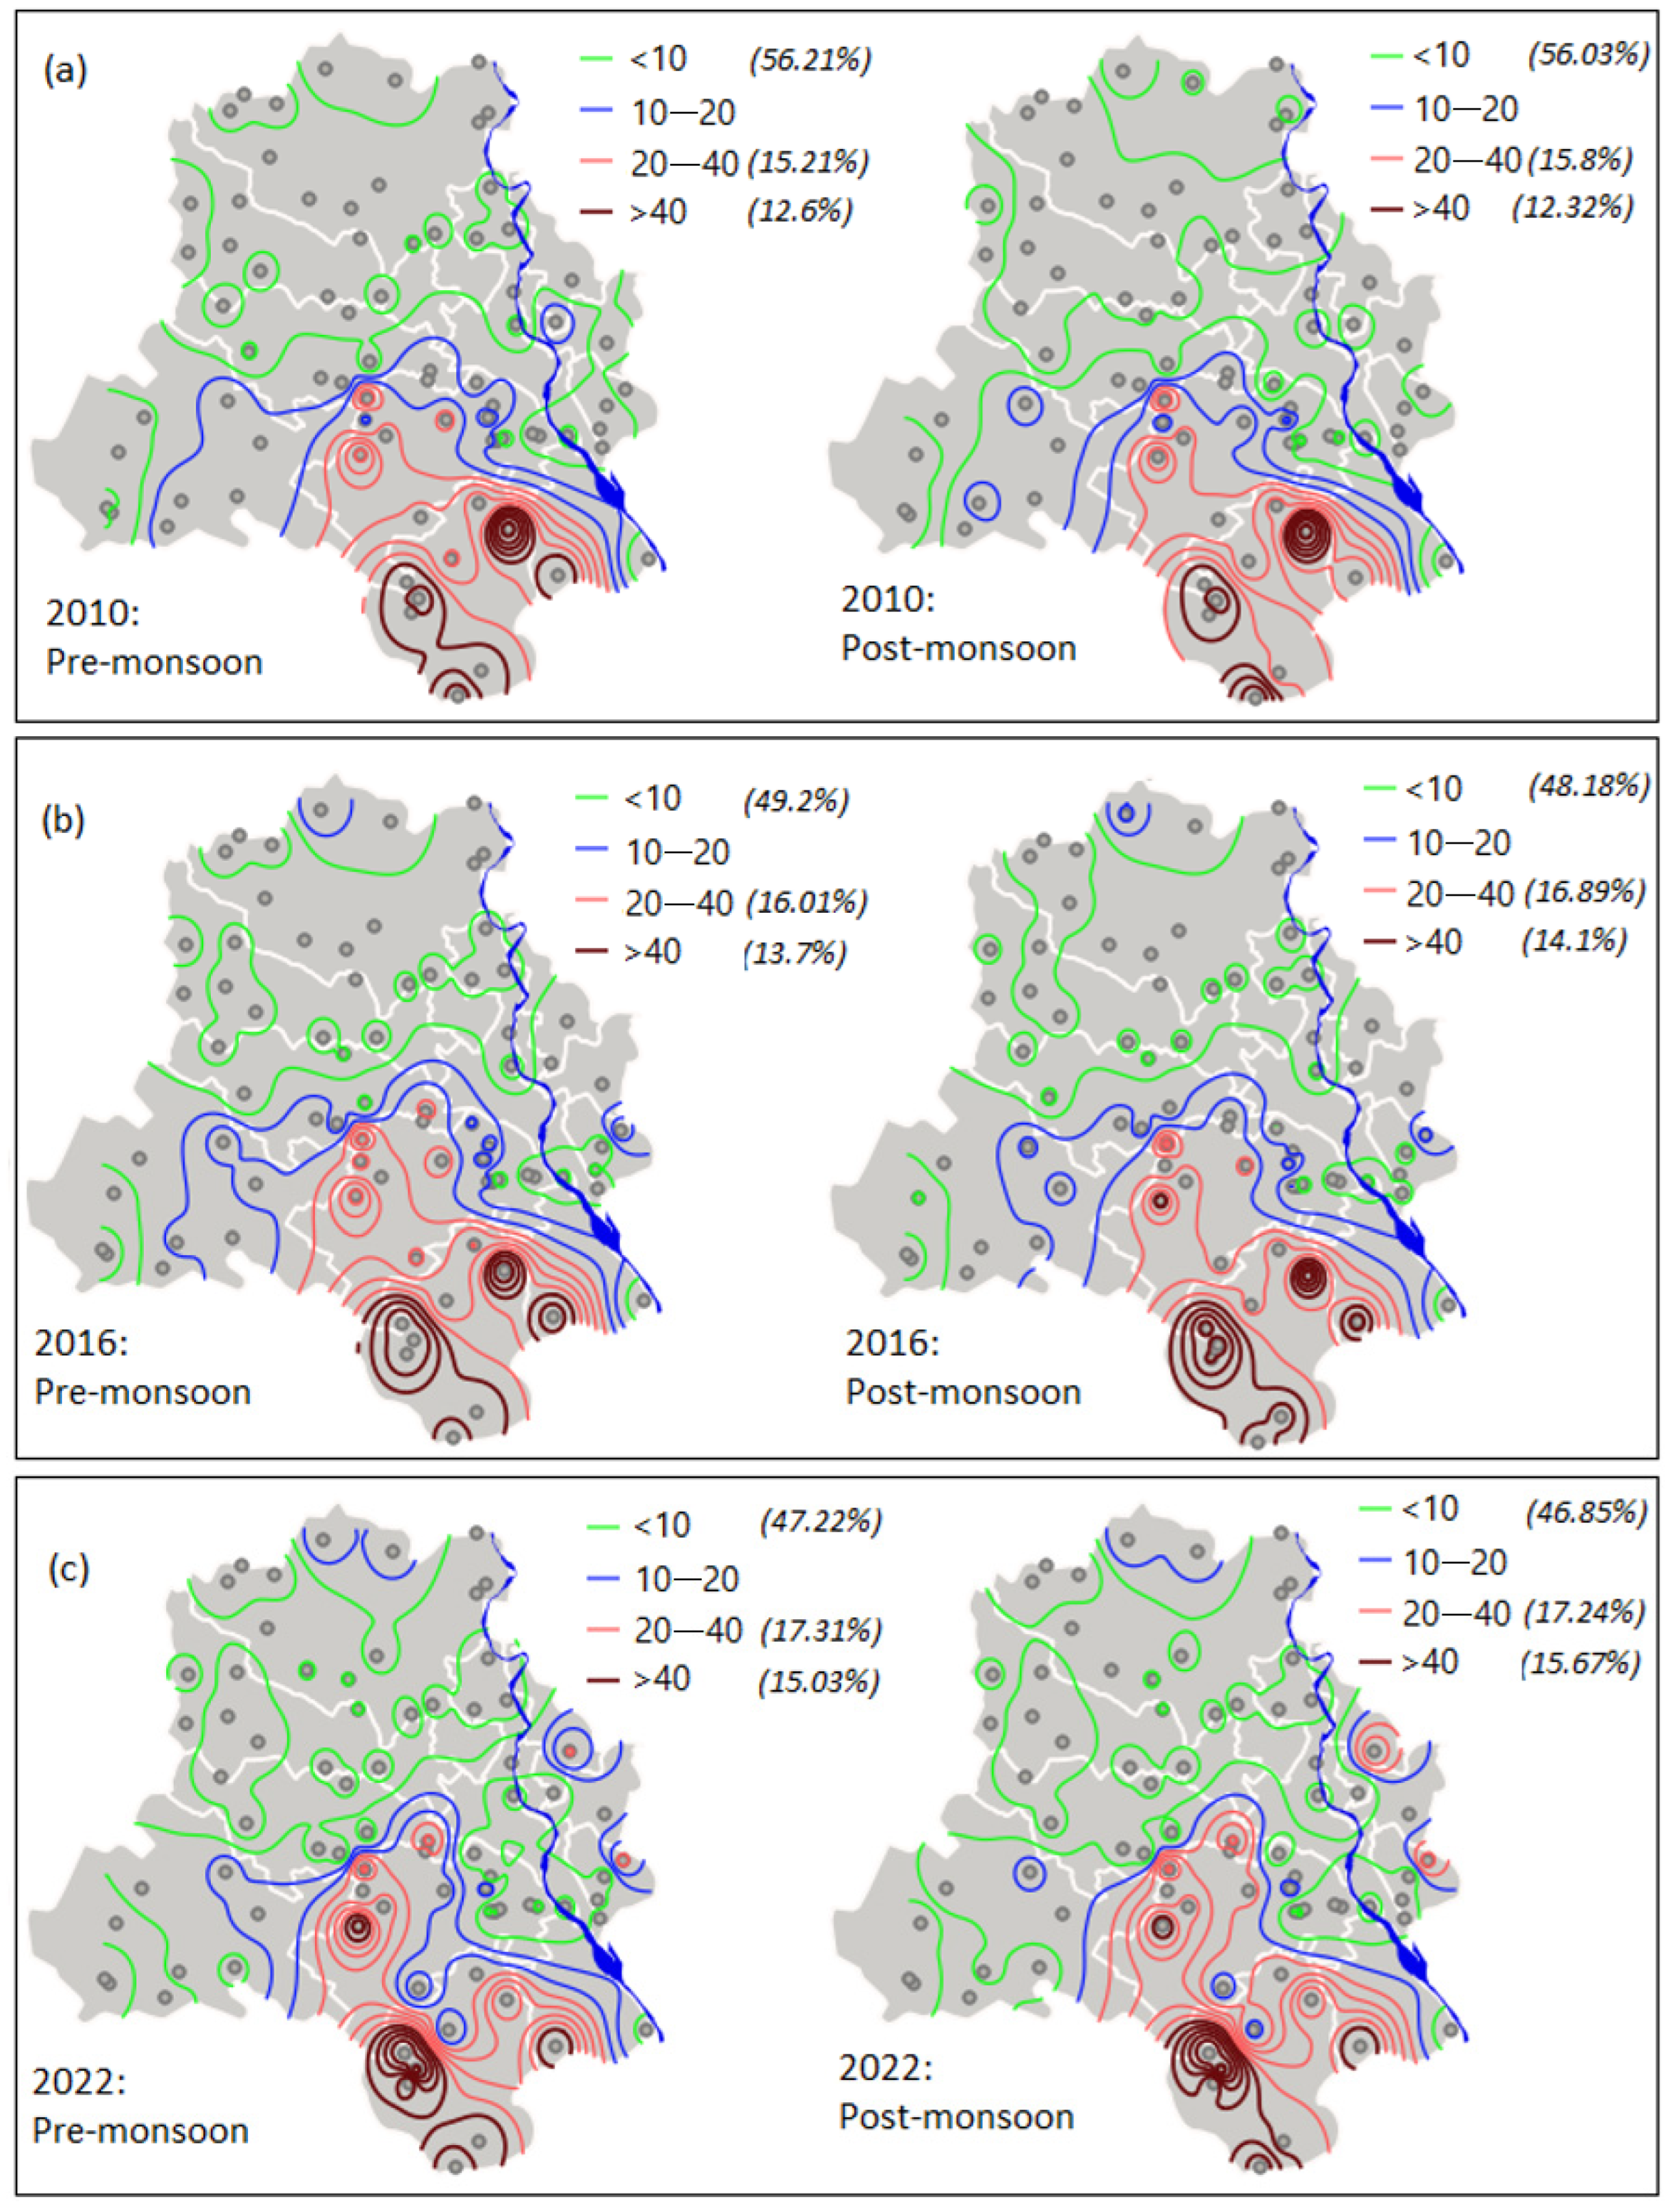
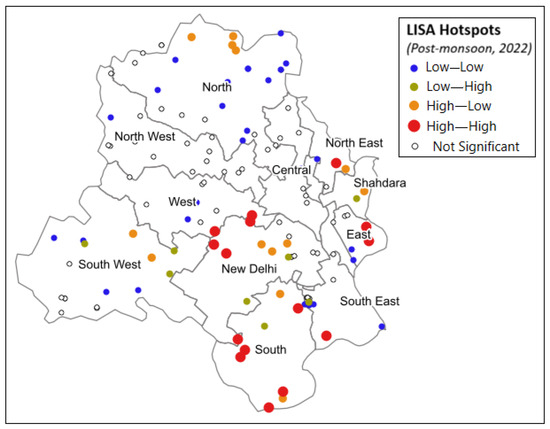
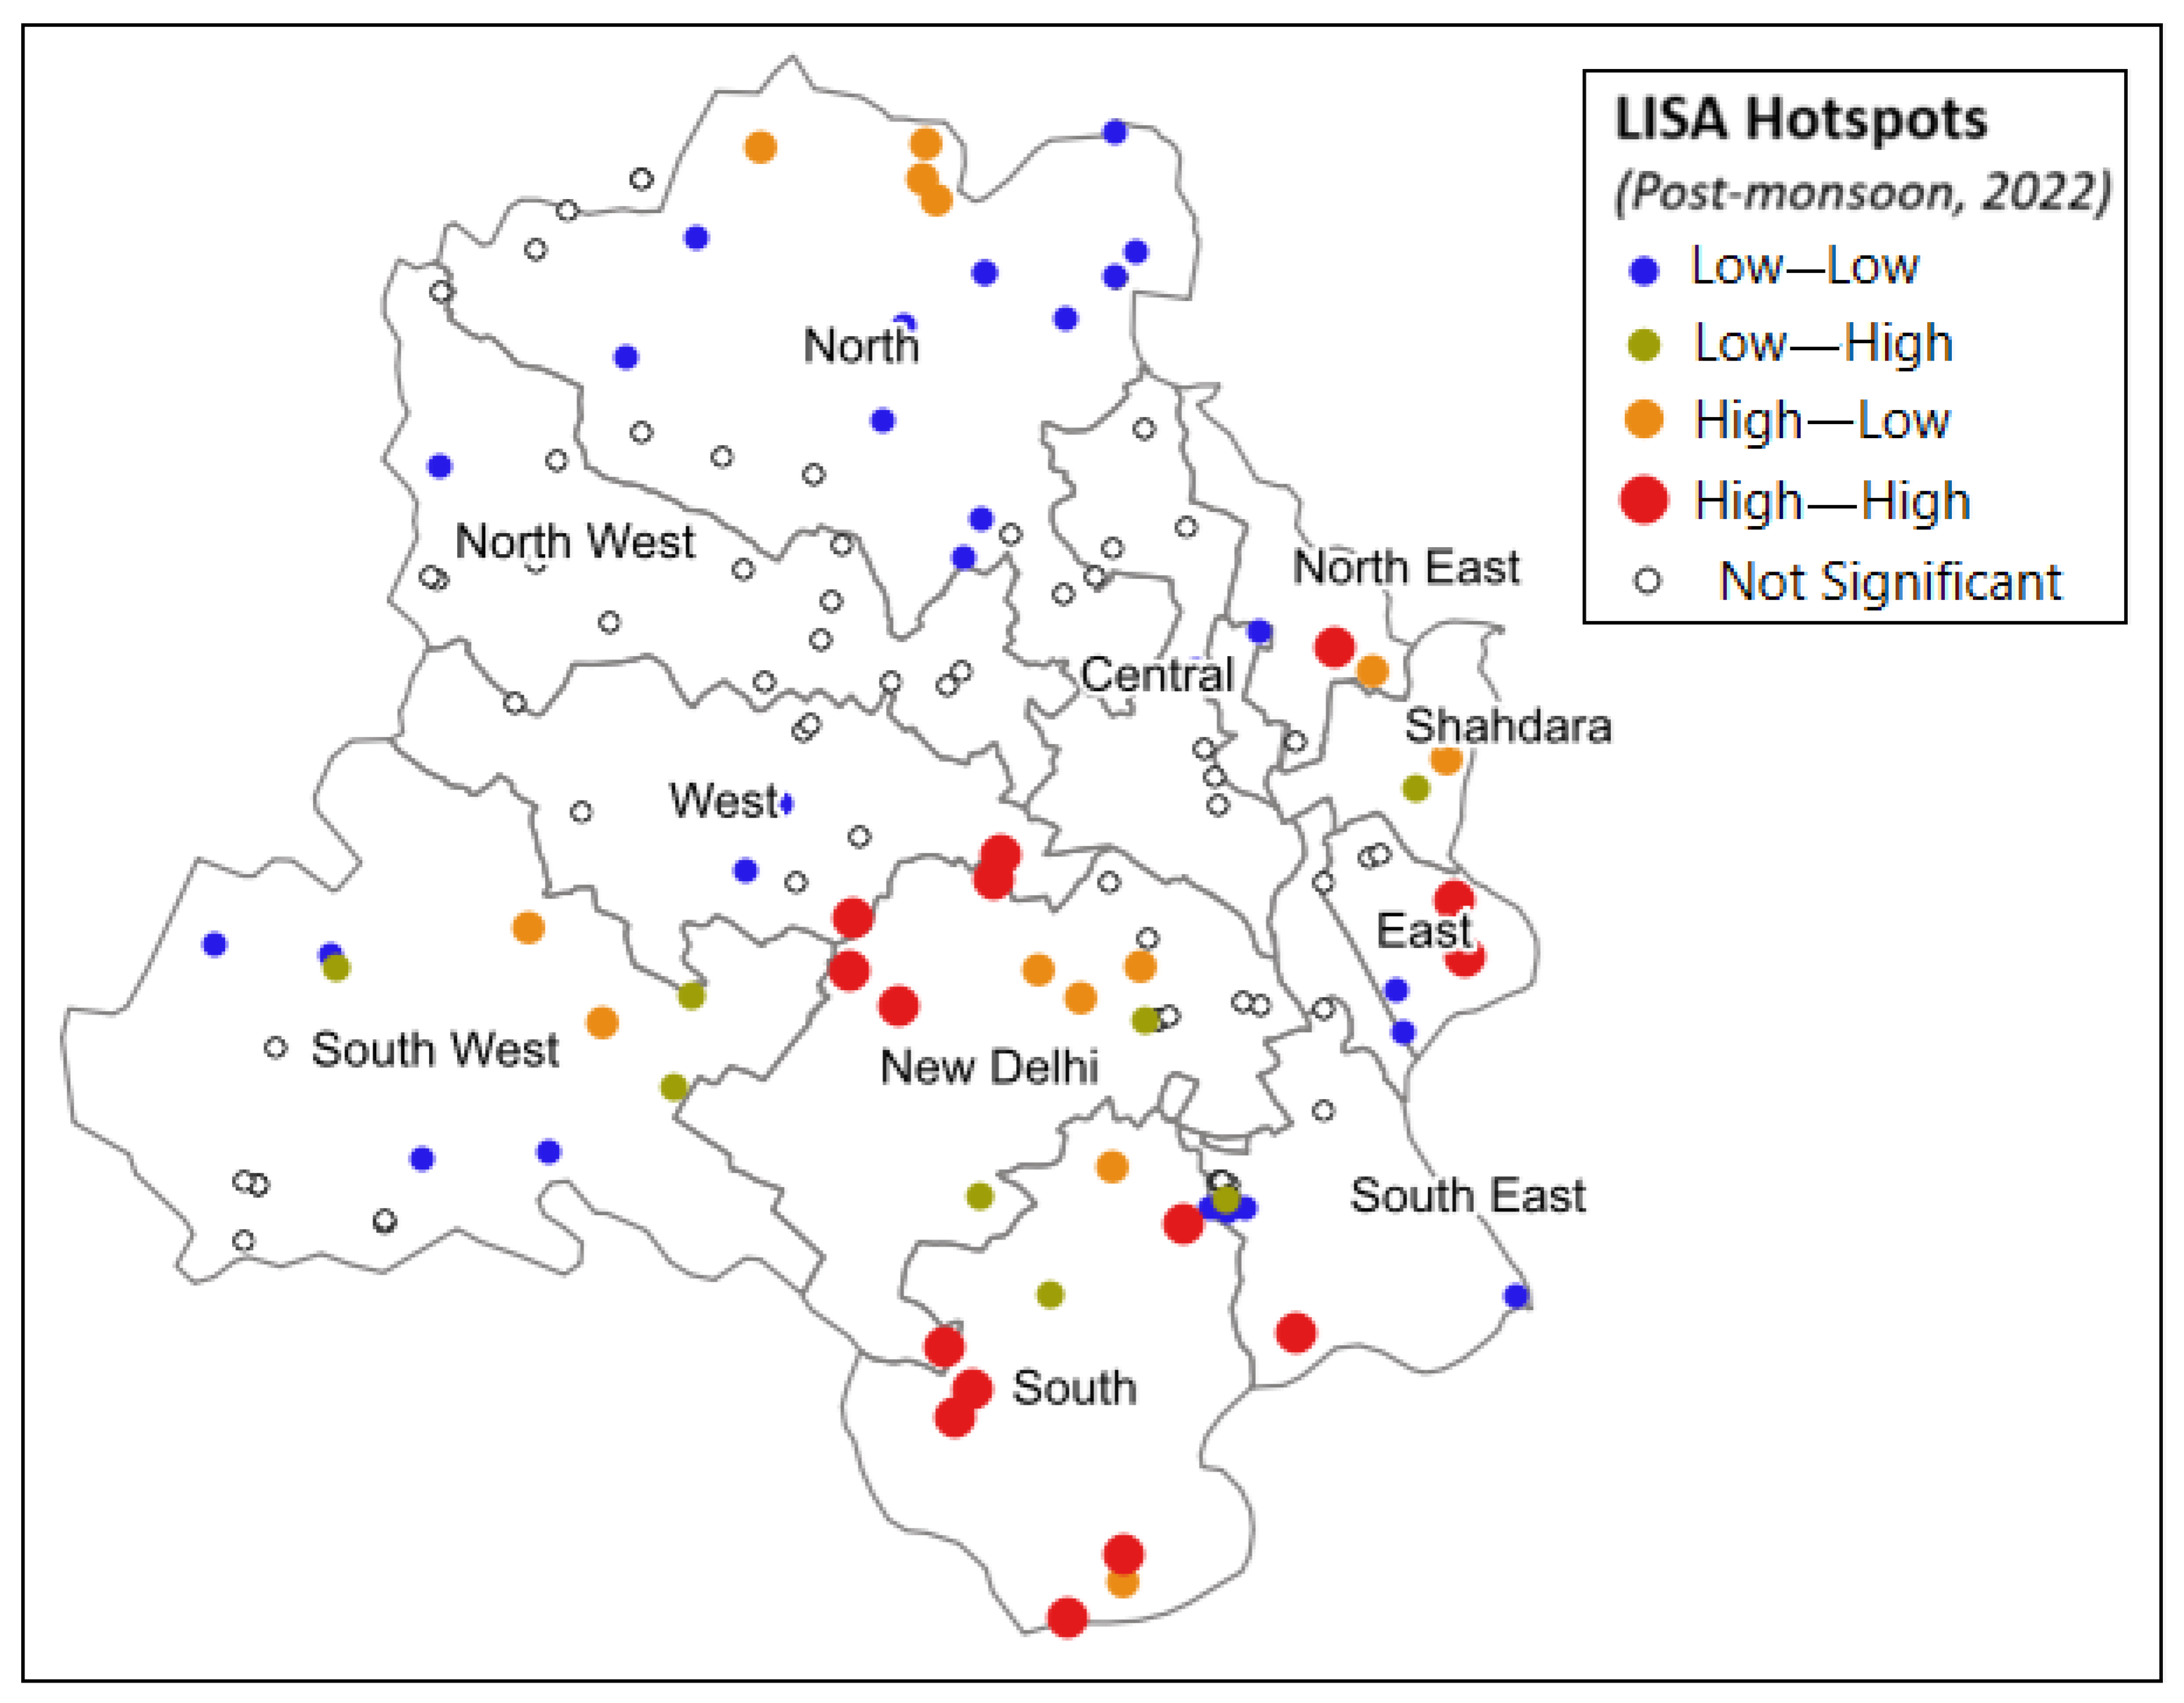
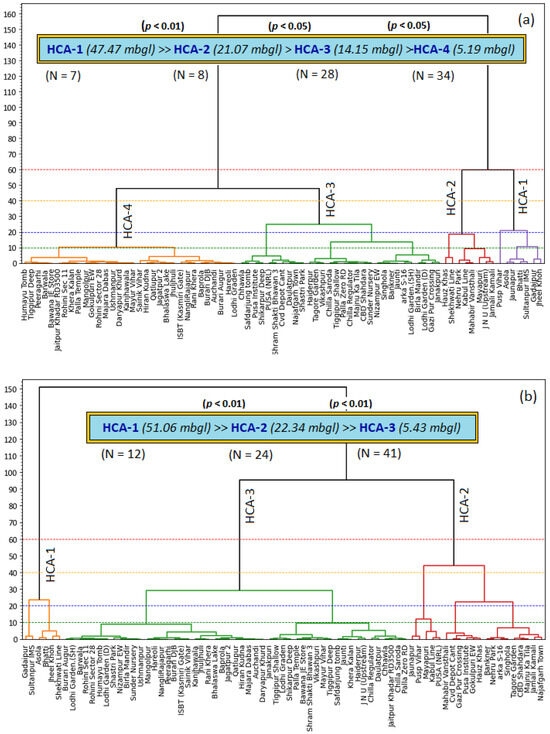
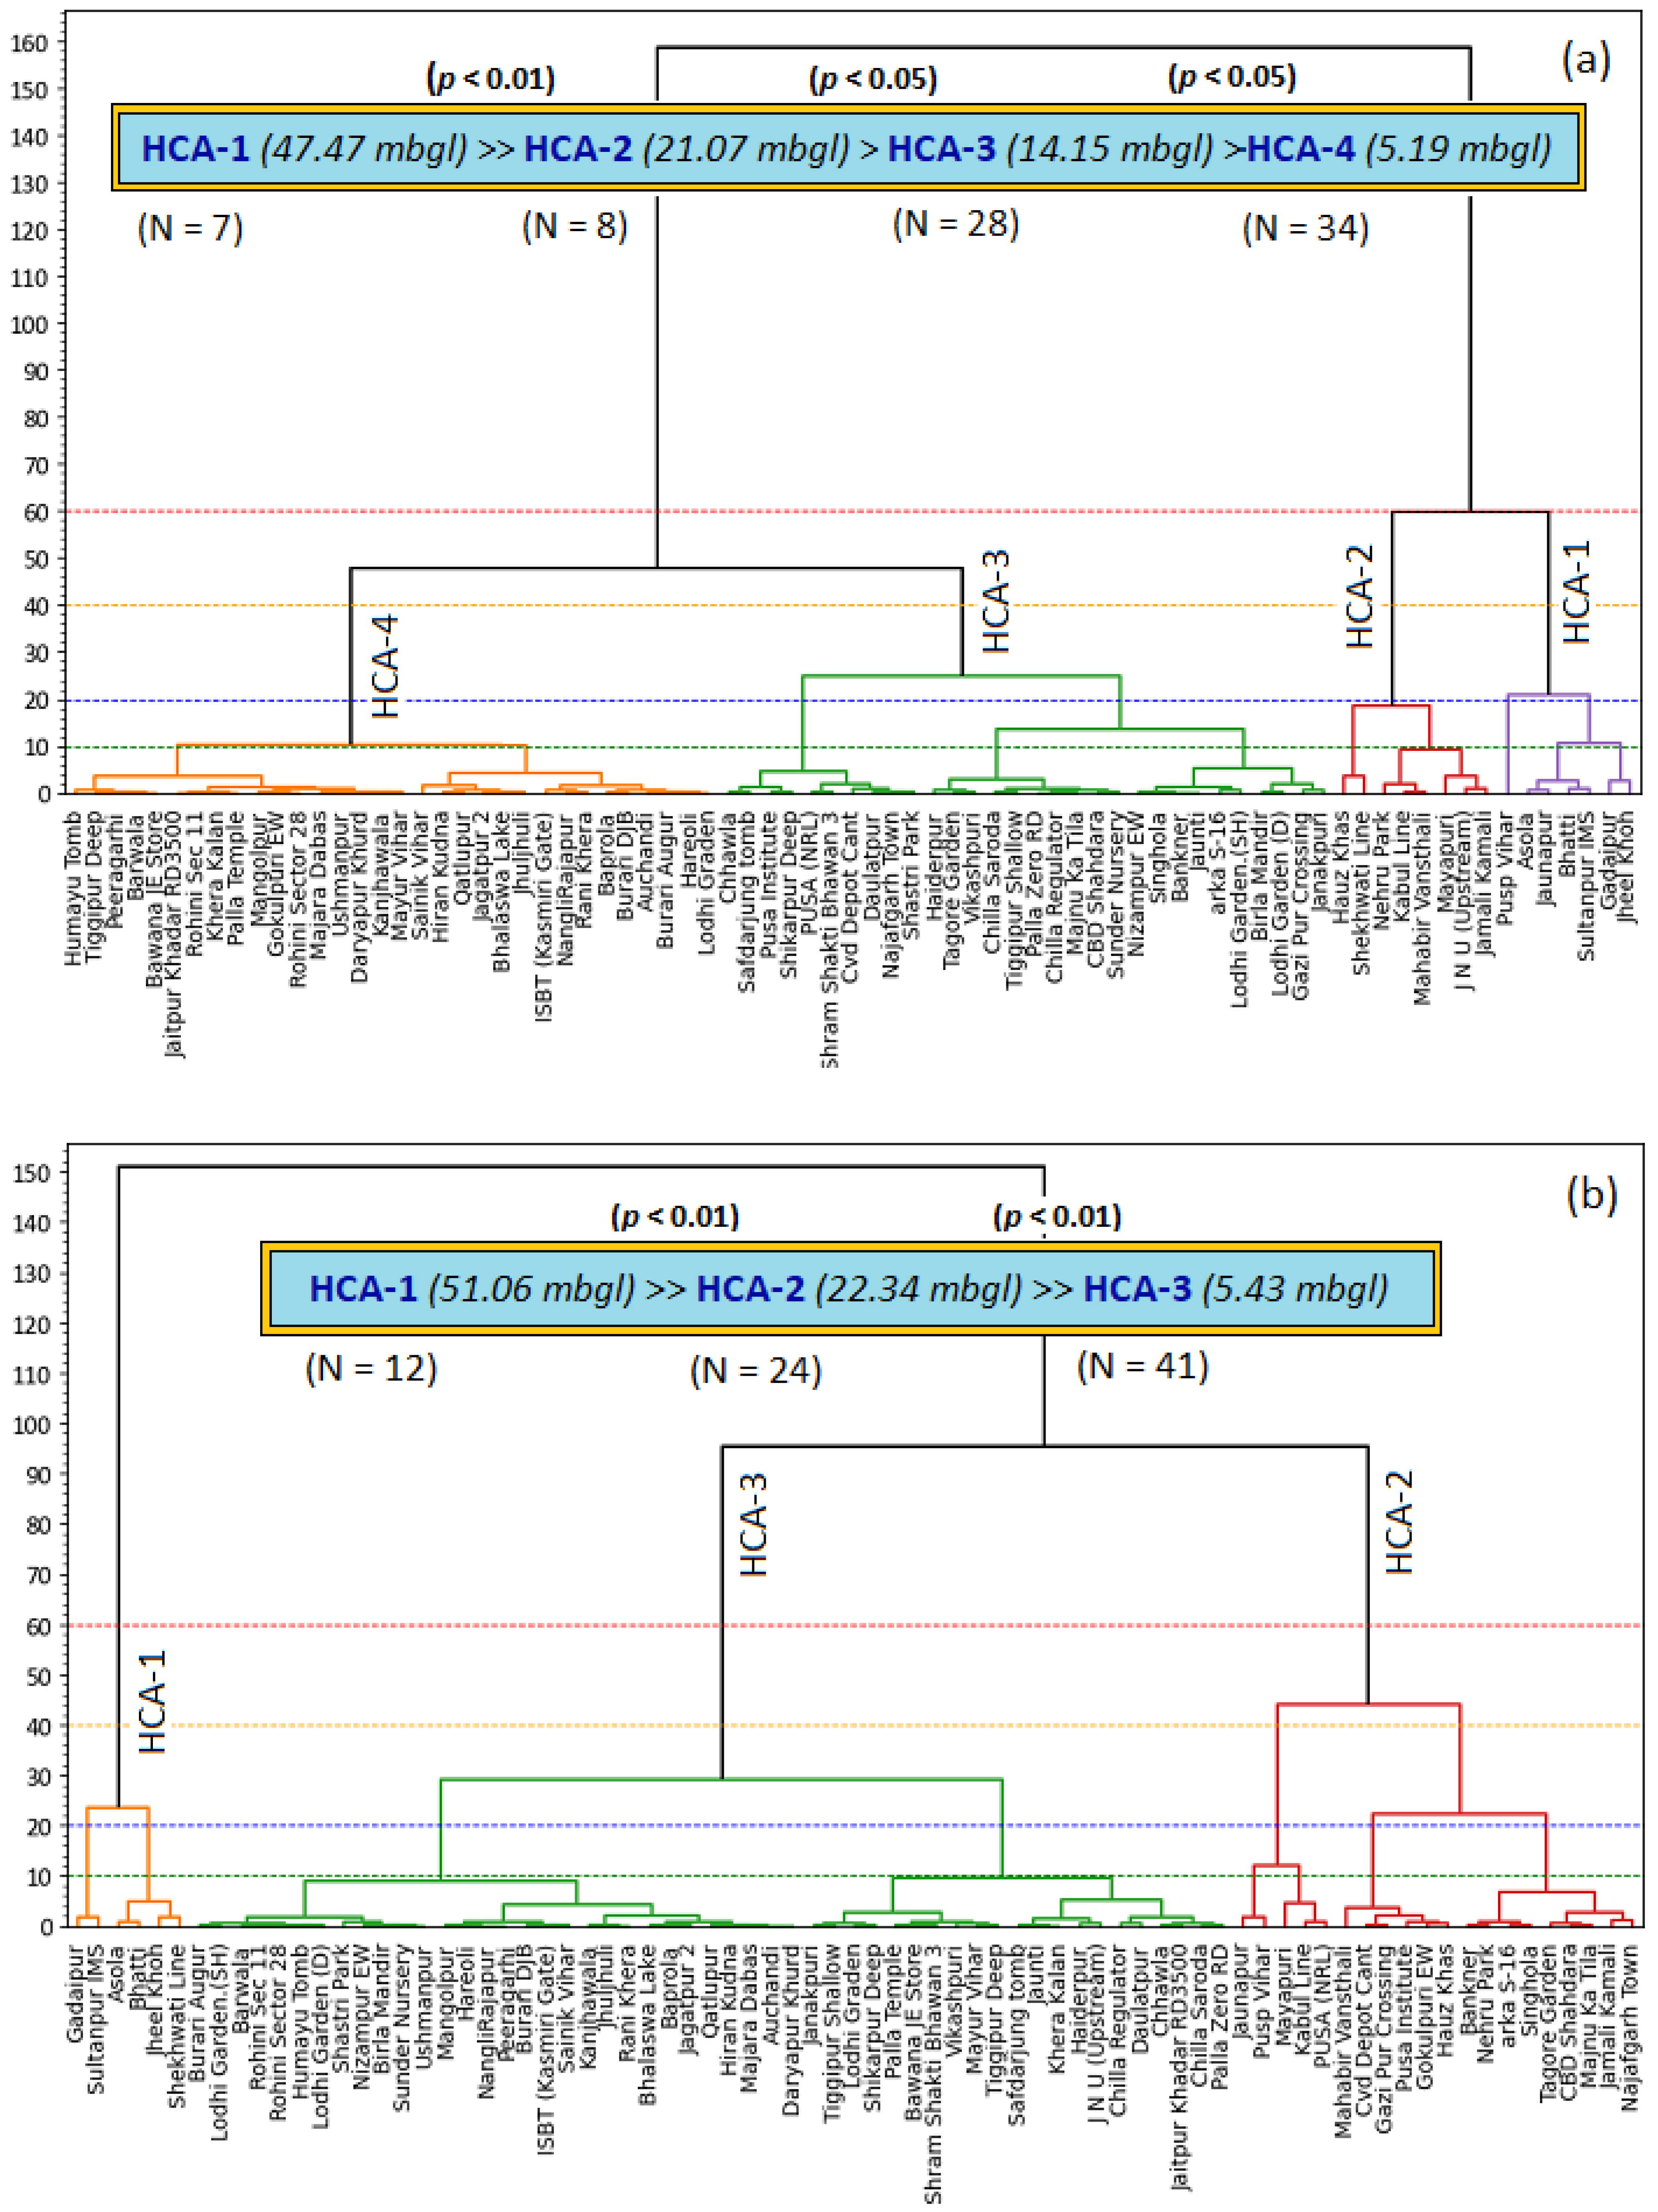
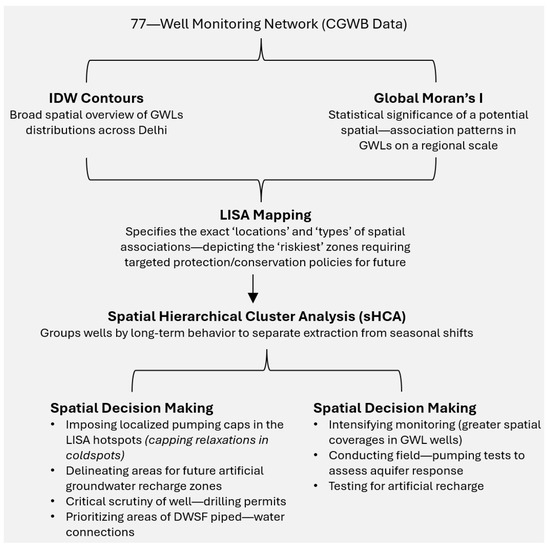
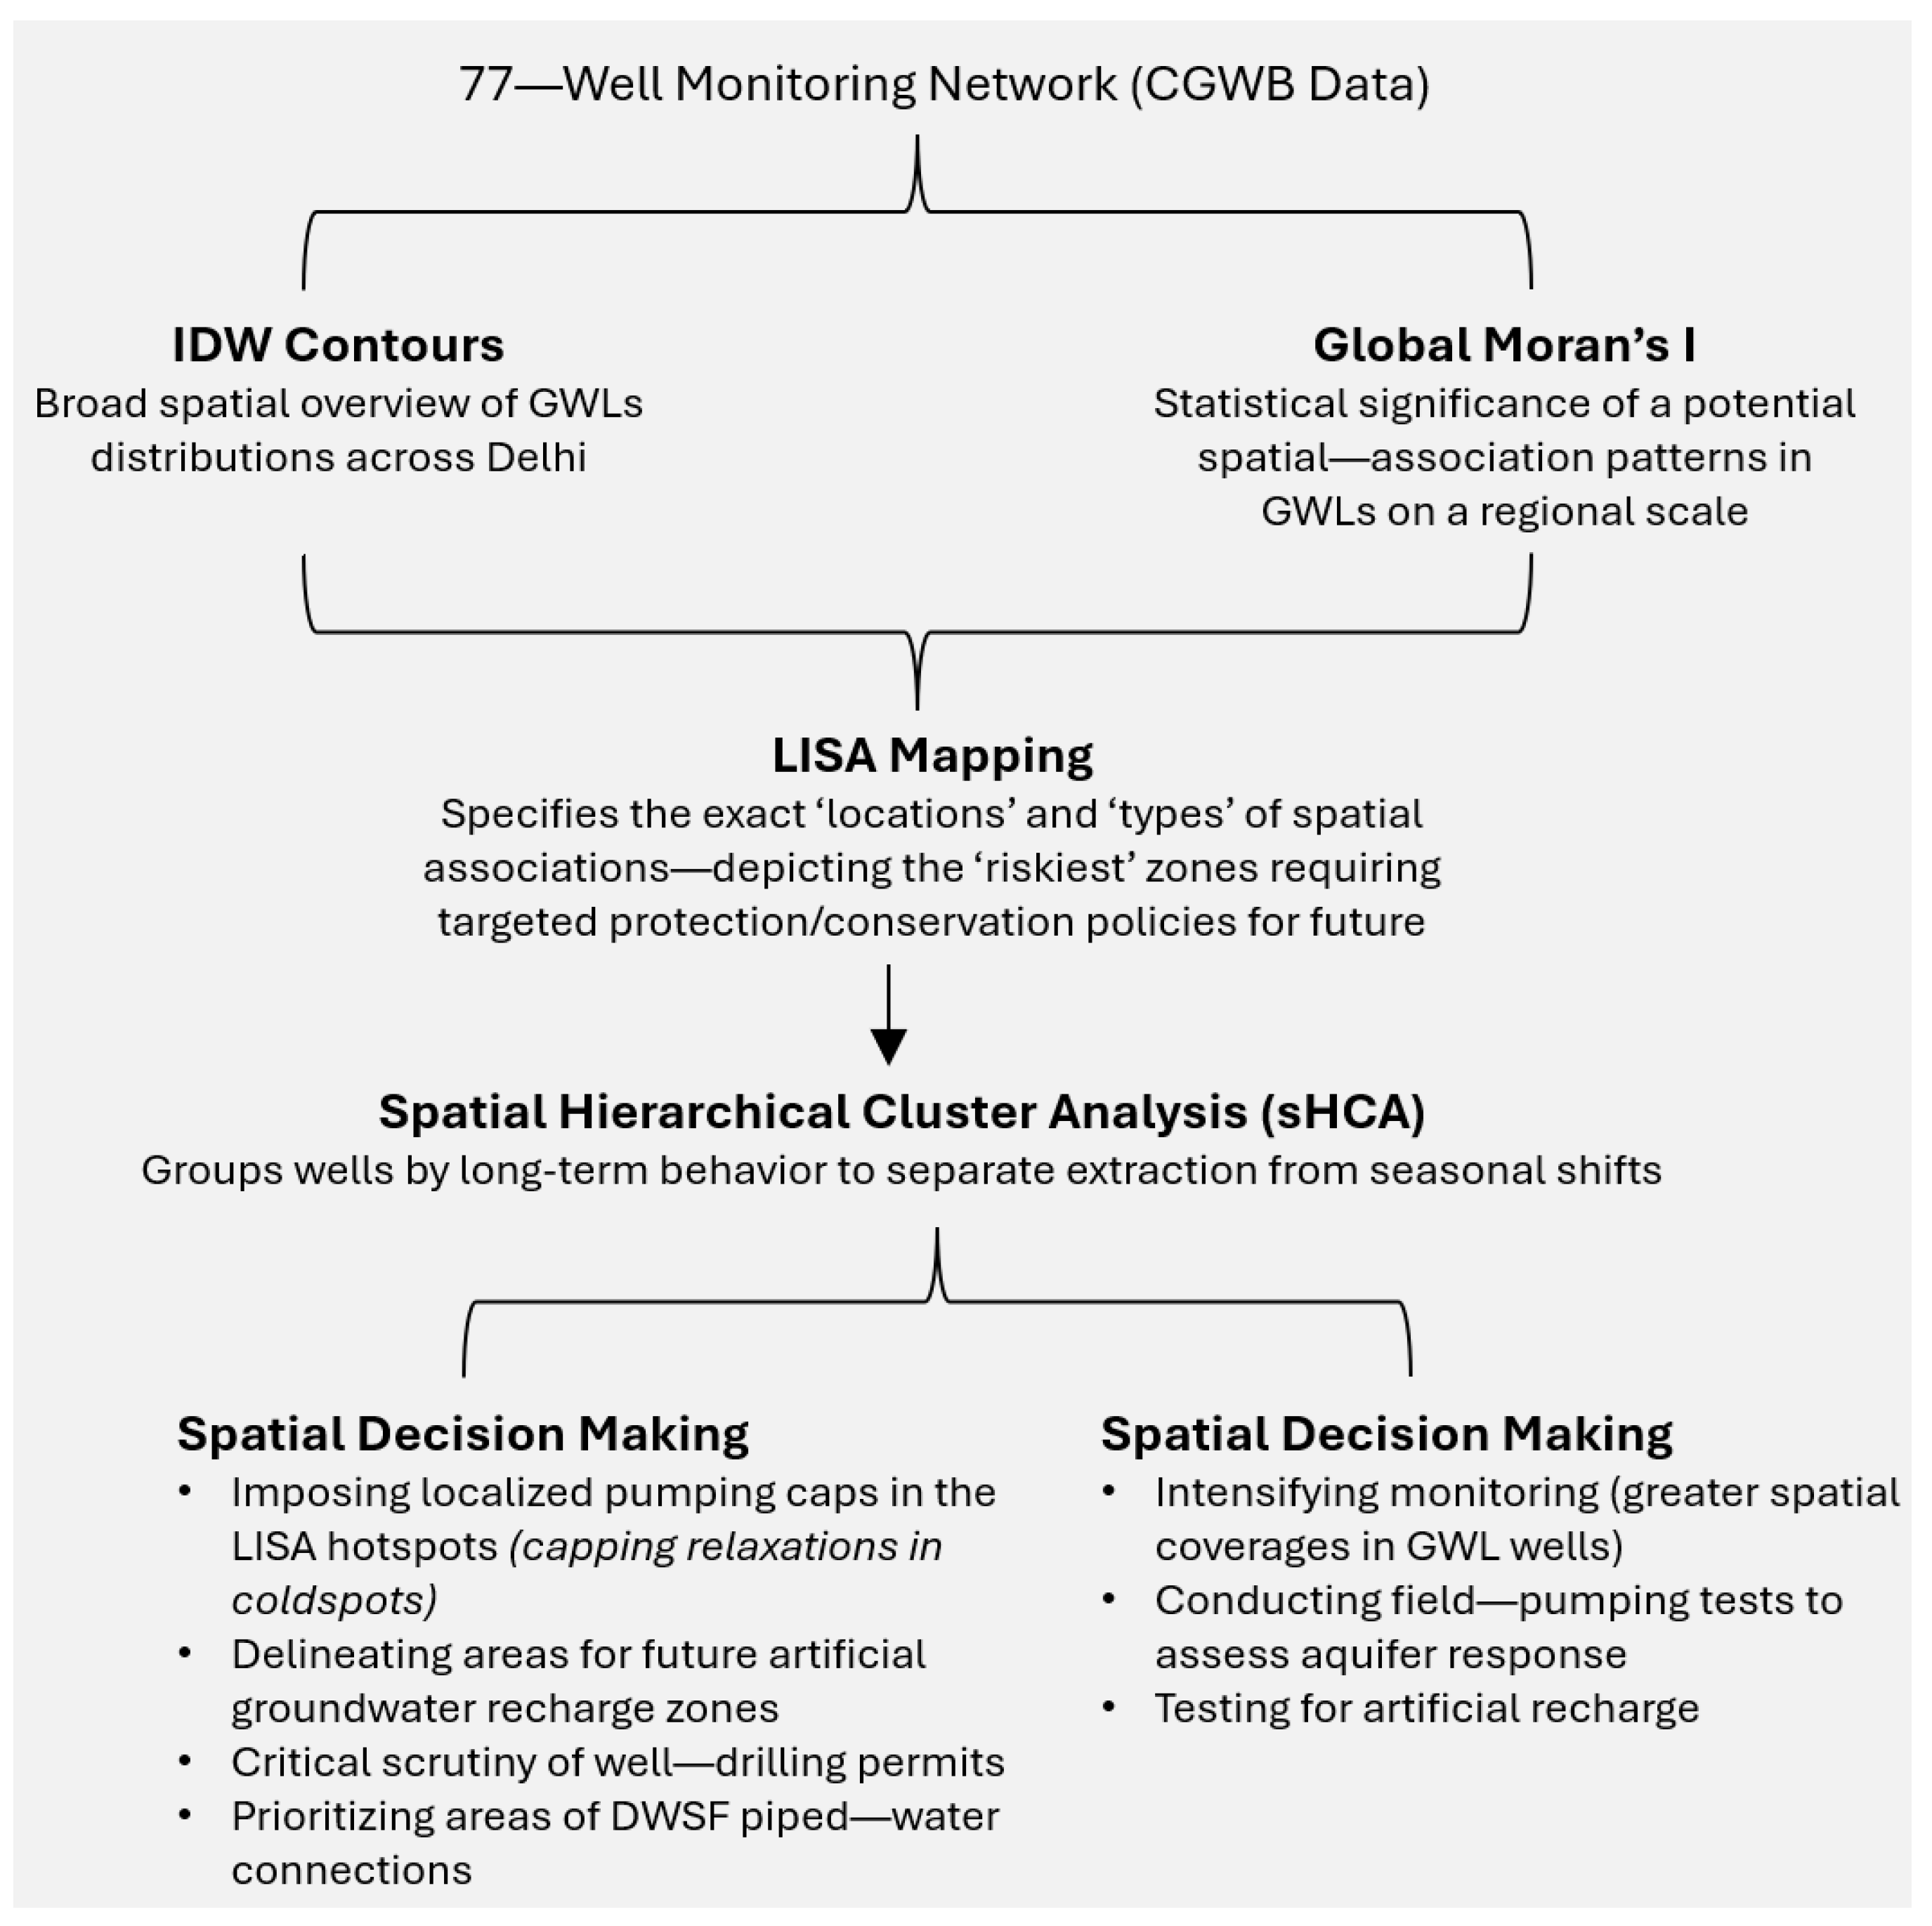
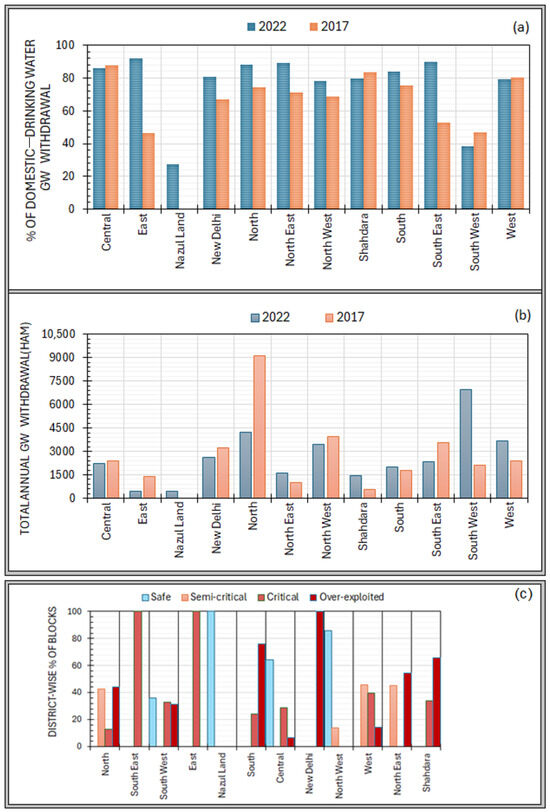
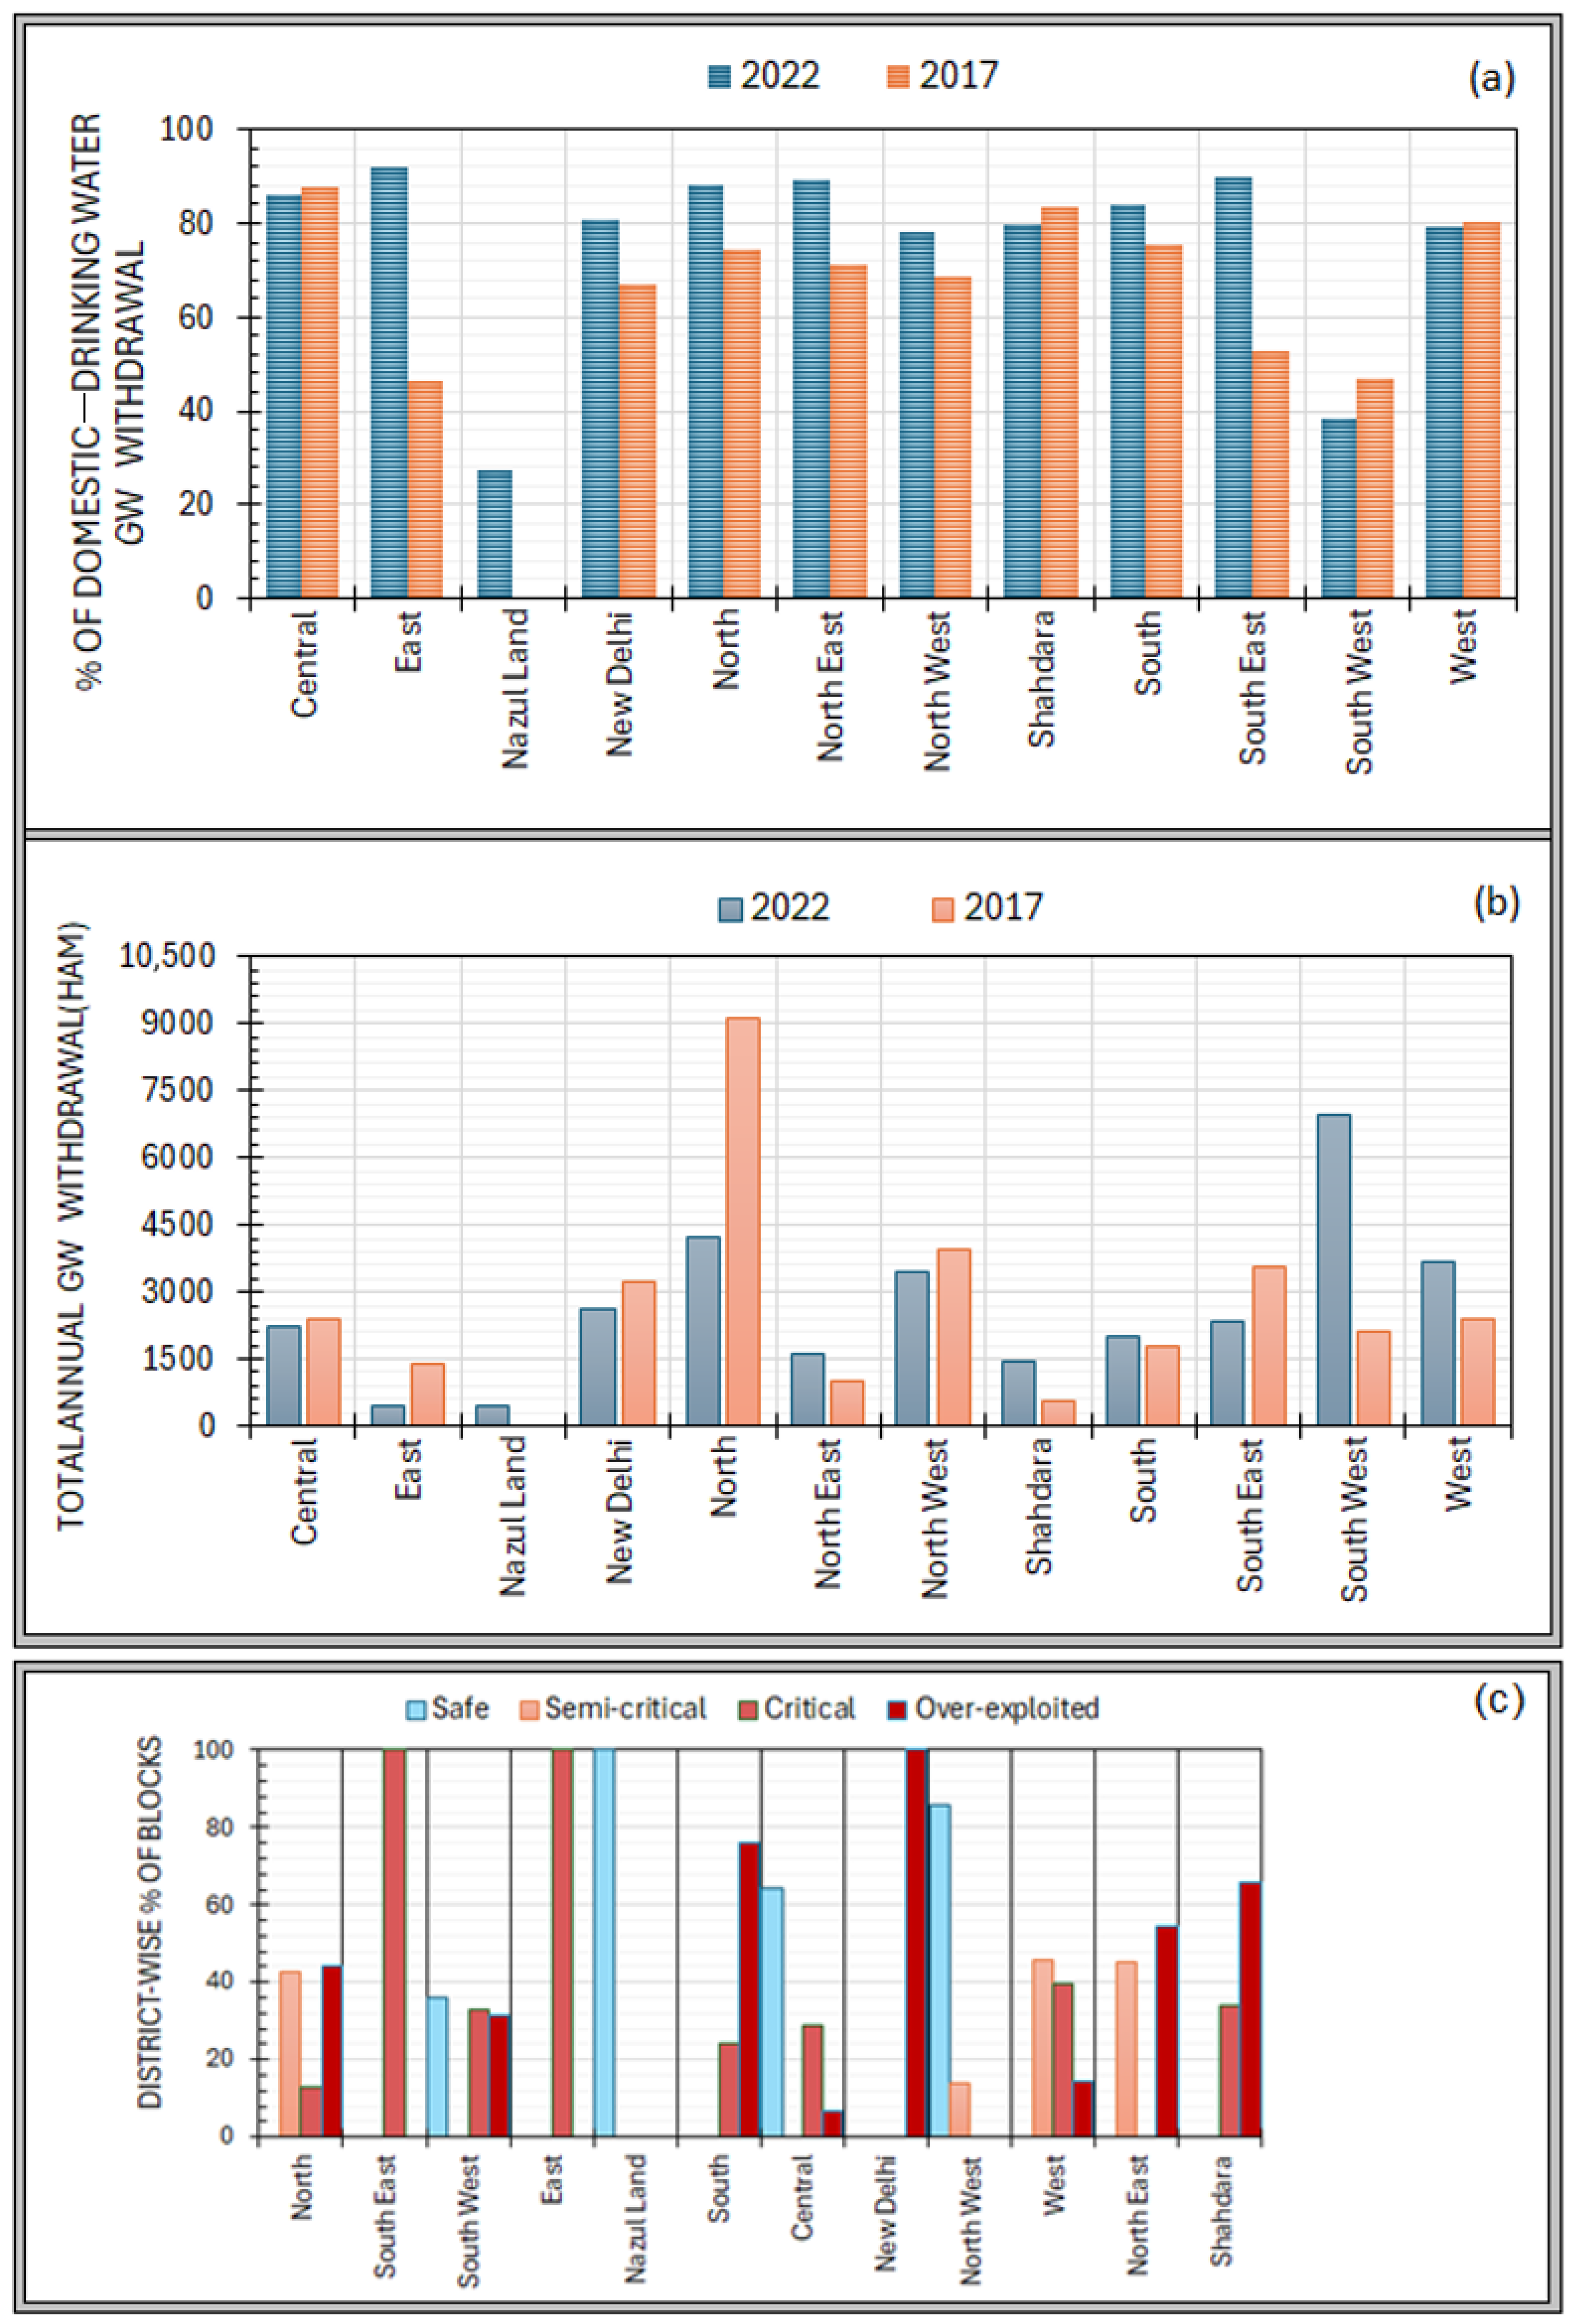

Disclaimer/Publisher’s Note: The statements, opinions and data contained in all publications are solely those of the individual author(s) and contributor(s) and not of MDPI and/or the editor(s). MDPI and/or the editor(s) disclaim responsibility for any injury to people or property resulting from any ideas, methods, instructions or products referred to in the content. |
© 2026 by the authors. Licensee MDPI, Basel, Switzerland. This article is an open access article distributed under the terms and conditions of the Creative Commons Attribution (CC BY) license.