


Abstract
With rural revitalization as China’s national policy priority, rural tourism has been promoted as a pathway to stimulate local economies and advance revitalization objectives. National and local governments have introduced policy measures to support rural tourism development. However, the spatial correspondence between documented policy attention and tourism popularity remains uneven and insufficiently understood. To address this gap, this study develops an integrated evaluation framework combining a text-based measure of documented policy attention, denoted PII, and a Tourism Popularity Index (TPI) using multi-source data from 920 peri-urban villages in Shanghai with rural tourism destination POIs. Spatial analysis reveals disparities between tourism popularity and documented policy attention, and further examines the contextual characteristics associated with this misalignment. The findings indicate that: (1) documented policy attention and rural tourism popularity exhibit pronounced spatial disparities, with high-popularity clusters emerging where favorable resource conditions, accessibility, and higher levels of policy attention coexist; (2) widespread policy–popularity mismatches indicate limited correspondence between the two measures; (3) the selected cases illustrate differences in spatial planning, operational capacity, and market-oriented strategies, cautioning against uniform policy expansion. The study offers a spatially explicit framework for assessing policy–popularity alignment and informing context-sensitive rural tourism governance in highly urbanized regions.
1. Introduction
Against the backdrop of China’s deepening Rural Revitalization Strategy, rural tourism has emerged as a key policy focus and a central engine for rural development, serving as a vital mechanism for facilitating urban–rural factor flows and activating rural resource potential [1,2]. Policies not only catalyze the growth of rural tourism industries but also play a crucial role in enhancing sustainability and social benefits [3]. Within this framework, policies constitute a core institutional pillar, shaping the spatiotemporal evolution of rural tourism and its socioeconomic and environmental impacts through planning regulation and resource allocation [4]. Well-implemented policies can mitigate risks of resource overexploitation and ecological degradation while fostering sustainable tourism models that allow local communities to share development benefits [5]. Policies have collectively shaped the overall development trajectory of rural tourism through coordinated efforts that include improving infrastructure [6], fostering distinctive rural industries [7], preserving cultural heritage [8], and supporting targeted poverty alleviation [9,10], thereby reinforcing the institutional foundation for its sustained growth.
In recent years, China has established a multi-layered policy support system for rural tourism, covering land use security, resource evaluation, financial support, cultural empowerment, and talent development. At the national level, the Ministry of Culture and Tourism and the National Development and Reform Commission launched the selection program for National Key Rural Tourism Villages in 2019 [11]. The program assesses villages against broad resource, cultural, environmental, service, governance, and socioeconomic criteria, while prioritizing designated villages for subsequent support in infrastructure, public services, tourism projects, and market promotion. The State Council has further incorporated tourism land use into national territorial spatial planning through the “Guiding Opinions on Promoting the Sustainable Development of Rural Tourism” [12]. At the metropolitan scale, megacities such as Shanghai have introduced localized policy instruments, including “The 14th Five-Year Plan (2021–2025) for Rural Revitalization in Shanghai” [13] and special funds dedicated to tourism development [14]. These coordinated efforts have gradually formed a rural tourism support system with distinctive Chinese characteristics.
Despite intensive documented policy attention and increasing resource allocations, the spatial correspondence between policy support and tourism popularity remains unclear. In many metropolitan regions, areas receiving strong policy attention do not always exhibit high tourism popularity. In particular, questions persist as to whether the spatial distribution of policy support aligns with tourism demand, or whether mismatches exist between policy attention and tourism attractiveness. Existing studies have documented both variations in policy implementation and tourism development, as well as regional inequalities in implementation, but the relationship between quantified policy support and measured tourism popularity has received limited empirical scrutiny. The degree of spatial alignment between policy support and tourism popularity therefore remains insufficiently understood.
Against this background, this study aims to develop and apply an integrated analytical framework for assessing village-level spatial alignment between documented policy attention and rural tourism popularity using the text-based PII, TPI, and quadrant classification. Drawing on policy documents, point-of-interest (POI) data, and user-generated content (UGC), the study addresses the following research questions: (1) What spatial patterns characterize documented policy attention to rural tourism across Shanghai’s peri-urban villages? (2) What spatial patterns characterize rural tourism popularity across these villages? (3) What alignment and mismatch types emerge from the quadrant analysis of documented policy attention and rural tourism popularity? (4) What policy-relevant contextual characteristics are illustrated by the selected mismatch cases?
The structure of this article is as follows. Section 1 presents the introduction, and Section 2 reviews the relevant literature. Section 3 introduces the study area, data sources, and methodology. Section 4, Section 5 and Section 6 present the spatial patterns of documented policy attention, rural tourism popularity, and their match and mismatch relationships, supplemented by illustrative case interpretation. Section 7 and Section 8 discuss the findings, outline future research directions, and provide conclusions. The findings provide empirical evidence for improving the precision and effectiveness of rural tourism policies, offer insights into adaptive rural development strategies in other metropolitan regions, and contribute to understanding sustainable rural tourism and regional integration.
2. Literature Review
2.1. The Role and Dilemma of Policy Attention
Policy attention is widely recognized as a key force shaping rural tourism development. Existing studies have demonstrated its positive impacts from multiple perspectives, including stimulating the local economy [15,16], promoting cultural heritage preservation and community identity [17], and fostering distinctive rural industries [7]. These concerted policy efforts contribute to the development of rural tourism.
However, policy effectiveness is not always linear and is often conditioned by some constraints. Prior research shows that outcomes may be limited by economic conditions and population density [18], institutional barriers [19], and the degree of community participation [20]. Moreover, variations in policy implementation frequently result in uneven development across rural areas [21]. These constraints are especially pronounced in metropolitan rural regions, where urban–rural integration is shaped by uneven development, income gaps, transport conditions, and policy orientation [22]. At the village scale, policy attention can promote rural settlement transition through land resource allocation and village-level behavioral regulation, with effectiveness depending on the alignment between policy design and local needs [23]. Accordingly, policy evaluation should move beyond policy presence to examine attention intensity, targeting, and spatial alignment with local conditions.
2.2. The Measurement of Tourism Popularity
Tourism popularity provides one perspective on rural tourism development, particularly in relation to tourism-facility provision and platform-recorded market attention. Traditional indicators based on official statistics, such as tourist arrivals and tourism revenue, are limited in timeliness and spatial resolution. With the advent of the digital era, the rise of big data has introduced new methods and perspectives to tourism research. User-generated content, including social media posts and online platform reviews, captures perceptions of place mediated through digital platforms and provides real-time, fine-grained insights into tourists’ behavioral preferences and emotional experiences, making it a prominent data source for sensing destination attractiveness and public perception [24,25,26]. Previous studies have demonstrated the value of online reviews in revealing how environmental discourse shapes electronic word-of-mouth [27,28] and investigating tourists’ image perception of destinations with a cognition-affection model [29], offering fresh insights for improving rural tourism.
At the same time, point-of-interest data provide an objective representation of the spatial distribution and density of tourism service facilities, reflecting supply-side provision of tourism infrastructure [30]. In this study, POI counts and online reviews are treated as complementary but conceptually distinct dimensions. Their combination provides a composite, platform-observable measure of tourism facility provision and public attention, without reducing it to a demand-only indicator of visitation or tourism performance.
2.3. The Spatial Mismatch Between Policy Attention and Tourism Popularity
The mismatch between the intended goals of tourism policy attention and the actual development outcomes arises from the effectiveness and limitations inherent in the policy implementation process. Even well-designed policies are often constrained at the local level by limited administrative capacity and insufficient coordination among stakeholders [31,32]. Spatially, the mismatch is frequently manifested as a misalignment between resource allocation and actual development needs. Policy support often concentrates on specific areas while overlooking the practical needs of others. This uneven distribution of resources hampers rural tourism development in certain regions, preventing them from generating substantive economic and cultural benefits and resulting in the mismatch [9,31].
In addition, conventional policy instruments that emphasize infrastructure construction and financial subsidies may overlook the socioecological characteristics of rural areas, leading to excessive development intensity, accelerated land-use change, and the weakening of traditional production systems [33,34]. Empirical research confirms peri-urban heterogeneity in service access, tourism development, and land-use change [35], while rural tourism spatial patterns exhibit clear spatial dependence and are significantly influenced by locational and socioeconomic factors [36]. At the village scale, tourism service priorities such as accommodation and transport are identified, but their spatial distribution does not necessarily show clustering [37]. Together, these studies clarify the uneven conditions surrounding rural tourism development but do not quantify village-level spatial alignment between policy attention and tourism popularity. This gap underscores the need for integrated spatial frameworks to evaluate the alignment between policy attention and tourism popularity. The policy-development process extends from policy attention and input through implementation and intermediate outputs to tourism activity and broader rural development. This study focuses on the spatial correspondence of policy attention with tourism service provision and platform-based popularity.
In response, this study constructs dual quantitative indicators for policy attention and tourism popularity and applies a spatial quadrant-based classification to systematically assess their spatial alignment in Shanghai’s suburban rural areas. By examining policy–popularity mismatches from geographical and planning perspectives, the study aims to provide empirical evidence for improving policy effectiveness in metropolitan rural tourism development.
3. Materials and Methods
3.1. Study Area
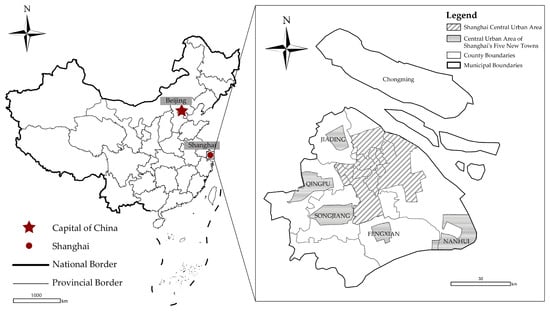
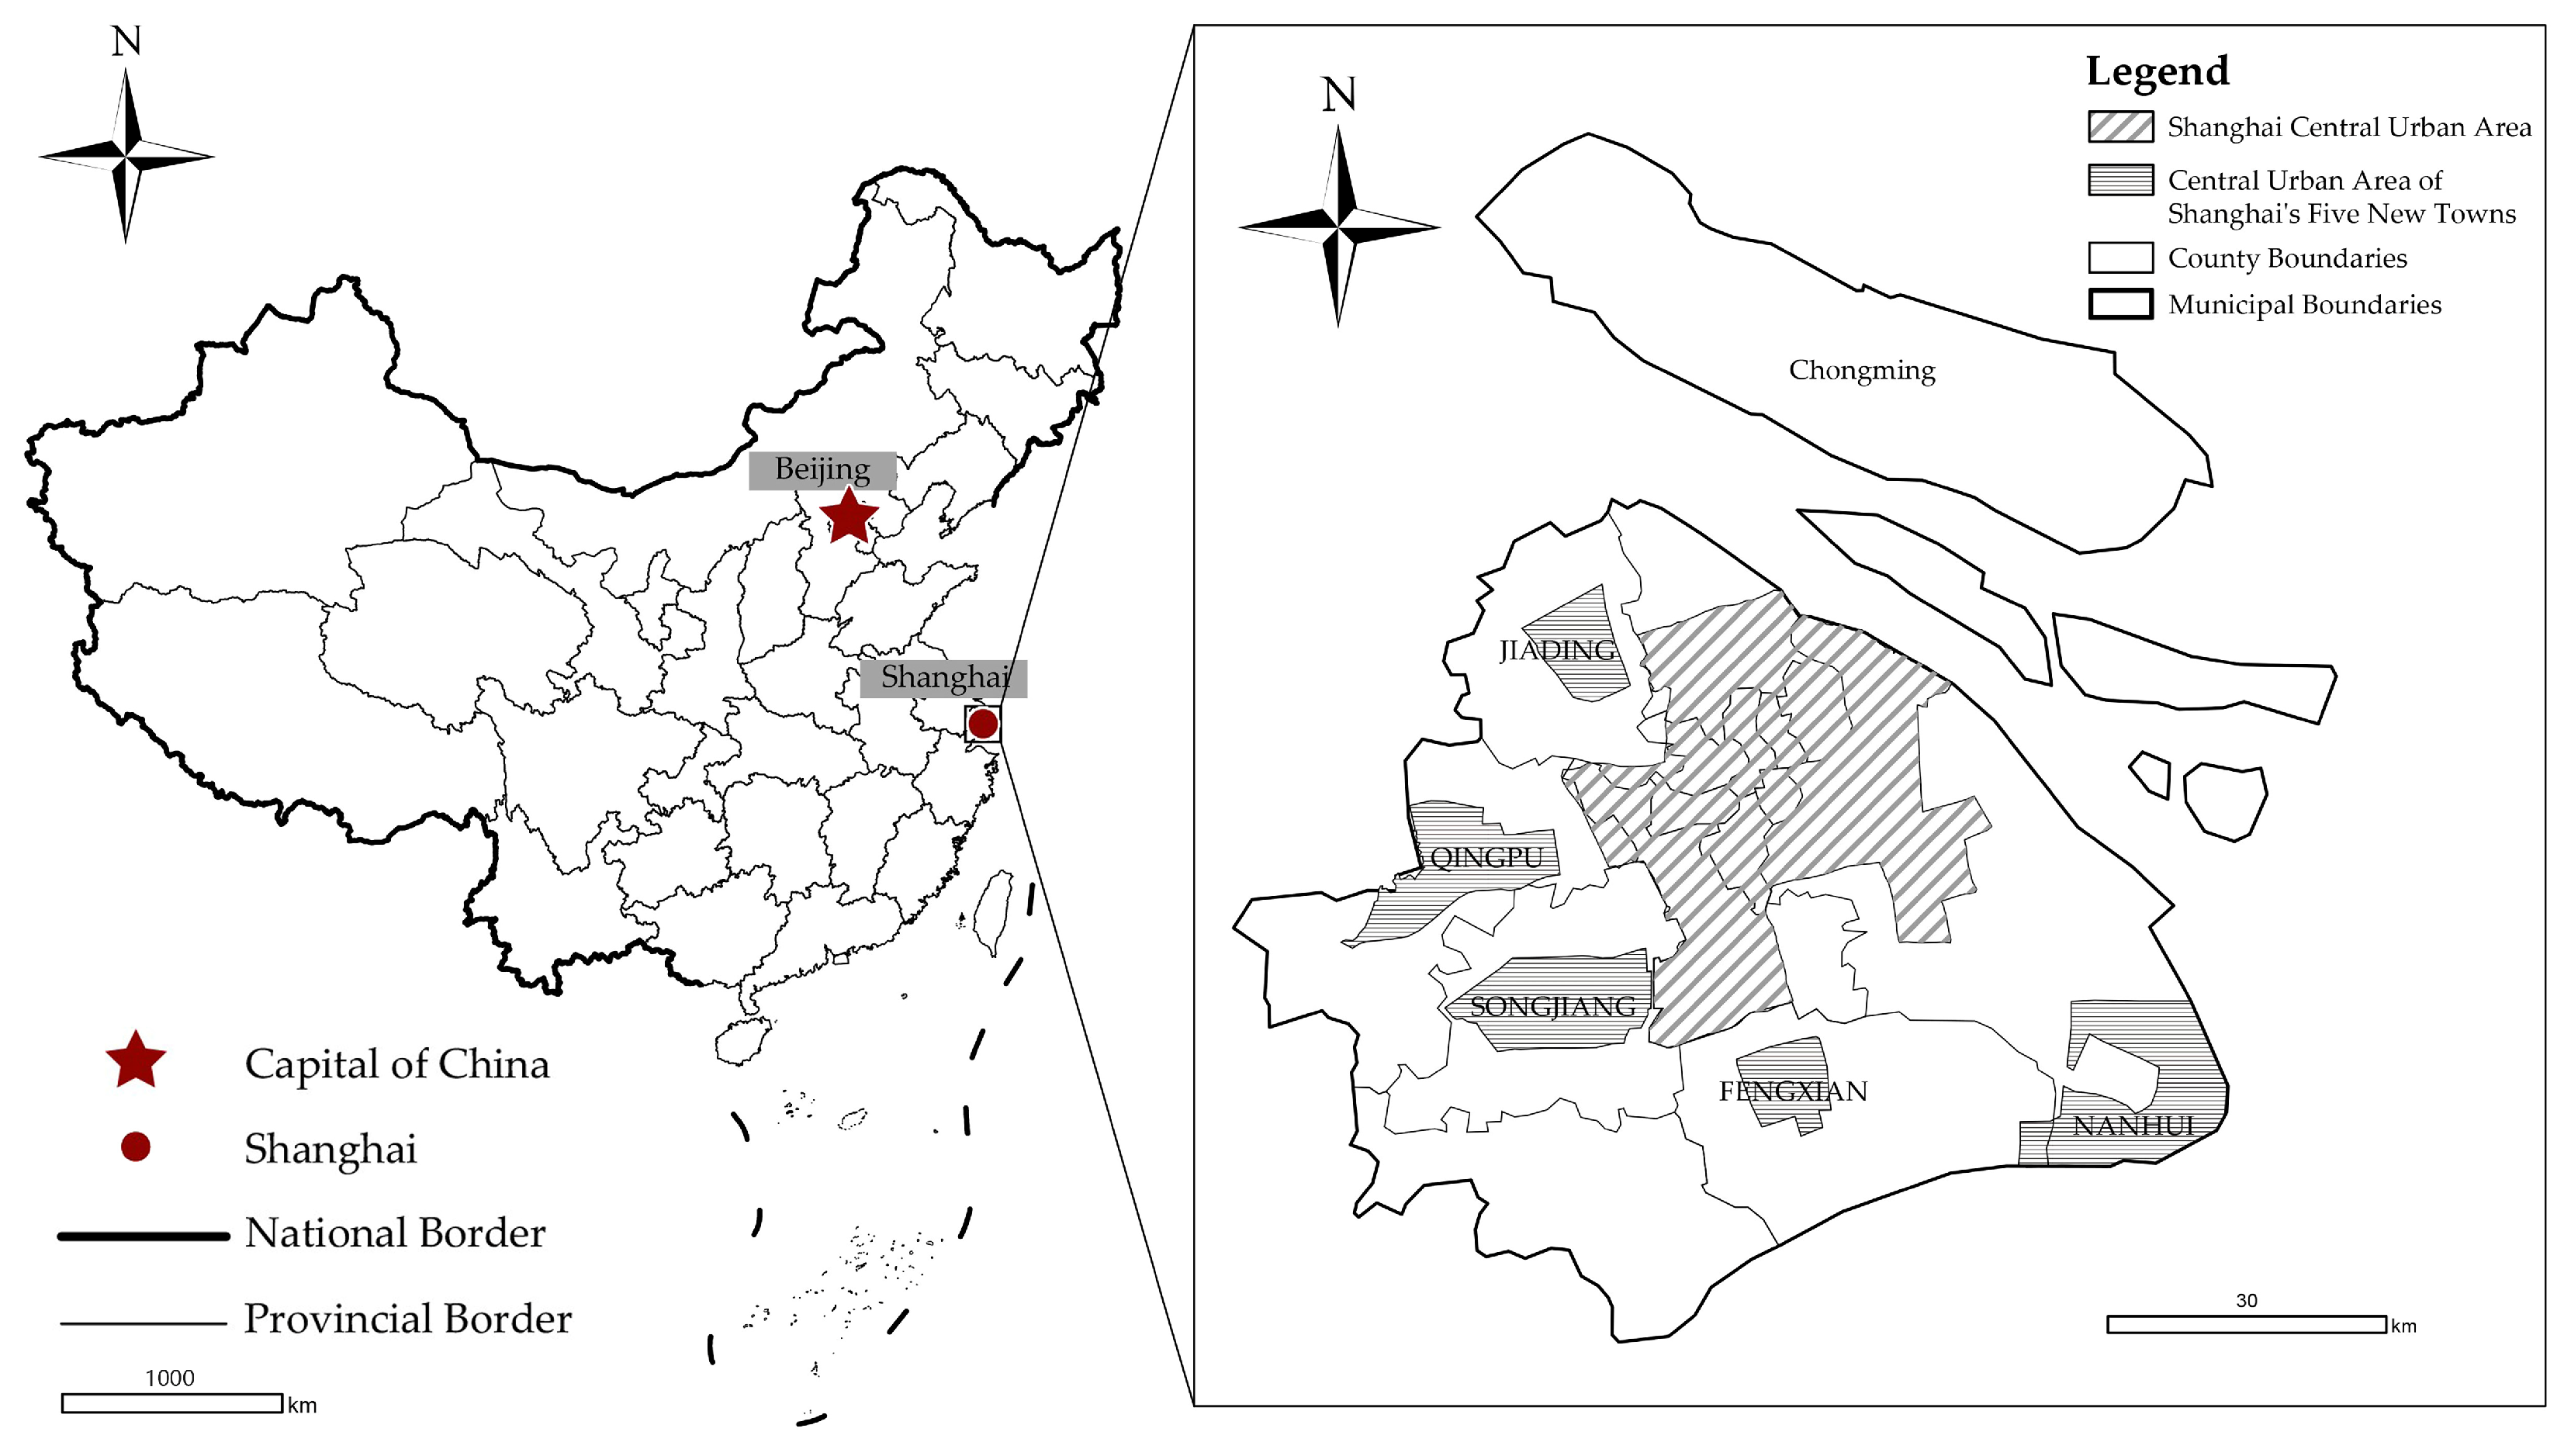
This study selects Shanghai as the case study area, focusing on the suburban rural areas outside the main urban district and the five new towns, including Jiading, Qingpu, Songjiang, Fengxian, and Nanhui. According to the “Urban Master Plan of Shanghai (2017–2035)” [38], the study area covers nine administrative districts, including Chongming, Jiading, Baoshan, Minhang, Qingpu, Songjiang, Jinshan, Fengxian, and Pudong New District, comprising 1875 administrative villages and communities (Figure 1).
Figure 1.
Location map of the study area.
As a Chinese megacity and an international tourism destination, Shanghai provides a representative context for examining suburban rural tourism. The city’s high income level and strong leisure consumption have supported sustained growth in rural tourism demand [39]. At the same time, Shanghai has actively promoted policy innovation, designating 67 Municipal Key Tourism Villages, including 27 that were also designated as National Key Tourism Villages, and implementing multiple targeted policies since 2018, including “The 14th Five-Year Plan (2021–2025) for Rural Revitalization in Shanghai” [13], and “Rural Tourism Development Support and Reward Measures” [40]. In addition, the vast amount of UGC from major digital platforms combined with scenic spot review information can offer abundant data support for quantitative research. These combined economic, policy, and data advantages make Shanghai an ideal case for analyzing the development mechanisms of rural tourism in highly urbanized areas.
3.2. Data Sources
The study area comprises 1875 administrative villages and communities outside the urban area of Shanghai, which served as the initial spatial frame. Of these, 920 villages with valid rural tourism destination POIs formed the eligible sample for the TPI-based and quadrant analyses. Because rural tourism destination POIs served as the units for matching UGC reviews, the remaining 955 units could not be assigned valid TPI values. Assigning them zero values would have conflated the absence of identifiable platform records with the verified absence of tourism supply and online attention. Data sources include rural tourism policy attention data, tourism construction and popularity data, and basic geographic data.
- (1)
- Documented policy attention data
Documented policy attention data were derived from village-name frequencies in official policy documents and government news releases related to rural tourism. Lists of National Key Tourism Villages were obtained from four batches jointly issued by the Ministry of Culture and Tourism and the National Development and Reform Commission, while lists of Municipal Key Tourism Villages were collected from two batches issued by the Shanghai Municipal Administration of Culture and Tourism. For concision, this study uses National Key Tourism Villages and Municipal Key Tourism Villages to distinguish the two designation levels, with Key Tourism Villages used as a collective term for villages holding either designation. Villages appearing on both lists were classified as National Key Tourism Villages and excluded from the municipal category to avoid double counting. Key Tourism Village designation was treated as formal institutional recognition and documented policy priority and analyzed separately from the text-based PII.
Policy texts were collected on 7 March 2025 from the Shanghai Government Service Platform using keyword searches including “rural tourism”, “tourism development”, “rural revitalization”, “cultural and tourism integration”, “ecotourism”, and “holistic tourism”. Search results were sorted by relevance, and the first 1000 results from each section were collected using Octoparse v8.7.7.030611. A fixed publication period was not predefined. The retrieved government news releases were dated from 23 April 2024 to 6 March 2025, whereas the government information disclosure records were dated from 24 November 2017 to 6 March 2025. Village names and frequency were extracted and counted using Python 3.12 scripts.
- (2)
- Tourism construction and popularity data
Tourism supply data comprised rural tourism destination POIs obtained from the Amap Open Platform API on 16 December 2024. The selected Amap type codes were 110000; 140100–140102; 140200–140201; 140300; 140400; 140600; 080401; and 080500–080505, covering scenic spots, museums, exhibition halls, convention and exhibition centers, art museums, science and technology museums, resorts, amusement parks, fishing gardens, picking gardens, campsites, and water activity centers. Shanghai’s rural tourism practice integrates accommodation, catering, agritainment, and cultural experiences [41,42]. The POI component of the TPI was designed to measure destination attraction supply through facilities whose primary functions generate sightseeing, cultural participation, resort, and recreational experiences. Accommodation and catering serve both visitors and residents, so their total counts also reflect the wider commercial-service environment. The baseline taxonomy therefore represents visitor-attracting destination facilities, and the expanded taxonomy represents the broader tourism-service environment.
POI taxonomy sensitivity was assessed across the 66 Key Tourism Villages. Adding accommodation, catering, explicit agritainment, and rural cultural services increased the POI count from 444 to 938, with accommodation and catering accounting for 94.9% of the additional records. Baseline and expanded village-level counts retained a Spearman correlation of 0.8343 at p < 0.001, and seven of the ten highest-count villages remained unchanged, confirming the broad hierarchy of rural tourism destination supply. The expanded definition identified relevant services in five of the 11 villages without baseline POIs and increased POI-based coverage from 55 to 60 of the 66 designated villages; Appendix A.1 Table A1 reports the detailed results.
POIs were cleaned and classified using Python. Tourism popularity data were collected from Dazhong Dianping using Octoparse, and the cumulative review count of each cleaned POI was recorded on 26 March 2025. POI and review records were matched using Python and aggregated to village-level spatial units in ArcGIS Pro 2022.
- (3)
- Geographic data
Basic geographic data, including administrative boundaries of Shanghai, districts, and villages, were obtained from the National Platform for Common GeoSpatial Information Services (MAPWORLD) with approval number GS (2024) 0650. The map base layers were used without any modification.
3.3. Research Methods
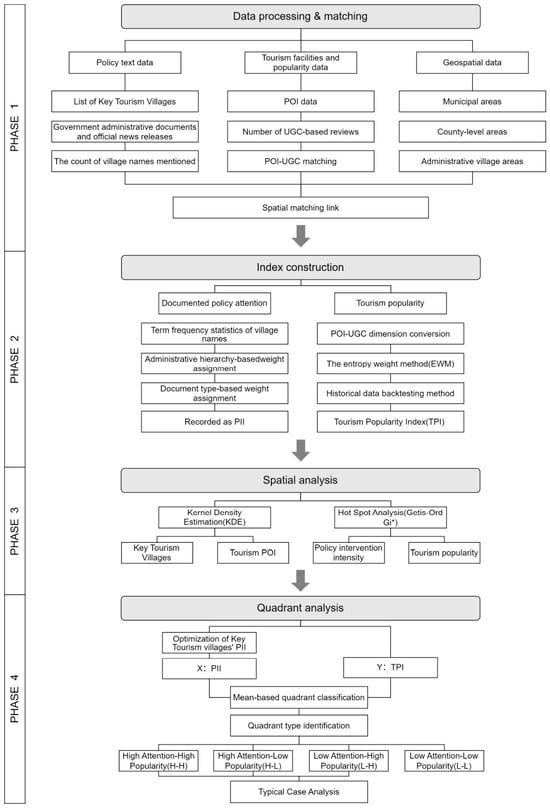
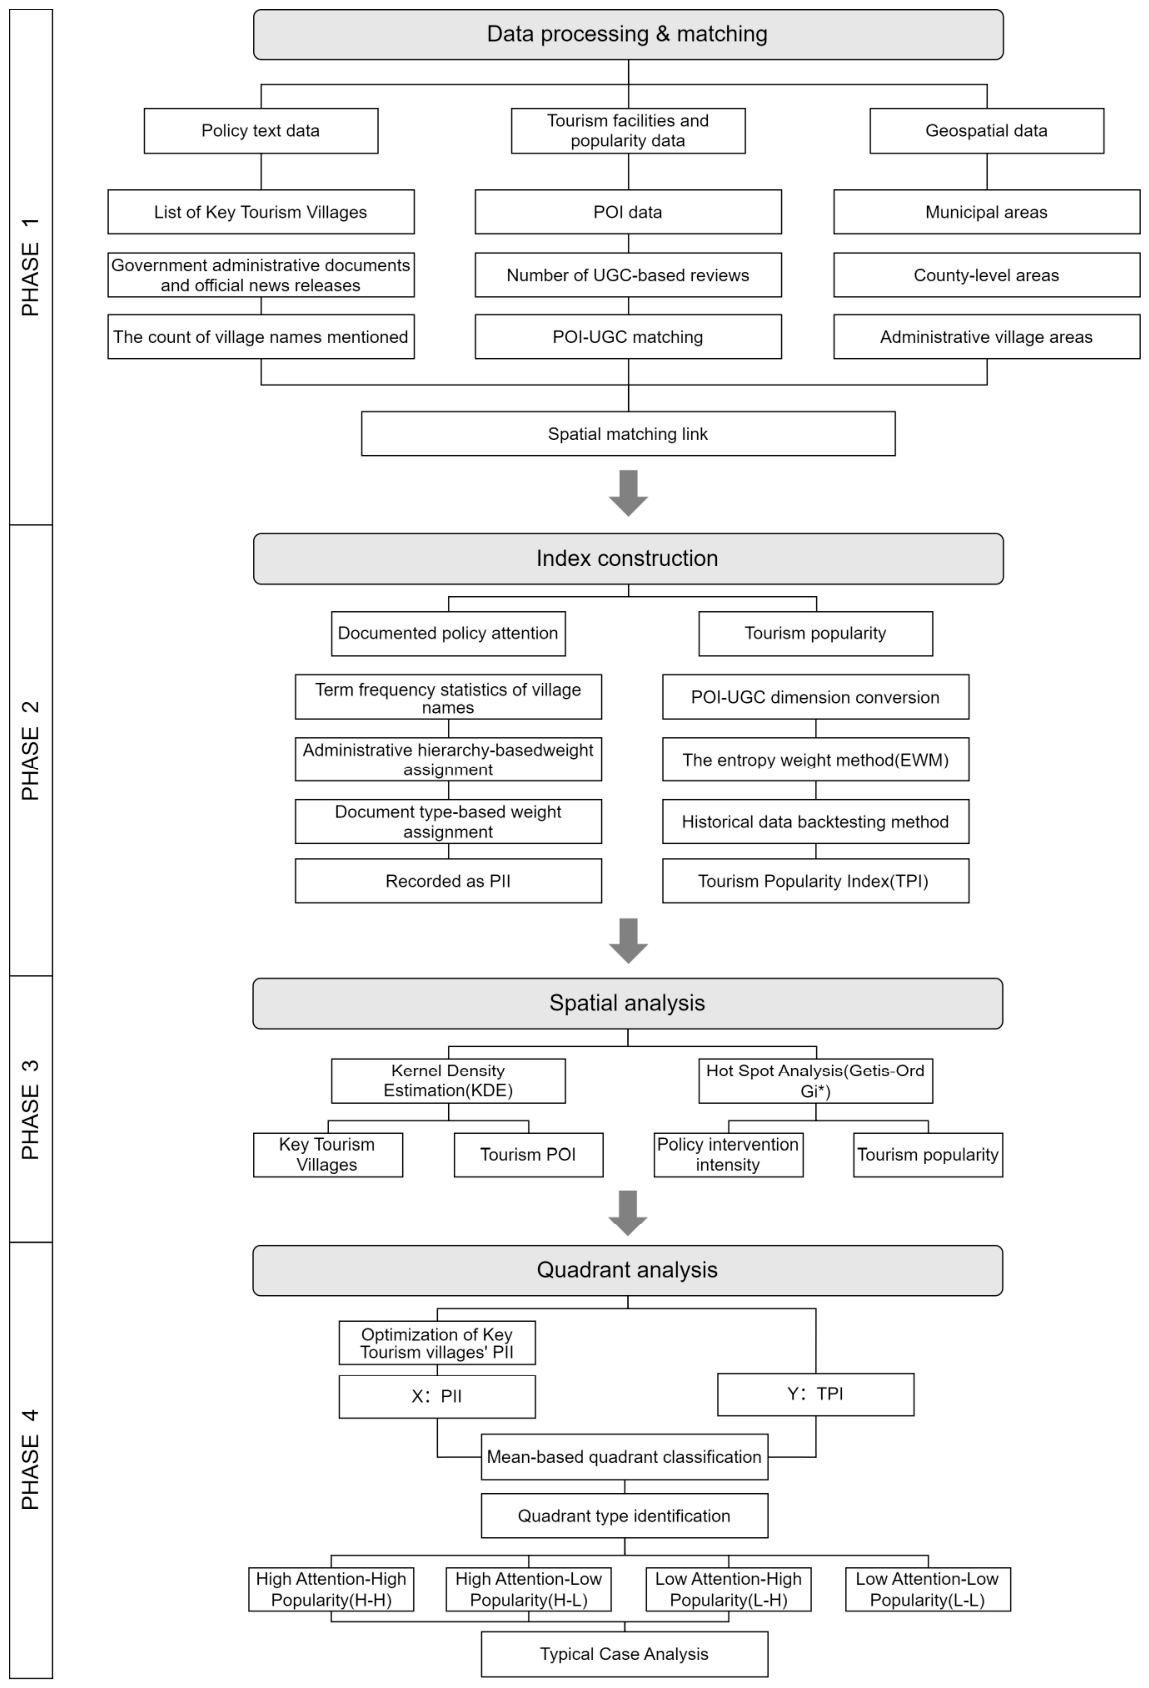
This study examined the spatial divergence of rural tourism popularity in peri-urban areas of a megacity under policy attention. A four-stage analytical framework was adopted, including data processing and matching, index construction, spatial analysis, and quadrant analysis. The approach integrated GIS-based spatial analysis, UGC mining, and multi-source quantitative modeling, as illustrated in Figure 2.
Figure 2.
Research Framework.
3.3.1. Data Processing and Matching
Policy text analysis focused on 920 villages with rural tourism destination POI records. Python scripts developed in PyCharm 2023.3.2 used the Jieba library to extract district, township, and village names, and Pandas 2.2.3 was used to assign each district-level mention to all sampled villages within the named district, each township-level mention to all sampled villages within the named township, and each village-level mention to the named village. Village-level policy mention frequencies were calculated using the Pandas library. For tourism supply and popularity data, cleaned POI records were matched and aligned with UGC review data using Pandas and FuzzyWuzzy 0.18.0. The matched datasets were then geocoded and aggregated to the administrative village level in ArcGIS Pro 2022, forming the basic spatial units for subsequent analysis. Following POI-UGC matching, cumulative review counts were summed across matched POIs within each administrative village, and the resulting village-level totals were used in TPI construction.
3.3.2. Construction of Quantitative Indices for Documented Policy Attention and Tourism Popularity
The PII represents the relative intensity of documented policy attention within the selected official texts. The text-based PII aggregated district-, township-, and village-level mention frequencies using administrative weights of 0.1, 0.3, and 1.0 and document weights of 1.2 and 1.0 for government information disclosure records and government news releases, respectively. This hierarchical allocation reflects policy transmission through Shanghai’s district–township–village governance system, with district and township mentions capturing shared jurisdictional policy environments and village mentions capturing explicit local policy attention.
To construct the Tourism Popularity Index (TPI), min-max normalization was applied to POI counts and online review counts to address differences in scale between indicators. All variables were transformed to a [0, 1] range to ensure comparability across dimensions.
Indicator weights were initially derived using the entropy weighting method, yielding weights of 0.191 for POI counts and 0.809 for review counts. Because extreme review values caused the latter to dominate, the entropy weights were retained only as a reference. A subsequent sensitivity analysis compared POI-to-review weighting schemes of 0.3:0.7, 0.4:0.6, and 0.5:0.5. Five benchmark villages were selected to represent contrasting indicator profiles, ranging from extreme popularity and high review counts to high POI provision and no recorded reviews (Table 1).
Table 1.
Sensitivity analysis of TPI weighting schemes using benchmark villages.
The entropy weights and the 0.3:0.7 scheme placed Dayu Village, which had the highest POI count, only ninth and eighth, indicating that facility provision was obscured by review counts. Under equal weighting, Dayu rose to fourth and exceeded high-review Daijing Village, which ranked fifth, weakening the intended priority of observed popularity. The 0.4:0.6 scheme kept Yuehu Community first, Daijing fourth, Dayu sixth, Xuemi eighteenth, and Gexin fifth. It therefore preserved the greater contribution of platform-recorded public attention while retaining tourism facility provision as a secondary component and was used to calculate the TPI. The resulting TPI is interpreted as a composite platform-observable indicator of facility provision and online attention rather than as a demand-only measure of visitation or tourism performance.
3.3.3. Multi-Factor Spatial Analysis
All mapping and spatial analyses were conducted in WGS 1984 UTM Zone 51N, with administrative villages serving as the principal spatial unit. Kernel Density Estimation (KDE) and the Getis–Ord Gi* statistic were employed in ArcGIS Pro 2022 to analyze the spatial distribution patterns of Key Tourism Villages, documented policy attention, tourism POIs, and tourism popularity. These methods were used to identify hot and cold spots of rural tourism development in the peri-urban areas of Shanghai and to reveal their spatial clustering characteristics.
KDE was applied to evaluate the spatial concentration of rural tourism destination POIs, enabling the identification of areas with high and low facility density. The calculation formula is as follows:
In the formula, represents the estimated two-dimensional density at spatial location , is the number of input points, is the bandwidth, is the kernel function, and denotes the location of the ith input point. KDE was performed in ArcGIS Pro using the quartic kernel and software-derived bandwidths of approximately 12.96, 16.52, 16.14, and 6.34 km for all Key Tourism Villages, National Key Tourism Villages, Municipal Key Tourism Villages, and rural tourism destination POIs, respectively. The default output cell size, calculated by ArcGIS Pro from the shorter dimension of each input extent divided by 250, was retained, and no additional edge or barrier correction was applied. The Getis–Ord Gi* analysis used a fixed distance band with Euclidean distance and the software-derived threshold ensuring that each village had at least one neighbor. Contiguity order and island handling were therefore not applicable. Row standardization is disabled for this ArcGIS Pro tool, no permutation procedure was involved, and FDR correction was not applied.
To examine the local spatial autocorrelation of tourism popularity and documented policy attention at the village level, the Getis–Ord Gi* statistic was applied. This method identifies statistically significant clusters of high values (hot spots) and low values (cold spots). The calculation formula is as follows:
In the formula, denotes the attribute value of spatial unit j, wij represents the spatial weight between units i and j, is the global mean, S is the standard deviation, and n is the total number of samples. Positive and significant values indicate hot spots, while negative values indicate cold spots.
3.3.4. Quadrant Classification of Documented Policy Attention and Tourism Popularity
For the quadrant analysis, documented policy attention was represented by the text-based PII defined in Section 3.3.2, consistent with the distribution and hotspot analyses in Section 4.2. And it served only as a descriptive typology for summarizing policy–popularity alignment and mismatch patterns. The sample means of the text-based PII (2.6032) and TPI (0.5005) were used as thresholds to classify villages into high attention–high popularity (H-H), high attention–low popularity (H-L), low attention–high popularity (L-H), and low attention–low popularity (L-L) types. Formal Key Tourism Village designation was analyzed separately in Section 4.1 and Section 6.1 as documented institutional priority.
Robustness was assessed using six alternative weighting scenarios, S1 to S6, and a village-specific specification, S7, which removed the district- and township-level components to test their shared-common-factor effect. S1 to S5 retained Spearman correlations of 0.9697 to 0.9995 and four-quadrant agreement of 92.6% to 99.9%, while S6 yielded a correlation of 0.8088 and agreement of 75.0%. Under S7, direct village-name mentions were recorded for 160 villages and absent for 760 villages, producing a correlation of 0.5934 and quadrant agreement of 80.9%. These results identify administrative hierarchy as a substantive component of multilevel policy attention and confirm the persistence of the broad mismatch pattern under direct village-level measurement; Appendix A.2 Table A2 reports the full results. Based on the spatial distribution of these quadrant types and selected illustrative cases, possible contextual characteristics were examined to support policy interpretation and planning recommendations.
Following the quadrant classification, four villages were purposively selected to illustrate contrasting alignment and mismatch profiles. The detailed selection criteria are reported in Appendix B Table A3. For each village, official policy documents and government news releases from the collected corpus were reread to summarize reported development characteristics. The materials are interpreted only as contextual illustrations.
4. Spatial Patterns of Documented Policy Attention
Policy attention in Shanghai’s suburban areas exhibited pronounced spatial heterogeneity. High-intensity areas were mainly concentrated in the northern suburbs and parts of the southwest, while several peri-urban zones showed relatively weak policy support. Notably, some Key Tourism Villages were located outside areas with strong policy attention, indicating a spatial mismatch between designated Key Tourism Villages and actual policy attention.
4.1. Spatial Distribution of Key Tourism Villages
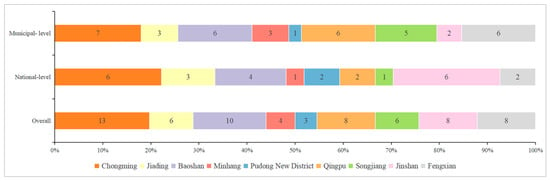
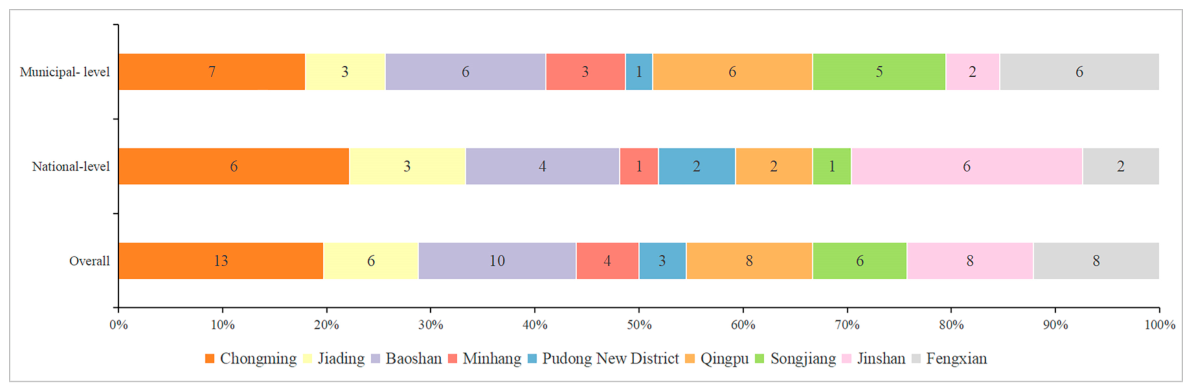
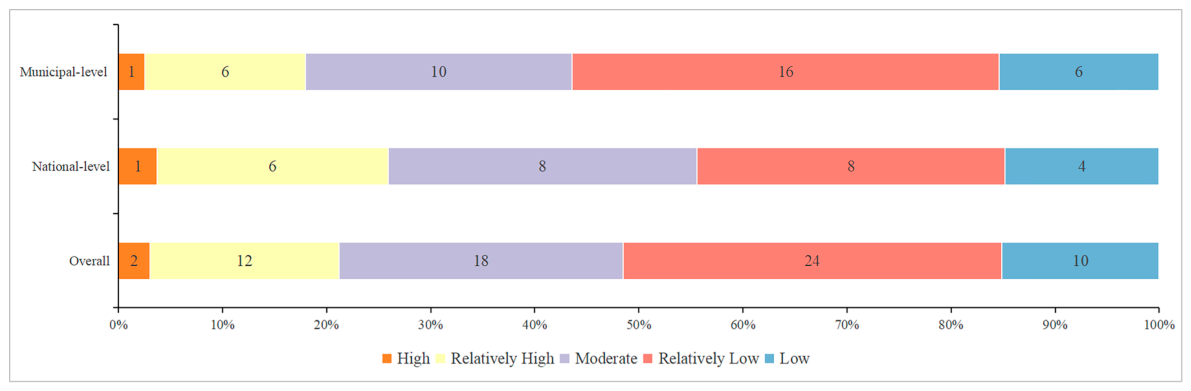
After assigning the 27 nationally designated villages within the combined municipal lists of 67 villages to the national category and excluding Jielong Village, which lies outside the study area, the study area contained 27 National Key Tourism Villages and 39 Municipal Key Tourism Villages, totaling 66 villages. From an administrative perspective (Figure 3), Chongming accounted for the largest share of all Key Tourism Villages (19.7%, 13 villages), followed by Baoshan (15.2%, 10 villages), while Fengxian, Jinshan, and Qingpu each accounted for 12.1% (8 villages). The labels within the bars indicate village counts, while the bar lengths show district shares calculated separately for the national-level (n = 27) and municipal-level (n = 39) groups. Within the national-level group, Chongming and Jinshan each accounted for 22.2% (6 villages); their corresponding shares within the municipal-level group were 17.9% (7 villages) and 5.1% (2 villages), respectively. Fengxian, Qingpu, and Songjiang showed higher municipal-level shares of 15.4% (6 villages), 15.4% (6 villages), and 12.8% (5 villages), compared with their national-level shares of 7.4% (2 villages), 7.4% (2 villages), and 3.7% (1 village), respectively. Together, Chongming, Jiading, and Baoshan hosted 43.9% of all Key Tourism Villages, while Minhang and Pudong accounted for 6.1% (4 villages) and 4.5% (3 villages), respectively.
Figure 3.
Administrative division proportions of Key Tourism Villages.
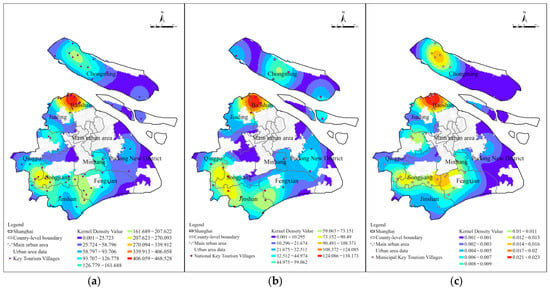
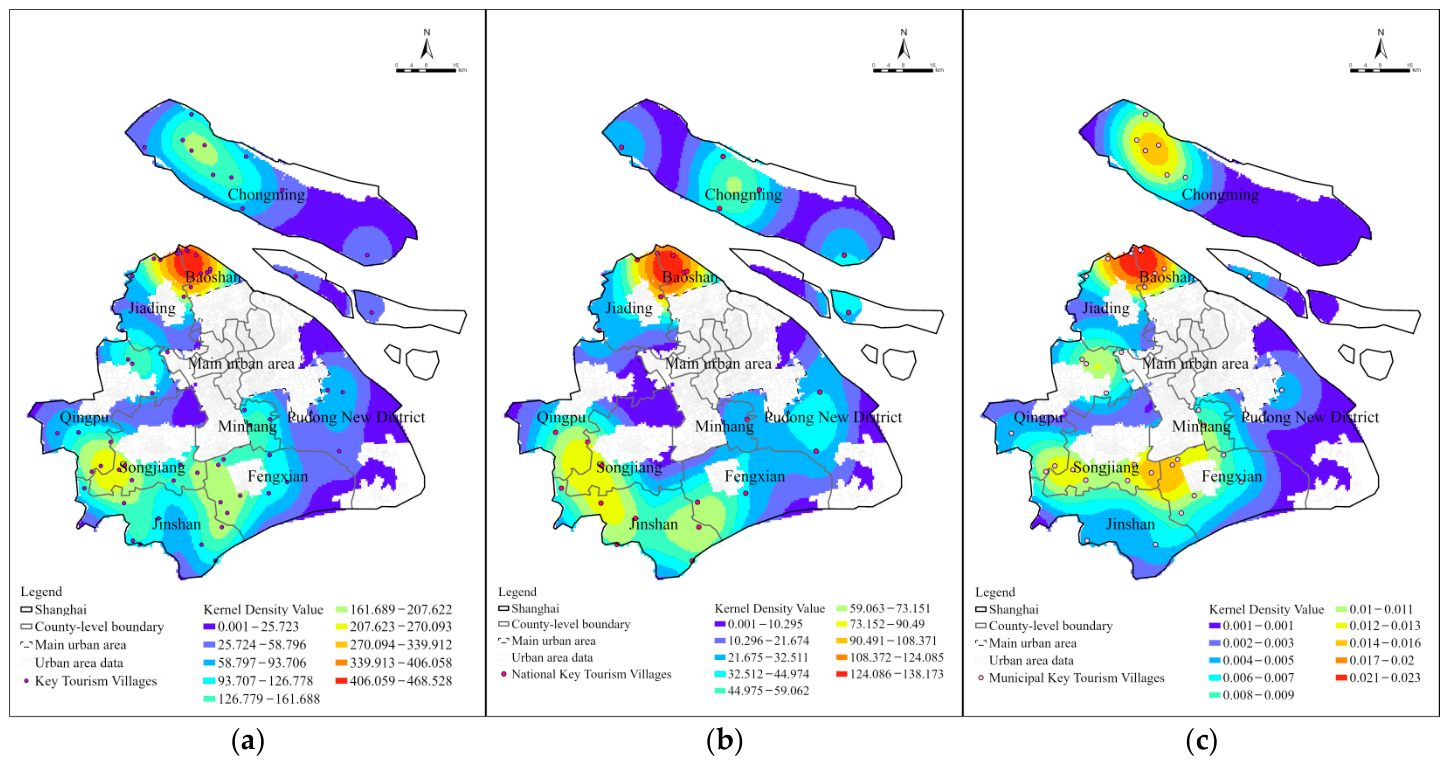
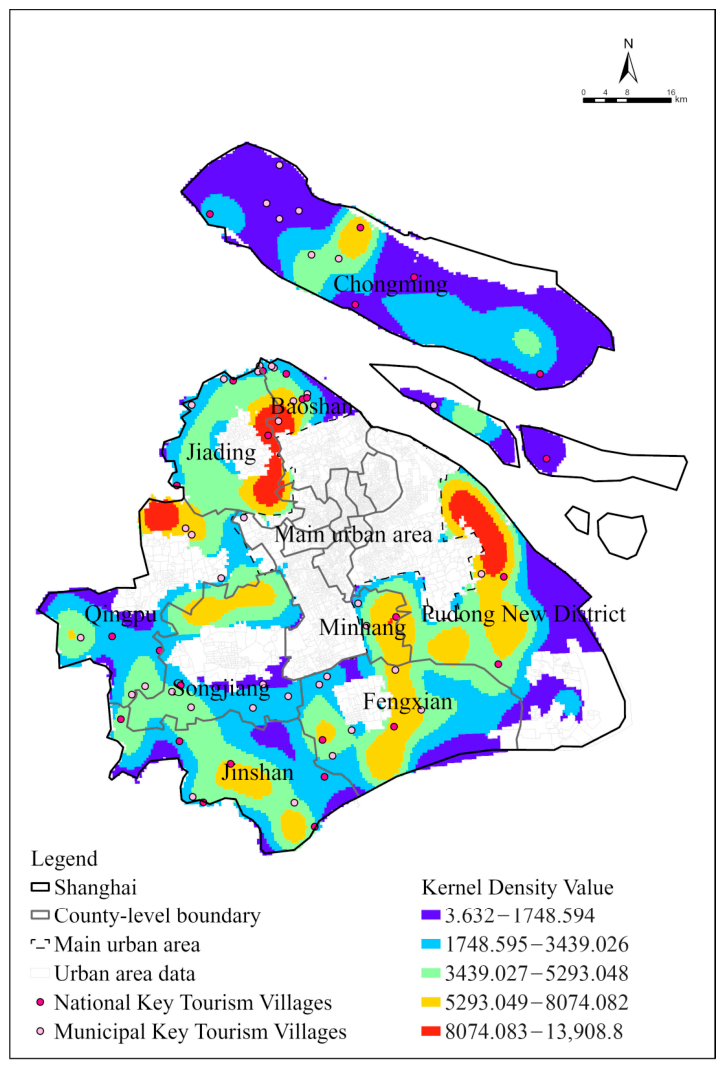
Based on the kernel density estimation shown in Figure 4, the spatial distribution of Key Tourism Villages in Shanghai exhibits pronounced clustering patterns, with clear differences across administrative levels. Overall (Figure 4a), Key Tourism Villages are predominantly located in suburban areas, forming a dual-core pattern characterized by a high-density cluster in the northern part of the municipality and a secondary cluster in the southwest. Chongming District stands out as a major hotspot, reflecting its strong ecological endowments and the strategic emphasis placed on rural tourism within broader rural revitalization policies.
Figure 4.
Kernel density estimation of Key Tourism Villages. (a) The Key Tourism Villages in total; (b) National Key Tourism Villages; (c) Municipal Key Tourism Villages.
A comparison by policy hierarchy (Figure 4b,c) reveals further differentiation. National Key Tourism Villages exhibit a more concentrated and intensive spatial pattern, with strong clustering in ecologically and policy-advantaged areas such as Chongming and Qingpu. Municipal Key Tourism Villages, by contrast, are more widely dispersed and cover a broader spatial extent, forming multiple, smaller-scale clusters in districts such as Fengxian, Jinshan, and Songjiang. This divergence suggests a selective and hierarchical logic in policy support, whereby higher-level designations reinforce existing strengths and demonstration effects, while lower-level initiatives contribute to a more spatially extensive, and potentially more balanced, development of rural tourism across Shanghai’s suburban areas.
4.2. Intensity of Documented Policy Attention Toward Rural Tourism
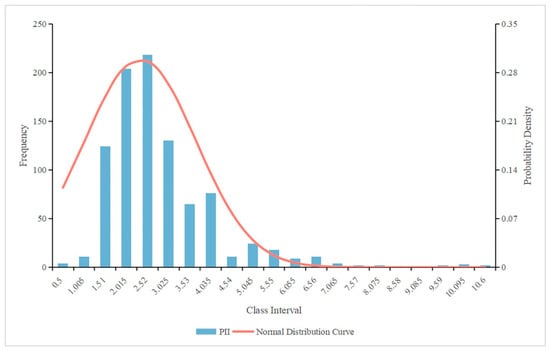
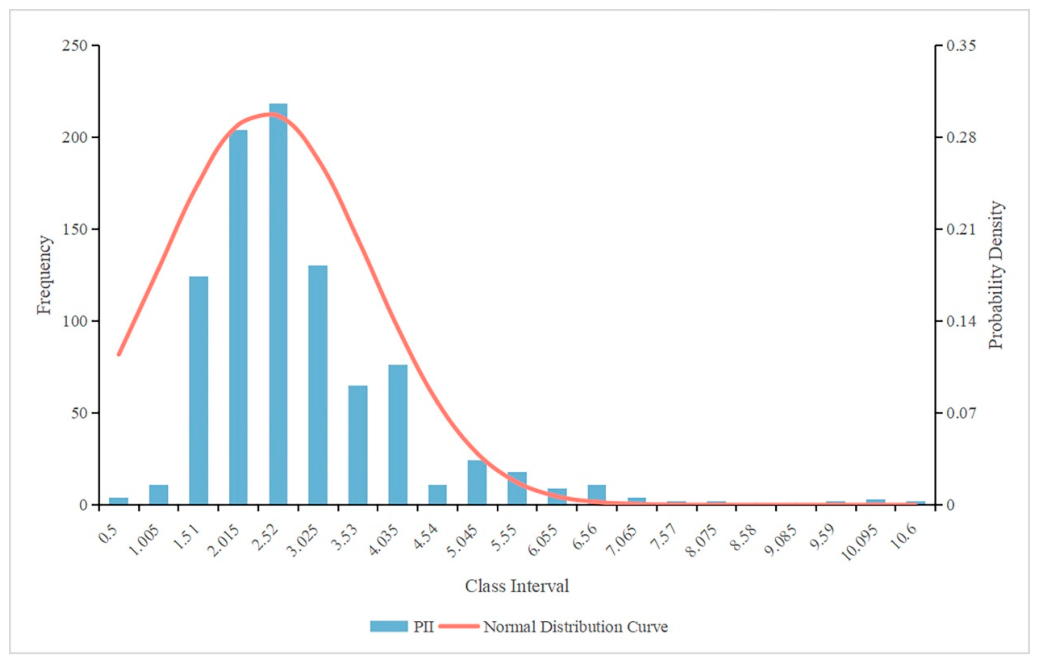
The PII ranged from 0.5 to 10.6, with a mean of 2.60, a median of 2.2, and a standard deviation of approximately 1.334, indicating a right-skewed distribution with a pronounced long-tail effect (Figure 5). Most villages exhibited low policy attention, while a small number recorded considerably higher values, reflecting a highly uneven distribution of documented policy support within the selected texts.
Figure 5.
Frequency distribution of documented policy attention measured by the text-based PII with an overlaid normal reference curve.
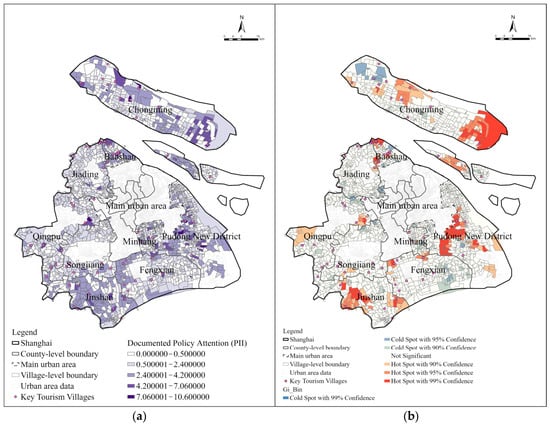
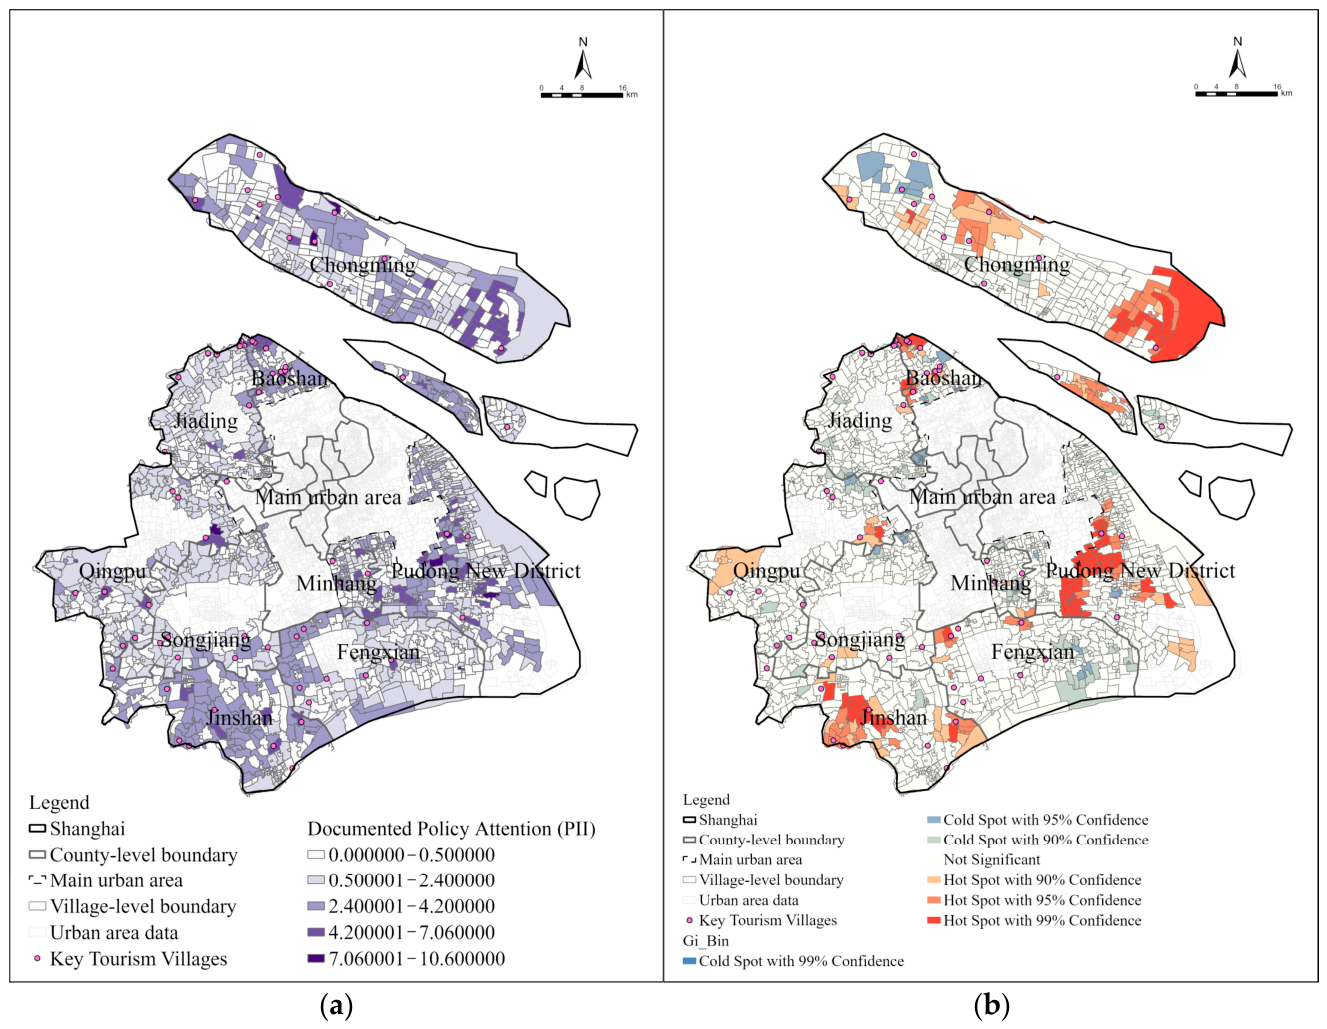
Spatially, PII displayed a fragmented and heterogeneous pattern (Figure 6). Hotspot areas were mainly concentrated in the northern suburbs, southeastern near suburbs, and southwestern outer suburbs, whereas large portions of the study area contained statistically significant clusters of relatively low PII values. Hongqiao Village in Chongming District recorded the highest PII (10.6), highlighting strong policy concentration in selected locations. The identified hotspots represent concentrations of multilevel documented policy attention transmitted through nested administrative units, with the stability of the dominant high-value locations confirmed by the village-specific comparison in Appendix A.2.
Figure 6.
Spatial distribution and hotspot analysis of the multilevel text-based PII. (a) Distribution of documented policy attention; (b) Hotspot analysis of documented policy attention.
A notable mismatch emerged between PII and the spatial distribution of Key Tourism Villages. Pudong New District showed extensive PII hotspots despite a limited presence of Key Tourism Villages, while Chongming District, which hosts the largest number of Key Tourism Villages, contained a substantial share of villages with relatively low PII values. Generally low values were also observed in Jiading, Qingpu, Songjiang, and Fengxian districts, further indicating an uneven spatial distribution of documented policy attention.
5. Rural Tourism Popularity in Peri-Urban Shanghai
Rural tourism popularity exhibited a clear pattern of spatial agglomeration, with higher levels concentrated in some exurban areas and scattered across the suburbs. Tourism facility distribution showed a partly contrasting pattern, as indicated by the relationship between facility density and tourism popularity.
5.1. Spatial Distribution of Rural Tourism Facilities
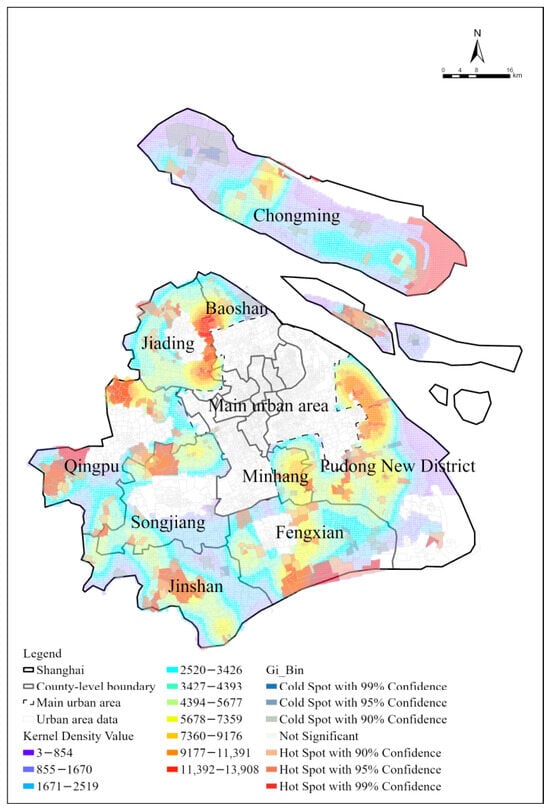
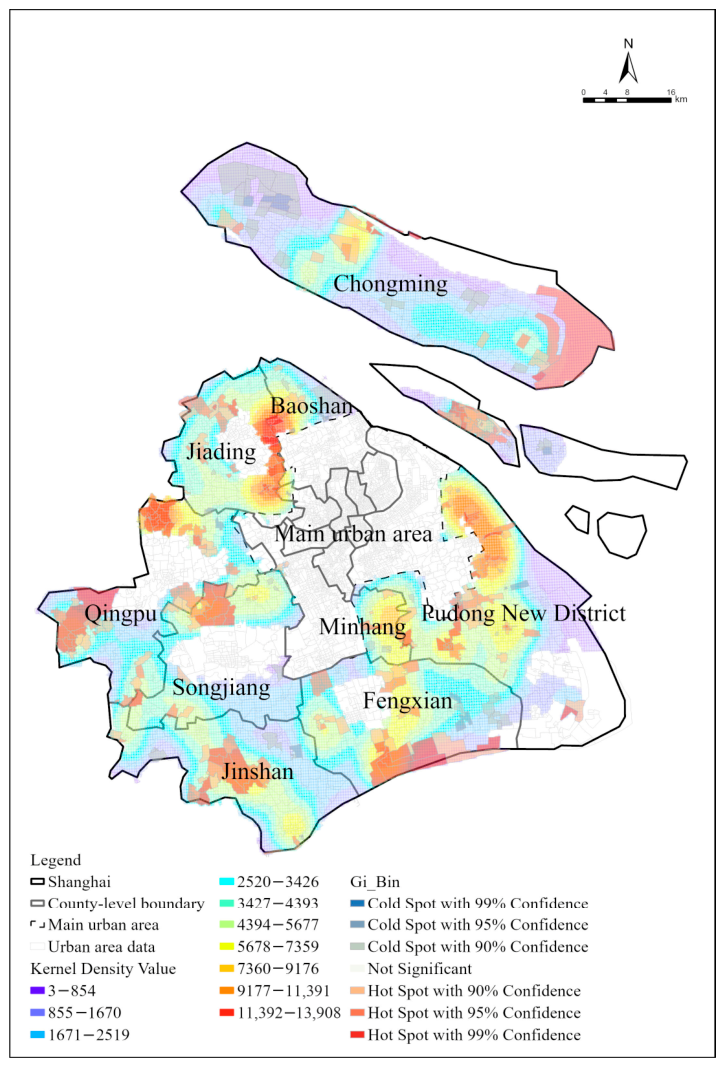
The spatial distribution of rural tourism destination POIs in Shanghai was highly uneven, exhibiting a clear “multi-core with peripheral dispersion” pattern. KDE (Figure 7) shows that facilities were strongly concentrated in the Jiading–Baoshan junction, northern Qingpu, and the central–northern part of Pudong New District, while most other suburban areas displayed scattered and low-density distributions.
Figure 7.
Kernel density estimation of rural tourism destination POIs.
Overlay analysis between POI density and Key Tourism Villages (Figure 8) indicated a pronounced spatial mismatch. Approximately 52% of Key Tourism Villages were located in low-density POI areas, whereas only 21% were situated within high-density zones. This pattern indicates that tourism facility concentration did not fully correspond to the distribution of designated priority villages.
Figure 8.
Proportional distribution of Key Tourism Villages within POI kernel density values.
The mismatch was more pronounced among Municipal Key Tourism Villages than National Key Tourism Villages, indicating weaker spatial correspondence between municipal-level designation and facility concentration. Overall, the observed pattern shows uneven alignment between policy designation and tourism facility agglomeration.
5.2. The Popularity of Rural Tourism
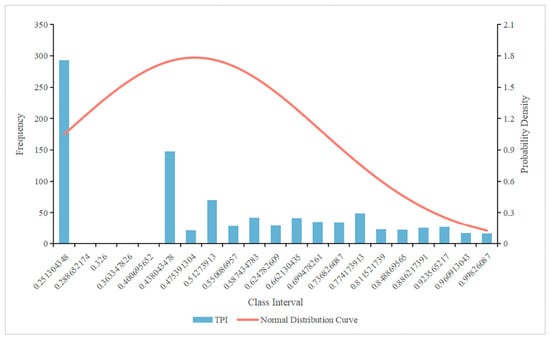
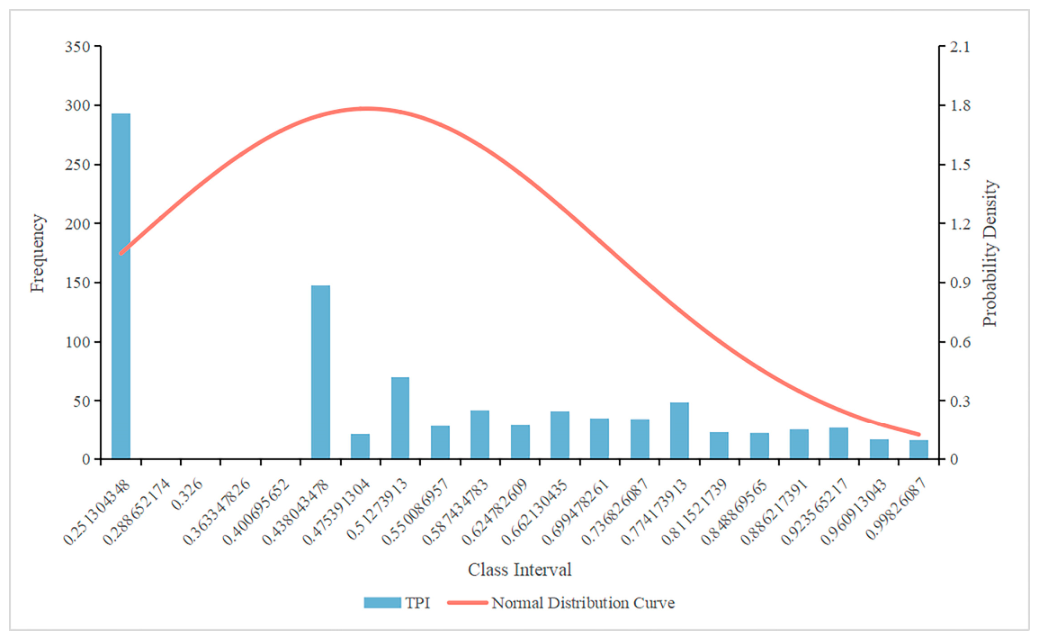
The TPI exhibited a pronounced imbalance across rural areas. TPI values ranged from 0.251 to 0.998, with a standard deviation of 0.223. The mean value of 0.500 exceeded the median of 0.469, while the sample mode of 0.251 indicated a concentration at the lower bound, consistent with the right-skewed pattern (Figure 9). This pattern suggested that most villages remained at relatively low popularity levels, while a small number of destinations attained exceptionally high popularity, thereby elevating the overall average.
Figure 9.
Frequency distribution of TPI with an overlaid normal reference curve.
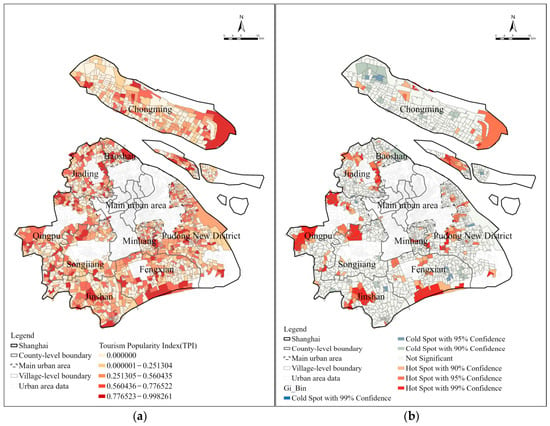
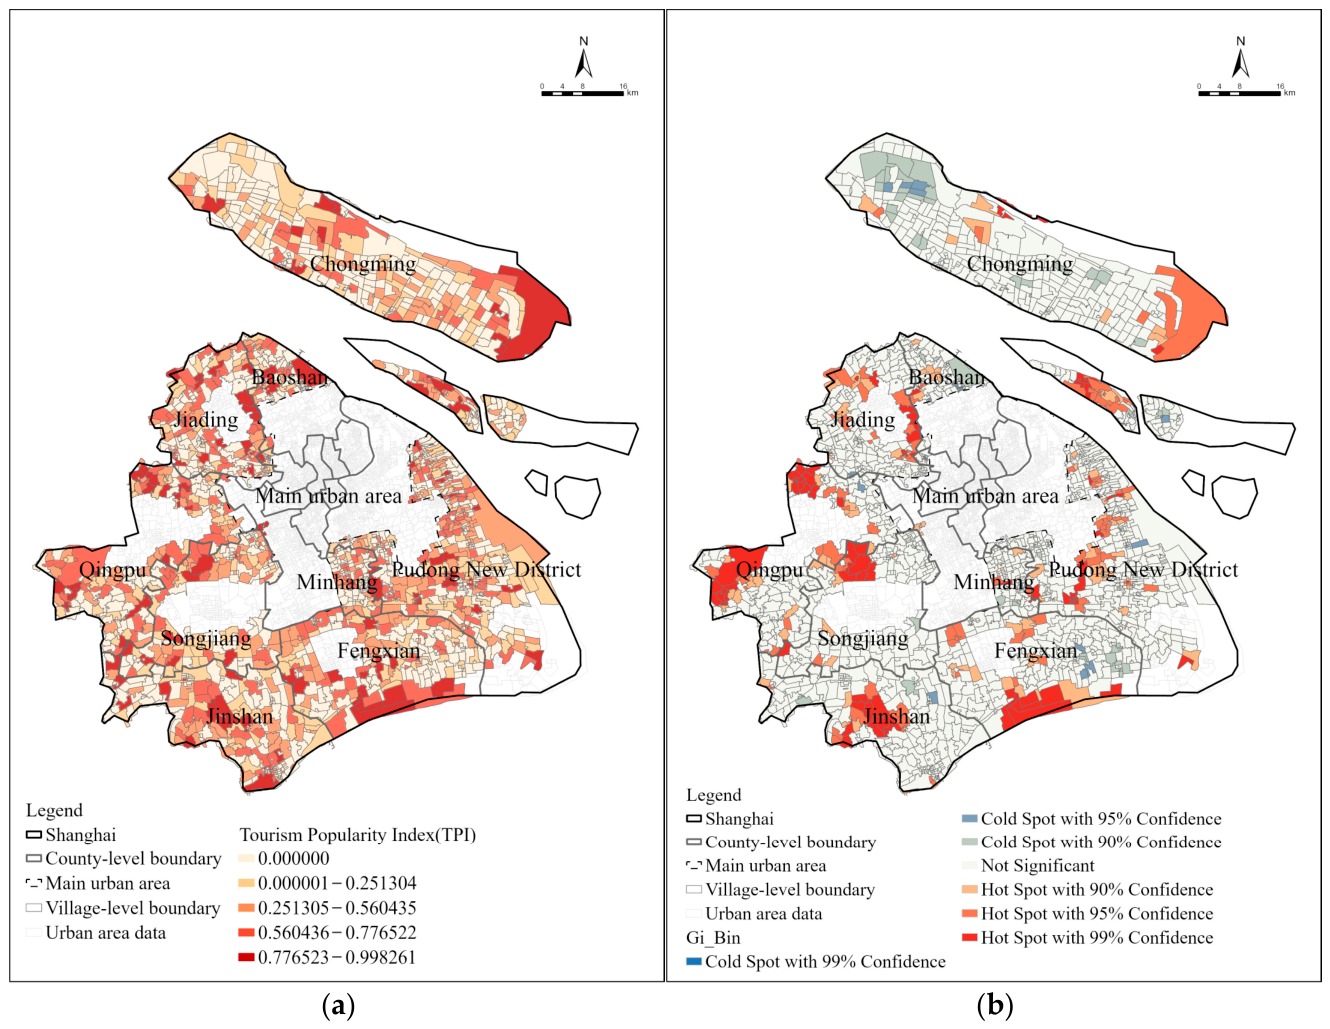
From a spatial perspective, rural tourism popularity displayed a markedly uneven and polarized pattern (Figure 10). High-popularity clusters were primarily concentrated in the western and southern suburbs and the northeastern mid-to-outer suburban areas, notably in eastern Chongming, the Jiading–Baoshan border area, and parts of Qingpu, Songjiang, Jinshan, and Fengxian. Among these, Yuehu Community in Songjiang District recorded the highest TPI value (0.998). In contrast, extensive low-popularity areas were distributed across northern and southeastern Chongming, eastern Baoshan, eastern Fengxian, and northeastern Jinshan, forming contiguous cold-spot regions.
Figure 10.
(a) Spatial distribution of tourism popularity; (b) Hotspot analysis of tourism popularity.
Overall, the results indicated a strong spatial polarization of rural tourism popularity, characterized by the concentration of tourist attention in a limited number of villages and the marginalization of a broad range of rural areas. This spatial disparity underscored the necessity of further examining the structural and policy-related mechanisms shaping tourism popularity.
5.3. Descriptive Overlay Analysis of Facility Density and Composite TPI
The overlay of POI kernel density and the composite TPI was used to describe their spatial consistency and divergence rather than to test an independent relationship between facility provision and tourism popularity, because POI counts contribute 40% of the TPI. As expected from this index construction, most high-POI-density areas coincided with high TPI values and hotspot clusters, while partial spatial mismatches remained visible in Shanghai’s peri-urban areas (Figure 11).
Figure 11.
Overlay of POI kernel density estimation and composite TPI hotspot analysis.
However, several areas exhibited relatively high composite TPI values despite low POI density, most prominently in eastern Chongming, southern Fengxian, and western Qingpu. These areas formed clear high-TPI hotspots despite lacking dense tourism facility agglomerations, showing that the composite index was not entirely determined by its facility component. High-quality resources, locational advantages, and targeted development strategies were common contextual features in some of these areas.
In eastern Chongming, high tourism popularity coincided with high-value ecological resources, particularly the Dongtan National Nature Reserve, despite relatively sparse tourism facilities. Southern Fengxian similarly combined relatively high popularity and limited POI concentration with extensive coastal green spaces. In western Qingpu, the high-popularity area around the Dianshan Lake-Oriental Land Scenic Area was also characterized by metro accessibility, a boundary location between Kunshan and Qingpu, and proximity to other destinations.
In contrast, northern Pudong New District exhibited extremely high POI density but relatively low TPI values. This pattern coincided with a high proportion of relatively homogeneous facilities, such as fruit-picking farms and fishing parks, together with limited product differentiation and integration. The coexistence of high POI density and relatively low composite TPI represents a descriptive divergence within the index and points to the need for further investigation of tourism resource integration and product competitiveness.
6. Relationship Between Policy Attention and Rural Tourism Popularity
This section examines how formal Key Tourism Village designation and text-based documented policy attention relate to rural tourism popularity through overlay and quadrant analyses.
6.1. Formal Key Tourism Village Designation and Tourism Popularity
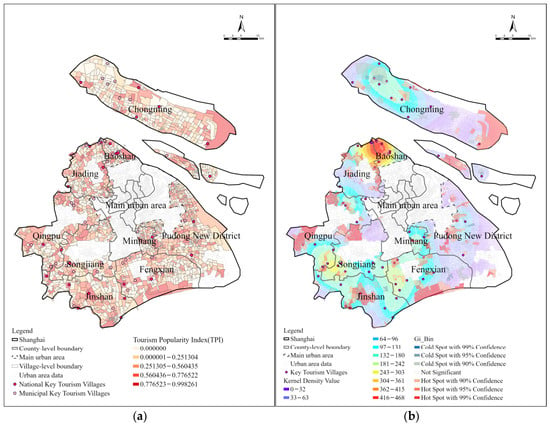
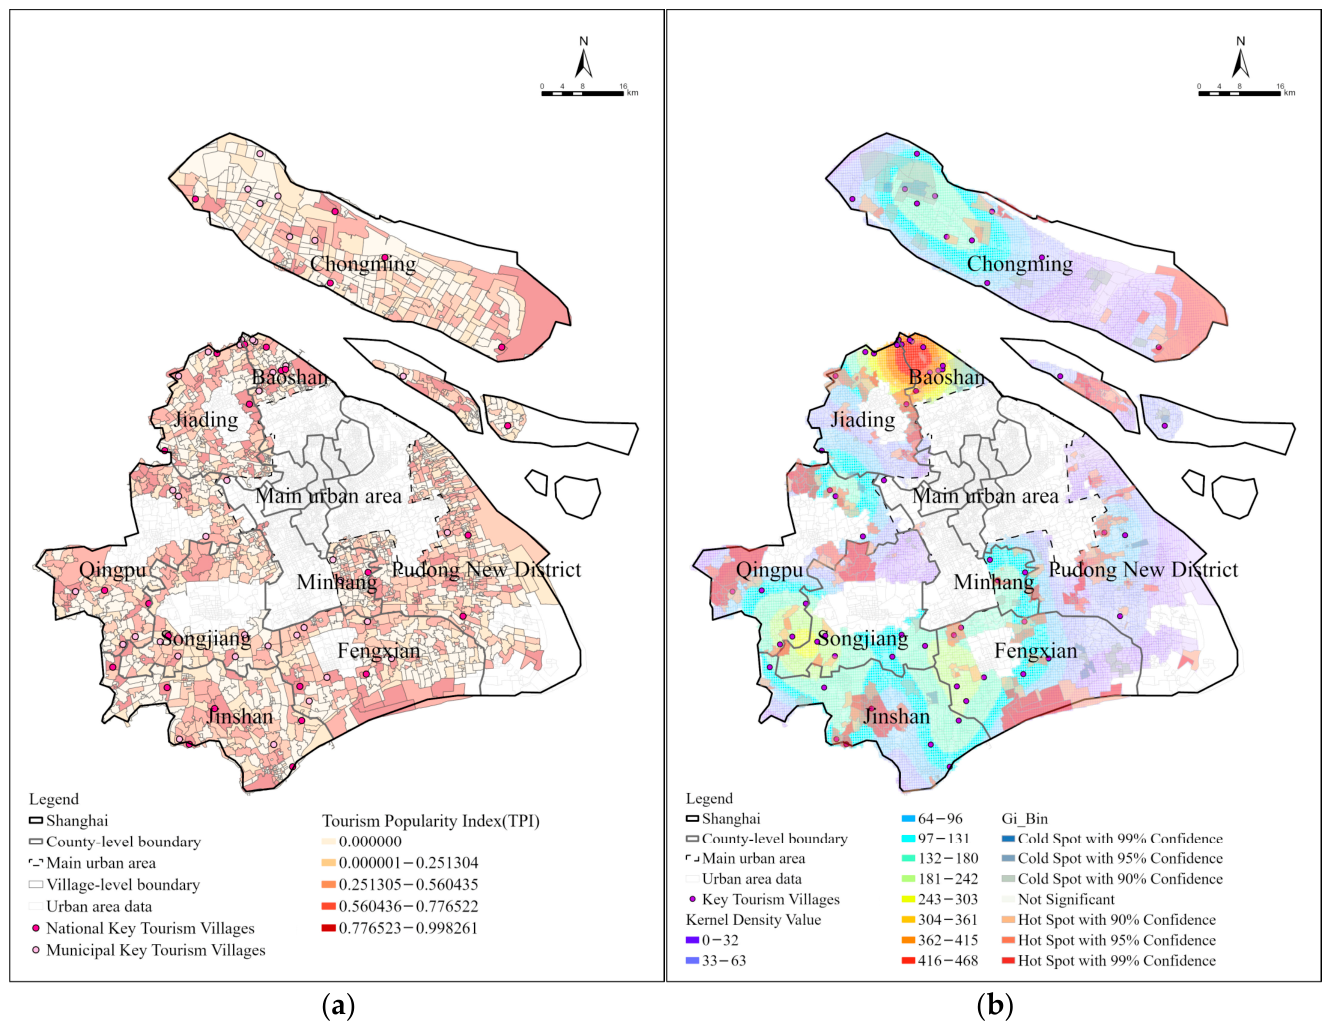
The spatial overlay between TPI and the 55 Key Tourism Villages meeting the POI inclusion criterion showed a generally positive correspondence between policy designation and tourism popularity (Figure 12). Most Key Tourism Villages were located within areas of high or above-average popularity, indicating an observed association between designation status and measured tourism popularity. Using the five-category TPI classification, 38 of the 55 designated Key Tourism Villages were classified as having high or above-average popularity (Figure 13), indicating a spatial correspondence between Key Tourism Villages designation and relatively high tourism popularity.
Figure 12.
(a) Overlay of Key Tourism Villages and tourism popularity spatial distribution; (b) Overlay of Key Tourism Villages kernel density estimation and tourism popularity hotspot analysis.
Figure 13.
Proportional distribution of tourism popularity categories among the 55 Key Tourism Villages.
Nevertheless, prominent mismatches persisted. A total of 17 Key Tourism Villages exhibited low or below-average popularity, suggesting that Key Tourism Villages status alone did not guarantee strong tourism performance. This mismatch indicates that policy designation and measured tourism popularity were not uniformly aligned.
Clear differences were observed between administrative levels. National Key Tourism Villages accounted for a higher proportion of high-popularity cases (56%) than municipal-level ones (approximately 27%), showing a descriptive difference in measured popularity. This difference may relate to designation timing, the selection of villages with pre-existing tourism strengths, subsequent support frameworks, or other village conditions. Municipal Key Tourism Villages showed lower measured popularity on average while remaining spatially diverse.
6.2. Villages with Policy–Popularity Alignment
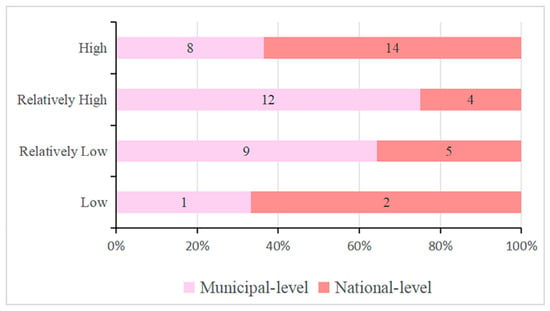
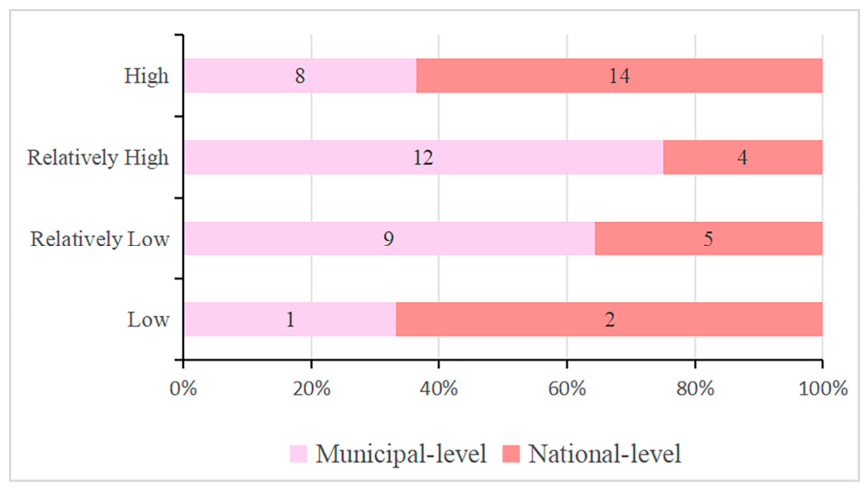
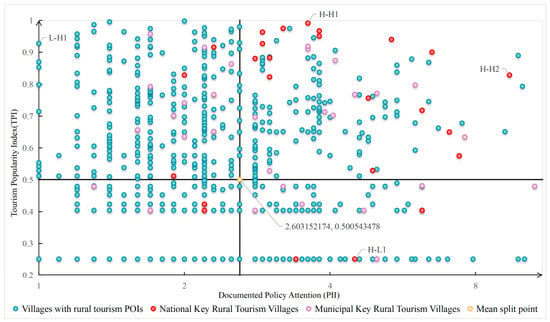
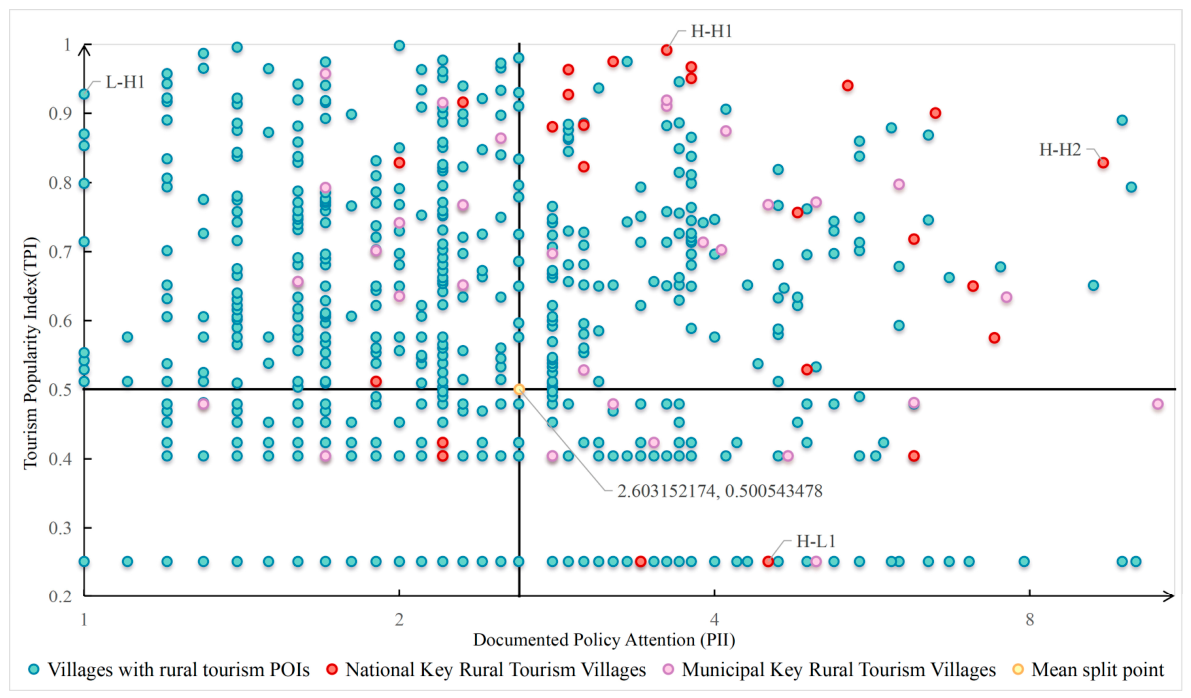
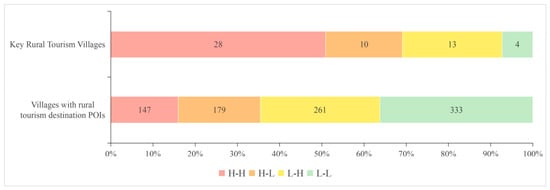
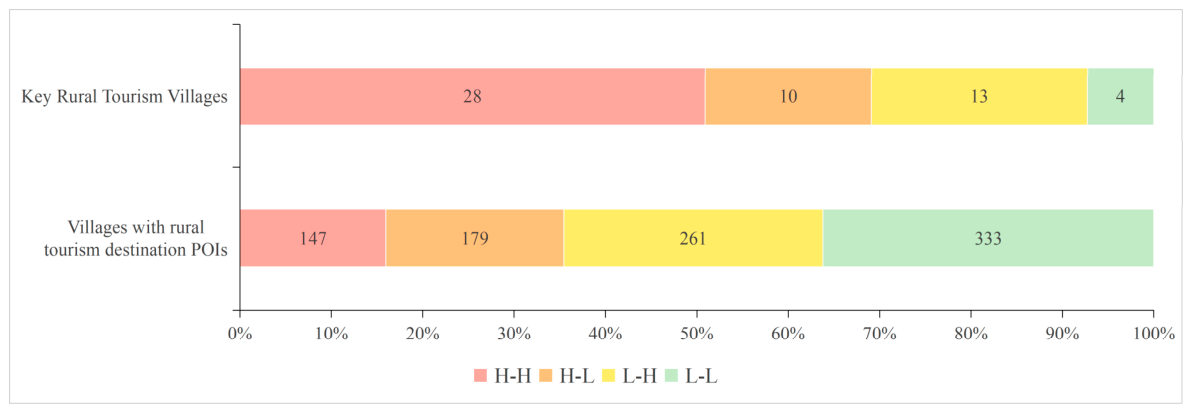
The quadrant classification based on the text-based PII and TPI placed 147 of the 920 villages (16.0%) in the H-H quadrant (Figure 14). This quadrant contained 28 of the 55 Key Tourism Villages eligible for quadrant classification (50.9%; Figure 15). The higher H-H share among eligible Key Tourism Villages than in the full sample indicates partial correspondence among formal designation, documented policy attention, and measured tourism popularity, alongside substantial heterogeneity within the designated group.
Figure 14.
Four-quadrant diagram based on the text-based PII and the Tourism Popularity Index. (The PII axis is displayed on a base-2 logarithmic scale. The mean thresholds are indicated by the horizontal and vertical lines, and points with identical index values may overlap).
Figure 15.
Village count distribution across quadrants for the 920 eligible villages, including 55 of the 66 Key Tourism Villages.
Gexin Village (Minhang District) and Qianwei Village (Chongming District) were representative H-H cases, where sustained, multi-level policy attention coincided with high tourism popularity. Gexin Village had received early and continuous policy recognition, including its inclusion in Shanghai’s rural revitalization demonstration program and its designation as a National Key Tourism Village. The policy documents and government news releases reviewed for this case describe an integrated agriculture–culture–tourism model, unified operation of idle rural housing, and inclusion in boutique tourism routes. The coexistence of these development features with a high TPI suggests that they may have supported its market visibility.
Similarly, Qianwei Village showed an alignment between sustained policy attention and high tourism popularity. As a key node within Chongming’s ecological island and all-region tourism strategies, it had received continued policy prioritization and diversified financial support. The reviewed materials document government–enterprise collaboration, infrastructure and scenic-area projects, professional operation, AAAA-level designation, ecological agriculture, and environmental education. These features may have contributed to its observed popularity.
The reviewed materials also describe differentiated land-use arrangements in both cases, including flexible use of collective construction land, activation of idle homesteads, and controlled mixed land use. These arrangements may have facilitated tourism facility provision while retaining agricultural and ecological functions, thereby providing a possible institutional context for the villages’ H-H positions.
6.3. Villages with Policy–Popularity Mismatch
The text-based PII classification placed 440 villages (47.8%) in the two mismatch quadrants, comprising 179 H-L and 261 L-H villages. Among the 55 eligible Key Tourism Villages, 10 (18.2%) were H-L and 13 (23.6%) were L-H (Figure 15).
Xianqiao Village and Qing Village were purposively selected to illustrate the local conditions associated with the H-L and L-H categories, respectively. Xianqiao, a first-batch National Key Tourism Village, recorded low measured tourism popularity. Its case materials report policy attention focused on physical construction and environmental improvement, together with homogeneous tourism products, strong seasonality, limited experiential depth, and weak branding, which may help provide a case-specific interpretation of its H-L position. In contrast, Qing Village combined limited formal policy recognition with high measured tourism popularity. Its case materials report favorable accessibility, distinctive cultural heritage, diversified tourism formats, market-oriented operation, cultural-tourism integration, agricultural branding, new-media promotion, cross-village coordination, and flexible land-industry arrangements, which may help provide a case-specific interpretation of its L-H position.
6.4. Summary of Policy–Popularity Alignment
Overall, documented policy attention and rural tourism popularity exhibited partial and uneven spatial alignment. Their broad spatial correspondence coexisted with widespread H-L and L-H mismatches, indicating substantial variation between textual policy attention and platform-based popularity.
H-H villages were commonly characterized by early and continuous policy attention, integrated industrial development, and the coexistence of spatial planning, land-use arrangements, and market-oriented operation. These contextual features were associated with the H-H classification, while only a small subset of villages combined relatively high documented policy attention with high measured tourism popularity.
Selected H-L (Xianqiao) Village combined construction-oriented policy attention with limited product differentiation, experiential design, and operational capacity, whereas selected L-H (Qing) Village combined lower documented policy attention with favorable resources, locational advantages, and adaptive market practices, illustrating two case-specific mismatch pathways. Across the full sample, documented policy attention was not consistently associated with high tourism popularity.
7. Discussion
7.1. Spatial Relationships Between Policy Attention and Tourism Popularity
This study revealed a complex and nonlinear relationship between documented policy attention and rural tourism popularity in Shanghai’s peri-urban areas. Both documented policy attention and tourism popularity exhibited pronounced spatial imbalance, but their alignment and mismatch patterns varied across regions, with the observed patterns varying alongside local economic conditions, spatial context, and market responsiveness. These spatial differences are consistent with previous Shanghai research identifying polarized rural development patterns and strong socioeconomic and locational influences [36], as well as evidence that rural tourism policy outcomes vary across local economic conditions and tourism types [18]. However, spatial clustering of tourism services was not observed across five other peri-urban villages [37], suggesting that such patterns may vary with study scale, indicators, and regional context.
At the macro scale, greater policy–popularity alignment was observed in areas with stronger economic foundations and better infrastructure, where tourism development could rapidly respond to institutional support. In contrast, in structurally disadvantaged areas, relatively high policy attention did not consistently coincide with high measured popularity, although these areas may retain development potential. This suggested that L-L areas should not be treated merely as lagging regions, but as targets for differentiated, long-term development strategies aligned with local resource endowments and regional functions. This interpretation complements village-level evidence that policy-supported transition depends on the alignment between policy design and local needs [23]. Temporal lag may also contribute to the observed H-L pattern. Infrastructure development and land-use interventions often require time to influence visitor behavior, while online reviews accumulate gradually. Villages with relatively recent attention may therefore appear as H-L cases before the corresponding tourism responses become visible in platform review data.
From a market and operational perspective, the selected H-L case illustrates how construction-oriented policy attention may coexist with homogeneous tourism products, weak experiential design, limited operational capacity, and low measured popularity. This illustrative configuration highlights product differentiation, operational capacity, and market responsiveness as potential dimensions for interpreting attention-popularity mismatches, consistent with previous studies emphasizing governance limitations and stakeholder coordination in rural tourism development [19,20].
These findings extend previous studies that examined policy attention and rural tourism spatial patterns separately by integrating documented policy attention, tourism service provision, and platform review data within a village-level framework. The resulting spatially explicit typology reveals alignments and mismatches that single indicator analyses may obscure and provides an evidence base for prioritizing resources and tailoring policy-making and destination management strategies: H-L villages warrant examination of attention timing and operational capacity; L-H villages may need targeted service support; H-H villages require consolidation and adaptive management; and L-L villages call for context-sensitive cultivation.
7.2. Limitations
Despite providing empirical evidence on the spatial relationship between policy attention and rural tourism popularity in peri-urban Shanghai, this study has several limitations. First, the analysis relies primarily on policy documents and online UGC data, which, while effective in capturing policy attention and market response, offer incomplete coverage. The focus on villages with identifiable rural tourism destination POIs may overlook emerging or informal tourism activities, and review counts, used as a proxy for tourism popularity, cannot fully reflect qualitative perceptions or experiential dimensions. This eligibility criterion may underrepresent low-supply, emerging, informal, or platform-unrecorded tourism cases and may truncate the L-L category relative to the full spatial frame. Accordingly, the findings are conditional on the 920 villages with identifiable rural tourism destination POIs and should not be generalized to all 1875 peri-urban units.
Second, methodological uncertainties remain. Semi-automated POI-UGC matching may introduce matching errors. The PII derives from village-name frequencies in official policy documents and government news releases and represents documented policy attention, including promotional visibility, repeated reporting, and high-profile events. Independent village-level data on fiscal expenditure, land-use approvals, implemented projects, infrastructure investment, subsidies, staffing, and regulatory support are required to measure the scale, timing, and substance of policy inputs. And the TPI measures online attention to selected rural tourism destination POIs, while service-based, temporary, informal, and platform-unrecorded rural tourism activities remain incompletely represented. These limitations may affect the estimated spatial distribution of PII and the subsequent hotspot and quadrant classifications.
Third, the cross-sectional dataset does not include consistent village-level controls for location and accessibility, population and income, village size, environmental and cultural resources, fiscal and market capacity, neighboring attractions, or destination maturity. The analysis therefore cannot isolate the independent contribution of PII to TPI or establish the temporal order and causal direction between them. Villages with existing tourism popularity or stronger development prospects may also receive greater policy attention, creating potential reverse causality. Because policy attention occurred at different times and review counts are cumulative, the analysis cannot explicitly estimate temporal lags. Recent attention may not yet have generated observable tourism responses, whereas earlier attention have had more time to influence tourism facilities and accumulate online reviews. Some observed H-L mismatches may therefore be temporary. Meanwhile, the observed association may also partly reflect pre-existing differences in accessibility, ecological resources, income levels, urban proximity, or administrative capacity, which were not controlled for in the present analysis. The available data therefore cannot determine whether the observed H-L cases reflect delayed associations, persistent mismatches, policy selection, or other pre-existing village conditions.
Future research could compare the PII with village-level data on fiscal expenditure, land-use approvals, implemented projects, infrastructure investment, subsidies, staffing, and regulatory measures. Matched comparative case studies of H-L and H-H villages with similar resource and accessibility conditions could combine longitudinal popularity data, participation records, project budgets, evaluation criteria, and interviews with officials, operators, and residents to test whether H-L mismatch is better explained by limited community participation or by administrative incentives favoring visible construction over market-responsive operations.
8. Conclusions
This study developed and applied an integrated village-level framework that combined policy-text, rural tourism destination POI, and platform review data to construct the text-based PII and TPI and assess their spatial relationship through overlay and quadrant analyses.
The core conclusions corresponding to the four research questions are summarized as follows. Documented policy attention was spatially uneven and fragmented, with localized hotspots and extensive low-attention areas. Rural tourism popularity was highly polarized and only partly corresponded with facility density, while favorable resources, accessibility, and differentiated tourism formats accompanied high popularity in some lower-density areas. The quadrant analysis revealed partial and uneven policy–popularity alignment, with widespread H-L and L-H mismatches and substantial heterogeneity among formally designated Key Tourism Villages. The illustrative cases suggest that attention-popularity mismatches may be associated with different configurations of policy orientation, product differentiation, operational capacity, resource and accessibility conditions, and market practices.
These findings support differentiated and stage-sensitive strategies that align policy instruments with spatial planning, industrial integration, and market-oriented operation through stronger feedback mechanisms, greater emphasis on operational quality, and cross-village and cross-sector collaboration. The study contributes empirical and analytical insights into rural tourism governance in highly urbanized regions. The spatially explicit framework offers a transferable approach for assessing policy–popularity alignment and informing rural tourism governance in other peri-urban contexts.
Author Contributions
Conceptualization, J.X.; methodology, Y.Z., J.X. and W.Z.; validation, J.X.; investigation, Y.Z.; data curation, Y.Z.; writing—original draft preparation, Y.Z.; writing—review and editing, J.X. and W.Z.; visualization, Y.Z. All authors have read and agreed to the published version of the manuscript.
Funding
This research received no external funding.
Institutional Review Board Statement
Not applicable.
Informed Consent Statement
Not applicable.
Data Availability Statement
The raw data supporting the conclusions of this article will be made available by the authors upon request.
Acknowledgments
We would like to thank the editors and reviewers for providing constructive comments on this manuscript.
Conflicts of Interest
The authors declare no conflicts of interest.
Abbreviations
The following abbreviations are used in this manuscript:
| POI | Point of Interest |
| UGC | User-Generated Content |
| TPI | Tourism Popularity Index |
| KDE | Kernel Density Estimation |
| H-H | High attention–high popularity |
| H-L | High attention–low popularity |
| L-H | Low attention–high popularity |
| L-L | Low attention–low popularity |
Appendix A
Appendix A.1
Accommodation and catering were identified from Amap categories, while agritainment and rural cultural services required explicit visitor-oriented functions in POI names or classifications.
Table A1.
Additional POI categories identified in the 11 Key Tourism Villages excluded under the baseline taxonomy.
Appendix A.2
Table A2 compares the baseline text-based PII with alternative document-type and administrative-level weights and a village-specific specification.
Table A2.
Sensitivity of text-based PII rankings and four-quadrant classifications to alternative specifications.
Under the village-specific specification, the seven highest-scoring villages remained unchanged and 16 of the top 20 were retained, while the combined H-L and L-H share remained close to the baseline, supporting stable dominant locations and a persistent broad mismatch pattern.
Appendix B
Table A3 summarizes the criteria used to purposively select four villages for illustrative interpretation. The cases were selected to illustrate contrasting policy–popularity profiles within their respective local contexts.
Table A3.
Selection criteria for illustrative case interpretation.
References
- Briedenhann, J. The Role of the Public Sector in Rural Tourism: Respondents’ Views. Curr. Issues Tour. 2007, 10, 584–607. [Google Scholar] [CrossRef] [Scilit]
- Gao, J.; Wu, B. Revitalizing traditional villages through rural tourism: A case study of Yuanjia Village, Shaanxi Province, China. Tour. Manag. 2017, 63, 223–233. [Google Scholar] [CrossRef] [Scilit]
- Liu, C.; Dou, X.; Li, J.; Cai, L.A. Analyzing government role in rural tourism development: An empirical investigation from China. J. Rural Stud. 2020, 79, 177–188. [Google Scholar] [CrossRef] [Scilit]
- Sun, P.; Cao, H. Tourism Development and Rural Land Transfer-Out: Evidence from China Family Panel Studies. Land 2024, 13, 426. [Google Scholar] [CrossRef] [Scilit]
- Tu, S.; Long, H.; Zhang, Y.; Ge, D.; Qu, Y. Rural restructuring at village level under rapid urbanization in metropolitan suburbs of China and its implications for innovations in land use policy. Habitat Int. 2018, 77, 143–152. [Google Scholar] [CrossRef] [Scilit]
- Zhu, Y.; Chai, S.; Chen, J.; Phau, I. How was rural tourism developed in China? Examining the impact of China’s evolving rural tourism policies. Environ. Dev. Sustain. 2024, 26, 28945–28969. [Google Scholar] [CrossRef] [Scilit]
- Nylander, M.; Hall, D. Rural tourism policy: European perspectives. In Rural Tourism and Sustainable Business; Channel View Publications: Clevedon, UK, 2005; Volume 26, pp. 17–40. [Google Scholar]
- Tang, M.; Xu, H. Cultural Integration and Rural Tourism Development: A Scoping Literature Review. Tour. Hosp. 2023, 4, 75–90. [Google Scholar] [CrossRef] [Scilit]
- Liu, Y.; Liao, H.; Qiu, J.; Liu, Y. Characteristics of Spatiotemporal Variations and Driving Factors of Land Use for Rural Tourism in Areas That Eliminated Poverty. Land 2023, 12, 910. [Google Scholar] [CrossRef] [Scilit]
- Ridderstaat, J.; Fu, X.; Lin, B. A framework for understanding the nexus between tourism development and poverty: Application to Honduras. Tour. Manag. 2022, 93, 104620. [Google Scholar] [CrossRef] [Scilit]
- The State Council of the People’s Republic of China. Notice on Carrying out the Construction of the National List of Key Villages for Rural Tourism by the General Office of the Ministry of Culture and Tourism and the General Office of the National Development and Reform Commission. Available online: https://www.gov.cn/zhengce/zhengceku/2019-09/26/content_5433317.htm (accessed on 30 May 2025).
- The State Council of the People’s Republic of China. Notice from 17 Departments Including the Ministry of Culture and Tourism on Issuing the “Guiding Opinions on Promoting the Sustainable Development of Rural Tourism”. Available online: https://www.gov.cn/zhengce/zhengceku/2018-12/31/content_5433069.htm (accessed on 30 May 2025).
- Shanghai Municipal People’s Government. Notice of the Shanghai Municipal People’s Government on Issuing the “The 14th Five-Year Plan (2021–2025) for Rural Revitalization in Shanghai”. Available online: https://www.shanghai.gov.cn/gwk/search/content/046782b10d2145c0b201c41aca762196 (accessed on 30 May 2025).
- Shanghai Municipal Administration of Culture and Tourism. Notice on Issuing the “Measures for the Management of Tourism Development Funds in Shanghai”. Available online: https://whlyj.sh.gov.cn/gfxwj/20250922/693e2facfaa54b50afcf0e30644fb9ec.html (accessed on 30 September 2025).
- Deng, Q.; Liu, F.; Cai, G. Analysis on the Current Situation of Implementing the Policy of Precise Poverty Alleviation in Hainan Province—From the Perspective Based on Target Groups. In Proceedings of the 2019 International Conference on Education, Management, Economics and Humanities (ICEMEH 2019), Shenzhen, China, 27 February 2019; p. 7. [Google Scholar]
- Sidali, K.L.; Kastenholz, E.; Bianchi, R. Food tourism, niche markets and products in rural tourism: Combining the intimacy model and the experience economy as a rural development strategy. J. Sustain. Tour. 2015, 23, 1179–1197. [Google Scholar] [CrossRef] [Scilit]
- Abrahams, R. Tourism and the reconfiguration of host group identities: A case study of ethnic tourism in rural Guangxi, China. J. Tour. Cult. Chang. 2015, 13, 39–55. [Google Scholar] [CrossRef] [Scilit]
- Tan, R.; Li, Y.; Zhang, L.; Luo, Y. Does rural tourism policy unlock economic growth in China’s rural areas? A synthetic control approach. Tour. Econ. 2025. advance online publication. [Google Scholar] [CrossRef] [Scilit]
- Tirado Ballesteros, J.G.; Hernández, M.H. Promoting tourism through the EU LEADER programme: Understanding Local Action Group governance. Eur. Plan. Stud. 2019, 27, 396–414. [Google Scholar] [CrossRef] [Scilit]
- Peira, G.; Longo, D.; Pucciarelli, F.; Bonadonna, A. Rural Tourism Destination: The Ligurian Farmers’ Perspective. Sustainability 2021, 13, 13684. [Google Scholar] [CrossRef] [Scilit]
- Liu, Y.-L.; Chiang, J.-T.; Ko, P.-F. The benefits of tourism for rural community development. Hum. Soc. Sci. Commun. 2023, 10, 137. [Google Scholar] [CrossRef] [Scilit] [PubMed]
- Zhang, H.; He, R.; Li, G.; Wang, J. Spatiotemporal evolution of coupling coordination degree of urban-rural integration system in metropolitan area and its influencing factors: Taking the capital region as an example. Econ. Geogr. 2020, 40, 56–67. [Google Scholar] [CrossRef]
- Li, K.; Li, K.; Liu, Y.; Yue, L.; Jiang, X. Transition Characteristics and Driving Mechanisms of Rural Settlements in Suburban Villages of Megacities under Policy Intervention: A Case Study of Dayu Village in Shanghai, China. Land 2023, 12, 1999. [Google Scholar] [CrossRef] [Scilit]
- Wang, H.; Yu, Z.; Liu, X. Deciphering Urban Soundscapes: A study of sensory experiences at Hong Kong Victoria harbour waterfronts using social media. Comput. Environ. Urban Syst. 2025, 120, 102307. [Google Scholar] [CrossRef] [Scilit]
- Xiang, Z.; Du, Q.; Ma, Y.; Fan, W. A comparative analysis of major online review platforms: Implications for social media analytics in hospitality and tourism. Tour. Manag. 2017, 58, 51–65. [Google Scholar] [CrossRef] [Scilit]
- Eren, F. 14: Urban assemblages through digital platforms: The case of Istanbul. In Handbook of Platform Urbanism; Smets, A., Ballon, P., Eds.; Edward Elgar Publishing: Cheltenham, UK, 2025; pp. 188–200. [Google Scholar] [CrossRef] [Scilit]
- Mariani, M.; Borghi, M. Are environmental-related online reviews more helpful? A big data analytics approach. Int. J. Contemp. Hosp. Manag. 2021, 33, 2065–2090. [Google Scholar] [CrossRef] [Scilit]
- Mariani, M.; Borghi, M. Environmental discourse in hotel online reviews: A big data analysis. J. Sustain. Tour. 2021, 29, 829–848. [Google Scholar] [CrossRef] [Scilit]
- Tan, H.; Liu, P.; Li, B. Perception of Tourism Destination Image in Dalian Based on Network Text Analysis. Econ. Geogr. 2021, 41, 231–239. [Google Scholar] [CrossRef]
- Qu, X.; Xu, G.; Qi, J.; Bao, H. Identifying the Spatial Patterns and Influencing Factors of Leisure and Tourism in Xi’an Based on Point of Interest (POI) Data. Land 2023, 12, 1805. [Google Scholar] [CrossRef] [Scilit]
- Srisomyong, N.; Meyer, D. Political economy of agritourism initiatives in Thailand. J. Rural Stud. 2015, 41, 95–108. [Google Scholar] [CrossRef] [Scilit]
- Wang, Y.; Man, T.W.Y. Political Economy of Tourism Development in Rural China: Case of Luting Township, Zhejiang. Tour. Plan. Dev. 2019, 16, 657–674. [Google Scholar] [CrossRef] [Scilit]
- Abedullah; Farooq, S.; Naz, F. Developing strategy for rural transformation to alleviate poverty in Pakistan: Stylized facts from panel analysis. J. Integr. Agric. 2023, 22, 3610–3623. [Google Scholar] [CrossRef] [Scilit]
- Balta, S.; Atik, M. Rural planning guidelines for urban-rural transition zones as a tool for the protection of rural landscape characters and retaining urban sprawl: Antalya case from Mediterranean. Land Use Policy 2022, 119, 106–144. [Google Scholar] [CrossRef] [Scilit]
- Perpiña Castillo, C.; van Heerden, S.; Barranco, R.; Jacobs-Crisioni, C.; Kompil, M.; Kučas, A.; Aurambout, J.P.; Batista e Silva, F.; Lavalle, C. Urban-rural continuum: An overview of their interactions and territorial disparities. Reg. Sci. Policy Pract. 2023, 15, 729–769. [Google Scholar] [CrossRef] [Scilit]
- Fang, Y.; Qiao, J.; Geng, H. Characterization of Rural Spatial Commodification Patterns around Metropolitan Areas and Analysis of Influential Factors: Case Study in Shanghai. Land 2024, 13, 1121. [Google Scholar] [CrossRef] [Scilit]
- Sadeghi, H.; Jafarpour Ghalehteimouri, K.; Seidiy, S.S. Assessment of tourism development services in peri-urban villages using the VIKOR model and spatial statistics algorithms in GIS for mapping spatial interactions. SN Soc. Sci. 2024, 4, 222. [Google Scholar] [CrossRef] [Scilit]
- Shanghai Municipal Bureau of Planning and Natural Resources. Approval of the State Council on the Urban Master Plan of Shanghai (2017–2035). Available online: https://ghzyj.sh.gov.cn/gtztgh/20230920/9799aa7eeed84b8aa318983474f9eccf.html (accessed on 30 May 2025).
- Shanghai Municipal Bureau of Statistics. The Income and Consumption Expenditure of Residents in Our City in 2024. Available online: https://tjj.sh.gov.cn/tjfx/20250121/304b193138e946df873311fb607c587b.html (accessed on 30 May 2025).
- Shanghai Municipal People’s Government. Measures for Supporting and Awarding the Development of Rural Tourism in Fengxian District. Available online: https://service.shanghai.gov.cn/XingZhengWenDangKuJyh/XZGFDetails.aspx?docid=24053114450322Sot3yZvuPhV3UObQ4 (accessed on 30 May 2025).
- Shanghai Municipal Administration of Culture and Tourism. Announcement on the Evaluation and Re-Evaluation of the Second Batch of Star-Rated Rural Homestays in Shanghai. Available online: https://whlyj.sh.gov.cn/jqxxgk/20241119/7902d31a83044683adee296e4e7b2f8e.html (accessed on 25 August 2026).
- Shanghai Municipal People’s Government. Chongming’s Westernmost Town Revitalizes Rural Tourism and Culture. Available online: https://www.shanghai.gov.cn/nw4411/20241130/fad80f564d3e42f3b844042affc6228f.html (accessed on 25 August 2026).

Disclaimer/Publisher’s Note: The statements, opinions and data contained in all publications are solely those of the individual author(s) and contributor(s) and not of MDPI and/or the editor(s). MDPI and/or the editor(s) disclaim responsibility for any injury to people or property resulting from any ideas, methods, instructions or products referred to in the content. |
© 2026 by the authors. Licensee MDPI, Basel, Switzerland. This article is an open access article distributed under the terms and conditions of the Creative Commons Attribution (CC BY) license.