


Abstract
Rapid urbanization and increasing land surface temperatures (LSTs) have intensified urban heat stress in rapidly growing tropical megacities such as Dhaka. However, the coarse spatial resolution of conventional thermal satellite imagery limits the identification of fine-scale urban thermal variability required for climate-sensitive urban planning. This study develops a multi-sensor LST downscaling framework by integrating Landsat 8 thermal imagery with Sentinel-2-derived spectral indices within the Google Earth Engine (GEE) platform. A random forest regression model was developed using the normalized difference vegetation index, normalized difference built-up index, and modified normalized difference water index as predictors for statistical downscaling from the 30 m Landsat grid to a nominal 10 m grid. To preserve localized thermal heterogeneity and improve radiometric consistency, a bicubic residual correction approach was incorporated into the downscaling workflow. The resulting statistically downscaled LST estimate on a nominal 10 m grid was subsequently used to classify Urban Thermal Zones (UTZs) across Dhaka City. The results showed that LST was negatively associated with vegetation and water-related indices and positively associated with the built-up index. The statistically downscaled product provided a more spatially detailed representation of the Landsat-derived thermal field and delineated relative surface-temperature hotspots and cooler zones across the study area. High-temperature zones were primarily concentrated within densely built-up commercial and industrial areas, whereas comparatively lower temperatures were observed in vegetated and water-dominated regions. The proposed framework demonstrates a computationally efficient approach to spatially refining Landsat-derived LST in a data-constrained tropical megacity. The findings provide valuable spatial information for urban climate adaptation, heat mitigation planning, and climate-resilient urban development.
1. Introduction
Land surface temperature (LST) is an important biophysical variable for monitoring land–atmosphere interactions, ecosystem processes, and climate-related environmental change. LST is recognized as an Essential Climate Variable because of its importance for characterizing surface energy exchanges and climate-related processes [1,2]. It is widely used to examine climate variability, surface energy balance, vegetation dynamics, and other environmental processes [3,4,5].
Urban expansion and the loss of vegetation contribute to increasing surface temperatures in many rapidly growing cities. Many South Asian urban areas now exhibit nighttime Surface Urban Heat Island Intensities (SUHIIs) of 2–3 °C or more during hot seasons, which exacerbates heat stress, increases mortality risks, and drives up energy demand [6,7,8]. Impervious surfaces and bare land generally exhibit the highest LST values and the strongest surface urban heat island effects [9,10]. Conversely, vegetation and water bodies provide localized cooling through evapotranspiration and shading [11]. The UHI effect is not merely a temperature increase; it reshapes regional climates and alters local energy. Reported urban–rural temperature differences commonly reach several degrees Celsius and may exceed 10 °C under particular climatic and morphological conditions [12]. This phenomenon has severe socioeconomic consequences. In European contexts, UHI effects have been linked to a ~45% increase in heat-related mortality during extreme weather [13]. Summer cooling loads and peak electricity demands rise significantly in most warm and temperate cities [14]. Interestingly, in severely cold regions, the UHI effect may slightly reduce total annual building energy use by lowering heating demands, highlighting the climate-dependent nature of these impacts [15].
Addressing urban heat is complicated by limitations in conventional meteorological monitoring systems, which often fail to capture fine-scale spatial temperature variability within dense urban morphologies [16,17,18]. Satellite Earth observation complements station-based monitoring by providing spatially continuous observations of land-surface conditions over large areas and at repeated intervals [19,20,21].
LST is mainly retrieved from thermal infrared (TIR) and, less often, passive microwave (PMW) satellite sensors. Bibliometric and review studies indicate that MODIS is the most widely used source of satellite-derived LST, followed by Landsat, while AVHRR and ASTER remain important for long-term monitoring and validation [22,23,24,25,26]. Urban land cover is highly heterogeneous at 5–20 m scales [3]. Landsat TIRS data can represent broad urban–rural temperature differences; however, their spatial resolution is often insufficient for analyzing fine-scale urban features [27]. MODIS provides near-daily LST observations at approximately 1 km spatial resolution, whereas Landsat and ASTER provide finer spatial detail but have longer revisit intervals and are frequently affected by cloud cover [28,29,30]. Errors can reach several degrees where small hot/cool features are mixed within a single pixel [31]. This limits the use of raw products for field-level irrigation, drought monitoring, or intra-urban heat analysis [28,29].
To overcome these resolution constraints and recover fine-scale thermal patterns, downscaling is essential. LST downscaling estimates fine-grid spatial variability by relating coarse-resolution thermal observations to predictors available at a finer spatial resolution. Previous studies have reported lower prediction errors for machine-learning and energy-balance-based approaches than for conventional statistical methods, although performance varies with the predictors, spatial scale, and landscape characteristics [30,32]. Such downscaling addresses spatial heterogeneity, but its accuracy and reliability depend on the spatial scales and predictors used [33].
Integrating Sentinel-2 MSI data with thermal sensors offers a path to greater spatial detail. Sentinel-2’s 10 m optical bands and derived indices (NDBI for imperviousness and MNDWI for moisture) correlate strongly with LST [3]. These predictors can be used to represent spatial variability associated with streets, urban blocks, vegetation patches, and water bodies more explicitly than the original coarse thermal grid [3,34]. In urban case studies, sharpening Landsat LST with Sentinel-2 has shown strong correlations with in situ temperatures (r ≈ 0.85–0.91) and provided a more spatially detailed representation of intra-urban thermal patterns [3].
Despite the growing demand for advanced remote sensing, downscaling techniques are rarely applied in rapidly developing cities. Dhaka represents a critical case due to its extreme population density and complex urban layout. Standard Landsat-derived LST products may not fully represent thermal contrasts among small and heterogeneous urban land-cover features. For example, they cannot distinguish between narrow, informal settlements and planned residential sectors.
This spatial gap makes it difficult to develop effective heat mitigation strategies tailored to the city’s landscape. In Dhaka, downscaling LST using Sentinel-2 and Landsat 8 data provides an opportunity. Such integration can provide a more spatially detailed characterization of Dhaka’s urban thermal environment. This spatially refined information can support urban thermal zoning and the development of heat-mitigation strategies.
Despite substantial advances in satellite-based urban thermal monitoring, significant limitations remain in generating high-resolution Land Surface Temperature (LST) datasets for rapidly urbanizing tropical megacities. Most existing studies primarily focus on temperate urban environments and often rely on coarse-resolution thermal products that are insufficient for capturing fine-scale intra-urban thermal variability. Although recent research has explored LST downscaling using statistical and machine learning approaches, applications in highly dense and heterogeneous cities of the Global South remain relatively limited. In particular, Dhaka City lacks an operational high-resolution thermal monitoring framework capable of identifying localized thermal hotspots and cooling zones at the neighborhood scale. Furthermore, many advanced machine learning-based downscaling approaches require substantial computational resources, complex parameterization, and extensive training datasets, which may limit their applicability in resource-constrained planning environments. Therefore, there remains a critical need for a computationally efficient, transferable, and planning-oriented thermal downscaling framework capable of supporting urban climate adaptation and heat mitigation strategies in rapidly growing tropical megacities such as Dhaka.
While previous studies have explored LST downscaling using statistical and machine learning approaches, applications in highly heterogeneous tropical megacities remain limited, particularly in the context of operational urban climate planning. This study advances existing research by developing a computationally efficient multi-sensor downscaling framework that integrates Landsat 8 thermal observations with Sentinel-2-derived biophysical indices to generate a statistically downscaled LST estimate on a nominal 10 m grid for Dhaka City. Unlike conventional interpolation-based approaches, the proposed framework incorporates bicubic residual correction to preserve sub-pixel thermal heterogeneity and maintain consistency with the original thermal signal. Furthermore, this study introduces a planning-oriented urban thermal zoning framework for Dhaka, enabling the identification of localized heat-risk areas and urban cooling zones at a micro-spatial scale. The developed workflow demonstrates the applicability of cloud-based geospatial platforms for scalable urban thermal monitoring in rapidly urbanizing and data-constrained cities of the Global South.
The major contributions of this study are summarized as follows:
- (a)
- Development of a multi-sensor thermal downscaling framework integrating Landsat 8 thermal data with Sentinel-2 spectral indices to generate a statistically downscaled LST estimate on a nominal 10 m grid for Dhaka City.
- (b)
- Integration of a bicubic residual correction approach to preserve localized thermal variability and improve radiometric consistency during the downscaling process.
- (c)
- Generation of statistically downscaled Urban Thermal Zones (UTZs) for identifying localized thermal hotspots and urban cooling zones across Dhaka City.
- (d)
- Demonstration of an automated and computationally efficient workflow within the Google Earth Engine (GEE; Google LLC, Mountain View, CA, USA) platform suitable for rapidly urbanizing and data-constrained cities.
- (e)
- Provision of spatially explicit thermal information that can support climate-sensitive urban planning, heat mitigation strategies, and urban resilience initiatives.
The primary aim of this research is to develop a multi-sensor framework for statistically downscaling LST in Dhaka City by integrating Landsat 8 thermal imagery with Sentinel-2 spectral indices within a cloud-based geospatial environment. The study further aims to identify and analyze urban thermal zones to support climate-sensitive urban planning and heat mitigation strategies.
To achieve this aim, the study pursues the following specific objectives:
- (a)
- To develop a multi-sensor LST downscaling framework by integrating Landsat 8 thermal data with Sentinel-2-derived biophysical indices within the Google Earth Engine platform.
- (b)
- To generate and evaluate a statistically downscaled LST estimate on a nominal 10 m grid for representing fine-scale spatial thermal variability across Dhaka City.
- (c)
- To classify and analyze Urban Thermal Zones (UTZs) in order to identify thermal hotspots and urban cooling zones for supporting climate-responsive urban planning and heat mitigation strategies.
The study was designed as a detailed methodological case study based on one carefully selected pair of near-date, dry-season satellite observations. Its objective was to evaluate the spatial application of the proposed multi-sensor downscaling framework rather than to establish temporal transferability across seasons or years.
The remainder of this paper is organized as follows. Section 2 describes the study area, datasets, and methodological framework used for LST retrieval and spatial downscaling. Section 3 presents the results of spectral analysis, downscaled thermal mapping, model validation, and urban thermal zoning. Section 4 discusses the implications of the findings, model performance, planning relevance, and limitations of the study. Finally, Section 5 summarizes the major conclusions and future research directions.
2. Materials and Methods
2.1. Study Area
Dhaka, the capital and largest metropolitan area of Bangladesh, is located in the central part of the country. Geographically, Dhaka city is located between 23.4–23.54 N and 90.2–90.3 E [35].
Dhaka is situated on the lower reaches of the Ganges-Brahmaputra Delta. The city has a tropical monsoon climate characterized by high temperatures, pronounced seasonal rainfall, and high humidity.
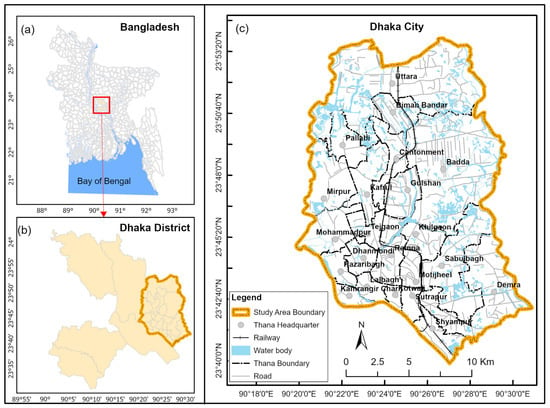
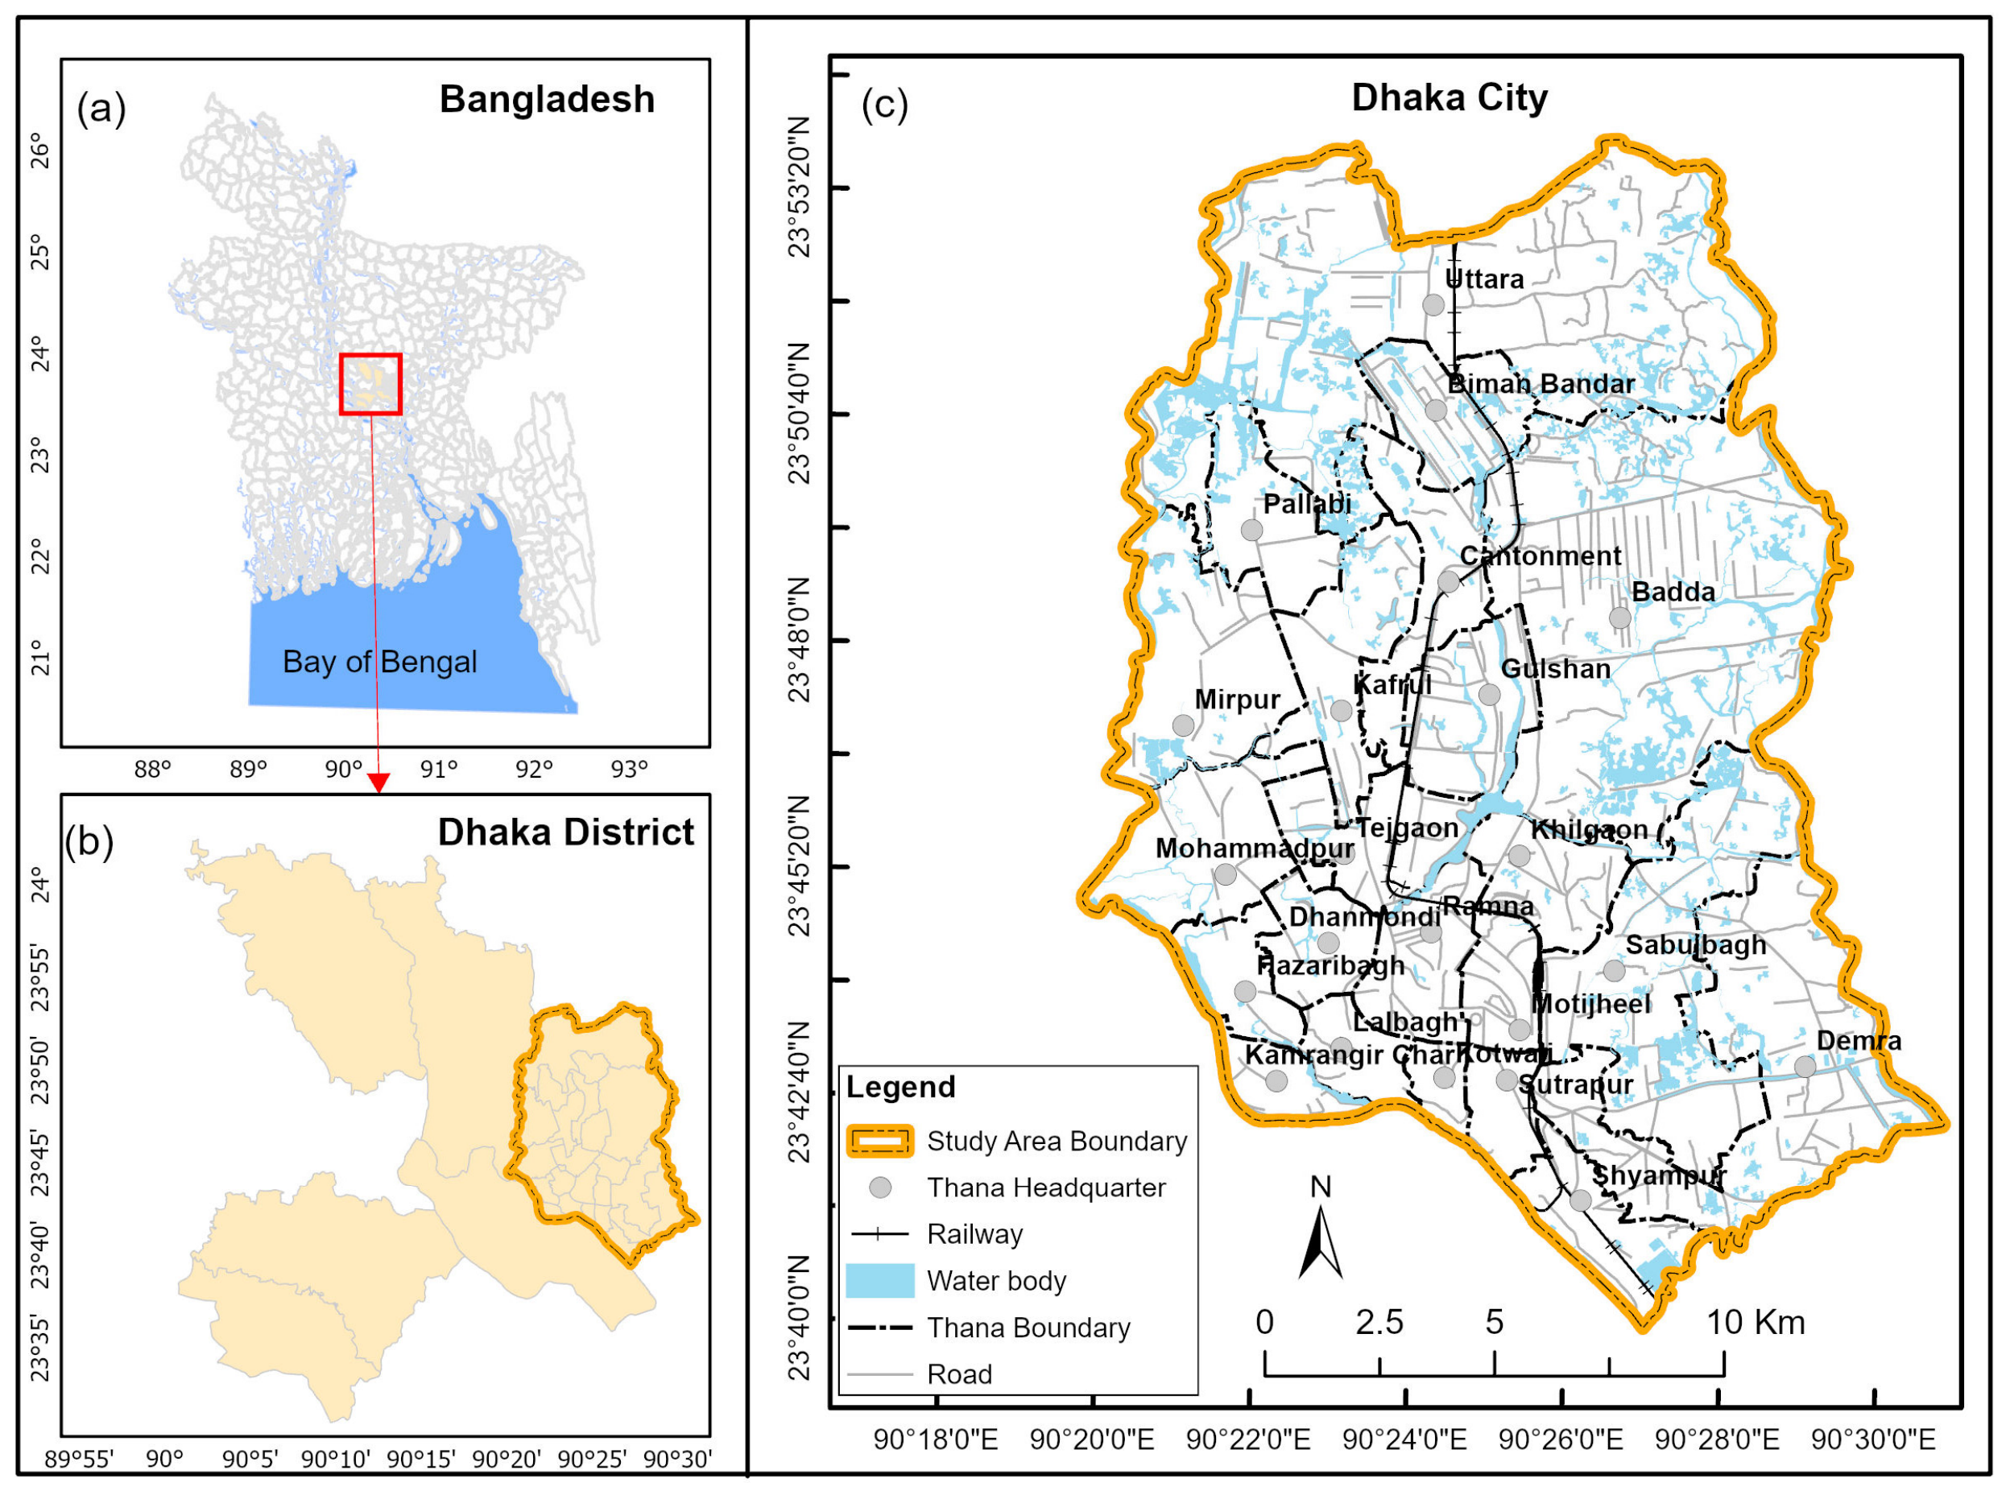
Dhaka was selected as the study area (Figure 1) because it currently lacks high-resolution thermal monitoring frameworks. The spatial resolution of conventional satellite LST products may be insufficient to represent thermal contrasts among Dhaka’s heterogeneous urban surfaces. This makes it a critical case study for implementing downscaling techniques to bridge the spatial gap in urban thermal zoning.
Figure 1.
Location of (a) Dhaka district in Bangladesh; (b) the city of Dhaka in Dhaka district; and (c) base map of the city of Dhaka.
2.2. Data Used
The primary datasets used in this study are Landsat 8 and Sentinel-2 data. These satellite data were accessed and processed through the Google Earth Engine cloud-computing platform. The workflow enabled efficient cloud-based preprocessing without the artifacts associated with manual handling.
As illustrated in Table 1, the Sentinel-2 Surface Reflectance (Level-2A) Harmonized collection was utilized to derive high-resolution (10 m) biophysical predictors. The use of the “harmonized” product is critical as it accounts for the subtle spectral differences between the Sentinel-2A and 2B sensors. This also provides a consistent timeseries. Simultaneously, thermal infrared data (30 m) were retrieved from the Landsat 8 Collection 2 Level-2 (Tier 1) dataset, which incorporates the geometric and radiometric calibration procedures provided by the USGS.
Table 1.
Summary of Data Specifications.
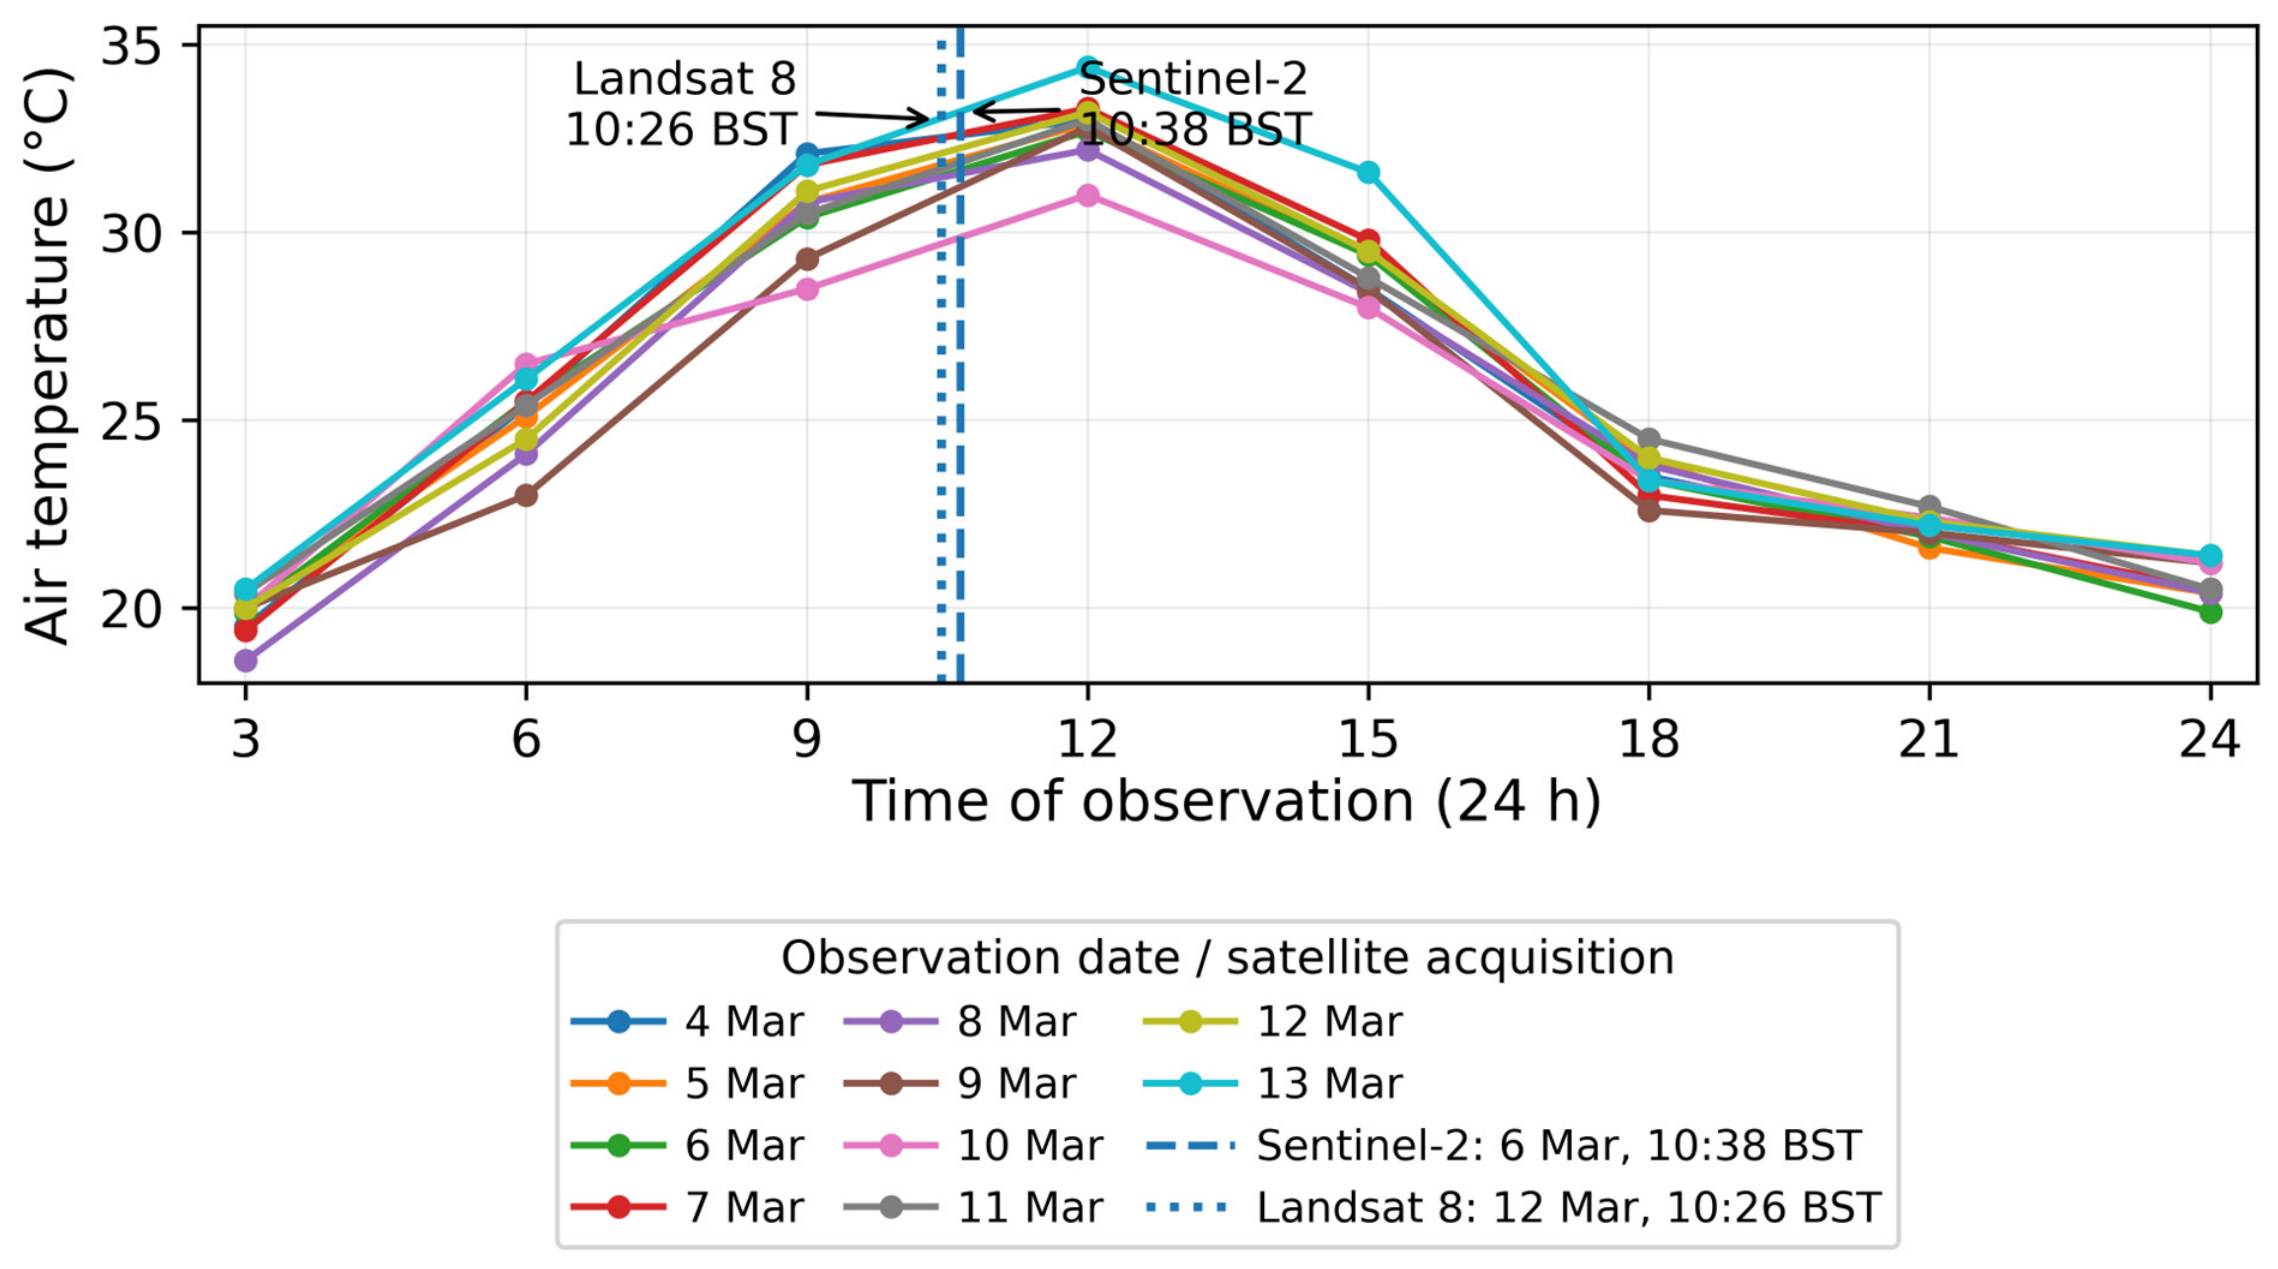
Same-date cloud-free Landsat 8 and Sentinel-2 observations were unavailable over Dhaka City during the selected study period. The closest suitable cloud-free images were therefore used: Sentinel-2 imagery acquired on 6 March 2025 and Landsat 8 imagery acquired on 12 March 2025. The two observations were acquired at closely comparable local times. Sentinel-2 passed over the study area at 10:38:21 BST, whereas Landsat 8 acquired the thermal observation at 10:26:15 BST, representing a difference of approximately 12 min. Thus, both observations correspond to approximately the same late-morning phase of the diurnal heating cycle, reducing potential bias attributable solely to differences in acquisition time.
To evaluate the meteorological comparability of the two acquisition dates, 3-hourly air-temperature observations from the Bangladesh Meteorological Department (BMD) were examined for the 10-day period from 4 to 13 March 2025 (Figure 2). These station observations were not used to numerically adjust or calibrate the satellite-derived LST because air temperature and land surface temperature represent different physical quantities. Instead, the BMD record was used as an independent meteorological consistency check. The 09:00 and 12:00 BST observations bracketed both satellite overpasses and indicated comparable late-morning heating conditions. Air temperatures were 25.5 °C at 09:00 and 30.4 °C at 12:00 on 6 March, and 24.5 °C at 09:00 and 31.1 °C at 12:00 on 12 March. The broader 10-day record also showed similar diurnal temperature behavior around the two acquisition dates, supporting the meteorological comparability of the selected image pair.
Figure 2.
Three-hourly air-temperature observations for Dhaka during 4–13 March 2025, with the Sentinel-2 and Landsat 8 acquisition times indicated. (Data Source: Bangladesh Meteorological Department).
Nevertheless, station-measured air temperature is not equivalent to land surface temperature, and BMD land-surface temperature observations were unavailable for the study period. Therefore, the meteorological comparison supports the comparability of atmospheric thermal conditions between the two dates but does not eliminate uncertainty associated with short-term changes in surface moisture, vegetation condition, irrigation, solar exposure, or other land-surface processes during the six-day interval.
The principal analysis was restricted to a single image pair to maintain consistency in seasonal conditions, spatial coverage, image quality, and preprocessing. Additional opportunistic image pairs were not combined with the principal case because differences in season, cloud-free coverage, surface moisture, atmospheric conditions, and acquisition intervals could introduce confounding effects. A rigorous assessment of temporal generalizability would require a systematically designed multi-date dataset representing comparable observations across seasons and years.
2.3. Data Processing
The data-processing workflow was implemented primarily on the GEE cloud-computing platform. GEE was selected for its high-performance computational capabilities, allowing for the seamless processing of large-scale satellite datasets without the need for local storage or extensive hardware resources. The entire analysis was automated using the JavaScript API within the GEE environment.
After processing, the resulting datasets were exported from GEE in GeoTIFF format. QGIS 3.44 LTR (QGIS Association, Grüt, Switzerland) was used for cartographic visualization and to generate the final thematic maps. The WGS 84/UTM Zone 46N coordinate system was used to maintain spatial accuracy across all urban planning layers.
2.4. LST Downscaling Framework
The downscaling of LST is a critical procedure to bridge the gap between coarse-resolution thermal data and high-resolution urban planning requirements. Random Forest (RF) was selected because it can represent nonlinear relationships and interactions between LST and multiple biophysical predictors. However, its ensemble structure does not eliminate the possibility of overfitting or spatially optimistic validation. Spatially blocked cross-validation was therefore used to evaluate model transferability.
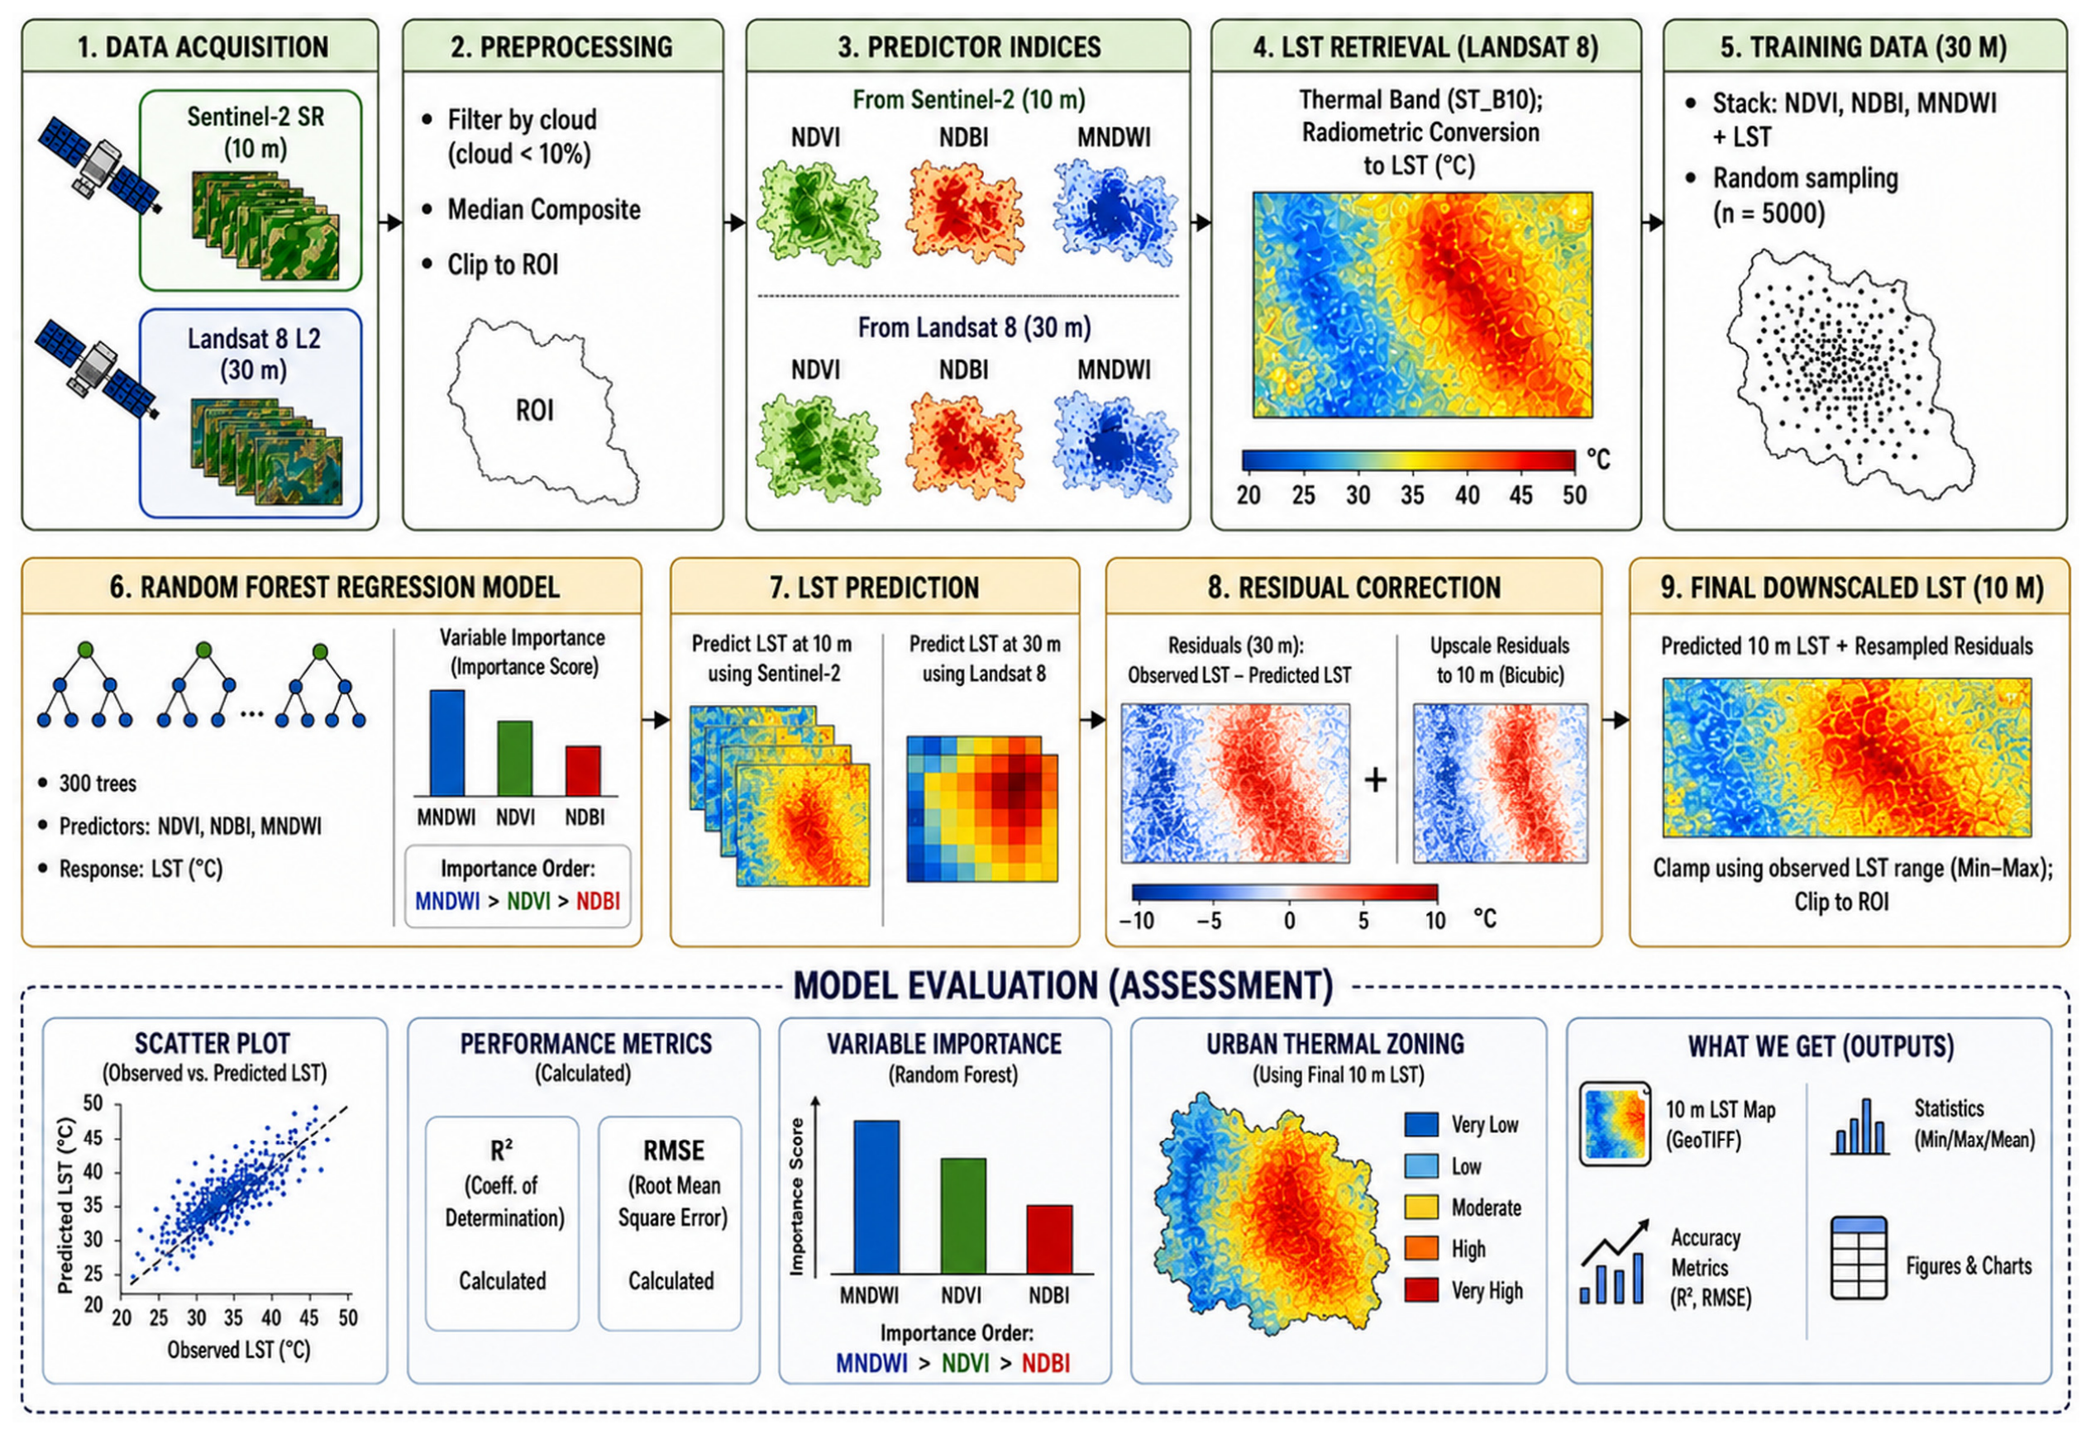
The framework includes a residual-correction step to retain coarse-scale agreement with the Landsat-derived thermal field. Unlike simple interpolation, this method calculates the residuals (the difference between observed and predicted LST) at the original 30 m resolution, up-samples them via bicubic interpolation, and re-injects them into the final 10 m prediction. This step was intended to preserve agreement with the Landsat-derived thermal field while introducing spatial variation guided by the Sentinel-2 predictors. By integrating these multi-sensor kernels, the framework produces a spatially refined representation of the Landsat-derived thermal field, with fine-grid variation guided by the Sentinel-2 predictors. The methodological workflow for LST downscaling is presented in Figure 3.
Figure 3.
Methodological workflow for LST downscaling using Sentinel-2 and Landsat 8 Images (Arrows indicate processing flow; tree symbols represent Random Forest decision trees, and the ellipsis (…) indicates additional trees not shown. Colors in the variable-importance bars only distinguish MNDWI, NDVI, and NDBI. Blue-to-red gradients indicate lower-to-higher LST. R2 is the coefficient of determination, and RMSE is the root mean square error.).
2.4.1. Calculation of Land-Cover Indices
The calculation of land cover indices was performed using GEE. In this study, Sentinel-2 Band 8 (10 m) was utilized for NDVI and NDBI calculations instead of Band 8A (20 m) (Table 2). This selection was made to maximize consistency of the fine-grid predictor data used in the downscaling procedure.
Table 2.
Land cover indices used for LST downscaling.
These indices were calculated for every pixel across the study area. This procedure produced predictor datasets at the spatial support required for model development and downscaling. The Sentinel-2-derived indices provided the finer-grid spatial information used to guide the downscaled estimates. Meanwhile, the 30 m indices from Landsat 8 were used for the initial temperature modeling. The predictor datasets were used to relate the Landsat-derived thermal field to finer-scale land-cover variation. This step provides the fine-grid predictor information required for statistical LST downscaling.
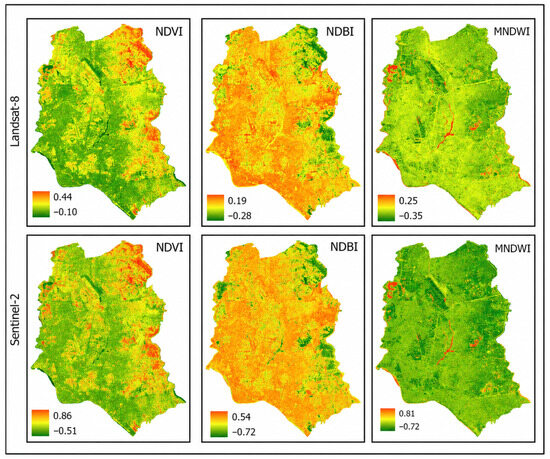
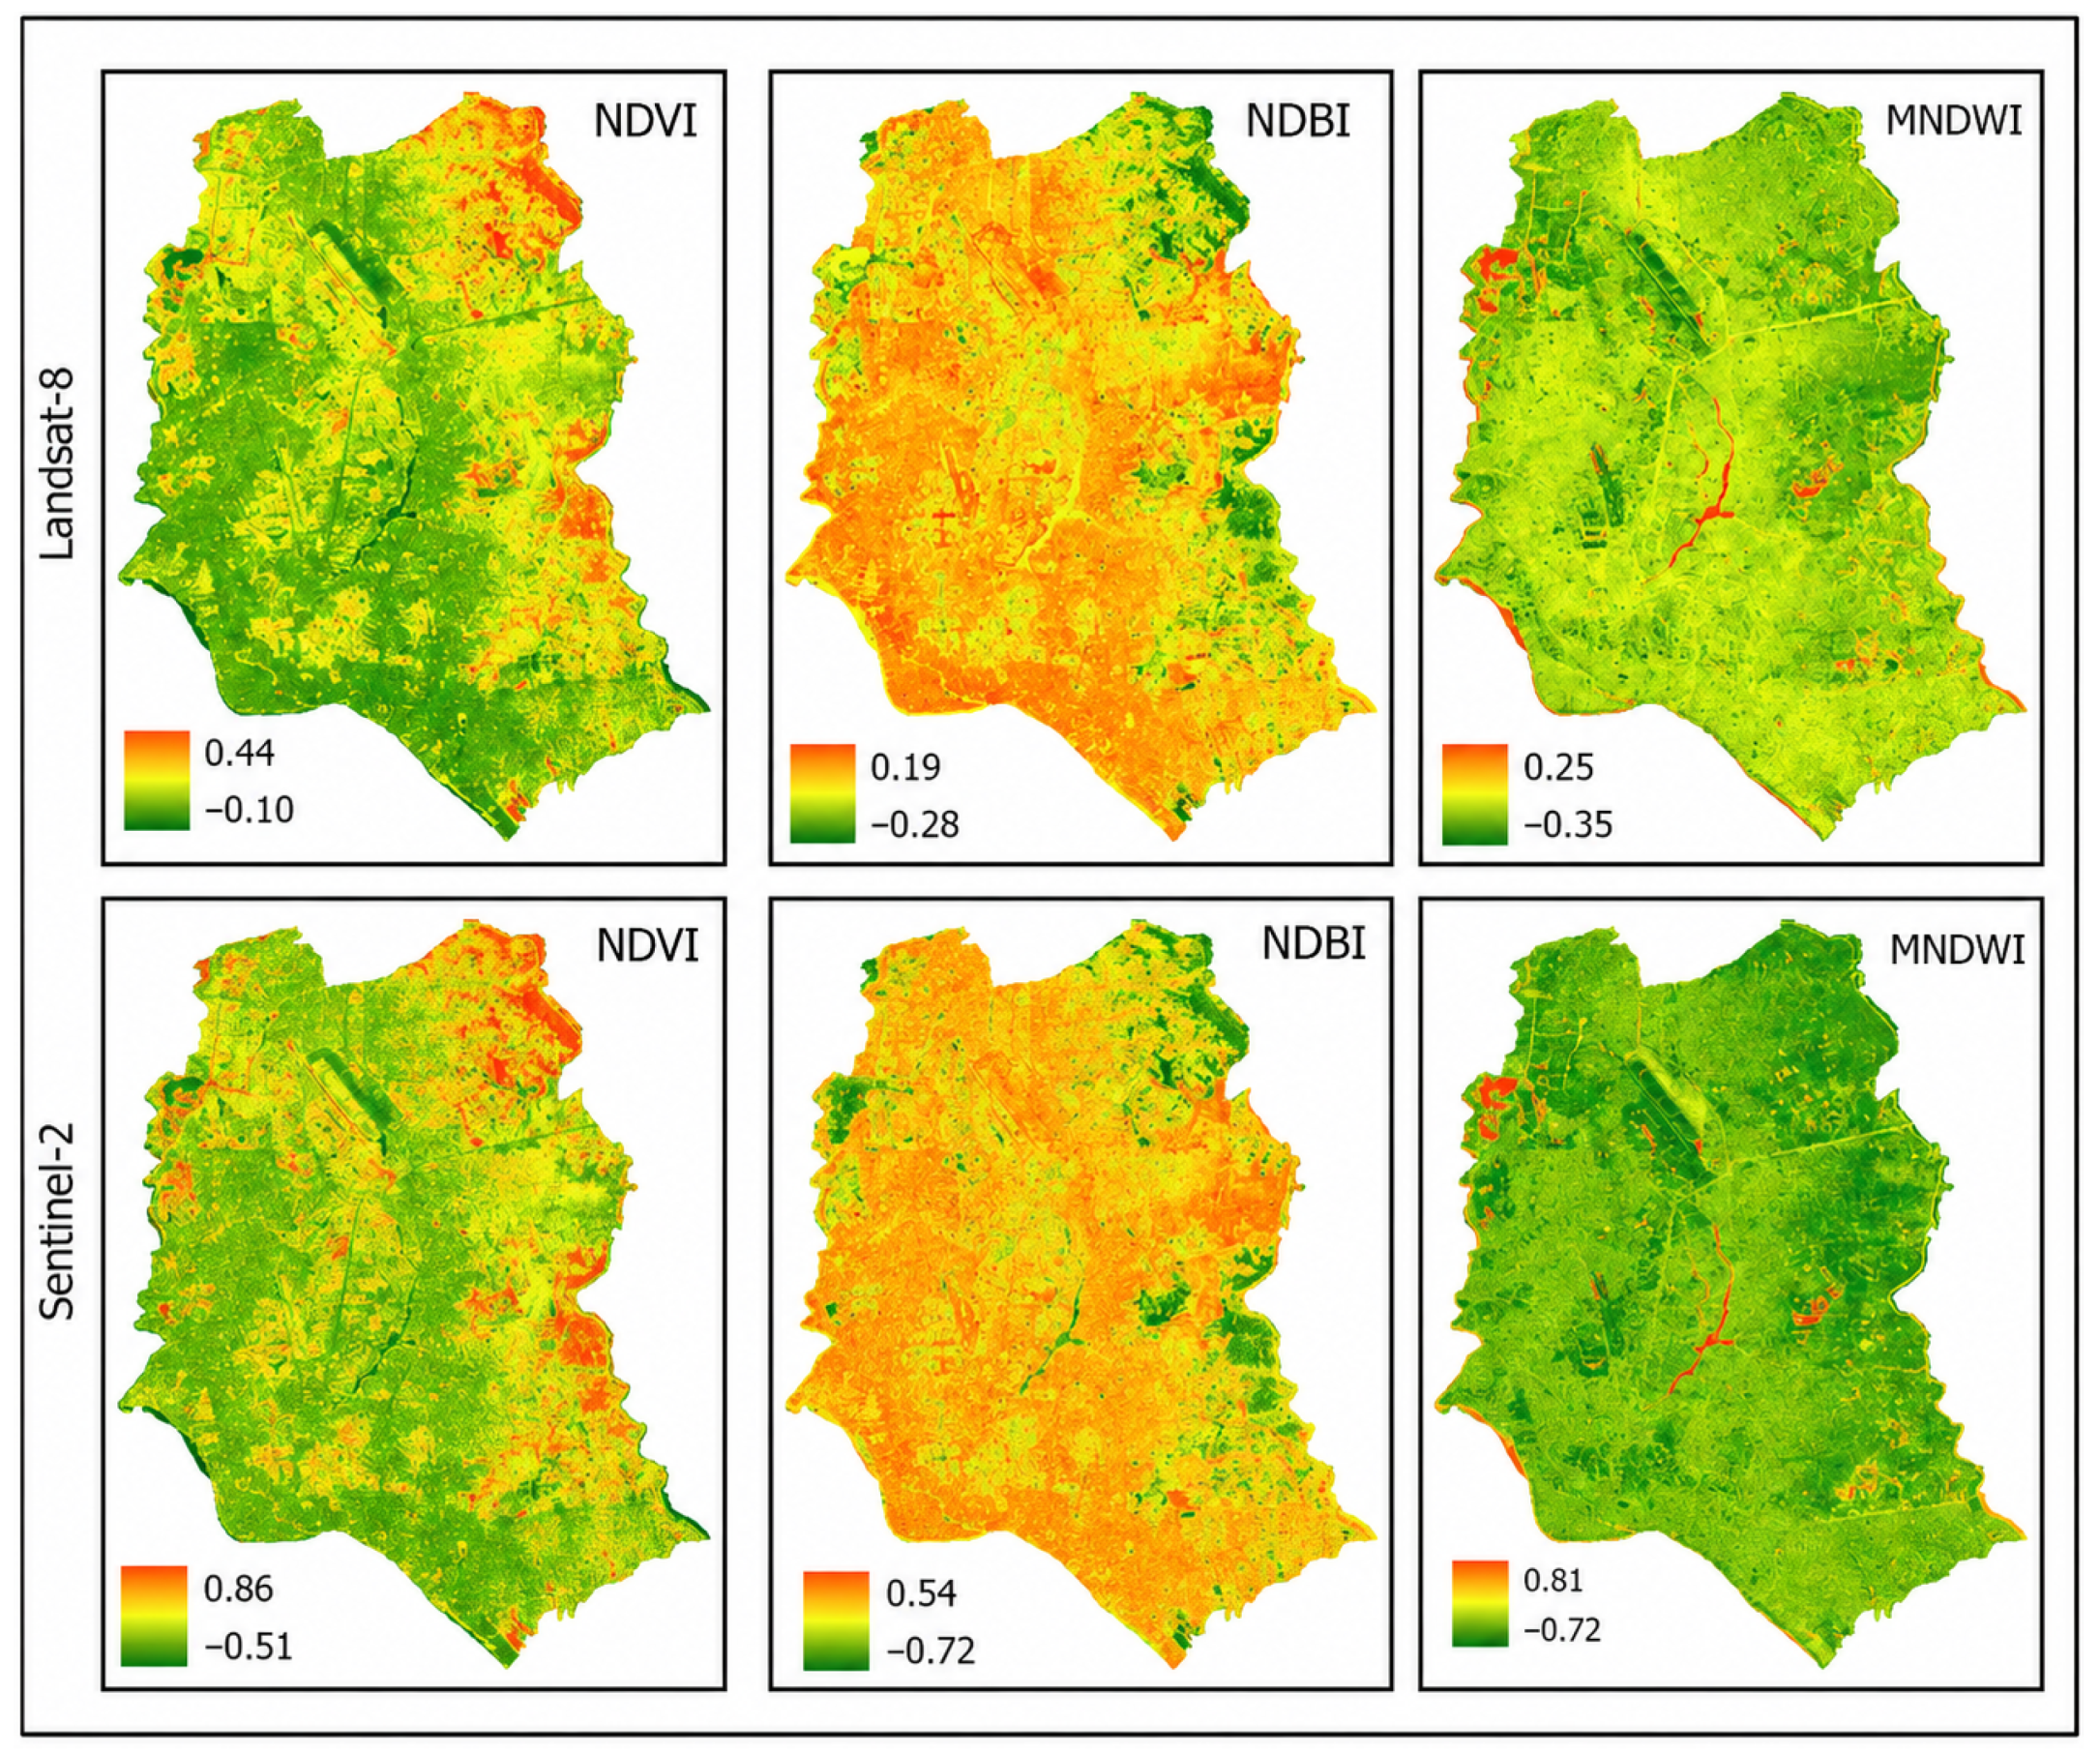
Figure 4 illustrates the derivation of key spectral indices used in this study from two satellite sensors. As shown in Figure 4, the workflow highlights how consistent spectral indices are generated from both sensors, enabling comparative analysis of land surface characteristics across different spatial resolutions.
Figure 4.
Derivation of spectral indices from Landsat 8 OLI (30 m resolution) (top row) and Sentinel-2 MSI (10 m resolution) (bottom row).
2.4.2. Retrieval of Landsat-Derived LST
The retrieval of LST involves transforming raw thermal signals into physical temperature values. This process follows a systematic radiometric calibration and statistical validation workflow within GEE.
Landsat-derived LST was obtained from the Landsat 8 Collection 2 Level-2 ST_B10 surface-temperature product. The scaled ST_B10 digital numbers were converted to Kelvin using the USGS scale factor and offset and subsequently converted to degrees Celsius. The conversion was implemented as follows:
where DN represents the scaled digital number of the ST_B10 band. The values 0.00341802 and 149.0 are the scale factor and offset, respectively, specified for this product. Subtracting 273.15 converts the temperature from Kelvin to degrees Celsius.
Ts = (DN × 0.00341802 + 149.0) − 273.15
To exclude anomalous values associated with residual cloud contamination, cloud shadows, and other image artifacts, the final statistically downscaled LST was constrained to the valid temperature range obtained from the rerun model output. The verified minimum and maximum temperatures were 28.88 °C and 39.25 °C, respectively. The clamping operation was implemented as follows:
LST_final = max(28.88, min(LST, 39.25))
Values below 28.88 °C were assigned the lower limit, while values above 39.25 °C were assigned the upper limit. The same verified limits were used consistently in the final raster, statistical analysis, Urban Thermal Zone classification, and cartographic outputs.
2.4.3. Random Forest, Sampling, Training and Spatial Validation
The RF modeling dataset was constructed at the 30 m Landsat spatial support. Landsat-derived LST was used as the response variable, while NDVI, NDBI, and MNDWI were used as predictor variables. Pixels affected by cloud, cloud shadow, missing observations, or invalid LST and index values were excluded before sampling.
A total of 5000 valid pixels were sampled across the study area. To reduce spatial dependence between model-development and validation observations, the study area was divided into 1 km × 1 km spatial blocks. The blocks were assigned to five mutually exclusive folds, and all samples from the same block were retained within the same fold.
During each cross-validation iteration, approximately 4000 samples from four folds were used for training, and approximately 1000 samples from the remaining fold were withheld for validation. The procedure was repeated until every fold had served once as the validation subset.
The RF model was implemented in regression mode using 300 decision trees. The final model configuration included the number of variables considered at each split, minimum leaf population, bagging fraction, maximum number of nodes, and random seed.
Spatial blocking was used instead of unrestricted random pixel splitting to reduce the likelihood that neighboring and environmentally similar pixels occurred in both the training and validation datasets. Residuals were calculated from training observations only during each validation iteration. Therefore, observed LST values from the withheld blocks were not used in model fitting or residual correction.
Random Forest was not assumed to be inherently immune to overfitting. Model generalizability was evaluated using the geographically withheld observations, and the pooled spatial-validation RMSE of 0.96 °C was used as the principal measure of predictive performance.
2.4.4. Final LST Downscaling
In this step, the trained RF model was applied to 10 m Sentinel-2 indices to generate the initial prediction. To preserve the radiometric integrity of the original Landsat 8 data, a bicubic residual correction was integrated. The final LST was calculated as follows:
where ΔLSTresampled represents the residual-correction term resampled to the nominal 10 m grid using bicubic interpolation.
LSTfinal_10m = RFpredicted_10m + Δ LSTresampled
2.4.5. Model Validation and Spatial-Consistency Assessment
Model evaluation was designed to distinguish the predictive performance of the Random Forest relationship from the consistency of the final downscaled product with the Landsat thermal data.
Spatial blocking was used instead of a conventional random pixel-level split to reduce the likelihood that neighboring pixels with similar land-cover and thermal characteristics occurred in both the training and validation datasets. For each iteration, the RF model and its residual-correction component were developed using training observations only. The observed LST values within the withheld blocks were not used for model fitting or residual calculation.
Model predictive performance was evaluated by comparing RF-predicted LST with observed Landsat 8 LST in the spatially withheld blocks. Root Mean Square Error (RMSE) was used as the principal metric of spatially withheld predictive performance. A separate coefficient of determination (R2) was calculated after aggregating the final nominal 10 m estimate to the original 30 m Landsat grid to quantify coarse-scale spatial consistency with the source Landsat thermal field.
A separate spatial-consistency assessment was conducted for the final downscaled product. The nominal 10 m LST estimate was aggregated to the original 30 m Landsat grid before comparison with the Landsat-derived LST. Because Landsat LST was used during model training and residual correction, this comparison was interpreted as a consistency assessment rather than independent validation of thermal accuracy at 10 m.
No coincident ground-based radiometric measurements, airborne thermal imagery, UAV thermal observations, or other independent fine-resolution LST data were available for the acquisition date. Consequently, the accuracy of individual pixels in the nominal 10 m product could not be validated directly.
2.5. Google Earth Engine Workflow
The entire computational workflow was implemented on the Google Earth Engine (GEE) cloud-computing platform. This process transforms Landsat 8 Collection 2 Level 2 thermal data from 30 m resolution to a 10 m product by integrating Sentinel-2 Level-2A multi-spectral indices.
Initially, Landsat 8 and Sentinel-2 collections were filtered for Dhaka City with a 10% cloud cover metadata threshold to ensure high data quality. Three biophysical predictors—NDVI, NDBI, and MNDWI—were calculated, with Sentinel-2 indices processed at 10 m and Landsat 8 indices at 30 m to serve as training baselines.
A random forest regression model was established at the 30 m scale. The algorithm was trained using 5000 random samples to capture the complex, non-linear relationships between the 30 m Landsat LST and the spectral predictors. This trained model was then applied to the 10 m Sentinel-2 indices to generate an initial predicted LST map.
To maintain radiometric integrity, regression residuals were calculated and resampled to 10 m using bicubic interpolation. Following residual correction, the final downscaled LST was constrained to the verified range of 28.88–39.25 °C. The corrected raster was subsequently used for urban thermal zone classification and spatial interpretation.
3. Results
3.1. Spectral Indices and LST
Understanding the relationship between Landsat 8-derived LST and biophysical indices (NDVI, NDBI, and MNDWI) is fundamental for urban climate studies. Examining these relationships helps characterize the association between land-cover composition and the Landsat-derived thermal field.
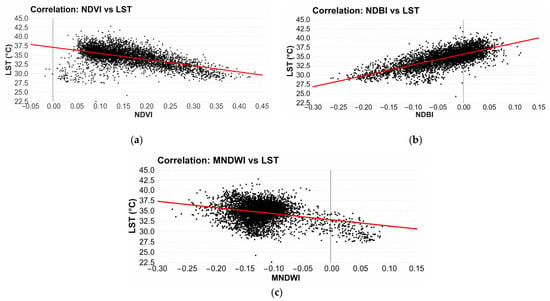
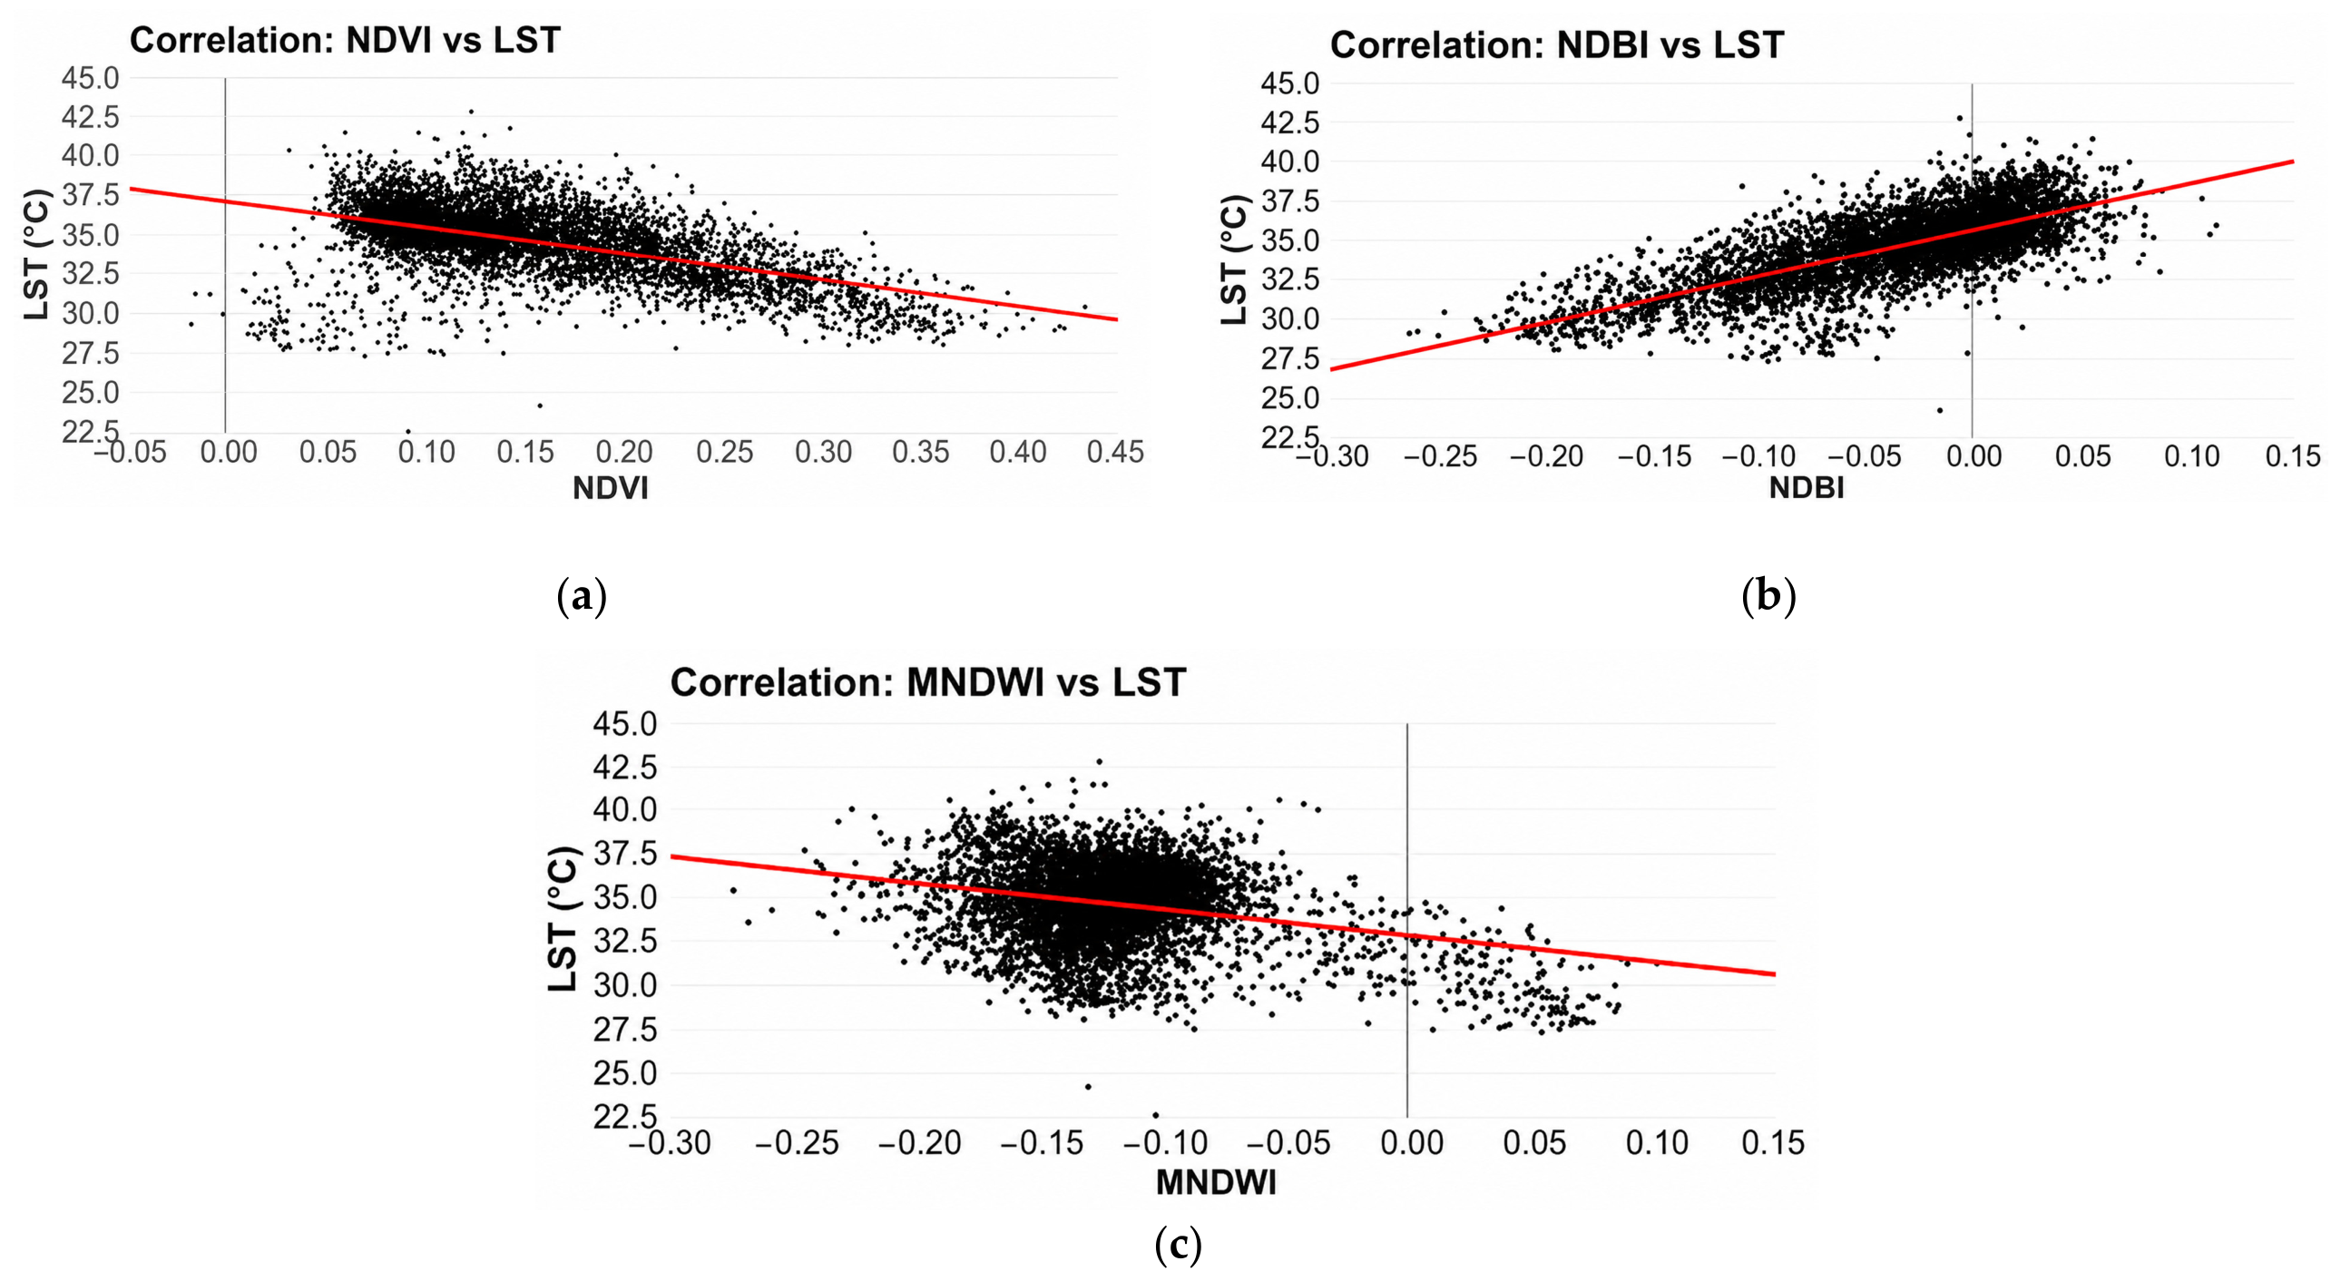
Figure 5b shows a positive relationship between NDBI and Landsat-derived LST, indicating that areas with greater built-up surface cover generally exhibited higher surface temperatures. These surfaces absorb significant solar radiation, leading to elevated temperatures in densely built areas. Conversely, NDVI (Figure 5a) shows a distinct negative correlation with LST, consistent with the cooling influence associated with greater vegetation cover. Areas with higher biomass facilitate evapotranspiration, which naturally lowers the surface temperature. Similarly, MNDWI (Figure 5c) displays a negative trend, highlighting the thermal buffering capacity of Dhaka’s water bodies. These relationships support the inclusion of the three indices as predictors in the random forest model.
Figure 5.
Scatter plots showing relationships between spectral indices and Landsat-derived LST at the 30 m spatial support: (a) NDVI and LST; (b) NDBI and LST; and (c) MNDWI and LST (Black dots denote observations, the red line represents the fitted regression, and the black vertical line indicates x = 0).
To define the relationship between the three spectral indices and baseline LST, a random forest regression model was developed. Instead of a single linear equation, the RF model used an ensemble of 300 decision trees to capture the non-linear interactions between land cover and temperature.
The RF model revealed relatively balanced variable importance across all three predictors: MNDWI (33.43%), NDVI (33.35%), and NDBI (33.22%). Although the differences are marginal, the near-equal importance suggests that all three indices contributed similarly to the RF model predictions in Dhaka’s dense urban landscape. This result may reflect multicollinearity between the indices or the broad land cover heterogeneity within the study area. Future studies should explore additional or alternative predictors to better differentiate variable contributions.
3.2. Output of Downscaled LST
The downscaling was achieved by applying the trained RF model to the 10 m resolution Sentinel-2 biophysical indices. Unlike multiple linear regression (MLR), which estimates fixed coefficients, the random forest model represents nonlinear relationships through an ensemble of decision trees.
where ΔLST represents the residual-correction term.
LST10m = RFmodel (NDVI10m, NDBI10m, MNDWI10m) + ∆LST10m
3.3. Spatial Distribution of Downscaled LST
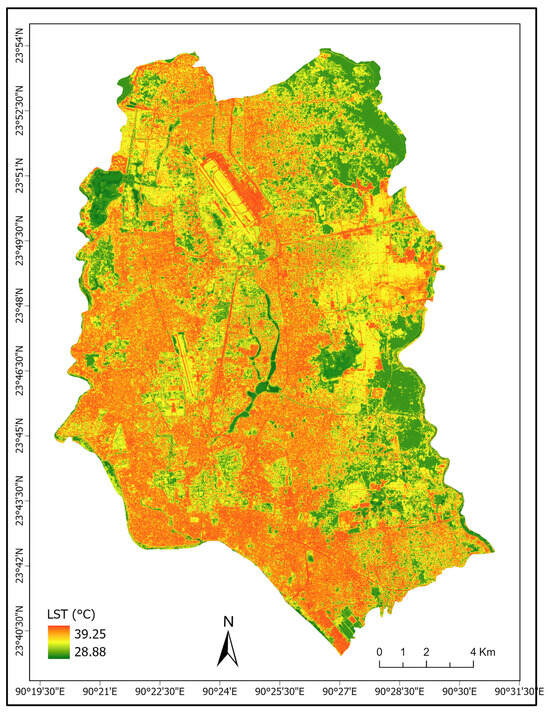
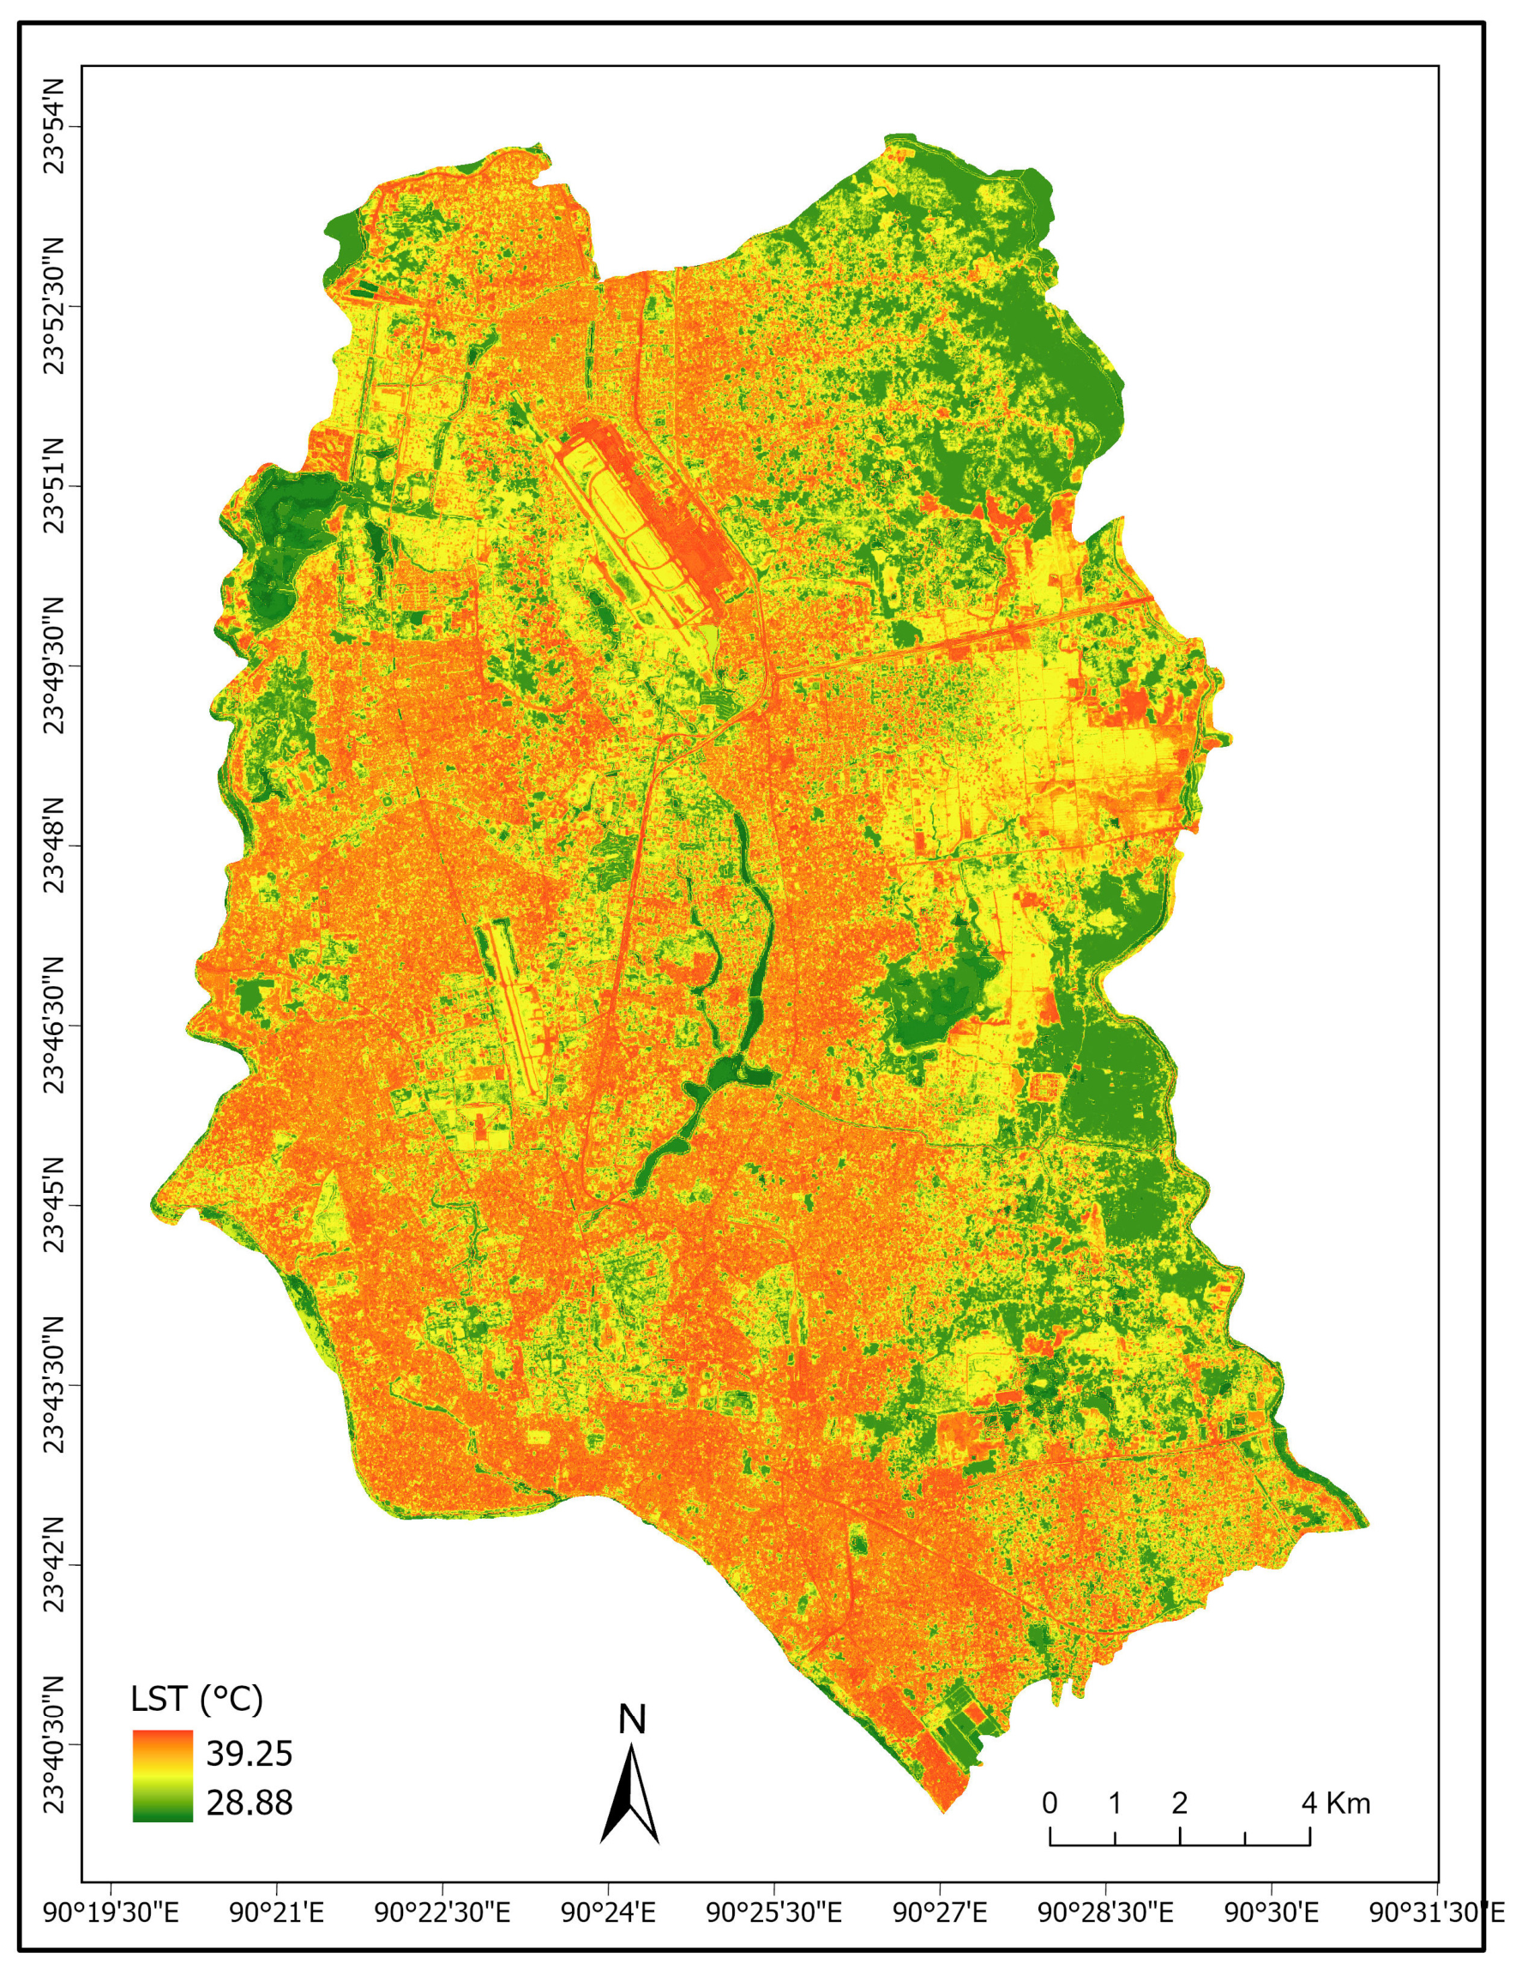
The final statistically downscaled LST estimate on the nominal 10 m grid is presented in Figure 6. The verified raster values ranged from 28.88 °C to 39.25 °C. These limits were obtained from the corrected model output after rerunning the complete processing workflow. The same range was applied consistently during statistical analysis, thermal zoning, and map preparation.
Figure 6.
Statistically downscaled LST estimate on a nominal 10 m grid for Dhaka City.
The final product represents a statistically downscaled LST estimate on a nominal 10 m grid. Fine-grid spatial variation was guided by Sentinel-2-derived NDVI, NDBI, and MNDWI, while the thermal magnitude remained constrained by the Landsat-derived LST and residual-correction field.
The spatial pattern of the downscaled estimate was consistent with the observed relationships between land-cover characteristics and Landsat-derived LST. The central and western industrial areas, including Tejgaon and Hazaribagh, were characterized by extensive built-up and impervious surfaces and exhibited comparatively high estimated LST values. The statistically downscaled estimate showed spatial patterns consistent with the observed relationships between LST and the biophysical indices. The nominal 10 m grid provides a more spatially detailed representation of estimated temperature variation among industrial blocks and adjacent land-cover types.
The downscaled estimate indicates relatively cooler areas associated with high NDVI and MNDWI values. Large green spaces such as the National Botanical Garden and water bodies such as Hatirjheel exhibited estimated LST values below the city average. By re-injecting the residuals into the final 10 m map, the downscaled estimate represented sharper spatial thermal gradients than the original 30 m Landsat product.
3.4. Model Performance and Spatial-Consistency Assessment
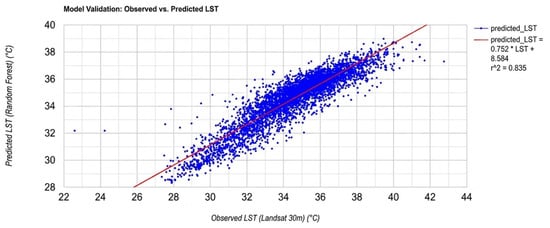
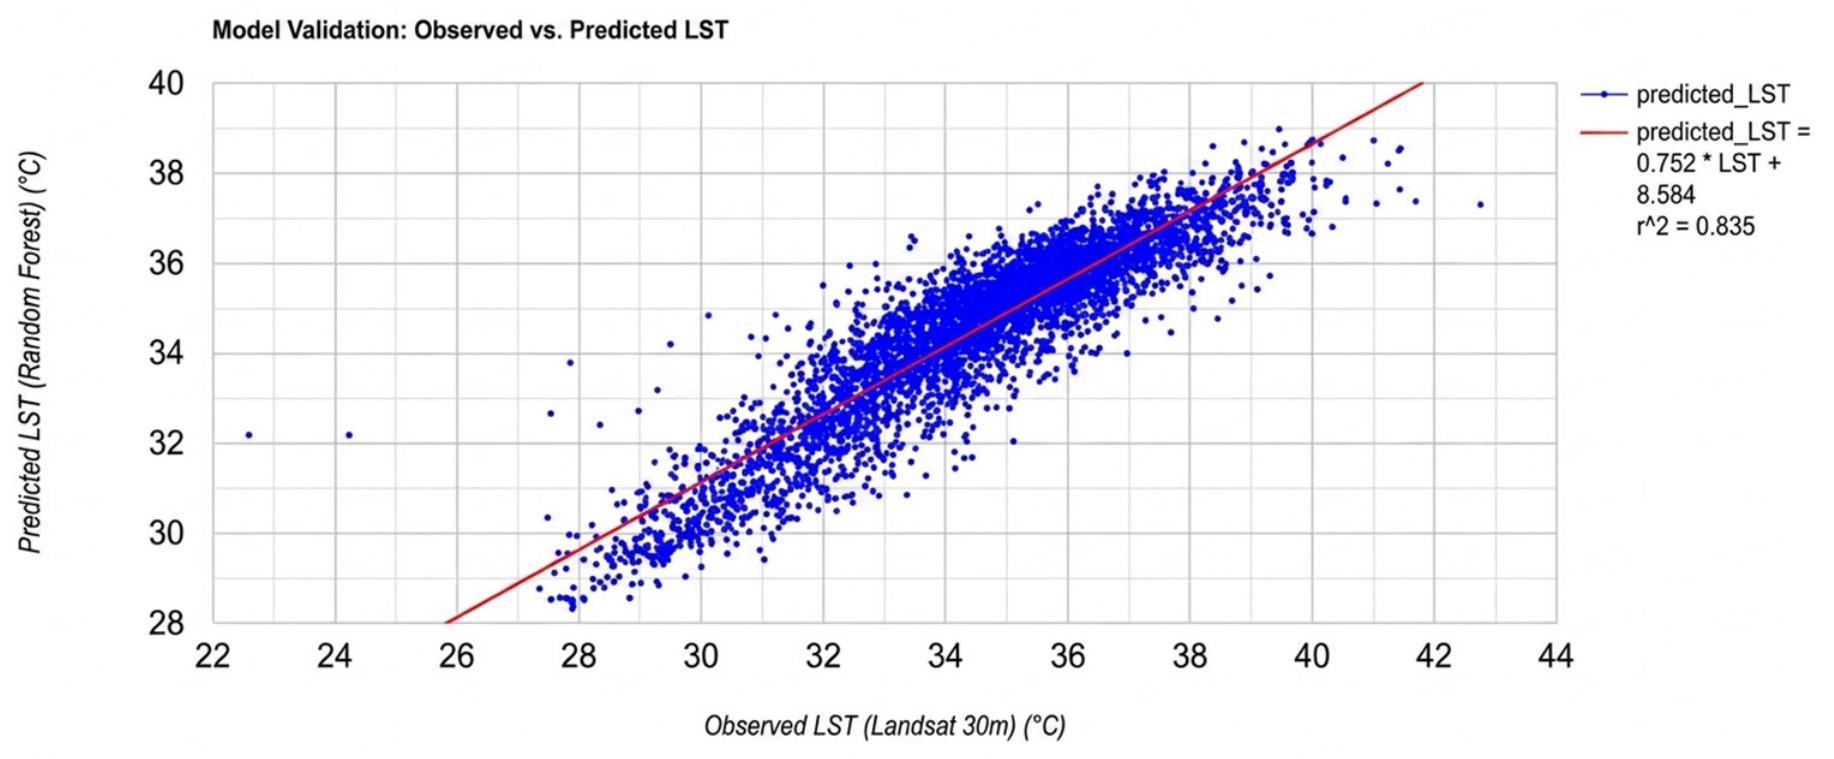
The fivefold spatial validation produced an overall RMSE of 0.96 °C between the RF-predicted and observed Landsat 8 LST values in the geographically withheld validation blocks (Figure 7). Figure 7 compares observed and RF-predicted LST values at the 30 m Landsat spatial support. This result indicates that the relationship between the three spectral predictors and Landsat-derived LST retained useful predictive capacity when applied to spatial areas excluded from the model training.
Figure 7.
Spatially blocked validation of the random forest model using geographically withheld Landsat 8 pixels.
The final nominal 10 m product was subsequently aggregated to the original 30 m Landsat grid to assess consistency with the source thermal pattern. The comparison produced an R2 value of 0.835, indicating that the aggregated downscaled product represented a substantial proportion of the spatial variation in the original Landsat LST. However, this comparison does not constitute independent validation because Landsat-derived LST contributed to model training and residual correction.
The RMSE therefore represents the spatially withheld predictive performance of the RF model at the Landsat spatial support, whereas the R2 value represents the coarse-scale consistency of the final downscaled product with the source Landsat thermal field. Neither metric independently confirms thermal accuracy at the level of individual 10 m pixels.
The validation results demonstrate useful predictive performance at the Landsat spatial support and satisfactory coarse-scale consistency after aggregation of the nominal 10 m product. Nevertheless, the evaluation does not establish independent thermal accuracy at 10 m. The fine-grid product should therefore be interpreted as a statistically downscaled representation of Landsat-derived thermal variation.
3.5. Urban Thermal Zoning
Using the statistically downscaled LST estimate on the nominal 10 m grid, the spatial heterogeneity of urban thermal conditions across Dhaka was further examined through a statistically robust classification framework. The delineation of thermal zones was performed using the mean–standard deviation (μ ± σ) method, which is widely adopted in urban climate studies to identify relative thermal anomalies and heat intensity patterns. This approach enables an objective classification based on the intrinsic distribution of temperature values rather than arbitrary thresholds. Similar methodologies have been applied in previous studies, including [36], where LST zones were defined based on statistical deviation from the mean to analyze urban heat island dynamics.
In this study, the mean LST (μ) of the downscaled dataset was calculated as 34.47 °C, while the standard deviation (σ) was 2.19 °C. Based on these statistical parameters, the LST values were categorized into five distinct UTZs, representing varying levels of thermal intensity. The classification scheme is presented in Table 3.
Table 3.
Urban thermal zone classification based on the mean–standard deviation method.
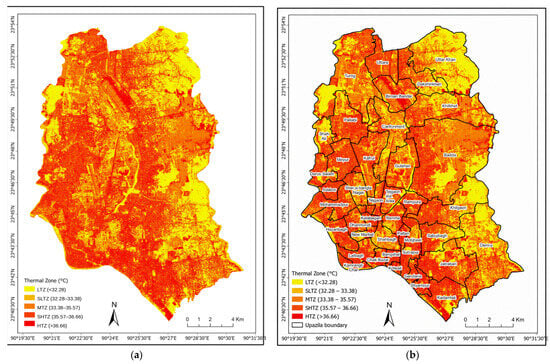
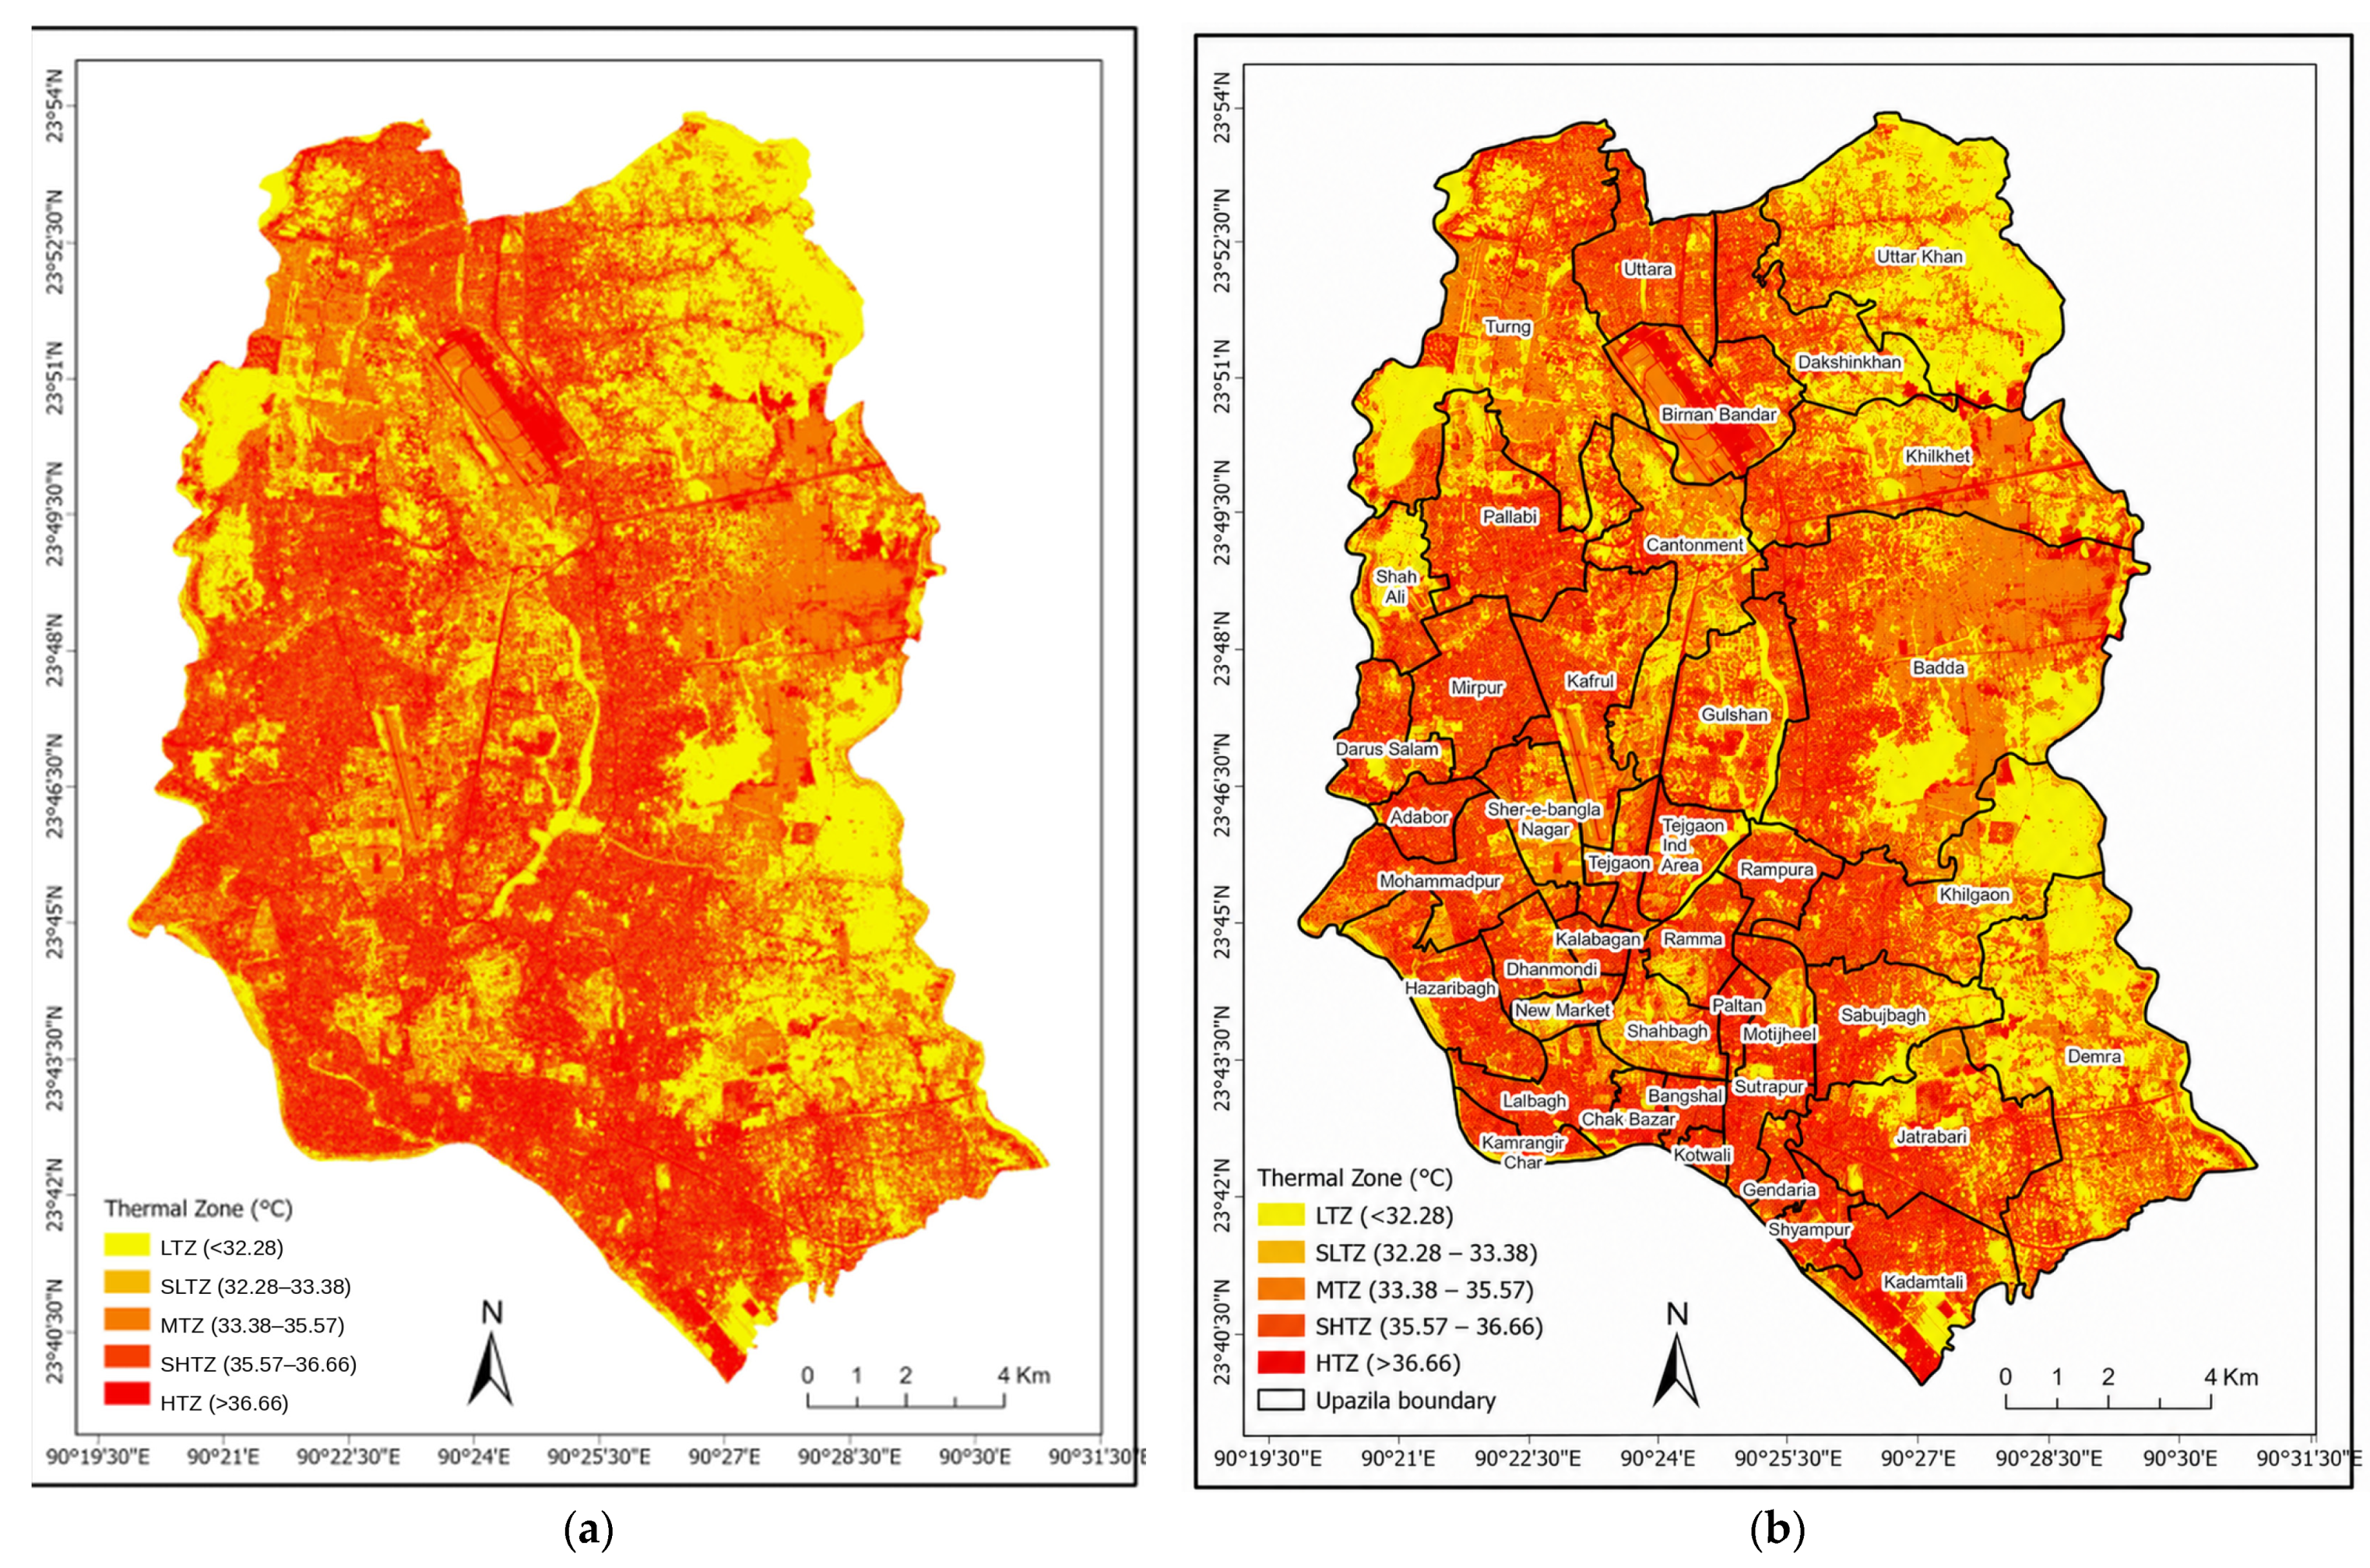
The spatial distribution of these thermal zones is illustrated in Figure 8a, while Figure 8b presents the classification overlaid with thana boundaries to facilitate localized spatial analysis.
Figure 8.
Urban Thermal Zone classification for Dhaka City using the mean–standard deviation (μ ± σ) method: (a) without thana boundaries and (b) with thana boundaries superimposed.
The results indicate a pronounced spatial variability in urban thermal conditions across the study area. The HTZ (>36.66 °C) is primarily concentrated in highly urbanized and industrialized areas. Notably, significant hotspots are observed in Kafrul, Mirpur, and Darus Salam, where dense built-up structures, impervious surfaces, and limited vegetation contribute to extreme thermal conditions. These areas represent the most critical heat-stressed zones within the city.
Surrounding these hotspots, the SHTZ (35.57–36.66 °C) are observed across parts of Biman Bandar and adjacent urban regions. These zones typically correspond to mixed land-use areas with moderate to high building density, where partial vegetation and open spaces provide limited thermal mitigation.
The MTZ (33.38–35.57 °C) dominates a large portion of the study area and is widely distributed across residential and commercial neighborhoods. Areas such as Gendaria and Jatrabari predominantly fall within this category, reflecting average thermal conditions influenced by a mix of built-up surfaces and intermittent vegetation.
In contrast, the SLTZ (32.28–33.38 °C) and LTZ (<32.28 °C) are primarily associated with relatively less dense urban areas and locations with higher vegetation or water presence. These cooler zones are notably found in parts of Sabujbagh, Kadamtali, and Shyampur, where green spaces, wetlands, and proximity to water bodies contribute to reduced surface temperatures. These areas function as important urban cooling zones, mitigating the overall thermal stress of the city.
The integration of thana boundaries (Figure 8b) further highlights the intra-urban variability of thermal conditions, demonstrating that heat intensity is not uniformly distributed but strongly influenced by land-use patterns and urban morphology. Thanas, dominated by dense built-up areas, exhibit a higher concentration of HTZ and SHTZ, whereas areas with more vegetation and open spaces are characterized by SLTZ and LTZ.
Overall, the mean–standard deviation-based classification effectively captures the relative thermal intensity across Dhaka’s urban landscape. By defining zones based on statistical deviation rather than fixed thresholds, the approach ensures adaptability to local climatic conditions and enhances the robustness of spatial heat assessment. The resulting thermal zonation provides a valuable framework for identifying priority areas for heat mitigation and supports targeted urban planning interventions aimed at improving thermal comfort and climate resilience.
4. Discussion
The results demonstrate the potential of the statistical downscaling approach to increase the spatial detail of the Landsat-derived thermal field over Dhaka. By integrating Landsat 8 thermal observations with finer-grid Sentinel-2 spectral predictors, the framework produced a statistically downscaled LST estimate on a nominal 10 m grid. The nominal grid size should not be interpreted as independently validated thermal resolution because individual fine-grid estimates remain statistically dependent on the coarser Landsat thermal observations and the assumptions of the downscaling model.
4.1. Interpretation of Downscaling Performance
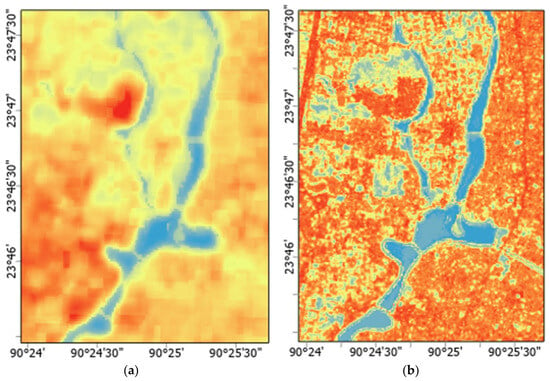
The results show that the proposed multi-sensor downscaling framework increased the spatial detail of the Landsat-derived thermal field by integrating Landsat 8 thermal observations with Sentinel-2-derived spectral indices (Figure 9). The resulting product is a statistically downscaled LST estimate on a nominal 10 m grid, in which fine-grid spatial variation is guided by Sentinel-2-derived predictors while the thermal information remains constrained by the Landsat-derived LST and residual-correction field. The Random Forest model combined with bicubic residual correction therefore provides a spatially refined representation of the source thermal pattern rather than a direct thermal measurement at 10 m resolution.
Figure 9.
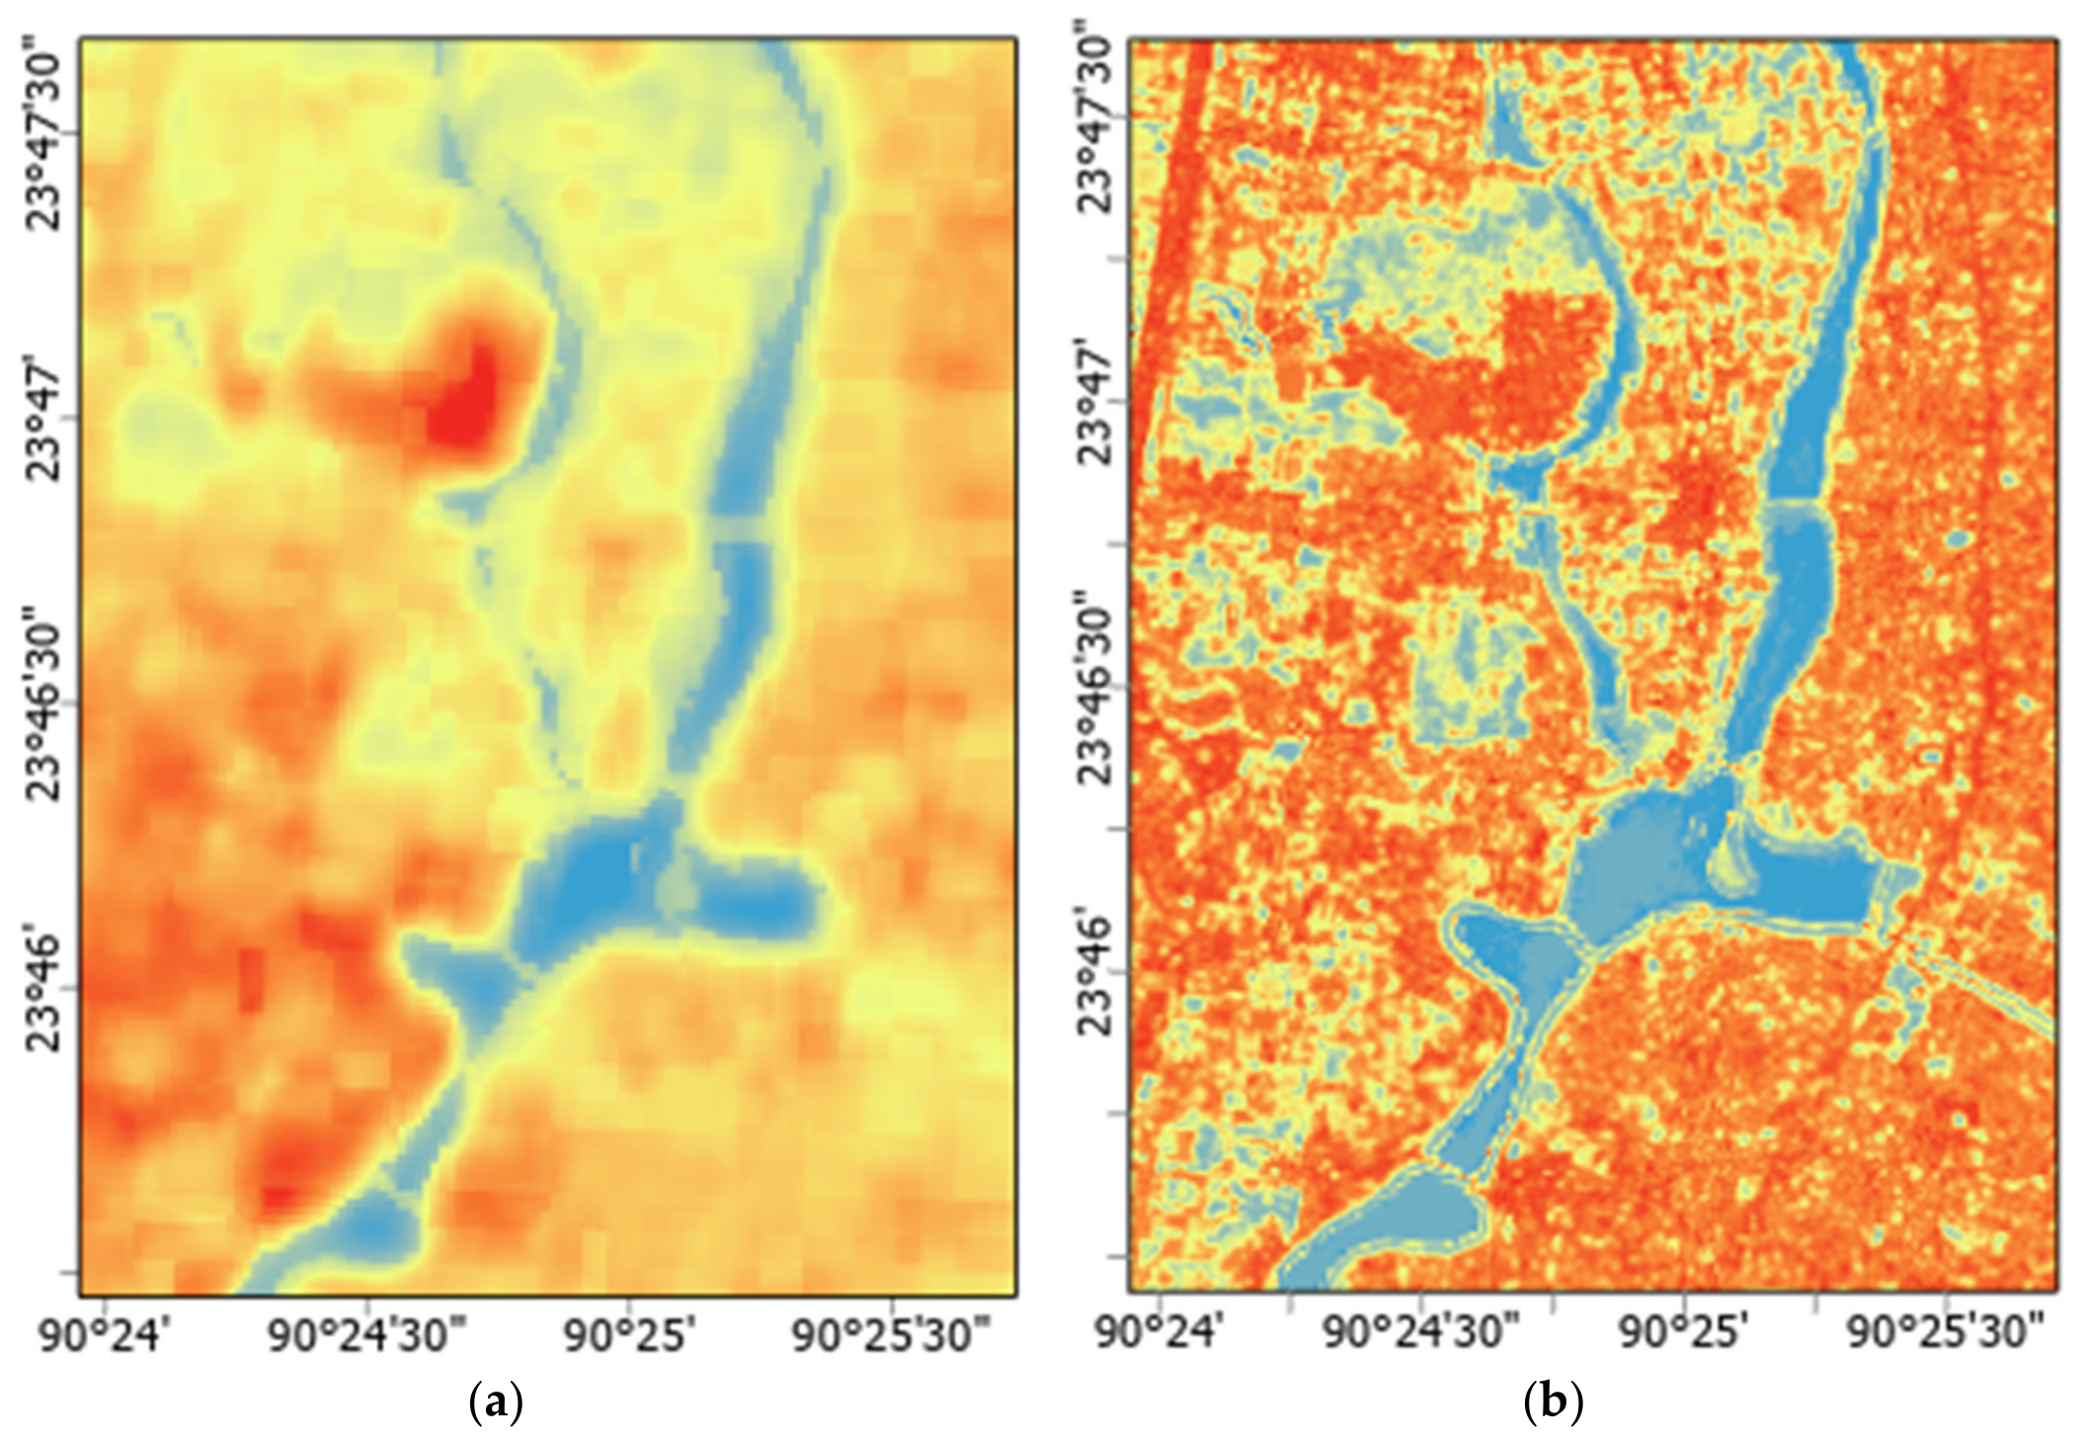
Comparison of (a) Landsat-derived LST at the 30 m spatial support and (b) the statistically downscaled LST estimate on a nominal 10 m grid (Cooler colors indicate relatively lower LST, whereas warmer colors indicate relatively higher LST).
Spatially blocked validation at the Landsat spatial support produced an RMSE of 0.96 °C, indicating useful predictive performance of the Random Forest relationship in geographically withheld areas. After aggregation of the final nominal 10 m estimate to the original 30 m Landsat grid, an R2 of 0.835 indicated substantial spatial consistency with the source Landsat thermal field. However, these metrics should not be interpreted as independent validation of thermal accuracy at the level of individual 10 m pixels. Similar regression- and machine learning-based downscaling studies have also reported comparable performance ranges for complex urban landscapes. For example, Onačillová K et al. [3] demonstrated the effectiveness of combining Sentinel-2 and Landsat imagery for generating higher-resolution urban LST products, while Tang K et al. [30] highlighted the capability of statistical and machine learning approaches in capturing spatial thermal heterogeneity in urban environments.
The spectral indices used in the model played a significant role in explaining the spatial variation in LST across the study area. NDVI exhibited a negative relationship with LST, reflecting the cooling effect of vegetation through evapotranspiration and shading. In contrast, NDBI showed a positive association with thermal intensity, indicating the heat-retaining characteristics of impervious and built-up surfaces. Similarly, MNDWI demonstrated the cooling influence of water bodies and wetlands within the urban landscape. These relationships confirm that land cover composition strongly influences urban thermal dynamics in Dhaka.
Although the downscaling process increased spatial detail, the estimate shown in Figure 9b should be interpreted as a statistically refined representation of Landsat-derived thermal variability rather than as a direct thermal measurement at 10 m resolution. Because the thermal information ultimately originates from Landsat observations, the fine-grid spatial pattern primarily reflects spatial redistribution guided by the higher-resolution Sentinel-2 predictors.
The spatially blocked assessment provides a more conservative evaluation than a random pixel-level split because geographically neighboring observations were retained within the same fold. The RMSE of 0.96 °C therefore represents model performance in spatial areas excluded from model training. In contrast, the R2 value of 0.835 obtained after aggregation of the final product to 30 m represents consistency with the original Landsat thermal field and not independent fine-resolution validation.
The absence of coincident fine-resolution thermal observations remains an important constraint. Although the results support the spatial transferability of the statistical relationship and the preservation of the broader Landsat thermal pattern, they do not verify the accuracy of individual pixels on the nominal 10 m grid.
4.2. Spatial Thermal Characteristics
The downscaled LST maps revealed considerable spatial heterogeneity in thermal conditions across Dhaka City. High-temperature zones were predominantly concentrated in densely urbanized and industrialized areas characterized by extensive impervious surfaces and limited vegetation cover. Areas such as Mirpur, Kafrul, and Darus Salam exhibited pronounced thermal intensity, indicating the strong influence of urban density and built-up concentration on surface heating.
The observed thermal patterns are closely linked to urban morphology and land-use characteristics. Highly compact urban structures with limited open spaces tend to absorb and retain heat more efficiently due to the thermal properties of construction materials such as concrete and asphalt. In addition, reduced airflow and limited evapotranspiration in dense built-up areas further intensify localized heating. These findings are consistent with previous urban heat island studies that identified impervious surface expansion as a major contributor to elevated urban temperatures.
In contrast, comparatively lower LST values were observed in areas containing vegetation, wetlands, and water bodies. Locations such as Sabujbagh, Kadamtali, and Shyampur exhibited relatively cooler thermal conditions due to the presence of green and blue infrastructure. Vegetation contributes to cooling through evapotranspiration and shading effects, while water bodies moderate surrounding temperatures by increasing latent heat exchange. The results therefore highlight the critical role of urban green spaces and wetlands in mitigating thermal stress within rapidly urbanizing environments such as Dhaka.
The mean–standard deviation-based urban thermal zoning further enhanced the interpretation of spatial thermal variability by identifying statistically significant thermal hotspots and cooling zones. The classification demonstrated that thermal intensity is not uniformly distributed across the city but varies substantially according to land cover composition, urban density, and environmental characteristics.
4.3. Planning Implications
The statistically downscaled LST estimate generated in this study provides spatially refined thermal information for climate-sensitive urban planning and heat mitigation strategies. The nominal 10 m grid provides a more spatially detailed basis for delineating relative thermal hotspots and cooler areas that may require immediate intervention. In rapidly urbanizing cities such as Dhaka, such spatially explicit thermal information can support evidence-based planning decisions and targeted climate adaptation measures.
The identified high-temperature zones indicate priority areas for implementing heat mitigation strategies such as urban greening, roadside plantation, cool roofs, reflective pavements, and preservation of urban wetlands. Expanding vegetation cover within densely built-up neighborhoods may substantially reduce localized thermal stress and improve environmental quality. Similarly, protecting existing water bodies and open spaces is important for maintaining natural cooling functions within the urban landscape.
The generated thermal maps may also contribute to broader urban climate resilience initiatives. Statistically downscaled thermal information can assist municipal authorities in identifying heat-sensitive communities, optimizing land-use planning, and integrating heat adaptation measures into future urban development policies. Furthermore, the proposed downscaling framework demonstrates the potential of freely available satellite imagery and cloud-based geospatial platforms for supporting thermal monitoring in data-scarce cities of the Global South.
4.4. Limitations
Despite the improved spatial resolution and satisfactory performance of the downscaling framework, several limitations should be acknowledged. First, the analysis relies on two-dimensional spectral indices and does not account for important urban factors such as building height, street geometry, and anthropogenic heat emissions, which also influence local thermal conditions. Therefore, the generated LST maps represent surface thermal patterns rather than the complete urban microclimatic environment.
Second, while the random forest model is capable of capturing nonlinear relationships, the model was trained using only three biophysical indices (NDVI, NDBI, and MNDWI). The exclusion of additional predictors such as albedo, emissivity, or sky view factor may limit the model’s ability to fully capture the complexity of urban thermal processes.
Third, the use of Sentinel-2 and Landsat 8 observations acquired six days apart remains a source of temporal uncertainty. Sentinel-2 was acquired on 6 March 2025 at 10:38:21 BST, whereas Landsat 8 was acquired on 12 March 2025 at 10:26:15 BST. Analysis of 3-hourly air-temperature observations obtained from the Bangladesh Meteorological Department (BMD) showed broadly comparable thermal conditions on the two acquisition dates. During the 10-day period from 4 to 13 March 2025, daily mean air temperature varied from 24.93 to 26.43 °C, while the daily means on 6 and 12 March were 25.39 °C and 25.75 °C, respectively. The two satellite observations were also acquired within approximately 12 min of the same local time of day, thereby limiting differences attributable solely to the diurnal temperature cycle. Nevertheless, station-measured air temperature is physically distinct from land surface temperature, and ground-based land-surface temperature observations were unavailable. Consequently, the BMD records support the meteorological comparability of the two acquisition dates but cannot exclude short-term changes in surface moisture, vegetation condition, irrigation, solar exposure, or other surface processes during the six-day interval. The temporal mismatch therefore remains an acknowledged source of uncertainty that is not fully represented by the reported model-performance statistics.
Fourth, the analysis was based on a single Landsat 8–Sentinel-2 image pair acquired during the dry season. Consequently, the temporal robustness, seasonal transferability, and interannual stability of the predictor–LST relationships were not evaluated. The findings should therefore be interpreted as evidence from the selected observation period rather than generalized automatically to other seasons or years.
Persistent cloud cover in tropical regions may limit the availability of suitable cloud-free imagery. In addition, although residual correction increased spatial detail, interpolation of the residual field may smooth some localized thermal extremes.
Independent fine-resolution thermal reference data were unavailable for the satellite acquisition period. Consequently, the accuracy of individual pixels in the nominal 10 m product could not be evaluated directly. Future research should incorporate coincident field radiometry, UAV thermal imagery, airborne thermal observations, or another suitable independent thermal dataset.
4.5. Future Research
Future research should evaluate additional ensemble and deep-learning approaches, including XGBoost, LightGBM, convolutional neural networks, and geographically weighted random forest models, to determine whether they improve the representation of spatial heterogeneity and nonlinear thermal relationships. Incorporating additional predictors and larger training datasets may further improve predictive accuracy.
Further studies should also integrate multi-temporal satellite imagery and ground-based meteorological observations to evaluate seasonal and long-term thermal variability. Expanding the framework to assess human thermal comfort, heat exposure, and socio-economic vulnerability would enhance its applicability for comprehensive urban climate resilience and heat risk management.
Future research should apply the workflow to a systematically selected multi-season and multi-year image archive. Such an assessment should use consistent cloud-screening criteria, comparable acquisition intervals, repeated spatial validation, and season-specific model calibration to determine whether the predictor–LST relationships remain stable through time.
Future applications should prioritize same-date or more closely matched multi-sensor observations to minimize temporal uncertainty in predictor–LST relationships. Where simultaneous cloud-free observations are unavailable, contemporaneous meteorological records should be incorporated systematically to assess the comparability of acquisition conditions. The present study demonstrates the usefulness of 3-hourly BMD air-temperature observations for evaluating short-term meteorological variability; however, future studies should, where available, incorporate additional variables such as precipitation, relative humidity, solar radiation, and surface-temperature measurements, together with multi-date sensitivity analysis, to more comprehensively quantify the influence of temporal mismatch on downscaled LST estimates.
5. Conclusions
This study combined Landsat 8 thermal observations with Sentinel-2-derived spectral indices to produce a statistically downscaled LST estimate on a nominal 10 m grid for Dhaka City. The random forest regression model combined with bicubic residual correction increased the spatial detail of the Landsat-derived thermal information while maintaining coarse-scale consistency with the source thermal field.
The estimated spatial patterns indicated that areas characterized by high impervious surface concentration and dense urban development exhibited elevated thermal intensity, whereas vegetation and water bodies played a significant role in reducing surface temperature. The mean–standard deviation-based urban thermal zonation further improved the interpretation of spatial heat patterns by identifying relative thermal hotspots and cooling zones across different thanas of Dhaka.
Overall, the study highlights the potential of integrating freely available satellite datasets and cloud-based geospatial platforms for detailed urban thermal assessment in data-scarce cities. The statistically downscaled LST map may support exploratory urban thermal assessment and the identification of areas for further heat-mitigation investigation. The six-day difference between the Sentinel-2 and Landsat 8 acquisitions remains a source of uncertainty, as the BMD observations indicated approximately 1–2 °C variation in air temperature during the surrounding period. Such short-term meteorological variability may have affected the predictor–LST relationship, although it cannot be interpreted directly as an equivalent error in satellite-derived LST. Future research should incorporate multi-temporal analysis, ground-based observations, and advanced machine learning approaches to further improve the accuracy and applicability of urban thermal mapping.
Author Contributions
Conceptualization, M.M.R.; methodology, M.M.R.; software, M.M.R., J.F.R., M.A.I. and M.K.; validation, M.M.R.; formal analysis, M.M.R., M.K. and J.F.R.; investigation, M.M.R.; resources, M.A.I., M.K. and J.F.R.; data curation, M.M.R., M.A.I. and J.F.R.; writing—original draft preparation, M.M.R., M.K. and J.F.R.; writing—review and editing, M.K. and G.S.; visualization, M.M.R.; supervision, G.S.; project administration, M.M.R. All authors have read and agreed to the published version of the manuscript.
Funding
This research was funded by Rajshahi University of Engineering & Technology (RUET), grant number DRE/8/RUET/764/(52)/pro/2025-2026/09.
Data Availability Statement
The Sentinel-2 and Landsat 8 datasets used in this study are publicly available through the Google Earth Engine platform from the Copernicus/European Space Agency and United States Geological Survey data archives. However, the processed datasets are openly available in Mendeley Data at https://data.mendeley.com/datasets/wf6dfy2jcf/1 (accessed on 1 September 2026). The 3-hourly air-temperature observations for Dhaka used to assess meteorological conditions during the satellite acquisition period were obtained from the Bangladesh Meteorological Department (BMD). These meteorological data may be obtained from the corresponding author subject to the applicable data-sharing conditions of BMD.
Acknowledgments
We gratefully acknowledge the European Space Agency (ESA) and the United States Geological Survey (USGS) for providing free access to Sentinel-2 MSI and Landsat 8 imagery, respectively. We also sincerely acknowledge the Bangladesh Meteorological Department (BMD) for providing the 3-hourly air-temperature observations for Dhaka used to assess meteorological conditions surrounding the satellite acquisition dates. The satellite data processing and analysis were conducted using the Google Earth Engine (GEE) cloud-computing platform.
Conflicts of Interest
The authors declare no conflicts of interest.
Abbreviations
The following abbreviations are used in this manuscript:
| ASTER | Advanced Spaceborne Thermal Emission and Reflection Radiometer |
| AVHRR | Advanced Very High Resolution Radiometer |
| BMD | Bangladesh Meteorological Department |
| BST | Bangladesh Standard Time |
| DN | Digital Number |
| ECV | Essential Climate Variable |
| ESA | European Space Agency |
| GEE | Google Earth Engine |
| HTZ | High Temperature Zone |
| LTZ | Low Temperature Zone |
| LST | Land Surface Temperature |
| ML | Machine Learning |
| MLR | Multiple Linear Regression |
| MNDWI | Modified Normalized Difference Water Index |
| MODIS | Moderate Resolution Imaging Spectroradiometer |
| MTZ | Medium Temperature Zone |
| MSI | Multispectral Instrument |
| NDBI | Normalized Difference Built-up Index |
| NDVI | Normalized Difference Vegetation Index |
| OLI | Operational Land Imager |
| PMW | Passive Microwave |
| RF | Random Forest |
| RMSE | Root Mean Square Error |
| SEB | Surface Energy Balance |
| SHTZ | Secondary High Temperature Zone |
| SLTZ | Secondary Low Temperature Zone |
| ST_B10 | Surface Temperature Band 10 |
| SUHII | Surface Urban Heat Island Intensity |
| TIR | Thermal Infrared |
| TIRS | Thermal Infrared Sensor |
| UAV | Unmanned Aerial Vehicle |
| UHI | Urban Heat Island |
| USGS | United States Geological Survey |
| UTM | Universal Transverse Mercator |
| UTZs | Urban Thermal Zones |
| WGS | World Geodetic System |
References
- Liu, J.; Hagan, D.; Liu, Y. Global Land Surface Temperature Change (2003–2017) and Its Relationship with Climate Drivers: AIRS, MODIS, and ERA5-Land Based Analysis. Remote Sens. 2021, 13, 44. [Google Scholar] [CrossRef] [Scilit]
- Orusa, T.; Borgogno Mondino, E. Landsat 8 thermal data to support urban management and planning in the climate change era: A case study in Torino area, NW Italy. In Remote Sensing Technologies and Applications in Urban Environments IV; Proceedings of SPIE Volume 11157; SPIE: Bellingham, WA, USA, 2019; 111570O. [Google Scholar] [CrossRef] [Scilit]
- Onačillová, K.; Gallay, M.; Paluba, D.; Péliová, A.; Tokarčík, O.; Laubertová, D. Combining Landsat 8 and Sentinel-2 Data in Google Earth Engine to Derive Higher Resolution Land Surface Temperature Maps in Urban Environment. Remote Sens. 2022, 14, 4076. [Google Scholar] [CrossRef] [Scilit]
- Reiners, P.; Sobrino, J.; Kuenzer, C. Satellite-Derived Land Surface Temperature Dynamics in the Context of Global Change—A Review. Remote Sens. 2023, 15, 1857. [Google Scholar] [CrossRef] [Scilit]
- Mildrexler, D.; Zhao, M.; Cohen, W.; Running, S.; Song, X.; Jones, M. Thermal Anomalies Detect Critical Global Land Surface Changes. J. Appl. Meteorol. Climatol. 2017, 57, 391–411. [Google Scholar] [CrossRef] [Scilit]
- Jain, M. Two decades of nighttime surface urban heat island intensity analysis over nine major populated cities of India and implications for heat stress. Front. Sustain. Cities 2023, 5, 1084573. [Google Scholar] [CrossRef] [Scilit]
- Raj, S.; Paul, S.; Chakraborty, A.; Kuttippurath, J. Anthropogenic forcing exacerbating the urban heat islands in India. J. Environ. Manag. 2020, 257, 110006. [Google Scholar] [CrossRef] [Scilit] [PubMed]
- Nayak, S.; Vinod, A.; Prasad, A. Spatial Characteristics and Temporal Trend of Urban Heat Island Effect over Major Cities in India Using Long-Term Space-Based MODIS Land Surface Temperature Observations (2000–2023). Appl. Sci. 2023, 13, 13323. [Google Scholar] [CrossRef] [Scilit]
- Khan, M.; Ullah, S.; Sun, T.; Rehman, A.; Chen, L. Land-Use/Land-Cover Changes and Its Contribution to Urban Heat Island: A Case Study of Islamabad, Pakistan. Sustainability 2020, 12, 3861. [Google Scholar] [CrossRef] [Scilit]
- Imran, H.; Hossain, A.; Islam, A.; Rahman, A.; Bhuiyan, M.; Paul, S.; Alam, A. Impact of Land Cover Changes on Land Surface Temperature and Human Thermal Comfort in Dhaka City of Bangladesh. Earth Syst. Environ. 2021, 5, 667–693. [Google Scholar] [CrossRef] [Scilit]
- Chen, H.; Deng, Q.; Zhou, Z.; Ren, Z.; Shan, X. Influence of land cover change on spatio-temporal distribution of urban heat island—A case in Wuhan mean urban area. Sustain. Cities Soc. 2022, 79, 103715. [Google Scholar] [CrossRef] [Scilit]
- Filho, W.; Icaza, L.; Neht, A.; Kļaviņš, M.; Morgan, E. Coping with the impacts of urban heat islands. A literature based study on understanding urban heat vulnerability and the need for resilience in cities in a global climate change context. J. Clean. Prod. 2018, 171, 1140–1149. [Google Scholar] [CrossRef] [Scilit]
- Huang, W.; Masselot, P.; Bou-Zeid, E.; Fatichi, S.; Paschalis, A.; Sun, T.; Gasparrini, A.; Manoli, G. Economic valuation of temperature-related mortality attributed to urban heat islands in European cities. Nat. Commun. 2023, 14, 7438. [Google Scholar] [CrossRef] [Scilit] [PubMed]
- Gonzalez-Trevizo, M.; Martinez-Torres, K.; Armendariz-Lopez, J.; Santamouris, M.; Bojórquez-Morales, G.; Leon, A. Research trends on environmental, energy and vulnerability impacts of Urban Heat Islands: An overview. Energy Build. 2021, 248, 111051. [Google Scholar] [CrossRef] [Scilit]
- Fan, Y.; Wang, Z.; Li, Y.; Wang, K.; Sun, Z.; Ge, J. Urban heat island reduces annual building energy consumption and temperature related mortality in severe cold region of China. Urban Clim. 2022, 45, 101262. [Google Scholar] [CrossRef] [Scilit]
- Cao, J.; Zhou, W.; Zheng, Z.; Ren, T.; Wang, W. Within-city spatial and temporal heterogeneity of air temperature and its relationship with land surface temperature. Landsc. Urban Plan. 2021, 206, 103979. [Google Scholar] [CrossRef] [Scilit]
- Hassani, A.; Santos, G.; Schneider, P.; Castell, N. Interpolation, Satellite-Based Machine Learning, or Meteorological Simulation? A Comparison Analysis for Spatio-temporal Mapping of Mesoscale Urban Air Temperature. Environ. Model. Assess. 2023, 29, 291–306. [Google Scholar] [CrossRef] [Scilit]
- Wen, Z.; Zhuo, L.; Wang, Q.; Wang, J.; Liu, Y.; Du, S.; Abdelhalim, A.; Han, D. Data Fusion for Estimating High-Resolution Urban Heatwave Air Temperature. Remote Sens. 2023, 15, 3921. [Google Scholar] [CrossRef] [Scilit]
- Zhao, S.; Liu, M.; Tao, M.; Zhou, W.; Lu, X.; Xiong, Y.; Li, F.; Wang, Q. The role of satellite remote sensing in mitigating and adapting to global climate change. Sci. Total Environ. 2023, 904, 166820. [Google Scholar] [CrossRef] [Scilit] [PubMed]
- Yang, J.; Gong, P.; Fu, R.; Zhang, M.; Chen, J.; Liang, S.; Xu, B.; Shi, J.; Dickinson, R. The role of satellite remote sensing in climate change studies. Nat. Clim. Change 2013, 3, 875–883. [Google Scholar] [CrossRef] [Scilit]
- Guo, H.; Zhang, L.; Zhu, L. Earth observation big data for climate change research. Adv. Clim. Change Res. 2015, 6, 108–117. [Google Scholar] [CrossRef] [Scilit]
- Li, Z.; Wu, H.; Duan, S.; Zhao, W.; Ren, H.; Liu, X.; Leng, P.; Tang, R.; Ye, X.; Zhu, J.; et al. Satellite Remote Sensing of Global Land Surface Temperature: Definition, Methods, Products, and Applications. Rev. Geophys. 2022, 61, e2022RG000777. [Google Scholar] [CrossRef] [Scilit]
- Li, Z.; Tang, B.; Wu, H.; Ren, H.; Yan, G.; Wan, Z.; Trigo, I.; Sobrino, J. Satellite-derived land surface temperature: Current status and perspectives. Remote Sens. Environ. 2013, 131, 14–37. [Google Scholar] [CrossRef] [Scilit]
- Ahmed, M.; Ghaderpour, E.; Gupta, A.; Dewan, A.; Hassan, Q. Opportunities and Challenges of Spaceborne Sensors in Delineating Land Surface Temperature Trends: A Review. IEEE Sens. J. 2023, 23, 6460–6472. [Google Scholar] [CrossRef] [Scilit]
- Phan, T.; Kappas, M. Application of MODIS land surface temperature data: A systematic literature review and analysis. J. Appl. Remote Sens. 2018, 12, 041501. [Google Scholar] [CrossRef] [Scilit]
- Zahrae, R.; Safae, A.; Mohammed, L.; Naoufal, R. A Literature Systematic Review of Thermal Infrared Remote Sensing Satellites Land Surface Temperature. In Proceedings of the 2022 IEEE International Geoscience and Remote Sensing Symposium (IGARSS), Kuala Lumpur, Malaysia, 17–22 July 2022; pp. 6368–6371. [Google Scholar]
- Andriambololonaharisoamalala, R.; Helmholz, P.; Bulatov, D.; Ivánová, I.; Song, Y.; Soon, S.; Jones, E. Downscaling of Urban Land Surface Temperatures Using Geospatial Machine Learning with Landsat 8/9 and Sentinel-2 Imagery. Remote Sens. 2025, 17, 2392. [Google Scholar] [CrossRef] [Scilit]
- Roy, D.; Das, B.; Singh, P.; Santra, P.; Deb, S.; Bhattacharya, B.; Govind, A.; Jatav, R.; Sethi, D.; Ghosh, T.; et al. Assessing the accuracy of multi-model approaches for downscaling land surface temperature across diverse agroclimatic zones. Sci. Rep. 2025, 15, 2345. [Google Scholar] [CrossRef] [Scilit] [PubMed]
- Liang, M.; Zhang, L.; Wu, S.; Zhu, Y.; Dai, Z.; Wang, Y.; Qi, J.; Chen, Y.; Du, Z. A High-Resolution Land Surface Temperature Downscaling Method Based on Geographically Weighted Neural Network Regression. Remote Sens. 2023, 15, 1740. [Google Scholar] [CrossRef] [Scilit]
- Tang, K.; Zhu, H.; Ni, P. Spatial Downscaling of Land Surface Temperature over Heterogeneous Regions Using Random Forest Regression Considering Spatial Features. Remote Sens. 2021, 13, 3645. [Google Scholar] [CrossRef] [Scilit]
- Cotlier, G.; Skokovic, D.; Jiménez, J.; Sobrino, J. Thermal Multi-Sensor Assessment of the Spatial Sampling Behavior of Urban Landscapes Using 2D Turbulence Indicators. Remote Sens. 2025, 17, 2349. [Google Scholar] [CrossRef] [Scilit]
- Firozjaei, M.K.; Mijani, N.; Kiavarz, M.; Duan, S.B.; Atkinson, P.M.; Alavipanah, S.K. A novel surface energy balance-based approach to land surface temperature downscaling. Remote Sens. Environ. 2024, 305, 114087. [Google Scholar] [CrossRef] [Scilit]
- Pu, R. Assessing scaling effect in downscaling land surface temperature in a heterogenous urban environment. Int. J. Appl. Earth Obs. Geoinf. 2021, 96, 102256. [Google Scholar] [CrossRef] [Scilit]
- Guzinski, R.; Nieto, H.; Sandholt, I.; Karamitilios, G. Modelling High-Resolution Actual Evapotranspiration through Sentinel-2 and Sentinel-3 Data Fusion. Remote Sens. 2020, 12, 1433. [Google Scholar] [CrossRef] [Scilit]
- Ratu, J.F.; Attoza, A.; Ahmed, K.T. A GIS-Based Approach to Integrate Urban Open Space for Managing Urban Environment. In Proceedings of the International Conference on Planning, Architecture & Civil Engineering, Rajshahi, Bangladesh, 9–11 September 2021; pp. 62–67. [Google Scholar]
- Qi, Y.; Li, H.; Pang, Z.; Gao, W.; Liu, C. A Case Study of the Relationship Between Vegetation Coverage and Urban Heat Island in a Coastal City by Applying Digital Twins. Front. Plant Sci. 2022, 13, 861768. [Google Scholar] [CrossRef] [Scilit] [PubMed]

Disclaimer/Publisher’s Note: The statements, opinions and data contained in all publications are solely those of the individual author(s) and contributor(s) and not of MDPI and/or the editor(s). MDPI and/or the editor(s) disclaim responsibility for any injury to people or property resulting from any ideas, methods, instructions or products referred to in the content. |
© 2026 by the authors. Licensee MDPI, Basel, Switzerland. This article is an open access article distributed under the terms and conditions of the Creative Commons Attribution (CC BY) license.