


Abstract
Kalanchoe delagoensis is a Crassulacean acid metabolism (CAM) succulent plant native to Madagascar that has spread as an aggressive invader across subtropical and Mediterranean regions. Research on this species has focused almost entirely on its cardiotoxic bufadienolides, leaving its phenolic fraction largely unexplored. Here, we profiled the phenolics of dried K. delagoensis leaves by reversed-phase liquid chromatography coupled with UV-Vis detection and electrospray ionisation high-resolution mass spectrometry (RPLC-ESI-HRMS). Two flavonoid diglycosides produced the most intense signals and were tentatively annotated by MS/MS analyses as quercetin and kaempferol deoxyhexoside-pentosides; the former shares the formula and fragmentation of quercetin 3-O-arabinopyranosyl-rhamnopyranoside (QAR), the chemical marker of the congeneric K. pinnata. The remaining MS/MS supported features form a single combinatorial family of flavonol glycosides on kaempferol, quercetin, and myricetin cores decorated with pentose, deoxyhexose, hexose, and hexuronic-acid units. Minor flavonol glycosides and mono- and digalloyl hexoses were also detected, and a malvidin-hexoside was putatively identified as a candidate contributor to the reddish leaf tint of the more sun-exposed leaves, supported by its absorption maximum at 520 nm and characteristic MS/MS spectrum. Folin-reactive compounds reached 47.0 ± 0.8 mg gallic acid equivalents per gram of dry leaf. These results extend the chemistry of K. delagoensis well beyond its bufadienolides, within the limits of a single clonal genotype and a single harvest.
1. Introduction
Phenolic compounds are among the most chemically diverse secondary metabolites in plants. They mediate defence against pathogens, screen UV radiation, manage oxidative stress, and contribute to pigmentation and pollinator signalling. The same antioxidant, anti-inflammatory, and antimicrobial properties that serve the plant have made phenolics attractive ingredients for the pharmaceutical, nutraceutical, and cosmetic sectors [1].
Belonging to the Crassulaceae family, the Kalanchoe genus encompasses almost 200 succulent plants native primarily to Madagascar, subtropical Africa, and parts of Asia [2]. These plants are characterised by Crassulacean acid metabolism (CAM), an evolutionary carbon-fixation pathway where nocturnal CO2 assimilation minimises daytime transpirational water loss [3,4]. Such physiological adaptation grants these species remarkable drought resistance, driving their ecological success across arid zones.
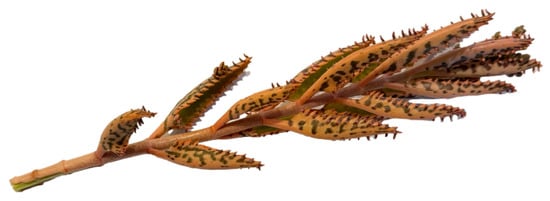
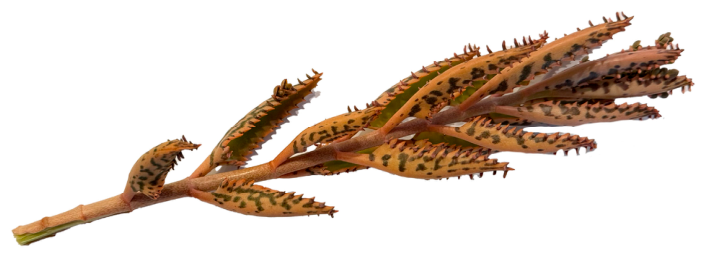
Many Kalanchoe species hold a firm place in the ethnobotany of Africa, Asia, and South America, where leaf preparations treat inflammation, skin complaints, and pain [5]. These uses rest on a broad chemical repertoire of bufadienolides, flavonoids, phenolic acids, and terpenoids [6]. The metabolite profile of K. pinnata, K. crenata, and K. daigremontiana is reasonably well mapped, with quercetin and kaempferol glycosides, gallic acid, and caffeic acid recurring as the main phenolics [7,8,9]. Bufadienolides, however, have absorbed most of the analytical effort because of their marked pharmacological and toxicological activity [10], leaving the phenolic side of the genus comparatively thin. Kalanchoe delagoensis (Figure 1) is a monocarpic succulent plant from the arid south of Madagascar.
Figure 1.
Kalanchoe delagoensis specimen sampled in Bari (Apulia, Italy), showing the diagnostic terete grey-green leaves with reddish-brown spotting and the epiphyllous plantlets (bulbils) borne at the leaf apices.
Driven by a highly prolific clonal propagation mechanism based on epiphyllous bulbils produced at the leaf tips, this species has rapidly naturalised as an aggressive invader in warm-temperate and subtropical regions, including southern Africa, eastern Australia, and the Mediterranean basin [11]. In addition to bufadienolides, phenolic constituents have also been investigated: da Silva et al. isolated corniculatusin 3-O-glucoside (8-methoxyquercetin 3-O-glucoside), kaempferol 3-O-glucoside, quercetin 3-O-glucuronide, and gallic acid from the flowers [12], whereas an HPLC-DAD survey based on commercial standards reported five phenolic acids and seven flavonoids in leaf extracts, including kaempferol and quercetin aglycones together with kaempferol-7-O-rhamnoside, trifolin, robinin, isoquercitrin, and quercitrin [13]. The spatial distribution of leaf flavonoids and phenolic acids has also been mapped histochemically [7]. The species has also been profiled extensively in vitro under its Bryophyllum synonyms: García-Pérez et al. reported myricetin and malvidin glycosides as the major phenolics of micropropagated B. tubiflorum [14,15], on cultured rather than field-grown leaves.
Reversed-phase liquid chromatography coupled with high-resolution mass spectrometry (RPLC-HRMS) is the method of choice when the target compounds are not available as standards, as is the case for most plant glycosides. An Orbitrap analyser provides high mass accuracy and resolution which, together with MS/MS data, allow the molecular formula to be established and the phenolic core to be hypothesised [1,16], with acquisition in both ion polarities providing further corroboration. On this basis, identifications are graded throughout on the five-level confidence scale of Schymanski et al. [17], and the level reached is stated for each one. Furthermore, for untargeted analysis, the mass defect, that is, the gap between the accurate mass and the nominal integer mass, is a useful aid, since it stays low for polyphenols and therefore serves as a class-level filter [18]. Indeed, this parameter is fundamentally governed by the specific H/C and O/C atomic ratios of the molecular structure. Consequently, this stoichiometric relationship can be directly exploited through a Van Krevelen diagram to refine the raw dataset, providing a non-specific, formula-based prioritisation window that enriches the candidate list in oxygen-rich aromatic formulas before manual evaluation [19]. Two considerations make the phenolic chemistry of this species worth resolving. First, the genus is a pharmacobotanical resource. The flavonol glycoside quercetin 3-O-arabinopyranosyl-rhamnopyranoside (QAR) is the principal anti-inflammatory constituent of K. pinnata and serves as its chemical marker [5,20], so establishing whether the same scaffold occurs in K. delagoensis bears directly on the chemotaxonomy of the clade and on the bioactivity that its extracts might carry [21,22]. Second, K. delagoensis is a problematic invader whose biomass is otherwise treated as a nuisance; characterising its flavonol content is a first step towards asking whether that biomass has any value beyond disposal, in line with current interest in valorising the phenolic fraction of invasive and underused plant material [23,24]. Any interest of this kind must be set against the chemistry of the genus. Bufadienolides have been reported in K. delagoensis itself, including bryophyllins A and B from the aerial parts and the bryotoxins from the flower heads, while kalantubosides and kalantubolides have been obtained from ethanolic extracts of the whole plant [25], and the species is among those documented as a cause of cardiac glycoside poisoning in grazing livestock [26]. Their content varies considerably between plant organs, and the phenolic composition of the leaves is therefore only part of what a leaf extract would contain, since a hydroethanolic extraction of the kind used here may also recover them.
What is available for naturally grown K. delagoensis remains either targeted or indirect. One study isolated individual constituents from the flowers [12], another screened leaf extracts by HPLC-DAD against a panel of commercial standards [13], and a third mapped the spatial distribution of leaf flavonoids and phenolic acids histochemically [7]; the only untargeted data reported for the species were obtained from in vitro cultured material [14,15]. An untargeted high-resolution tandem-MS characterisation of naturally grown leaves is therefore the missing piece, able to reveal constituents for which no standard exists and to describe this invasive plant on the same matrix as its better studied congeners, particularly for the naturalised Mediterranean stands where it is an aggressive invader.
This study set out to (i) resolve the leaf phenolic fraction of K. delagoensis at the MS/MS level by RPLC-ESI-HRMS in both ion polarities, (ii) organise the detected flavonol glycosides into a coherent structural family and assess whether a QAR-compatible composition occurs, (iii) estimate the Folin-reactive fraction of the leaf material and compare its recovery across solvents, and (iv) place the phenolic chemistry of this invasive species in the context of the genus.
2. Materials and Methods
2.1. Chemicals and Reagents
Water (H2O), acetonitrile (ACN), methanol (MeOH), formic acid, ethanol (EtOH), gallic acid, sodium carbonate, and the Folin–Ciocalteu reagent were from Merck (Milan, Italy). Solvents were LC-MS-grade.
2.2. Plant Material and Sample Preparation
Leaves of K. delagoensis Ecklon & Zeyher were collected by G.V. in February 2026 from three outdoor-grown plants growing in a private garden near the Giardino Raffaele De Bellis, Viale Unità d’Italia, Bari, Apulia, southern Italy. The three plants had arisen by clonal propagation from epiphyllous bulbils and were growing together, and they are therefore three individuals of a single genotype. Taxonomic identification was based on diagnostic morphological characters, including erect, terete grey-green leaves with reddish-brown spotting, 25–80 mm long and 3–5 mm in diameter, and the presence of epiphyllous plantlets, or bulbils, at the leaf apices [27] (Figure 1). Leaves from the three plants were pooled, oven-dried at 37 °C for 48 h, milled, and sieved below 300 µm to obtain a homogeneous composite powder used for all analyses. For LC-HRMS profiling, three independent extractions were prepared from the composite powder at 1.0 mg/mL in H2O/EtOH (50:50, v/v) with 0.1% (v/v) formic acid, sonicated for 60 min at room temperature, and centrifuged at 10,000× g for 5 min. Each supernatant was diluted 1:10 (v/v) with LC-MS-grade water and filtered through a 0.22 µm PTFE membrane before injection. Extractions were carried out protected from light and the extracts were analysed immediately after preparation. The extraction was designed for qualitative profiling and was not validated for exhaustive recovery; no re-extraction of the residue was performed. The profile reported here therefore describes the dried, milled material analysed, in which the more labile constituents may be under-represented relative to the fresh tissue.
2.3. LC-ESI-HRMS Analysis
Analyses were run on an UltiMate 3000 UHPLC system (Thermo Scientific, Waltham, MA, USA) coupled to a hybrid quadrupole-Orbitrap Q Exactive mass spectrometer (Thermo Scientific) fitted with a heated electrospray ionisation (HESI) source. Separation used an Ascentis Express C18 core–shell column (150 × 2.1 mm i.d., 2.7 µm; Sigma-Aldrich, Milan, Italy) with a matching guard column (10 × 2.1 mm i.d.) at 40 °C. The injection volume was 5.0 µL. Mobile phase A was water and B acetonitrile, each with 0.1% (v/v) formic acid; the flow rate was 200 µL/min. The gradient was as follows: 0 to 5 min, 5% B; 5 to 8 min, 5 to 15% B; 8 to 25 min, 15 to 18% B; 25 to 28 min, 18 to 40% B; 28 to 30 min, 40 to 100% B; 30 to 40 min, 100% B; 40 to 41 min, 100 to 2% B; 41 to 45 min, 2 to 5% B; 45 to 50 min, 5% B. The 30–40 min segment at 100% B was used to wash strongly retained matrix constituents, and the 40–50 min segment returned the column to the initial composition and ensured re-equilibration before the next injection. The column effluent passed through a diode-array detector (DAD, Dionex UltiMate, Thermo Scientific) before entering the mass spectrometer. Full spectra were acquired from 300 to 650 nm with a bunch width of 1 nm, a data collection rate of 5 Hz, a response time of 2.0 s and a narrow slit; the reference wavelength was 600 nm with a bandwidth of 1 nm. The traces at 330 and 520 nm reported in Figure S1 were extracted from these spectra.
HESI settings were as follows: sheath gas, 35 au; auxiliary gas, 15 au; spray voltage, 3.5 kV; capillary temperature, 320 °C; and S-Lens RF, 100%. Full-scan MS spectra were acquired over the m/z 200–2000 range at a resolving power of 70,000 (FWHM at m/z 200).
Data-dependent MS/MS spectra were acquired in both ionisation modes at a resolving power of 17,500 (AGC target 1 × 10⁵, maximum injection time 50 ms, one microscan, profile mode), using higher-energy collisional dissociation (HCD) at a normalised collision energy of 30 and a 1.0 m/z isolation window. The five most intense precursors of each full-scan cycle were selected for fragmentation (TopN = 5, loop count 5), with a minimum AGC target of 8.0 × 10³, an intensity threshold of 1.6 × 10⁵, isotope exclusion enabled and dynamic exclusion of 10.0 s.
A solvent blank was injected after the sample sequence to assess carryover; no signals corresponding to the annotated features were detected in the blank. Assignment confidence followed Schymanski et al. [17]. For natural-product glycosides the assigned level refers to the proposed elemental composition and structural class, and it does not imply the resolution of isomeric sugars or of the glycosylation architecture.
Before each analytical sequence, the mass spectrometer was externally calibrated in both ionisation modes using the Pierce LTQ Velos ESI positive-ion and Pierce ESI negative-ion calibration solutions (Thermo Fisher Scientific, Waltham, MA, USA). Accuracies obtained at the end of calibration ranged between 0.17 ppm and 0.23 ppm in positive polarity and between 0.48 ppm and 0.65 ppm in negative polarity. No internal lock mass was applied during acquisition.
Raw data were inspected in Xcalibur and processed with Compound Discoverer 3.4 (Thermo Fisher Scientific, Waltham, MA, USA). The positive- and negative-ion acquisitions were processed together within a single workflow, with the single-polarity restriction at compound assembly disabled, so that evidence from the two modes was combined into one entry per compound. Retention times were aligned across files. No automated background subtraction was applied, and carryover was assessed by manual inspection of the solvent blank injected after the sequence. The workflow template also carried spectral-library and database searches, which served to generate candidate structures; each candidate was then examined against the experimental MS/MS spectra and the annotation was restated at the level of structural detail those spectra support, so that no annotation reported here rests on a library or database match alone. All processing parameters are given node by node in Supplementary Text S1. Candidate phenolic compounds were selected by post-processing the assigned formulae and retaining only features consistent with typical polyphenolic criteria: double bond equivalent (DBE) > 4, oxygen-to-carbon (O/C) ratio of 0.4–0.9, and hydrogen-to-carbon (H/C) ratio of 0.7–1.4. These criteria served only as a non-specific prioritisation window: features falling outside it may be missed, and formulas falling inside it may correspond to non-phenolic metabolites, so phenolic annotation always required the subsequent manual evaluation of chromatograms and the MS/MS evidence. Figures were prepared with SigmaPlot (version 14.0, Systat Software Inc., San Jose, CA, USA), and chemical structures were drawn with ChemDraw (version 8.0, PerkinElmer Informatics, Waltham, MA, USA).
2.4. Folin–Ciocalteu Assay
Folin-reactive compounds were determined following Busto et al. [28] with minor changes. Leaf material was cut and oven-dried at 37 °C for 48 h. Coarse fragments were produced on an OMAS M6 blade mill, reduced further on an automatic mortar and pestle (RM200, Retsch Verder Scientific s.r.l., Pedrengo (BG), Italy), and sieved below 300 µm. To cover the range of phenolic polarities, four solvent systems were compared: water, ethanol/water 50% (v/v), ethanol 70%/water 30% (v/v), and absolute ethanol. Three independent extractions were prepared for each solvent: 10.0 mg of powder was suspended in 10.0 mL of solvent, sonicated for 1 h at 40 °C, and centrifuged to give the final extract. A gallic acid (GA) stock solution (5.0 g/L) was prepared by dissolving 0.5 g GA in 10 mL ethanol and making up to 100 mL with water; working standards of 10, 25, 50, 100, and 250 mg/L were prepared by dilution. Each calibration level was prepared and measured in triplicate, and all absorbances were corrected against a reagent blank. The calibration curve was described by the equation y = 0.0011x + 0.0032, with an excellent coefficient of determination (R2 = 0.998). Method precision was assessed by calculating the relative standard deviation (RSD%) of triplicate measurements (Section 3.4). The limit of detection (LOD) and limit of quantification (LOQ) were determined from the standard deviation of the blank response according to the equations LOD = 3.3σ/S and LOQ = 10σ/S, where σ represents the standard deviation of the blank measurements and S is the slope of the calibration curve. The calculated LOD and LOQ were 3.0 and 9.1 mg GAE/g dry sample, respectively.
For the assay, 100 µL of standard or sample was combined with 7.9 mL of water and 500 µL of Folin–Ciocalteu reagent; after 8 min, 1.5 mL of sodium carbonate (1.9 M) was added. Absorbance was read at 765 nm on a UV-Vis spectrophotometer (UV-1900i, Shimadzu, Milan, Italy). Absorbance values were converted to gallic acid equivalents using the calibration curve and expressed as milligrams of gallic acid equivalents per gram of dry sample (mg GAE/g). The absorbance values of all samples fell within the calibration range, and therefore no dilution of the extracts was required. Values are reported as mean ± standard deviation of the three independent extractions prepared for each solvent (n = 3). Because all extractions derive from the same composite powder, this dispersion describes the repeatability of the extraction and assay procedure and not biological variability.
3. Results and Discussion
3.1. Overview and Most Intense Phenolic Compounds in Extracts of K. delagoensis Leaves
The hydroalcoholic leaf extract of K. delagoensis was profiled by RPLC-ESI-HRMS using both positive- and negative-ionisation modes. All data derive from a single composite sample of three clonally propagated plants harvested on one occasion, so the profile described here characterises that material and not the species. Moreover, naming throughout reflects MS/MS annotation, not structural confirmation. The datasets acquired in the two polarities were jointly evaluated for compound annotation, as they provided complementary structural information and thereby improved the confidence of metabolite assignment. The negative-ion base-peak chromatogram is shown in Figure 2, while the UV-Vis chromatographic traces extracted at 330 nm, corresponding to the flavonoid B-band absorption region, and at 520 nm, indicative of anthocyanin pigments, are reported in Figure S1.
Figure 2.
Representative negative-ion RPLC-ESI-HRMS base-peak chromatogram of the hydroethanolic leaf extract of K. delagoensis. The chromatographic profile shows two major phenolic constituents eluting at 22.1 and 27.8 min, assigned to peaks #18 and #20, respectively, whereas several lower-intensity, more polar phenolics are detected at earlier retention times. The corresponding UV-Vis chromatographic traces extracted at 330 and 520 nm are reported in Figure S1. Peak numbers refer to the tentative assignments listed in Table 1.
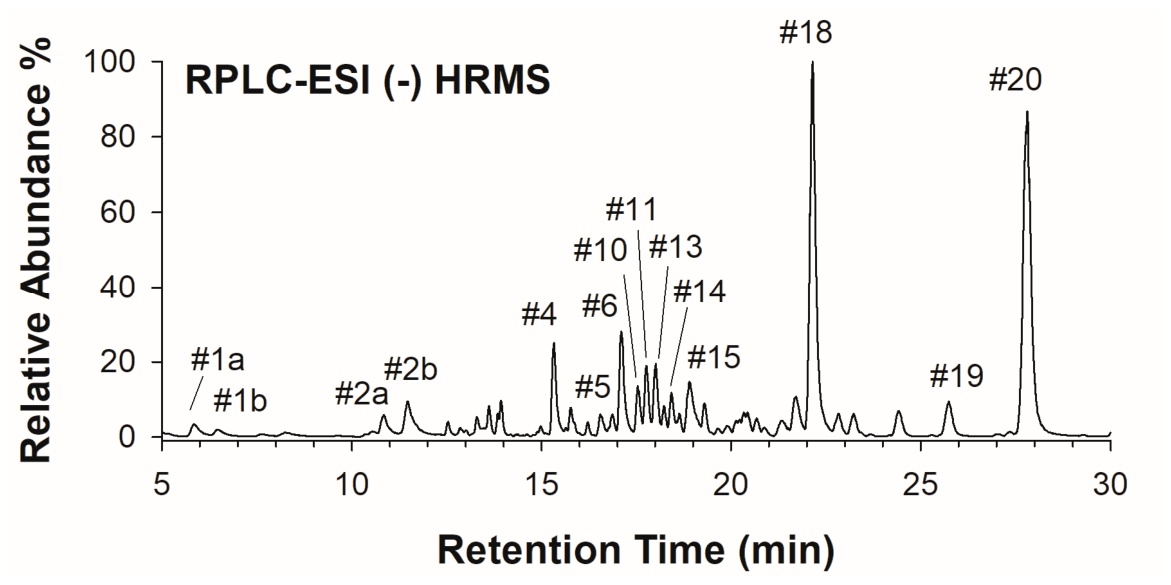
Table 1.
Phenolic features annotated in K. delagoensis leaf powder by RPLC-ESI-HRMS and tandem MS, listed in order of retention time. Assignments are based on accurate mass, isotope pattern, chromatographic behaviour, and diagnostic MS/MS fragments defining the phenolic core and the class of attached sugar residues. Unless otherwise stated, annotations are reported at Schymanski confidence level 3 [17], because MS/MS data do not resolve isomeric sugars or define the position, linkage, or anomeric configuration of glycosylation.
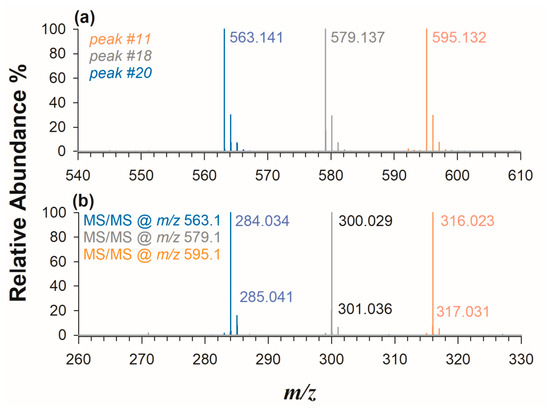
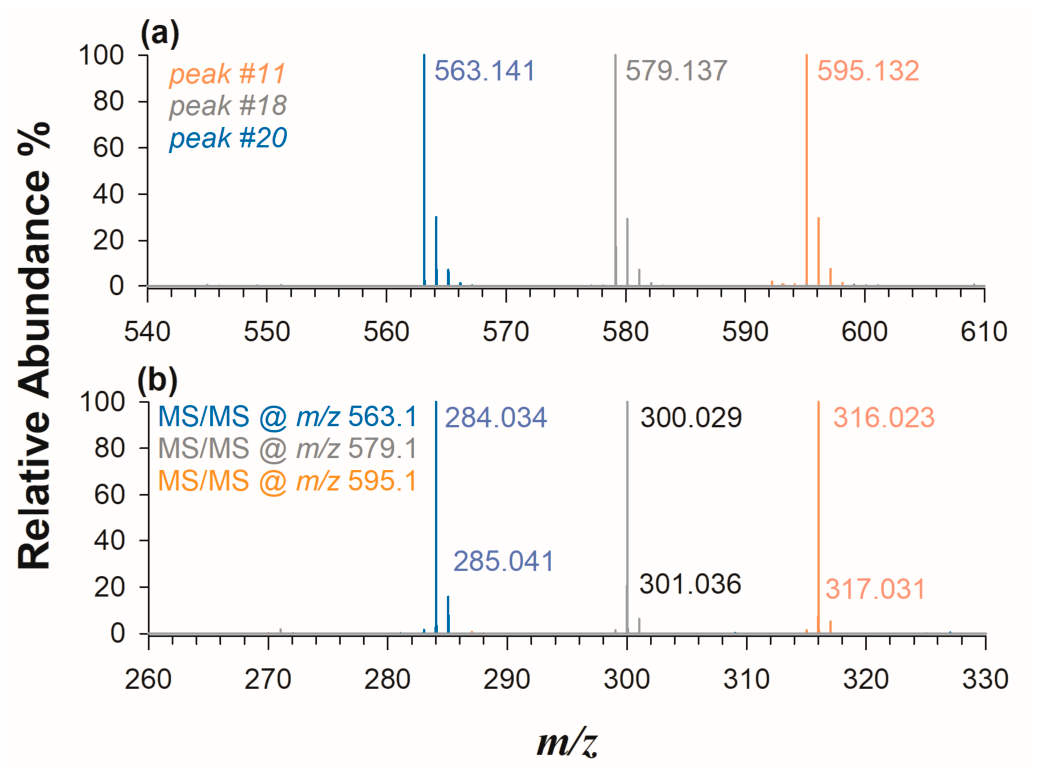
The chromatographic profile was characterised by two major constituents eluting at 22.1 and 27.8 min (peaks #18 and #20), which accounted for the largest fraction of the total ion current, whereas several less intense and more polar metabolites eluted at earlier retention times. The peak areas of these two compounds were at least one order of magnitude greater than those of any other detected component. However, signal intensities under gradient ESI conditions provide merely a semi-quantitative estimate of relative abundance rather than absolute quantification, as ionisation efficiencies can vary significantly among different structures and are strongly influenced by the changing organic solvent composition throughout the chromatographic run. Peak #18 (Figure 3a) exhibited a deprotonated ion at m/z 579.137, corresponding to [M − H]− of the neutral formula C26H28O15 (m/zcalc 579.136; error 1.7 ppm). Its MS/MS spectrum (Figure 3b) was dominated by product ions at m/z 300.029 and 301.036, corresponding, respectively, to the radical anion and the deprotonated aglycone of quercetin ([QUE − 2H]•− and [QUE − H]−). The radical anion is generated through charge-remote homolytic cleavage of the glycosidic bond, with the unpaired electron delocalised across the flavonol π-system, and represents a characteristic fragmentation pathway of flavonol glycosides in negative-ion mode [29,30]. The accompanying neutral loss of 278.100 Da corresponds to the combined mass of one deoxyhexose and one pentose residue, and peak #18 was accordingly annotated as a quercetin deoxyhexoside-pentoside. Whether these are attached to the aglycone as a disaccharide or independently is not established by these data.
Figure 3.
High-resolution full-scan MS spectra (a) and MS/MS spectra (b), acquired in negative-ion mode, of the main flavonol diglycosides detected in the leaf extract of K. delagoensis. The precursor ions are assigned to peak #18 (grey, quercetin core, m/z 579.137), peak #20 (blue, kaempferol core, m/z 563.141), and a lower-intensity myricetin analogue (orange, m/z 595.132). Upon higher-energy collisional dissociation (HCD), all three precursors display the diagnostic neutral loss of 278.100 Da, corresponding to the combined mass of one deoxyhexose and one pentose residue, yielding the corresponding flavonol aglycone ions: m/z 300/301 for quercetin, 284/285 for kaempferol, and 316/317 for myricetin.
In positive-ion mode, the same compound yielded the protonated and sodiated adducts at m/z 581.150 and m/z 603.132, respectively (Figure S2a), together with the protonated aglycone at m/z 303.050 in MS/MS experiments (Figure S2b), further supporting the presence of a quercetin core. This composition is noteworthy within Kalanchoe. Quercetin deoxyhexosyl-pentosides have been reported among flavonoid glycosides from several plant families, for example, in Anthyllis hermanniae [31]. In K. pinnata, the isomeric quercetin arabinopyranosyl-rhamnopyranoside (QAR) is the dominant phenolic constituent; its structure was established by NMR and MALDI-MS, and it has been proposed as a chemical marker for this species [22]. The identical molecular formula and closely matching MS/MS behaviour observed here for K. delagoensis therefore suggest that this decoration of a quercetin core with a deoxyhexose and a pentose may be shared across the Kalanchoe/Bryophyllum clade. A quercetin deoxyhexoside-pentoside was reported at trace level in in vitro cultured B. tubiflorum (a synonym of K. delagoensis) [14,15], where myricetin and malvidin glycosides prevail. The two datasets differ in plant material, genotype, growth conditions, developmental stage, extraction, chromatography and annotation criteria, so the difference in relative abundance cannot be ascribed to any single factor. Earlier field surveys of the species reported monoglycosides and, in one case, a kaempferol triglycoside, but no pentose-containing glycoside [12,13], so a flavonol bearing a deoxyhexose and a pentose already extends the phenolic profile documented from naturally grown material. Confirmation as QAR by an authentic standard or by NMR would also make this extension of pharmacobotanical interest, since QAR displays marked pharmacological activity, including antinociceptive, antiedematogenic, and anti-inflammatory effects in murine models, associated with cyclooxygenase inhibition and reduced TNF-α levels [21]. As for the glycosides discussed below, MS data alone cannot define the identity, sequence, attachment position, interglycosidic linkage, or anomeric configuration of the sugar units; therefore, the assignment is reported at confidence level 3 [17].
Peak #20 (27.8 min, Figure 3a) yielded a deprotonated ion at m/z 563.141, consistent with the molecular formula [C26H28O14 − H]− (m/zcalc 563.140; error 1.8 ppm) and represented the most intense phenolic signal in the chromatographic run.
Its MS/MS spectrum (Figure 3b) closely paralleled that of peak #18 but showed the dominant radical anion of the kaempferol (KAE) core at m/z 284.034 ([KAE − 2H]•−), accompanied by the deprotonated aglycone at m/z 285.041 ([KAE − H]−), as expected from the lower degree of B-ring hydroxylation [29,30]. In positive-ion mode, the compound produced a protonated adduct, [M + H]+, at m/z 565.155 and [M + Na]+ at m/z 587.137 (Figure S2a), while MS/MS experiments generated the protonated kaempferol aglycone at m/z 287.055 (Figure S2b). The same neutral loss of 278.100 Da observed for peak #18 indicates the same combination of one deoxyhexose and one pentose residue, supporting the assignment of peak #20 as the kaempferol analogue of the quercetin diglycoside, that is, a kaempferol deoxyhexoside-pentoside. Its elemental composition is compatible with that reported for kapinnatoside in K. pinnata [22], although the available MS/MS data do not establish identical sugar identities, sequence, linkage or attachment position. Taken together, these two diglycosides, namely the quercetin and kaempferol deoxyhexoside-pentosides, are the most intense phenolic signals detected in the leaves of K. delagoensis, in agreement with the histochemical evidence of flavonoid accumulation reported by Casanova et al. [7].
The same substitution pattern was also observed on a third flavonol core. A signal at m/z 595.132 ([C26H28O16 − H]−; m/zcalc 595.130; error 2.4 ppm; Figure 3) displayed the same neutral loss of 278.100 Da, as observed for peaks #18 and #20. However, its MS/MS spectrum released the myricetin radical anion at m/z 316.023 ([MYR − 2H]•−), together with the deprotonated aglycone at m/z 317.031 ([MYR − H]−), supporting its assignment as a myricetin-deoxyhexoside-pentoside. These three compounds therefore define a homologous series sharing the same glycan decoration and differing only in the hydroxylation pattern of the flavonol B-ring. Notably, the relative abundance of the diagnostic radical-anion fragments increased in the order kaempferol < quercetin < myricetin, consistent with the greater resonance stabilisation of the negative charge as the number of phenolic hydroxyl groups increases [29,30]. The detection of a myricetin-containing series should be interpreted cautiously. Myricetin glycosides have been documented in field-grown K. pinnata [32], so their occurrence in the present specimen is chemotaxonomically coherent. These compounds were also reported by García-Pérez et al. among the flavonols of in vitro cultured K. delagoensis (as B. tubiflorum in [14]); they were, however, absent from the two earlier surveys of field-grown K. delagoensis, which reported only quercetin and kaempferol derivatives [12,13]. Their detection here thus extends the flavonol profile documented from naturally grown leaves of the species. As for the other glycosides described above, high-resolution accurate mass and MS/MS data establish the aglycone core and the overall sugar class but cannot unambiguously determine the identity, stereochemistry, linkage order, or attachment position of the monosaccharide units. In the absence of authentic standards or NMR confirmation, the precise glycan architecture therefore remains tentative and is inferred only from the literature precedents.
3.2. A Combinatorial Network of Flavonol Glycosides
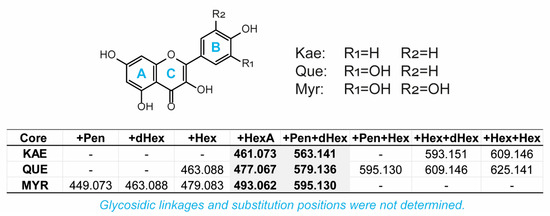
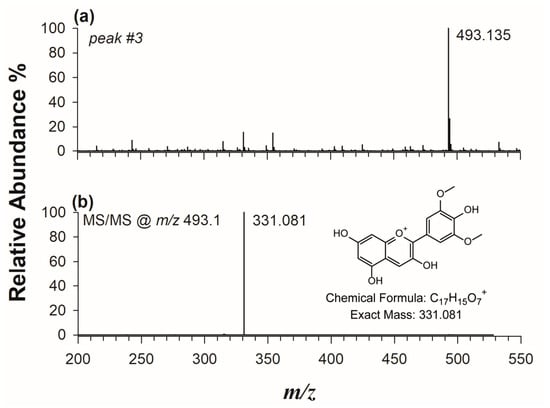
Beyond these diglycosides, the extract contained a broader set of phenolic features that, despite their apparent diversity, could be rationalised from a limited number of recurring structural units. The aglycone components were represented by the three flavonols kaempferol (C15H10O6), quercetin (C15H10O7), and myricetin (C15H10O8), which differ by progressive hydroxylation of the B-ring and were directly inferred from their diagnostic negative-ion MS/MS fragments at m/z 284/285, 300/301, and 316/317, respectively (Figure 3b). The glycosidic portion was interpreted from the neutral losses observed upon MS/MS fragmentation.
Cleavage of the glycosidic bond removes the sugar residues from the precursor ion and generates the corresponding aglycone fragment; therefore, the mass difference between the precursor and the aglycone provides diagnostic information on the attached sugar class. In this dataset, losses of 132.042, 146.058, 162.053, and 176.032 Da were assigned to pentose, deoxyhexose, hexose, and hexuronic acid residues, respectively (Table S1). When two sugars were present, the spectra showed either sequential losses or a combined neutral loss corresponding to the sum of the two residues, such as 278.100 Da for the combination of a deoxyhexose and a pentose. Thus, most phenolic signals in the extract can be described as combinations of a limited number of flavonol cores and sugar units, reducing the apparent chemical complexity to a coherent combinatorial family (Figure 4). The features supporting this interpretation are summarised in Table 1, ordered by retention time and limited to compounds for which informative MS/MS spectra were obtained.
Figure 4.
Schematic summary of the flavonol aglycone cores and sugar-residue classes inferred from MS/MS in the leaf extract of K. delagoensis. The upper panel shows the common flavonol scaffold and the B-ring hydroxylation pattern that differentiates kaempferol (KAE), quercetin (QUE), and myricetin (MYR). The lower panel summarises the observed combinations between these flavonol cores and the sugar classes inferred from MS/MS neutral losses. Reported values correspond to the deprotonated precursor ions [M − H]− calculated for each core–sugar combination. Abbreviations: Pen, pentose; dHex, deoxyhexose; Hex, hexose; HexA, hexuronic acid. The scheme represents inferred cores and residue classes: it does not establish the identity of the sugars, their sequence, their attachment position, the interglycosidic linkage, the anomeric configuration or the ring form.
Candidate phenolics were selected from the high-resolution dataset by retaining accurate-mass features containing only C, H, and O and falling within a 5 ppm mass tolerance. To separate putative polyphenols from bulk plant interferences, including lipids and peptide-like components, a formula-based triage was then applied using structural constraints typical of phenolic metabolites. Features were filtered according to their degree of unsaturation (DBE) and elemental ratios, particularly O/C and H/C. As shown in the Van Krevelen diagram (Figure S3), oxygen-rich polyphenols occupy a distinct chemical space, defined here by O/C values between 0.4 and 0.9 and H/C values between 0.7 and 1.4, and they are markedly less hydrogen-rich than aliphatic matrix components [33]. The remaining candidate features were subsequently evaluated by MS/MS, and only those providing informative fragmentation spectra were retained for annotation. In parallel, the base-peak chromatograms were inspected manually, so that abundant signals not satisfying the elemental-ratio criteria would still be examined. The free flavonol aglycones, whose H/C ratio of 0.67 places them just below the selected window, were detected only at trace level, below 0.1% of the most intense feature. Each compound was therefore described according to its aglycone core and the class and number of attached sugar units. A major challenge in flavonol glycoside annotation is that the same elemental composition may correspond to multiple isomers differing in aglycone identity, sugar identity, linkage sequence, or glycosylation site; consequently, accurate mass alone is insufficient for unambiguous assignment [34,35,36]. In practice, this ambiguity was reduced by combining chromatographic separation with diagnostic MS/MS fragments. The pair of chromatographically resolved ions at m/z 463.089 provides a representative example. The species eluting at 18.0 min yielded quercetin-derived fragments and was assigned as a quercetin-hexoside, thereby defining the aglycone and sugar class but not the identity of the hexose or its attachment pattern [37]. Conversely, the isomeric species eluting at 17.1 min generated myricetin-derived fragments and was assigned as a myricetin-deoxyhexoside. The same interpretive framework applies to the other myricetin glycosides detected in the dataset: the myricetin-hexoside at m/z 479.084 and the myricetin-pentoside at m/z 449.074 were both characterised by the diagnostic m/z 316/317 radical-anion and aglycone product ions in their MS/MS spectra. The occurrence of this minor myricetin series indicates that the 3′,4′,5′-trihydroxylated B-ring pattern is produced in the field-grown material examined here and not only under in vitro conditions.
Higher-order glycosides further completed this flavonol network. These included features annotated as quercetin-pentoside-hexoside (m/z 595.132), quercetin-hexoside-deoxyhexoside (m/z 609.148), and kaempferol-hexoside-deoxyhexoside (m/z 593.153). In addition, a minor branch of O-methylated flavonols was detected, represented by a feature annotated as a laricitrin hexoside (Table 1). This compound does not define an independent scaffold, but rather a methylated derivative of the myricetin-type core already present in the dataset, consistent with the activity of plant flavonoid O-methyltransferases [38]. The low intensity of its signal suggests that O-methylation represents a secondary diversification route within the flavonol glycoside profile of K. delagoensis.
3.3. Hexuronides, Gallotannins, and Anthocyanins
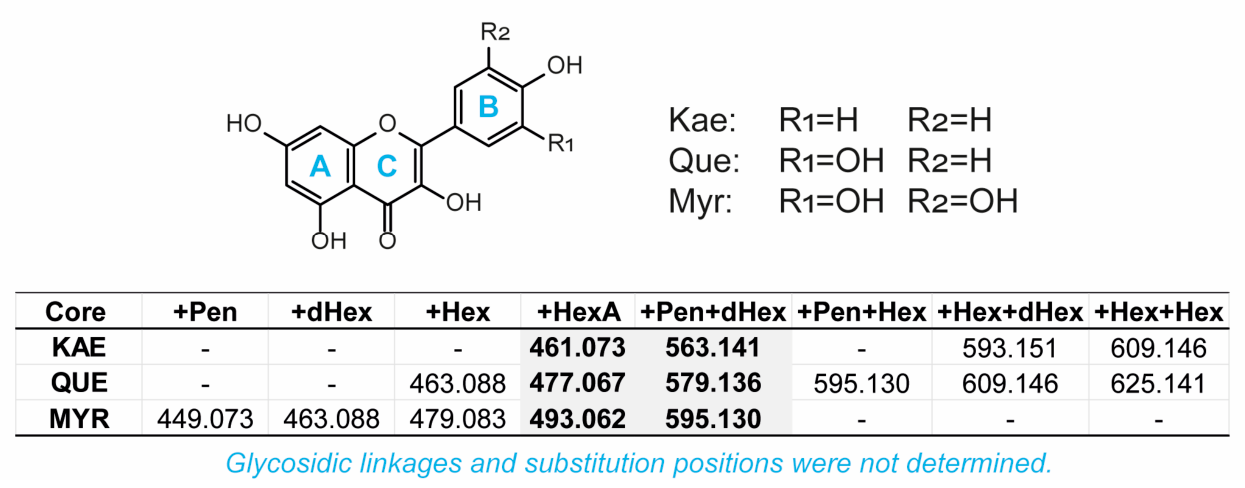
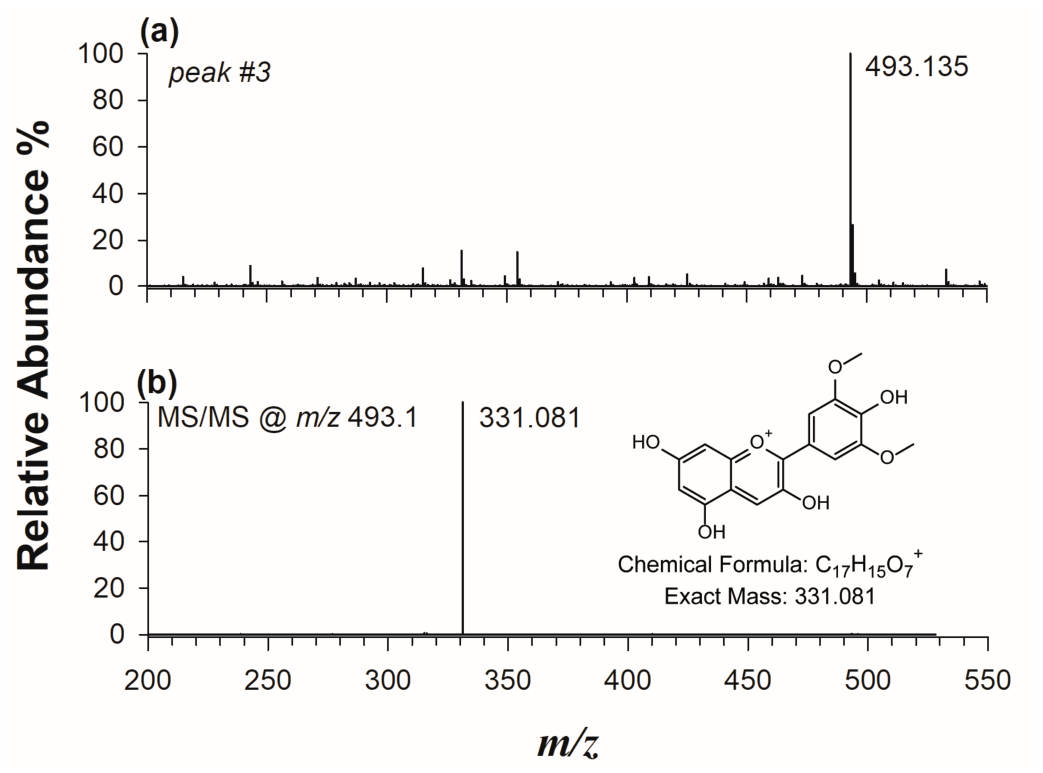
A second group of phenolic conjugates was characterised by the replacement of neutral sugars with a hexuronic acid residue, corresponding to a diagnostic neutral loss of 176.032 Da. Three flavonol hexuronides were supported by MS/MS data: quercetin-hexuronide (m/z 477.068, 17.5 min), myricetin-hexuronide (m/z 493.062, 17.9 min), and kaempferol-hexuronide (m/z 461.074, 20.8 min), each yielding the corresponding aglycone fragment (Table 1). Such conjugation is common in leaves and is consistent with the previous isolation of quercetin-glucuronide from the flowers of this species. In addition to flavonol glycosides, the dataset revealed a small series of galloylated hexose derivatives. Two isomers of galloyl-hexose at m/z 331.068 ([C13H16O10 − H]−, 5.9 and 6.4 min) and two isomers of digalloyl-hexose at m/z 483.079 ([C20H20O14 − H]−, 10.9 and 11.5 min) were supported by their MS/MS behaviour and assigned as mono- and digalloyl hexoses (Figure S4a,b). These compounds belong to the broader gallotannin family, a class of widespread plant antioxidants closely related to ellagitannins and readily characterised by tandem MS [39]. Inspection of the MS/MS data also revealed a more complex acylated phenolic ester. The ion at m/z 477.105 ([M − H]−) was tentatively assigned to a coumaroyl-galloyl-hexose at Schymanski confidence level 3. Its negative-ion fragmentation pattern was compatible with this annotation: losses of 164.047 and 146.037 Da, corresponding to the p-coumaroyl residue released as free acid and as ketene, generated galloyl-hexose product ions at m/z 313.056 and m/z 331.068, respectively, while loss of gallic acid followed by cross-ring cleavage of the hexose gave m/z 265.072, which retains the coumaroyl unit. Finally, fragment ions at m/z 169.014 and 163.040 were assigned to deprotonated gallate and coumarate, respectively (Figure S4). Hybrid acyl-hexose esters bearing coumaroyl and galloyl moieties on the same hexose core have previously been isolated and structurally characterised in other plant taxa [40], supporting the plausibility of the present assignment. Nevertheless, in the absence of an authentic standard or NMR confirmation, the exact acylation pattern and linkage positions remain unresolved. Finally, the reddish colouration observed in the most sun-exposed leaves was associated with an anthocyanin detected in positive-ion mode. The compound eluted at 13.4 min and displayed a characteristic absorbance maximum at 520 nm in the DAD trace (Figure S1). Its full-scan spectrum showed the flavylium molecular ion [M]+ at m/z 493.135, consistent with [C23H25O12]+, while MS/MS fragmentation generated a single diagnostic product ion at m/z 331.081 through neutral loss of a hexose residue (162.053 Da), as shown in Figure 5.
Figure 5.
Positive-ion HRMS evidence supporting the annotation of the leaf anthocyanin as a malvidin-hexoside. (a) Full-scan spectrum showing the flavylium molecular ion [M]+ at m/z 493.135, consistent with [C23H25O12]+. (b) MS/MS spectrum showing the diagnostic neutral loss of a hexose residue (162.053 Da), which yields the malvidin flavylium core at m/z 331.081. The chromatographic peak elutes at 13.4 min and coincides with the 520 nm absorbance maximum observed in the DAD trace (Figure S1).
The precursor was therefore annotated as a malvidin-hexoside. Four mutually consistent observations support the annotation. The precursor at m/z 493.135 is consistent with the elemental composition [C23H25O12]+ and was detected in positive-ion mode only, with no corresponding species in negative-ion mode, as expected of a permanently charged anthocyanin and unlike every other feature listed in Table 1. Its visible absorption maximum at 520 nm is characteristic of an anthocyanin chromophore. MS/MS gave a neutral loss of 162.053 Da, consistent with cleavage of a hexose residue, and the resulting product ion at m/z 331.081 corresponds to a dimethylated delphinidin flavylium cation. The annotation is also coherent with previous reports identifying malvidin glycosides as the predominant anthocyanins within the Bryophyllum subgenus of Kalanchoe [14], as well as with the occurrence of malvidin 3,5-di-O-glucosides among the flower pigments of K. blossfeldiana [41]. Other pigments, copigmentation, concentration and vacuolar pH also could contribute to leaf colour, so this feature is best regarded as a candidate contributor to the colouration and not as the compound responsible for it. Table S2 compares the classes detected here against the compounds previously reported for the species and its synonyms from naturally grown leaves, flowers and in vitro cultured material. Comparisons with previously reported compounds rest on molecular formula and fragmentation behaviour and do not constitute structural confirmation; differences with respect to earlier reports may also reflect genotype, environment, developmental stage, extraction protocol and analytical methodology.
3.4. Folin-Reactive Phenolic Content
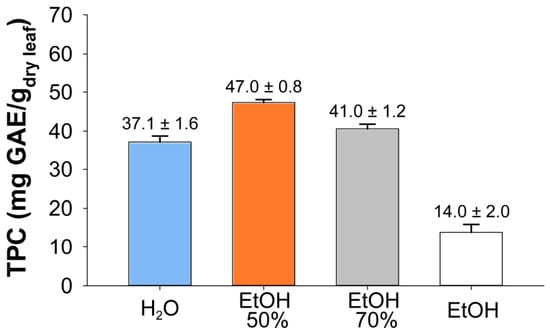
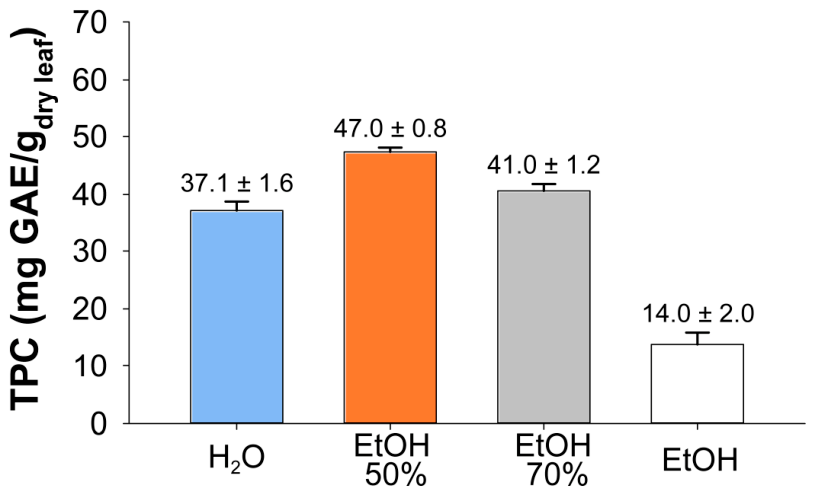
Folin-reactive compounds in K. delagoensis leaf powder were determined using the Folin–Ciocalteu assay, a widely applied colorimetric method for estimating the overall reducing capacity of plant phenolic extracts [42]. Because the assay responds to phenolics and other reducing constituents, the resulting values should be interpreted as total Folin-reactive compounds expressed as gallic acid equivalents rather than as an absolute measure of individual polyphenols. Extraction efficiency was compared across four solvent systems of different polarity: water, ethanol/water 50:50 (v/v), ethanol/water 70:30 (v/v), and absolute ethanol. The highest response was obtained with the 50% hydroethanolic mixture (47.0 ± 0.8 mg GAE/g dry leaf), followed by 70% ethanol (41.0 ± 1.2 mg GAE/g), water (37.1 ± 1.6 mg GAE/g), and absolute ethanol (14.0 ± 2.0 mg GAE/g) (Figure 6). Data are expressed as mean ± SD of three independent extractions (n = 3). One-way ANOVA followed by Tukey’s multiple comparison test demonstrated statistically significant differences among all extraction solvents (p < 0.05). Ethanol/water 50:50 (v/v) showed the highest recovery of Folin-reactive compounds, confirming it as the most efficient extraction condition among those tested. The superior performance of hydroethanolic mixtures is consistent with the amphiphilic character of the annotated phenolics, which combine polar glycosidic or galloyl moieties with less polar flavonol or phenolic-acid cores. In contrast, pure ethanol was markedly less effective, likely because it provides insufficient solvation of the highly oxygenated glycosides and galloylated hexoses annotated in this extract. These results indicate that aqueous ethanol, particularly at 50–70% (v/v), is the most suitable solvent range for recovering Folin-reactive phenolics from dried K. delagoensis leaves [43].
Figure 6.
Folin-reactive phenolic content of dried K. delagoensis leaf powder after extraction with solvents of different polarity: water, ethanol/water 50:50 (v/v), ethanol/water 70:30 (v/v), and absolute ethanol. Values are expressed as mg gallic acid equivalents per gram of dry leaf powder (mg GAE/g) and reported as mean ± standard deviation of three independent extractions per solvent (n = 3). Because all extractions derive from a single composite powder, the error bars describe the repeatability of the extraction and assay procedure and not biological variability. All pairwise differences were significant by one-way ANOVA, followed by Tukey’s multiple comparison test (α = 0.05).
4. Conclusions
This study provides an untargeted, qualitative characterisation of the phenolic fraction of K. delagoensis leaves, establishing them as a phenolically rich matrix whose chemical profile is more diverse than previously recognised from targeted or in vitro analyses. Rather than representing a scattered set of unrelated metabolites, the detected constituents form a coherent phenolic architecture centred on flavonol glycosides, with recurring kaempferol, quercetin, and myricetin cores decorated by a limited set of sugar residues. Within this framework, the two most intense features are quercetin and kaempferol deoxyhexosidepentosides. Their compositions match those of the flavonol glycosides characteristic of K. pinnata, though the identity of the structure remains to be established. The detection of myricetin derivatives, galloylated hexose esters, and malvidin-hexoside further broadens the known phenolic repertoire of the species and shows that several chemically distinct phenolic subclasses contribute to it.
At the same time, the study should be interpreted within the limits of an untargeted HRMS/MS workflow. Annotations define the phenolic core and the class of glycosylation but do not resolve sugar identity, linkage sequence, attachment position, or stereochemistry; consequently, structural confirmation by authentic standards, co-injection experiments, or NMR remains necessary for the most diagnostic compounds. Replication across different plants, seasons, and growth conditions will also be required to determine whether the profile described here is stable or influenced by environmental factors. Absolute quantification was outside the scope of this qualitative profiling study, and the relative abundances reported here should be considered indicative only. Future work should address it, either by hydrolysis and the quantification of the released aglycones or, where suitable standards are available, of the intact glycosides. Nevertheless, the present results provide the first high-resolution framework for the phenolic chemistry of this naturally grown invasive succulent, and support future work aimed at exploring whether its otherwise unwanted biomass could be considered a recoverable source of flavonol glycosides. Any such assessment would have to address the co-extracted bufadienolides and their toxicology and weigh the risk of promoting an invasive species.
Supplementary Materials
The following supporting information can be downloaded at https://www.mdpi.com/article/10.3390/compounds6030049/s1. Text S1: Data-processing parameters; Table S1: Neutral losses assigned to the phenolic features listed in Table 1; Table S2: Phenolic classes detected in this work compared with compounds previously reported for Kalanchoe delagoensis; Figure S1: RPLC-DAD (UV-Vis) chromatographic profiles of the aqueous ethanolic leaf extract of K. delagoensis; Figure S2: Positive-ion HRMS and MS/MS evidence supporting the assignment of the three flavonol diglycosides detected in the K. delagoensis leaf extract; Figure S3: Van Krevelen diagram derived from the untargeted metabolomics dataset of the K. delagoensis leaf extract; Figure S4: Negative-ion MS/MS spectra of the galloylated and acylated hexose derivatives annotated in the K. delagoensis leaf extract.
Author Contributions
Conceptualization, G.V.; methodology, F.B. and G.V.; software, G.V.; validation, C.D.C., T.R.I.C. and E.D.G.; formal analysis, F.B., V.N. and G.V.; investigation, F.B., V.N. and G.V.; resources, T.R.I.C.; data curation, G.V.; writing—original draft preparation, G.V. and F.B.; writing—review and editing, C.D.C., T.R.I.C. and E.D.G.; funding acquisition, T.R.I.C. All authors have read and agreed to the published version of the manuscript.
Funding
This research received no external funding.
Data Availability Statement
The annotation evidence for all reported features and the associated MS/MS spectra are provided. The raw instrument files are available from the corresponding author on request.
Acknowledgments
This work was supported by the project PONa3_00395/1 “BIOSCIENZE & SALUTE (B&H)” of the Italian Ministero per l’Istruzione, l’Università e la Ricerca (MIUR). We thank the project “Strengthening BIOdiversity Preservation through Sustainable Exploitation of the Bioresources CHAIN in the Programme Area-BIOCHAIN”, funded by the Interreg VI-A Greece-Italy 2021–2027 Programme.
Conflicts of Interest
The authors declare no conflicts of interest.
References
- Dai, J.; Mumper, R.J. Plant Phenolics: Extraction, Analysis and Their Antioxidant and Anticancer Properties. Molecules 2010, 15, 7313–7352. [Google Scholar] [CrossRef] [Scilit] [PubMed]
- Gehrig, H.; Gaußmann, O.; Marx, H.; Schwarzott, D.; Kluge, M. Molecular Phylogeny of the Genus Kalanchoe (Crassulaceae) Inferred from Nucleotide Sequences of the ITS-1 and ITS-2 Regions. Plant Sci. 2001, 160, 827–835. [Google Scholar] [CrossRef] [Scilit] [PubMed]
- Lüttge, U. Ecophysiology of Crassulacean Acid Metabolism (CAM). Ann. Bot. 2004, 93, 629–652. [Google Scholar] [CrossRef] [Scilit] [PubMed]
- Winter, K.; Smith, J.A.C. CAM Photosynthesis: The Acid Test. New Phytol. 2022, 233, 599–609. [Google Scholar] [CrossRef] [Scilit] [PubMed]
- Nascimento, L.B.d.S.; Casanova, L.M.; Costa, S.S. Bioactive Compounds from Kalanchoe Genus Potentially Useful for the Development of New Drugs. Life 2023, 13, 646. [Google Scholar] [CrossRef] [Scilit] [PubMed]
- Stefanowicz-Hajduk, J.; Hering, A.; Gucwa, M.; Hałasa, R.; Soluch, A.; Kowalczyk, M.; Stochmal, A.; Ochocka, R. Biological Activities of Leaf Extracts from Selected Kalanchoe Species and Their Relationship with Bufadienolides Content. Pharm. Biol. 2020, 58, 732–740. [Google Scholar] [CrossRef] [Scilit] [PubMed]
- Casanova, J.M.; dos Santos Nascimento, L.B.; Casanova, L.M.; Leal-Costa, M.V.; Costa, S.S.; Tavares, E.S. Differential Distribution of Flavonoids and Phenolic Acids in Leaves of Kalanchoe delagoensis Ecklon & Zeyher (Crassulaceae). Microsc. Microanal. 2020, 26, 1061–1068. [Google Scholar] [CrossRef] [Scilit] [PubMed]
- Costa, S.S.; Muzitano, M.F.; Camargo, L.M.M.; Coutinho, M.A.S. Therapeutic Potential of Kalanchoe Species: Flavonoids and Other Secondary Metabolites. Nat. Prod. Commun. 2008, 3, 2151–2164. [Google Scholar] [CrossRef] [Scilit]
- Rajsekhar, P.B.; Arvind Bharani, R.S.; Ramachandran, M.; Jini Angel, K.; Rajsekhar, S.P.V. The “Wonder Plant” Kalanchoe pinnata (Linn.) Pers.: A Review. J. Appl. Pharm. Sci. 2016, 6, 151–158. [Google Scholar] [CrossRef] [Scilit]
- Kolodziejczyk-Czepas, J.; Stochmal, A. Bufadienolides of Kalanchoe Species: An Overview of Chemical Structure, Biological Activity and Prospects for Pharmacological Use. Phytochem. Rev. 2017, 16, 1155–1171. [Google Scholar] [CrossRef] [Scilit] [PubMed]
- Guerra-García, A.; Golubov, J.; Mandujano, M.C. Invasion of Kalanchoe by Clonal Spread. Biol. Invasions 2015, 17, 1615–1622. [Google Scholar] [CrossRef] [Scilit]
- da Silva, F.T.; Casanova, L.M.; Matos, A.; Casanova, J.M.; Costa, S.S. Flavonol Glycosides and Gallic Acid from Flowers of Kalanchoe Delagoensis. Rev. Virtual Quim. 2023, 15, 405–411. [Google Scholar] [CrossRef] [Scilit]
- Elansary, H.O.; Szopa, A.; Kubica, P.; Ekiert, H.; Ali, H.M.; Elshikh, M.S.; Abdel-Salam, E.M.; El-Esawi, M.; El-Ansary, D.O. Bioactivities of Traditional Medicinal Plants in Alexandria. Evid.-Based Complement. Altern. Med. 2018, 2018, 1463579. [Google Scholar] [CrossRef] [Scilit] [PubMed]
- García-Pérez, P.; Ayuso, M.; Lozano-Milo, E.; Pereira, C.; Dias, M.I.; Ivanov, M.; Calhelha, R.C.; Soković, M.; Ferreira, I.C.F.R.; Barros, L.; et al. Phenolic Profiling and in Vitro Bioactivities of Three Medicinal Bryophyllum Plants. Ind. Crops Prod. 2021, 162, 113241. [Google Scholar] [CrossRef] [Scilit]
- García-Pérez, P.; Zhang, L.; Miras-Moreno, B.; Lozano-Milo, E.; Landin, M.; Lucini, L.; Gallego, P.P. The Combination of Untargeted Metabolomics and Machine Learning Predicts the Biosynthesis of Phenolic Compounds in Bryophyllum Medicinal Plants (Genus kalanchoe). Plants 2021, 10, 2430. [Google Scholar] [CrossRef] [Scilit] [PubMed]
- Ventura, G.; Mesto, D.; Blasi, D.; Cataldi, T.R.I.; Calvano, C.D. The Effect of Milling on the Ethanolic Extract Composition of Dried Walnut (Juglans regia L.) Shells. Int. J. Mol. Sci. 2023, 24, 13059. [Google Scholar] [CrossRef] [Scilit] [PubMed]
- Schymanski, E.L.; Jeon, J.; Gulde, R.; Fenner, K.; Ruff, M.; Singer, H.P.; Hollender, J. Identifying Small Molecules via High Resolution Mass Spectrometry: Communicating Confidence. Environ. Sci. Technol. 2014, 48, 2097–2098. [Google Scholar] [CrossRef] [Scilit] [PubMed]
- Sleno, L. The Use of Mass Defect in Modern Mass Spectrometry. J. Mass Spectrom. 2012, 47, 226–236. [Google Scholar] [CrossRef] [Scilit] [PubMed]
- Rivas-Ubach, A.; Liu, Y.; Bianchi, T.S.; Tolić, N.; Jansson, C.; Paša-Tolić, L. Moving beyond the van Krevelen Diagram: A New Stoichiometric Approach for Compound Classification in Organisms. Anal. Chem. 2018, 90, 6152–6160. [Google Scholar] [CrossRef] [Scilit] [PubMed]
- Lourenço, E.M.G.; Fernandes, J.M.; Carvalho, V.d.F.; Grougnet, R.; Martins, M.A.; Jordão, A.K.; Zucolotto, S.M.; Barbosa, E.G. Identification of a Selective PDE4B Inhibitor from Bryophyllum pinnatum by Target Fishing Study and in Vitro Evaluation of Quercetin 3-O-α-LArabinopyranosyl-(1→2)-O-α-LRhamnopyranoside. Front. Pharmacol. 2020, 10, 1582. [Google Scholar] [CrossRef] [Scilit] [PubMed]
- Ferreira, R.T.; Coutinho, M.A.S.; Malvar, D.d.C.; Costa, E.A.; Florentino, I.F.; Costa, S.S.; Vanderlinde, F.A. Mechanisms Underlying the Antinociceptive, Antiedematogenic, and Anti-Inflammatory Activity of the Main Flavonoid from Kalanchoe pinnata. Evid.-Based Complement. Altern. Med. 2014, 2014, 429256. [Google Scholar] [CrossRef] [Scilit] [PubMed]
- Muzitano, M.F.; Tinoco, L.W.; Guette, C.; Kaiser, C.R.; Rossi-Bergmann, B.; Costa, S.S. The Antileishmanial Activity Assessment of Unusual Flavonoids from Kalanchoe pinnata. Phytochemistry 2006, 67, 2071–2077. [Google Scholar] [CrossRef] [Scilit] [PubMed]
- Patil, P.; Divya, M.P.; Parthiban, K.T.; Balasubramanian, A.; Varadha Raj, S.; Ravi, R.; Ashick Rajah, R. Strategic Valorization of Invasive Alien Plants: A Bioeconomic Review for Sustainable Product Development. Front. Plant Sci. 2026, 16, 1697102. [Google Scholar] [CrossRef] [Scilit] [PubMed]
- Albreht, A.; Križman, M. Green Sequential Extraction of Carotenoids and Coproducts from Invasive Alien Plants and Non-Edible Agricultural Residues. ACS Sustain. Chem. Eng. 2026, 14, 4275–4286. [Google Scholar] [CrossRef] [Scilit]
- Assis de Andrade, E.; Machinski, I.; Terso Ventura, A.C.; Barr, S.A.; Pereira, A.V.; Beltrame, F.L.; Strangman, W.K.; Williamson, R.T. A Review of the Popular Uses, Anatomical, Chemical, and Biological Aspects of Kalanchoe (Crassulaceae): A Genus of Plants Known as “Miracle Leaf”. Molecules 2023, 28, 5574. [Google Scholar] [CrossRef] [Scilit] [PubMed]
- McKenzie, R.A.; Franke, F.P.; Dunster, P.J. The Toxicity to Cattle and Bufadienolide Content of Six Bryophyllum Species. Aust. Vet. J. 1987, 64, 298–301. [Google Scholar] [CrossRef] [Scilit] [PubMed]
- Smith, G.F.; Figueiredo, E.; van Wyk, A.E. Kalanchoe (Crassulaceae) in Southern Africa: Classification, Biology, and Cultivation; Academic Press: Cambridge, MA, USA, 2019; pp. 1–338. [Google Scholar]
- Busto, F.; Scalia, A.C.; Gentile, P.; Girón-Hernández, J.; Cometa, S.; Brosio, T.; Mastrorilli, P.; Cochis, A.; De Giglio, E. Analytical and Biological Characterization of Gellan Gum-Pomegranate Peel Extract Hydrogel: Combining Mechanical, Antibacterial, Anti-Inflammatory and pro-Regenerative Properties for Cartilage Healing. Carbohydr. Polym. Technol. Appl. 2025, 12, 101032. [Google Scholar] [CrossRef] [Scilit]
- Hvattum, E. Determination of Phenolic Compounds in Rose Hip (Rosa canina) Using Liquid Chromatography Coupled to Electrospray Ionisation Tandem Mass Spectrometry and Diode-Array Detection. Rapid Commun. Mass Spectrom. 2002, 16, 655–662. [Google Scholar] [CrossRef] [Scilit] [PubMed]
- Hvattum, E.; Ekeberg, D. Study of the Collision-induced Radical Cleavage of Flavonoid Glycosides Using Negative Electrospray Ionization Tandem Quadrupole Mass Spectrometry. J. Mass Spectrom. 2003, 38, 43–49. [Google Scholar] [CrossRef] [Scilit] [PubMed]
- Halabalaki, M.; Urbain, A.; Paschali, A.; Mitakou, S.; Tillequin, F.; Skaltsounis, A.-L. Quercetin and Kaempferol 3-O-[α-l-Rhamnopyranosyl-(1→2)-α-l-Arabinopyranoside]-7-O-α-l-Rhamnopyranosides from Anthyllis hermanniae: Structure Determination and Conformational Studies. J. Nat. Prod. 2011, 74, 1939–1945. [Google Scholar] [CrossRef] [Scilit] [PubMed]
- Fürer, K.; Raith, M.; Brenneisen, R.; Mennet, M.; Simões-Wüst, A.P.; Von Mandach, U.; Hamburger, M.; Potterat, O. Two New Flavonol Glycosides and a Metabolite Profile of Bryophyllum pinnatum, a Phytotherapeutic Used in Obstetrics and Gynaecology. Planta Med. 2013, 79, 1565–1571. [Google Scholar] [CrossRef] [Scilit] [PubMed]
- Ollivier, S.; Jéhan, P.; Olivier-Jimenez, D.; Lambert, F.; Boustie, J.; Lohézic-Le Dévéhat, F.; Le Yondre, N. New Insights into the Van Krevelen Diagram: Automated Molecular Formula Determination from HRMS for a Large Chemical Profiling of Lichen Extracts. Phytochem. Anal. 2022, 33, 1111–1120. [Google Scholar] [CrossRef] [Scilit] [PubMed]
- Vukics, V.; Guttman, A. Structural Characterization of Flavonoid Glycosides by Multi-Stage Mass Spectrometry. Mass Spectrom. Rev. 2010, 29, 1–16. [Google Scholar] [CrossRef] [Scilit] [PubMed]
- Cuyckens, F.; Claeys, M. Mass Spectrometry in the Structural Analysis of Flavonoids. J. Mass Spectrom. 2004, 39, 1–15. [Google Scholar] [CrossRef] [Scilit] [PubMed]
- Jiang, C.; Gates, P.J. Systematic Characterisation of the Fragmentation of Flavonoids Using High-Resolution Accurate Mass Electrospray Tandem Mass Spectrometry. Molecules 2024, 29, 5246. [Google Scholar] [CrossRef] [Scilit] [PubMed]
- de Souza, L.M.; Dartora, N.; Scoparo, C.T.; Gorin, P.A.J.; Iacomini, M.; Sassaki, G.L. Differentiation of Flavonol Glucoside and Galactoside Isomers Combining Chemical Isopropylidenation with Liquid Chromatography–Mass Spectrometry Analysis. J. Chromatogr. A 2016, 1447, 64–71. [Google Scholar] [CrossRef] [Scilit] [PubMed]
- Kim, B.-G.; Sung, S.H.; Chong, Y.; Lim, Y.; Ahn, J.-H. Plant Flavonoid O-Methyltransferases: Substrate Specificity and Application. J. Plant Biol. 2010, 53, 321–329. [Google Scholar] [CrossRef] [Scilit]
- Ventura, G.; Calvano, C.D.; Bianco, G.; Di Capua, A.; Losito, I.; Cataldi, T.R.I. Discovering the Ellagitannin Landscape of Dried Walnut Shells by Liquid Chromatography with Tandem Mass Spectrometry. J. Agric. Food Chem. 2024, 72, 19051–19060. [Google Scholar] [CrossRef] [Scilit] [PubMed]
- Jiang, Z.H.; Hirose, Y.; Iwata, H.; Sakamoto, S.; Tanaka, T.; Kouno, I. Caffeoyl, Coumaroyl, Galloyl, and Hexahydroxydiphenoyl Glucoses from Balanophora japonica. Chem. Pharm. Bull. 2001, 49, 887–892. [Google Scholar] [CrossRef] [Scilit] [PubMed]
- Nielsen, A.H.; Olsen, C.E.; Møller, B.L. Flavonoids in Flowers of 16 Kalanchoë blossfeldiana Varieties. Phytochemistry 2005, 66, 2829–2835. [Google Scholar] [CrossRef] [Scilit] [PubMed]
- Ainsworth, E.A.; Gillespie, K.M. Estimation of Total Phenolic Content and Other Oxidation Substrates in Plant Tissues Using Folin-Ciocalteu Reagent. Nat. Protoc. 2007, 2, 875–877. [Google Scholar] [CrossRef] [Scilit] [PubMed]
- Horozić, E.; Kolarević, L.; Bajić, M.; Alić, L.; Babić, S.; Ahmetašević, E. Comparative Study of Antioxidant Capacity, Polyphenol and Flavonoid Content of Water, Ethanol and Water-Ethanol Hibiscus Extracts. Eur. J. Adv. Chem. Res. 2023, 4, 13–16. [Google Scholar] [CrossRef] [Scilit]
Disclaimer/Publisher’s Note: The statements, opinions and data contained in all publications are solely those of the individual author(s) and contributor(s) and not of MDPI and/or the editor(s). MDPI and/or the editor(s) disclaim responsibility for any injury to people or property resulting from any ideas, methods, instructions or products referred to in the content. |
© 2026 by the authors. Licensee MDPI, Basel, Switzerland. This article is an open access article distributed under the terms and conditions of the Creative Commons Attribution (CC BY) license.