


Abstract
Powder X-ray diffraction (XRD) was used to determine the crystal structure of sodium chloride (NaCl) powder and to evaluate the accuracy with which a simple laboratory diffraction dataset can recover the crystallographic parameters of a well-known ionic solid. The diffraction profile collected over the angular interval 20° ≤ 2θ ≤ 90° contains nine indexed reflections at approximately 27.4°, 31.7°, 45.5°, 53.9°, 56.5°, 66.3°, 73.1°, 75.4°, and 84.1°. The sequence of squared-sine ratios, when referenced to the first reflection, is consistent with the allowed reflections of a face-centered cubic lattice. The observed indexing sequence is assigned to the (111), (200), (220), (311), (222), (400), (331), (420), and (422) reflections of the rock-salt structure. From Bragg analysis and the cubic interplanar-spacing relation, the average lattice parameter was determined as a = 5.642 ± 0.004 Å, in excellent agreement with the accepted value of approximately 5.640 Å for NaCl at ambient conditions. Peak broadening was further used to estimate an apparent Scherrer crystallite size of about 41.6 nm. This value should be interpreted as an XRD coherence length rather than as a direct particle size, because instrumental broadening and microstrain were not independently deconvoluted. A structure-factor and Lorentz–polarization analysis was used to rationalize the intensity hierarchy of the diffraction peaks and to explain why odd allowed reflections are weak but observable in NaCl owing to the difference between the Na+ and Cl− scattering factors. The contribution of this work is methodological and educational: it reconstructs a transparent workflow connecting peak fitting, indexing, lattice-constant evaluation, crystallite-size estimation, and intensity interpretation within one coherent analysis. The incorporation of data-driven whole-pattern analysis significantly enhances structural validation, providing improved accuracy in lattice-parameter determination and a more reliable interpretation of crystallite size and microstrain effects.
1. Introduction
Determining the structure of a crystalline solid from its diffraction pattern is one of the central operations in materials physics, solid-state chemistry, crystallography, and powder characterization. X-ray diffraction is especially powerful because the wavelength of commonly used laboratory X-rays is comparable to interatomic distances in solids. X-ray diffraction is especially powerful because the wavelength of commonly used laboratory X-rays is comparable to the characteristic interatomic and interplanar spacings in crystals. This wavelength matching is essential for diffraction: when the wavelength is of the same order as the periodic separation of scattering centers, waves scattered from successive lattice planes can interfere constructively at well-defined angles. If the wavelength were much larger than the lattice spacing, the atomic periodicity would not be resolved; if it were much smaller, the diffraction geometry would be less directly matched to the crystallographic length scale. For Cu Kα radiation, λ is approximately 1.54 Å, which is comparable to the angstrom-scale d-spacings of common crystalline solids. Consequently, the crystal behaves as a three-dimensional diffraction grating, and the observed diffraction angles can be related to interplanar spacings through Bragg’s law, 2d sinθ = nλ. This is the physical basis for using XRD peak positions to determine the unit-cell geometry and lattice parameter. As a result, a periodic arrangement of atoms behaves as a three-dimensional diffraction grating, and the angular positions of the diffracted beams encode the geometry of the unit cell. The intensities and shapes of the diffraction peaks add further information on the distribution of atoms within the unit cell, the finite coherence length of the crystalline domains, microstrain, preferred orientation, and instrumental effects [1,2,3,4,5].
Sodium chloride is an ideal reference material for introducing structure determination by powder XRD. It possesses the rock-salt structure, which can be described as two interpenetrating face-centered cubic sublattices displaced with respect to each other. In a conventional description, Cl− ions occupy fcc lattice positions and Na+ ions occupy the octahedral holes, although the origin can be shifted so that the two assignments are interchanged. Each ion is six-fold coordinated by counterions, giving the well-known octahedral local environment of the B1 structure type. The space group is Fm-3m, No. 225, and the room-temperature lattice parameter is close to 5.640 Å [6,7,8].
The present work uses NaCl powder not as an unknown material in the strict sense, but as a controlled validation system. Because the expected structure is known, each step of the analysis can be tested: peak fitting, Bragg d-spacing calculation, cubic indexing, lattice-constant extraction, crystallite-size estimation, and structure-factor-based interpretation of intensities. This makes the experiment pedagogically useful and scientifically instructive. Modern powder diffraction has moved far beyond simple peak indexing. Classical indexing algorithms and modern powder-pattern analysis tools have also played an important role in transforming powder XRD from manual peak assignment into a more systematic workflow for unit-cell search, profile inspection, visualization, and educational interpretation [8,9,10,11,12,13,14,15]. Rietveld refinement allows entire diffraction patterns to be modeled by simultaneously refining structural, instrumental, microstructural, and background parameters [9,12]. More recent work has introduced automated and data-driven approaches for crystal-structure solution from powder diffraction patterns [13]. Nevertheless, the classical sequence of Bragg law analysis, indexing, and structure-factor reasoning remains foundational. A researcher who cannot interpret a simple NaCl powder pattern by hand will have difficulty judging the reliability of a more automated refinement.
The central objective of this paper is to present a publication-style analysis of a NaCl powder XRD dataset. The rock-salt structure of NaCl is well established, and this manuscript does not claim to discover a new structure. Instead, NaCl is used as a controlled validation material to reconstruct a transparent laboratory powder XRD workflow, including peak-profile fitting, Bragg d-spacing calculation, fcc indexing, uncertainty-aware lattice-parameter extraction, Scherrer and Williamson–Hall line-broadening interpretation, structure-factor and Lorentz–polarization intensity analysis, and whole-pattern residual inspection. The analysis emphasizes the hierarchy of reliability among peak positions, peak widths, and relative intensities, thereby providing a critical bridge between classical powder diffraction instruction and publication-level crystallographic interpretation.
Several previous studies and crystallography texts have used NaCl as a standard rock-salt material for demonstrating Bragg diffraction, face-centered cubic indexing, and lattice-parameter determination. The present work is similar to these studies in that it uses the well-known NaCl structure as a reference system and applies the established sequence of peak-position analysis, d-spacing calculation, and fcc reflection assignment. However, the objective and scope of the present manuscript are broader than a simple phase-identification exercise. Here, NaCl is used as a controlled validation material to reconstruct the complete reasoning chain of laboratory powder XRD analysis, including peak-profile fitting, squared-sine indexing, uncertainty-aware lattice-parameter extraction, Scherrer and Williamson–Hall line-broadening interpretation, structure-factor and Lorentz–polarization intensity analysis, and whole-pattern residual inspection. In this respect, the manuscript differs from previous introductory treatments that typically focus on only one or two of these steps, and it also differs from advanced Rietveld-focused studies by deliberately showing how much crystallographic information can be obtained from a transparent peak-by-peak workflow before applying full refinement. Therefore, the contribution of this work is methodological and educational rather than the discovery of a new NaCl structure; it provides a critical bridge between classical powder diffraction instruction and publication-level structural interpretation.
The present study uses NaCl as a controlled reference system to establish a transparent and uncertainty-aware workflow for laboratory powder XRD analysis. Rather than claiming the discovery of a new NaCl structure, the work integrates peak-profile fitting, Bragg law conversion, fcc indexing, lattice-parameter determination, Scherrer and Williamson–Hall line-broadening analysis, structure-factor and Lorentz–polarization intensity interpretation, and whole-pattern residual inspection. Its methodological contribution is to demonstrate, within a single experimentally grounded framework, which diffraction outputs are comparatively robust, particularly peak positions and the derived lattice parameter and which are more sensitive to instrumental and specimen-dependent effects, including peak widths and relative intensities. The study therefore connects classical crystallographic analysis with the critical interpretation required for publication-level powder diffraction research.
2. Scientific Background and Literature Context
2.1. Powder Diffraction as a Structural Fingerprint
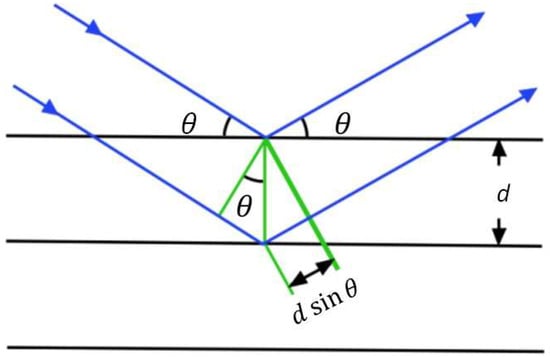
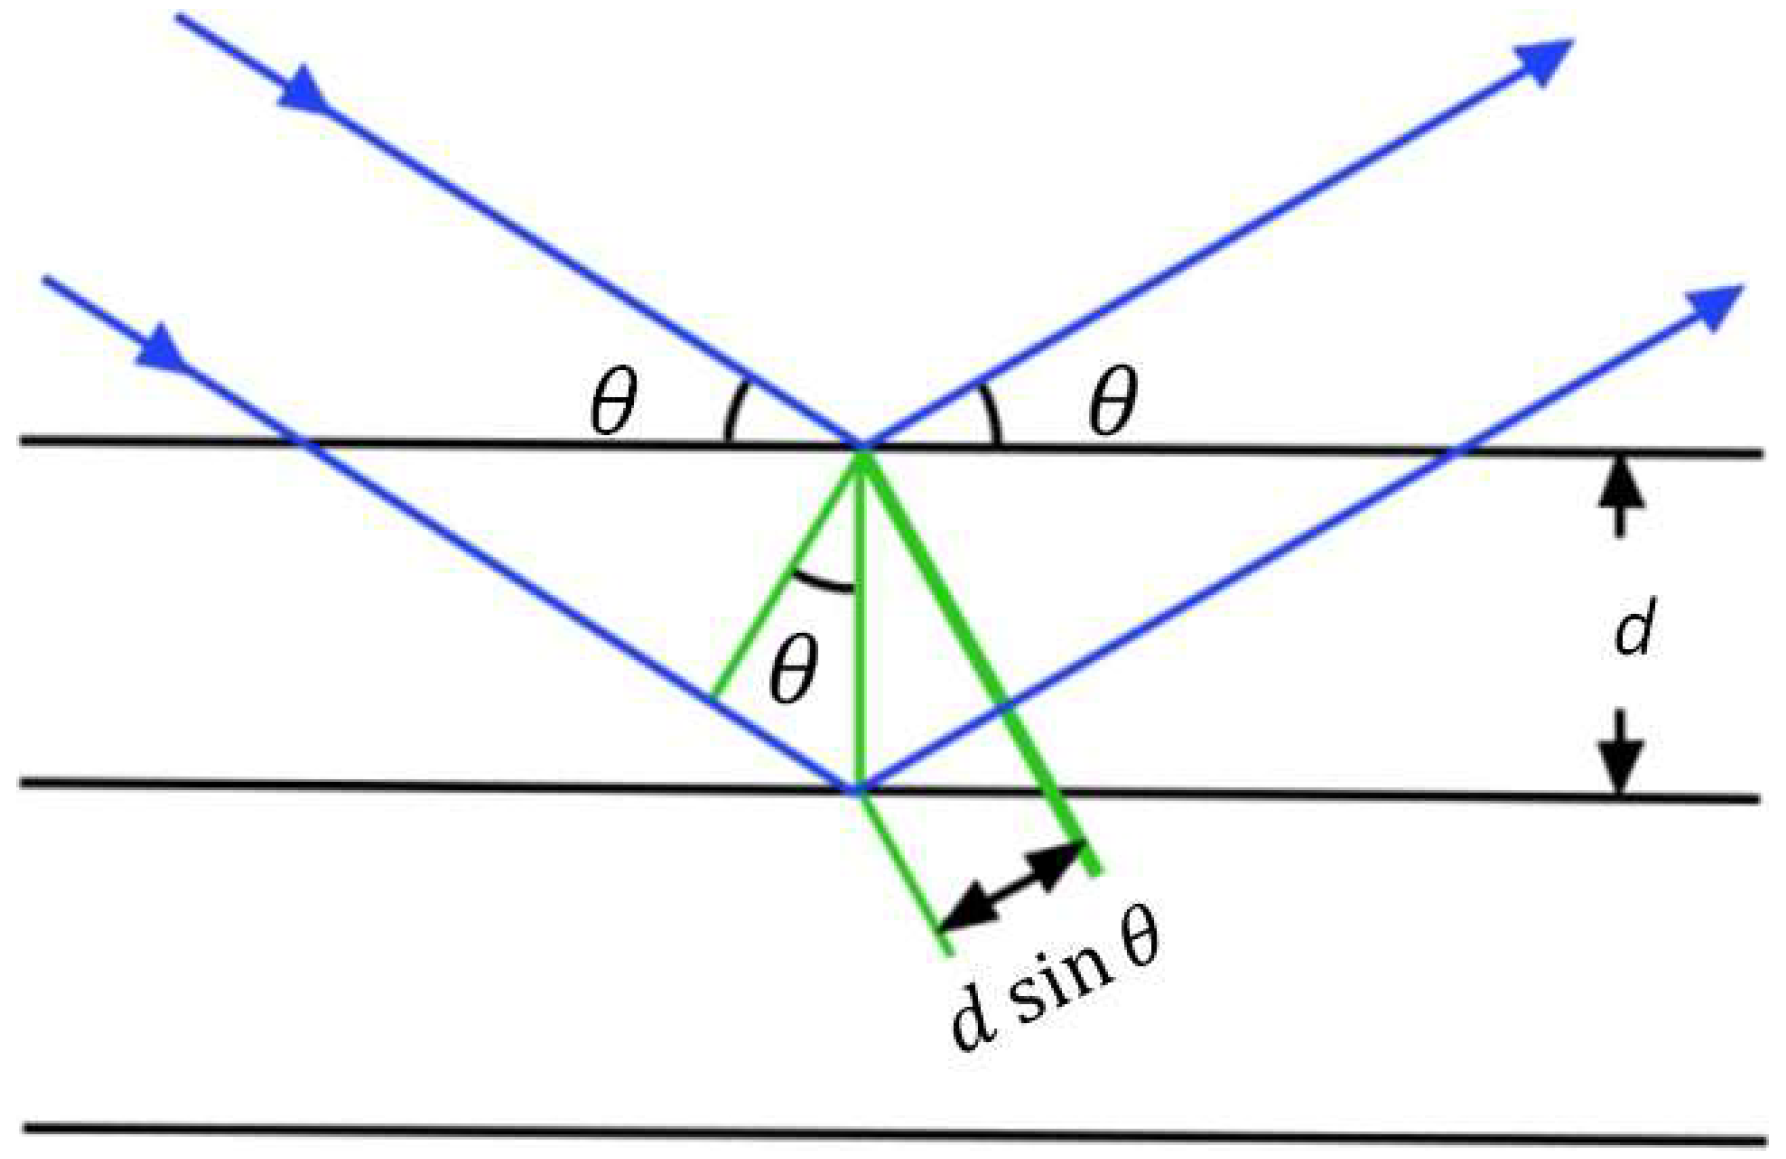
Powder diffraction differs from single-crystal diffraction in that the specimen contains a large number of randomly oriented crystallites. For a given set of lattice planes {hkl}, some crystallites will always satisfy the Bragg condition. Instead of observing discrete spots in reciprocal space, a powder diffractometer records rings or their one-dimensional projection as intensity versus 2θ. Each peak position corresponds to an interplanar spacing, while each relative intensity depends on the multiplicity of the plane family, atomic scattering factors, the structure factor, angular corrections, thermal factors, absorption, texture, and instrumental geometry (Figure 1) [3,13,14,15,16,17].
Figure 1.
Schematic illustration of the Bragg construction for X-ray diffraction from parallel lattice planes. The incident X-ray wave is coherently scattered by the periodic electron-density distribution of the crystal. Constructive interference occurs when the additional path difference between waves scattered from adjacent planes equals an integer multiple of the wavelength, nλ. The geometry shows the lattice-plane spacing d, the Bragg angle θ, and the path-difference contribution 2d sinθ, leading to Bragg’s law, 2d sinθ = nλ [10].
The positions of the peaks are usually the most robust part of a simple laboratory experiment. If the wavelength is known and sample displacement is small, peak positions can be used to determine d-spacings and lattice constants with high precision. Although laboratory XRD does not provide direct real-space imaging with high spatial resolution, its sensitivity to lattice spacing is exceptionally high because interplanar distances are obtained from diffraction angles through Bragg’s law. This sensitivity is largely independent of the macroscopic beam size: the beam may illuminate a relatively large specimen area, but the measured peak position still reflects the average periodic spacing of the diffracting lattice planes within the illuminated volume. Consequently, when the wavelength calibration, specimen alignment, and peak fitting are reliable, XRD can determine d-spacings and lattice parameters with sub-angstrom sensitivity, which is typically more precise than direct measurement of interplanar distances by many routine microscopy-based methods. Here, small sample displacement means that the powder surface is sufficiently close to the diffractometer reference plane that any specimen-height error produces only a minor 2θ shift relative to the peak-position uncertainty. In Bragg–Brentano geometry, a vertical displacement of the specimen from the focusing plane can systematically shift the measured peak positions and thereby bias the calculated d-spacings and lattice parameter. The narrow scatter of the peak-by-peak lattice parameters in the present NaCl dataset suggests that such displacement-related errors are limited, although a more rigorous analysis would evaluate them using an internal standard, calibrated reference material, or zero-shift/specimen-height correction in whole-pattern refinement.
NaCl has historically been used as a standard example because its diffraction pattern combines simplicity with important crystallographic lessons. Its fcc Bravais lattice imposes systematic absences for mixed-parity {hkl} values. At the same time, the NaCl basis contains two chemically different ions, so the structure factor distinguishes even and odd allowed reflections. Reflections for which h, k, and l are all even are controlled by the sum of the two form factors, whereas reflections for which they are all odd are controlled by their difference.
2.2. Rock-Salt Structure of NaCl
The rock-salt structure can be described using an fcc lattice with a two-ion basis. A convenient origin places Cl− at (0, 0, 0) and Na+ at (1/2, 1/2, 1/2) in fractional coordinates. The conventional cubic cell contains four formula units, Z = 4. Each Na+ ion is surrounded by six Cl− ions at the vertices of an octahedron, and each Cl− ion has the same local counterion coordination. This symmetrical arrangement is responsible for the high structural simplicity of halite and makes the material a benchmark for powder XRD indexing [17,18,19].
Because the structure is cubic, the interplanar spacing is related to the lattice constant by a simple algebraic expression. This is the key reason why the lattice parameter can be recovered from a small number of peak positions without needing a full structural refinement. If all indexed peaks give approximately the same value of a, the indexing is internally consistent. If the values drift systematically with angle, sample displacement, zero-shift, or transparency errors may be present.
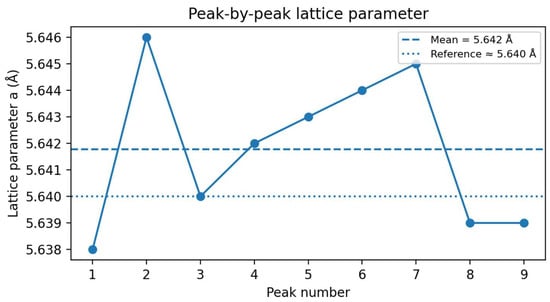
In the present analysis, the extracted values range only from 5.638 to 5.646 Å, producing an average of 5.642 Å. This narrow spread is a strong sign that the peak positions, wavelength assignment, and {hkl} indexing are mutually consistent.
3. Theoretical Framework
3.1. Bragg Law and D-Spacing
Constructive interference occurs when the path difference between X-rays coherently scattered by the periodic electron-density distribution associated with adjacent lattice planes is an integer multiple of the wavelength. In this sense, Bragg’s law provides a geometrical representation of coherent elastic scattering from the crystal lattice, rather than a literal mirror-like reflection from atomic planes [1,2,3,4,5,20].
2 dhkl sinθ = nλ
Here dhkl is the spacing between the {hkl} planes, θ is the Bragg angle, n is the reflection order, and λ is the X-ray wavelength. For ordinary powder XRD analysis, the first-order condition n = 1 is normally used, so each observed 2θ value can be converted into a d-spacing:
dhkl = λ/(2 sinθ)
The experiment used an average X-ray wavelength close to λ = 1.542 Å, consistent with Cu Kα radiation. The uncertainty in d-spacing is dominated by uncertainty in the fitted peak center and any systematic zero-shift or sample-displacement error.
The geometrical origin of Bragg’s law is illustrated schematically in Figure 1, where constructive interference occurs when the additional path difference between waves scattered from adjacent lattice planes equals an integer multiple of the wavelength. The caption was also revised to explain d, θ, and the path difference 2d sin(θ).
3.2. Cubic Indexing Relation
For a cubic structure, the interplanar spacing is related to the lattice parameter by:
1/(dhkl)2 = (h2 + k2 + l2)/a2
Combining Equation (2) with Equation (3) gives the useful indexing relation:
4 sin2θ/λ2 = (h2 + k2 + l2)/a2
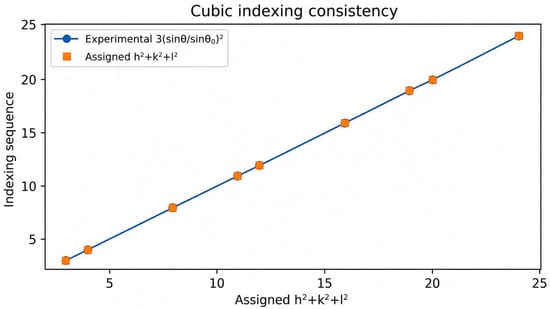
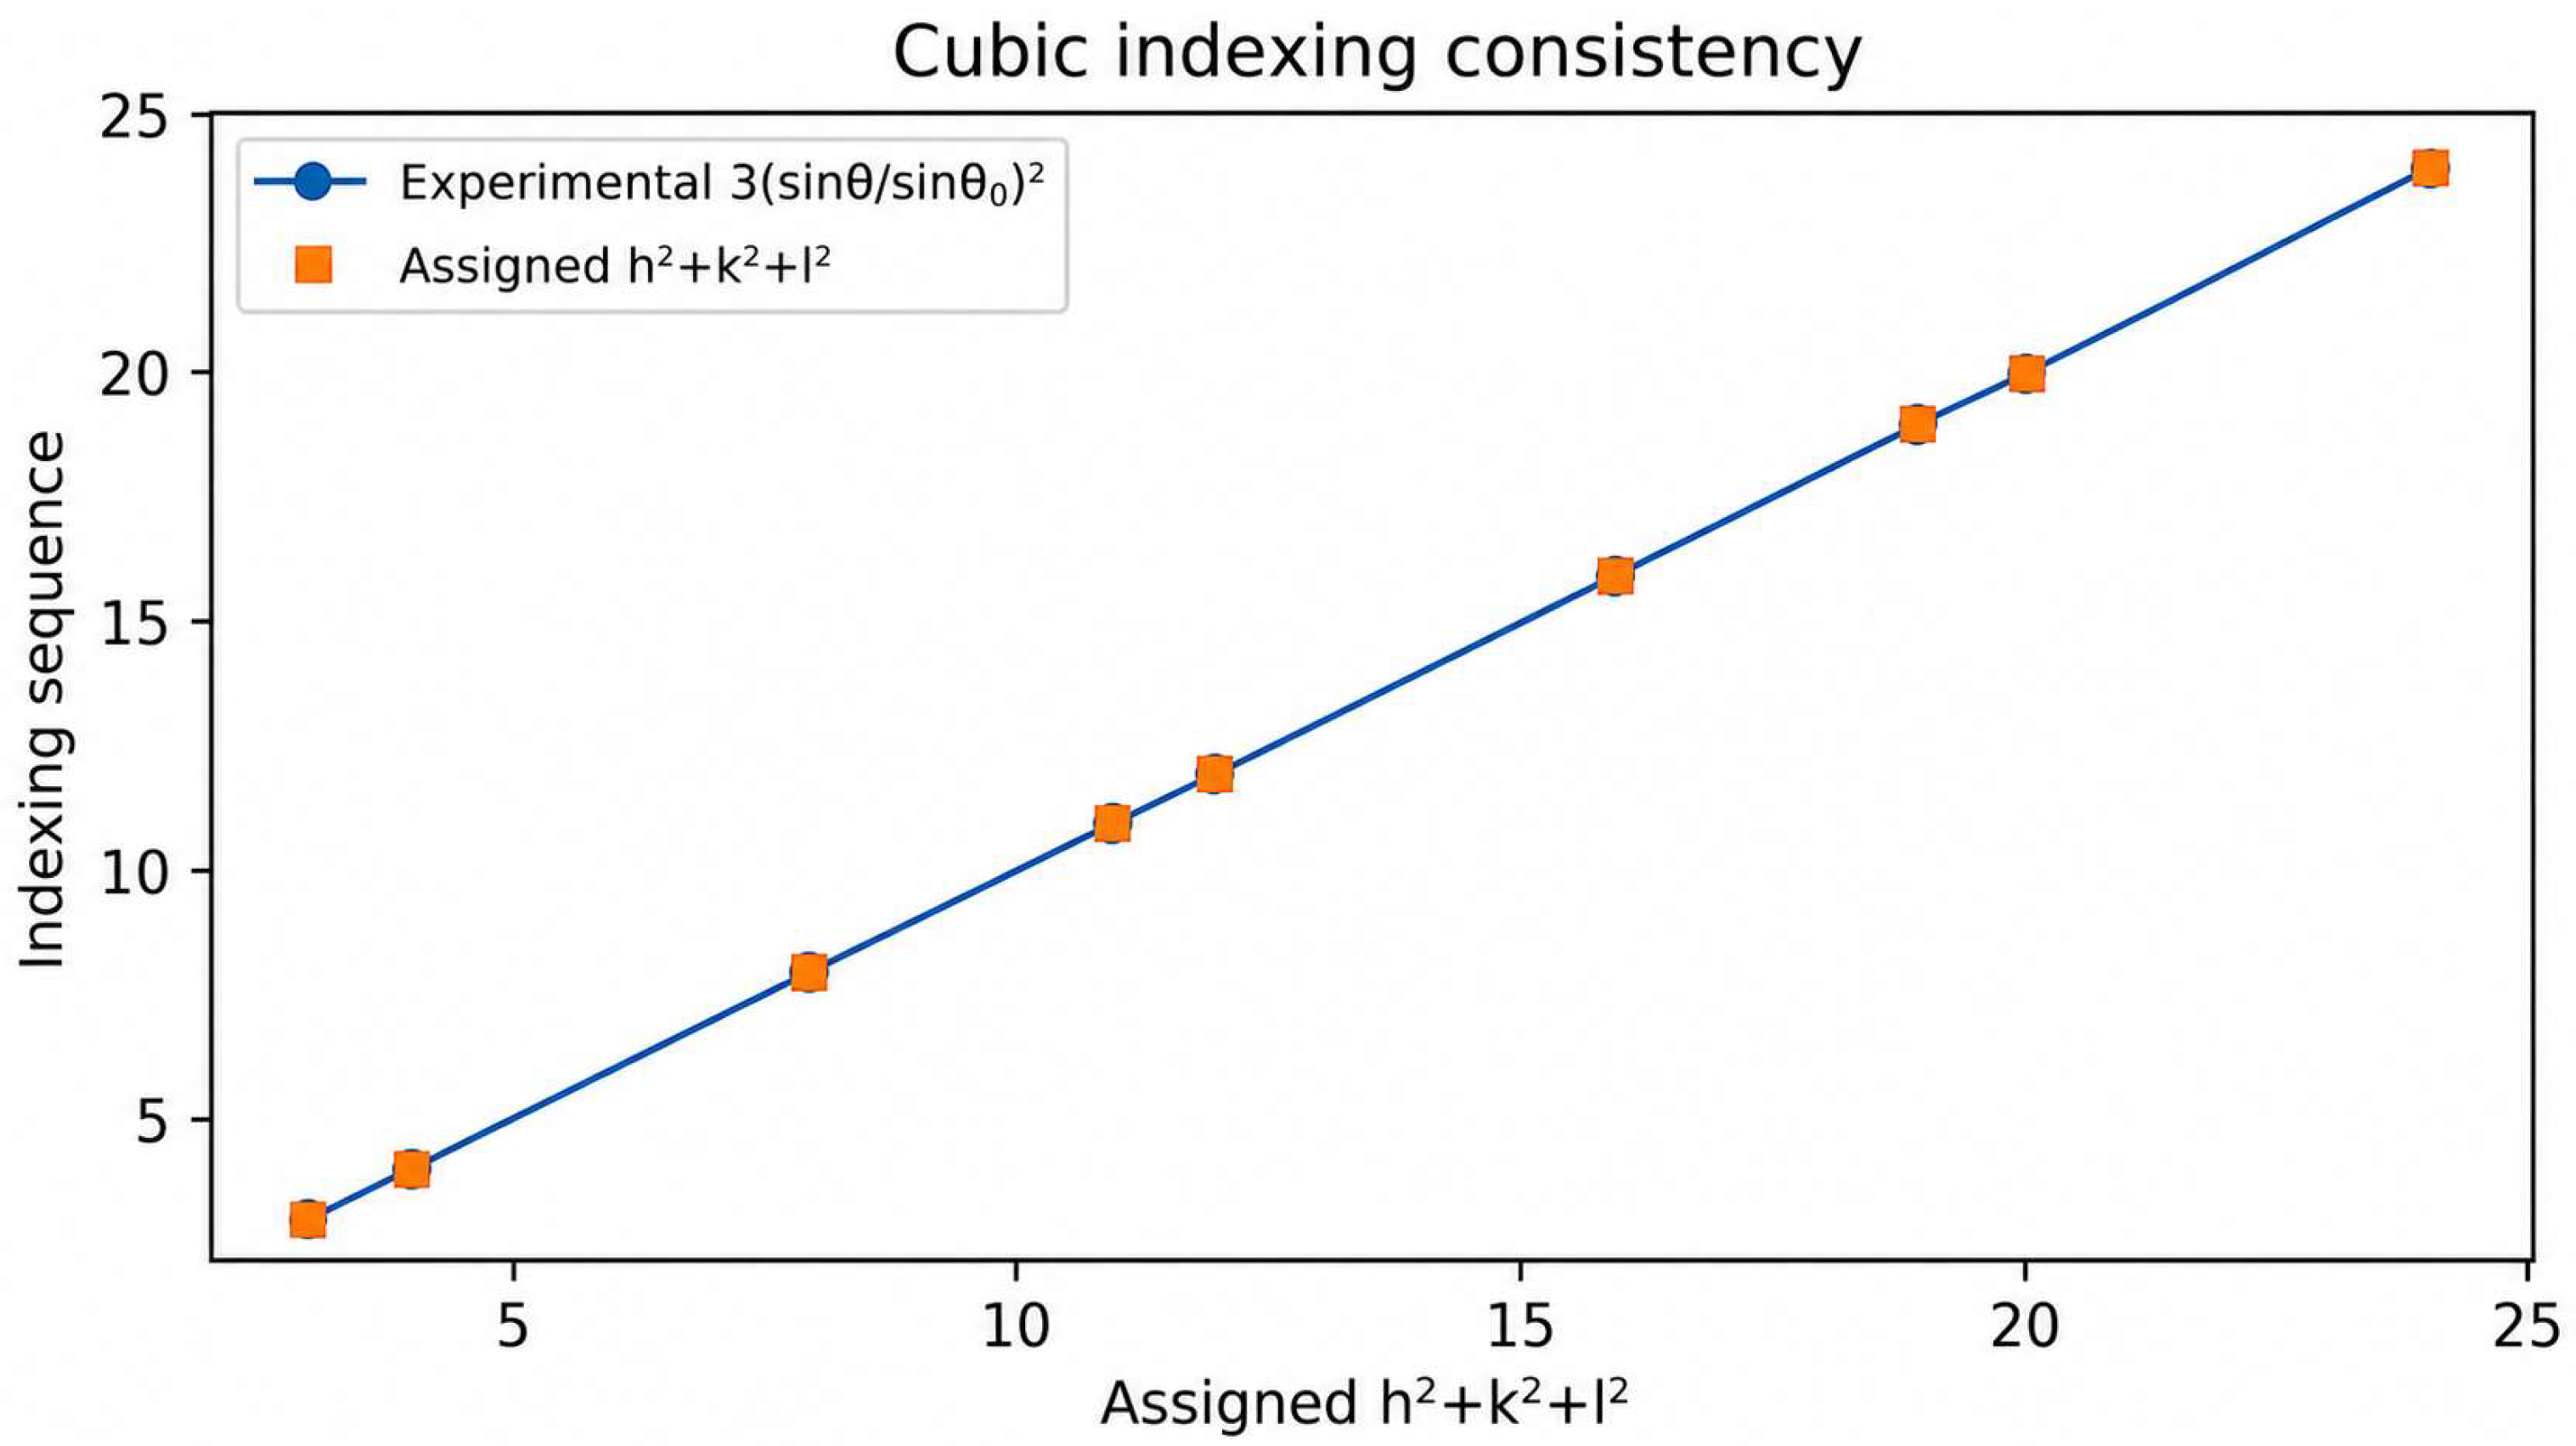
If the first observed peak is used as a reference, the ratios of sin2θ should be proportional to the ratios of h2 + k2 + l2. In the present dataset, the sequence is consistent with the fcc allowed values 3, 4, 8, 11, 12, 16, 19, 20, and 24, corresponding to (111), (200), (220), (311), (222), (400), (331), (420), and (422) [21,22,23,24,25].
3.3. Selection Rules and Structure Factor
The selection rule for a face-centered cubic lattice can be derived directly from the lattice contribution to the structure factor. The conventional fcc cell contains equivalent lattice points at (0,0,0), (0,1/2,1/2), (1/2,0,1/2), and (1/2,1/2,0). Therefore, the fcc lattice factor is
or equivalently,
Lfcc = 1 + exp[iπ(k + l)] + exp[iπ(h + l)] + exp[iπ(h + k)]
Lfcc = 1 + (−1)(k+l) + (−1)(h+l) + (−1)(h+k)
Here, h, k, and l are the Miller indices of the reflection under consideration. The combinations k + l, h + l, and h + k are integer sums that enter the phase factors of the translated fcc lattice points relative to the origin. If h, k, and l are all even, all exponent terms are +1 and Lfcc = 4. If h, k, and l are all odd, the sums h + k, h + l, and k + l are also even, so again Lfcc = 4. However, if h, k, and l have mixed parity, two of the phase factors are −1, and the total sum cancels, giving Lfcc = 0. Thus, diffraction from an fcc lattice is allowed only when h, k, and l are either all even or all odd, while mixed-parity reflections are systematically absent.
For NaCl, the fcc lattice is combined with a two-ion basis. Taking Cl− at (0,0,0) and Na+ at (1/2,1/2,1/2), the structure factor can be written as:
Fhkl = Lfcc [fCl + fNa exp(iπ(h + k + l))]
In this expression, fCl and fNa are the atomic X-ray scattering factors of chlorine and sodium, respectively, at the corresponding scattering angle or scattering-vector magnitude. The fcc lattice factor first imposes the all-even/all-odd selection rule. For the allowed reflections, the basis term then determines the relative intensity. When h, k, and l are all even, h + k + l is even and Fhkl = 4(fCl + fNa). When h, k, and l are all odd, h + k + l is odd and Fhkl = 4(fCl − fNa). Therefore, odd allowed reflections are not forbidden in NaCl; they are weak because they depend on the difference between the chlorine and sodium scattering factors, whereas even reflections depend on their sum.
The same procedure can be used to retrieve selection rules for other symmetries. In general, the structure factor is written as Fhkl = Σj fj exp [2πi(hxj + kyj + lzj)], where the sum extends over the atoms or symmetry-equivalent lattice points in the unit cell. Systematic absences occur when the phase terms cancel exactly for particular hkl combinations. Selection rules are therefore a direct consequence of translational symmetry and phase interference, rather than empirical indexing conventions [26].
3.4. Crystallite-Size Estimation from Peak Broadening
Diffraction-peak broadening may arise from finite coherent-domain size, microstrain, instrumental response, and the selected profile function. The Scherrer equation provides a first-order estimate of the coherent diffracting-domain length [27]:
D = Kλ/(β cosθ)
Here, D is the apparent coherent-domain length, λ is the X-ray wavelength, β is the full width at half maximum in radians after broadening correction, θ is the Bragg angle, and K is the shape factor. A conventional value of K = 0.9 was adopted for approximately equiaxed domains analyzed using FWHM-type peak widths. Because D scales linearly with K and is derived from line breadth rather than direct imaging, it should not be interpreted as the external NaCl particle diameter.
For Gaussian-type profiles, the sample contribution may be estimated as βsample = (βobs2 − βinst2)1/2, where βobs and βinst are the observed and instrumental widths, respectively. Ideally, the instrumental width should be measured using a strain-free standard, such as Si or LaB6, under identical instrumental conditions. In the present dataset, a representative instrumental contribution was used only to assess sensitivity. Consequently, narrow weak reflections, particularly (331), become highly dependent on the assumed instrumental width.
The reported values are therefore described as apparent Scherrer coherence lengths. Their accuracy is limited by the peak-profile model, background selection, shape factor, unresolved Cu Kα1/Kα2 contributions, microstrain, instrumental correction, and fitting uncertainty. A more rigorous separation of size and strain contributions would require a standard-based instrumental profile together with Williamson–Hall or Rietveld line-profile analysis [10,11,12].
3.5. Lorentz–Polarization Correction and Relative Intensities
The calculated relative intensity of a powder reflection can be approximated as a product of multiplicity, structure-factor magnitude, and angular correction terms:
Here mhkl is the multiplicity of the plane family, Fhkl is the structure factor, and LP(θ) is the Lorentz–polarization factor. The Lorentz–polarization factor represents the angular correction required when calculated powder diffraction intensities are compared with measured intensities. The Lorentz part arises from the geometry of the diffraction experiment: during a 2θ scan, different reflections remain in the Bragg-diffracting condition over different angular intervals, so the recorded intensity depends not only on the intrinsic scattering strength of the {hkl} planes but also on the scanning geometry. The polarization part accounts for the fact that X-rays are electromagnetic waves and are scattered by the electron clouds of atoms with an angular dependence related to the orientation of the electric-field vector relative to the scattering direction. Thus, the Lorentz–polarization factor is not an arbitrary fitting parameter; it describes how the measured intensity is modified by diffraction geometry and X-ray polarization. In the present work, this correction is used to place the structure-factor-based intensity calculation on a physically meaningful comparative scale, while recognizing that a complete refinement would require instrument-specific intensity corrections. One commonly used form for the angular factor in laboratory powder geometry is [28]:
LP(θ) = [1 + cos2(2θ)]/[sin2θ cosθ]
The relative intensities calculated from Equation (9) are idealized. The measured intensities can deviate strongly if the powder is not randomly oriented, if the sample thickness or packing is non-uniform, or if profile fitting and background subtraction introduce systematic errors [27,28].
4. Methodology and Data-Analysis Protocol
Commercially available ACS-reagent-grade sodium chloride powder (NaCl, ≥99.0% purity) was used as the reference crystalline material. Before XRD mounting, the NaCl was gently hand-ground in an agate mortar and pestle for approximately 5 min to break up large crystals/agglomerates and obtain a more visually uniform free-flowing powder suitable for laboratory powder XRD analysis. No high-energy milling, chemical treatment, sieving, or particle-size classification was applied. Therefore, the grinding procedure should be regarded as a mild homogenization step rather than a controlled particle-size-reduction process. The powder was then spread as a thin and visually uniform layer onto double-sided adhesive tape fixed to a flat sample holder. Because the powder was not size-classified, possible effects of non-uniform spreading, surface-height mismatch, and partial preferred orientation were considered when interpreting relative intensities and fitted peak widths.
Powder X-ray diffraction measurements were performed using a laboratory powder X-ray diffractometer equipped with a Cu Kα X-ray source. The average wavelength used in the analysis was λ = 1.542 Å, consistent with Cu Kα radiation. The diffraction pattern was collected in conventional 2θ/θ scanning mode using continuous scanning over the angular range of 20° ≤ 2θ ≤ 90°, with a step size of 0.02°. The X-ray tube was operated at 40 kV and 40 mA. The instrumental configuration included a divergence slit of 1/2°, a divergence height-limiting slit of 10 mm, a scattering slit of 1/2°, a receiving slit of 0.3 mm, and a Kβ filter to suppress unwanted Kβ radiation. NaCl powder was mounted by spreading a thin and visually uniform layer of powder onto double-sided adhesive tape. This preparation method is simple and suitable for laboratory powder XRD demonstration; however, it may introduce preferred orientation, slight specimen-height displacement, or local thickness variations if the powder layer is not perfectly random, flat, and homogeneous. These possible effects were therefore considered when interpreting relative intensities and peak broadening.
The diffraction data were processed by first extracting the peak centers, peak heights, integrated areas, and full widths at half maximum from fitted peak profiles. Gaussian and Voigt-type functions were used in IGOR Pro 8 to evaluate the sensitivity of the extracted peak positions and widths to the selected profile model. Bragg’s law was then used to convert the fitted 2θ values into interplanar spacings, and the squared-sine ratio method was applied to assign the allowed fcc reflections of the rock-salt NaCl structure. The lattice parameter was calculated independently for each indexed reflection and subsequently averaged to evaluate the internal consistency of the indexing procedure. The fitted peak widths were further used for Scherrer-type coherence-length estimation, while the measured integrated intensities were compared with idealized calculated intensities based on multiplicity, atomic scattering factors, structure factor, and Lorentz–polarization correction. In addition, the full diffraction profile was modeled by Gaussian peak components superimposed on a polynomial background to inspect the residual distribution and validate the consistency of the peak-by-peak analysis. The original XRD pattern and individual peak-fitting outputs are provided in the Supplementary Figures as Figure S1 and Figures S2–S10, respectively [21,29].
A representative schematic/photograph of the powder mounting procedure has been added to clarify the sample-preparation geometry used for the NaCl powder XRD measurement, Figure S11. The illustration shows the powder distributed as a thin layer on double-sided adhesive tape fixed to a flat sample holder. This visual addition is intended only to document the mounting configuration and improve experimental reproducibility. It should not be interpreted as a quantitative assessment of particle morphology, powder packing, or preferred orientation. As discussed in the methodology, adhesive-tape mounting is a simple and useful preparation method for laboratory powder XRD demonstration, but non-uniform powder spreading, surface-height mismatch, or partial texture can influence measured relative intensities and fitted peak widths.
5. Results
5.1. Peak Positions and Indexing
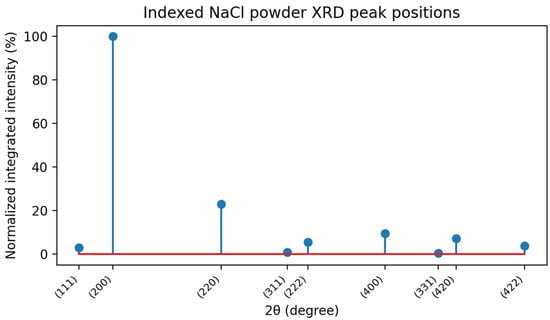
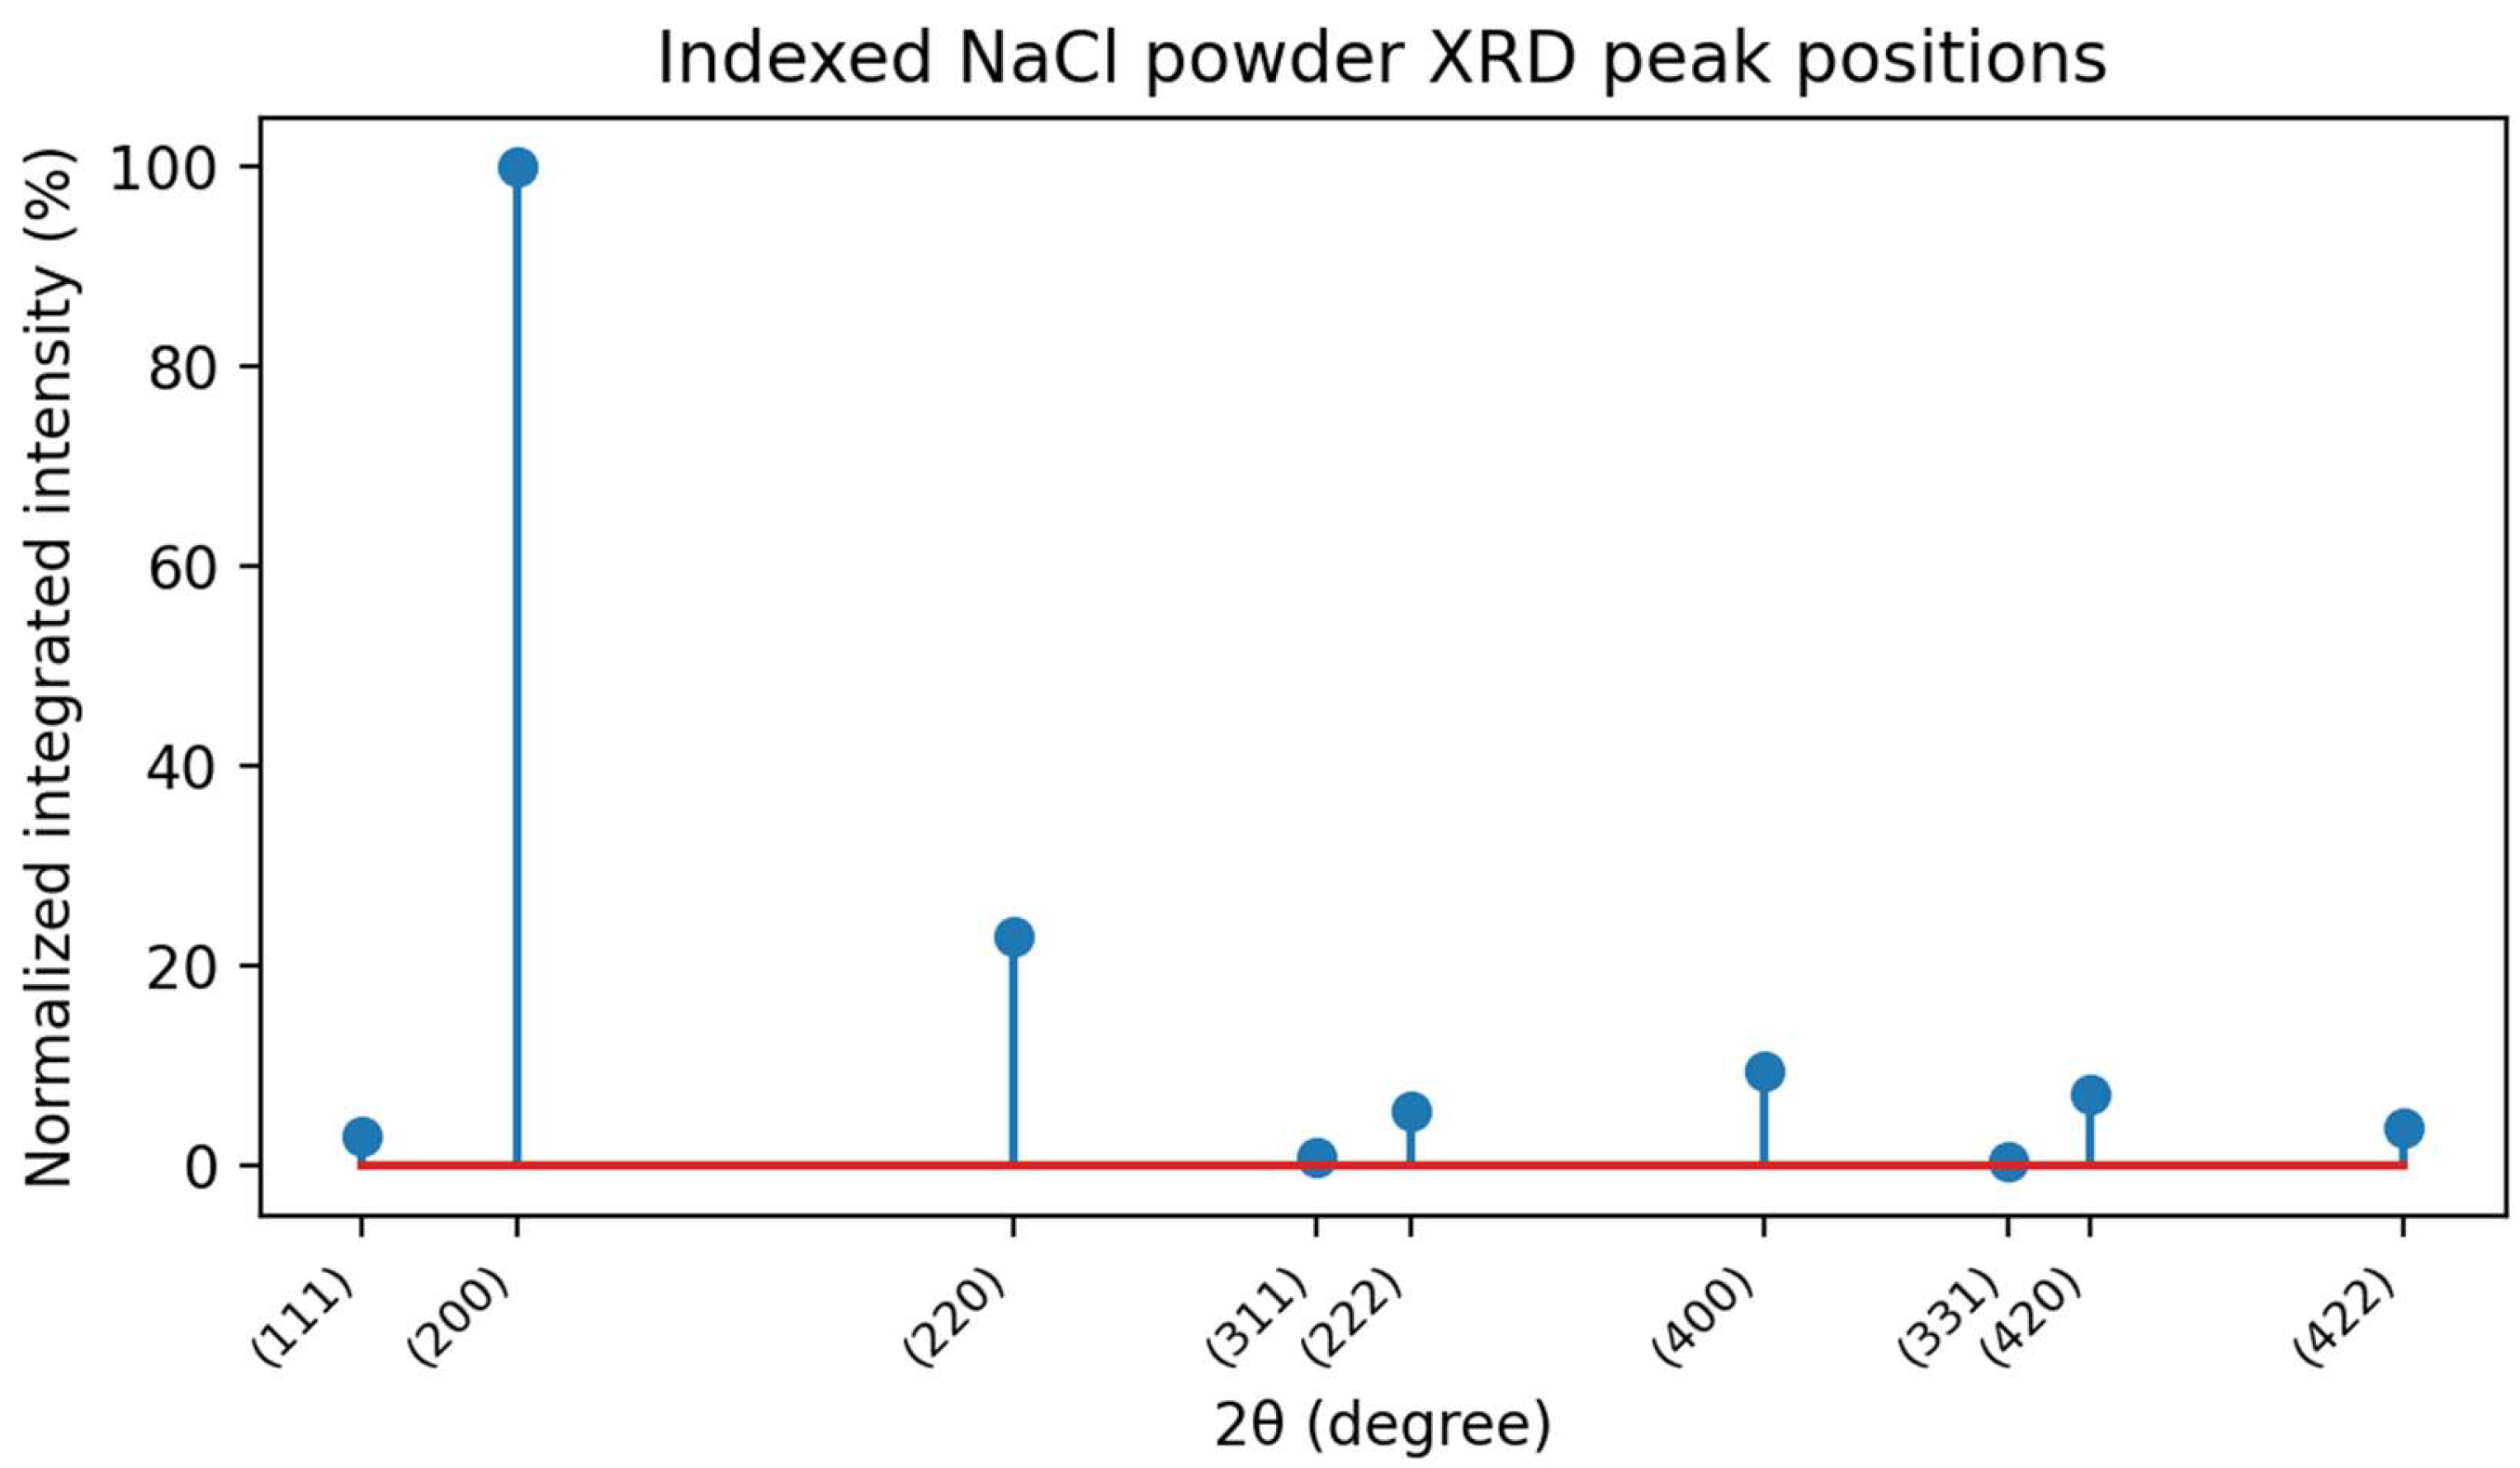
The fitted peak centers and corresponding {hkl} assignments are summarized in Table 1. θ0 denotes the Bragg angle of the first observed/reference reflection; here, the (111) peak at 2θ = 27.40°. Therefore, (sinθ/sinθ0)2 is the normalized squared-sine ratio used to compare the experimental diffraction sequence with the allowed h2 + k2 + l2 values for an fcc lattice. The observed reflections match the expected allowed sequence for an fcc lattice. The assignment begins with (111), not (100), because mixed or forbidden fcc reflections are absent. The appearance of (111), (200), (220), (311), (222), (400), (331), (420), and (422) confirms that the pattern is compatible with the rock-salt NaCl structure rather than a primitive or body-centered cubic lattice, as shown in Figure 2 and Figure 3. The complete source pattern is shown in Figure S1, while the fitted profiles of the first to ninth diffraction peaks are presented in Figures S2–S10.
Table 1.
Fitted peak positions, d-spacings, indexing ratios, and {hkl} assignments.
Figure 2.
Indexed NaCl powder XRD peak positions using normalized integrated experimental intensities. The blue markers and vertical stems represent the normalized integrated intensities of the assigned NaCl reflections. The red horizontal line indicates the zero-intensity baseline and is included only as a visual reference guide; it does not represent an additional experimental or calculated dataset.
Figure 3.
Cubic indexing consistency for NaCl powder. The blue line and markers represent the experimentally derived normalized sin2θ sequence, while the orange markers indicate the assigned fcc h2 + k2 + l2 values. The close agreement between both datasets confirms the face-centered cubic indexing sequence of the rock-salt NaCl structure. [14,15,16,17,18,29].
5.2. Lattice-Parameter Determination
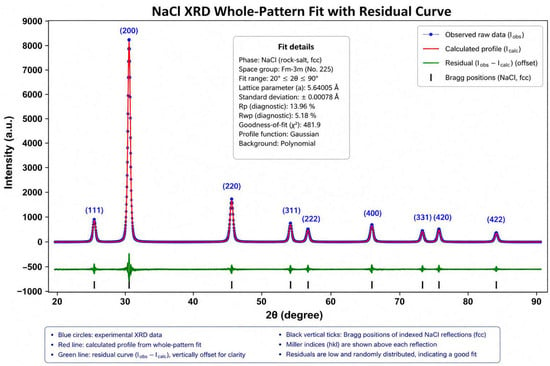
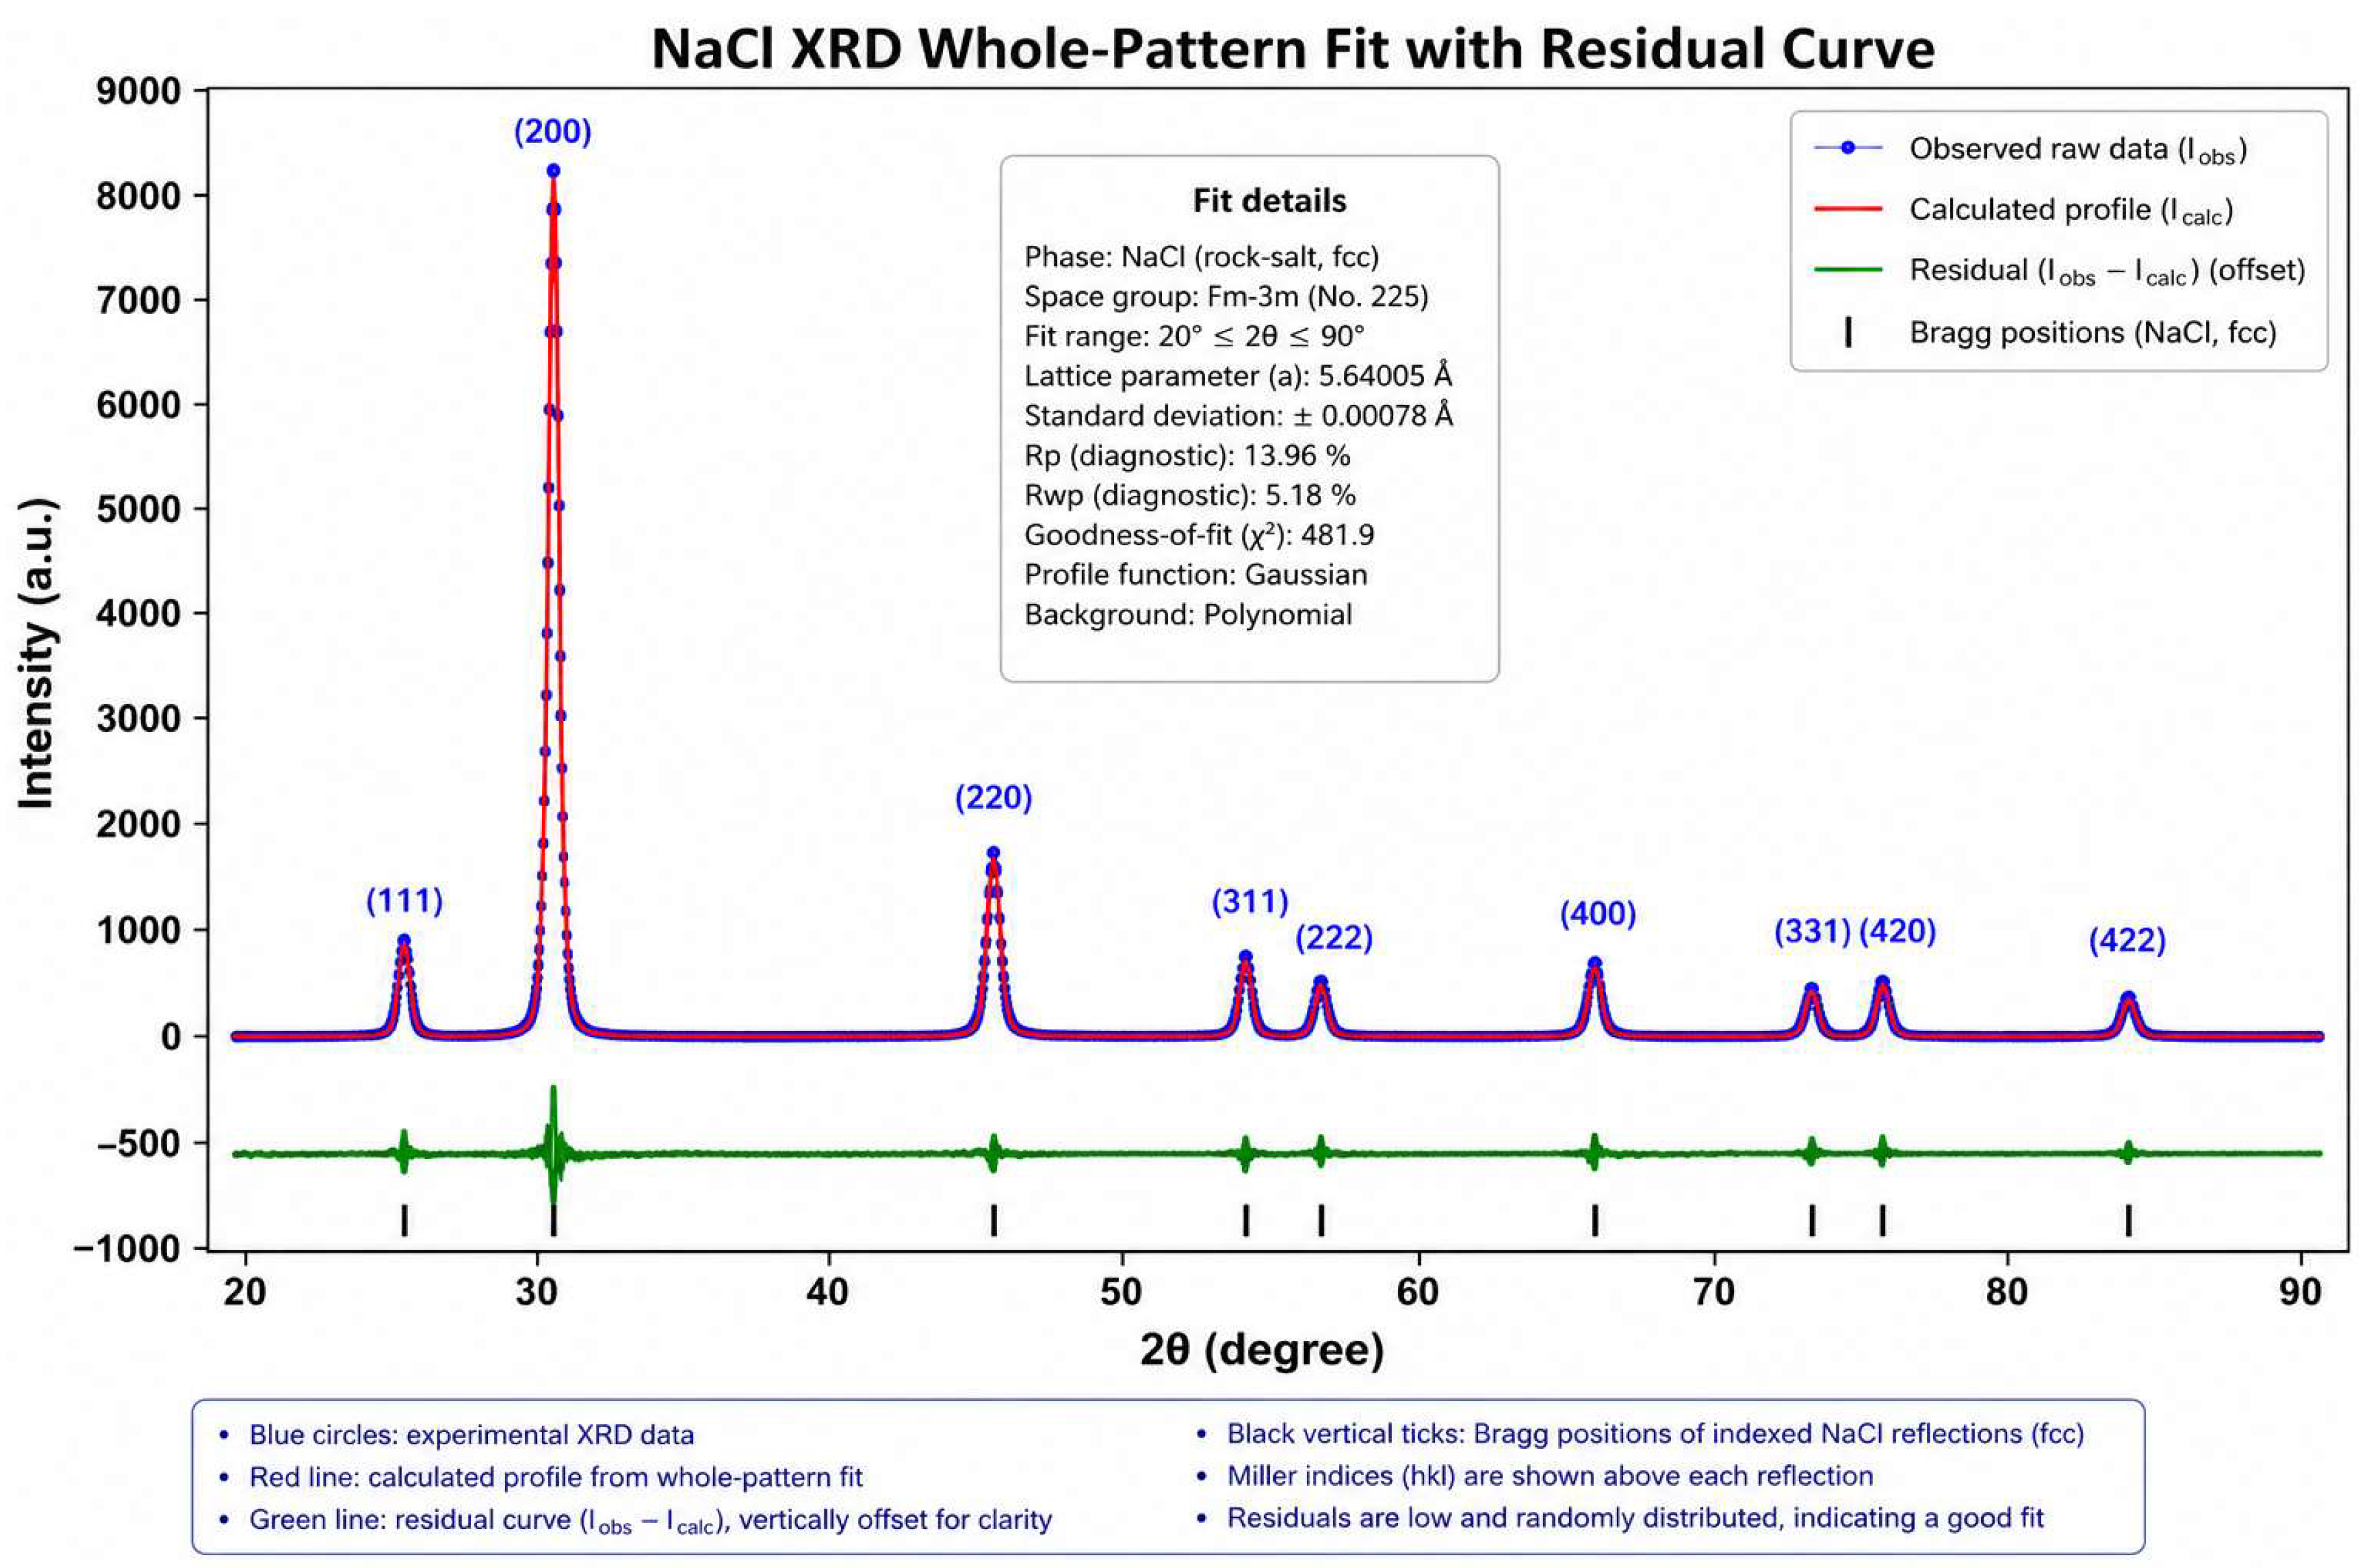
The lattice parameter was calculated using a = d(h2 + k2 + l2)1/2. The peak-by-peak values are very consistent, indicating that the fcc indexing is reliable and that systematic peak-position errors are small. The average value obtained from the nine reflections is a = 5.642 ± 0.004 Å. The complete NaCl powder diffraction profile was further examined using a whole-pattern fitting approach based on the raw experimental dataset. The diffraction pattern over the range 20° ≤ 2θ ≤ 90° was modeled using Gaussian peak components superimposed on a polynomial background. Although this treatment is not a fully constrained Rietveld refinement, it provides an additional validation of peak positions, lattice-parameter consistency, and residual distribution. The fitted profile reproduces the main experimental reflections, while the residual curve remains low over most of the diffraction range. Minor localized deviations near the strongest reflections are attributed to peak asymmetry, unresolved Cu Kα doublet contributions, preferred orientation, and simplified profile modeling. The experimental, calculated, and residual profiles are shown in Figure 4. The uncertainty quoted for the average lattice parameter was estimated from the dispersion of the lattice parameters calculated independently from the nine indexed reflections. The individual values range from 5.638 to 5.646 Å, giving a conservative half-range of ±0.004 Å around the mean value of 5.642 Å (Table 2). The corresponding sample standard deviation is approximately 0.003 Å. Therefore, the uncertainty reflects the peak-to-peak scatter caused by peak-position fitting, possible zero-shift or specimen-height effects, Kα-related profile asymmetry, and other small experimental uncertainties, rather than the formal standard error of repeated measurements. Compared with the accepted ambient value near 5.640 Å, the percentage deviation is approximately 0.035% [21,29].
Figure 4.
Experimental, calculated, and difference (residual) XRD profiles of NaCl powder obtained from whole-pattern fitting. Vertical ticks indicate the positions of the indexed fcc reflections.
Table 2.
Lattice parameter obtained independently from each indexed reflection.
The complete NaCl powder diffraction profile was further analyzed using a data-driven whole-pattern fitting approach based on the raw experimental dataset. The diffraction pattern over the range 20° ≤ 2θ ≤ 90° was modeled using Gaussian peak components superimposed on a polynomial background. Although this approach does not represent a fully constrained Rietveld refinement, it provides a robust validation of peak positions, lattice-parameter consistency, and residual distribution. The refined lattice parameter obtained from the whole-pattern fit is a = 5.64005 ± 0.00078 Å, which is in excellent agreement with the accepted room-temperature value of NaCl. The difference curve (yobs − ycalc) remains low across most of the diffraction range, with minor localized deviations near the strongest reflections. These deviations are attributed to peak asymmetry, Kα doublet effects, preferred orientation, and simplified profile modeling [6,7,21,29,30,31,32].
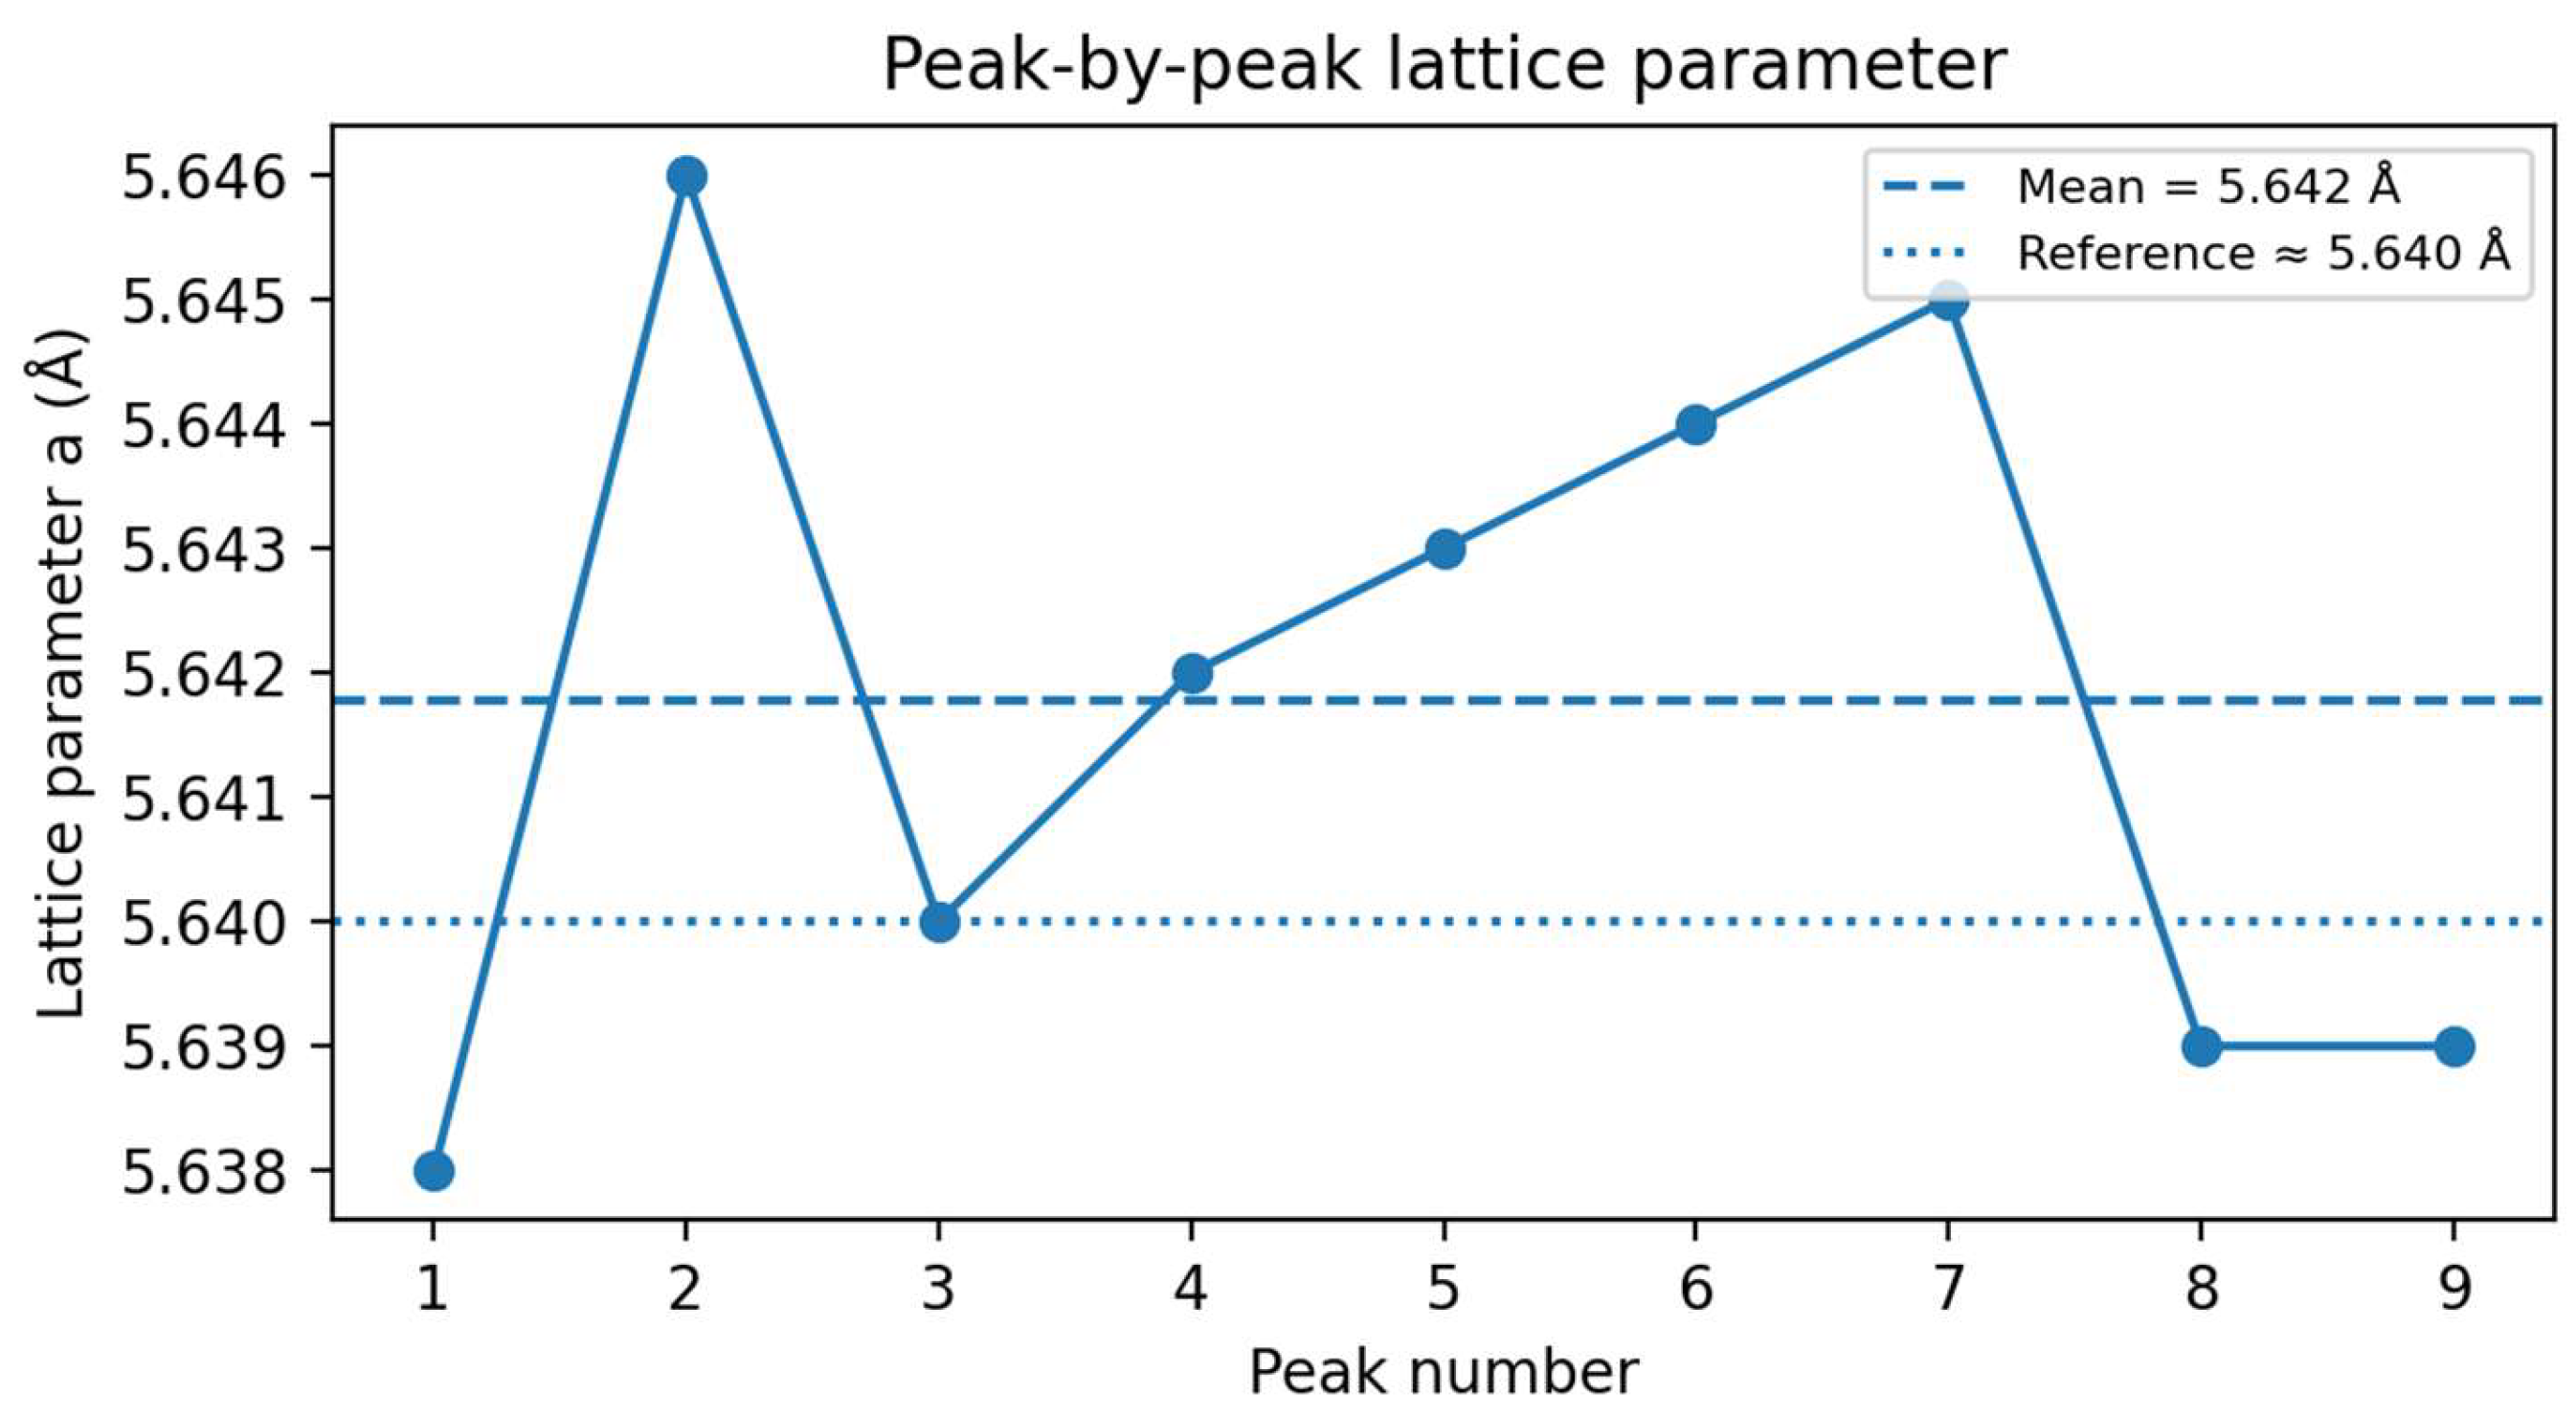
The peak-by-peak lattice parameters obtained from the independently indexed reflections are plotted in Figure 5. The values cluster closely around the experimental mean value of 5.642 Å and remain very near the accepted reference value of approximately 5.640 Å. This agreement confirms that the assigned fcc reflection sequence is internally consistent and that the small deviations among individual reflections are within the expected range for a laboratory powder XRD experiment. Therefore, Figure 5 provides a direct graphical validation of the lattice-parameter consistency obtained from the indexed NaCl reflections.
Figure 5.
Peak-by-peak lattice-parameter values obtained from the independently indexed NaCl reflections. The connected data points show the lattice parameter calculated from each reflection, the dashed line represents the experimental mean value of 5.642 Å, and the dotted line represents the accepted reference value near 5.640 Å. The close clustering of the individual values around both lines confirms the consistency of the fcc indexing and the reliability of the lattice-parameter determination.
5.3. Peak Width and Apparent Scherrer Size
The fitted FWHM values were converted to radians and used in the Scherrer analysis. Because the Cu Kα1/Kα2 components were not explicitly deconvoluted, the fitted widths represent effective profile widths rather than purely intrinsic sample broadening. This approximation has little effect on peak-position-based indexing and lattice-parameter determination but can significantly influence high-angle peak widths. The resulting values are therefore interpreted as apparent coherent-domain lengths rather than absolute crystallite or particle sizes.
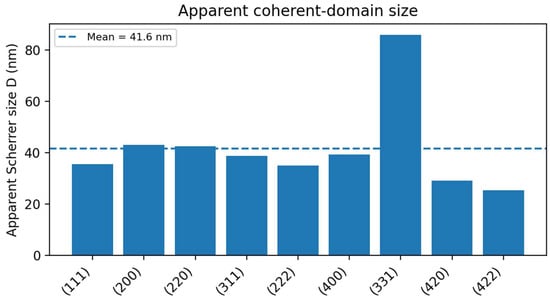
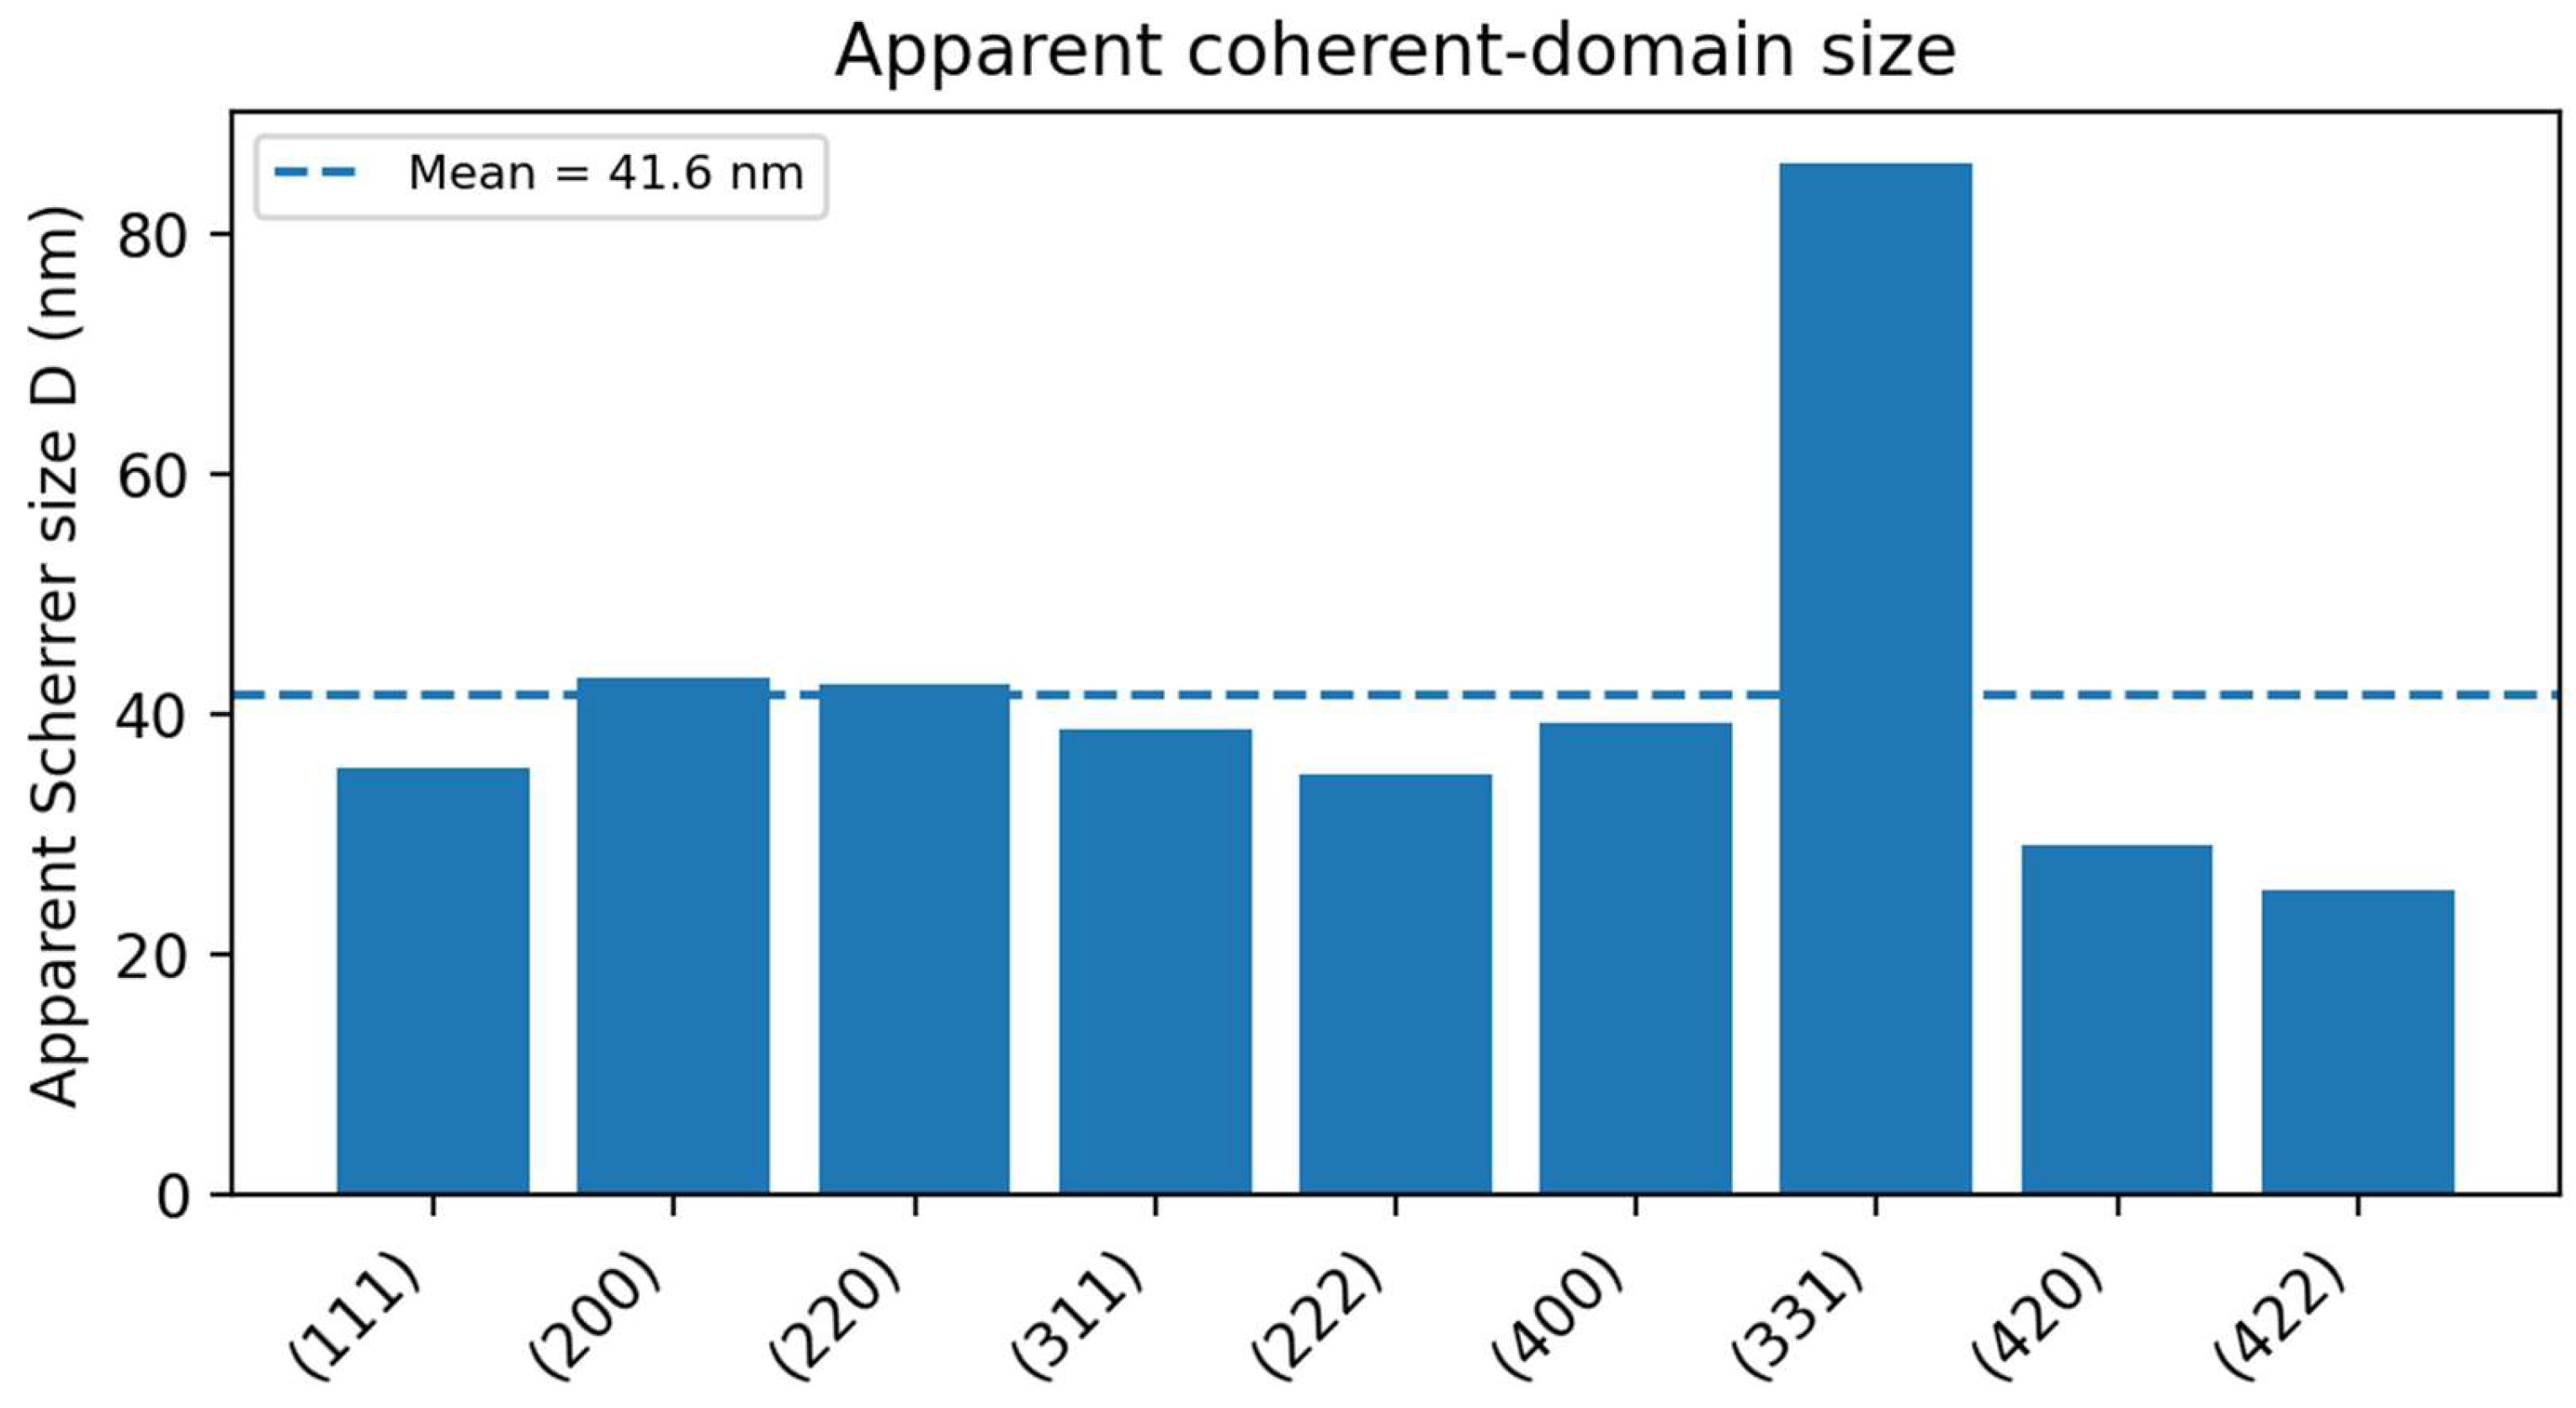
Including all nine reflections gives an average apparent Scherrer coherence length of approximately 41.6 nm. However, the weak high-angle (331) reflection yields an anomalously large value and is especially sensitive to background selection, fitting-window choice, unresolved Kα splitting, and the assumed instrumental width. Excluding this unstable reflection gives a more representative uncorrected average of approximately 36.1 nm. After applying a representative instrumental-broadening correction of βinst = 0.10°, the apparent coherence lengths range from about 25.0 to 149.2 nm; the upper value again corresponds to the (331) reflection, whose observed width is close to the assumed instrumental contribution and is therefore not considered reliable for particle-size interpretation.
Table 3 reports the observed FWHM values, uncorrected and corrected Scherrer estimates, and a reliability assessment for each reflection. These values should be regarded as first-order XRD estimates of coherent diffracting-domain length along the scattering direction. They may differ from the external particle size because defects, subgrain boundaries, microstrain, local lattice distortions, and small orientation changes can interrupt phase coherence within a larger particle. The uncertainty also depends on the profile model, FWHM definition, shape factor, instrumental correction, and fitting procedure. Accordingly, the Scherrer results are used here to describe relative line-broadening behavior rather than to claim an absolute NaCl particle size (Figure 6) [8,9,11,12,30,31,32,33,34,35].
Table 3.
Peak broadening and apparent Scherrer coherence lengths for all indexed NaCl reflections. Both uncorrected and instrument-corrected values are shown to illustrate the sensitivity of the Scherrer estimate to instrumental broadening, especially for weak or narrow reflections.
Figure 6.
Apparent Scherrer coherence length calculated for each indexed NaCl reflection. The dashed line shows the arithmetic average obtained when all nine reflections are included. The high-angle weak (331) reflection gives an anomalously large apparent value and is therefore interpreted cautiously because its FWHM is sensitive to unresolved Kα1/Kα2 splitting, background subtraction, and profile-fitting choice. The Scherrer values should be regarded as apparent coherence lengths rather than absolute particle sizes.
5.4. Williamson–Hall Size–Strain Analysis
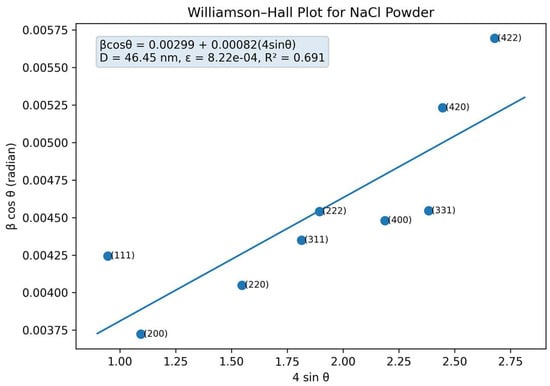
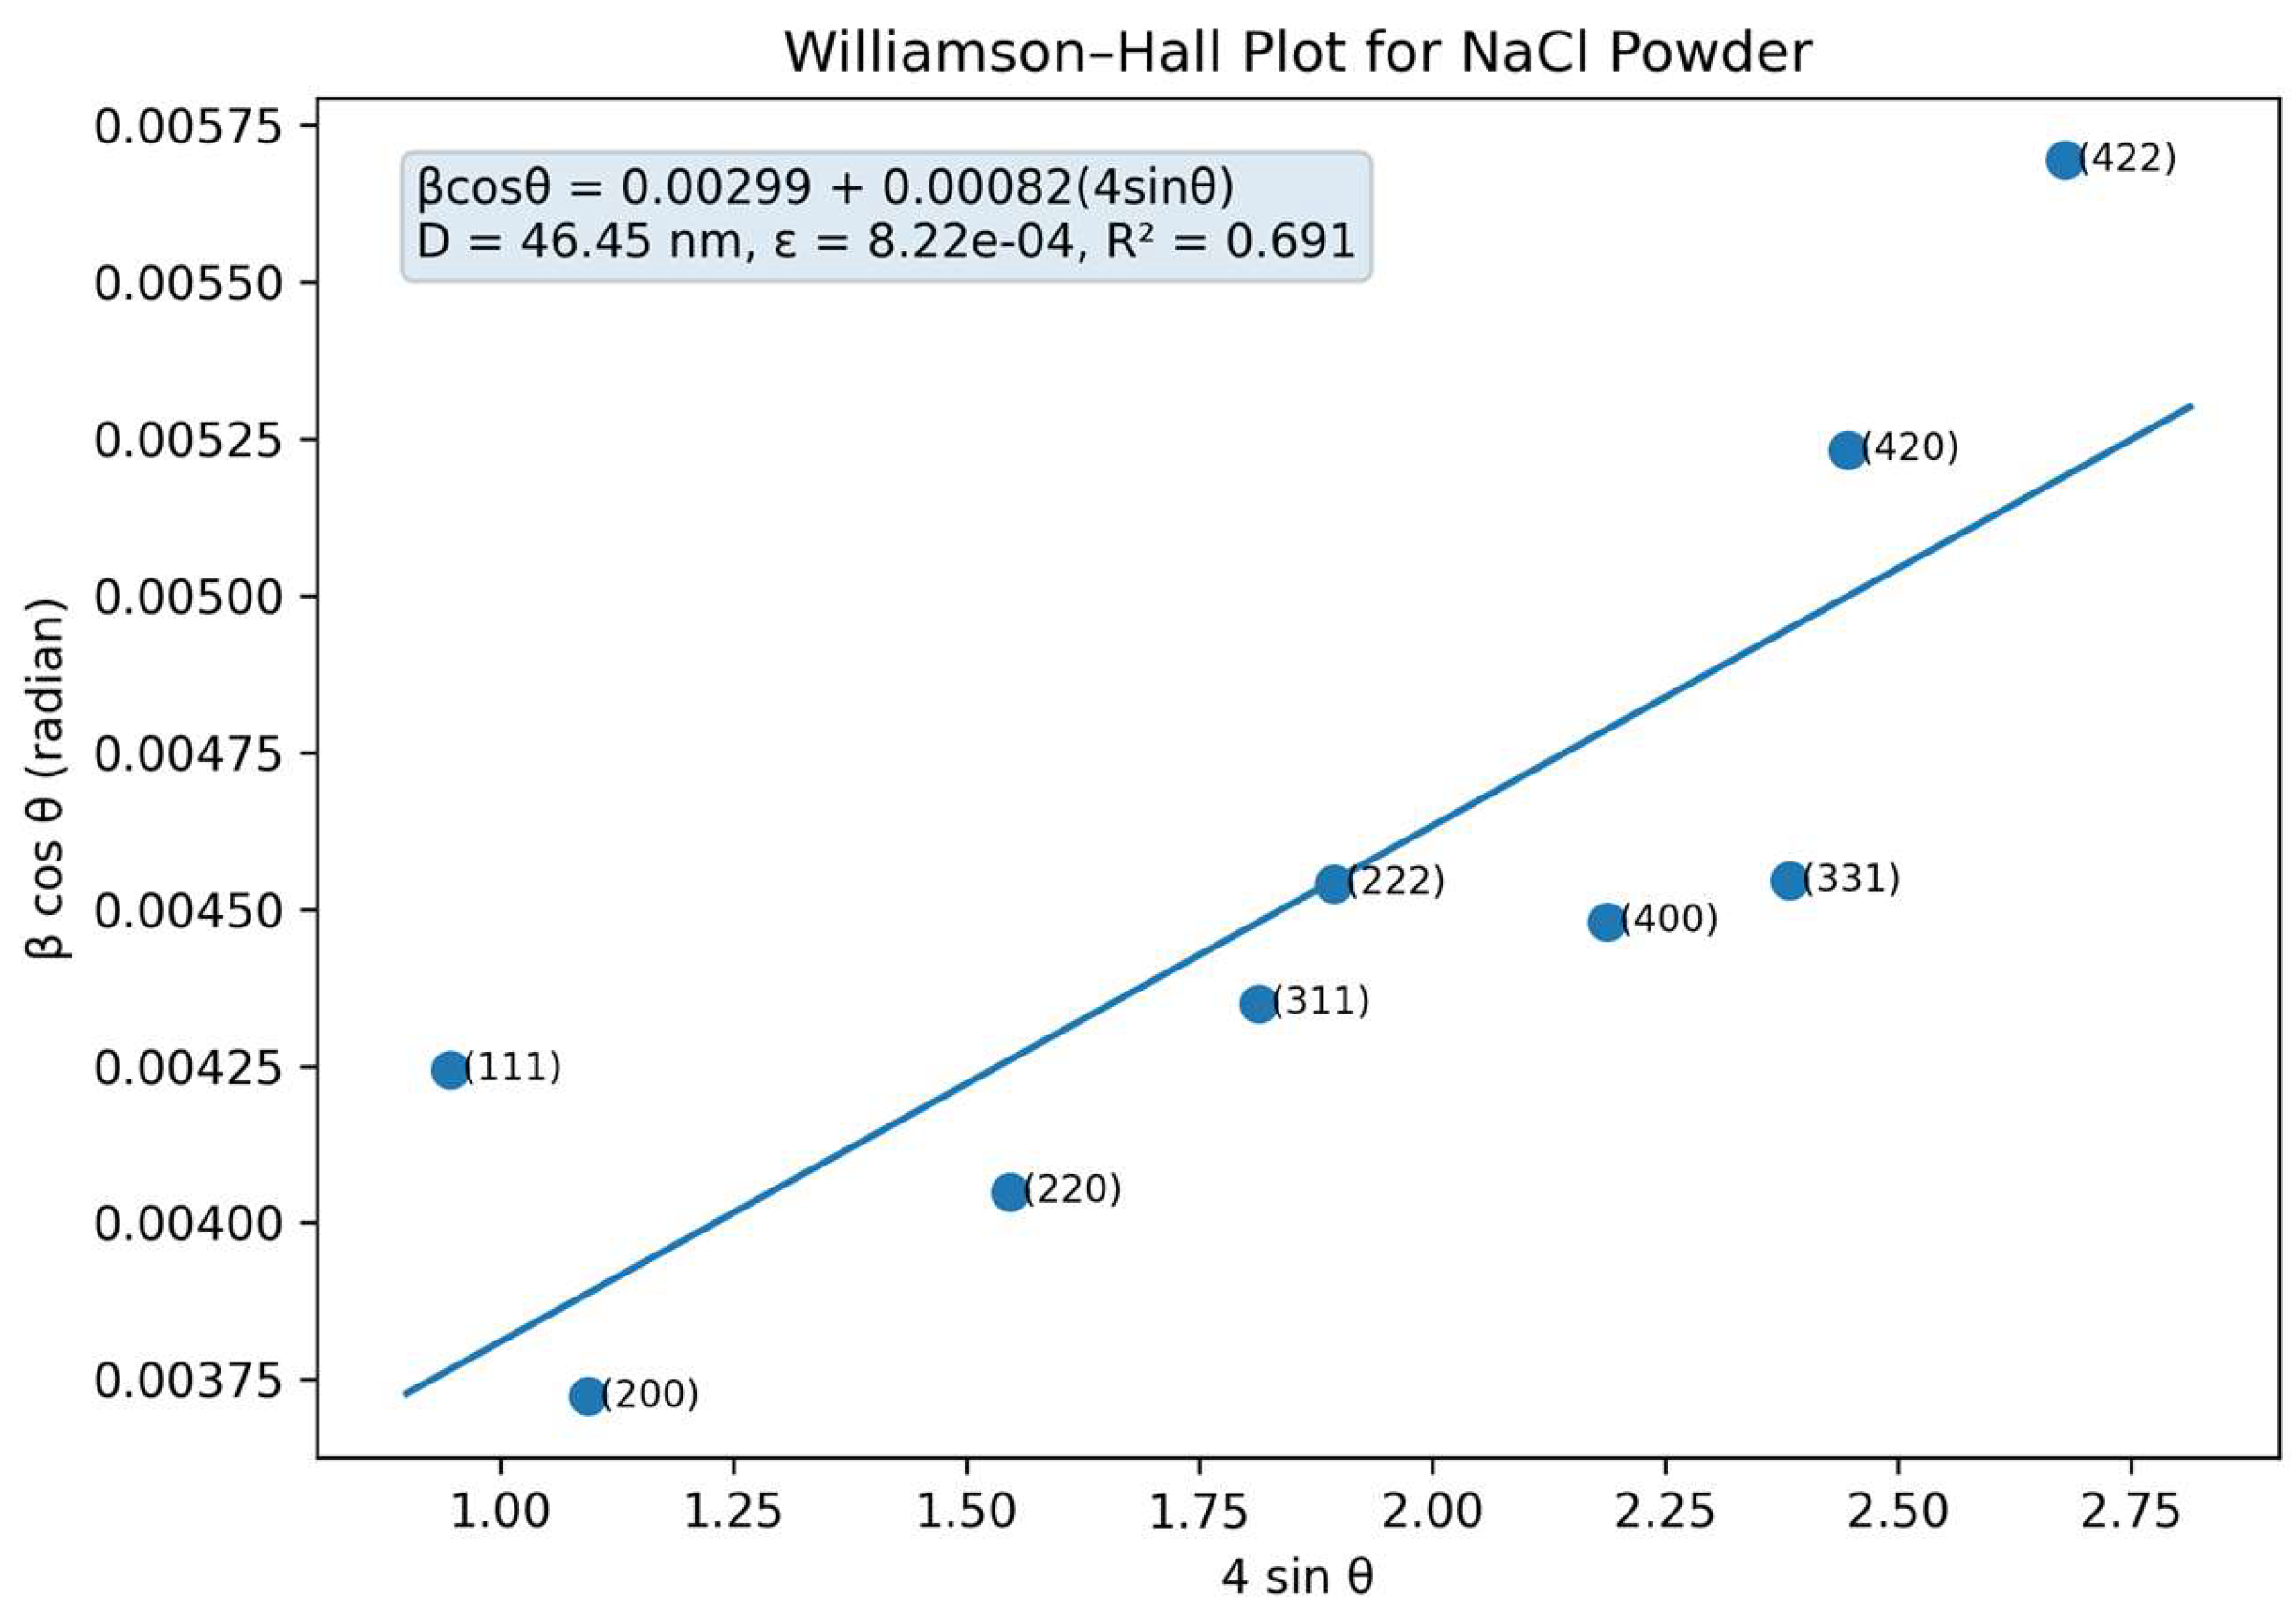
To complement the Scherrer analysis, the peak broadening was further examined using the Williamson–Hall (W-H) approach, which separates the size-related and strain-related contributions to the full width at half maximum within a simplified uniform-deformation approximation. In this treatment, the broadening term is expressed as β cosθ = Kλ/D + 4ε sinθ, where β is the FWHM in radians, θ is the Bragg angle, K is the shape factor, λ is the X-ray wavelength, D is the apparent coherent-domain size, and ε is the apparent microstrain parameter [36]. Figure 7 presents the Williamson–Hall plot constructed from the fitted NaCl diffraction peaks. The vertical axis corresponds to β cosθ, while the horizontal axis corresponds to 4 sinθ. The linear regression gives β cosθ = 0.00299 + 0.00082(4 sinθ), with R2 = 0.691. From the intercept, the apparent coherent-domain size is estimated to be approximately 46.45 nm, while the slope gives an apparent microstrain contribution of about 8.22 × 10⁻⁴.
Figure 7.
Williamson–Hall plot for NaCl powder based on the fitted XRD peak widths. The intercept represents the apparent size-related broadening contribution, while the slope represents an apparent distributional microstrain contribution. The extracted values are D ≈ 46.45 nm and ε ≈ 8.22 × 10⁻⁴; these values should be interpreted as apparent size–strain indicators because the instrumental profile and Cu Kα1/Kα2 doublet were not fully deconvoluted.
The crystallite size obtained from the W-H analysis is broadly consistent with the Scherrer-based coherence-length estimate, but the moderate R2 value indicates that the peak broadening is not fully described by a single uniform size–strain model. This behavior is expected for a laboratory powder XRD dataset because weak reflections, background selection, peak-profile choice, unresolved or partially resolved Kα doublet effects, and instrumental broadening can all affect the fitted FWHM values. Therefore, the W-H-derived size and strain should be interpreted as apparent size–strain parameters rather than absolute microstructural constants.
The positive slope of the W-H fit indicates an apparent positive microstrain contribution to the diffraction broadening. However, this should not be interpreted as direct evidence of macroscopic tensile strain in the NaCl powder. In the Williamson–Hall formalism used here, the strain term represents an effective distributional broadening contribution associated with variations in lattice spacing and other unresolved broadening sources. Because the fitted FWHM values were not deconvoluted using a standard-based instrumental profile and because the Kα1/Kα2 doublet was not explicitly modeled, the extracted microstrain is best described as an apparent distributional microstrain contribution.
The representative βinst = 0.10° correction used in the Scherrer analysis is retained only as a sensitivity test to illustrate how strongly the apparent coherence length can depend on the assumed instrumental width. It is not treated as a definitive instrumental-broadening correction. A rigorous W-H or size–strain analysis would require measurement of a strain-free standard under identical instrumental conditions, explicit treatment of the instrumental profile, and preferably whole-pattern refinement or dedicated line-profile analysis. Accordingly, the Williamson–Hall plot is used here as a qualitative and semi-quantitative extension of the Scherrer analysis, not as proof of a uniquely determined tensile strain state.
The comparison between Scherrer and Williamson–Hall analyses shows reasonable order-of-magnitude agreement. The Scherrer analysis gives an apparent mean coherence length of approximately 41.6 nm when all reflections are included, or approximately 36.1 nm when the unstable (331) reflection is excluded, whereas the W-H intercept gives an apparent size of approximately 46.45 nm. This agreement supports the general consistency of the line-broadening analysis, but the values should remain interpreted as apparent coherence-length and size–strain indicators rather than definitive microstructural constants.
5.5. Calculated and Experimental Relative Intensities
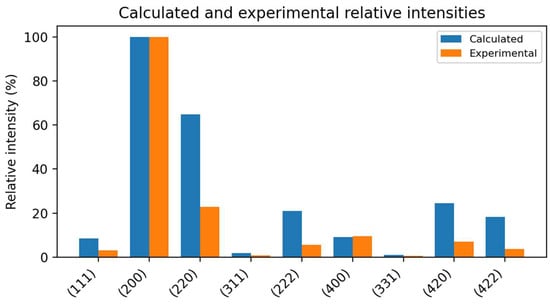
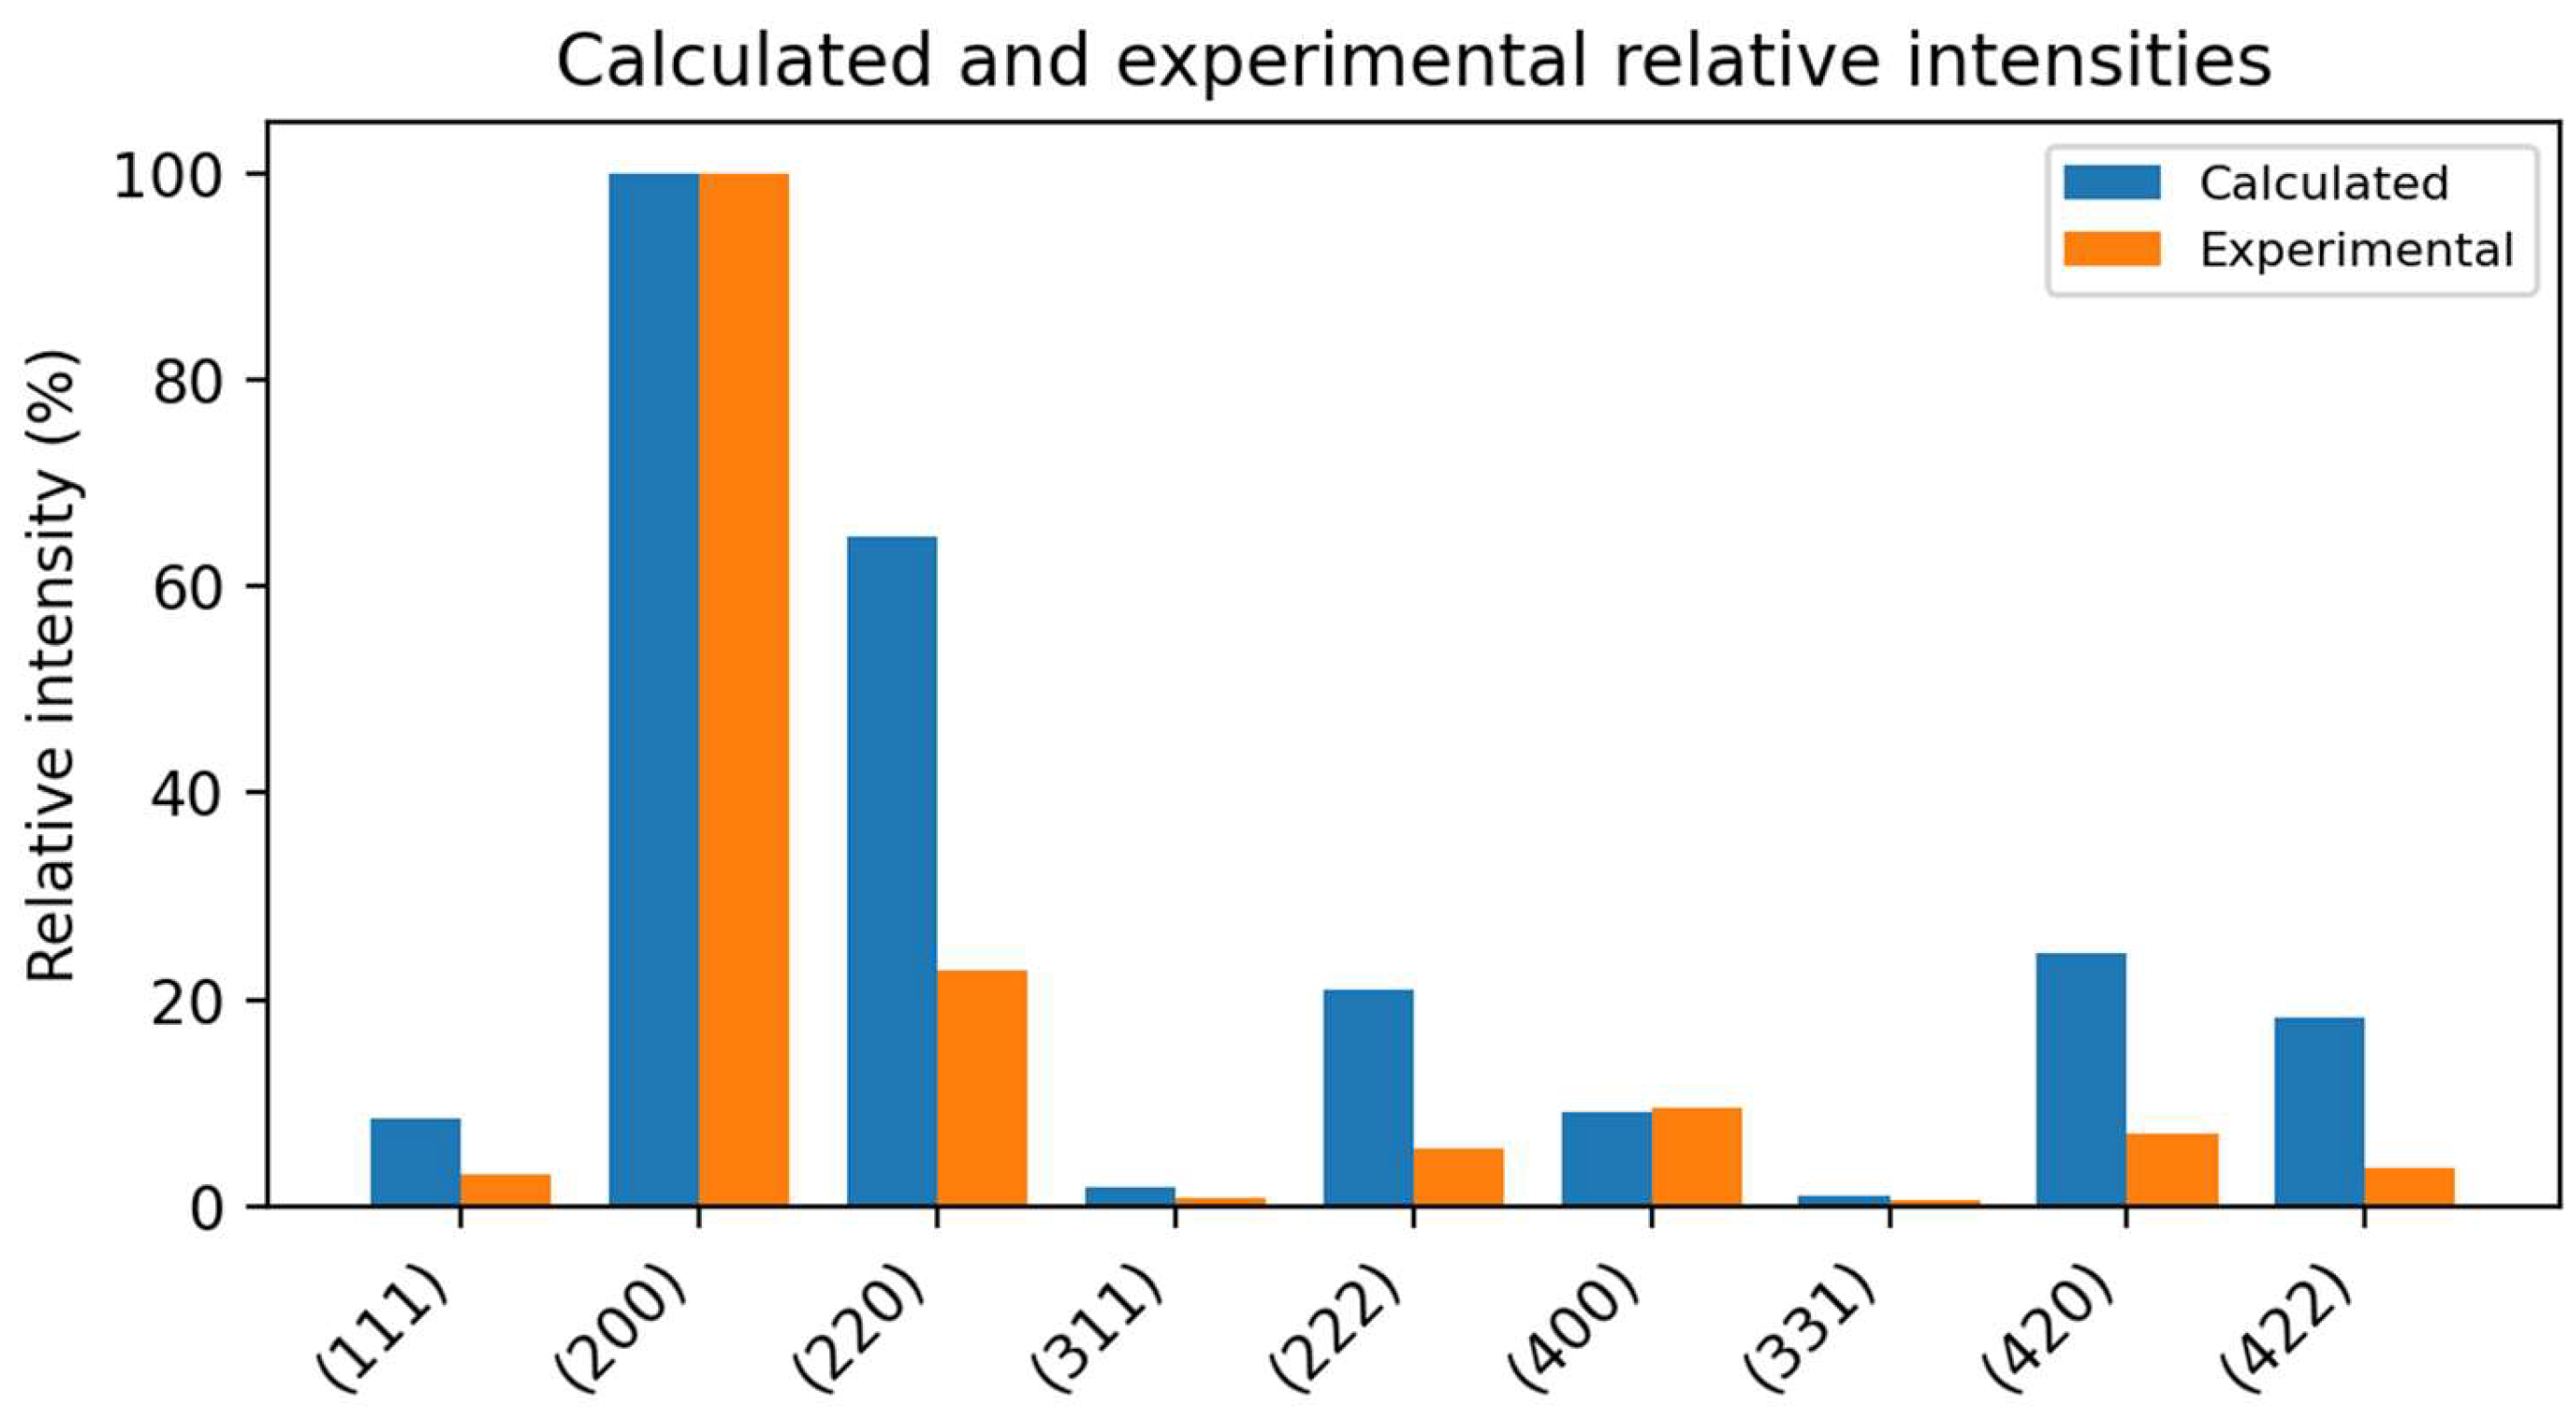
The calculated intensities were normalized to the strongest calculated peak, and the experimental integrated intensities were normalized to the strongest measured peak. The strongest reflection in both cases is the (200) reflection, indicating that the overall structure-factor hierarchy is captured qualitatively (Table S1). However, the relative intensity values differ substantially for several peaks. These deviations are not unexpected in simple powder preparation. Preferred orientation, imperfect randomization, adhesive-tape substrate effects, non-uniform sample thickness, background choice, and peak-profile selection can all affect integrated intensities (Figure 8). Accordingly, the discrepancy between calculated and experimental intensity ratios should be interpreted partly as a diagnostic indication of specimen-preparation and texture effects rather than as a failure of the fcc indexing or rock-salt structural assignment [2,3,4,5,19,20,36,37,38].
Figure 8.
Calculated versus experimental relative intensities. The disagreement reflects the greater sensitivity of intensity analysis to specimen preparation and profile modeling.
6. Detailed Discussion
6.1. Why the Pattern Proves an Fcc Rock-Salt Structure
The strongest structural conclusion of the experiment is the fcc nature of the NaCl lattice. In a primitive cubic lattice, reflections such as (100), (110), and (210) would be allowed. In a body-centered cubic lattice, the allowed sequence would follow h + k + l even. The observed sequence instead follows the fcc rule: h, k, and l must all be odd or all even. The first allowed value of h2 + k2 + l2 is therefore three, corresponding to (111). The second is four, corresponding to (200), and the third is eight, corresponding to (220), [2,3,4,5,14,15,16,17,18,39].
The presence of the (111) reflection is especially important. In a monatomic fcc lattice, the lattice factor would permit (111), but in a two-sublattice basis the intensity depends on how the two atom types interfere. For NaCl, the reflection is not completely extinguished because the scattering factors of Na+ and Cl− are different. However, because odd reflections depend on fCl − fNa rather than fCl + fNa, they are weaker than many even reflections. This explains why the first peak is present but much less intense than the (200) peak.
The analysis therefore distinguishes two different levels of extinction. The first is the fcc lattice extinction, which removes mixed-parity reflections entirely. The second is the NaCl basis modulation, which changes the relative strength of allowed reflections depending on whether h + k + l is even or odd. Confusing these two effects can lead to incorrect statements such as treating all odd reflections as forbidden. In NaCl, odd allowed fcc reflections are not forbidden; they are weakened by destructive interference between two chemically distinct sublattices.
6.2. Zero-Error and Specimen-Displacement Limitations
The measured lattice parameter of 5.642 Å agrees extremely well with the literature values near 5.640 Å. This level of agreement is notable because the sample was prepared by a simple powder-on-tape method rather than by a carefully packed capillary or low-background specimen holder. The result shows that peak positions can be robust even when intensities are imperfect [14,15,16,17,18,33,34,35,36,37,38,39,40].
In Bragg–Brentano powder diffraction geometry, a residual zero offset or a small displacement of the powder surface from the diffractometer focusing plane can introduce a systematic shift in the measured 2θ positions. A constant zero error shifts all peak centers by nearly the same angular amount, whereas specimen-height displacement produces an angle-dependent contribution that is commonly proportional to cosθ. Such effects can slightly bias the calculated d-spacings and lattice parameter if they are not refined or corrected using a calibrated standard or a constrained whole-pattern method.
In the present study, zero-shift and specimen-displacement/sample-height parameters were not refined because the analysis was intentionally performed using a transparent peak-by-peak workflow rather than a full Rietveld or Le Bail refinement. This limitation does not change the main crystallographic conclusion, because the observed sequence of allowed reflections and the narrow peak-to-peak scatter of the independently calculated lattice parameters remain consistent with fcc NaCl. Nevertheless, the absolute lattice parameter and the small differences among individual peak positions should be interpreted with awareness of possible residual zero and sample-height errors.
In a more advanced refinement, the lattice parameter would be obtained by whole-pattern fitting rather than by peak-by-peak calculation. A Rietveld refinement would refine zero-shift, background, scale factor, lattice parameter, peak-shape parameters, and possibly preferred orientation simultaneously [6,7,25,26,27,28]. Nevertheless, the present peak-by-peak result is already sufficiently accurate to identify the phase and validate the structure.
6.3. Meaning and Limitation of the Scherrer Size
The average Scherrer value of about 41.6 nm does not necessarily mean that the NaCl powder particles are physically 41.6 nm in diameter. XRD peak broadening measures coherent diffracting-domain size along the scattering direction because each diffraction peak is produced by constructive interference from a finite sequence of lattice planes normal to the corresponding scattering vector. For a given {hkl} reflection, the relevant periodicity is the spacing and phase correlation of the {hkl} planes along the direction perpendicular to those planes. If many consecutive planes remain regularly spaced and phase-correlated, their scattered waves add coherently over a long distance, and the diffraction maximum is narrow. If this periodic sequence is interrupted by a crystallite boundary, subgrain boundary, dislocation, stacking imperfection, local strain field, or small misorientation, the coherent addition of scattered waves is limited to a shorter distance and the reciprocal-space peak becomes broader. Thus, peak broadening is physically linked to the finite length over which the crystal can scatter coherently in the direction probed by that reflection. The Scherrer equation expresses this inverse relationship between angular peak breadth and coherent-domain length. Different reflections may therefore give different apparent sizes because the (111), (200), (220), and other peaks probe coherence normal to different lattice-plane families. For this reason, the Scherrer-derived value is a reflection-dependent apparent coherent-domain length along the scattering direction, not a direct measurement of the external particle diameter. A single particle may contain several coherently diffracting domains, or a larger crystalline grain may produce broadening due to microstrain, instrument resolution, or defects. Therefore, Scherrer analysis provides an apparent crystallite size, not a direct particle-size distribution.
The present Scherrer calculation uses the observed FWHM without explicit subtraction of instrumental broadening. This typically underestimates the true size. If the instrumental FWHM were measured using a standard reference material and deconvoluted from the observed peak widths, the corrected β values would be smaller, and the calculated crystallite sizes would be larger. Moreover, the seventh peak gives a much larger size than the others because its fitted width is small; this may reflect weak peak statistics rather than a true anisotropic domain size. It should be emphasized that the Scherrer-derived value is not directly equivalent to the particle size that would be obtained from microscopy. Microscopy measures the external particle or grain dimensions, whereas XRD peak broadening probes the coherent diffracting-domain length and is additionally affected by instrumental broadening, microstrain, Kα doublet effects, profile-function choice, and specimen preparation. A single NaCl particle may contain several coherent domains, and therefore, the microscopy particle size and the Scherrer coherence length need not coincide. In the present work, the Scherrer and Williamson–Hall analyses are used as methodological demonstrations of peak-width interpretation rather than as a complete particle-size characterization. A direct microscopy-based particle-size distribution would be a valuable complementary measurement in an extended study, but it is outside the scope of the present XRD-focused educational analysis.
A publication-level microstructural analysis should therefore use at least one of the following improvements: instrumental-broadening correction, Williamson–Hall analysis to separate size and strain contributions, multiple profile functions, or full Rietveld line-profile refinement. The value reported here remains useful as a laboratory estimate, but the language should remain cautious [8,9,10,11,12,29,30,31,41].
6.4. Why Intensity Agreement Is Poorer than Lattice-Constant Agreement
Relative intensities are more sensitive than peak positions because they depend on many experimental variables beyond the crystal structure. The calculation assumes a randomly oriented powder with ideal counting statistics, correct background subtraction, and appropriate angular corrections. Real powder on adhesive tape is unlikely to satisfy these assumptions. NaCl often forms cubic or faceted grains, and such grains may preferentially rest on low-index faces. This preferred orientation changes the number of crystallites satisfying the Bragg condition for particular plane families and therefore alters measured intensities.
An additional limitation is the absorption assumption used in the idealized intensity calculation. For a thick, randomly packed powder specimen, the diffracted intensity may approach a condition in which absorption effects are treated in a simplified way. However, this condition is not guaranteed for a thin powder layer supported on adhesive tape. In the present geometry, part of the beam may interact with the adhesive substrate or pass through regions of low powder coverage, and the effective absorbing thickness may vary across the illuminated area. Consequently, incomplete absorption and sample transparency can change the measured relative intensities. This effect is expected to influence integrated peak areas much more strongly than peak positions, which explains why the lattice parameter and fcc indexing remain reliable while the intensity agreement is only qualitative.
Peak fitting contributes a second source of uncertainty. Integrated area is more sensitive to the chosen background and profile function than peak position. Gaussian, Lorentzian, and Voigt functions can give similar peak centers but different integrated areas, especially for weak or overlapping peaks. Therefore, the large discrepancies in normalized intensity should not be interpreted as evidence that the phase identification is wrong. Instead, they demonstrate that a simple peak-intensity comparison is insufficient for quantitative structure refinement unless specimen preparation and profile modeling are carefully controlled.
The calculated intensity model also neglects or simplifies several corrections that may be relevant, including absorption, incomplete sample absorption, sample transparency, temperature factors, instrumental polarization details, preferred orientation, Cu Kα doublet separation, substrate/background contributions, and instrument-specific geometry. A Rietveld refinement using an appropriate specimen model and measured instrumental parameters would allow some of these effects to be treated more consistently. The present calculation is therefore retained only as a qualitative structure-factor/Lorentz–polarization comparison, because it captures the expected hierarchy of strong and weak NaCl reflections without claiming quantitative agreement [2,3,4,5,19,20,42].
7. Advanced Publication-Level Analysis
7.1. Peak-Profile Functions and Fitted Parameters
One of the important differences between a routine laboratory report and a publication-level powder diffraction analysis is the treatment of peak-profile functions. In the present work, individual NaCl reflections were fitted using Gaussian and Voigt-type functions to extract peak centers, peak heights, integrated areas, and full widths at half maximum. This procedure is suitable for obtaining the principal quantitative parameters required for indexing, lattice-parameter calculation, intensity comparison, and first-order line-broadening analysis. However, the observed diffraction profile should not be interpreted as a purely sample-derived function. In a real laboratory diffractometer, the measured peak shape is a convolution of instrumental and specimen-related contributions, including instrumental resolution, axial divergence, Kα doublet effects, sample transparency, specimen displacement, finite coherent-domain size, microstrain, and possible low-angle asymmetry.
The choice of profile function affects different fitted parameters to different degrees. Peak centers are generally more stable than FWHM values and integrated areas because the centroid or maximum position of a well-isolated peak can remain reliable even when the tails are not perfectly modeled. This explains why the present analysis gives a consistent lattice parameter from the indexed reflections, whereas the measured relative intensities and peak-width-derived coherence lengths require more cautious interpretation. By contrast, FWHM and integrated area depend strongly on the selected profile model, background subtraction, fitting range, and treatment of the peak tails.
Gaussian, Lorentzian, Voigt, and pseudo-Voigt functions may therefore yield very similar peak centers but different widths and integrated areas. A Gaussian component is often associated with instrumental resolution effects or distributions of lattice spacings, whereas Lorentzian-like contributions are commonly associated with finite-size and strain-related broadening. Voigt and pseudo-Voigt profiles are more flexible because they combine Gaussian-like and Lorentzian-like behavior and can therefore approximate the mixed broadening usually observed in laboratory powder XRD. For this reason, the widths obtained in the present analysis should be regarded as effective fitted widths. They are appropriate for a first-order Scherrer-type estimate, but they do not by themselves prove that finite crystallite size is the only source of broadening.
An additional consideration is the use of Cu Kα radiation. Because laboratory Cu Kα radiation contains Kα1 and Kα2 components with slightly different wavelengths, unresolved doublet contributions can broaden or slightly distort the fitted profile, especially at higher diffraction angles. This effect has limited influence on the main fcc indexing and phase-identification conclusions, but it becomes more important when precise FWHM values, integrated areas, and crystallite-size estimates are reported. A more rigorous publication-level treatment would therefore require instrumental-profile calibration using a standard material and, ideally, whole-pattern refinement or profile modeling that treats instrumental and sample-related broadening separately [21,29,30,31,36,37,38,39,40,41,42,43,44,45].
7.2. Reflection-by-Reflection Interpretation
The first reflection at approximately 27.4° is assigned to (111). Its presence confirms that the first allowed fcc family is observed, while its weak relative intensity is a direct consequence of the NaCl two-ion basis. For odd allowed reflections, the NaCl structure factor contains the difference between the chlorine and sodium atomic scattering factors, Fhkl = 4(fCl − fNa), rather than their sum. Because fCl and fNa are not equal, this difference does not vanish, and the odd reflection remains observable. However, because |fCl − fNa| is much smaller than |fCl + fNa|, the corresponding odd reflections are much weaker than the even reflections, for which Fhkl = 4(fCl + fNa) [2,3,4,5,14,15,16,17,18,45].
The (200) reflection at approximately 31.7° is the strongest experimental peak. This is expected because it is an all-even reflection controlled by the sum of the atomic scattering factors. It also has a favorable angular correction and high experimental area. The dominance of this peak is the reason it was used as the normalization reference for both calculated and experimental intensities.
The (220) peak at approximately 45.5° is another strong all-even reflection and provides a robust contribution to the lattice-parameter average. Its calculated relative intensity is large, but its experimental relative intensity is smaller. This discrepancy suggests that texture or specimen-preparation effects influence the measured pattern. Because the peak position remains correct, the difference should not be interpreted as a failure of indexing.
The weak (311) reflection at approximately 53.9° is again an odd, allowed reflection. Its intensity is expected to be low because it depends on the difference in form factors. Weak peaks are especially sensitive to background subtraction, and a small uncertainty in fitted area can produce a large percentage error. Therefore, the intensity mismatch for weak odd reflections is less alarming than an error in angular position would be.
The (222), (400), (420), and (422) reflections represent higher-order even families. Their positions strengthen the cubic indexing because they extend the h2 + k2 + l2 sequence to higher values. Higher-angle reflections are especially valuable for refining the lattice constant because small errors in d-spacing become more visible. However, they are also more affected by Kα doublet separation and reduced intensity.
The (331) reflection at approximately 73.1° gives an anomalously large apparent Scherrer coherence length in the present dataset. This result should not be interpreted as evidence that the crystallites are physically larger in the (331) direction. Rather, it reflects the high sensitivity of the fitted FWHM to the selected background, fitting window, peak-profile model, instrumental-broadening assumption, and unresolved Cu Kα1/Kα2 doublet separation at higher diffraction angles. Because the Scherrer equation depends inversely on the fitted FWHM, even a small underestimation of the width can produce a disproportionately large apparent coherence length. Therefore, the (331)-derived value is retained for transparency but treated as a fitting-sensitive outlier, not as proof of crystallite-size anisotropy.
7.3. Reliability of Conclusions from Different XRD Observables
Rather than comparing numerical errors among different physical quantities, the present analysis emphasizes the reliability of the conclusions drawn from each type of XRD observable. Peak positions provide the most robust information in this laboratory dataset because they are directly linked to interplanar spacings through Bragg’s law and give a consistent fcc indexing sequence and lattice parameter. The small scatter of the peak-by-peak lattice constants supports the reliability of the rock-salt structural assignment and the extracted average lattice parameter.
Peak widths provide useful but more conditional information. Their interpretation depends on the fitted profile, instrumental broadening, Kα-related profile effects, microstrain, and the assumed Scherrer shape factor. Therefore, the Scherrer and Williamson–Hall results are retained as apparent coherent-domain and size–strain estimates rather than as absolute particle-size values.
Relative intensities are the most specimen- and instrument-sensitive part of the analysis. Although the structure-factor calculation correctly explains the qualitative hierarchy of strong even reflections and weak odd allowed reflections in NaCl, exact intensity agreement requires better control of powder randomization, preferred orientation, absorption, surface flatness, background subtraction, and instrument-specific corrections. Accordingly, the most reliable conclusions of the present work are the fcc indexing and lattice-parameter determination, whereas peak-width and intensity analyses are presented as educational, physically informative, but more model-dependent interpretations [3,4,5,25,26,27,28,46,47,48,49].
8. Toward a Full Rietveld Refinement of the NaCl Dataset
For simple cubic NaCl, the peak-by-peak procedure used above is sufficient to demonstrate phase identification, fcc indexing, lattice-parameter calculation, and the qualitative interpretation of intensities and line broadening. However, this approach is not sufficient as a general method for extracting the structure of more complex crystalline materials. In lower-symmetry structures, multiphase specimens, distorted lattices, or materials with strongly overlapping reflections, individual peak fitting can become ambiguous because several reflections may contribute to the same observed peak envelope. In such cases, the appropriate procedure is whole-pattern refinement, most commonly through the Rietveld method.
In Rietveld refinement, the complete measured diffraction pattern is modeled rather than only selected peak positions or integrated intensities. The calculated intensity at each measured point can be written in simplified form as:
where ycalc is the calculated intensity at the i-th data point, ybg is the background contribution, S is the scale factor, mhkl is the reflection multiplicity, LPhkl is the Lorentz–polarization/angular correction, Fhkl is the structure factor, Phi is the peak-profile function, Phkl may represent preferred-orientation effects, and Ahkl may include absorption, thermal, or other correction terms depending on the refinement model. The Bragg positions 2θhkl are determined by the unit-cell parameters and the wavelength, while the structure factors are determined by the atomic coordinates, occupancies, and atomic displacement parameters of the assumed crystal structure.
The refinement proceeds by adjusting model parameters to minimize the weighted difference between the observed and calculated profiles:
where wi is the statistical weight assigned to the i-th data point. In practice, the refined parameters may include scale factor, zero-shift or specimen displacement, background coefficients, unit-cell parameters, peak-profile parameters, preferred-orientation parameters, atomic coordinates, occupancies, and displacement parameters. The key advantage is that all reflections are constrained by one structural model. For example, changing the lattice parameter shifts all calculated peak positions consistently; changing atomic coordinates or occupancies changes the structure-factor amplitudes and hence the relative intensities; and changing the peak-profile parameters affects the width and shape of the complete set of calculated reflections.
M = Σi wi [yobs(2θi) − ycalc(2θi)]2
This explains why Rietveld refinement is much more powerful than isolated peak fitting. It uses all data points in the diffraction pattern, treats overlapping peaks naturally, couples the measured pattern to a crystallographic model, and allows instrumental and specimen-related effects such as background, zero-shift, peak asymmetry, preferred orientation, and size–strain broadening to be refined explicitly. For the present NaCl dataset, the structural model is simple and already validated by the fcc indexing sequence and the lattice parameter obtained from individual reflections. Therefore, a full Rietveld refinement would mainly improve the treatment of background, peak shape, zero-shift, preferred orientation, and residual distribution rather than change the structural assignment.
Nevertheless, Rietveld refinement should not be treated as a black-box procedure. A low residual or visually good fit does not automatically prove that the structural interpretation is correct. Overparameterization, incorrect background modeling, unrecognized texture, uncorrected instrumental broadening, or use of an inappropriate structural model can produce a misleading refinement. For this reason, the manual analysis presented in this work remains important: it provides the crystallographic logic needed to evaluate whether a subsequent whole-pattern refinement is physically meaningful. Thus, the NaCl example serves as a transparent bridge between introductory peak-by-peak powder XRD analysis and the more general Rietveld approach required for complex crystal structures.
9. Conclusions
Powder XRD analysis confirmed the face-centered cubic rock-salt structure of NaCl through the indexed sequence of the (111), (200), (220), (311), (222), (400), (331), (420), and (422) reflections. The systematic absence of mixed-parity reflections and the relative weakness of the allowed odd reflections are consistent with the fcc lattice and the two-ion NaCl basis. The average lattice parameter obtained from the independently indexed reflections was a = 5.642 ± 0.004 Å, while whole-pattern analysis yielded a = 5.64005 ± 0.00078 Å. Both values agree closely with the accepted room-temperature value and demonstrate that the peak positions and crystallographic indexing constitute the most reliable quantitative outcomes of the analysis.
The peak-width and relative-intensity results require more cautious interpretation. The Scherrer and Williamson–Hall values represent apparent coherent-domain and size–strain parameters rather than absolute particle-size or microstrain measurements because the instrumental response and Cu Kα1/Kα2 contributions were not independently and fully deconvoluted. The calculated intensities reproduce the qualitative hierarchy of strong even reflections and weak odd reflections, but quantitative differences from the experimental intensities remain because of preferred orientation, powder mounting, surface-flatness variations, background treatment, and simplified profile modeling. Thus, peak positions provide the strongest evidence for structural identification, whereas peak widths and intensities remain more model- and specimen-dependent [8,9,10,11,12,29,30,31,38,49].
The main contribution of this work is the integration of manual peak-by-peak crystallographic reasoning with whole-pattern validation and uncertainty-aware interpretation in a single laboratory workflow. More rigorous microstructural characterization would require a strain-free reference standard measured under identical instrumental conditions, explicit treatment of the Cu Kα doublet and instrumental profile, and constrained Rietveld refinement. These refinements would improve the quantitative separation of size, strain, texture, and instrumental contributions without changing the principal identification of the NaCl rock-salt structure.
Supplementary Materials
The following supporting information can be downloaded at: https://www.mdpi.com/article/10.3390/compounds6030048/s1.
Author Contributions
M.A. and T.A.; methodology, M.A., G.N.M. and T.A.; software, M.A. and T.A.; validation, M.A., G.N.M. and T.A.; formal analysis, M.A., T.A. and O.M.; investigation, M.A. and T.A.; resources, M.A. and T.A.; data curation, M.A., G.N.M. and T.A.; writing—original draft, M.A. and T.A.; writing—review and editing, M.A. and T.A.; visualization, M.A. and T.A.; supervision, M.A. and T.A.; project administration, M.A. and T.A.; funding acquisition, M.A., T.A. and O.M. All authors have read and agreed to the published version of the manuscript.
Funding
This research received no external funding.
Data Availability Statement
The data supporting the findings of this study are available from the corresponding author upon reasonable request.
Conflicts of Interest
The authors declare no conflicts of interest.
References
- Bragg, W.H.; Bragg, W.L. The reflection of X-rays by crystals. Proc. R. Soc. A 1913, 88, 428–438. [Google Scholar] [CrossRef] [Scilit]
- Kittel, C. Introduction to Solid State Physics, 8th ed.; Wiley: Hoboken, NJ, USA, 2004. [Google Scholar]
- Cullity, B.D.; Stock, S.R. Elements of X-Ray Diffraction, 3rd ed.; Prentice Hall: Upper Saddle River, NJ, USA, 2001. [Google Scholar]
- Warren, B.E. X-Ray Diffraction; Dover Publications: New York, NY, USA, 1990. [Google Scholar]
- Klug, H.P.; Alexander, L.E. X-Ray Diffraction Procedures for Polycrystalline and Amorphous Materials, 2nd ed.; Wiley: New York, NY, USA, 1974. [Google Scholar]
- Young, R.A. (Ed.) The Rietveld Method; Oxford University Press: Oxford, UK, 1993. [Google Scholar]
- Rietveld, H.M. A profile refinement method for nuclear and magnetic structures. J. Appl. Crystallogr. 1969, 2, 65–71. [Google Scholar] [CrossRef] [Scilit]
- Langford, J.I.; Wilson, A.J.C. Scherrer after sixty years: A survey and some new results in the determination of crystallite size. J. Appl. Crystallogr. 1978, 11, 102–113. [Google Scholar] [CrossRef] [Scilit]
- Visser, J.W. A fully automatic program for finding the unit cell from powder data. J. Appl. Crystallogr. 1969, 2, 89–95. [Google Scholar] [CrossRef] [Scilit]
- Boultif, A.; Louër, D. Powder pattern indexing with the dichotomy method. J. Appl. Crystallogr. 2004, 37, 724–731. [Google Scholar] [CrossRef] [Scilit]
- Werner, P.-E.; Eriksson, L.; Westdahl, M. TREOR, a semi-exhaustive trial-and-error powder indexing program for all symmetries. J. Appl. Crystallogr. 1985, 18, 367–370. [Google Scholar] [CrossRef] [Scilit]
- Roisnel, T.; Rodriguez-Carvajal, J. WinPLOTR: A Windows tool for powder diffraction pattern analysis. Mater. Sci. Forum 2001, 378, 118–123. [Google Scholar] [CrossRef] [Scilit]
- Momma, K.; Izumi, F. VESTA 3 for three-dimensional visualization of crystal, volumetric and morphology data. J. Appl. Crystallogr. 2011, 44, 1272–1276. [Google Scholar] [CrossRef] [Scilit]
- Gražulis, S.; Sarjeant, A.A.; Moeck, P.; Stone-Sundberg, J.; Snyder, T.J.; Kaminsky, W.; Oliver, A.G.; Stern, C.L.; Dawe, L.N.; Rychkov, D.A.; et al. Crystallographic education in the 21st century. J. Appl. Crystallogr. 2015, 48, 1964–1975. [Google Scholar] [CrossRef] [Scilit] [PubMed]
- Brannon, J.P.; Ramirez, I.; Williams, D.; Barding, G.A.; Liu, Y.; McCulloch, K.M.; Chandrasekaran, P.; Stieber, S.C.E. Teaching crystallography by determining small molecule structures and 3-D printing: An inorganic chemistry laboratory module. J. Chem. Educ. 2020, 97, 2273–2279. [Google Scholar] [CrossRef] [Scilit]
- Estrada, F.R.; Malfatti-Gasperini, A.A. XRDplayground: A Python-based educational tool for interactive learning of powder X-ray diffraction crystallography. J. Appl. Crystallogr. 2025, 58, 609–614. [Google Scholar] [CrossRef] [Scilit]
- Patterson, A.L. The Scherrer formula for X-ray particle size determination. Phys. Rev. 1939, 56, 978–982. [Google Scholar] [CrossRef] [Scilit]
- Williamson, G.K.; Hall, W.H. X-ray line broadening from filed aluminium and wolfram. Acta Metall. 1953, 1, 22–31. [Google Scholar] [CrossRef] [Scilit]
- Monshi, A.; Foroughi, M.R.; Monshi, M.R. Modified Scherrer equation to estimate more accurately nano-crystallite size using XRD. World J. Nano Sci. Eng. 2012, 2, 154–160. [Google Scholar] [CrossRef]
- Gesing, T.M.; Fischer, C.; Borrmann, H. Determination of the average crystallite size and related microstructural parameters from in-house powder diffraction data. J. Appl. Crystallogr. 2024, 57, 1–12. [Google Scholar] [CrossRef] [Scilit] [PubMed]
- Li, Q.; Jiao, R.; Wu, L.; Zhu, T.; Huang, W.; Jin, S.; Liu, Y.; Weng, H.; Chen, X. Powder diffraction crystal structure determination using generative models. Nat. Commun. 2025, 16, 7428. [Google Scholar] [CrossRef] [Scilit] [PubMed]
- Walker, D.; Verma, P.K.; Cranswick, L.M.D.; Jones, R.L.; Clark, S.M.; Buhre, S. Halite–sylvite thermoelasticity. Am. Mineral. 2004, 89, 204–210. [Google Scholar] [CrossRef] [Scilit]
- Xu, F.; Belliard, L.; Li, C.; Djemia, P.; Becerra, L.; Huang, H.; Perrin, B.; Zerr, A. Single-crystal elastic moduli, anisotropy, and the B1–B2 phase transition of NaCl at high pressures. Appl. Phys. Lett. 2024, 125, 164102. [Google Scholar] [CrossRef] [Scilit]
- Nespolo, M. International Tables for Crystallography, Volume A, Space-group symmetry. Found. Adv. 2017, 73, 274–276. [Google Scholar] [CrossRef] [Scilit]
- NBS NSRDS 41; Crystal Structure Transformations in Binary Halides. National Standard Reference Data Series. National Bureau of Standards: Washington, DC, USA, 1972.
- Nasiri, S.; Rabiei, M.; Palevicius, A.; Janušas, G.; Vilkauskas, A.; Nutalapati, V.; Monshi, A. Modified Scherrer equation to calculate crystal size by XRD with high accuracy: Examples Fe2O3, TiO2 and V2O5. Nano Trends 2023, 3, 100015. [Google Scholar] [CrossRef] [Scilit]
- Reynolds, R.C., Jr. The Lorentz-polarization factor and preferred orientation in oriented clay aggregates. Clays Clay Miner. 1986, 34, 359–367. [Google Scholar] [CrossRef] [Scilit]
- Cheary, R.W.; Coelho, A.A. A fundamental parameters approach to X-ray line-profile fitting. J. Appl. Crystallogr. 1992, 25, 109–121. [Google Scholar] [CrossRef] [Scilit]
- Toby, B.H. EXPGUI, a graphical user interface for GSAS. J. Appl. Crystallogr. 2001, 34, 210–213. [Google Scholar] [CrossRef] [Scilit]
- Toby, B.H.; Von Dreele, R.B. GSAS-II: The genesis of a modern open-source all-purpose crystallography software package. J. Appl. Crystallogr. 2013, 46, 544–549. [Google Scholar] [CrossRef] [Scilit]
- Rodriguez-Carvajal, J. Recent advances in magnetic structure determination by neutron powder diffraction. Phys. B Condens. Matter 1993, 192, 55–69. [Google Scholar] [CrossRef] [Scilit]
- Dinnebier, R.E.; Billinge, S.J.L. (Eds.) Powder Diffraction: Theory and Practice; Royal Society of Chemistry: Cambridge, UK, 2008. [Google Scholar] [CrossRef] [Scilit]
- Pecharsky, V.K.; Zavalij, P.Y. Fundamentals of Powder Diffraction and Structural Characterization of Materials, 2nd ed.; Springer: New York, NY, USA, 2009. [Google Scholar] [CrossRef] [Scilit]
- ISBN 0-939950-24-3; Modern Powder Diffraction. Reviews in Mineralogy. Mineralogical Society of America: Washington, DC, USA, 1989; Volume 20.
- Prabhu, Y.T.; Rao, K.V.; Kumar, V.S.S.; Kumari, B.S. X-ray analysis by Williamson-Hall and size-strain plot methods of ZnO nanoparticles with fuel variation. World J. Nano Sci. Eng. 2014, 4, 21. [Google Scholar]
- Scardi, P.; Leoni, M. Whole powder pattern modelling. Acta Crystallogr. Sect. A 2002, 58, 190–200. [Google Scholar] [CrossRef] [Scilit] [PubMed]
- Warren, B.E.; Averbach, B.L. The effect of cold-work distortion on X-ray patterns. J. Appl. Phys. 1950, 21, 595–599. [Google Scholar] [CrossRef] [Scilit]
- Cheary, R.W.; Coelho, A.A.; Cline, J.P. Fundamental parameters line profile fitting in laboratory diffractometers. J. Res. Natl. Inst. Stand. Technol. 2004, 109, 1–25. [Google Scholar] [CrossRef] [Scilit] [PubMed]
- McCusker, L.B.; Von Dreele, R.B.; Cox, D.E.; Louër, D.; Scardi, P. Rietveld refinement guidelines. J. Appl. Crystallogr. 1999, 32, 36–50. [Google Scholar] [CrossRef] [Scilit]
- Gražulis, S.; Chateigner, D.; Downs, R.T.; Yokochi, A.F.T.; Quirós, M.; Lutterotti, L.; Manakova, E.; Butkus, J.; Moeck, P.; Le Bail, A. Crystallography Open Database: An open-access collection of crystal structures. J. Appl. Crystallogr. 2009, 42, 726–729. [Google Scholar] [CrossRef] [Scilit] [PubMed]
- Jain, A.; Ong, S.P.; Hautier, G.; Chen, W.; Richards, W.D.; Dacek, S.; Cholia, S.; Gunter, D.; Skinner, G.; Ceder, G.; et al. Commentary: The Materials Project: A materials genome approach to accelerating materials innovation. APL Mater. 2013, 1, 011002. [Google Scholar] [CrossRef] [Scilit]
- International Union of Crystallography. International Tables for Crystallography, Volume A: Space-Group Symmetry, 6th ed.; Aroyo, M.I., Ed.; Wiley: Chichester, UK, 2016. [Google Scholar]
- Coelho, A.A. TOPAS and TOPAS-Academic: An optimization program integrating computer algebra and crystallographic objects written in C++. J. Appl. Crystallogr. 2018, 51, 210–218. [Google Scholar] [CrossRef] [Scilit]
- Lutterotti, L. Total pattern fitting for the combined size-strain-stress-texture determination in thin film diffraction. Nucl. Instrum. Methods Phys. Res. Sect. B 2010, 268, 334–340. [Google Scholar] [CrossRef] [Scilit]
- Scardi, P.; Leoni, M. Diffraction line profiles from polydisperse crystalline systems. Acta Crystallogr. Sect. A 2001, 57, 604–613. [Google Scholar] [CrossRef] [Scilit] [PubMed]
- Pawley, G.S. Unit-cell refinement from powder diffraction scans. J. Appl. Crystallogr. 1981, 14, 357–361. [Google Scholar] [CrossRef] [Scilit]
- Le Bail, A.; Duroy, H.; Fourquet, J.L. Ab-initio structure determination of LiSbWO6 by X-ray powder diffraction. Mater. Res. Bull. 1988, 23, 447–452. [Google Scholar] [CrossRef] [Scilit]
- Noyan, I.C.; Cohen, J.B. Residual Stress: Measurement by Diffraction and Interpretation; Springer: New York, NY, USA, 1987. [Google Scholar] [CrossRef] [Scilit]
- Wenk, H.-R.; Van Houtte, P. Texture and anisotropy. Rep. Prog. Phys. 2004, 67, 1367–1428. [Google Scholar] [CrossRef] [Scilit]

Disclaimer/Publisher’s Note: The statements, opinions and data contained in all publications are solely those of the individual author(s) and contributor(s) and not of MDPI and/or the editor(s). MDPI and/or the editor(s) disclaim responsibility for any injury to people or property resulting from any ideas, methods, instructions or products referred to in the content. |
© 2026 by the authors. Licensee MDPI, Basel, Switzerland. This article is an open access article distributed under the terms and conditions of the Creative Commons Attribution (CC BY) license.