


Abstract
Accurate modeling of underground mine ventilation requires reliable estimates of roadway aerodynamic resistance. Conventional methods, based on geometric surveys or barometric pressure measurements, have notable limitations, including neglect of local losses, high time requirements, and sensitivity to environmental disturbances. This paper introduces a two-point flow-based method for determining roadway resistance directly from in situ measurements. Using basic instruments (anemometer, differential manometer, thermometer, and hygrometer), measurements are taken at two points along a straight airway. The pressure drop is calculated via the Bernoulli equation, allowing resistance to be determined without relying on geometric data or friction assumptions. This method captures both frictional and local losses inherently. Field testing in five roadway sections of a coal mine in Vietnam yielded resistance values 10–15 times higher than theoretical friction-only estimates, highlighting the importance of local losses. The equivalent cross-sectional areas back-calculated from the measured resistance using literature-based friction factors showed consistency with geometric survey data (typical deviation 3–6%), indicating internal coherence of the measurements. Full validation against independent barometric or CFD methods remains a subject of ongoing research. The method is simple, fast, minimally disruptive, and compatible with ventilation modeling tools. It provides a practical and accurate alternative for resistance estimation under real operating conditions.
1. Introduction
Ventilation in underground mines is one of the key factors in ensuring a safe and efficient working environment [1,2,3]. A ventilation system is not only responsible for delivering an adequate amount of fresh air to mining areas but also for removing harmful gases, dust, heat, and moisture generated during production processes [4,5,6]. To design and operate a mine ventilation system effectively, airflow simulations within the mine’s network of workings are essential. Computational Fluid Dynamics (CFD) models and ventilation network simulations provide detailed predictions of airflow distribution and contaminant transport, but their accuracy depends critically on the quality of input data such as airflow parameters, geometric characteristics, and boundary conditions. Calibration of simulation models against measured airflow data is necessary to ensure reliable results for ventilation design and operational decision-making [7,8].
One common challenge in designing and simulating underground mine ventilation systems is the discrepancy between simulation results and actual field data, including differences in flow rates, pressure, and even airflow direction compared with real-world mine workings. If these discrepancies are not corrected, they may lead to improper placement of fans, regulators, and other control elements, reducing ventilation efficiency and negatively impacting safety and working conditions in the mine. Accurate model calibration against actual measured airflow data is therefore essential to avoid such errors [2,7].
The primary cause of such discrepancies is typically not the computational models or simulation software themselves, but rather inaccuracies in input data—particularly in the values of the cross-sectional areas of mine roadways. Under real operating conditions, the cross-sectional area is not constant as assumed in design but varies over time due to multiple factors such as accumulation of materials (e.g., coal, timber, tools), presence of transportation or communication equipment, as well as deformations, subsidence, or narrowing of the workings resulting from their use. Nonetheless, these factors are often neglected or poorly estimated during data input for simulations, leading to inaccurate calculations of flow resistance, a key parameter in determining pressure losses in the ventilation network [7,8,9,10].
As a result, all calculations concerning airflow distribution, fan sizing and placement, and the effectiveness of control measures may be distorted, reducing the reliability of the ventilation network design. Therefore, precise determination of the cross-sectional area at specific locations within the mine is crucial for improving the accuracy of ventilation system simulations and design [2]. However, currently used measurement methods often have limited accuracy, require specialized equipment, are time-consuming, and involve complex procedures, making them impractical under the constraints of continuous production, limited space, and personnel shortages in underground mining conditions. This highlights the urgent need to develop a new method, simple, fast, easy to apply in the field, yet capable of providing the required accuracy to improve the efficiency of ventilation planning and simulation in mines [6,7].
1.1. Methods for Determining Aerodynamic Resistance
1.1.1. Geometric Method
The geometric method estimates resistance using design documentation, technological schematics, and geological technical profiles. These documents provide information on the shape of the roadway cross-section, the type of support system, and key dimensions such as height and width. Based on these geometric parameters, the cross-sectional area is calculated using basic geometric formulas corresponding to specific types of cross-sectional shapes (e.g., rectangle, trapezoid, circular arch, etc.) [9,11,12,13].
The estimation of roadway cross-sectional areas based on design and technical documentation is a commonly applied method, particularly during the ventilation planning phase for newly constructed or planned mine workings. When drawings, technological schematics, and data regarding support types, height, and width are available, the designer can quickly approximate the cross-sectional area using basic geometric calculations. This approach is convenient, does not require field measurements, and is especially suitable in time-constrained scenarios or when the mine is still under development. The obtained data can be easily incorporated into ventilation network simulations [9,14,15,16].
However, this method presents significant limitations in practical applications. Design data typically represent idealized conditions, whereas the actual state of underground workings changes over time due to factors associated with mining and construction activities—such as geological deformations, accumulation of materials, or physical damage. Moreover, resistance and pressure loss calculations based on such documentation often fail to consider local losses resulting from changes in airflow direction, turbulence, fan operation, and the presence of intersections or curves. These factors can lead to significant discrepancies between the assumed and actual cross-sectional areas [5,8,17,18].
Failure to update the assumed values introduces errors that accumulate throughout the ventilation model, ultimately reducing its overall accuracy and contributing to deviations between simulation results and real mine conditions [19]. Therefore, despite its advantages in terms of simplicity and speed, the documentation-based method is most appropriate at the preliminary planning stage and should be supplemented with in situ measurements to ensure sufficient accuracy for detailed analysis and calculations [17,20].
1.1.2. Pressure Measurements
A more realistic and accurate approach involves conducting direct field measurements. This experimental measurement method enables the acquisition of data that reflects the actual operational condition of the roadway, considering all factors that influence its shape and size, such as material accumulation, the presence of transportation equipment, and mechanical deformations of the support structure resulting from prolonged use [5,9].
The barometric method determines aerodynamic resistance by measuring pressure drops along airway sections using portable barometers or differential manometers [21]. In this approach, the pressure difference (ΔP) between two nodes is recorded and resistance is calculated as R = ΔP/Q2, where Q represents the simultaneously measured airflow rate. Because it is based on in situ measurements, the method reflects actual operating conditions and inherently accounts for all factors influencing airflow.
However, despite this advantage, the method presents several significant limitations. The measurement process is time-consuming and labor-intensive, particularly under hazardous underground conditions [22]. Its accuracy is also affected by atmospheric pressure fluctuations, turbulent flow pulsations, and dynamic changes in the ventilation network, such as the opening or closing of doors and the movement of personnel and equipment during surveys [21]. Furthermore, in short airways or in cases where pressure drops are small, measurement uncertainty may exceed the actual pressure loss, leading to unreliable results [22,23]. The method also requires specialized equipment and experienced operators.
Studies have shown that achieving a relative error of 10% or less in pressure drop measurements requires at least three independent readings at each node [21,23]. In practice, however, single measurements are often used, which further increases uncertainty and reduces the reliability of the obtained resistance values.
1.1.3. Measurement Using 3D Laser Scanning Technology
Modern optical and laser-based devices are increasingly applied in the measurement of underground mine roadways [9,14]. Contemporary total stations equipped with electronic tachymeters combine laser-based distance measurement and angular positioning to rapidly collect geometric data of cross-sections [9]. Both Terrestrial Laser Scanners (TLS) and mobile LiDAR systems can acquire dense point clouds covering the full vault and sidewalls of mine workings. These systems can scan millions of points within minutes, enabling highly detailed and high-resolution reconstruction of tunnel geometries [24]. In practical applications, mobile laser scanning devices have been mounted on backpacks or autonomous platforms for mapping underground excavations.
Field studies have validated the effectiveness of 3D laser scanning in real-world mining environments. In one case from an underground coal mine in Australia, a body-worn mobile LiDAR scanner surveyed over 50 m of tunnel, successfully capturing both horizontal and vertical clearance dimensions over long distances [25]. Similarly, in China, the Heron AC-1 system scanned a 3.4 km-long tunnel, generated a full 3D model, and automatically produced cross-sectional profiles with calculated surface areas and volumes [24,26]. 3D laser scanning is currently regarded as one of the most advanced technologies for underground spatial documentation, particularly in the analysis and modeling of mine tunnel cross-sections [24]. Compared to traditional manual measurements, it offers significant advantages in terms of accuracy, completeness, and operational efficiency.
One of the key benefits is the ability to obtain extremely high-density point clouds with sub-centimeter precision, enabling detailed representation of tunnel geometry, including complex, asymmetric, or deformed structures. Additionally, 3D scans can capture the presence of infrastructure elements such as conveyor systems, cabling, and accumulated materials, which are often overlooked during manual surveys. The resulting point cloud data can be processed to produce 3D visualizations for use in ventilation simulations, deformation monitoring, and infrastructure planning. High levels of automation minimize the need for direct human involvement in hazardous conditions, while digital datasets are easily stored, shared, and reanalyzed in future measurement campaigns [24,27].
However, the method is not without limitations. Initial investments in scanning hardware and data processing software are substantial, and specialized personnel are required for operation and analysis [9,14]. Additionally, environmental conditions such as dust, humidity, or confined spaces may interfere with laser performance, affecting scan quality [9]. In some scenarios, occluded areas caused by structural obstacles require multiple repositioning of the scanner, increasing acquisition time and labor [14]. Moreover, the large volume of data generated poses computational challenges, particularly for airflow simulation and ventilation network modeling using specialized software [5,19].
1.1.4. Statistical Determination of Friction Factors
Recent research has increasingly focused on the statistical analysis of in situ measurement data to derive representative friction factors for mine ventilation modeling [28,29,30]. This approach is based on large datasets collected from operating mines, where measured pressure drops and airflow rates are used to back-calculate friction factors for different types of roadways. By aggregating and analyzing these results, it is possible to establish typical ranges and median values that reflect real operating conditions rather than idealized assumptions.
A notable example is provided by studies conducted in Polish coal mines operated by JSW S.A., where extensive measurement campaigns enabled the compilation of friction factor distributions for various roadway configurations [31]. The results show clear differentiation depending on the presence of infrastructure, particularly conveyor systems. For roadways supported by ŁP arches without conveyors, the median friction factor was found to be 0.0165 kg/m3, with a very wide range from 0.00015 to 0.4865 kg/m3. In contrast, roadways equipped with conveyors exhibited a significantly higher median value of 0.0295 kg/m3, within a narrower range of 0.0085 to 0.1965 kg/m3.
These findings highlight the substantial impact of installed infrastructure on airflow resistance. Conveyor-equipped roadways show, on average, approximately 80% higher friction factors compared to those without conveyors, reflecting additional local losses, flow disturbances, and reduced effective cross-sectional area. The wide variability observed within each category also indicates the strong influence of local conditions, such as roadway roughness, deformation, equipment arrangement, and maintenance state.
While statistical friction factors provide a valuable reference for preliminary design and model calibration, they remain inherently approximate. They represent average conditions and cannot fully capture the specific characteristics of individual roadway sections. As a result, their application may introduce uncertainty in detailed ventilation analyses, particularly in complex or highly variable underground environments.
1.2. Research Gap and Objective
Existing methods for determining aerodynamic resistance in mine roadways exhibit important limitations. Geometric approaches fail to account for local losses and the impact of installed infrastructure, while barometric surveys are time-consuming, require specialized equipment, and are susceptible to errors caused by airflow pulsations and atmospheric variability. Although laser scanning techniques offer high geometric accuracy, they remain costly, computationally demanding, and still depend on assumed friction factors. Similarly, the use of statistical friction factors provides general guidance but cannot adequately represent local variations within individual roadway sections.
Consequently, there is a clear need for a practical, cost-effective, and accurate method that can be implemented using simple, readily available instrumentation, while capturing both frictional and local losses and providing results representative of entire airway sections. Such a method should also minimize disruption to mining operations and allow straightforward integration with ventilation network simulation tools.
This study addresses this gap by proposing a two-point, flow-based method for the direct determination of aerodynamic resistance. Based on the Bernoulli equation, the method calculates pressure drop from in situ measurements taken at two locations along a roadway, eliminating the need for detailed geometric surveys or extensive barometric measurements. The approach is supported by a theoretical framework and validated through field testing in an operational coal mine. The novelty of the proposed approach lies not in the underlying equations, which are well established, but in their combination into a simple and rapid field procedure that, using only basic instruments, inherently accounts for the combined frictional, local, and infrastructure-induced losses without requiring them to be identified or measured individually.
2. Materials and Methods
2.1. Fundamentals and Method’s Requirements
Based on the analysis of existing measurement methods and the requirements for accuracy, simplicity, and cost-effectiveness, the proposed approach is designed to meet several key criteria. It is grounded in an experimental basis, relying on direct in situ measurements rather than assumptions or design data. The method emphasizes simplicity by using only basic, widely available instruments, avoiding the need for complex or advanced equipment. It also enables rapid data acquisition and straightforward calculations that can be performed using simple tools such as spreadsheets. Furthermore, the approach ensures representativeness by providing results that characterize the entire airway section rather than a single measurement point. Practicality is also a key consideration, as the method avoids the large data volumes and processing demands associated with techniques such as laser scanning. In response to these requirements, this paper proposes the development of a novel measurement approach, referred to as the “two-point method.”
The measurement setup is intentionally based on simple, compact, and cost-effective instrumentation, including an anemometer (vane or hot-wire type) for air velocity measurement, a differential manometer with a Pitot tube for static and dynamic pressure, a thermometer and hygrometer for temperature and humidity, and a laser distance meter for determining elevation differences. On-site data processing can be performed using a basic calculator or standard spreadsheet software.
2.2. Measurement Procedure
Measurements are conducted within a designated section of a mine roadway at two fixed locations, hereafter referred to as points A and B. The logical and deliberate selection of these measurement points is essential to ensure that the collected data are representative of the investigated roadway segment. Points A and B correspond to the entrance and exit of the selected roadway section and should, where possible, be positioned in close proximity to ventilation network nodes, such as main roadway intersections or air intake and return points. This placement facilitates the integration of measurement results into subsequent ventilation network calculations and simulations.
At both points A and B, key parameters are measured, including air temperature, relative humidity, static and absolute pressure, roadway cross-sectional area, and air velocity. Temperature and humidity are measured using electronic sensors, while pressure is determined by using pressure sensors or U-tube manometers. The roadway cross-sectional area is obtained using manual measurement techniques, such as tape measurements or laser rangefinders. These measures account for factors that reduce the effective cross-sectional area, including transport equipment, electrical cables, ventilation ducts, and other obstructions. Air velocity is measured within the same cross-section to ensure consistency.
The selection of points A and B further requires that the roadway segment be straight, geometrically stable, and free from airflow disturbances caused by bends, junctions, auxiliary fans, large obstacles, or abrupt changes in cross-sectional geometry. Such conditions promote stable, fully developed turbulent flow, thereby improving the accuracy of velocity and pressure measurements and ensuring compliance with the assumptions underlying frictional pressure loss calculations, such as those based on Atkinson’s equation. Measurements conducted in highly turbulent zones would lead to significant data variability and would not reliably represent normal operating airflow conditions.
The air velocity measurement follows a grid method consistent with ISO 3966:2020 [32]. At each measurement point (A and B), the cross-section is divided into 6 to 9 elemental areas depending on the roadway shape (semi-arched or rectangular). For each elemental area, the local velocity is measured using a calibrated thermal anemometer (accuracy ±0.05 m/s). The average air velocity is then calculated as the area-weighted mean of the local velocities:
where is the local velocity in the i-th elemental area and is its area. Three independent measurement series are conducted at each point, and the arithmetic mean is used for further calculations.
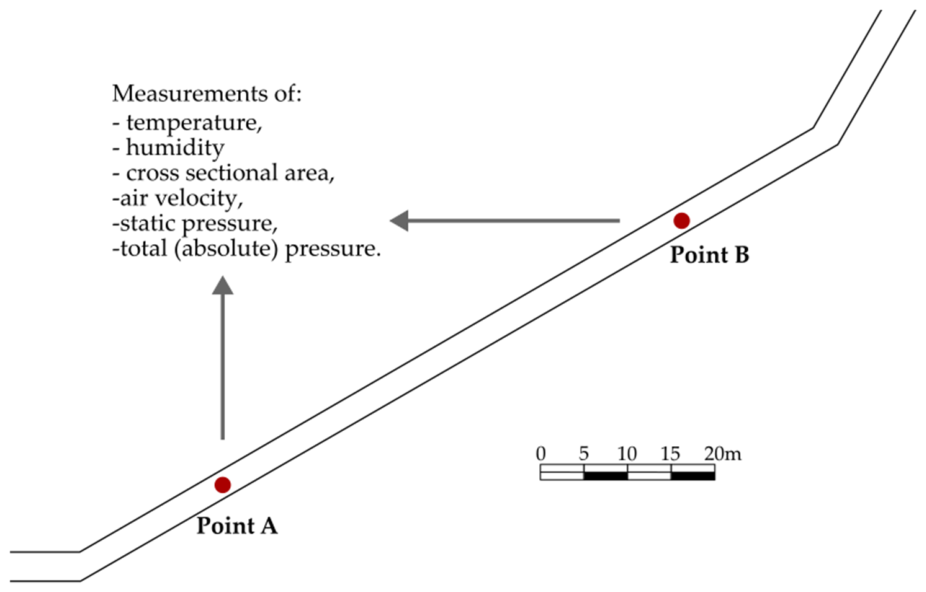
When properly executed, measurements at points A and B provide all parameters necessary to determine frictional pressure losses along the roadway segment, assess the accuracy of ventilation network simulations, and calibrate input data for mine ventilation modeling software. A schematic illustration of the measurement locations along a designated roadway at the −250 m level of the coal mine in the northeastern province of Vietnam is presented in Figure 1.
Figure 1.
Diagram of measurement points and requirements for essential measurements, including air temperature, relative humidity, cross-sectional area, air velocity, static pressure, and total (absolute) pressure.
2.3. Calculation Procedure
The Bernoulli equation, including a correction factor α for non-uniform velocity distribution, is used to calculate the pressure loss between points A and B:
where
- ΔP—pressure loss between points A and B, Pa;
- —static pressure at points A and B, Pa;
- —air density, kg/m3;
- —air velocity at points A and B, m/s;
- g—gravitational acceleration (≈9.81), m/s2;
- —elevation at points A and B, m.
For fully developed turbulent flow in mine roadways, the correction factor α typically ranges from 1.02 to 1.05. In this study, the value of α = 1.03 is adopted based on the measured velocity profiles. Because the velocity (dynamic) term is small compared with the static and gravitational components of ΔP, varying α within this range changes the calculated ΔP by a negligible amount, well below the overall measurement uncertainty.
Air density is calculated using the following formula:
where
- —partial pressure of dry air, Pa;
- —partial pressure of water vapor, Pa;
- —specific gas constant for dry air = 287 J/(kg·K);
- —specific gas constant for water vapor = 461 J/(kg·K);
- T—absolute temperature, K.
The partial pressure of dry air is calculated using the following formula:
where:
- —absolute pressure, Pa.
The partial pressure of water vapor is calculated using the following formula:
where is saturated vapor pressure at given temperature T, calculated according to Equation (6).
where means temperature expressed in Celsius degrees.
When the pressure loss ΔP is known, the resistance of the roadway section from point A to point B can be easily calculated using the following Equation (7).
where:
- R—roadway resistance, in N·s2/m8 or Pa·s2/m8;
- Q—volumetric airflow rate through the roadway, in m3/s.
3. Results
3.1. Test Sites and Measurement Conditions
To assess the applicability and robustness of the proposed two-point method, field measurements were conducted in five different roadway sections within the coal mine in the northeastern province of Vietnam. The selected sections represent a range of typical underground conditions, including variations in geometry, infrastructure, and operational characteristics. The measurement sections were located at the −250 m level within different operational zones of the mine. Each section was selected according to the criteria defined in Section 2.2, ensuring relatively stable airflow conditions, geometric continuity, and minimal disturbance from major ventilation elements such as junctions or auxiliary fans. The analyzed roadway sections can be characterized as shown in Table 1.
Table 1.
Characteristics of the analyzed roadway sections.
All sections had semi-arched cross-sections supported by steel arches (SVP-type), typical for underground coal mining conditions in the region. The lengths of the analyzed sections ranged from approximately 60 m to 120 m. Microclimatic conditions across the measurement sites were similar, with air temperatures in the range of 30–33 °C and relative humidity exceeding 90%, which significantly influences air density and was accounted for in all calculations.
3.2. Reference Measurements
For each measurement section, reference cross-sectional areas were determined using direct geometric surveys. Measurements were performed at both endpoints (points A and B) using a laser distance meter. Three measurement series were conducted at each point, and mean values were used for further analysis. The effective cross-sectional area was calculated by subtracting the area occupied by infrastructure elements from the geometric cross-section. The results presented in Table 2 show that the variability of cross-sectional areas between points A and B ranged from approximately 4% to 6%, reflecting natural geometric variability along the roadway sections.
Table 2.
Reference cross-sectional areas for each test section.
3.3. Two-Point Method Measurements
For each of the five roadway sections, measurements required for the two-point method were conducted at two locations, denoted as points A and B, using a set of basic instruments. These included a thermal anemometer for air velocity, a differential manometer equipped with a Pitot tube for pressure measurements, a thermohygrometer for temperature and humidity, and a laser distance meter for determining elevation differences. To ensure reliability, all parameters were measured in three independent series, and the arithmetic mean values were used in subsequent calculations.
The recorded parameters comprised static pressure (P), absolute pressure (Pat), air velocity (v), air temperature (t), relative humidity (φ), and elevation difference (h). Based on the measured air velocity and the reference cross-sectional area, the airflow rate (Q) was determined for each section. The results are summarized in Table 3. Minor discrepancies in airflow rate between points A and B, typically within the range of 5–7%, were observed in some cases. These differences likely reflect small air leakages or local inflows, which are considered acceptable under real underground mining conditions and do not significantly affect the overall validity of the results.
Table 3.
Measured parameters for each test section (mean values).
The observed differences in airflow rate between points A and B (typically 5–7%) arise from several factors inherent to underground mining conditions: minor air leakages through stoppings, seepage through mine seals, and localized air inflows from surrounding strata. Such variations are considered acceptable in real mine ventilation practice. A relative difference threshold of 10% was adopted: sections with ΔQ/Q > 10% would require subdivision into shorter segments or re-measurement. None of the tested sections exceeded this threshold.
3.4. Results and Consistency Assessment
Air density was calculated for each measurement point using the thermodynamic relationships described in Section 2.3. The variation in density between points A and B was generally small (below 0.5%) and resulted mainly from temperature and pressure differences. Results are presented in Table 4.
Table 4.
Calculated air density ρ for each test section.
The pressure drop for each section was calculated using the Bernoulli equation, considering static pressure differences, velocity changes, and elevation differences. The aerodynamic resistance of each section was then determined using the quadratic resistance law. Where airflow rates differ between points A and B, the Qmean, calculated as the mean value for A and B points, is used for further analysis (Table 5). This approach is considered acceptable when the relative difference between QA and QB does not exceed 10%, as larger discrepancies would indicate significant leakage or measurement error and would require reevaluation or subdivision of the section.
Table 5.
Calculated pressure drops and aerodynamic resistance for each test section.
To validate the proposed method, the calculated aerodynamic resistance values were compared with reference values derived from geometric measurements and literature-based friction factors. Additionally, the equivalent cross-sectional area was back calculated from the measured resistance using the Atkinson formula with friction factors from statistical data [31]:
- Roadways without conveyors (S1, S4, S5): k = 0.0165 kg/m3;
- Roadways with ventilation ducts and cables (S2): k = 0.0230 kg/m3 (estimated);
- Roadways with conveyor (S3): k = 0.0295 kg/m3.
Results are presented in Table 6. Rref denotes the theoretical friction-only resistance calculated using the Atkinson formula using data from Table 2 and factors summarized above. This value excludes local losses and infrastructure effects and serves as a lower-bound reference. Seq is back-calculated from Rmeas using literature-based friction factors k (S1, S4, S5: k = 0.0165; S2: k = 0.0230; S3: k = 0.0295 kg/m3). This value is presented for illustrative purposes only and does not constitute independent validation. Full validation requires separate barometric or CFD measurements. The ratio Rmeas/Rref quantifies the combined contribution of local losses and infrastructure relative to wall friction alone.
Table 6.
Measured aerodynamic resistance and equivalent cross-sectional area.
Measured aerodynamic resistance values were higher than friction-only values in all analyzed sections. The difference ranged from 10 to 15 times. This confirms that local losses and infrastructure have a significant impact on airflow resistance. The equivalent cross-sectional area calculated using the two-point method was consistent with geometric measurements. The relative error ranged from 3.0% to 6.3%, with a mean value of 4.5%. Higher resistance values were observed in sections with infrastructure (S2, S3). For section S2, the resistance was about 12.1 times higher than the friction-only value. For section S3, the increase was approximately 10 times. This is related to the presence of ventilation ducts, cables, and the conveyor. In sections with more complex conditions (S4, S5), slightly higher errors were obtained (6.3% and 5.7%). This is likely due to irregular geometry, temperature-related density changes, and less stable flow conditions. The results are consistent across all analyzed sections. The method gives comparable values for different types of roadways and operating conditions. The back-calculation of the equivalent cross-sectional area from measured resistance serves as an internal consistency check rather than a fully independent validation. Since Seq is derived using literature-based friction factors k, its agreement with geometric measurements confirms that the measured resistance values are physically plausible and consistent with known airflow behavior but does not constitute independent validation free from assumed parameters.
3.5. Uncertainty Analysis
To assess the reliability of the measured aerodynamic resistance values, an uncertainty analysis was performed in accordance with ISO/IEC Guide 98-3 (GUM) [33]. The following measurement uncertainties were estimated based on instrument specifications and field conditions:
- Static pressure difference ΔPstat: ±5 Pa (differential manometer);
- Air velocity v: ±0.05 m/s (calibrated thermal anemometer);
- Cross-sectional area A: ±0.1 m2 (laser distance meter, manual tape);
- Temperature t: ±0.3 °C (thermohygrometer);
- Relative humidity φ: ±2% (thermohygrometer);
- Elevation difference Δh: ±0.2 m (laser distance meter).
Propagation of uncertainties through Equations (2) and (7) yields a combined relative uncertainty in aerodynamic resistance R of approximately 8–12% for the tested sections. The largest contributors are the static pressure difference (~6–8%) and the airflow rate measurement (~4–6%). These uncertainty levels are acceptable for ventilation network calibration in underground mines, where typical resistance variations between similar roadways often exceed 20–30%.
4. Discussion
The measurement results for the analyzed excavation sections show that the two-point method accurately reflects actual airflow conditions. The most important observation is the significant difference between the resistance determined based on measurements and the theoretical value resulting solely from friction. In each case, the total resistance was many times higher than the value calculated using the classical method. This difference results from the fact that in real-world conditions, flow is influenced not only by friction losses on the excavation walls, but also by local losses and the presence of infrastructure.
The reported ratio of measured to friction-only resistance (10–15×) depends on the adopted value of the Atkinson friction factor k. For SVP arch supports, the literature reports k values ranging from 0.010 kg/m3 (clean, well-maintained roadways) to 0.025 kg/m3 (deformed, obstructed conditions). Using this range, the ratio R_meas/R_ref varies between approximately 8 and 20 across the tested sections. Regardless of the exact value, the key finding remains that the actual aerodynamic resistance is substantially higher (by nearly an order of magnitude or more) than friction-only estimates. This confirms that local losses and infrastructure effects dominate total resistance in real operating conditions. Two caveats should be kept in mind. First, the reference friction factors k adopted here were derived from Polish coal mines, and their transfer to the different geological and climatic conditions of the studied mine is itself a source of uncertainty; the k-based comparison should therefore be read as indicative rather than absolute. Second, the two-point method yields only the integral resistance of the segment between A and B and does not, by itself, separate the wall-friction, local-loss, and infrastructure contributions. The method is accordingly best regarded as a tool for quantifying the total resistance actually present in a roadway, rather than for attributing it to individual physical mechanisms.
These contributions include changes in flow direction, cross-sectional variations, equipment components (cables, pipelines, conveyors), and irregularities of the support. Geometric methods ignore or simplify these factors, whereas the two-point method accounts for them directly because it is based on the measured actual pressure drop. This allows the total aerodynamic resistance of the roadway section to be determined in a way that corresponds to the real operating conditions of the ventilation network. Good agreement was also obtained between the equivalent cross-sectional area derived from the resistance and the geometric measurements, with differences of only a few percent. This indicates that the method correctly reflects the effective flow cross-section, accounting for both the roadway geometry and its current equipment. In sections containing infrastructure (e.g., conveyors, pipelines), a marked increase in aerodynamic resistance was observed, consistent with operational experience and literature data; the two-point method captures this effect without requiring detailed measurement of each individual element. Under more complex conditions, such as irregular geometry or temperature variation, slightly larger deviations occurred, attributable to greater flow variability and more demanding measurement conditions; nevertheless, the results remained consistent and within an acceptable error range. Full independent validation should be carried out by comparing two-point resistance values with those obtained from CFD simulations of the same roadway sections, or with barometric surveys collected simultaneously under controlled conditions, without reliance on assumed friction factors. A comparison of the proposed approach with existing methods described in the Introduction section is presented in Table 7.
Table 7.
Comparison of methods for determining aerodynamic resistance.
The comparison shows that each method has specific limitations that impact its practical application. The geometric method is the simplest and cheapest, but it is based on ideal assumptions. It does not consider the influence of infrastructure or local losses, thus leading to an underestimation of aerodynamic resistance. It can be used at the design stage, but it does not provide reliable results for operational conditions. The barometric method considers the actual pressure drops and allows for the determination of total resistance. Its disadvantages include time-consuming processing, the need for specialized equipment, and sensitivity to interference. Furthermore, it is a point-based method, requiring multiple measurements to obtain a representative result. Laser scanning allows for accurate mapping of the excavation geometry but does not directly provide aerodynamic resistance. It requires further calculations using friction coefficients, which introduces additional uncertainty. This method is expensive and difficult to use in routine measurements. Compared to these methods, the two-point method combines their key advantages. As shown in Table 7, it allows for the direct determination of total resistance, considers local losses and infrastructure impact and remains relatively simple to use. It does not require detailed geometric measurements for resistance determination, although the cross-section verification step presented here does use literature-based friction factors k as a reference. An additional advantage is that the result refers to the entire analyzed section, not a single point. This is crucial for the construction and calibration of ventilation network models.
Despite good results, the method has its limitations. Primarily, it requires relatively stable flow conditions. It works best in straight sections of mines, free from significant disturbances such as intersections, fans, or sudden changes in cross-section. In conditions of strong turbulence, measurement accuracy may be reduced. The length of the measurement section is also important. For short sections, the pressure drop can be comparable to the measurement uncertainty, which increases the relative error. In such cases, it is recommended to use longer sections or repeat measurements. The scope of the conducted research is limited to selected sections in a single mine. Further validation of the method under other conditions is necessary, particularly in areas with more complex flow and in workings with different equipment and support types. An additional issue is the implementation of the results in ventilation network models. The determined total resistance must be distributed over the length of the section. This can be achieved by assuming a unit resistance or dividing the section into smaller segments. It is also advisable to compare the two-point method with measurements based on laser scanning and CFD simulation results. This will allow for a better assessment of its accuracy and scope of applicability. Further work should include increasing the number of cases analyzed and developing measurement procedures to facilitate the use of the method in practice.
The authors acknowledge a fundamental limitation of the proposed method. The method requires straight, geometrically stable segments free from junctions, bends, or abrupt cross-section changes (Section 2.2). Yet these very features are the primary sources of local losses that the method aims to capture. This apparent contradiction means that the two-point method is not universally applicable. Instead, it is best suited for long straight airways such as haulage roadways, intake airways, and return airways where flow is well-developed and disturbances are minimal.
For realistic mine networks containing junctions, regulators, fans, and abrupt geometry changes, the authors propose a tiered surveying strategy:
- (a)
- Two-point method, applied to long straight segments (typically >50–80 m) to obtain representative integrated resistance values;
- (b)
- Barometric surveys, used at complex nodes, junctions, and short segments where the two-point method would suffer from low ΔP/uncertainty ratios;
- (c)
- 3D laser scanning reserved for critical zones requiring detailed geometric reconstruction (e.g., deformations, obstructions) to inform CFD models or to quantify local losses indirectly.
This tiered approach combines the speed and simplicity of the two-point method on suitable segments with the higher resolution of other techniques where needed. The two-point method should therefore be viewed as a screening and calibration tool for ventilation network models, not as a universal replacement for all resistance measurement techniques.
5. Conclusions
This paper presents a two-point method for determining the aerodynamic resistance of mine workings based on in situ measurements. The method uses airflow parameters measured at two points along the roadway section and allows for direct determination of aerodynamic resistance without the use of table coefficients or simplified geometric models.
Measurements conducted in five roadway sections of the mine confirmed that the two-point method allows the aerodynamic resistance to be determined under real operating conditions. The cross-sectional areas obtained from geometric measurements ranged from 13.55 to 14.68 m2, with a 3–6% variability between points A and B. The calculated aerodynamic resistance values ranged from 0.2206 to 0.2447 N·s2/m8 and were 10 to 15 times higher than the values derived from friction alone. This shows that the measurement accounts not only for frictional losses but also for local losses, the influence of infrastructure, and the actual condition of the roadway. The cross-sectional area back-calculated from the resistance was consistent with the geometric measurements, with an average error of 4.5% and a minimum of 3.0% for the simplest section (S1); larger deviations (up to 6.3%) occurred in sections with more complex flow conditions. Higher resistance values were observed in sections with installed infrastructure (S2, S3), an effect the method captured without the need for detailed measurement of individual equipment components. Overall, the two-point method produced consistent results across a range of conditions and can be applied in practice to determine the aerodynamic resistance of roadway sections.
The field measurements showed that the actual resistance of a roadway is many times higher than the value calculated from friction alone. This is due to the significant contribution of local losses and the influence of infrastructure, which are not accounted for in conventional methods, so that approaches based solely on geometric analysis led to an underestimation of aerodynamic resistance under real operating conditions. Good agreement was achieved between the cross-sectional area derived from the resistance and the geometric measurements, with differences of only a few percent, confirming the method’s accuracy and its ability to represent the actual flow cross-section while accounting for the presence of infrastructure and local restrictions.
The method is simple to use and requires no specialized equipment. It can be applied in mine environments without a significant disruption to operation. The results can be used directly in ventilation network models, which is important for their calibration and verification. The two-point method is thus a practical tool for determining the aerodynamic resistance of mine workings, and its use allows for a more realistic representation of airflow conditions in a mine than traditional methods. Further research should encompass a larger number of workings and a wider range of operating conditions, particularly workings with extensive infrastructure and areas with disturbed airflow.
Author Contributions
Conceptualization, M.B. and K.Z.-G.; methodology, B.T.H.; software, B.T.H.; validation, M.B. and K.Z.-G.; formal analysis, K.Z.-G.; investigation, B.T.H.; resources, B.T.H.; data curation, M.B.; writing—original draft preparation, B.T.H.; writing—review and editing, M.B. and K.Z.-G.; visualization, B.T.H.; supervision, M.B.; project administration, K.Z.-G.; funding acquisition, M.B. All authors have read and agreed to the published version of the manuscript.
Funding
This work is supported by the AGH University of Krakow, Faculty of Civil Engineering and Resource Management (subsidy No. 501.00-100302-10000).
Data Availability Statement
Data is contained within the article.
Conflicts of Interest
The authors declare no conflicts of interest.
Abbreviations
The following abbreviations are used in this manuscript:
| CFD | Computational Fluid Dynamics |
| LiDAR | Light Detection and Ranging |
| TLS | Terrestrial Laser Scanners |
References
- McPherson, D.J. Subsurface Ventilation and Environmental Engineering, 1st ed.; Springer: Dordrecht, The Netherlands, 1993. [Google Scholar]
- Hartman, H.L.; Mutmansky, J.M.; Ramani, R.V.; Wang, Y.J. Mine Ventilation and Air Conditioning, 3rd ed.; Wiley: New York, NY, USA, 1997. [Google Scholar]
- Kissell, F.N. Handbook for Dust Control in Mining; NIOSH: Pittsburgh, PA, USA, 2003. [Google Scholar]
- Xue, Y.; Wang, J.; Xiao, J. Bibliometric analysis and review of mine ventilation literature published between 2010 and 2023. Heliyon 2024, 10, e26133. [Google Scholar] [CrossRef] [Scilit] [PubMed]
- Saleem, H.A. Energy consumption reduction in underground mine ventilation system: An integrated approach using mathematical and machine learning models toward sustainable mining. Sustainability 2025, 17, 1038. [Google Scholar] [CrossRef] [Scilit]
- Semin, M.; Kormshchikov, D. Applications of artificial intelligence for mine ventilation: A brief review. Front. Artif. Intell. 2024, 7, 1402555. [Google Scholar] [CrossRef] [Scilit] [PubMed]
- Xu, G.; Huang, J.; Nie, B.; Chalmers, D.; Yang, Z. Calibration of mine ventilation network models using the non-linear optimization algorithm. Energies 2018, 11, 31. [Google Scholar] [CrossRef] [Scilit]
- Yi, H.; Kim, M.; Lee, D.; Park, J. Applications of Computational Fluid Dynamics for Mine Ventilation in Mineral Development. Energies 2022, 15, 8405. [Google Scholar] [CrossRef] [Scilit]
- Janus, J.; Ostrogórski, P. Underground mine tunnel modelling using laser scan data in relation to manual geometry measurements. Energies 2022, 15, 2537. [Google Scholar] [CrossRef] [Scilit]
- Ganić, A.; Milutinović, A.; Tokalić, R.; Ognjanović, S. Measuring methods for cross sections of underground mine chambers. Undergr. Min. Eng. 2011, 19, 101–108. [Google Scholar]
- Niubó, M.; de Felipe, J.J.; Bascompta, M.; Pérez-Ràfols, F.; Vives i Costa, J.; Sanmiquel, L.; López, J.-A. Assessing mine ventilation optimization and friction factor determination for underground mines. Arab. J. Geosci. 2025, 18, 72. [Google Scholar] [CrossRef] [Scilit]
- Zhao, C.; Cao, H.; Wan, M.; He, B.; Wu, B. Study on the influence of section shape of underground roadway on ventilation resistance. Energy Sources Part A Recovery Util. Environ. Eff. 2024, 46, 11041–11057. [Google Scholar] [CrossRef] [Scilit]
- Wang, Z.; Li, Q.; Zhang, H. The roadway layout and control technology of pillar-free mining. Processes 2022, 10, 1784. [Google Scholar] [CrossRef] [Scilit]
- Qi, Z.; Obracaj, D.; Piergies, K.; Korzec, M.; Gao, K. Method for roadway cross-section determination and airflow resistance calculation based on multidimensional feature fusion of point cloud data. Rock Mech. Rock Eng. 2025, 59, 4069–4085. [Google Scholar] [CrossRef] [Scilit]
- Jia, Z.; Zhao, Q.; Zhao, Y.; Cui, B.; Song, T. Dimensionless analysis of rough roadway airflow distribution based on numerical simulations. Fluids 2025, 10, 77. [Google Scholar] [CrossRef] [Scilit]
- Cui, D.; Xueqiu, H.; Baisheng, N. Numerical simulation of airflow distribution in mine tunnels. Int. J. Min. Sci. Technol. 2017, 27, 663–667. [Google Scholar] [CrossRef] [Scilit]
- Michelin, F.C.F.; Ambrosio, S.K.; Jackson, C.; Stewart, C.M. Efficient and Accurate Ventilation Surveys for Model Calibration. Ventsim, 2025. Available online: https://ventsim.com/wp-content/uploads/2025/07/Ventsim-DESIGN-Efficient-and-accurate-ventilation-surveys-for-model-calibration.pdf (accessed on 27 July 2025).
- Menéndez, J.; Fernández-Oro, J.M.; Merlé, N.; Galdo, M.; Álvarez, L.; López, C.; Bernardo-Sánchez, A. Auxiliary ventilation systems in mining and tunnelling: Air leakage prediction and system design to optimize energy efficiency and operation costs. Tunn. Undergr. Space Technol. 2023, 140, 105298. [Google Scholar] [CrossRef] [Scilit]
- Cao, P.; Liu, J.; Wang, H.; Wang, Y.; Liu, X.; Dong, W. Uncertainty analysis of digital twin model of mine ventilation system. Sci. Rep. 2024, 14, 26558. [Google Scholar] [CrossRef] [Scilit] [PubMed]
- Li, J.; Li, Y.; Zhang, J.; Li, B.; Zhang, Z.; Dong, J.; Cui, Y. Accurate and real-time network calculation for mine ventilation without wind resistance measurement. J. Wind Eng. Ind. Aerodyn. 2022, 230, 105183. [Google Scholar] [CrossRef] [Scilit]
- Krach, A. Sources of uncertainty in ventilation measurements in mines. Arch. Min. Sci. 2004, 49, 151–178. (In Polish) [Google Scholar]
- Branny, M.; Nowak, B.; Ptaszyński, B.; Kuczera, Z.; Łuczak, R.; Życzkowski, P. An influence of air velocity profile on the two-phase flow parameters in the ventilating shaft. Górnictwo Geoinżynieria 2010, 34, 29–39. (In Polish) [Google Scholar]
- Roszczynialski, W.; Trutwin, W.; Wacławik, J. Kopalniane Pomiary Wentylacyjne [Mine Ventilation Measurements]; Śląsk: Katowice, Poland, 1992. [Google Scholar]
- Qiu, Z.; Li, W.; Zhang, H. A review of laser scanning for geological and geotechnical applications in underground mining. J. Rock Mech. Geotech. Eng. 2022, 14, 1025–1042. [Google Scholar]
- Singh, S.K.; Raval, S.; Banerjee, B. Mobile 3D imaging in underground coal mines: A case study. In Proceedings of the International Future Mining Conference, Sydney, Australia, 19–20 November 2019. [Google Scholar]
- Heron. Underground Mine Mapping and 3D Modelling with Portable LiDAR System. Geo-Matching Industry Report. 2021. Available online: https://geo-matching.com/articles/underground-mine-mapping-and-3d-modelling-with-portable-lidar-system (accessed on 27 July 2025).
- Szmuk, A.; Zwolińska-Glądys, K.; Kuczera, Z.; Borowski, M. Methodological Approach for Determining the Aerodynamic Resistance Using 3D Scanning: Application in Mine Ventilation Modeling. Appl. Sci. 2025, 15, 11723. [Google Scholar] [CrossRef] [Scilit]
- Frączek, R. Aerologia Górnicza. Przykłady i Zadania [Mine Aerology: Examples and Exercises]; Katedra Elektryfikacji i Automatyzacji Górnictwa, Politechnika Śląska: Gliwice, Poland, 2007. (In Polish) [Google Scholar]
- Wacławik, J. Wentylacja Kopalń [Mine Ventilation, Volumes I, II], Tom I, II; Wydawnictwo AGH: Krakow, Poland, 2010. [Google Scholar]
- Pawiński, J.; Roszkowski, J.; Strzemiński, J. Przewietrzanie Kopalń [Mine Ventilation]; Śląskie Wydawnictwo Techniczne: Katowice, Poland, 1995. [Google Scholar]
- Szmuk, A. Analysis of Air Distribution in the Ventilation System Based on Experimental and Simulation Studies Using Software VentSim. Unpublished. Doctoral Thesis, AGH University of Krakow, Krakow, Poland, 2026. (In Polish) [Google Scholar]
- ISO 3966:2020; Measurement of Fluid Flow in Closed Conduits—Velocity Area Method Using Pitot Static Tubes. International Organization for Standardization: Geneva, Switzerland, 2020.
- ISO Guide 98-3:2008; Uncertainty of Measurement Part 3: Guide to the Expression of Uncertainty in Measurement (GUM:1995). International Organization for Standardization: Geneva, Switzerland, 2008.

Disclaimer/Publisher’s Note: The statements, opinions and data contained in all publications are solely those of the individual author(s) and contributor(s) and not of MDPI and/or the editor(s). MDPI and/or the editor(s) disclaim responsibility for any injury to people or property resulting from any ideas, methods, instructions or products referred to in the content. |
© 2026 by the authors. Licensee MDPI, Basel, Switzerland. This article is an open access article distributed under the terms and conditions of the Creative Commons Attribution (CC BY) license.