


Abstract
Hydrothermal alteration mapping is a critical component of porphyry copper exploration because alteration assemblages provide important vectors toward mineralization. This study presents a systematic evaluation of supervised machine learning algorithms for delineating hydrothermal alteration zones using Advanced Spaceborne Thermal Emission and Reflection Radiometer (ASTER) short-wave infrared (SWIR) surface reflectance data (AST_07XT). The investigation focuses on the Nain region within the central Urumieh–Dokhtar Magmatic Arc (UDMA), Iran, a major metallogenic belt hosting numerous porphyry copper systems. Representative spectral endmembers corresponding to Al–OH-bearing and Mg–OH-bearing hydrothermal alteration minerals were extracted using Minimum Noise Fraction (MNF), Pixel Purity Index (PPI), and n-dimensional visualization techniques. These endmembers were subsequently used to train and evaluate a comprehensive suite of supervised machine learning classifiers, including linear, kernel-based, tree-based, ensemble, probabilistic, boosting, and neural-network algorithms for pixel-wise hydrothermal alteration mapping. Model performance was evaluated using multiple statistical metrics, including overall accuracy (OA), average accuracy (AA), precision, recall, F1-score, Cohen’s kappa coefficient, area under the ROC curve (AUC), spatial cross-validation accuracy, uncertainty analysis, and spatial agreement analysis. Among the evaluated classifiers, SVM_Linear, SVM_RBF, LDA, and MLP achieved the highest classification performance, with overall accuracies exceeding 94% and strong spatial consistency between classified maps. The resulting alteration maps display spatially coherent distributions of Al–OH and Mg–OH minerals that are consistent with established hydrothermal alteration zoning models in porphyry–epithermal systems. The mapped hydrothermal alteration zones show strong spatial correspondence with known mineralized areas and alteration patterns within the Urumieh–Dokhtar Magmatic Arc, confirming the geological reliability of the classification results. Uncertainty analysis further indicates high model confidence across most alteration zones, with higher uncertainty values mainly restricted to transitional and spectrally heterogeneous regions. The results demonstrate that integrating ASTER SWIR imagery with supervised machine learning algorithms provides a robust, scalable, and transferable framework for regional-scale hydrothermal alteration mapping and mineral exploration in porphyry copper provinces.
1. Introduction
The integration of machine learning (ML) techniques into geosciences has significantly enhanced the analysis of large and complex geospatial datasets, particularly in mineral exploration [1,2,3,4]. ML algorithms are categorized into supervised, unsupervised, self-supervised, and reinforcement learning [1]. The use of supervised machine learning is increasing in geological studies, such as geochemical exploration [5], distinguishing lithological units [6,7,8], identifying lithium-bearing pegmatites [9], detecting hydrothermal alteration in porphyry deposits [10], mapping linear geological structures [3], locating podiform chromite deposits [11,12], identifying hydrothermal alteration in lode-type gold deposits, and prospecting for volcanogenic massive sulfide, orogenic gold, porphyry copper, epithermal gold, and additional lode-type gold deposits [13,14,15,16]. Supervised ML is a method that uses labeled data for model building to predict values or new class labels. This model tries to learn the relationship between data features and their labels [17]. These methods offer improved classification accuracy, automation, and reproducibility compared to conventional image interpretation approaches [18]. Supervised ML algorithms represent diverse learning paradigms, including linear and nonlinear decision boundaries, bagging and boosting strategies, probabilistic inference, and deep feature learning, thereby enabling a systematic assessment of classification robustness under specific feature conditions [17,19].
A broad suite of supervised machine learning algorithms, such as tree-based ensembles (Random Forest, Decision Tree, Extremely Randomized Trees), kernel-based methods (Support Vector Machine), instance-based learning (K-Nearest Neighbors), probabilistic classifiers (Gaussian Naïve Bayes, Gaussian Process Classification), boosting frameworks (AdaBoost, Gradient Boosting, Histogram Gradient Boosting, XGBoost, LightGBM, CatBoost), linear models (Logistic Regression, Stochastic Gradient Descent), discriminant analysis (LDA, QDA), and neural networks (Artificial Neural Network) [17,19] can be evaluated for geoscientific applications using remote sensing satellite imagery, especially for alteration mapping and mineral exploration. Tree-based ensemble methods such as Random Forest and Extremely Randomized Trees are widely recognized for their resistance to overfitting, ability to model nonlinear relationships, and strong generalization performance in geospatial datasets [20,21]. Kernel-based SVMs maximize class separability in high-dimensional space, making them effective for spectrally overlapping alteration minerals [22,23]. Gradient boosting frameworks (e.g., XGBoost, LightGBM, CatBoost) enhance predictive accuracy through sequential error minimization and regularization strategies [24,25]. In contrast, discriminant analysis and logistic regression provide statistically interpretable baselines, while stochastic gradient descent and neural networks offer scalability and adaptive learning capacity for large datasets [26,27,28].
Satellite remote sensing plays a critical role in regional-scale mineral exploration, especially in arid and semi-arid terrains [29]. The Advanced Spaceborne Thermal Emission and Reflection Radiometer (ASTER) provides multispectral data in the visible to near-infrared (VNIR), short-wave infrared (SWIR), and thermal infrared (TIR) regions [30]. Of particular importance for mineral exploration are the six SWIR bands (1.6–2.43 µm), which are highly sensitive to hydroxyl-bearing minerals. Al–OH and Mg–OH mineral groups exhibit diagnostic absorption features near 2.2 µm and 2.33 µm, enabling the identification of argillic, phyllic, and propylithic alteration zones commonly associated with porphyry and epithermal systems [31]. Despite the extensive use of ASTER SWIR data for hydrothermal alteration mapping, most previous studies have relied on conventional spectral enhancement techniques (e.g., band ratios, PCA, SAM, MF) or have applied a limited number of machine learning classifiers without systematic performance benchmarking [32,33]. Moreover, comparative evaluations across a broad spectrum of linear, nonlinear, ensemble, boosting, probabilistic, and neural-network algorithms using identical input datasets remain scarce. As a result, there is still limited understanding of how algorithmic architecture influences alteration classification accuracy, robustness, and generalizability in multispectral datasets with overlapping spectral responses. A key methodological challenge in alteration mapping using multispectral SWIR data is the spectral similarity between alteration assemblages, particularly within the Al–OH mineral group, where argillic and phyllic zones exhibit overlapping absorption features near 2.2 µm [32,33]. This spectral ambiguity complicates discrimination when using traditional threshold-based or single-model approaches. Therefore, a rigorous algorithmic comparison under controlled preprocessing conditions is required to determine which supervised learning paradigms are most suitable for resolving subtle spectral differences in hydrothermal systems.
The UDMA represents one of the most significant metallogenic belts in Iran, hosting numerous porphyry copper and epithermal deposits formed during Cenozoic subduction-related magmatism [34,35]. The Nain region (Figure 1), located in the central segment of the UDMA, is characterized by Eocene volcanic sequences and Oligo–Miocene intrusive bodies spatially associated with hydrothermal alteration and porphyry copper mineralization. The Kahang deposit has been investigated by numerous researchers. In addition to geological, ore microscopy, and fluid inclusion studies, ref. [36] performed 40Ar/39Ar dating on hydrothermal biotites associated with the porphyry stock and potassic alteration zone, and obtained an age of approximately 14 Ma for the hydrothermal alteration and Cu-(Mo) mineralization event. Ref. [37] determined an age of approximately 15 Ma for the quartz diorite intrusive body hosting the Kahang deposit based on U–Pb zircon geochronology. A study on the chemistry of hydrothermal biotites from the potassic alteration zone showed that the hydrothermal biotites of the Kahang deposit are chemically similar to those of porphyry copper deposits and differ from hydrothermal biotites associated with porphyry molybdenum systems [38]. In addition, several remote sensing studies have been conducted in this area. For example, ref. [39] investigated hydrothermal alteration in the Kahang porphyry copper deposit using ASTER data. The granodiorites hosting the Zafarghand porphyry copper deposit were dated by [40,41,42,43,44,45,46,47,48,49,50,51,52,53] using the U–Pb method and were classified as the oldest mineralization-hosting intrusive bodies in the central UDMA. Remote sensing studies have also been carried out in this area. For instance, ref. [32] used ASTER data to identify hydrothermal alteration patterns in the region. In another study conducted in the Zafarghand area, ref. [41] utilized ASTER satellite imagery to detect hydrothermal alteration zones. Furthermore, ref. [54] employed ASTER satellite data to investigate alteration zones in the northwestern part of the Nain region.
Figure 1.
Schematic deposit model of a typical porphyry copper deposit (modified from [44]). (A) Schematic cross-section showing the distribution and characteristics of hydrothermal alteration zones, including propylitic, phyllic, argillic, and potassic alterations. (B) Schematic cross-section illustrating the ore types associated with each alteration zone.
Although previous studies have employed ASTER data and selected classification methods for alteration mapping in parts of the UDMA [14,32,42,43], a comprehensive evaluation of multiple supervised machine learning algorithms applied to ASTER SWIR surface reflectance data remains limited. Despite the widespread application of ASTER SWIR imagery in hydrothermal alteration mapping, several challenges remain regarding the reliable discrimination of different alteration assemblages in complex porphyry–epithermal environments. In particular, the spectral similarity between Al–OH-bearing minerals associated with argillic and phyllic alteration zones, together with the limited spectral resolution of ASTER SWIR bands, may reduce classification reliability and increase uncertainty in alteration mapping. Furthermore, although machine learning approaches have increasingly been applied in mineral exploration studies, the comparative performance and spatial robustness of different supervised machine learning algorithms for distinguishing hydrothermal alteration minerals in the Urumieh–Dokhtar Magmatic Arc (UDMA) remain insufficiently investigated. Therefore, the main scientific question of this study is whether ASTER SWIR imagery, despite its limited spectral resolution and the spectral overlap between hydrothermal mineral assemblages, can reliably discriminate and spatially map Al–OH and Mg–OH alteration minerals when integrated with supervised machine learning algorithms in a geologically complex porphyry–epithermal environment.
2. Geology of the Study Area
2.1. Regional Geology
UDMA is part of the Zagros orogeny, which resulted from the Neotethys ocean subduction beneath Central Iran [35]. UDMA with about 2000 Km is located between the Central Iran and the Sannandaj–Sirjan zone. The UDMA is hosted for the Cenozoic magmatism activity, and is predominantly formed of the Eocene volcanic rocks and the Oligocene–Miocene intrusive rocks [49]. The UDMA is composed of thick sequences of the calc-alkaline to adakitic lavas and pyroclastics, which formed as intermediate to acidic rocks, including gabbro, diorite, granodiorite, granite, and ignimbrite, tuff, and aglumera [50]. The change in the magma composition from calk-alkaline during the Eocene to adakitic during Oligo–Miocene is related to the transition from the subduction to collision processes [51,52], the latter of which is associated with the porphyry and epithermal mineralization [6].
UDMA is one of the most important host zones of the Iranian porphyry and epithermal deposits [54]. The central part of the UDMA in the Nain region hosts several porphyry deposits, including Kahang, Zafarghand, and the Kahyaz epithermal prospect (Figure 2). These types of deposits are characterized by hydrothermal alteration, which especially occurs with specific patterns around the porphyry deposit. The hydrothermal alteration is a characteristic feature of the porphyry and epithermal deposits, which are commonly formed in most deposits by mineralogical and chemical zoning, with lateral and vertical extension relative to the groundwater table [44,55]. Alteration zones in the Kahang and Zafarghand deposits include phyllic (quartz-sericite-rich), argillic (kaolinite-alunite-rich), and propylithic alteration (epidote-chlorite-calcite-rich) [37,40].
Figure 2.
Geological and location map of the study area (after [45,46,47,48]).
2.2. Local Geology
2.2.1. Kahang Deposit
The Kahang porphyry copper deposit is located 73 km NE of Isfahan, in the central part of the Urmia–Dokhtar magmatic zone. This deposit contains 120 million tons of ore with a grade of 0.6% copper [36], and is the most important copper porphyry deposit in the central part of the UDMA. The geological and alteration map of Kahang is shown in Figure 3. The lithology of the Kahang consists of Paleocene–Eocene volcanic rocks and Oligo–Miocene intrusive rocks. These intrusive rocks, composed of granodiorite and quartz diorite, intruded into the older volcanic rocks with compositions of andesite, basaltic andesite, and tuff. Similar to alteration zones of the porphyry deposits [44], mineralization is surrounded by potassic, phyllic, argillic, and propylitic alterations [36,38,56]. Potassic alteration developed from depths of over 700 m in the central parts of veins and breccia zones within quartz dioritic and monzonitic stocks, and granodiorite [36,56]. This alteration is mainly traceable in the deeper sections. Phyllic alteration is characterized by the development of the main minerals of sericite, quartz, and pyrite. Chlorite is also present as a minor mineral. Sericite forms from the alteration of K-feldspar and plagioclase. The intensity of this alteration is too intense to identify the original minerals [38,56]. Argillic alteration that affected the dacitic and rhyodacitic rocks is characterized by clay minerals dominantly kaolinite. This shallow alteration is considered to be a supergene overprint, and the feldspar-to-clay alteration at depth is most likely of a similar origin. However, it is also possible that the deep portion represents an hypogene argillic alteration. Near to fault contacts, argillic alteration is overprinted by phyllic alteration [38]. Peripheral Propylitic alteration mainly occurs in trachytic and trachyandesitic rocks, and covers a wide area. This alteration is composed of chlorite and epidote, along with minor minerals such as calcite, albite, sericite, and clay minerals [36,38]. The main mineralization in Kahang is chalcopyrite and molybdenite that occurred in the veinlets and breccias associated with the phyllic alteration [57].
Figure 3.
(A) Alteration map of the Kahang deposit (after from [58,59]). (B) Geology map of the Kahang deposit (after from [59]).
2.2.2. Zafarghand Deposit
The Zafarghand copper-molybdenum deposit is located in 89 km northeast of Isfahan, in the central part of the UDMA. Eocene volcanic rocks, consisting of dacite and rhyodacite, are the oldest exposed units in this region [60]. Intrusive bodies, which have intruded into the Eocene volcanic rocks, are composed of granite and porphyry granodiorite. Andesitic-dacitic dikes with NW-SE and NE-SW trends cut the Eocene rock units [32]. Porphyry granodiorite, as a stock form, hosts stockwork veins, veinlets, and mineralized breccia (Figure 4A). Stockwork veins are concentrated in the deeper parts of the deposit and are associated with potassic and phyllic alterations (Figure 4B). Mineralization has occurred in both hypogene and supergene forms. Hypogene mineralization, characterized by sulfide minerals (chalcopyrite and bornite), is limited to potassic and phyllic alteration. Potassic alteration consists of secondary biotite and potassium feldspar, while phyllic alteration is characterized by sericite, pyrite, and quartz minerals. Propylitic alteration, which extends in the outer parts away from the intrusive body, is composed of chlorite, epidote, and carbonate minerals [32].
Figure 4.
(A) Simplified alteration map and (B) geological map of the Zafarghand deposit (after modified from [61]).
2.2.3. Kahyaz and Neighboring Clay Mines
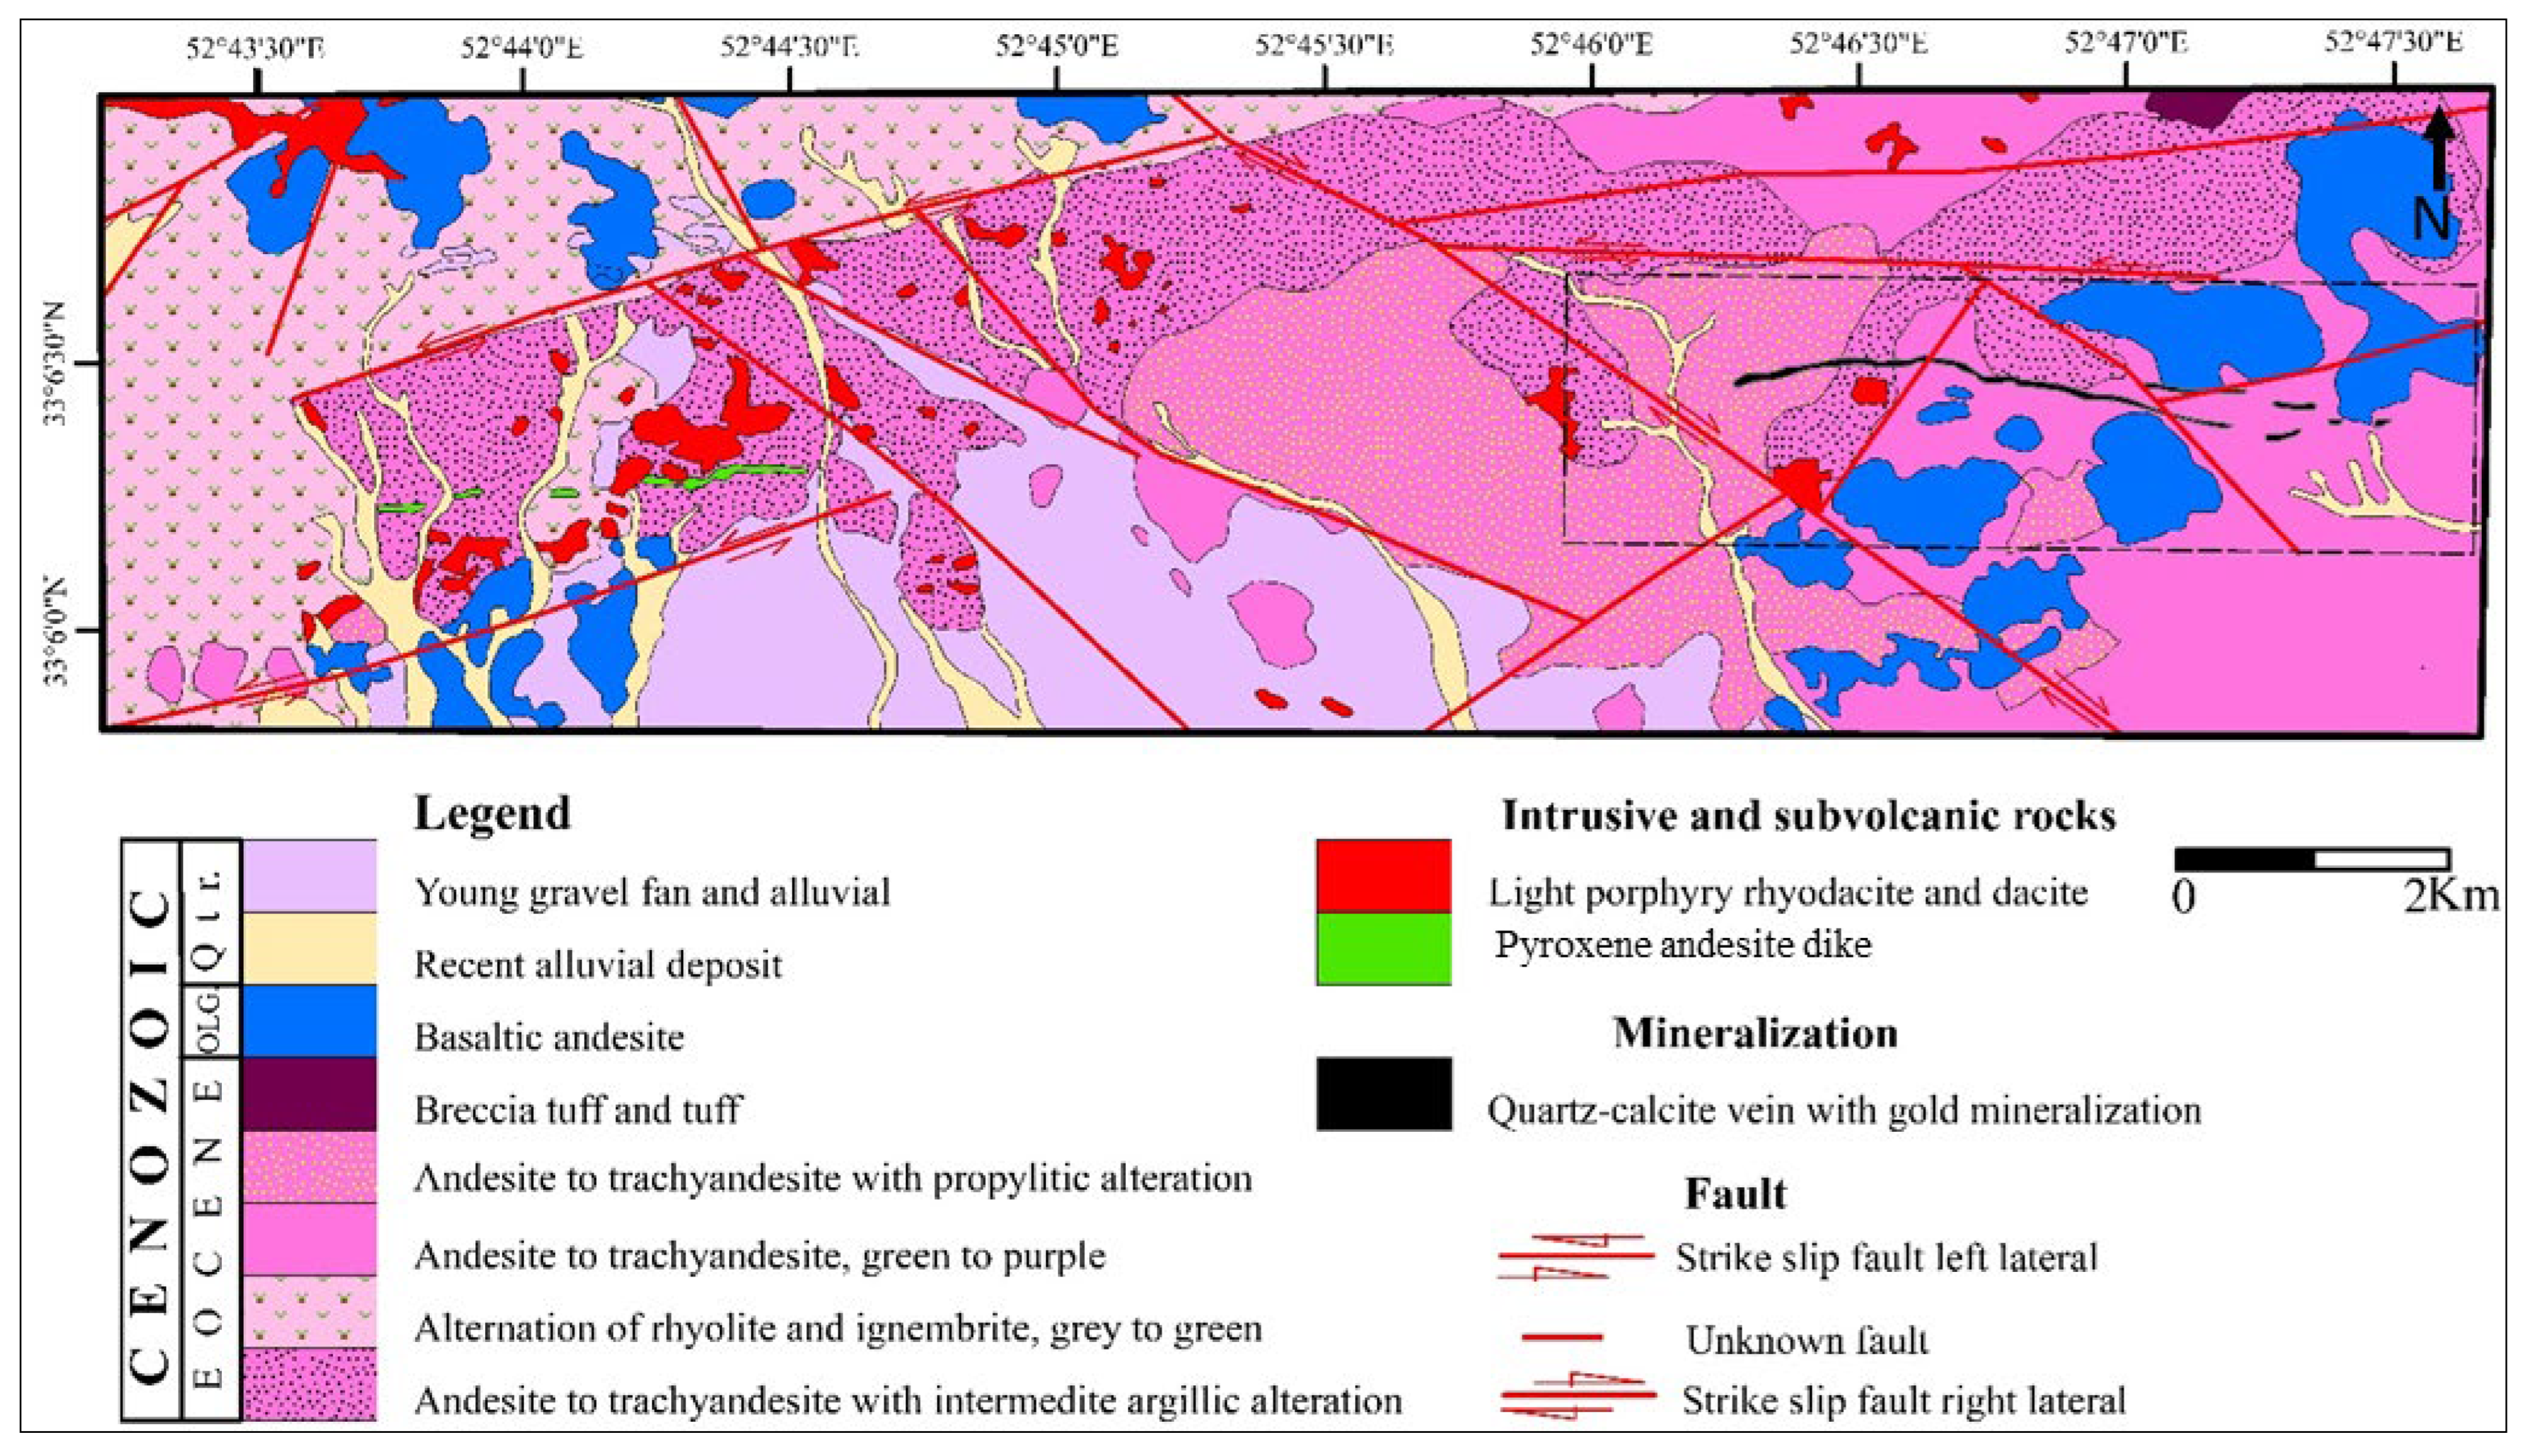
The Kahyaz epithermal gold prospect, located 40 km northwest of Nain in the central UDMA, lies within the central part of the UDMA. Based on the 1:25,000 geological map (Figure 5), the main lithologies of the area consist of Eocene andesitic volcanic rocks, basaltic andesite, and rhyolite, which are overlain by Oligocene basalts. A subvolcanic dacite–rhyodacite intrusive body and microdiorite dikes are exposed in different parts of the area, and they have caused argillic and silicic alteration in various zones. Propylitic alteration, composed of chlorite and epidote, occurs in the andesite and basalt units. Mineralization occurs as a quartz–calcite vein with a length of 2500 m and an average thickness of 7 m. The average gold grade is about 1.1 ppm [62]. The mineralized vein consists of the quartz, calcite, and adularia, and have the colloform and crustiform textures. These features attributed to the low sulfidation epithermal deposits [55,63].
At the regional scale, several clay mines feed the ceramic and porcelain factory of Isfahan town. In the nearby Kahyaz prospect, bentonite deposits of Jahan and Khack mines plus to neighboring area, which are known as Neyestanak bentonite deposits, are formed in the andesite, basaltic andesite, and trachy-andesite host rocks [64]. In this area, propylitic, phyllic, and argillic alterations extend into volcanic and pyroclastic rock units. Propylitic alteration, characterized by epidote and chlorite minerals, is more developed than other alterations and has often occurred in basaltic andesite, andesite, and pyroclastic rocks [42]. Phyllic alteration in this area is characterized by illite, smectite, albite, and quartz minerals, mainly affecting andesites and pyroclastic rocks. Argillic alteration has developed in volcanic and pyroclastic rocks, and formed by the decomposition of potassium feldspar into various clay minerals [42]. Based on remote sensing studies in the Kahang deposit [65], phyllic, argillic, and propylitic alterations have been identified as main alteration zones. According to this study, the phyllic and argillic alterations overlapped; therefore, the classic alteration zoning (from the intrusive body outward: potassic, phyllic, argillic, and propylitic), which is characteristic of porphyry deposits [44], is not observed in this deposit.
Figure 5.
Geological and alteration map of the Kahyaz prospect (after modified from [66]).
2.3. Structural Geology
The distribution of hydrothermal alteration and mineralization in the study area is strongly controlled by regional and local fault systems. At the regional scale, the Qom–Zefreh fault, trending NW–SE, is the most important fault in the area. At the deposit scale, numerous faults parallel to the regional faults are present. For example, in the central part of the Kahang deposit, there is a 700 m-long fault that has influenced the emplacement of igneous bodies [56]. Around the Kahyaz prospect and its surrounding mines, the Kachou-mesghal and Zafarghand faults, with east–west trends, and the Kashan fault, with a northwest–southeast trend, are among the most important faults in the study area. The transpressional movement of these faults has caused brittle deformation events and, consequently, regional mineralization [42]. This area is also structurally active. The presence of brecciated and faulted rocks, as well as the abundance of dikes and mineralized veins, all indicate the structural dynamism of the region. Most faults in this area are strike-slip and normal faults. Northwest–southeast, east–west, and northeast–southwest trends are the dominant orientations of faults at this local scale [42].
Quartz–calcite veins at the Kahyaz are associated with the development of fractures and faults trending NE–SW and NW–SE. The main faults in this area have a NE–SW trend. Most of dikes also have a NE-SW trend. Fractures and one of the main faults in the Kahyaz area show a NW–SE trend [66].
The hydrothermal alteration and mineralization observed in the study area are closely associated with Miocene intrusive bodies, particularly granodioritic and quartz dioritic stocks. These intrusions acted as the heat and fluid sources responsible for the development of hydrothermal systems. Alteration zoning follows the typical porphyry pattern, with potassic alteration occurring near the intrusive centers, surrounded by phyllic and argillic alteration zones, and grading outward into propylitic assemblages. Copper mineralization is spatially associated with the intrusive centers and the surrounding hydrothermal alteration halos, indicating a strong genetic relationship between magmatism, hydrothermal alteration, and ore formation.
2.4. Metallogenic Framework
The study area is located within the central segment of the Urumieh–Dokhtar Magmatic Arc (UDMA), one of the most important porphyry copper belts in Iran. Numerous geological, geochemical, geochronological, mineralogical, and remote sensing investigations have been conducted in the region. Previous studies have demonstrated that the Kahang deposit represents a Miocene porphyry Cu–Mo system genetically associated with granodioritic to quartz dioritic intrusions. Hydrothermal biotite 40Ar/39Ar dating yielded ages of approximately 14 Ma for alteration and mineralization [36], while U–Pb zircon geochronology indicated emplacement ages of about 15 Ma for the host intrusive rocks [37]. Hydrothermal biotite chemistry further confirmed similarities with typical porphyry copper systems [38]. The Zafarghand porphyry system has also been interpreted as a porphyry-style mineralized system based on intrusive-hosted Cu mineralization, hydrothermal alteration zoning, and recent U–Pb zircon geochronology [40]. In addition, several remote sensing studies have mapped hydrothermal alteration patterns in both Kahang and Zafarghand using ASTER imagery [32,41,65]. Collectively, these studies support the interpretation that the investigated area forms part of a long-lived magmatic-hydrothermal system characterized by porphyry-related alteration and mineralization.
3. Materials and Methods
3.1. Remote Sensing Data Characteristics
ASTER is an advanced multispectral imaging sensor that is onboard the TERRA, launched in December 1999, gathering data from March 2000 [30,67]. This instrument collected the triple multispectral images from the Earth in ranges of visible to infrared thermal, including three bands in visible to near-infrared (VNIR) with 0.5 to 0.9 micrometer in wavelength and resolution of 15 m; 6 bands of short-wave infrared (SWIR) with 1.6 to 2.5 micrometers and resolution of 30 m; 5 bands in thermal infrared (TIR) with 8 to 12 micrometers in wavelength and 90 m in resolution [68]. Using the ASTER sensor can distinguish the lithological units and hydrothermally altered districts [14]. The spectral resolution of ASTER data in the SWIR range makes it possible to map detailed alteration zones. OH-bearing minerals show a distinct spectral absorption feature in the short-wave infrared range [69]. Detection of the Al-OH and Mg-OH mineral groups facilitated the determination of the altered area. The argillic alteration zone, characterized by kaolinite and alunite minerals, has a binary absorption signature in 2.16 to 2.2 micrometers, coincident with 6 and 5 bands. Absorption in 2.2 micrometers (or band 6) is stronger than 2.17 micrometers (or band 5). The spectral features of the ASTER sensor and dataset are shown in Table 1. In this study, an AST_07XT ASTER scene (AST_07XT_00305192004072015_20250124020808_18288) acquired on 19 May 2004 was obtained from the NASA Earthdata website (https://www.earthdata.nasa.gov/) (accessed on 4 July 2024). The AST_07XT Level-2 product (Surface Reflectance VNIR and Crosstalk Corrected SWIR) is cloud-free, exhibits minimal vegetation cover, and includes both VNIR and SWIR spectral bands. The mineralogy of the hydrothermal altered minerals was analyzed by X-ray diffraction spectrometer (XRD) in the laboratory of the Bu-Ali Sina university. XRD analyses were carried out using an X-ray diffractometer equipped with a Cu–Kα radiation source (λ = 1.54 Å), operated at 40 kV and 30 mA. Diffraction patterns were recorded over a 2θ range of 2–60° and subsequently interpreted using Powder software (version Profex 5.7.0).
Table 1.
Spectral features of ASTER sensor [70,71].
3.2. Processing of the Datasets for Alteration Mineral Extraction
Endmember, or spectrally pure pixels were identified using Minimum Noise Fraction (MNF) transformation [72,73], followed by Pixel Purity Index (PPI) analysis and n-dimensional visualization [74,75], to construct a reference mineral distribution map. Following matched filtering and spectral screening procedures, a total of 11,127 pixels were selected for the Al–OH class, 14,753 pixels for the Mg–OH class, and 14,388 pixels for the background class. The selected samples were derived from spectrally pure pixels identified using MNF, PPI, and n-D Visualizer analyses and were subsequently verified through Z-profile inspection, field observations, petrographic investigations, and XRD mineralogical analyses. This map was subsequently validated through field surveys. AST_07XT data processing was conducted in ENVI 5.6, whereas supervised machine learning algorithms were implemented in a Jupyter Notebook environment using Python version 3.9.25. The overall workflow for hydrothermal alteration mapping is summarized in the flowchart shown in Figure 6.
Figure 6.
The overall workflow for hydrothermal alteration mapping using the SWIR bands. Spatial cross-validation was implemented using a 5-fold GroupKFold strategy.
Figure 7 presents the grayscale composite of the SWIR bands alongside the corresponding classified reference map. To derive endmembers and construct this reference map, MNF, PPI, and n-dimensional visualization were sequentially applied. MNF enhances class separability while suppressing noise, functioning similarly to Principal Component Analysis (PCA) by transforming the original multiband dataset into a reduced set of components that retain the highest spectral variance [73]. Subsequently, spectrally pure pixels associated with key indicator minerals (Al–OH and Mg–OH groups) were isolated using PPI and n-D visualization. Threshold values for both classes were determined by comparing the matched-filtered images for each class (Figure 8A,B) with false-color composites (Figure 8C). Matched filtering (MF) is an advanced spectral analysis technique that performs partial unmixing to estimate the relative abundance of user-defined endmembers; by maximizing the response of the target spectrum while minimizing background contributions, MF enhances detection and discrimination of the target spectral signature within the imagery [76].
Figure 7.
(A) AST-07XT gray image of the SWIR bands. (B) Distribution map of the Al-OH mineral groups (red color), Mg-OH mineral group (green color) and background (black color).
Figure 8.
MF analytical results for (A) Al-OH mineral groups indicated by bright pixels; (B) Mg-OH mineral group indicated by bright pixels; (C) false color composite image (4, 6, and 8 bands correspond to red (R), green (G), and blue (B) channels of study area); (D) special distribution of the pixels related to two different classes. Background image of 4, 6, and 8 bands related to red (R), green (G), and blue (B), respectively.
3.3. Machine Learning Algorithms for Alteration Mapping
Hydrothermal alteration minerals in the study area were classified using a suite of supervised machine learning (ML) algorithms. The evaluated models included Random Forest (RF), Support Vector Machine (SVM), Extremely Randomized Trees (ET), Decision Tree (DT), K-Nearest Neighbors (KNN), Gaussian Naïve Bayes (GNB), Histogram Gradient Boosting (HGB), Extreme Gradient Boosting (XGBoost), Light Gradient Boosting Machine (LGBM), Categorical Boosting (CatBoost), AdaBoost, Linear Discriminant Analysis (LDA), Gradient Boosting Classifier (GBC), Quadratic Discriminant Analysis (QDA), Approximate Gaussian Process Classification (GPC), and an Artificial Neural Network (ANN).
The RF, DT, and ET classifiers are tree-based models characterized by high computational efficiency, strong class separability, and conceptually simple decision rules [77]. RF is an ensemble method that aggregates numerous randomly constructed decision trees to reduce overfitting and is widely adopted in geosciences owing to its robustness, applicability to both classification and regression, ease of implementation, and capability to handle large datasets [1,20,78,79]. DT is also extensively used due to their interpretability, flexibility for mixed data types, and straightforward application to classification and regression tasks [1,77], whereas Extremely Randomized Trees (ET) further increase randomness by selecting split thresholds at random, typically improving training speed relative to conventional trees [1,17,19].
Gaussian Naïve Bayes (GNB) is a probabilistic classifier based on Bayes’ theorem that assumes Gaussian-distributed features, enabling fast computation of class probabilities and efficient data classification [1,19]. KNN is an instance-based algorithm that assigns class labels according to the majority class among the k closest training samples in feature space; smaller k yields more sensitive, locally adaptive classification, whereas larger k produces smoother, more stable decision boundaries [80]. SVM implements statistical learning theory by mapping input features into a higher-dimensional space and determining an optimal separating hyperplane that maximizes the margin between classes, thereby enhancing generalization and controlling overfitting [1,23,81,82].
AdaBoost is an ensemble technique that iteratively combines multiple weak learners into a strong classifier by reweighting training samples, emphasizing misclassified instances in subsequent iterations, and producing a weighted vote across base learners [21,83,84,85,86]. Gradient Boosting Decision Tree (GBDT) algorithms, including LightGBM, XGBoost, and CatBoost, construct additive tree ensembles by sequentially fitting new trees to residual errors [86]. LightGBM employs histogram-based binning and leaf-wise growth to accelerate training and reduce memory usage while maintaining high accuracy and good generalization, particularly for large datasets [87,88]. XGBoost is an optimized GBDT implementation that incorporates regularization and advanced tree-pruning strategies, making it highly effective for both classification and regression [89,90,91]. CatBoost is specifically designed to handle numerous categorical variables efficiently using oblivious (symmetric) trees and ordered boosting to mitigate target leakage and overfitting, often achieving superior performance on heterogeneous tabular data [86].
Discriminant analysis methods, including Linear Discriminant Analysis (LDA) and Quadratic Discriminant Analysis (QDA), provide relatively simple yet powerful classifiers. LDA assumes common covariance among classes and yields linear decision boundaries, simultaneously serving as an effective dimensionality-reduction technique by maximizing Fisher’s separability criterion without requiring hyperparameter tuning, whereas QDA relaxes the equal-covariance assumption and produces nonlinear boundaries [15,92]. Because of these attributes, LDA has been widely applied in remote sensing for image classification and feature reduction [93].
Figure 6 presents the general workflow adopted for hydrothermal alteration mapping using ASTER SWIR data and supervised machine learning algorithms. The workflow includes data preprocessing, spatially independent dataset preparation, feature extraction from the six ASTER SWIR bands, implementation of multiple supervised classification models, spatial cross-validation using GroupKFold, and final model evaluation based on statistical accuracy metrics, uncertainty analysis, spatial agreement analysis, and geological validation using field observations, petrographic investigations, and XRD analyses. The performance of several nonlinear classifiers, particularly SVM, MLP, XGBoost, and LightGBM, was sensitive to hyperparameter selection. Therefore, Grid Search combined with GroupKFold spatial cross-validation was used to identify optimal parameter combinations. The relatively small differences between cross-validation and independent test accuracies indicate that the optimized models remained stable and did not exhibit substantial sensitivity to parameter variations.
To prevent information leakage, the dataset was first partitioned into spatially independent training and testing subsets based on sample coordinates. Feature standardization (Z-score normalization) was fitted exclusively on the training dataset, and the resulting scaling parameters were subsequently applied to the independent test dataset. Following spatial partitioning, approximately 50% of the samples were assigned to the training subset and 50% to the testing subset. These datasets were then used for model training, spatial cross-validation, and independent performance evaluation.
3.4. Model Evaluation
Model performance was assessed using average accuracy (AA), overall accuracy (OA), recall, precision, F1-score, Cohen’s kappa, and receiver operating characteristic (ROC) curves with the area under the curve (AUC). AA was computed as the mean of per-class accuracies, where each class accuracy was calculated as the ratio of correctly classified pixels to the total number of pixels within that class. Whereas OA represents the proportion of correctly classified pixels over the entire dataset. Recall quantifies the ability of the model to correctly identify positive samples (e.g., pixels belonging to a given alteration class), while precision measures the proportion of predicted positive pixels that are truly positive. The F1-score is the harmonic mean of precision and recall, providing a balanced measure of classification performance. The kappa coefficient expresses the degree of agreement between predicted and true labels beyond chance, ranging from 0 to 1. ROC curves illustrate the trade-off between true positive rate (TPR) and false positive rate (FPR) across decision thresholds, and the AUC summarizes the model’s class-separation capability, with higher AUC values indicating better discrimination. Classification uncertainty was further evaluated using prediction probabilities derived from the classifiers, where lower uncertainty values indicate higher model confidence. TP denotes true positives, and FP denotes false positives [94,95]. The confusion matrix summarizes the predictions of a machine learning classification model in tabular form, where rows represent the true classes and columns represent the predicted classes. In this representation, rows correspond to the true labels and columns to the predicted labels [77].
Spatial cross-validation accuracy (CV_Accuracy) was computed using GroupKFold spatial cross-validation in order to reduce the effects of spatial autocorrelation and evaluate the robustness of the classification models under spatially independent validation conditions. Higher CV_Accuracy values indicate stronger model generalization capability across spatially separated data subsets.
Classification uncertainty was estimated from class probability outputs using the maximum predicted probability for each pixel. Uncertainty values were calculated as:
where (P_i) represents the predicted probability of class membership. Lower uncertainty values indicate higher confidence in the classification results, whereas higher uncertainty values reflect greater ambiguity, spectral overlap, or mixed-pixel conditions.
[Uncertainty = 1 − \max(P_i)]
4. Results and Analysis
In this study, spectral datasets consisting of six ASTER SWIR bands sensitive to Al–OH and Mg–OH hydrothermal alteration minerals were used as input features for machine learning classification. To reduce scale-related effects among spectral bands, all variables were standardized using Z-score normalization (StandardScaler). Because the spectral behavior of Al–OH and Mg–OH mineral groups may exhibit both linear and nonlinear separability within the ASTER SWIR feature space, a wide range of supervised machine learning algorithms, including linear, nonlinear, tree-based, ensemble, and neural-network classifiers, were implemented and comparatively evaluated. To reduce the effects of spatial autocorrelation and improve the reliability of model evaluation, the dataset was divided into spatially independent training and test subsets based on spatial coordinates. Pixels located on one side of the study area were used for training, whereas spatially separated pixels were used for testing. In addition, GroupKFold spatial cross-validation was applied during model evaluation using spatial blocks generated from pixel coordinate. The performance of the machine learning models was evaluated using multiple statistical metrics, including overall accuracy (OA), average accuracy (AA), precision, recall, F1-score, Cohen’s kappa coefficient, AUC, spatial cross-validation accuracy (CV_Accuracy), and uncertainty analysis. The optimized hyperparameters adopted for the different machine learning algorithms are summarized in Table 2.
Table 2.
Selected hyperparameters used for different machine learning algorithms.
4.1. Spectral Features of Alteration Minerals
Al–OH-bearing minerals such as kaolinite, illite, smectite, and montmorillonite exhibit a characteristic absorption maximum near 2.20 µm [96] (Figure 9A). Accordingly, these phases, collectively representing an argillic alteration assemblage, were grouped as the Al–OH mineral class. Chlorite and epidote were assigned to the Mg–OH mineral group, which, together with calcite, displays a prominent absorption feature around 2.35 µm typical of propylitic alteration [97] (Figure 9B,C). A comparative view of the spectral characteristics of the Al–OH and Mg–OH groups is provided in Figure 9D.
Figure 9.
The correspondence between ASTER SWIR spectra and reference spectra from the USGS library for key alteration minerals. (A) compares the Al–OH mineral group spectra derived from ASTER data with USGS spectra for montmorillonite, kaolinite, smectite, and illite. (B) presents an analogous comparison for the Mg–OH mineral group, showing ASTER-derived spectra against USGS reference spectra for epidote and chlorite. (C) compares the ASTER SWIR spectrum of calcite with the USGS calcite reference spectrum. (D) summarizes the diagnostic spectral features by juxtaposing the Al–OH and Mg–OH group spectra.
4.2. Comparison of Machine Learning Results
The classification results obtained from the evaluated machine learning algorithms demonstrated varying levels of performance in discriminating hydrothermal alteration zones using ASTER SWIR data. Among the tested models, SVM_Linear achieved the highest classification performance with an overall accuracy (OA) of 94.50%, average accuracy (AA) of 87.00%, kappa coefficient of 0.8764, and AUC value of 0.9917 (Table 3). SVM_RBF and LDA also showed very strong performance, with OA values of 94.31% and 94.37%, respectively. The MLP classifier produced similarly high results, achieving an OA of 94.05% and a kappa coefficient of 0.8655. Ensemble-based models including Random Forest, Gradient Boosting, HistGradientBoosting, XGBoost, LightGBM, and CatBoost yielded acceptable accuracies ranging between approximately 89% and 92%. Among these methods, LightGBM showed the highest performance with an OA of 91.56%. In contrast, AdaBoost and Gaussian Naive Bayes exhibited substantially lower classification performance. AdaBoost produced an OA of 46.71%, while GaussianNB yielded the lowest OA value of 38.68%, indicating limited capability in separating the hydrothermal alteration classes within the ASTER SWIR feature space. The spatial cross-validation results remained generally high for the majority of models, with SVM_Linear, MLP, and LDA producing cross-validation accuracies above 97%, suggesting relatively stable model behavior under spatial validation conditions. The uncertainty analysis demonstrated that the highest-performing models also exhibited low uncertainty values. SVM_Linear produced one of the lowest mean uncertainty values (0.0128), followed by MLP (0.0081), LDA (0.0137), and SVM_RBF (0.0154), indicating high confidence in the classification outputs. Spatial agreement analysis between the selected high-performing models revealed very strong consistency in the generated hydrothermal alteration maps. The agreement between SVM_Linear and SVM_RBF reached 99.59% with a kappa agreement value of 0.9902, while the agreement between SVM_Linear and MLP reached 99.53%. Similarly, the agreement between MLP and LDA exceeded 98.95%, indicating highly similar spatial distributions among the best-performing classifiers (Table 4).
Table 3.
Performance comparison of supervised machine learning models for hydrothermal alteration mapping based on ASTER SWIR imagery.
Table 4.
Spatial consistency comparison among selected machine learning classifiers using agreement percentage and kappa agreement metrics for hydrothermal alteration classification.
4.3. Confusion Matrix Analysis
The confusion matrices of the machine learning classifiers (Figure 10) indicate that the majority of pixels belonging to the background, Al–OH, and Mg–OH classes were correctly classified. The highest-performing models, particularly SVM_Linear, SVM_RBF, MLP, and LDA, showed strong diagonal dominance in the confusion matrices, reflecting high classification accuracy and reliable separation of hydrothermal alteration classes. Misclassification errors were mainly concentrated between the Al–OH and Mg–OH classes, which is expected due to partial spectral overlap and transitional hydrothermal alteration boundaries within the ASTER SWIR spectral range. The confusion matrices also demonstrate that the background class was generally identified with high accuracy by most classifiers, whereas some confusion occurred between alteration classes in models with lower overall performance. Ensemble tree-based models such as RF, XGBoost, and LightGBM produced relatively balanced classification results with moderate confusion between alteration zones. In contrast, AdaBoost and GaussianNB exhibited substantially higher off-diagonal values, indicating weaker discrimination capability and less reliable class separation.
Figure 10.
Confusion matrices of the classified pixels for the Mg–OH, Al–OH mineral groups, and background obtained using the different machine learning algorithms.
4.4. Final Classified Mineral Maps
The final classified mineral maps produced by the machine learning models reveal the spatial distribution of Al–OH and Mg–OH hydrothermal alteration minerals across the study area (Figure 11). The high-performing classifiers, particularly SVM_Linear, SVM_RBF, MLP, and LDA, generated spatially coherent alteration patterns with relatively low noise and clear discrimination between alteration zones and background areas. The classified maps show that Al–OH-rich zones are mainly concentrated within structurally controlled central alteration regions, whereas Mg–OH minerals are more widely distributed around the peripheral parts of the hydrothermal system. The spatial patterns identified by the different high-performing models are highly consistent with each other, as confirmed by the spatial agreement analysis. In contrast, lower-performing models such as AdaBoost and GaussianNB produced noisier and less geologically coherent classification patterns. Transitional boundaries between Al–OH and Mg–OH zones are locally observed, reflecting gradual mineralogical variations and mixed spectral responses within hydrothermal alteration systems.
Figure 11.
Final classified mineral maps produced by the different machine learning algorithms, showing the spatial distribution of the Mg–OH and Al–OH mineral groups derived from the AST_07XT data; Al–OH minerals are mapped as red pixels, and Mg–OH minerals as green pixels.
4.5. Uncertainty Analysis
Uncertainty values were calculated from the class probability outputs of the machine learning classifiers. Lower uncertainty values indicate higher confidence in the classification results, whereas higher values represent lower classification confidence. Among the evaluated models, SVM_Linear, SVM_RBF, MLP, and LDA produced the lowest uncertainty values, indicating stable classification performance for distinguishing Al–OH and Mg–OH alteration minerals. In contrast, AdaBoost and Gaussian NB showed relatively higher uncertainty values. The uncertainty map (Figure 12) shows that low uncertainty values are mainly concentrated within the major hydrothermal alteration zones, while higher uncertainty values occur mostly along transitional boundaries and spectrally heterogeneous regions. These areas are likely associated with mixed pixels and gradual mineralogical variations.
Figure 12.
Full-image uncertainty map generated using the SVM Linear classifier for hydrothermal alteration mapping based on ASTER SWIR data. Dark regions represent low uncertainty and high classification confidence, whereas bright red to yellow areas indicate higher uncertainty associated with transitional zones, spectral mixing, and complex hydrothermal alteration boundaries.
4.6. Fieldwork, Petrography, and XRD Analysis
Representative photomicrographs of the main alteration assemblages are shown in Figure 13 and Figure 14. Field investigations (Figure 13) were conducted to validate the hydrothermal alteration zones identified from ASTER SWIR imagery and machine learning classification results. Field observations confirmed the occurrence of argillic and propylitic alteration assemblages within the study area. Argillic alteration zones are characterized by light-colored altered rocks and clay-rich surfaces (Figure 13 C,E,F), whereas propylitic alteration is represented by greenish alteration associated with chlorite–epidote assemblages (Figure 13A,B,D). Several quartz–calcite veins and hydrothermal vein systems were also observed in the field (Figure 13B,G), indicating structurally controlled hydrothermal fluid circulation. In addition, evidence of sulfide mineralization, including chalcopyrite associated with quartz veins and iron oxides, was identified in hand specimens (Figure 13H). These mineral assemblages are consistent with hydrothermal systems commonly associated with porphyry-style mineralization. Field observations further showed strong spatial correspondence with the alteration zones mapped from ASTER SWIR data, particularly within areas classified as Al–OH and Mg–OH mineral assemblages. Petrographic studies indicate that argillic and phyllic alteration developed mainly through the replacement of plagioclase by clay minerals and sericite in andesitic and dacitic–rhyodacitic rocks (Figure 14A–C). Propylitic alteration is widespread in basaltic–andesitic, granodioritic, and andesitic host rocks and is characterized by secondary minerals of chlorite, epidote, and calcite (Figure 14 E,G–I). In addition, the main mineralized vein at the Kahyaz epithermal prospect is composed predominantly of quartz, chalcedony, adularia, and calcite (Figure 14F), which are typical constituents of low-sulfidation epithermal vein systems.
Figure 13.
Field photographs of different alteration types. (A) Outcrop of argillic and propylitic alteration in the Zafarghand porphyry copper prospect (view toward the NE). (B) Argillic and propylitic alterations developed in the dacitic–rhyodacitic and basaltic-andesitic rocks, respectively, and their relationship to a quartz–calcite vein in the Kahyaz epithermal gold prospect (view toward the SW). (C) Close-up view of argillic alteration in the Kahyaz prospect. (D) Extensive propylitic alteration outcrop and its marginal position relative to the centrally located argillic alteration zone. (E,F) views of the clay pit mine face (view toward the NE). (G) Hand specimen of a quartz–calcite vein from the Kahyaz prospect, showing well-developed colloform and crustiform textures. (H) Hand specimen of granodiorite composed of quartz and feldspar from the Zafarghand porphyry copper prospect, in which quartz veinlets, chalcopyrite, and iron oxides are visible.
Figure 14.
Photomicrographs (under plane-polarized light (PPL) and cross-polarized light (XPL)) showing different hydrothermal alteration types in the study area. (A) Andesitic sample from the Kahyaz prospect, where plagioclase has been altered to clay minerals. (B) Rhyodacitic sample with argillic alteration from the Kahyaz prospect; plagioclase and quartz occur within a clay-rich matrix. (C) Dacitic sample from the Kahyaz prospect, showing sericitization of plagioclase. Most plagioclase crystals have been replaced by sericite as a result of phyllic alteration. (D) Basaltic-andesite sample from the Kahyaz prospect with intense propylithic alteration; plagioclase has been replaced by calcite, while chlorite has formed through alteration of mafic minerals (pyroxene). (E) Microdiorite sample from the Kahyaz prospect; plagioclase is completely altered to calcite, and chlorite has developed as an alteration product of pyroxene. (F) Quartz vein sample from the Kahyaz prospect; quartz, chalcedony, adularia, and calcite constitute the main minerals of the mineralized vein. (G) Granodiorite sample from the Zafarghand deposit; plagioclase and quartz are the dominant primary minerals. Orthopyroxene has been altered to chlorite. (H) Granodiorite sample from the Zafarghand deposit; chlorite has replaced actinolite. (I) Andesitic sample from the Zafarghand deposit; plagioclase has been altered to epidote. The images were acquired under cross-polarized light (XPL) conditions. Abbreviations: Py = pyrite; Pl = plagioclase; Clay min. = clay mineral; Qz = quartz; Cal = calcite; Ser = sericite; Chl = chlorite; Ad = adularia; Ccd = chalcedony; Opx = orthopyroxene; Act = actinolite; Ep = epidote.
Petrographic investigations (Figure 14) and XRD analyses (Figure 15) further confirmed the presence of hydrothermal minerals, including illite, muscovite, montmorillonite, chlorite, and epidote. XRD analyses (Figure 15) of representative alteration samples indicate that the phyllic alteration zone is characterized primarily by illite, muscovite, and paragonite. In contrast, the argillic alteration zone is dominated by illite–montmorillonite, accompanied by faujasite, gypsum, and calcite. These mineral assemblages are consistent with the hydrothermal alteration patterns identified from ASTER SWIR data (Figure 15).
Figure 15.
X-ray diffraction (XRD) patterns of representative hydrothermal alteration samples. (A) Phyllic alteration assemblage dominated by illite and muscovite. (B) Argillic alteration assemblage containing illite–montmorillonite with associated gypsum, calcite, and faujasite. (C) Argillic alteration assemblage characterized by illite–montmorillonite, gypsum, paragonite, and faujasite.
5. Discussion
In porphyry copper systems, hydrothermal alteration and mineralization exhibit both vertical and lateral zoning around intrusive bodies. The location and geometry of porphyry copper systems are commonly controlled by faults and fault intersections. There is a close spatial, genetic, and temporal relationship between porphyry copper systems and intrusive bodies [98]. Porphyry copper deposits are typically located within the central parts of intrusive bodies, which commonly occur as stocks, dikes, and small irregular intrusions [98]. Typical porphyry copper deposits are characterized by a central potassic alteration core composed mainly of biotite and K-feldspar. Outward from the intrusive mass center, the alteration zones gradually transition into phyllic alteration zones containing illite–muscovite (sericite), argillic alteration zones characterized by diagnostic minerals such as kaolinite and alunite, and finally marginal propylitic alteration zones containing characteristic minerals including epidote, chlorite, and carbonate minerals [44]. Typical alteration zones of the porphyry copper deposits show in Figure 1. Porphyry copper deposits usually exhibit an elliptical pattern of phyllic and argillic alteration zones, which are concentrically distributed as halos surrounding intrusive bodies, whereas hydrothermal alteration pattern related to the epithermal deposits is linear [97]. In the epithermal deposits, hydrothermal alteration zones are commonly developed around fluid pathways and mineralized zones, progressing outward from central silicic alteration assemblages toward argillic and propylitic alteration zones [55].
This study utilized the ASTER AST_07XT SWIR surface reflectance product (1–2.5 µm) to detect hydrothermal alteration minerals characterized by diagnostic absorption features associated with hydroxyl-bearing Mg–OH and Al–OH groups. The integration of MNF transformation, PPI extraction, and n-D visualization enabled the identification of representative spectral pixels corresponding to key alteration minerals. The detected minerals, including kaolinite, alunite, illite, muscovite, chlorite, epidote, and calcite, are typical indicators of argillic, phyllic, and propylitic alteration zones commonly associated with hydrothermal systems. The mapped alteration assemblages show strong spatial correspondence with known mineralized areas in the central part of the Urumieh–Dokhtar Magmatic Arc (UDMA), demonstrating the effectiveness of combining ASTER SWIR data with machine learning approaches for regional-scale hydrothermal alteration mapping.
A wide range of supervised machine learning algorithms was applied to classify the alteration minerals. The comparative analysis of machine learning algorithms demonstrated that several models achieved high classification performance for hydrothermal alteration mapping using ASTER SWIR data. Among all tested models, the SVM_Linear classifier produced the best overall performance, with an overall accuracy (OA) of 94.50%, kappa coefficient of 0.8764, and AUC value of 0.9917. The uncertainty map generated from this model also showed generally low uncertainty values over most alteration zones, indicating high model confidence in the classification results. The SVM_RBF and MLP models also exhibited very strong performance, with OA values of 94.31% and 94.05%, respectively. These models produced spatially coherent alteration patterns that were highly consistent with the SVM_Linear results. The spatial agreement analysis confirmed this similarity, where the agreement between SVM_Linear and SVM_RBF reached 99.59% with a kappa agreement of 0.9902, indicating nearly identical spatial predictions. LDA also showed competitive performance (OA = 94.37%), suggesting that the spectral separation between alteration classes is relatively strong within the selected ASTER SWIR feature space. In contrast, ensemble tree-based methods such as Random Forest, Extra Trees, Gradient Boosting, HistGradientBoosting, XGBoost, LightGBM, and CatBoost produced slightly lower accuracies, although they still achieved acceptable classification results and generated spatial patterns generally consistent with the high-performing models. Decision Tree and QDA showed moderate performance, while AdaBoost and Gaussian Naive Bayes produced significantly lower accuracies and less reliable spatial distributions. GaussianNB generated noisy classification patterns likely due to its assumption of feature independence and sensitivity to overlapping spectral distributions. The uncertainty analysis further demonstrated that the best-performing models exhibited low uncertainty values, especially SVM_Linear, SVM_RBF, MLP, and LDA. These results suggest that the selected training samples and spectral signatures were sufficiently representative for distinguishing the Al–OH and Mg–OH hydrothermal alteration groups. Spatial agreement analysis between the selected models revealed very high consistency among SVM_Linear, SVM_RBF, MLP, and LDA, with agreement values generally exceeding 98%. This strong spatial consistency increases confidence in the robustness of the mapped hydrothermal alteration zones. Overall, the results indicate that kernel-based classifiers and neural-network-based approaches are particularly effective for hydrothermal alteration mapping using ASTER SWIR imagery, while simpler statistical classifiers showed weaker performance in handling spectral complexity and mixed pixels.
Although several machine learning algorithms achieved high classification accuracies, each method has inherent methodological limitations. Linear classifiers such as LDA may be less effective when alteration classes exhibit nonlinear spectral boundaries. Nonlinear approaches such as SVM and MLP generally provide greater flexibility but are more sensitive to hyperparameter selection and computational complexity. Tree-based ensemble methods, including RF, ET, and boosting algorithms, are robust to noisy data but may still be affected by spatial autocorrelation and class imbalance. Furthermore, all classifiers remain constrained by the spectral and spatial resolution of ASTER SWIR imagery, which may reduce separability between spectrally similar hydrothermal minerals.
The alteration mineral assemblages identified in this study are consistent with well-established hydrothermal alteration zoning models around porphyry copper deposits. Illite and muscovite are typically associated with phyllic alteration zones, whereas kaolinite and montmorillonite characterize argillic alteration environments. In contrast, chlorite, epidote, and carbonate minerals are representative of propylitic alteration zones located at the outer parts of hydrothermal systems [96]. These mineral groups display diagnostic absorption features in the SWIR region that can be effectively detected using ASTER imagery. Illite and muscovite exhibit an absorption feature near 2.205 µm, corresponding to ASTER band 6, while kaolinite shows a doublet absorption near 2.165 and 2.205 µm that is partially captured by ASTER bands 5 and 6. Similarly, chlorite, epidote, and carbonate minerals display a prominent absorption around 2.33 µm, coinciding with ASTER band 8.
Field observations, petrographic studies, and XRD analyses further confirmed the occurrence of the detected hydrothermal alteration minerals within the mapped zones. These independent geological validations increase confidence in the remote sensing and machine learning results and support the reliability of the interpreted hydrothermal alteration patterns.
In addition, transitional boundaries between hydrothermal alteration zones and the presence of mixed pixels may increase spectral ambiguity and classification uncertainty, particularly in areas characterized by gradual mineralogical variations. The uncertainty analysis performed in this study demonstrated that the majority of pixels exhibit low uncertainty values, whereas higher uncertainty values are mainly concentrated in transitional and spectrally heterogeneous regions. This behavior is consistent with the expected spectral complexity of hydrothermal systems. To reduce the effects of spatial autocorrelation and possible overfitting, a spatially independent validation strategy based on GroupKFold spatial cross-validation was implemented during model evaluation. Potassic alteration zones were not specifically mapped in this study because ASTER SWIR bands are less sensitive to the diagnostic spectral characteristics of potassic minerals such as K-feldspar and biotite. The spectral response of these minerals is generally weaker in the SWIR region compared to Al–OH and Mg–OH alteration minerals. Therefore, the present study mainly focused on alteration assemblages that can be reliably detected using ASTER SWIR data.
Another factor that may influence the interpretation of hydrothermal alteration patterns is the effect of supergene alteration and weathering processes. Oxidation of sulfide minerals and the formation of secondary iron oxides, hydroxides, and clay minerals can locally modify the original hydrothermal mineral assemblages and their spectral responses. Consequently, some spectral signatures detected from ASTER SWIR imagery may represent a combination of primary hydrothermal alteration and secondary supergene processes. Although field observations, petrographic studies, and XRD analyses support the overall interpretation of the mapped alteration zones, the potential influence of supergene alteration should be considered when interpreting alteration boundaries and mineral distributions.
The spatial distribution of Mg–OH and Al–OH minerals mapped in this study provides valuable insights into the hydrothermal alteration system associated with mineralization in the study area. Al–OH minerals, including illite, muscovite, and kaolinite, are typically concentrated in phyllic and argillic alteration zones that commonly occur near the central parts of porphyry systems. In contrast, Mg–OH minerals such as chlorite and epidote generally characterize propylitic alteration zones that develop in the outer portions of hydrothermal systems. The alteration patterns detected in this study show spatial agreement with known mineral occurrences such as the Zafarghand and Kahang porphyry copper deposits and nearby prospects, including Kahyaz, as well as the Khak and Jahan industrial mineral mines. This spatial relationship highlights the exploration significance of the mapped alteration halos and suggests that additional mineralized zones may occur within areas exhibiting similar spectral signatures.
Despite the promising results, some limitations should be considered. One challenge is the limited spectral capability of ASTER for distinguishing between argillic and phyllic alteration zones. Illite–muscovite (phyllic) and kaolinite (argillic) minerals share similar absorption characteristics near 2.2 µm, and the lack of a dedicated ASTER band exactly matching the 2.165 µm absorption feature reduces the ability to separate these alteration types precisely. Consequently, kaolinite-bearing argillic zones may be grouped with other Al–OH minerals in the classification results. Although several classifiers achieved high classification accuracies, these results should be interpreted considering the limitations of ASTER SWIR imagery. Spectral overlap among hydrothermal minerals, mixed-pixel effects, and spatial autocorrelation may influence classification performance. Consequently, uncertainty analysis, independent testing, and geological validation were incorporated to provide a more realistic assessment of model reliability.
Potassic alteration was not considered in this study for several reasons. First, potassic alteration zones are commonly poorly exposed at the surface [46]. Second, biotite, one of the key indicator minerals of potassic alteration, exhibits spectral features near 2.32 μm that overlap with those of chlorite, phlogopite, and carbonate minerals in ASTER SWIR data [99]. Furthermore, K-feldspar, another diagnostic mineral of potassic alteration, is also a common constituent of felsic igneous rocks [68], and ASTER SWIR bands do not provide sufficient spectral resolution to discriminate hydrothermal K-feldspar from primary magmatic K-feldspar. Therefore, the present study focused on Al–OH and Mg–OH alteration minerals that can be more reliably identified using ASTER SWIR imagery. Hyperspectral satellite sensors such as PRISMA, which provide finer spectral resolution and dense band coverage in the 2.1–2.3 µm region, offer improved potential for accurately distinguishing argillic and phyllic alteration zones in future studies. Since quartz (including opal and chalcedony), the dominant gangue mineral in many low-sulfidation epithermal gold veins, lacks diagnostic absorption features in the ASTER SWIR region [96,100,101], its direct detection using SWIR data is limited. In contrast, quartz exhibits distinctive spectral characteristics in the ASTER thermal infrared (TIR) bands [68]. Consequently, ASTER TIR imagery may provide a more effective approach for identifying and mapping epithermal quartz veins.
Integrating ASTER SWIR data with supervised machine learning algorithms provides a robust and efficient framework for mapping hydrothermal alteration zones. The strong spatial correspondence observed between the classified Mg–OH and Al–OH mineral maps and known mineralized districts underscores the exploration potential of this workflow at regional scales. Because ASTER datasets are globally available through NASA’s LP DAAC and related archives, the methodology developed here can be readily transferred to other segments of the Urumieh–Dokhtar Magmatic Arc, as well as to analogous porphyry–epithermal belts worldwide.
6. Conclusions
This study demonstrated the effectiveness of integrating ASTER SWIR data with supervised machine learning algorithms for hydrothermal alteration mineral mapping in the central part of the Urumieh–Dokhtar Magmatic Arc (UDMA), Iran. The ASTER AST_07XT surface reflectance product was successfully used to detect diagnostic spectral absorption features associated with hydroxyl-bearing Mg–OH and Al–OH mineral groups within the 2.0–2.4 µm wavelength region. Image processing techniques, including Minimum Noise Fraction (MNF), Pixel Purity Index (PPI), and n-dimensional visualization, enabled the extraction of representative spectral endmembers corresponding to key hydrothermal alteration minerals such as kaolinite, alunite, illite, muscovite, chlorite, epidote, and calcite. A wide range of supervised machine learning algorithms was evaluated for hydrothermal alteration classification. Among the tested classifiers, SVM_Linear, SVM_RBF, LDA, and MLP achieved the highest classification performance, with overall accuracies exceeding 94% and very high spatial agreement between classified maps. The uncertainty analysis further demonstrated that these models produced generally low uncertainty values, indicating high confidence in the classification results. In contrast, simpler statistical models such as GaussianNB and AdaBoost showed substantially lower classification performance and less reliable spatial distributions. The final classified mineral maps reveal spatial patterns that are consistent with well-established hydrothermal alteration zoning models typical of porphyry–epithermal systems. Al–OH alteration zones are mainly concentrated within central hydrothermal regions, whereas Mg–OH minerals are more widely distributed around peripheral propylitic zones. The mapped alteration halos show strong spatial correspondence with known mineralized districts, including the Kahang and Zafarghand porphyry copper deposits and nearby mineral prospects, highlighting the exploration significance of the detected hydrothermal alteration patterns. Although ASTER SWIR imagery provides strong capabilities for regional-scale hydrothermal alteration mapping, its relatively limited spectral resolution restricts the precise discrimination of closely related argillic and phyllic alteration minerals. Future studies integrating hyperspectral satellite datasets such as PRISMA, together with detailed field investigations, laboratory spectroscopy, petrographic studies, and XRD analyses, are expected to improve mineralogical discrimination and exploration targeting accuracy. Overall, the results confirm that the integration of ASTER SWIR data with supervised machine learning algorithms provides a reliable, scalable, and transferable framework for hydrothermal alteration mapping and mineral exploration in magmatic arc environments.
Author Contributions
M.R. conceived and designed the study, prepared the ASTER dataset, carried out the analyses and interpretation, and wrote the manuscript. A.B.P. contributed through critical editing and by providing valuable comments and suggestions on data preparation, which substantially improved the quality of the article. All authors have read and agreed to the published version of the manuscript.
Funding
This research received no external funding.
Data Availability Statement
The data used to support the findings of this study are included within the article.
Acknowledgments
The authors gratefully acknowledge the Faculty of Basic Science, Department of Geology, Bu-Ali Sina University, Hamedan, Iran, for their continuous support of this research. The Institute of Oceanography and Environment (INOS), Universiti Malaysia Terengganu (UMT), is also sincerely thanked for its assistance in editing, revising, and reorganizing the manuscript.
Conflicts of Interest
The authors declare no conflicts of interest.
References
- Binetti, M.S.; Massarelli, C.; Uricchio, V.F. Machine learning in geosciences: A review of complex environmental monitoring applications. Mach. Learn. Knowl. Extr. 2024, 6, 1263–1280. [Google Scholar] [CrossRef] [Scilit]
- Hoseinzade, Z.; Saremi, M.; Shojaei, M.; Mokhtari, A.R.; Pour, A.B.; Mirzabozorg, S.A.A.S.; Hezarkhani, A.; Maghsoudi, A.; Yousefi, S. Fusion of remote sensing and geochemical data using hybrid Variational Autoencoder-BIRCH deep learning algorithm for copper prospectivity mapping. Remote Sens. Appl. Soc. Environ. 2025, 40, 101738. [Google Scholar] [CrossRef] [Scilit]
- Habashi, J.; Pour, A.B.; Muslim, A.M.; Afrapoli, A.M.; Hong, J.K.; Park, Y.; Almasi, A.; Crispini, L.; Hashim, M.; Bagheri, M. Revealing critical mineralogical insights in extreme environments using deep learning technique on hyperspectral PRISMA satellite imagery: Dry Valleys, South Victoria Land, Antarctica. ISPRS J. Photogramm. Remote Sens. 2025, 228, 83–121. [Google Scholar] [CrossRef] [Scilit]
- Cao, J.; Wang, L.; Liu, X.; Wu, S. Evaluating SWIR Spectral Data and Random Forest Models for Copper Mineralization Discrimination in the Zhunuo Porphyry Deposit. Minerals 2026, 16, 213. [Google Scholar] [CrossRef] [Scilit]
- Bai, S.; Zhao, J. A new strategy to fuse remote sensing data and geochemical data with different machine learning methods. Remote Sens. 2023, 15, 930. [Google Scholar] [CrossRef] [Scilit]
- Masoumi, F.; Eslamkish, T.; Abkar, A.A.; Honarmand, M.; Harris, J.R. Integration of spectral, thermal, and textural features of ASTER data using Random Forests classification for lithological mapping. J. Afr. Earth Sci. 2017, 129, 445–457. [Google Scholar] [CrossRef] [Scilit]
- Shirmard, H.; Farahbakhsh, E.; Müller, R.D.; Chandra, R. A review of machine learning in processing remote sensing data for mineral exploration. Remote Sens. Environ. 2022, 268, 112750. [Google Scholar] [CrossRef] [Scilit]
- Bahrami, H.; Esmaeili, P.; Homayouni, S.; Pour, A.B.; Chokmani, K.; Bahroudi, A. Machine learning-based lithological mapping from ASTER remote-sensing imagery. Minerals 2024, 14, 202. [Google Scholar]
- Arian, H.; Alaminia, Z.; Ahmadi, H.; Pour, A.B.; Manesh, S.M.T.; Lentz, D.R.; Parsa, L. Mapping potential zones of Lithium-bearing pegmatites using ASTER and Sentinel-2 remote sensing imagery in the Tagablor Pegmatite Field, Central Afghanistan. Remote Sens. Appl. Soc. Environ. 2025, 38, 101625. [Google Scholar] [CrossRef] [Scilit]
- Seifi, A.; Yousefi, S.; Aryafar, A.; Hosseinjanizadeh, M.; Salajegheh, A.; Farhadian, H. Evaluation of decision tree on ASTER statistical data for segregating alteration zones in Darrehzar deposit, Iran. Earth Sci. Inform. 2025, 18, 481. [Google Scholar] [CrossRef] [Scilit]
- Abubakar, J.; Zhang, Z.; Cheng, Z.; Yao, F.; Bio Sidi, D.; Bouko, A.A. Advancing skarn iron ore detection through multispectral image fusion and 3d convolutional neural networks (3d-cnns). Remote Sens. 2024, 16, 3250. [Google Scholar] [CrossRef] [Scilit]
- Eskandari, A.; Hosseini, M.; Nicotra, E. Application of satellite remote sensing, UAV-geological mapping, and machine learning methods in the exploration of podiform chromite deposits. Minerals 2023, 13, 251. [Google Scholar] [CrossRef] [Scilit]
- Cracknell, M.J.; Reading, A.M.; McNeill, A.W. Mapping geology and volcanic-hosted massive sulfide alteration in the Hellyer–Mt Charter region, Tasmania, using Random Forests™ and Self-Organising Maps. Aust. J. Earth Sci. 2014, 61, 287–304. [Google Scholar]
- Yousefi, M.; Tabatabaei, S.H.; Rikhtehgaran, R.; Pour, A.B.; Pradhan, B. Application of Dirichlet process and support vector machine techniques for mapping alteration zones associated with porphyry copper deposit using ASTER remote sensing imagery. Minerals 2021, 11, 1235. [Google Scholar] [CrossRef] [Scilit]
- Zhao, S.; Zhang, B.; Yang, J.; Zhou, J.; Xu, Y. Linear discriminant analysis. Nat. Rev. Methods Primers 2024, 4, 70. [Google Scholar] [CrossRef] [Scilit]
- Hao, J.; Duan, L.; Zhang, Y.; Zhao, H.; Shao, Y.; Guo, Y.; Wang, X.; Song, S. Machine learning on white mica short-wave infrared (SWIR) spectral data in the Tengjia Au deposit, Jiaodong peninsula (Eastern China): A prospecting indicator for lode gold deposits. Ore Geol. Rev. 2024, 173, 106230. [Google Scholar] [CrossRef] [Scilit]
- Bzdok, D.; Krzywinski, M.; Altman, N. Machine learning: Supervised methods. Nat. Methods 2018, 15, 5. [Google Scholar] [CrossRef] [Scilit] [PubMed]
- Duda, R.O.; Hart, P.E.; Stork, D.G. Pattern Classification, 2nd ed.; John Wiley & Sons: New York, NY, USA, 2012; ISBN 978-0-471-05669-0. [Google Scholar]
- Shetty, S.H.; Shetty, S.; Singh, C.; Rao, A. Supervised machine learning: Algorithms and applications. In Fundamentals and Methods of Machine and Deep Learning: Algorithms, Tools and Applications; Wiley: Hoboken, NJ, USA, 2022; pp. 1–16. [Google Scholar]
- Breiman, L. Random forests. Mach. Learn. 2001, 45, 5–32. [Google Scholar] [CrossRef] [Scilit]
- Rokach, L. Decision forest: Twenty years of research. Inf. Fusion 2016, 27, 111. [Google Scholar] [CrossRef] [Scilit]
- Vapnik, V.N. The Nature of Statistical Learning Theory, 1st ed.; Springer: Berlin/Heidelberg, Germany, 1995. [Google Scholar]
- Mountrakis, G.; Im, J.; Ogole, C. Support vector machines in remote sensing: A review. ISPRS J. Photogramm. Remote Sens. 2011, 66, 247–259. [Google Scholar] [CrossRef] [Scilit]
- Chen, T.; Guestrin, C. Xgboost: A scalable tree boosting system. In Proceedings of the 22nd Acm Sigkdd International Conference on Knowledge Discovery and Data Mining, San Francisco, CA, USA, 13–17 August 2016; pp. 785–794. [Google Scholar]
- Prokhorenkova, L.; Gusev, G.; Vorobev, A.; Dorogush, A.V.; Gulin, A. CatBoost: Unbiased boosting with categorical features. In Neural Information Processing Systems 31; NeurIPS: Vancouver, BC, Canada, 2018. [Google Scholar]
- Hajaj, S.; El Harti, A.; Pour, A.B.; Khandouch, Y.; Fels, A.E.A.E.; Elhag, A.B.; Ghazouani, N.; Ustuner, M.; Laamrani, A. Evaluation of Heterogeneous Ensemble Learning Algorithms for Lithological Mapping Using EnMAP Hyperspectral Data: Implications for Mineral Exploration in Mountainous Region. Minerals 2025, 15, 833. [Google Scholar] [CrossRef] [Scilit]
- Hajaj, S.; El Harti, A.; Pour, A.B.; Khandouch, Y.; Üstüner, M.; Amiri, M.M. Balancing hyperspectral dimensionality reduction and information preservation for machine learning-based lithological classification using EnMAP hyperspectral imagery. Remote Sens. Appl. Soc. Environ. 2025, 38, 101618. [Google Scholar] [CrossRef] [Scilit]
- Saremi, M.; Maghsoudi, A.; Hezarkhani, A.; Pour, A.B.; Hoseinzade, Z.; Mirzabozorg, S.A.A.S.; Yousefi, M. Enhancing porphyry copper prospectivity mapping: A deep autoencoder-based approach to identify non-deposit points in Varzaghan region, NW Iran. Ore Geol. Rev. 2025, 183, 106705. [Google Scholar] [CrossRef] [Scilit]
- Pour, A.B.; Ranjbar, H.; Sekandari, M.; Abd El-Wahed, M.; Hossain, M.S.; Hashim, M.; Yousefi, M.; Zoheir, B.; Wambo, J.D.T.; Muslim, A.M. Remote sensing for mineral exploration. In Geospatial Analysis Applied to Mineral Exploration; Elsevier: Amsterdam, The Netherlands, 2023; pp. 17–149. [Google Scholar]
- Abrams, M.; Tsu, H.; Hulley, G.; Iwao, K.; Pieri, D.; Cudahy, T.; Kargel, J. The advanced spaceborne thermal emission and reflection radiometer (ASTER) after fifteen years: Review of global products. Int. J. Appl. Earth Obs. Geoinf. 2015, 38, 292–301. [Google Scholar] [CrossRef] [Scilit]
- Pour, A.B.; Hashim, M. The application of ASTER remote sensing data to porphyry copper and epithermal gold deposits. Ore Geol. Rev. 2012, 44, 1–9. [Google Scholar] [CrossRef] [Scilit]
- Fallah, M.; Jamali, H.; Alaminia, Z.; Pour, A.B. ASTER remote sensing data for detecting porphyry copper type alteration patterns in West Zafarghand Cu±Mo deposit, Iran. Int. J. Image Data Fusion 2025, 16, 2429589. [Google Scholar]
- Riaz, K.; Pour, A.B.; Habashi, J.; Muslim, A.M.; Masoumi, I.; Moradi Afrapoli, A.; Hashim, M.; Mehranzamir, K.; Sattari, F. ASTER Remote Sensing Satellite Imagery for Regional Mineral Mapping in the McMurdo Dry Valleys, South Victoria Land, Antarctica. Minerals 2026, 16, 220. [Google Scholar] [CrossRef] [Scilit]
- Alavi, M. Tectonostratigraphic evolution of the Zagrosides of Iran. Geology 1980, 8, 144–149. [Google Scholar] [CrossRef] [Scilit]
- Berberian, M.; King, G.C.P. Towards a paleogeography and tectonic evolution of Iran. Can. J. Earth Sci. 1981, 18, 210–265. [Google Scholar] [CrossRef] [Scilit]
- Aliyari, F.; Afzal, P.; Harati, H.; Zengqian, H. Geology, mineralogy, ore fluid characteristics, and 40Ar/39Ar geochronology of the Kahang Cu-(Mo) porphyry deposit, Urumieh-Dokhtar Magmatic Arc, Central Iran. Ore Geol. Rev. 2020, 116, 103238. [Google Scholar] [CrossRef] [Scilit]
- Raeisi, D.; Zhao, M.; Babazadeh, S.; Long, L.E.; Hajsadeghi, S.; Modabberi, S. Synthesis on productive, sub-productive and barren intrusions in the Urumieh-Dokhtar magmatic arc, Iran, constraints on geochronology and geochemistry. Ore Geol. Rev. 2021, 132, 103997. [Google Scholar] [CrossRef] [Scilit]
- Afshooni, S.Z.; Mirnejad, H.; Esmaeily, D.; Haroni, H.A. Mineral chemistry of hydrothermal biotite from the Kahang porphyry copper deposit (NE Isfahan), Central Province of Iran. Ore Geol. Rev. 2013, 54, 214–232. [Google Scholar] [CrossRef] [Scilit]
- Salehi, T.; Tangestani, M.H. Per-pixel analysis of ASTER data for porphyry copper hydrothermal alteration mapping: A case study of NE Isfahan, Iran. Remote Sens. Appl. Soc. Environ. 2020, 20, 100377. [Google Scholar] [CrossRef] [Scilit]
- Raeisi, D.; Babazadeh, S.; Long, L.E.; Zhao, M.; Cottle, J.M.; Nayebi, N.; Modabberi, S. Geochemical and isotopic signatures, and zircon UPb ages of the oldest known intrusive rocks associated with porphyry Cu deposits in the central Urumieh–Dokhtar magmatic arc, Iran. J. Geochem. Explor. 2024, 256, 107366. [Google Scholar] [CrossRef] [Scilit]
- Esmaelzadeh Kalkhoran, S.; Ghannadpour, S.S.; Moeini Rad, A.; Jalili, H. Comparing the performance of ASTER and LANDSAT 8 satellite images in identifying iron oxide and porphyry copper alterations in Zafarghand region of Isfahan Province. J. Miner. Resour. Eng. 2024, 9, 41–65. [Google Scholar]
- Khademian, F.; Alaminia, Z.; Nadimi, A.; Lentz, D.R.; Ghasemi, A.; Sharifi, M. Structural and alteration zones controls on Cu mineralisation in the northwest of Nain (northeastern Isfahan, Iran): A remote sensing perspective. J. Afr. Earth Sci. 2024, 211, 105151. [Google Scholar] [CrossRef] [Scilit]
- Forouzan, M.; Arfania, R. Integration of the bands of ASTER, OLI, MSI remote sensing sensors for detection of hydrothermal alterations in southwestern area of the Ardestan, Isfahan Province, Central Iran. Egypt. J. Remote Sens. Space Sci. 2020, 23, 145–157. [Google Scholar] [CrossRef] [Scilit]
- Lowell, J.D.; Guilbert, J.M. Lateral and vertical alteration-mineralization zoning in porphyry ore deposits. Econ. Geol. 1970, 65, 373–408. [Google Scholar] [CrossRef] [Scilit]
- Zahedi, M. Geological Map of Esfahan, Scale 1:250,000; Geological Survey of Iran: Tehran, Iran, 1976.
- Nabavi, M.; Amidi, M. Geological Map of Nain 1:250000; Geological Survey of Iran: Tehran, Iran, 1978.
- Amidi, S.M.; Zahedi, M. Geological Map of Kashan 1:250000; Geological Survey of Iran: Tehran, Iran, 1988.
- Nabavi, M.H.; Houshmandzadeh, A. Geological Map of Anarak, Scale 1:250000; Geological Survey of Iran: Tehran, Iran, 1990.
- Agard, P.; Omrani, J.; Jolivet, L.; Whitechurch, H.; Vrielynck, B.; Spakman, W.; Monié, P.; Meyer, B.; Wortel, R. Zagros orogeny: A subduction-dominated process. Geol. Mag. 2011, 148, 692–725. [Google Scholar] [CrossRef] [Scilit]
- Jafari, A.; Ao, S.; Jamei, S.; Ghasemi, H. Evolution of the Zagros sector of Neo-Tethys: Tectonic and magmatic events that shaped its rifting, seafloor spreading and subduction history. Earth-Sci. Rev. 2023, 241, 104419. [Google Scholar] [CrossRef] [Scilit]
- Omrani, J.; Agard, P.; Whitechurch, H.; Benoit, M.; Prouteau, G.; Jolivet, L. Arc-magmatism and subduction history beneath the Zagros Mountains, Iran: A new report of adakites and geodynamic consequences. Lithos 2008, 106, 380–398. [Google Scholar] [CrossRef] [Scilit]
- Shafiei, B.; Haschke, M.; Shahabpour, J. Recycling of orogenic arc crust triggers porphyry Cu mineralization in Kerman Cenozoic arc rocks, southeastern Iran. Miner. Depos. 2009, 44, 265–283. [Google Scholar]
- Aghazadeh, M.; Hou, Z.; Badrzadeh, Z.; Zhou, L. Temporal–spatial distribution and tectonic setting of porphyry copper deposits in Iran: Constraints from zircon U–Pb and molybdenite Re–Os geochronology. Ore Geol. Rev. 2015, 70, 385–406. [Google Scholar] [CrossRef] [Scilit]
- Richards, J.P.; Spell, T.; Rameh, E.; Razique, A.; Fletcher, T. High Sr/Y magmas reflect arc maturity, high magmatic water content, and porphyry Cu ± Mo ± Au potential: Examples from the Tethyan arcs of central and eastern Iran and western Pakistan. Econ. Geol. 2012, 107, 295–332. [Google Scholar] [CrossRef] [Scilit]
- John, D.A.; Vikre, P.G.; du Bray, E.A.; Blakely, R.J.; Fey, D.L.; Rockwell, B.W.; Mauk, J.L.; Anderson, E.D.; Graybeal, F. Descriptive Models for Epithermal Gold-Silver Deposits; No. 2010-5070-Q; US Geological Survey: Reston, VA, USA, 2018.
- Azadi, M.; Mirmohammadi, M.; Hezarkhani, A. Aspects of magmatic–hydrothermal evolution of Kahang porphyry copper deposit, Central Iran. Arab. J. Geosci. 2015, 8, 4873–4893. [Google Scholar] [CrossRef] [Scilit]
- Hajsadeghi, S.; Mirmohammadi, M.; Asghari, O. Evidence of gas plume model in porphyry copper deposits based on anatomy, fluid inclusions and HO isotopes: Insight from Kahang deposit, Iran. Ore Geol. Rev. 2021, 139, 104517. [Google Scholar] [CrossRef] [Scilit]
- Asadi, H. Alteration Map of the Kahang Deposit in 1/1000 Scale; Dorsa Pardazeh Company: Tehran, Iran, 2004. [Google Scholar]
- Zarnab Exploration Consulting Company. Geology and Alteration of the Kahang Area. Report of 1/1000 Map Exploration; NICICo Company Ltd.: Tehran, Iran, 2011. (In Persian) [Google Scholar]
- Radfar, J.; Amini Jehragh, M.; Emami, M. Geological Map of Ardestan, Scale 1:100,000; Geological Survey of Iran: Tehran, Iran, 1999.
- Alaminia, A.; Bagheri, H.; Salehi, M. Geochemical and geophysical investigations and fluid inclusion studies in the exploration area of Zafarghand (Northeast Isfahan, Iran). J. Econ. Geol. 2017, 9, 295–312, (In Persian with English Abstract). [Google Scholar] [CrossRef] [Scilit]
- Barati, B.; Aghazadeh, M. Geology Map of the Kahyaz, Scale 1:25000; Kowsar Industries and Mines Development Investment Company: Tehran, Iran, 2019. [Google Scholar]
- White, N.C.; Hedenquist, J.W. Epithermal environments and styles of mineralization: Variations and their causes, and guidelines for exploration. J. Geochem. Explor. 1990, 36, 445–474. [Google Scholar] [CrossRef] [Scilit]
- Fatahi, S.; Mackizadeh, M.; Khani, N.; Bayat, S. Mineralogy, Geochemistry and Genesis of Mollaahmad Pass Bentonite Deposit, Naein, Isfahan Province, Iran. Acta Geodyn. Geomater. 2020, 17, 61–87. [Google Scholar] [CrossRef] [Scilit]
- Salehi, T.H.; Tangestani, M. Evaluation of WorldView-3 VNIR and SWIR Data for Hydrothermal Alteration Mapping for Mineral Exploration: Case Study from Northeastern Isfahan, Iran. Nat. Resour. Res. 2020, 29, 3479–3503. [Google Scholar] [CrossRef] [Scilit]
- Geochemical Investigations and Preparation of a 1:25,000-Scale Geological Map of the Kahyaz Area; Kowsar Mining and Industries Development Investment Company: Tehran, Iran, 2019.
- Yamaguchi, Y.; Kahle, A.B.; Tsu, H.; Kawakami, T.; Pniel, M. Overview of advanced spaceborne thermal emission and reflection radiometer (ASTER). IEEE Trans. Geosci. Remote Sens. 1998, 36, 1062–1071. [Google Scholar] [CrossRef] [Scilit]
- Ninomiya, Y.; Fu, B.; Cudahy, T.J. Detecting lithology with Advanced Spaceborne Thermal Emission and Reflection Radiometer (ASTER) multispectral thermal infrared “radiance-at-sensor” data. Remote Sens. Environ. 2005, 99, 127–139. [Google Scholar] [CrossRef] [Scilit]
- Zhang, T.; Yi, G.; Li, H.; Wang, Z.; Tang, J.; Zhong, K.; Li, Y.; Wang, Q.; Bie, X. Integrating data of ASTER and Landsat-8 OLI (AO) for hydrothermal alteration mineral mapping in duolong porphyry cu-au deposit, Tibetan Plateau, China. Remote Sens. 2016, 8, 890. [Google Scholar] [CrossRef] [Scilit]
- Fujisada, H.; Sakuma, F.; Ono, A.; Kudoh, M. Design and preflight performance of ASTER instrument protoflight model. IEEE Trans. Geosci. Remote Sens. 1998, 36, 1152–1160. [Google Scholar] [CrossRef] [Scilit]
- Di Tommaso, I.; Rubinstein, N. Hydrothermal alteration mapping using ASTER data in the Infiernillo porphyry deposit, Argentina. Ore Geol. Rev. 2007, 32, 275–290. [Google Scholar] [CrossRef] [Scilit]
- Kruse, F.A.; Richardson, L.L.; Ambrosia, V.G. Techniques developed for geologic analysis of hyperspectral data applied to near-shore hyperspectral ocean data. In Proceedings of the Fourth International Conference on Remote Sensing for Marine and Coastal Environments: Environmental Research Institute of Michigan (ERIM), Orlando, FL, USA, 17–19 March 1997; Volume 17, p. 19. [Google Scholar]
- Green, A.A.; Berman, M.; Switzer, P.; Craig, M.D. A transformation for ordering multispectral data in terms of image quality with implications for noise removal. IEEE Trans. Geosci. Remote Sens. 1988, 26, 65–74. [Google Scholar] [CrossRef] [Scilit]
- Boardman, J.W. Automating spectral unmixing of AVIRIS data using convex geometry concepts. In Summaries of the 4th Annual JPL Airborne Geoscience Workshop; NASA Jet Propulsion Laboratory: Pasadena, CA, USA, 1993; Volume 1. [Google Scholar]
- Boardman, J.W.; Kruse, F.A.; Green, R.O. Mapping target signatures via partial unmixing of AVIRIS data. In Summaries of the Fifth Annual JPL Airborne Earth Science Workshop; NASA Jet Propulsion Laboratory: Pasadena, CA, USA, 1995; Volume 1. [Google Scholar]
- Harris, J.R.; Rogge, D.; Hitchcock, R.; Ijewliw, O.; Wright, D. Mapping lithology in Canada’s Arctic: Application of hyperspectral data using the minimum noise fraction transformation and matched filtering. Can. J. Earth Sci. 2005, 42, 2173–2193. [Google Scholar] [CrossRef] [Scilit]
- Fan, M.; Xiao, K.; Sun, L.; Zhang, S.; Xu, Y. Automated hyperparameter optimization of gradient boosting decision tree approach for gold mineral prospectivity mapping in the Xiong’ershan area. Minerals 2022, 12, 1621. [Google Scholar] [CrossRef] [Scilit]
- Fernández-Delgado, M.; Cernadas, E.; Barro, S.; Ribeiro, J.; Neves, J. Direct Kernel Perceptron (DKP): Ultra-fast kernel ELM-based classification with non-iterative closed-form weight calculation. Neural Netw. 2014, 50, 60–71. [Google Scholar] [CrossRef] [Scilit] [PubMed]
- Ghamisi, P.; Plaza, J.; Chen, Y.; Li, J.; Plaza, A.J. Advanced spectral classifiers for hyperspectral images: A review. IEEE Geosci. Remote Sens. Mag. 2017, 5, 8–32. [Google Scholar] [CrossRef] [Scilit]
- Everitt, B.S.; Laundau, S.; Leese, M.; Stahl, D. Miscellaneous Cluster Methods in Cluster Analysis, 5th ed.; John Wiley & Sons, Ltd.: Chichester, UK, 2006. [Google Scholar]
- Tran, N.; Schneider, J.G.; Weber, I.; Qin, A.K. Hyper-parameter optimization in classification: To-do or not-to-do. Pattern Recognit. 2020, 103, 107245. [Google Scholar] [CrossRef] [Scilit]
- Lachaud, A.; Adam, M.; Mišković, I. Comparative study of random forest and support vector machine algorithms in mineral prospectivity mapping with limited training data. Minerals 2023, 13, 1073. [Google Scholar] [CrossRef] [Scilit]
- Freund, Y.; Schapire, R.E. A decision-theoretic generalization of on-line learning and an application to boosting. J. Comput. Syst. Sci. 1997, 55, 119–139. [Google Scholar] [CrossRef] [Scilit]
- Freund, Y.; Schapire, R.E. A desicion-theoretic generalization of on-line learning and an application to boosting. In Computational Learning Theory; Springer: Berlin/Heidelberg, Germany, 1995. [Google Scholar]
- Freund, Y.; Schapire, R.E. A short introduction to boosting. J. Jpn. Soc. Artif. Intell. 1999, 14, 771–780. [Google Scholar]
- Dev, V.A.; Eden, M.R. Gradient boosted decision trees for lithology classification. Comput. Aided Chem. Eng. 2019, 47, 113–118. [Google Scholar] [CrossRef] [Scilit]
- Ke, G.; Meng, Q.; Finley, T.; Wang, T.; Chen, W.; Ma, W.; Ye, Q.; Liu, T.Y. Lightgbm: A highly efficient gradient boosting decision tree. In Advances in Neural Information Processing Systems 30; NeurIPS: Vancouver, BC, Canada, 2017. [Google Scholar]
- Kim, J.; Lee, H.; Oh, J. Study on prediction of ship’s power using light GBM and XGBoost. J. Adv. Mar. Eng. Technol. 2020, 44, 174–180. [Google Scholar] [CrossRef] [Scilit]
- Li, T.; Xia, Q.; Ouyang, Y.; Zeng, R.; Liu, Q.; Li, T. Prospectivity and Uncertainty Analysis of Tungsten Polymetallogenic Mineral Resources in the Nanling Metallogenic Belt, South China: A Comparative Study of AdaBoost, GBDT, and XgBoost Algorithms. Nat. Resour. Res. 2024, 33, 1049–1071. [Google Scholar] [CrossRef] [Scilit]
- Can, R.; Kocaman, S.; Gokceoglu, C. A comprehensive assessment of XGBoost algorithm for landslide susceptibility mapping in the upper basin of Ataturk dam, Turkey. Appl. Sci. 2021, 11, 4993. [Google Scholar] [CrossRef] [Scilit]
- Zhang, S.; Carranza, E.J.M.; Xiao, K.; Wei, H.; Yang, F.; Chen, Z.; Li, N.; Xiang, J. Mineral prospectivity mapping based on isolation forest and random forest: Implication for the existence of spatial signature of mineralization in outliers. Nat. Resour. Res. 2022, 31, 1981–1999. [Google Scholar] [CrossRef] [Scilit]
- Tharwat, A. Linear vs. quadratic discriminant analysis classifier: A tutorial. Int. J. Appl. Pattern Recognit. 2016, 3, 145–180. [Google Scholar] [CrossRef] [Scilit]
- Bandos, T.V.; Bruzzone, L.; Camps-Valls, G. Classification of hyperspectral images with regularized linear discriminant analysis. IEEE Trans. Geosci. Remote Sens. 2009, 47, 862–873. [Google Scholar] [CrossRef] [Scilit]
- Saljoughi, B.S.; Hezarkhani, A. A comparative analysis of artificial neural network (ANN), wavelet neural network (WNN), and support vector machine (SVM) data-driven models to mineral potential mapping for copper mineralizations in the Shahr-e-Babak region, Kerman, Iran. Appl. Geomat. 2018, 10, 229–256. [Google Scholar] [CrossRef] [Scilit]
- Sun, T.; Li, H.; Wu, K.; Chen, F.; Zhu, Z.; Hu, Z. Data-driven predictive modelling of mineral prospectivity using machine learning and deep learning methods: A case study from southern Jiangxi Province, China. Minerals 2020, 10, 102. [Google Scholar] [CrossRef] [Scilit]
- Rowan, L.C.; Mars, J.C. Lithologic mapping in the Mountain Pass, California area using advanced spaceborne thermal emission and reflection radiometer (ASTER) data. Remote Sens. Environ. 2003, 84, 350–366. [Google Scholar] [CrossRef] [Scilit]
- Mars, J.C.; Rowan, L.C. Regional mapping of phyllic-and argillic-altered rocks in the Zagros magmatic arc, Iran, using Advanced Spaceborne Thermal Emission and Reflection Radiometer (ASTER) data and logical operator algorithms. Geosphere 2006, 2, 161–186. [Google Scholar]
- Sillitoe, R.H. Porphyry copper systems. Econ. Geol. 2010, 105, 3–41. [Google Scholar] [CrossRef] [Scilit]
- Hunt, G.R. Spectral signatures of particulate minerals in the visible and near infrared. Geophysics 1977, 42, 501–513. [Google Scholar] [CrossRef] [Scilit]
- Salisbury, J.W.; D’Aria, D.M. Emissivity of terrestrial materials in the 8–14 μm atmospheric window. Remote Sens. Environ. 1992, 42, 83–106. [Google Scholar] [CrossRef] [Scilit]
- Rockwell, B.W.; Hofstra, A.H. Identification of quartz and carbonate minerals across northern Nevada using ASTER thermal infrared emissivity data—Implications for geologic mapping and mineral resource investigations in well-studied and frontier areas. Geosphere 2008, 4, 218–246. [Google Scholar] [CrossRef] [Scilit]
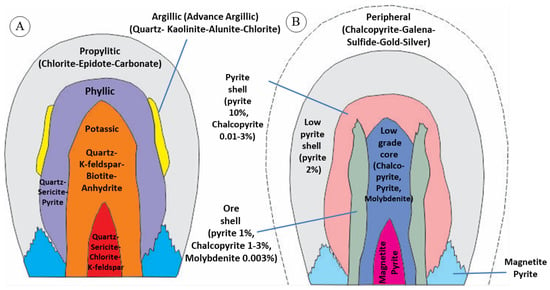
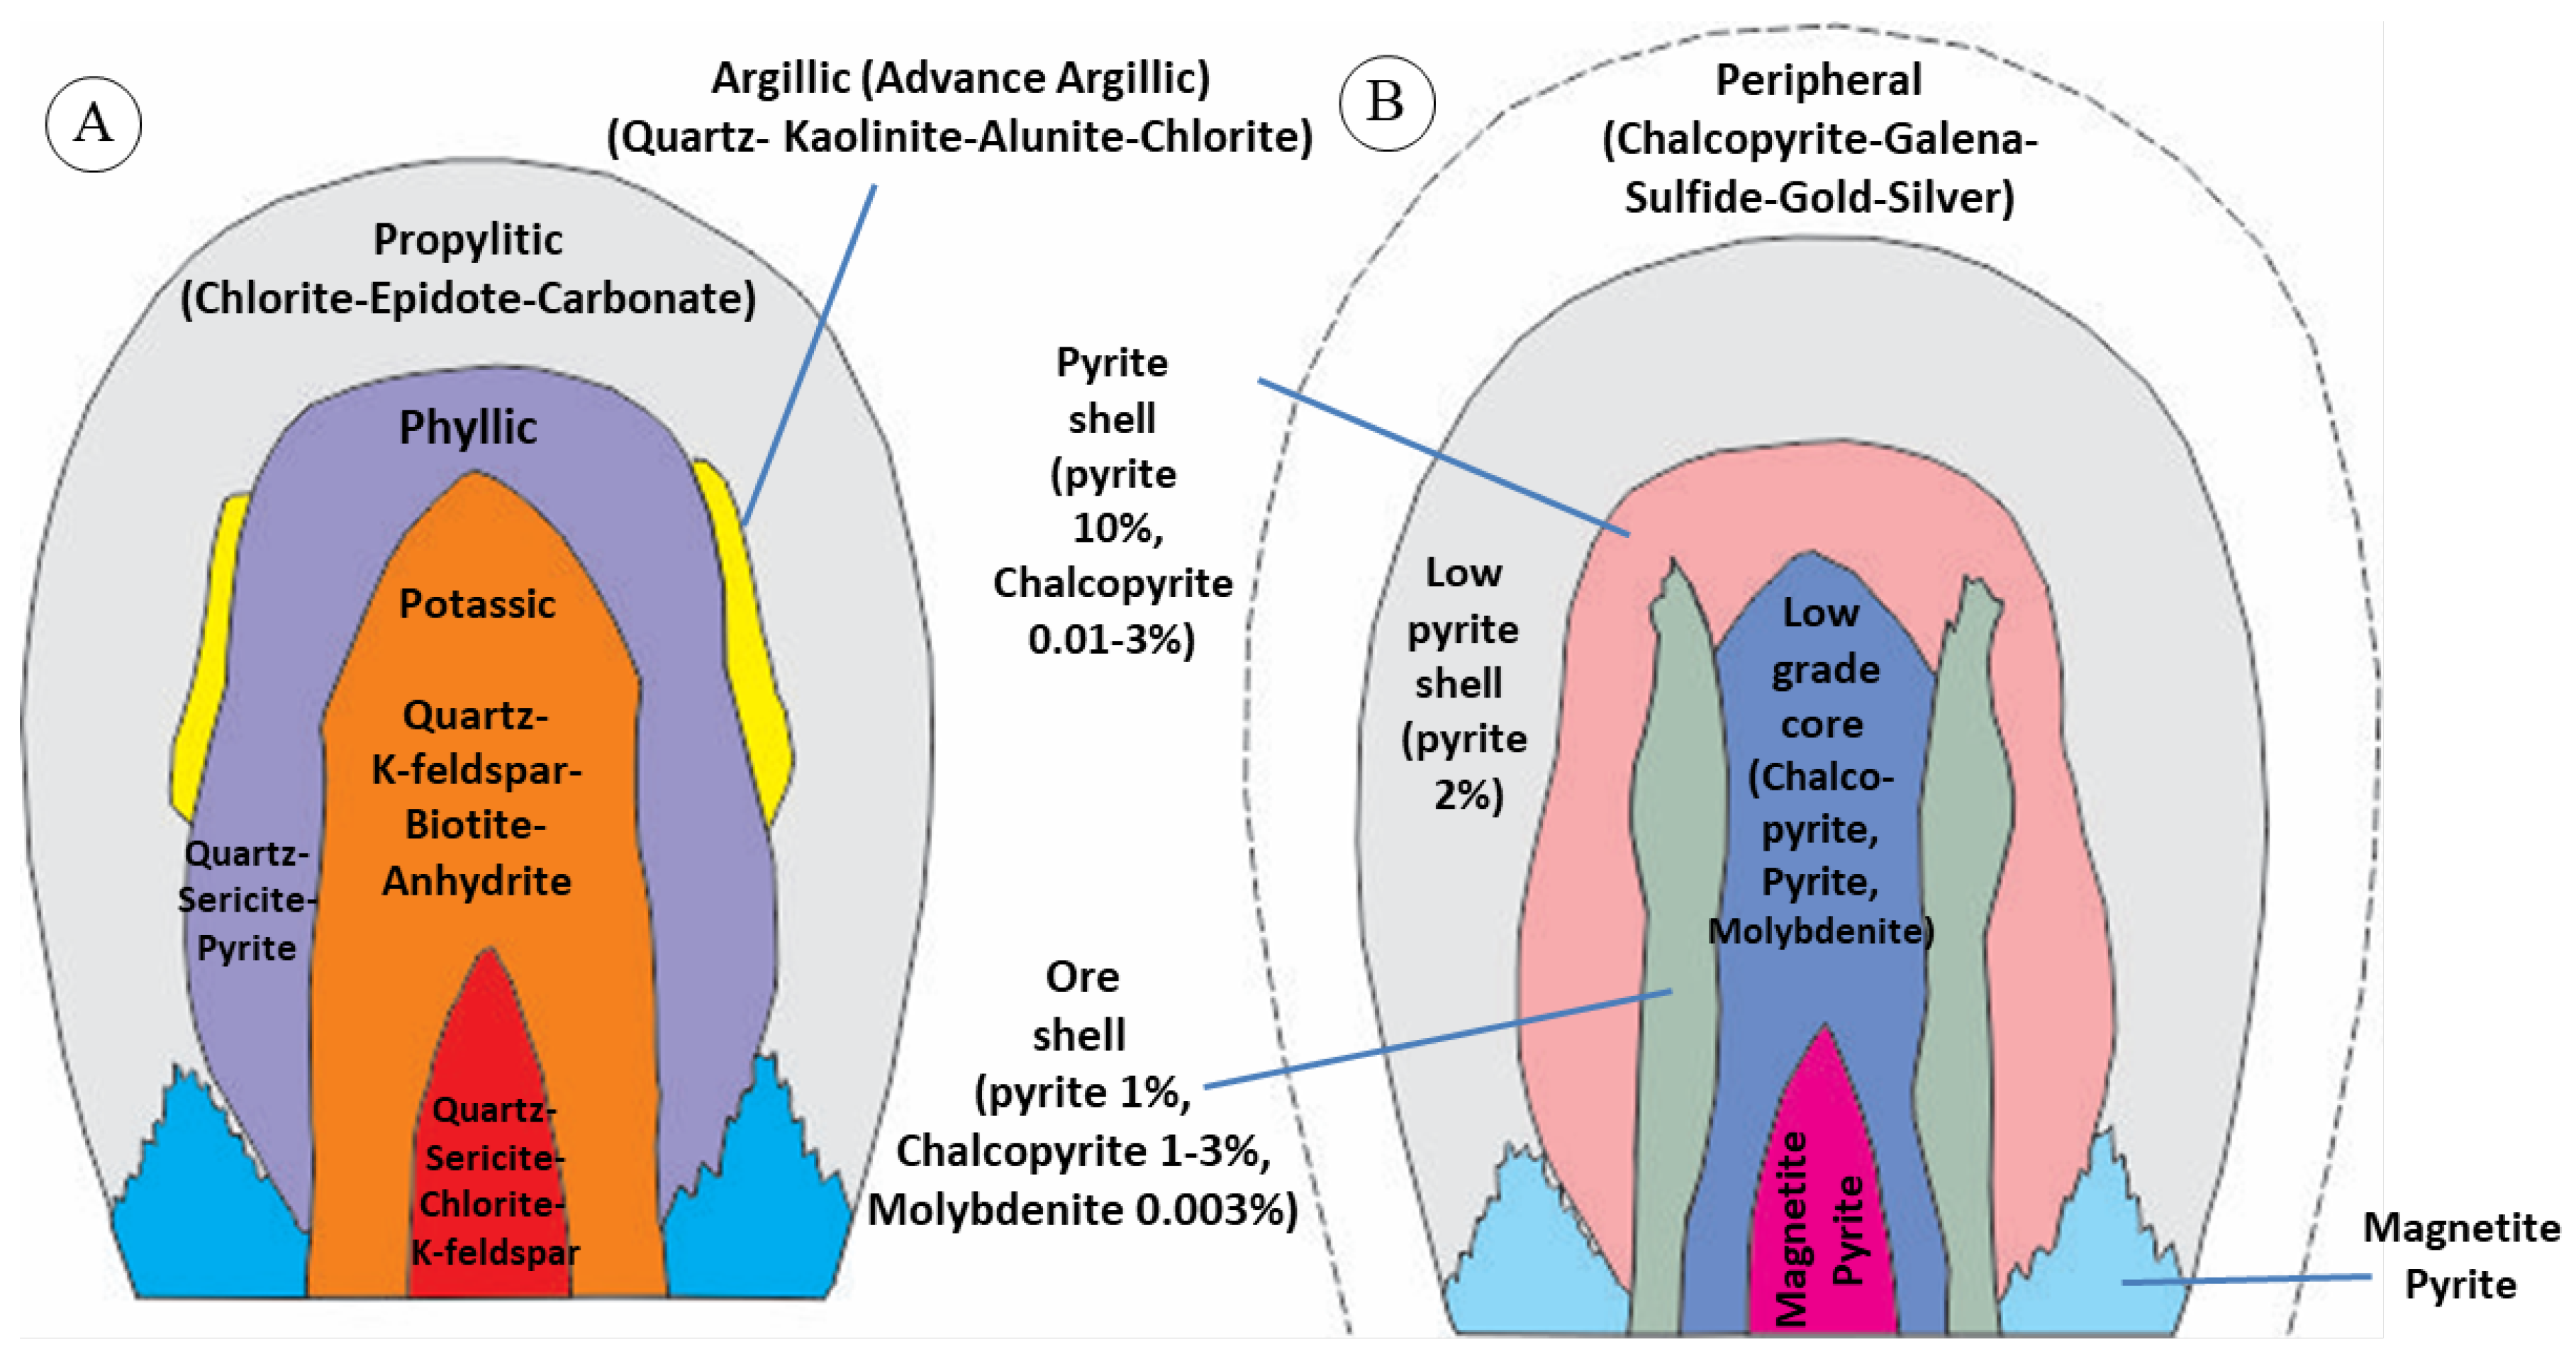
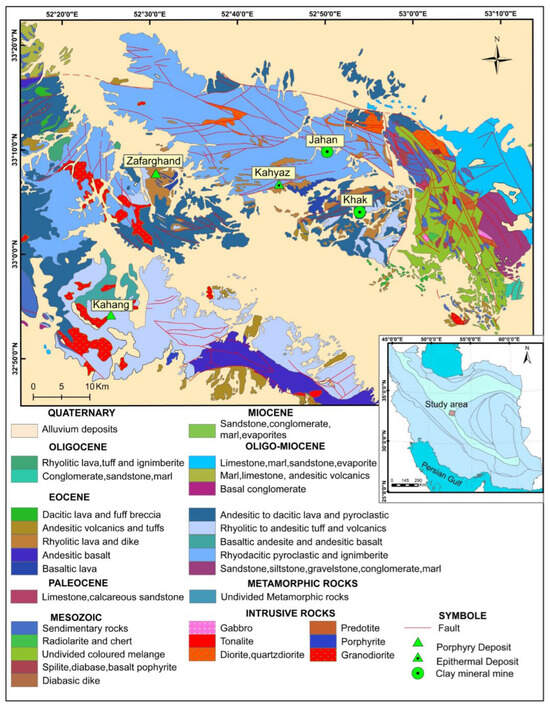
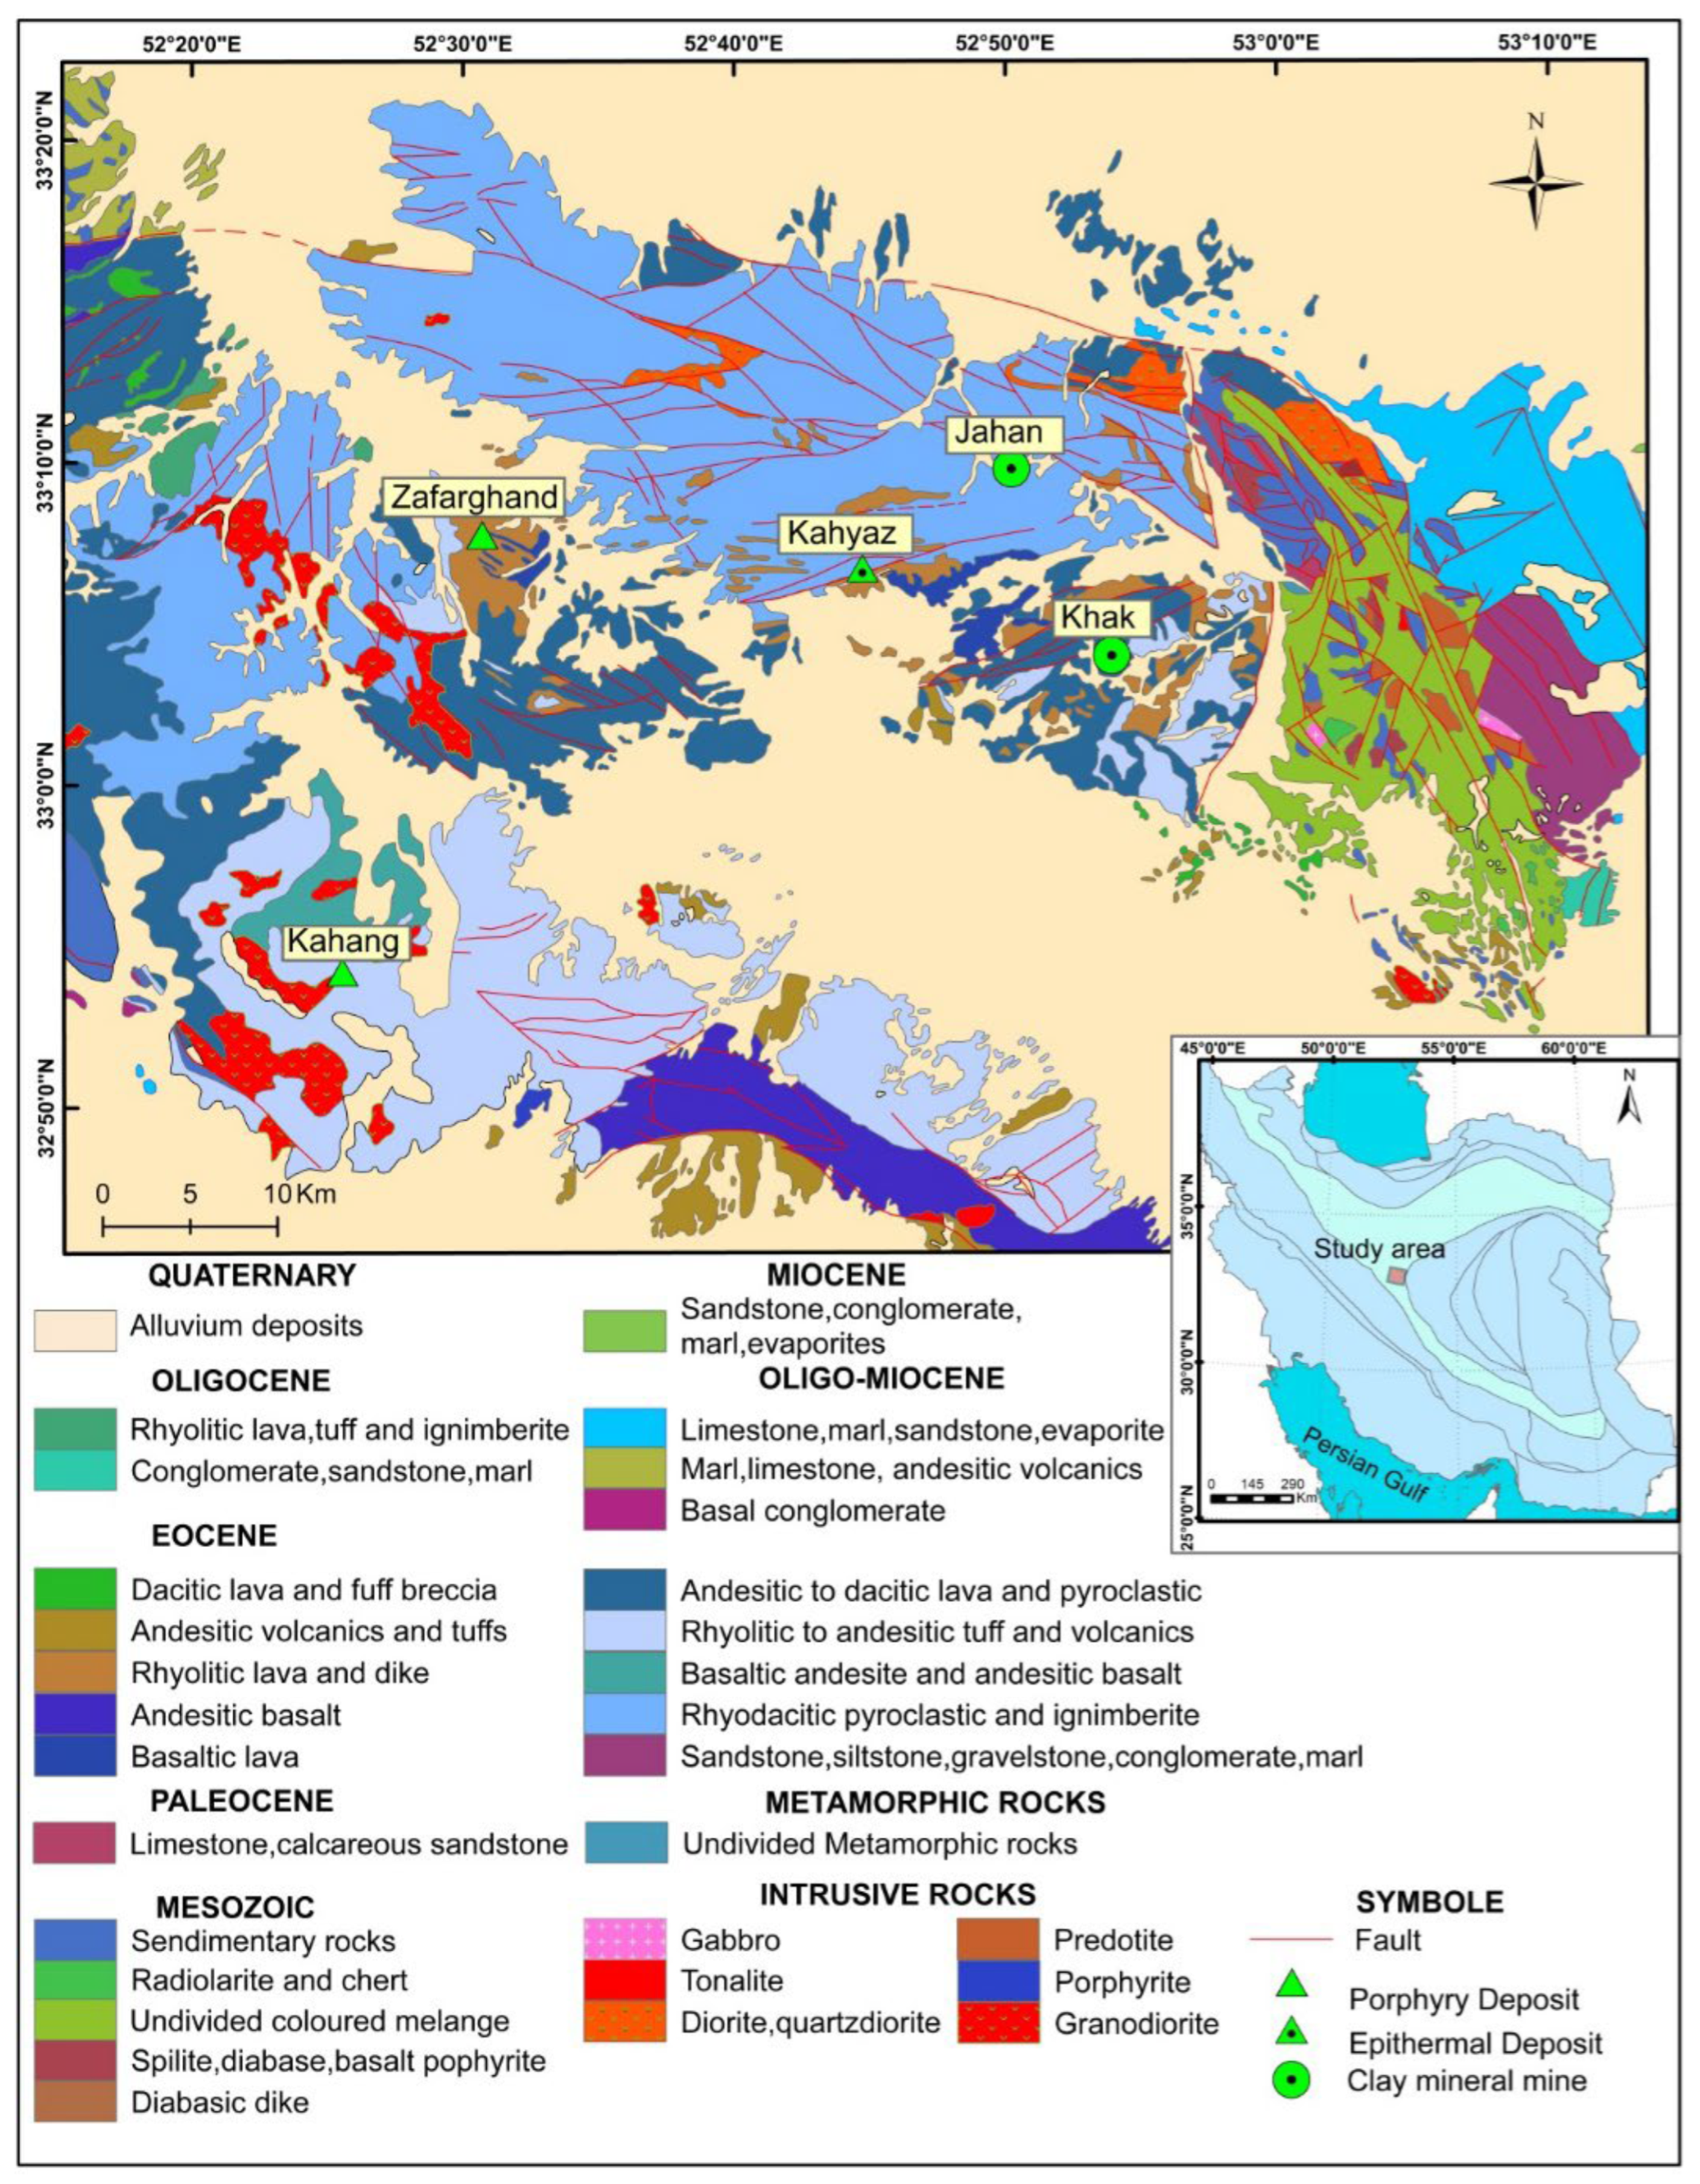
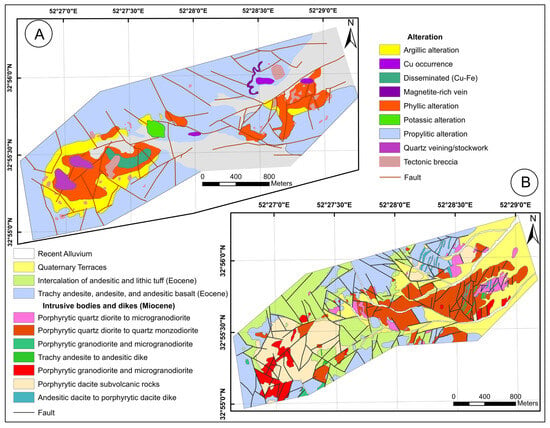
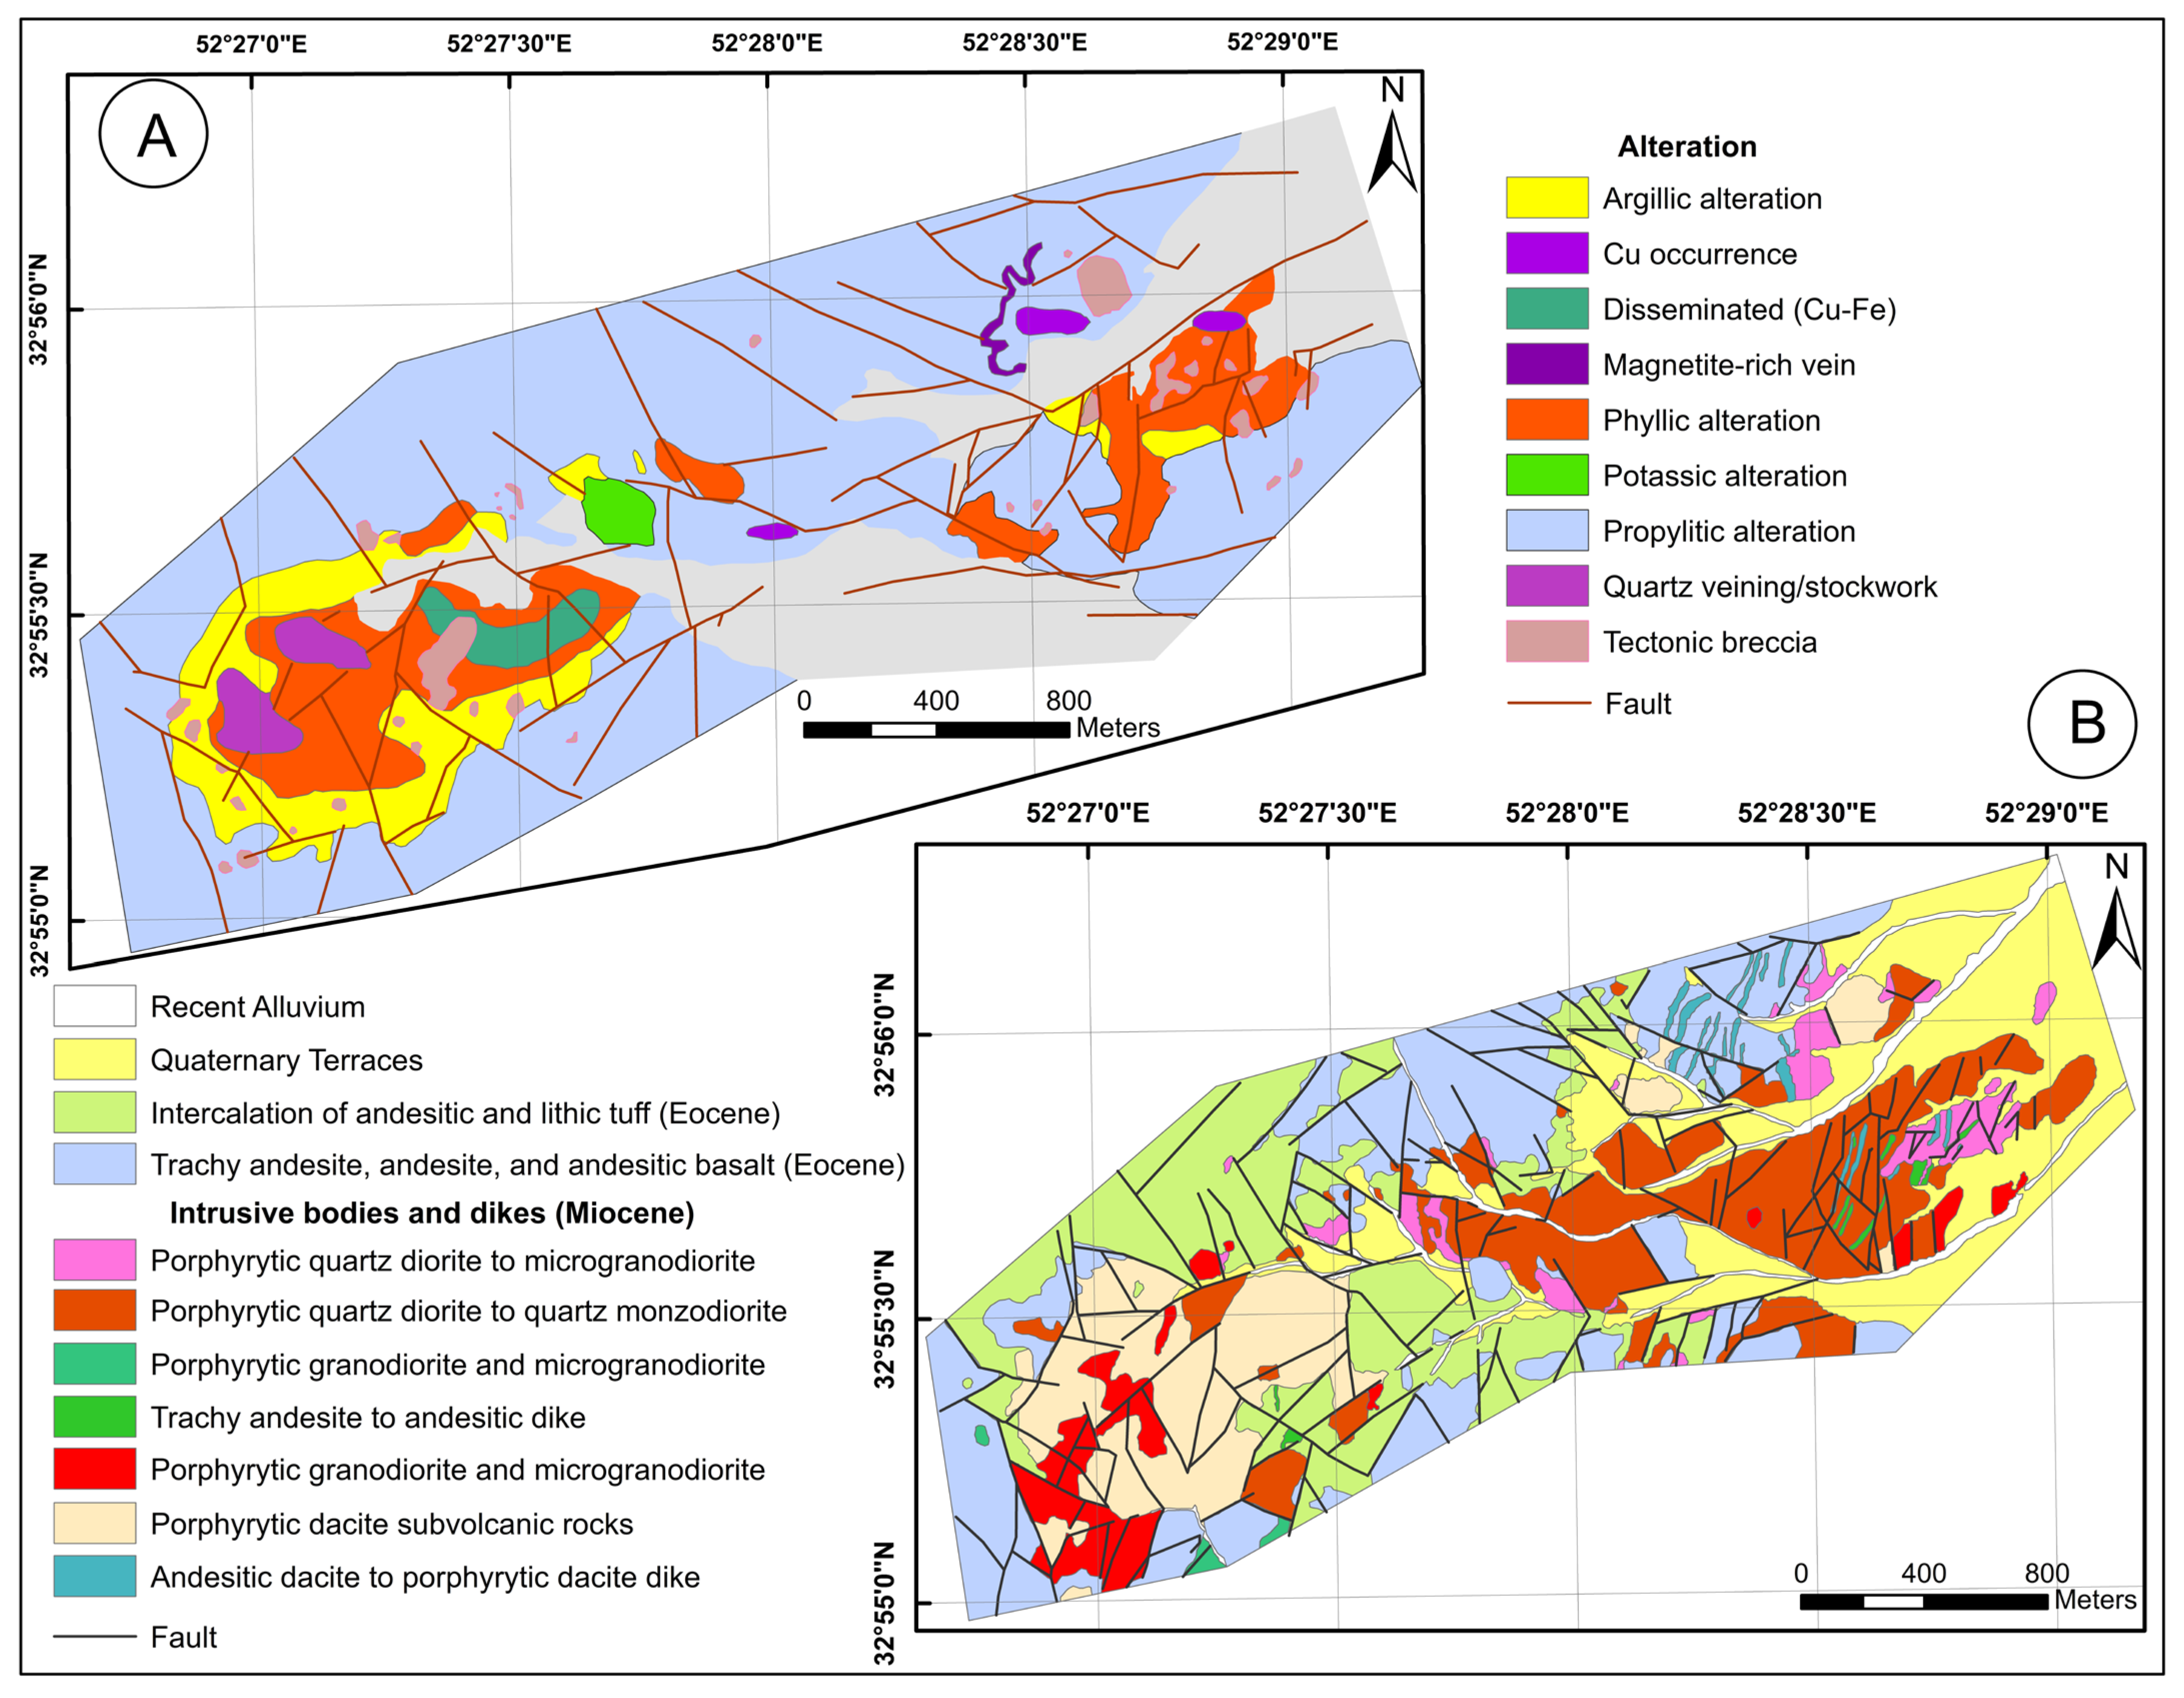
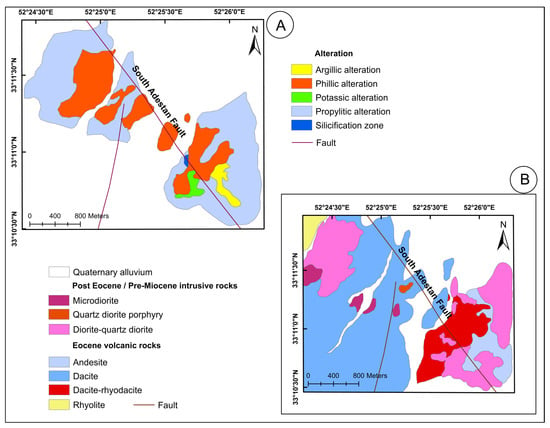
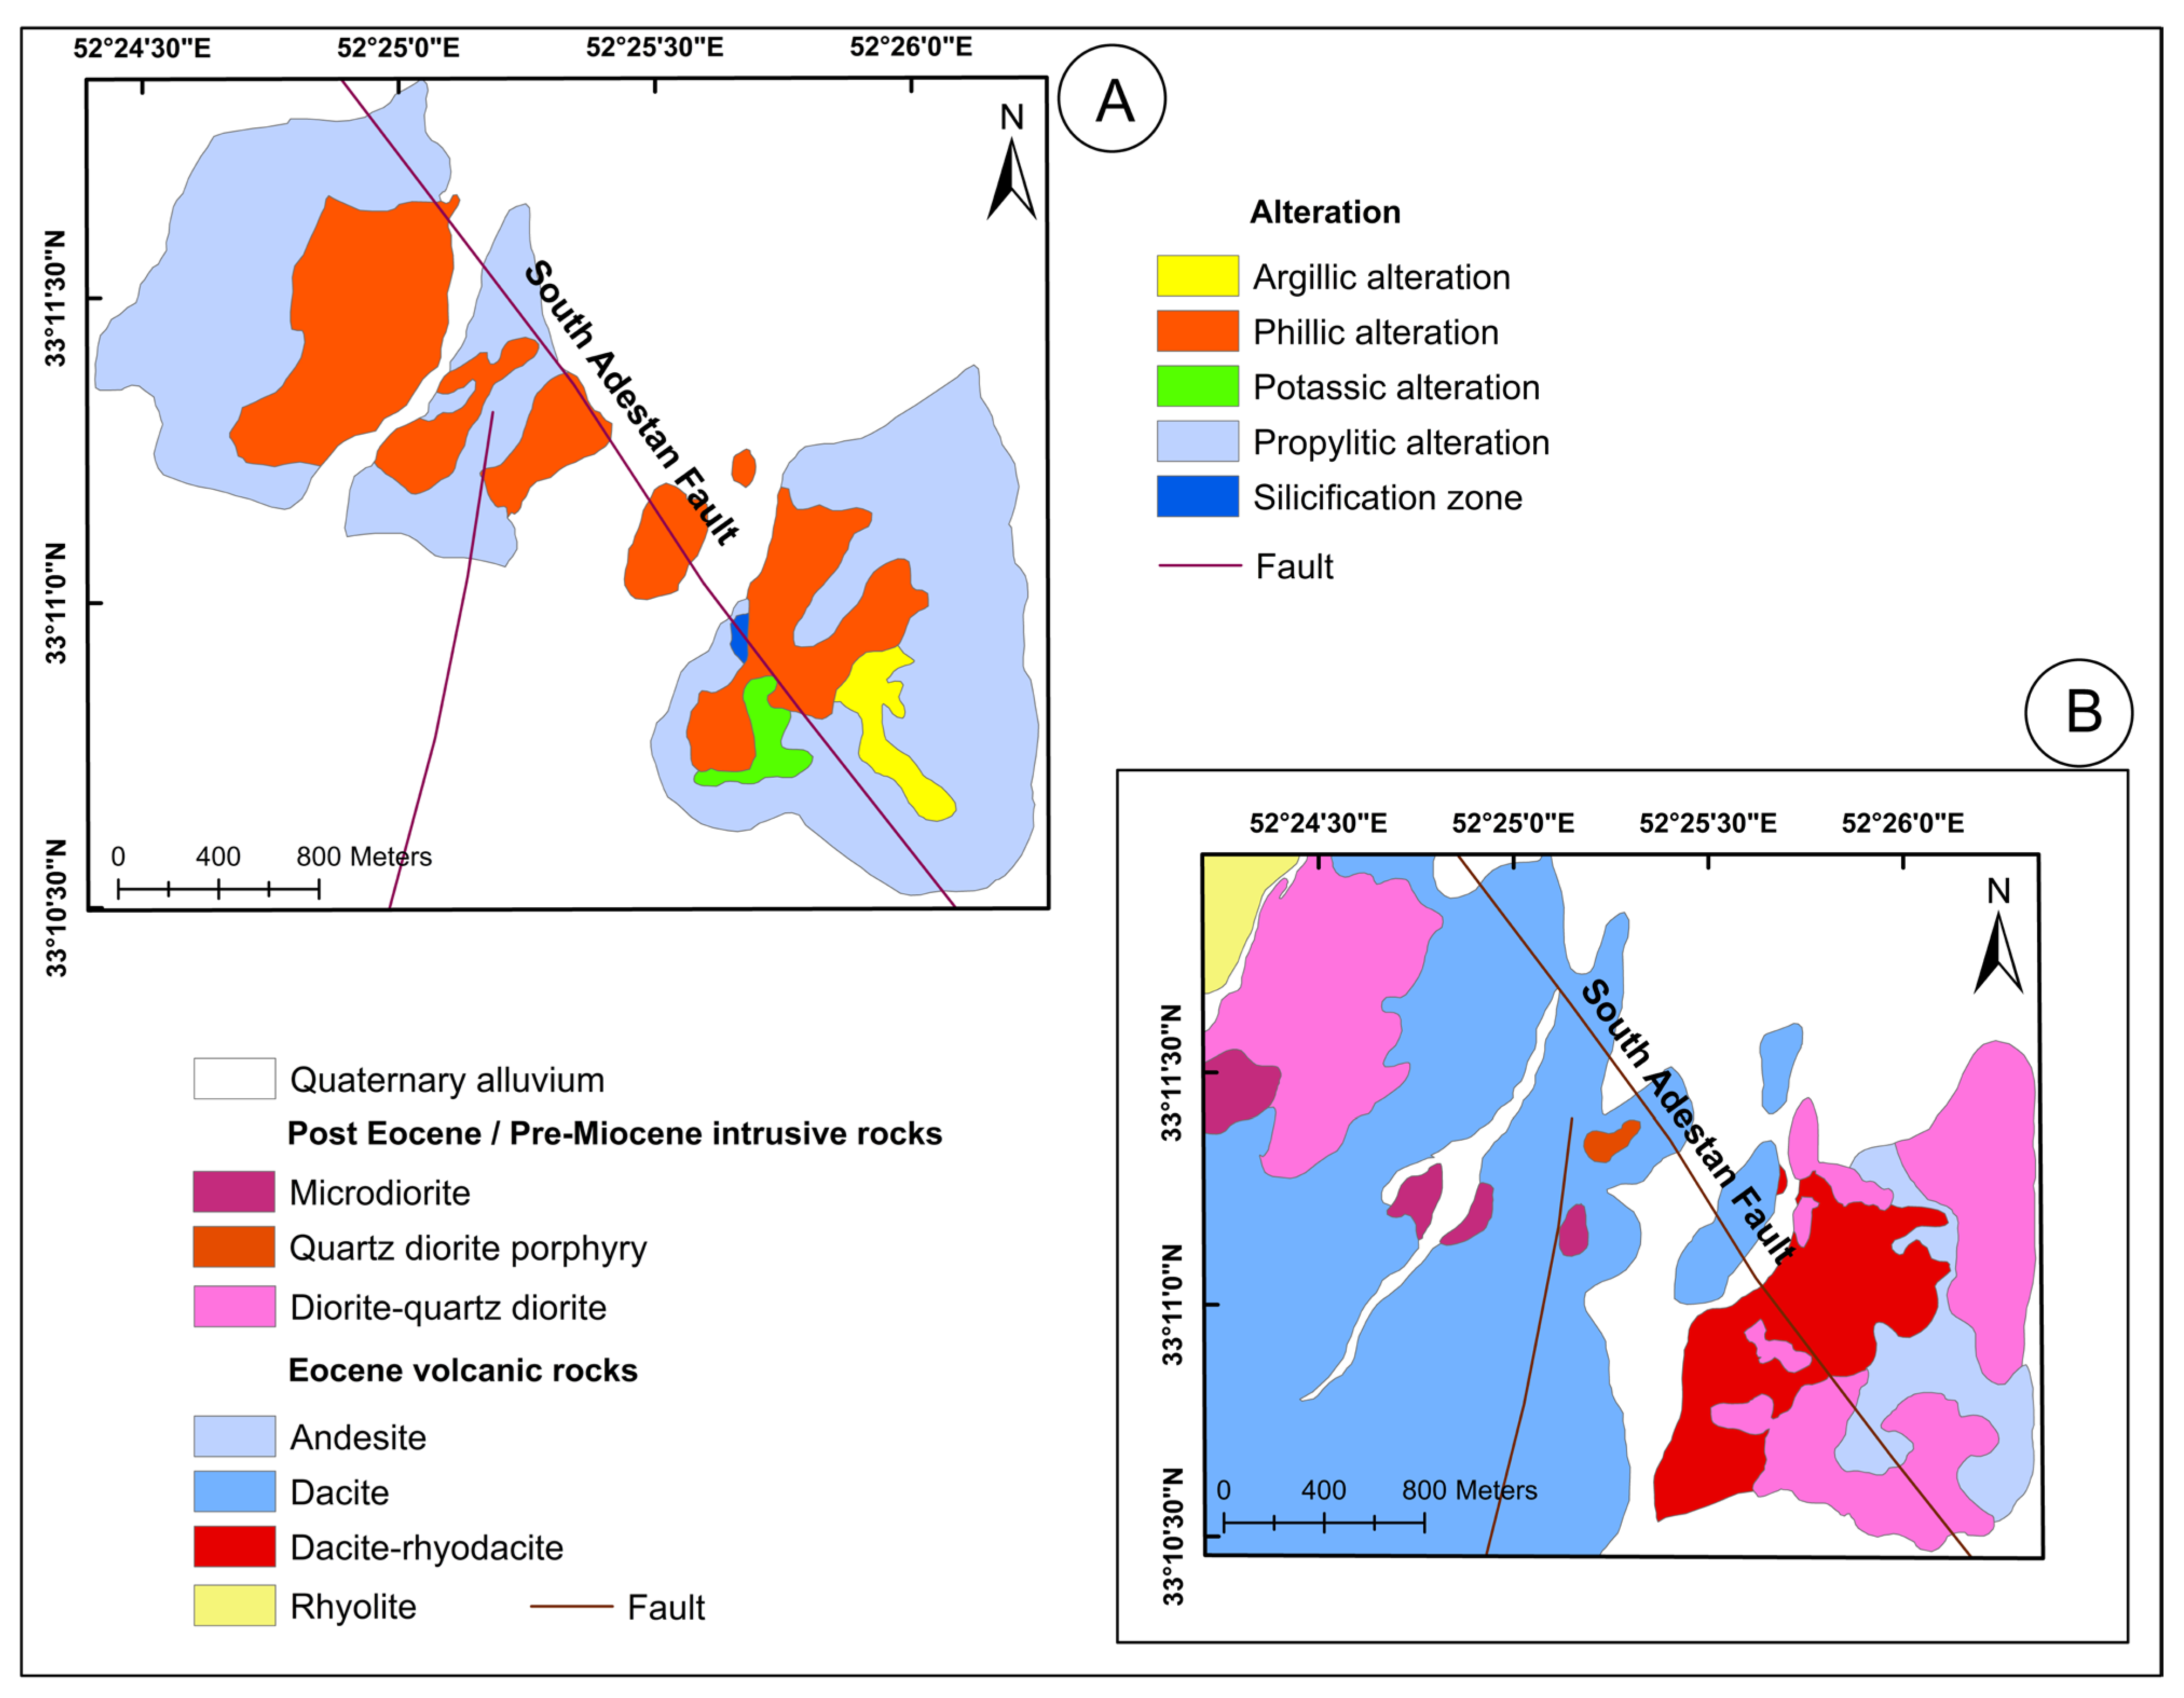
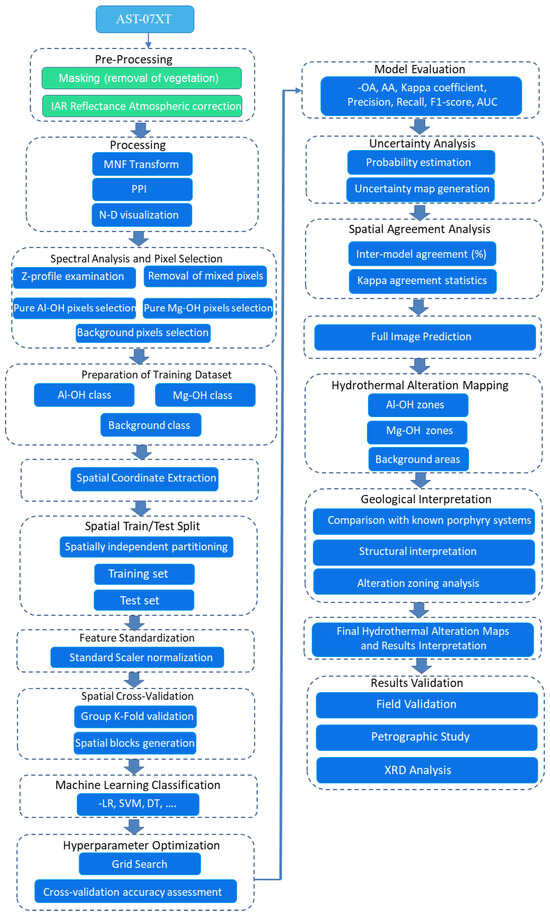
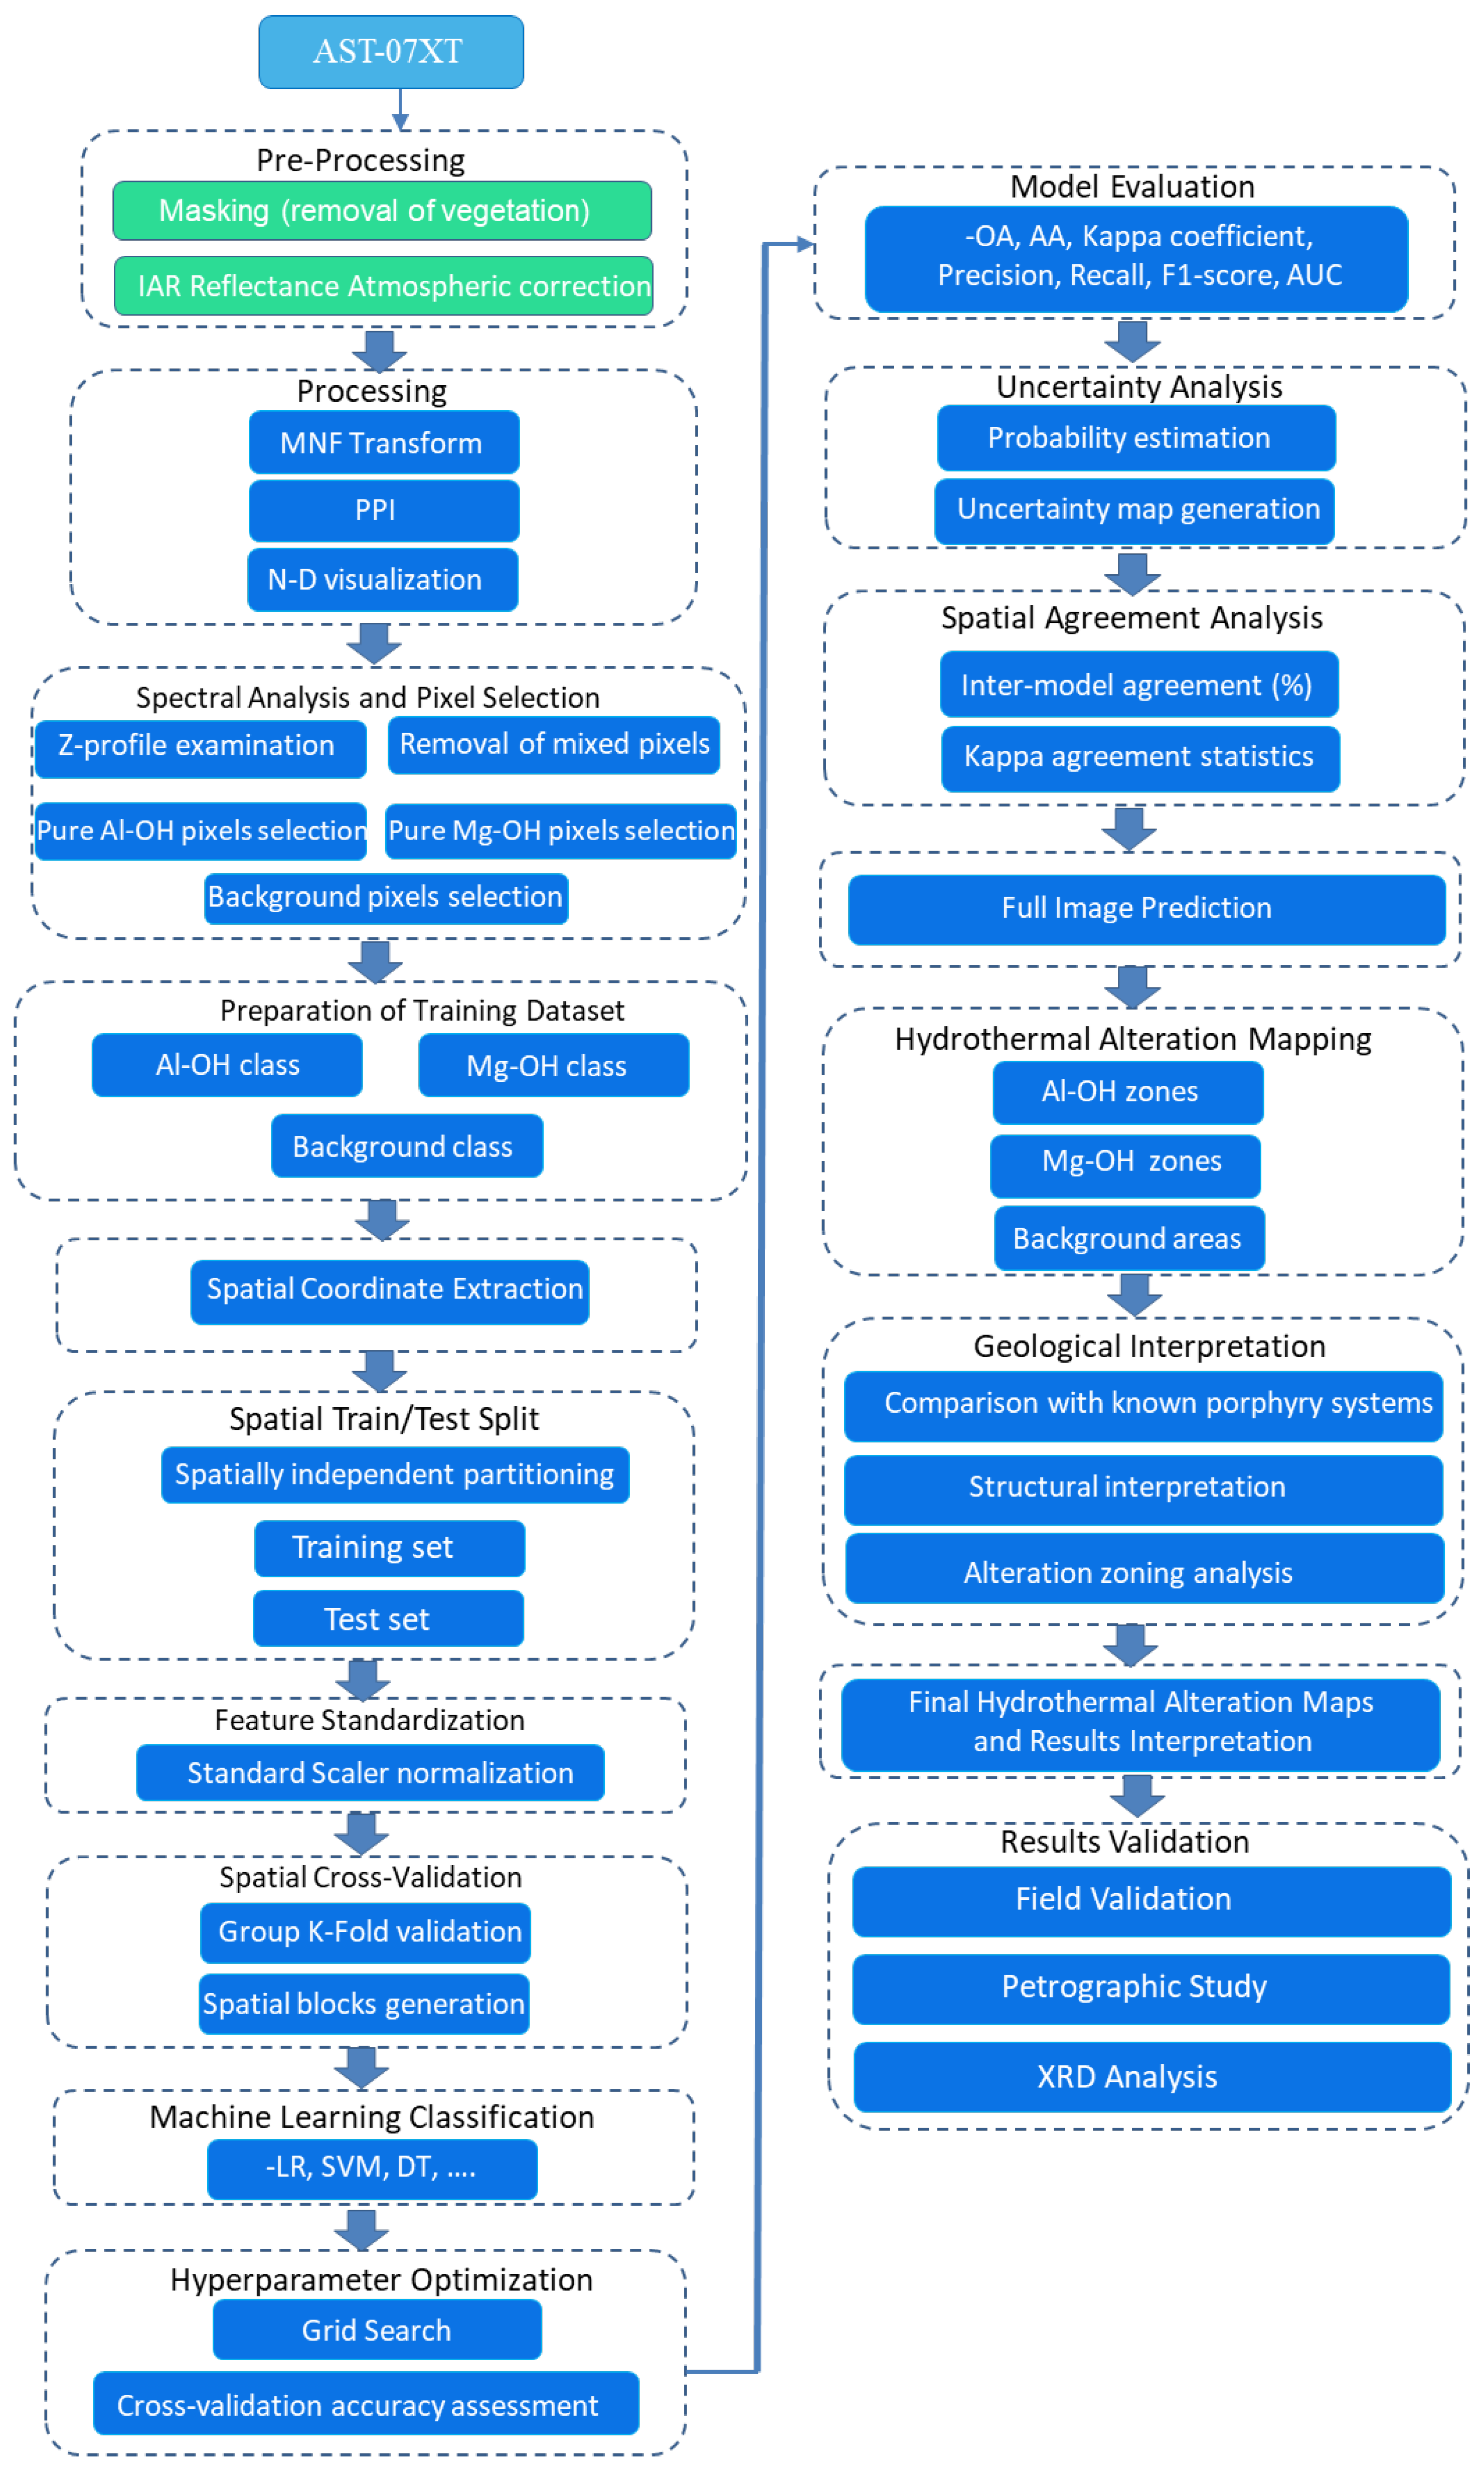
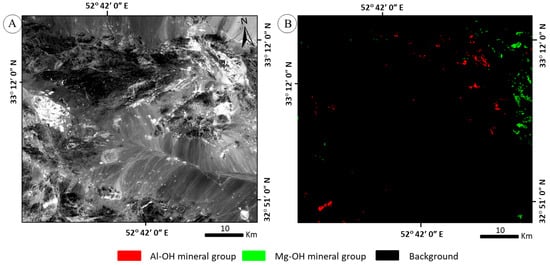
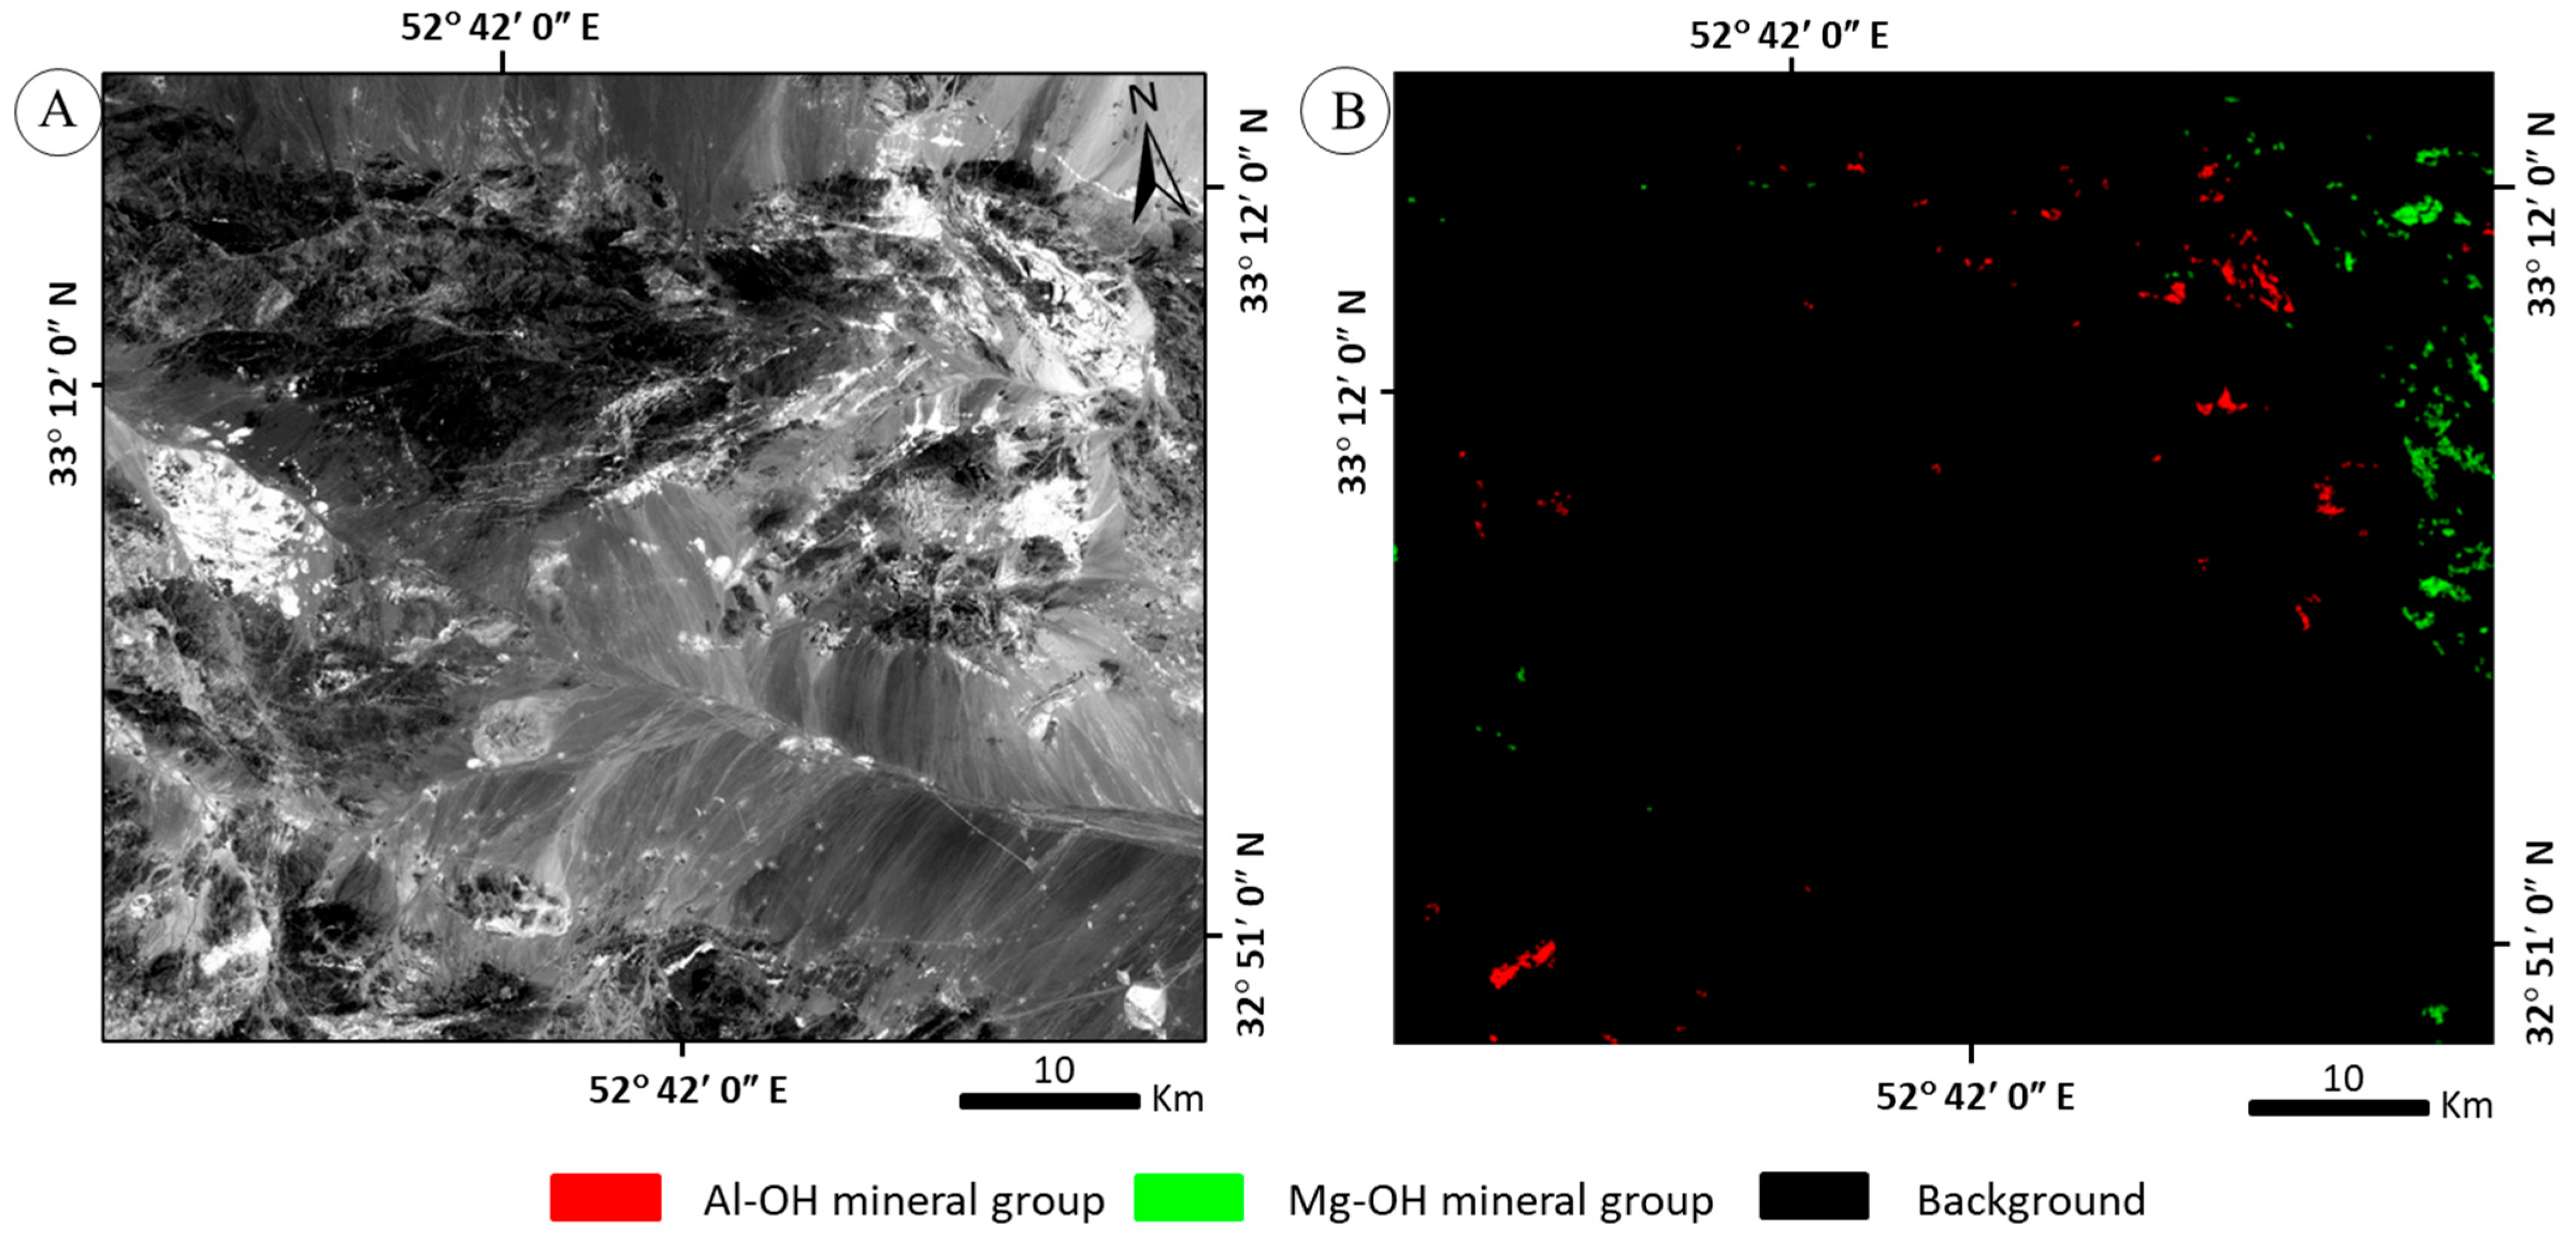
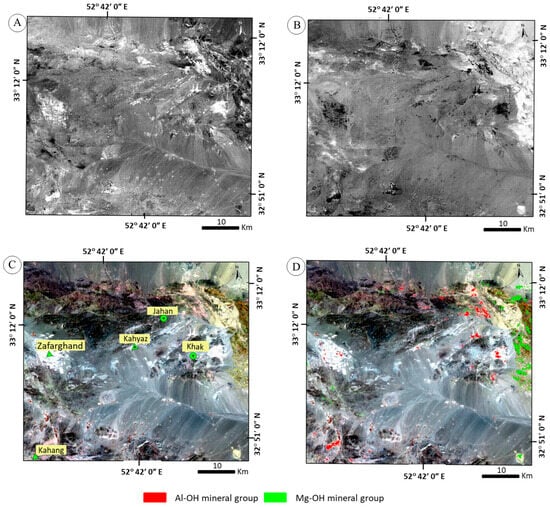
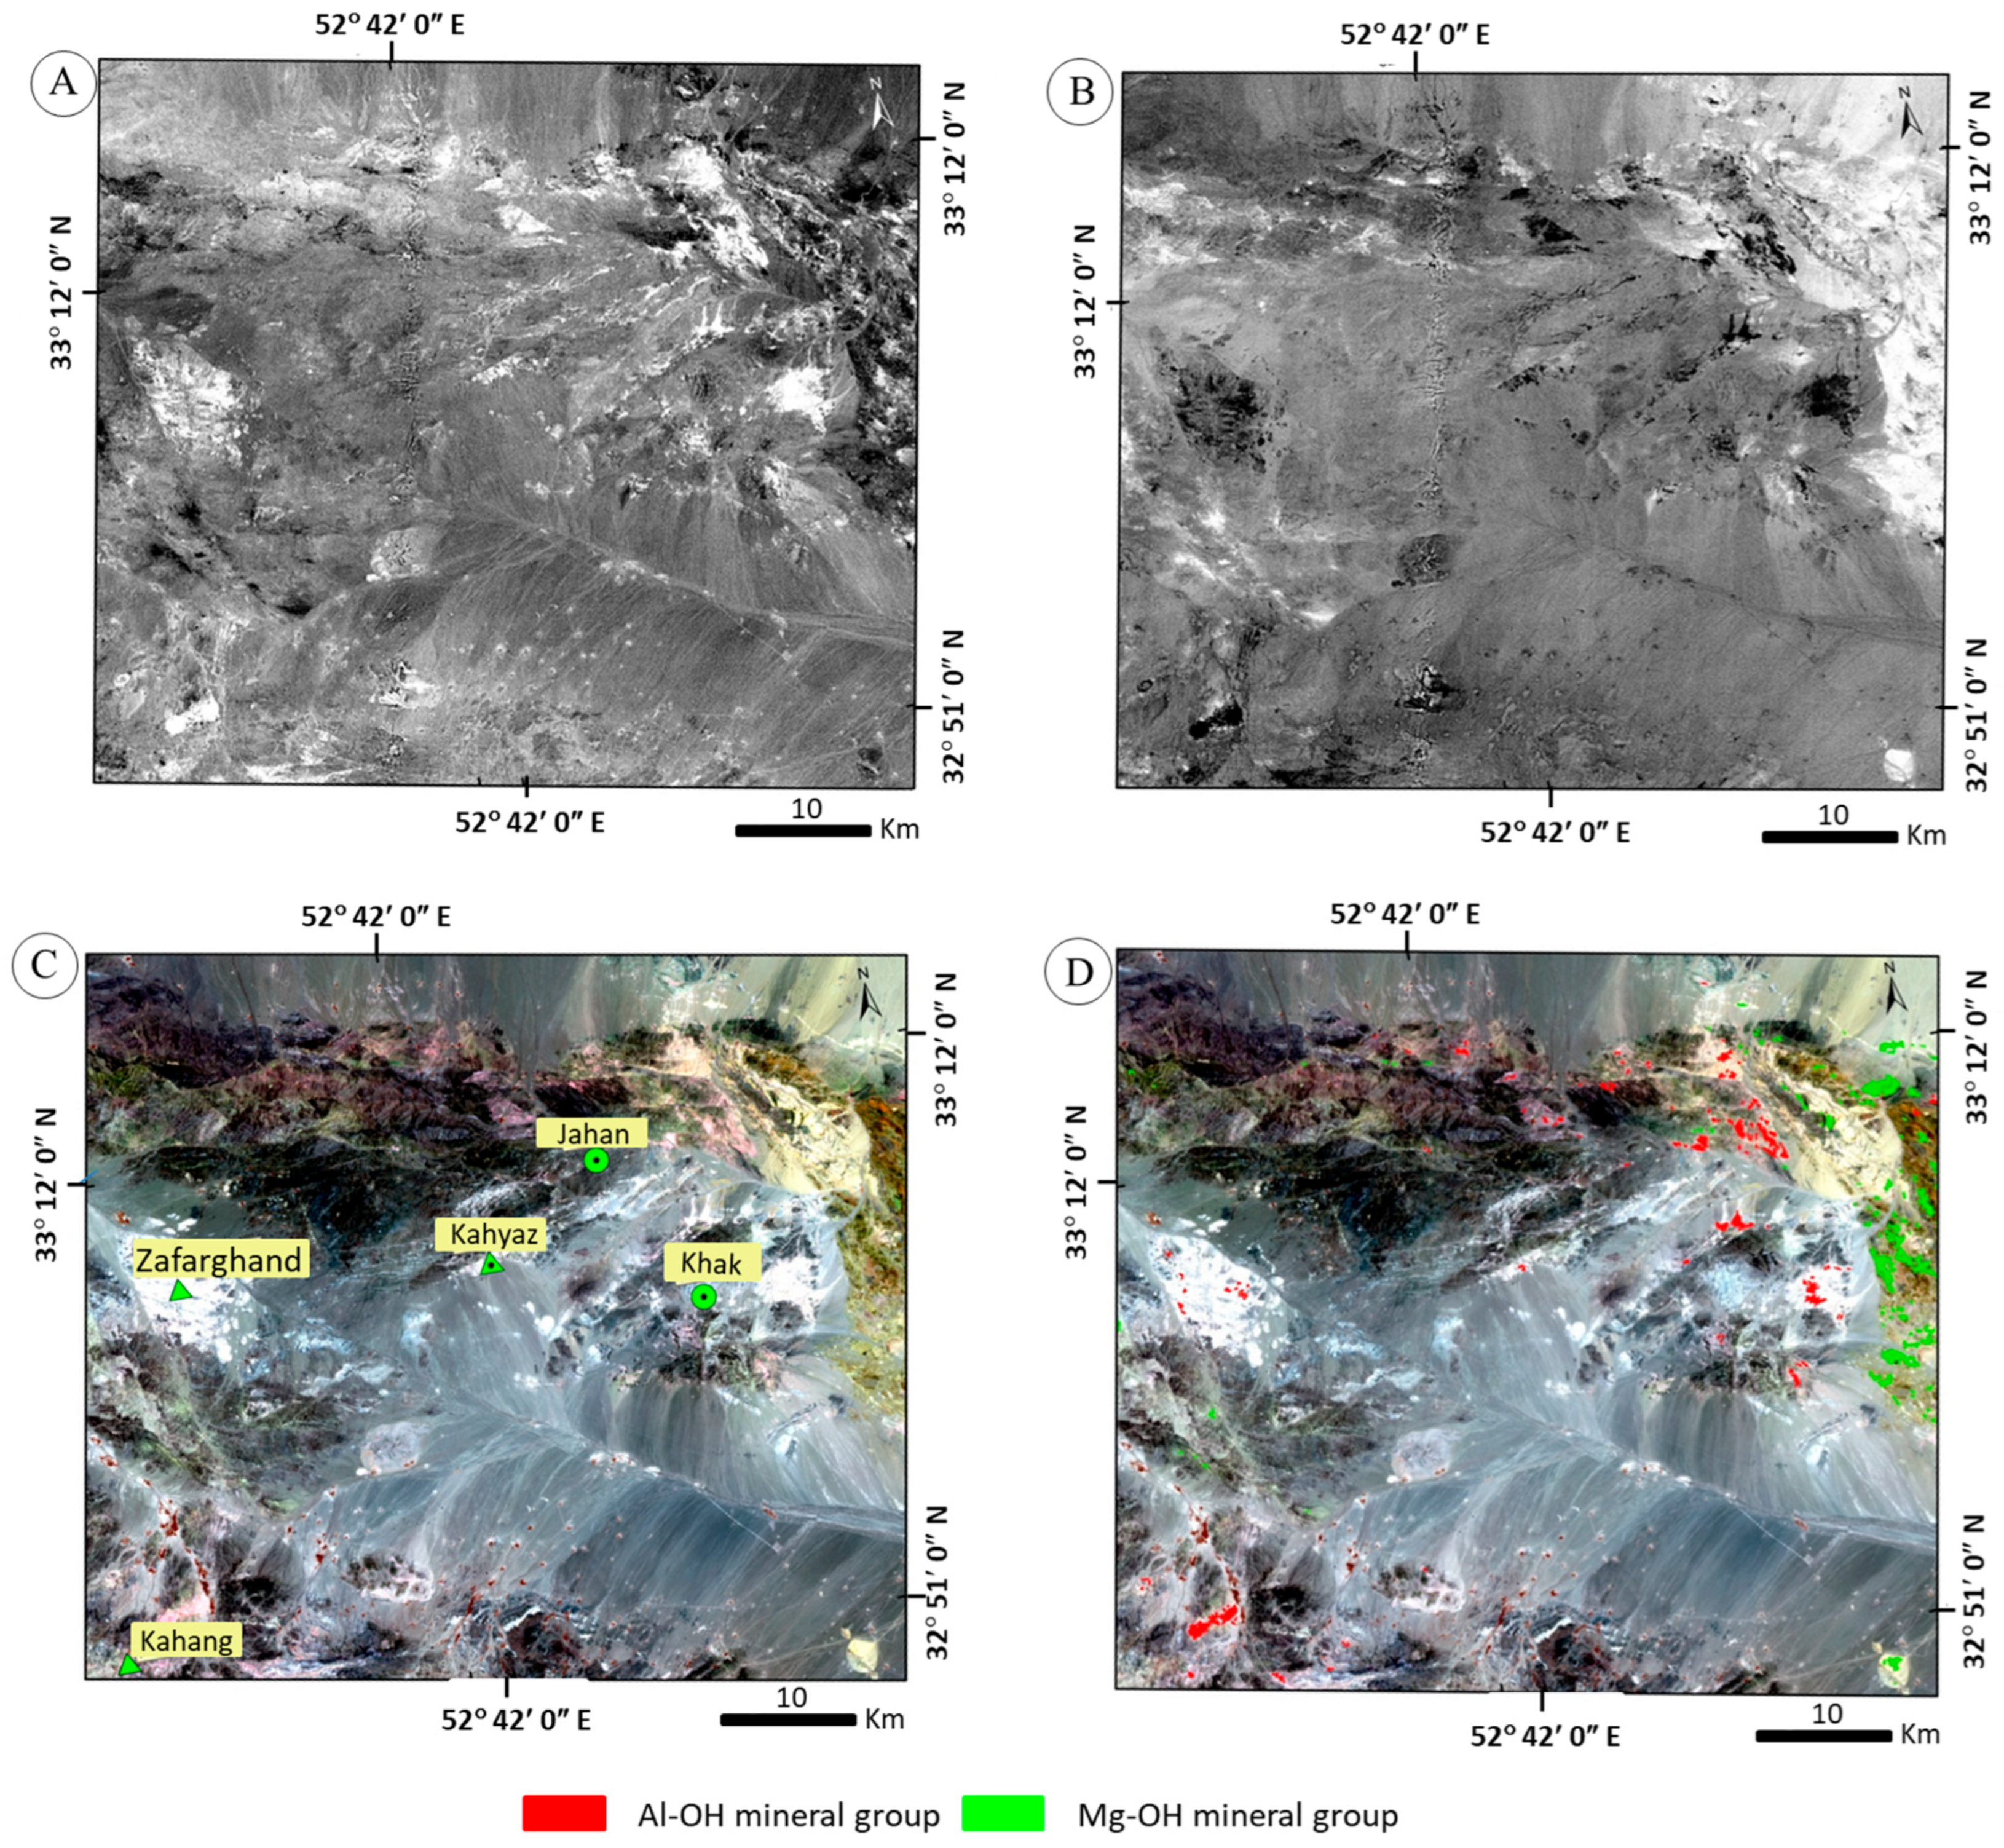
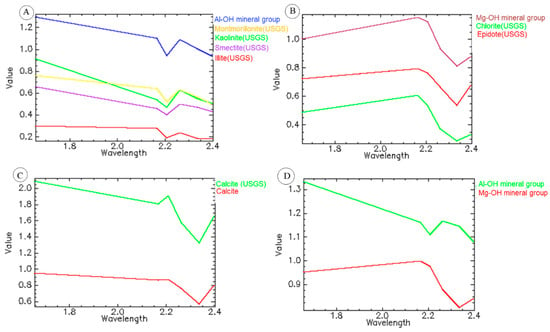
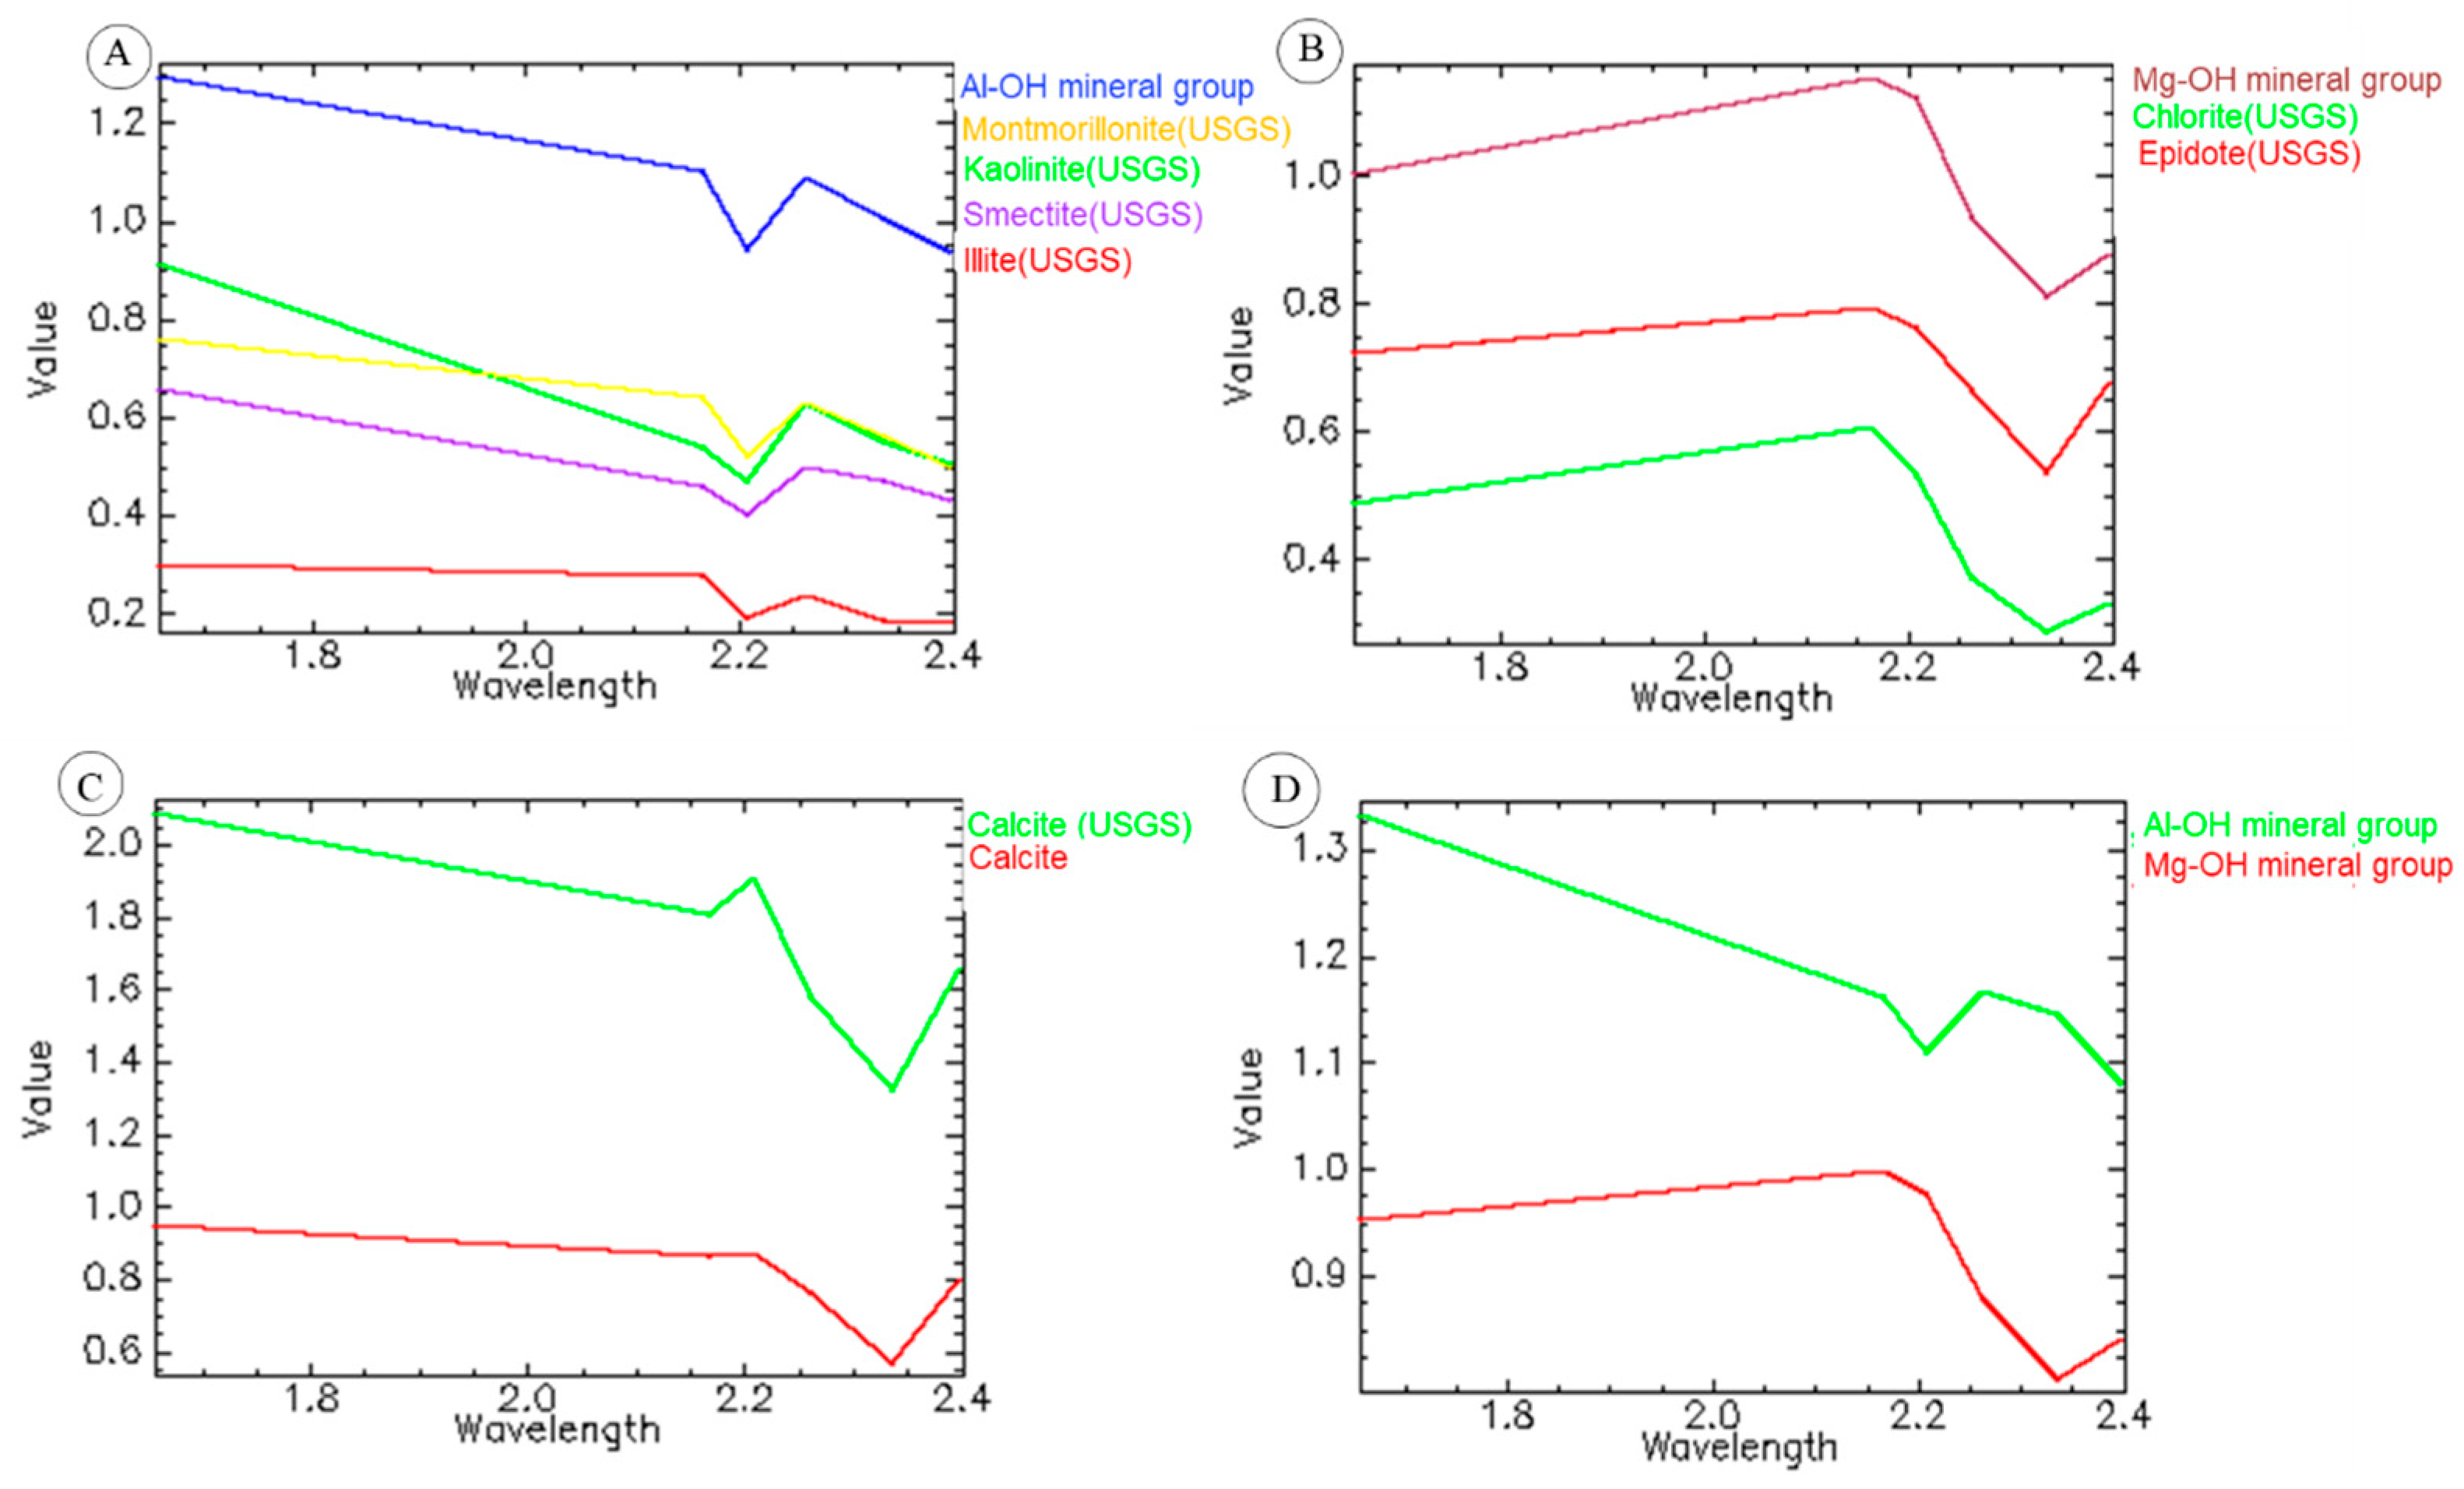
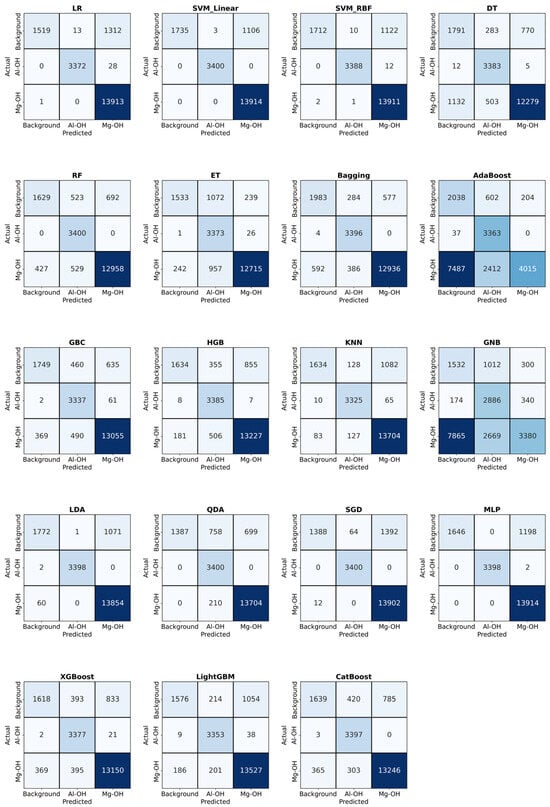
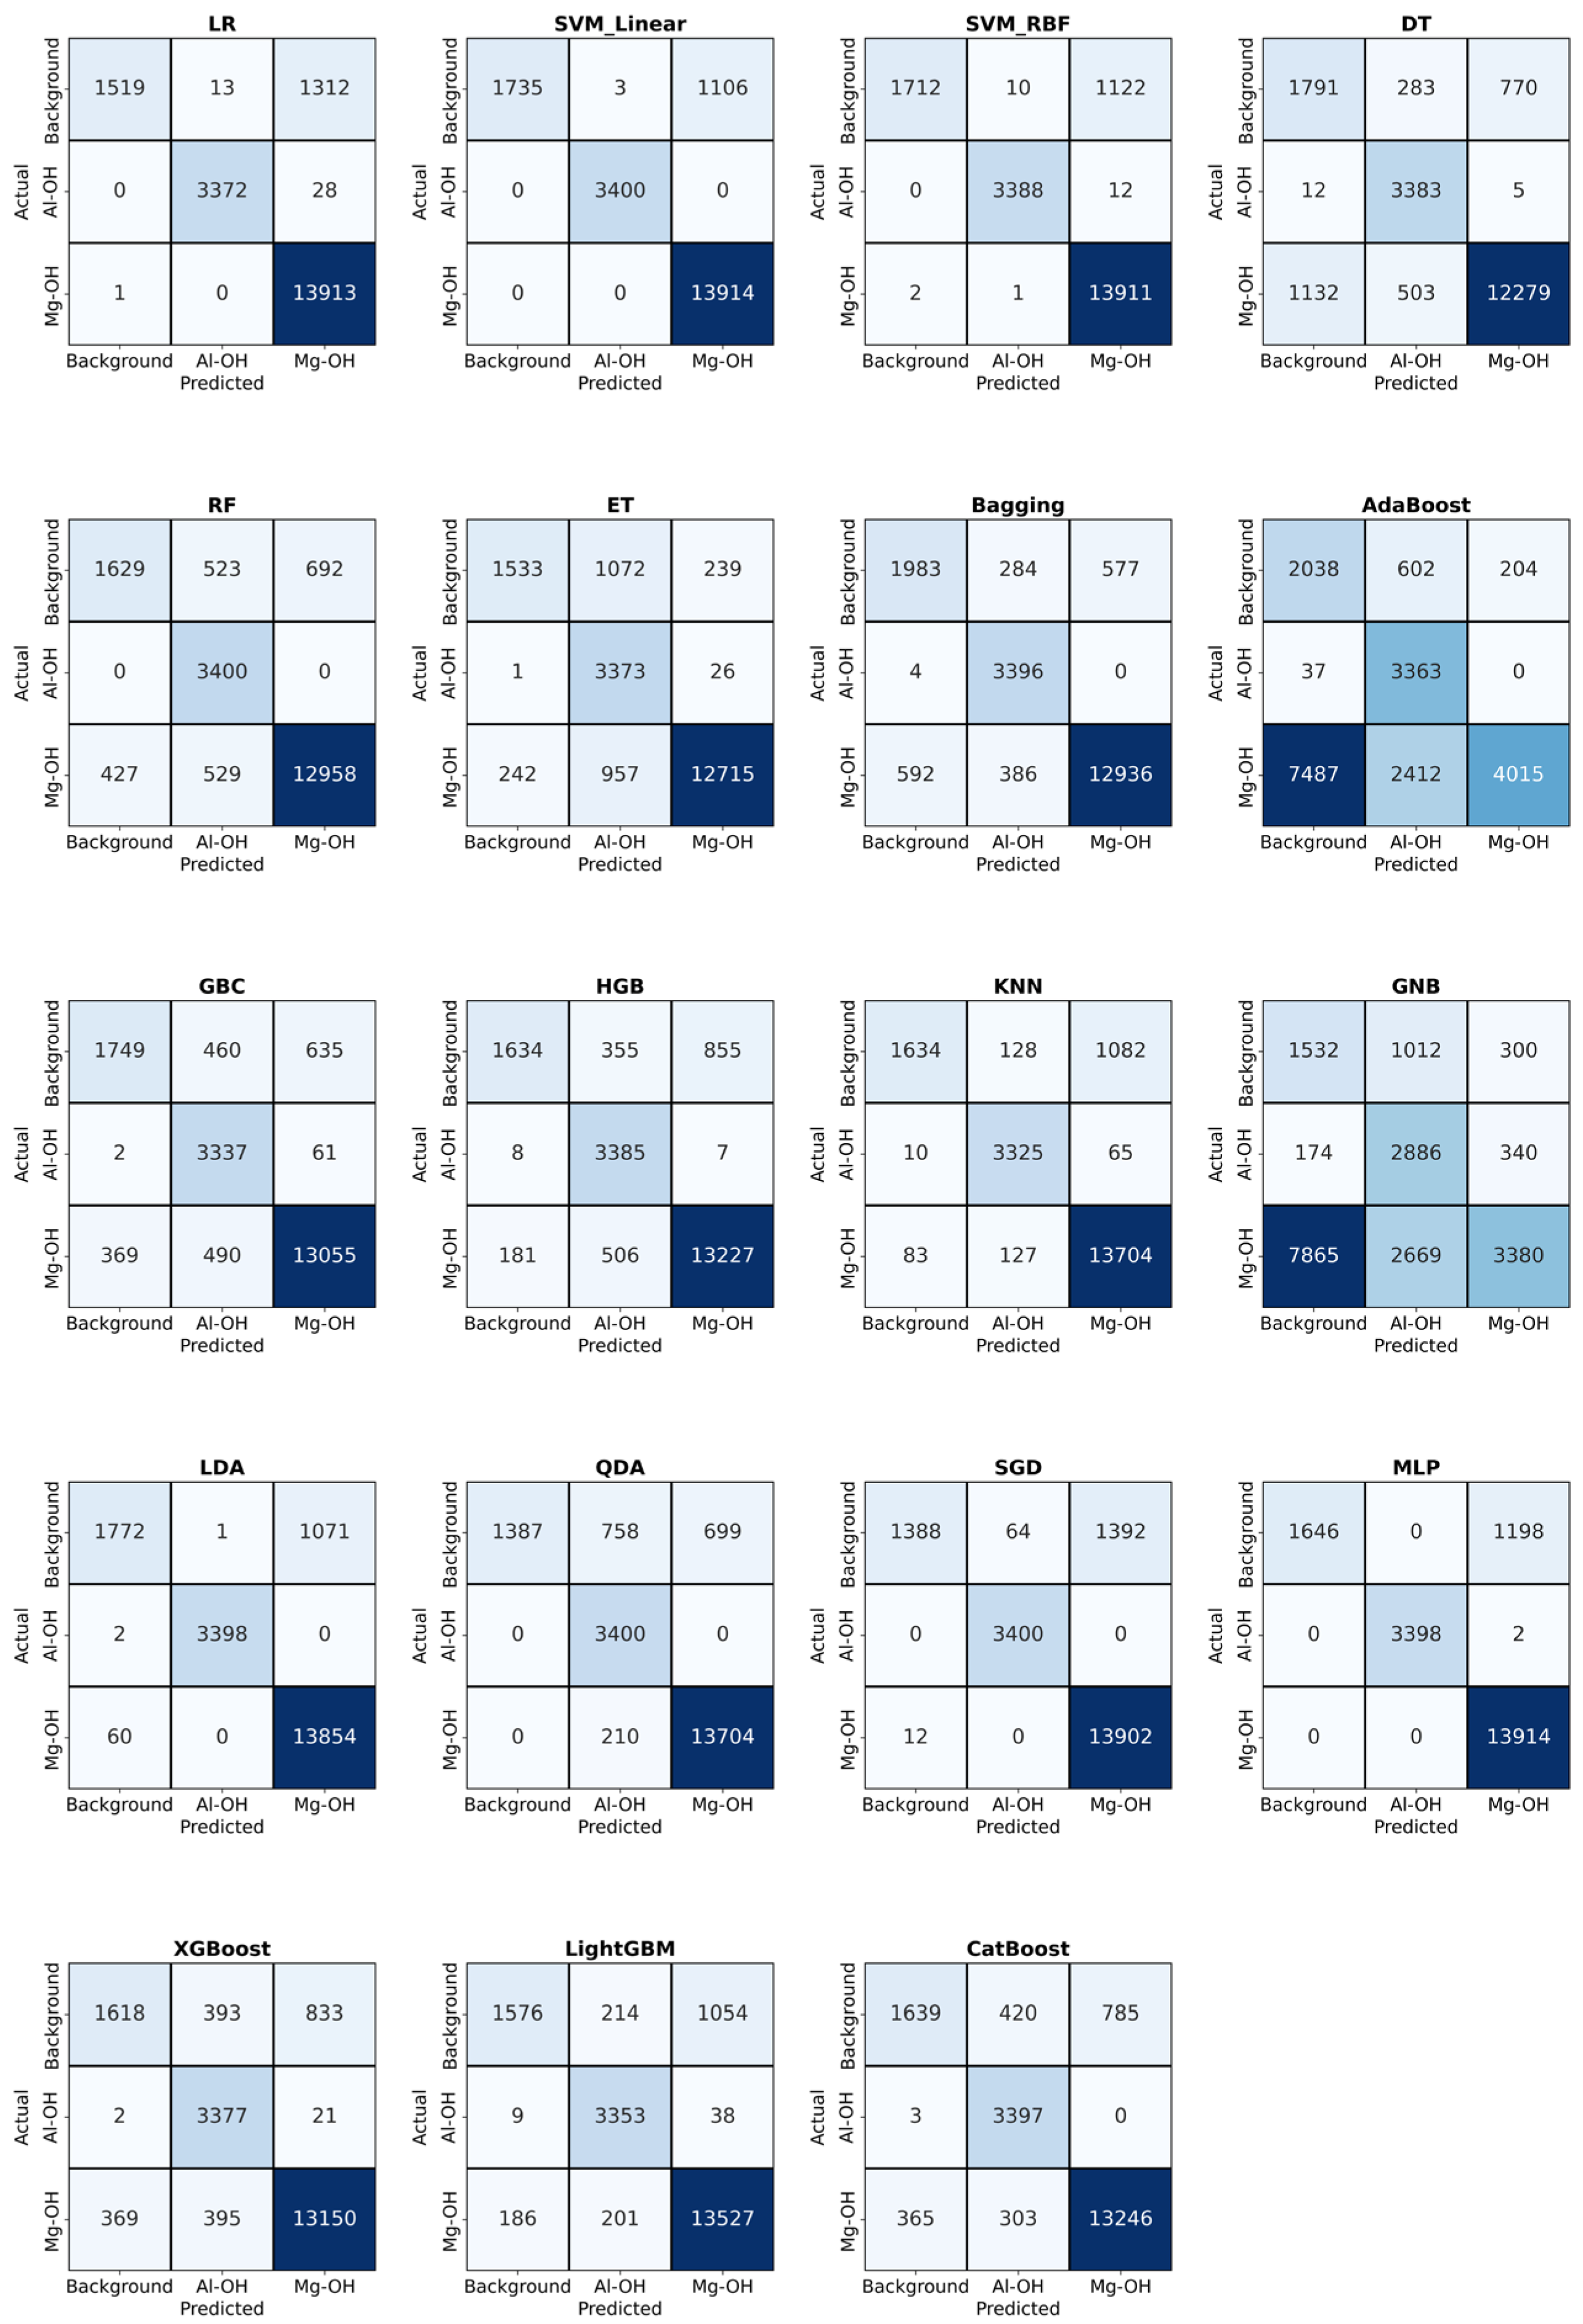
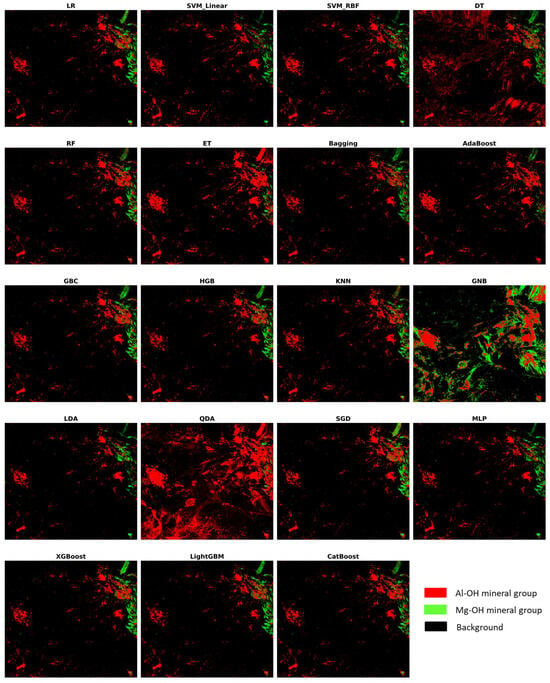
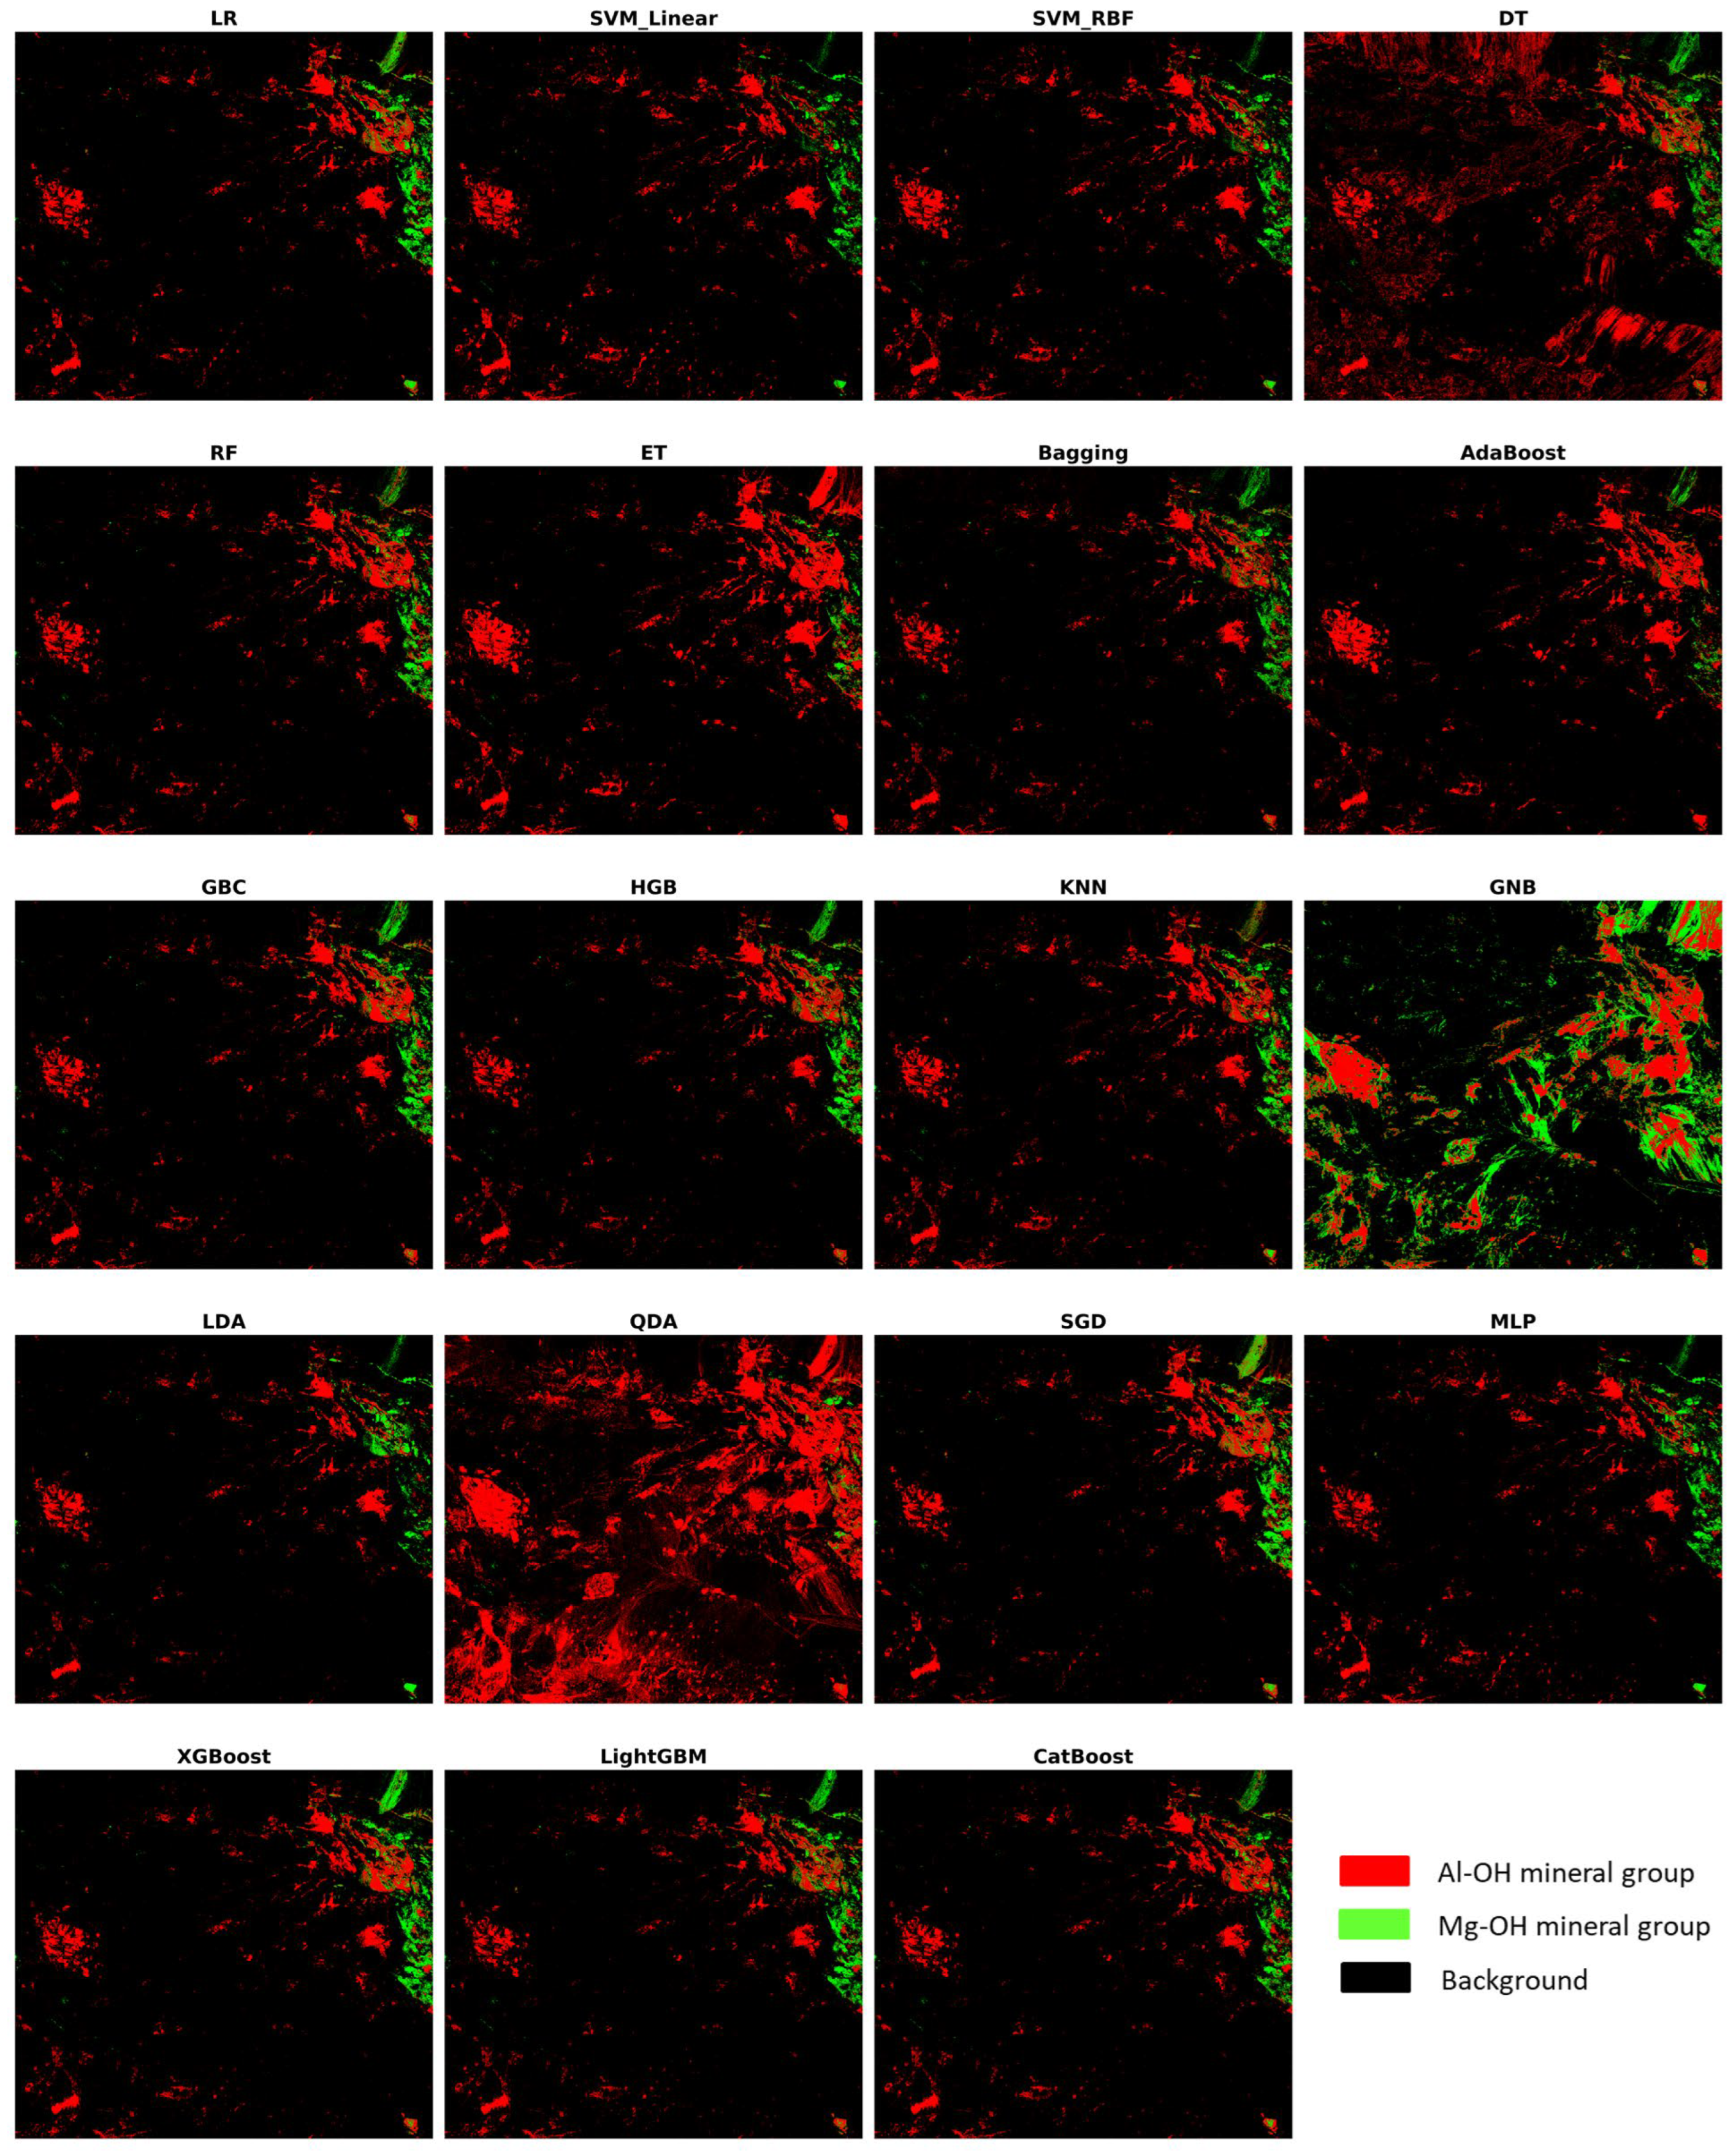
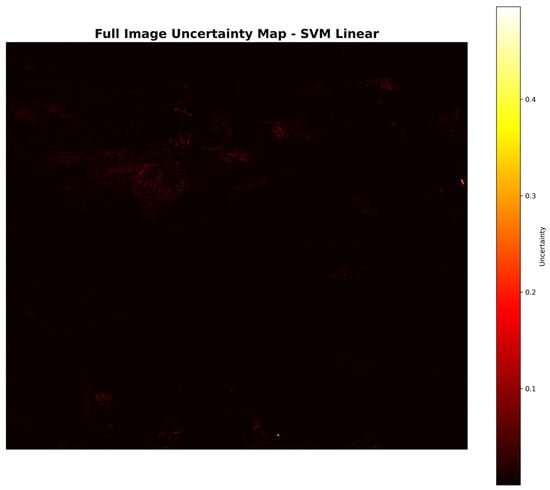
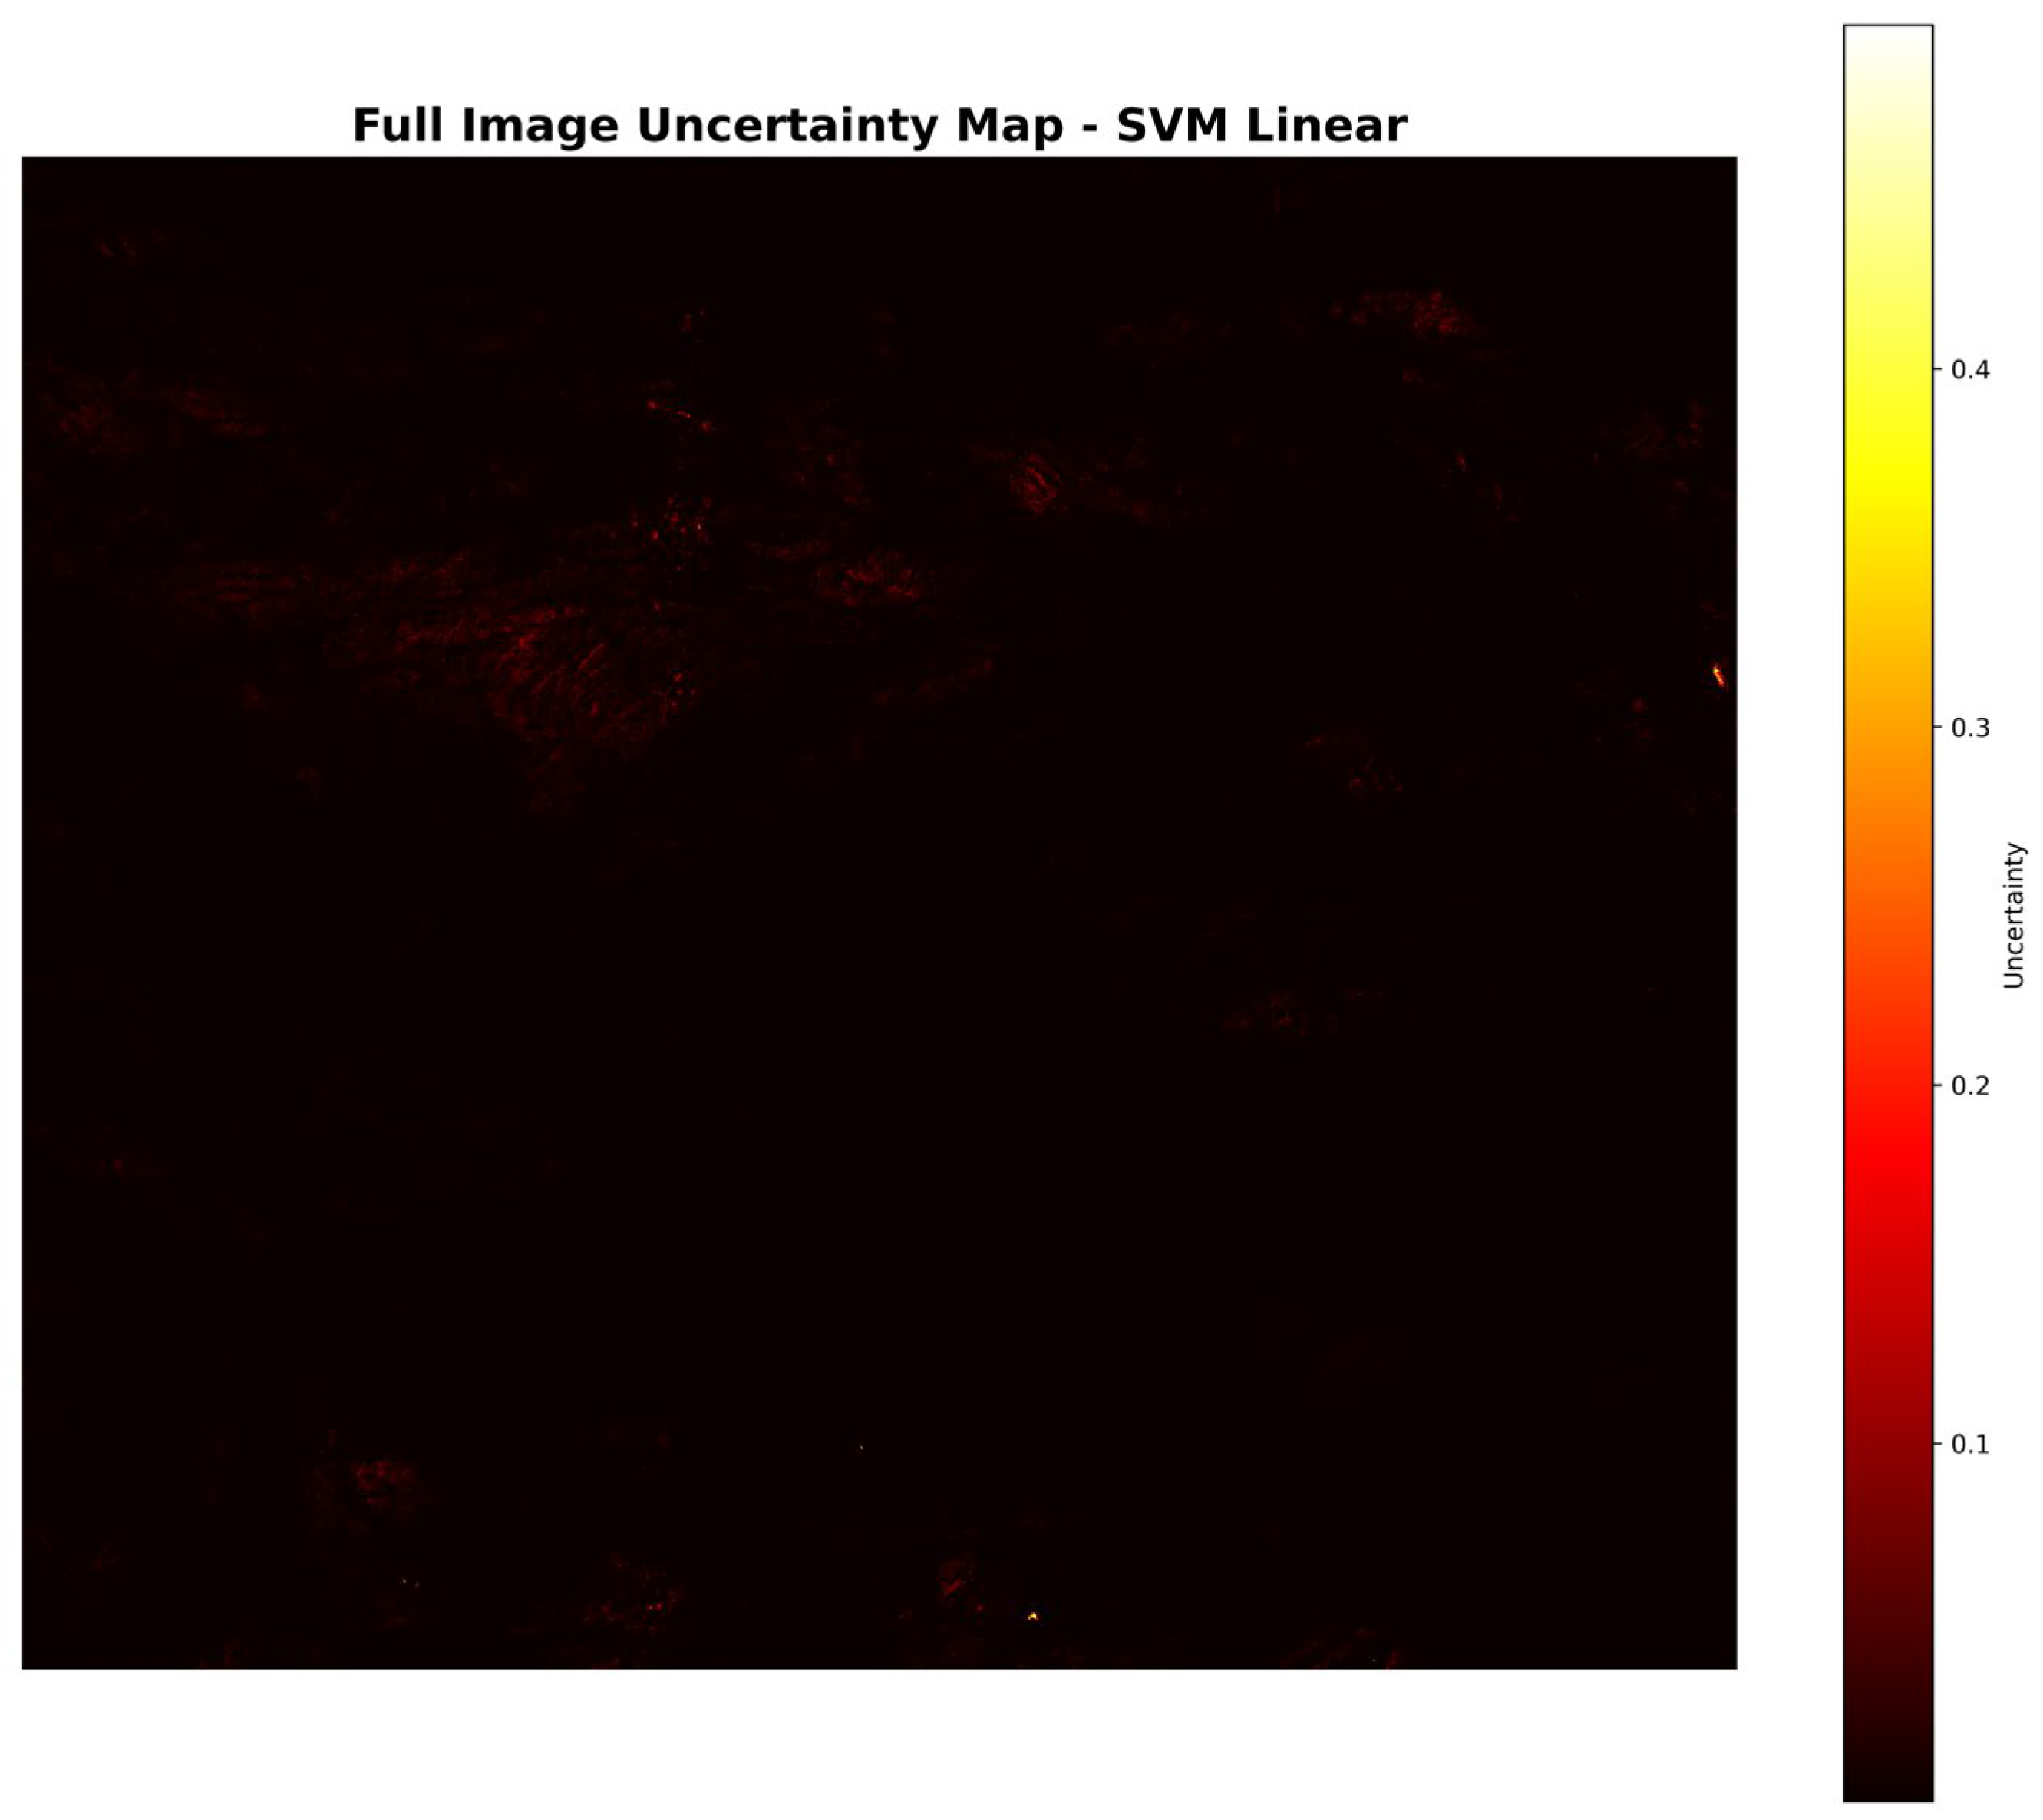
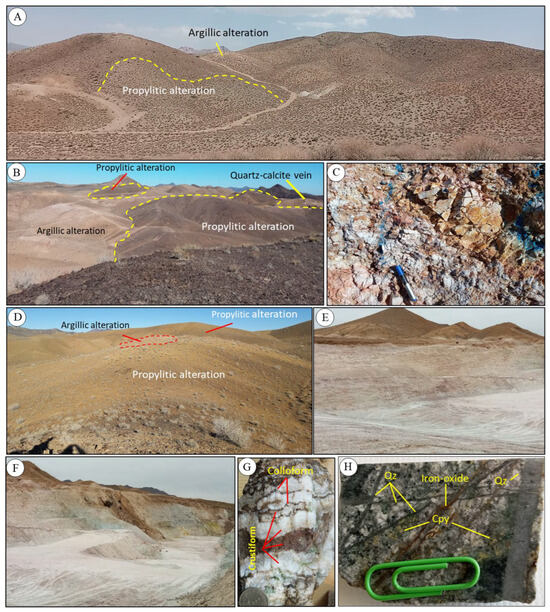
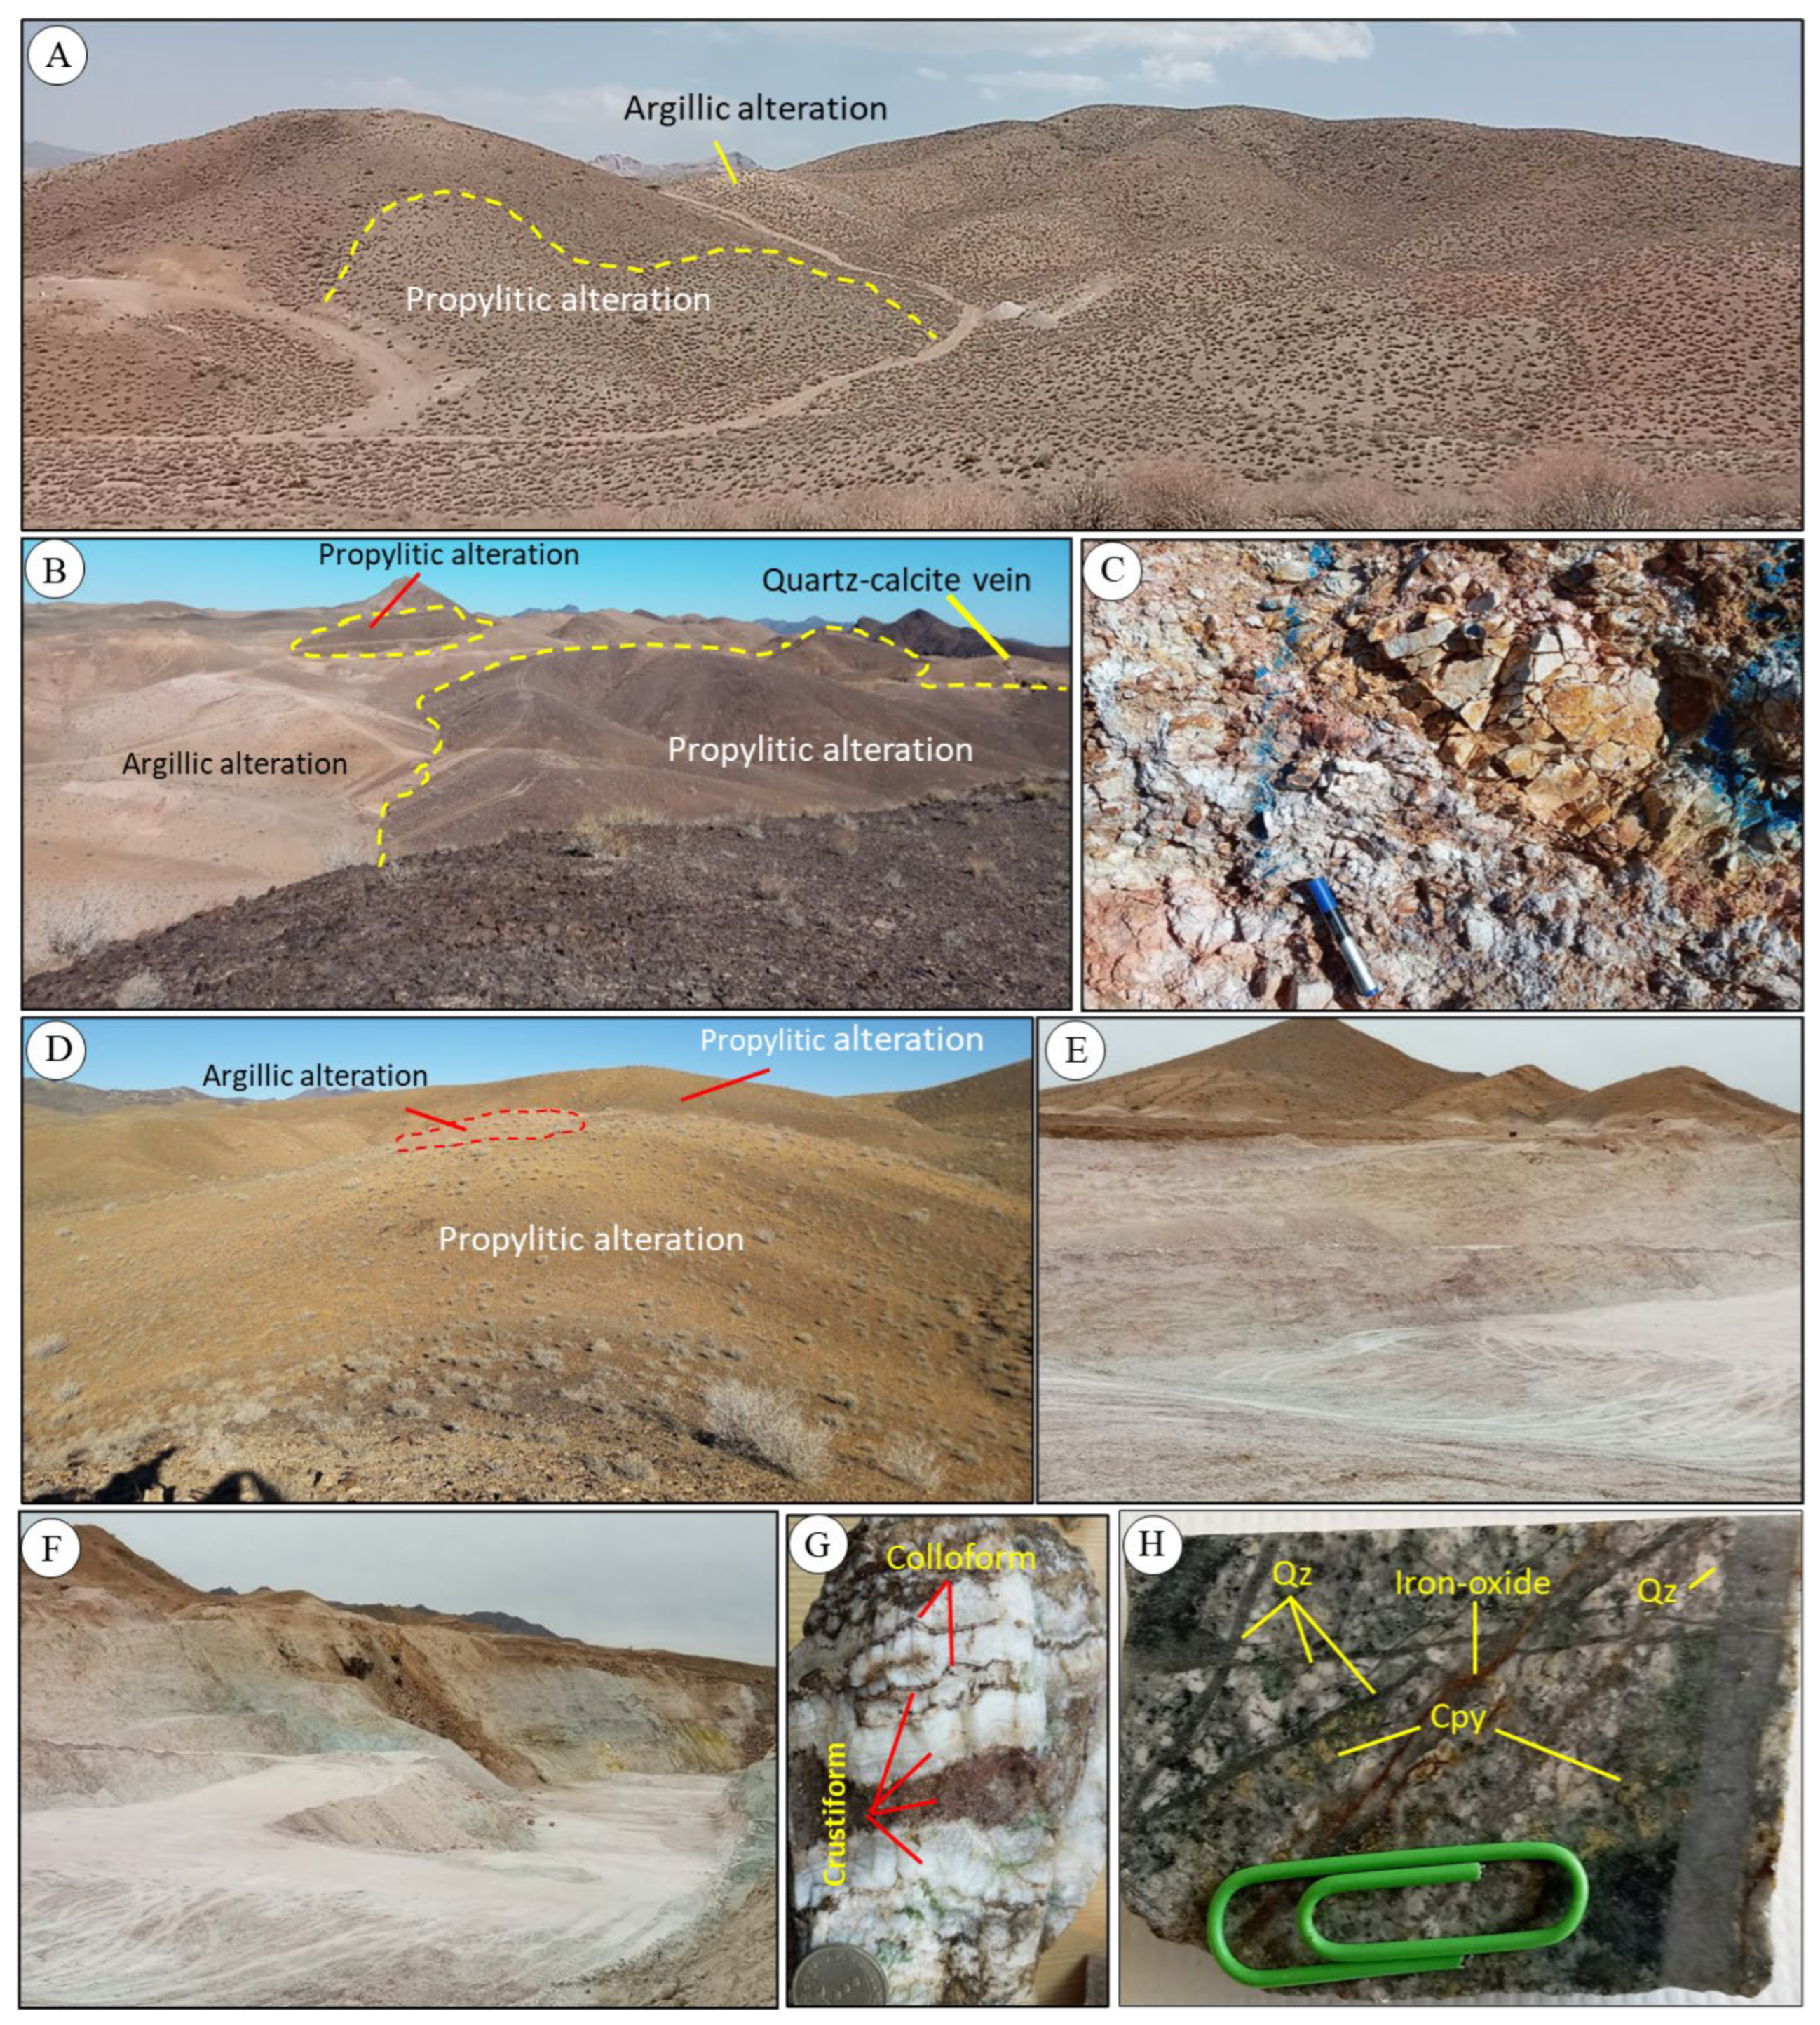
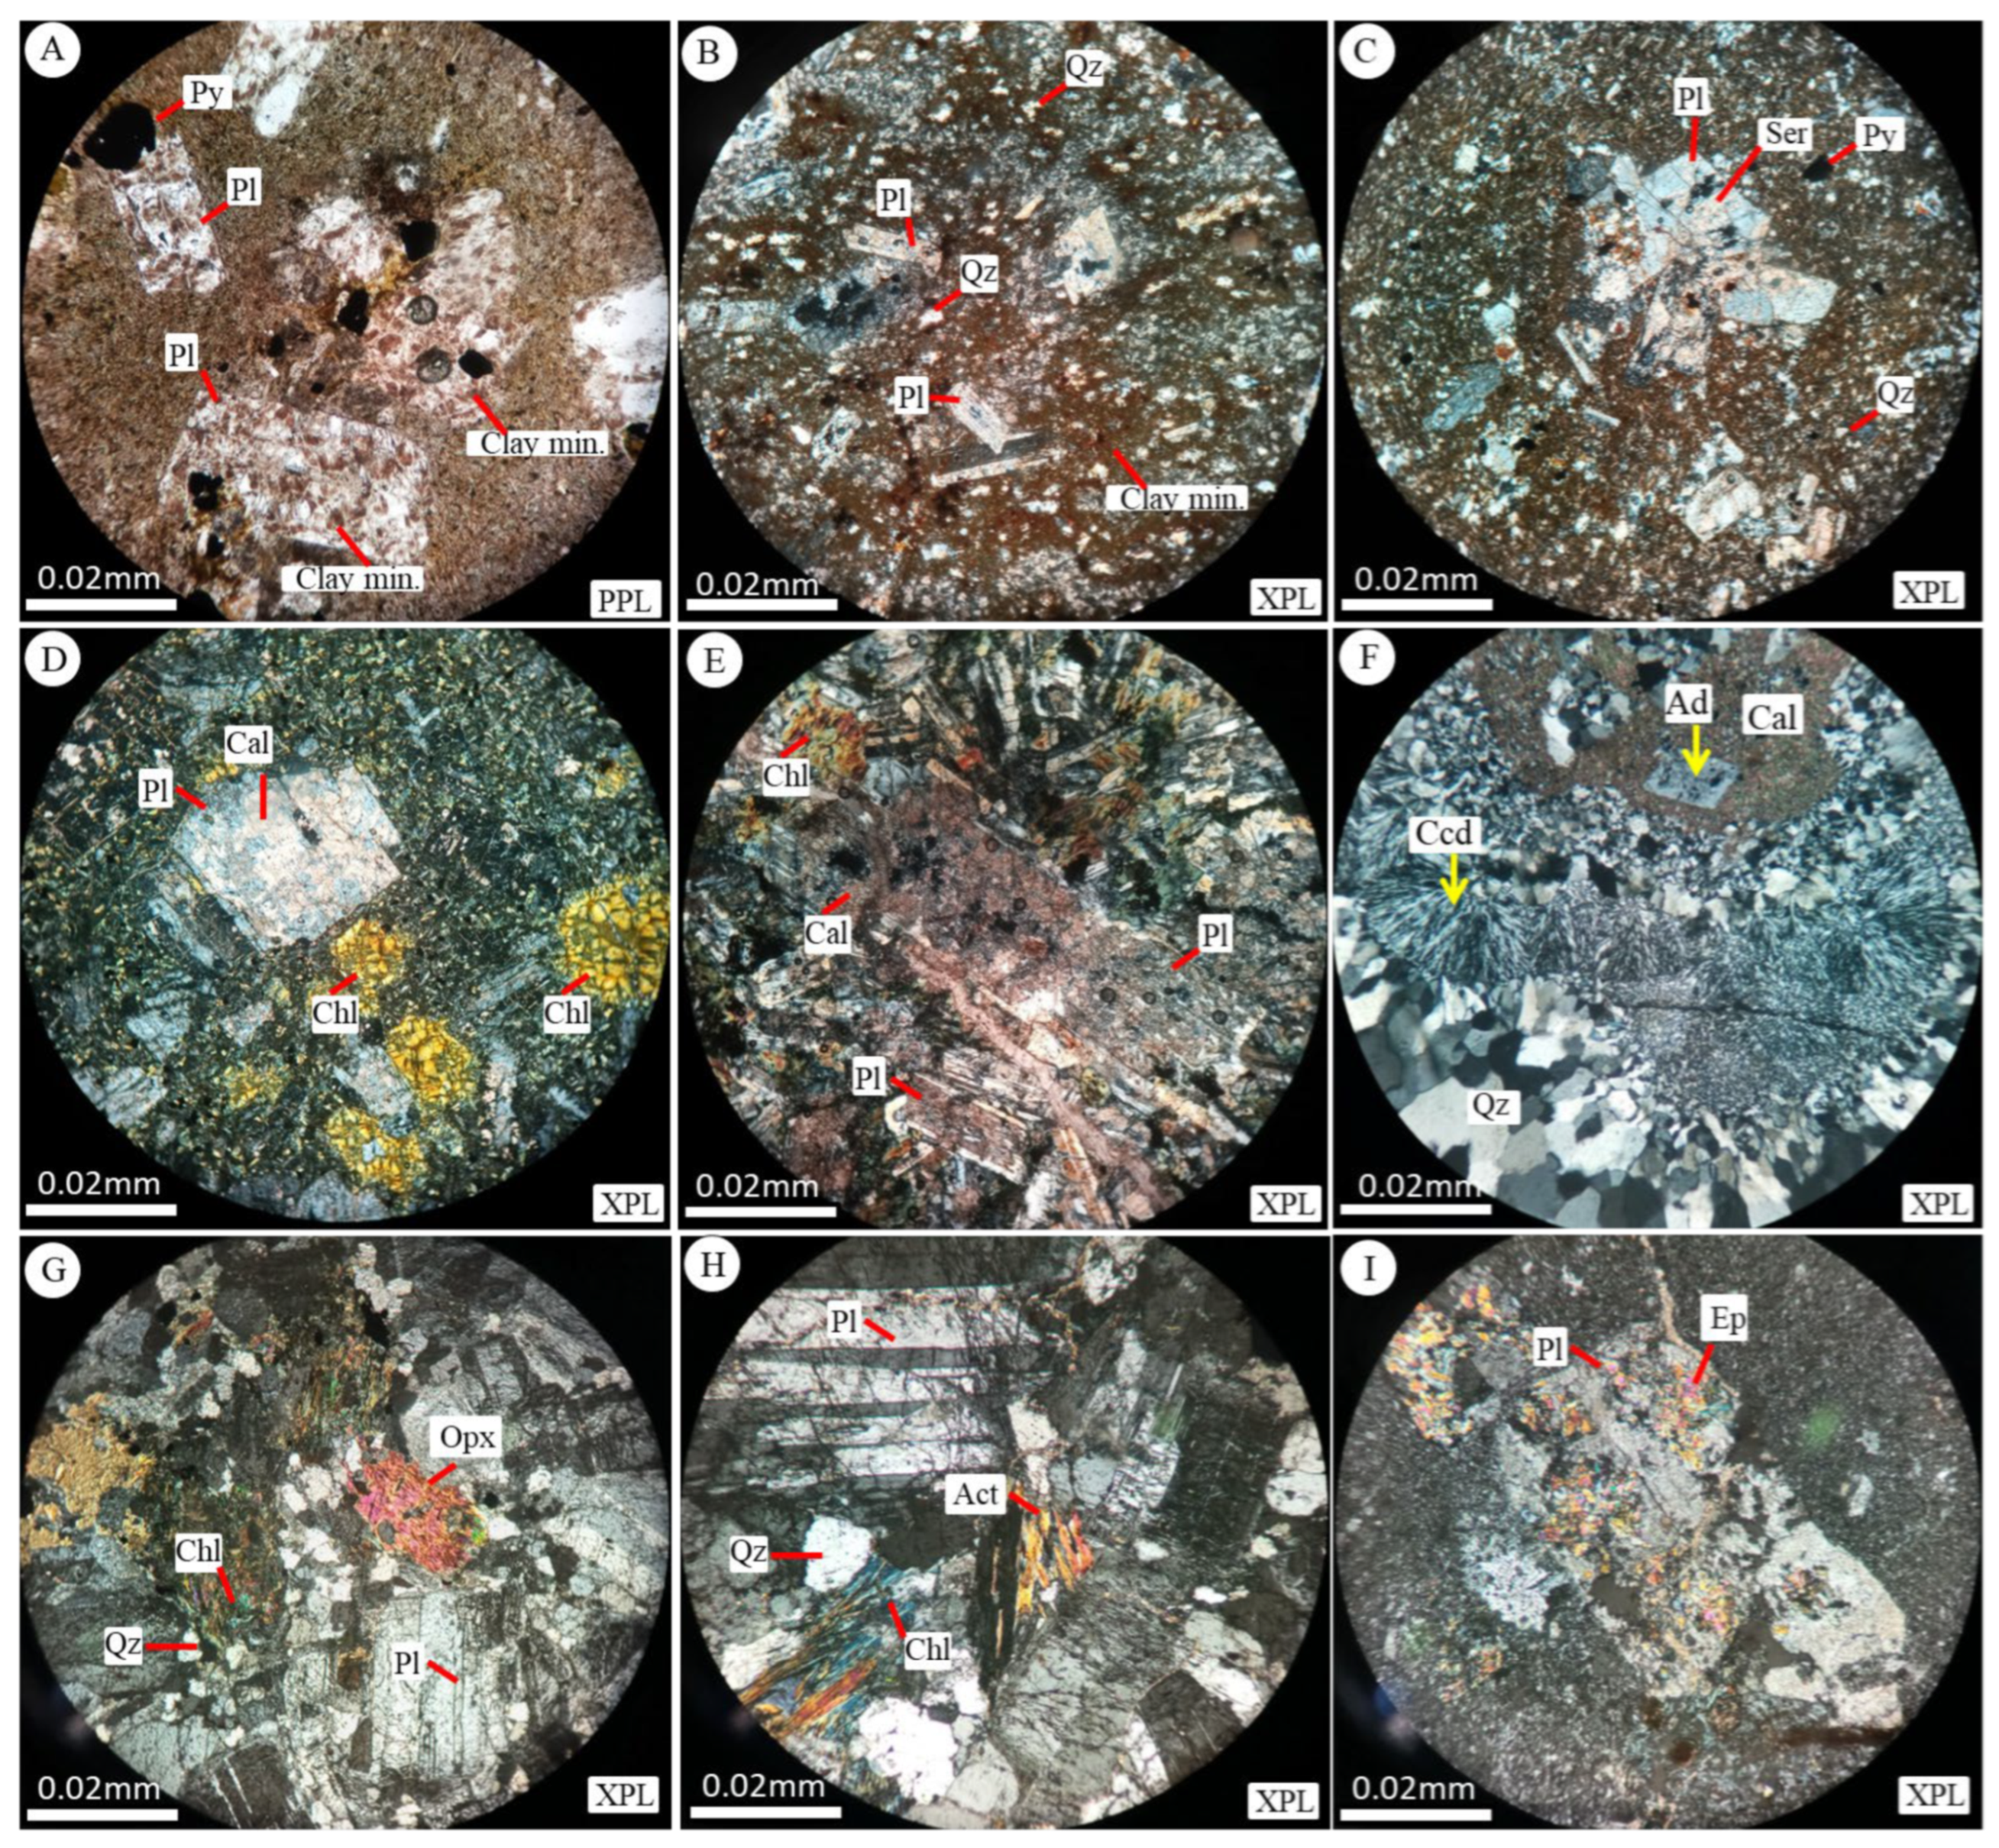
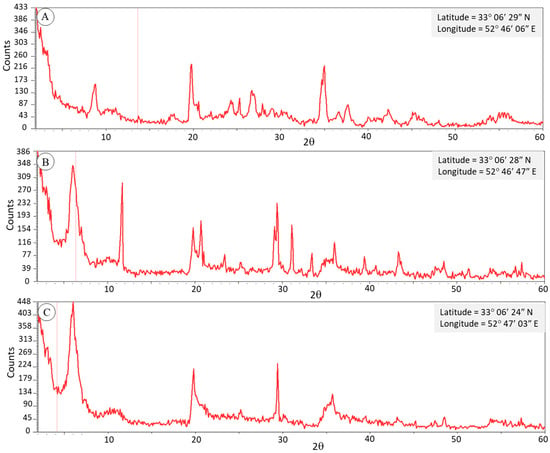
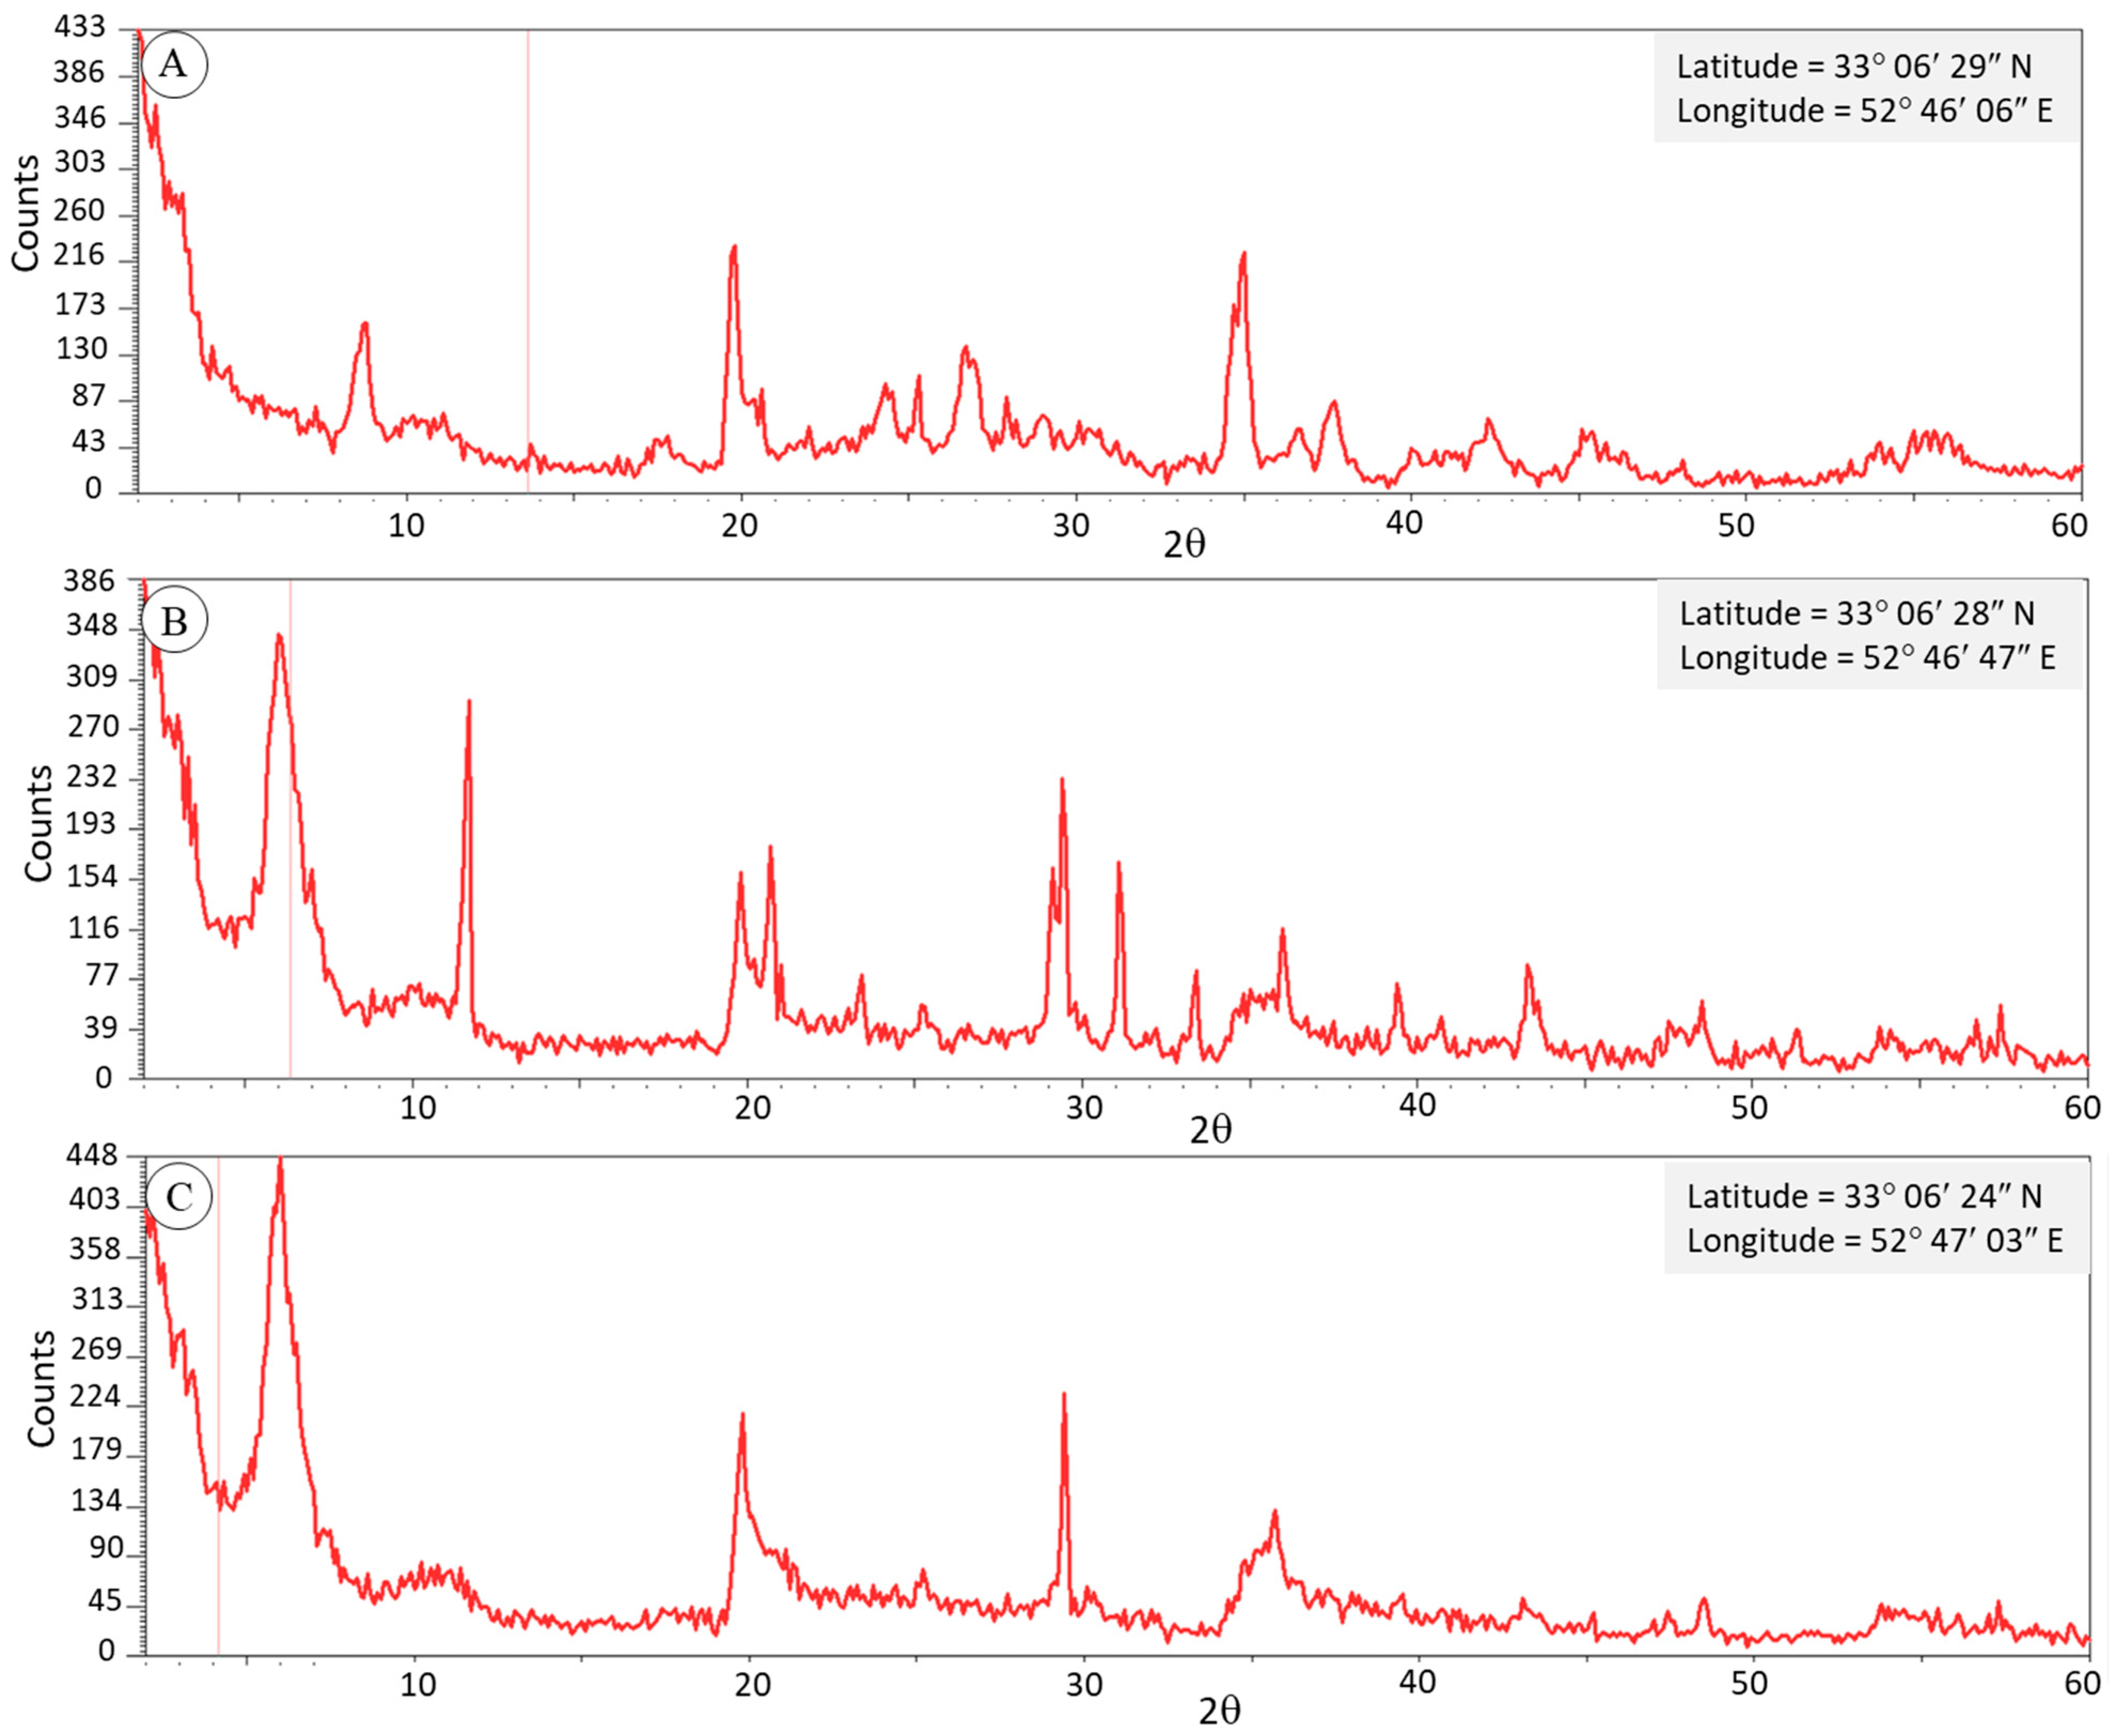

Disclaimer/Publisher’s Note: The statements, opinions and data contained in all publications are solely those of the individual author(s) and contributor(s) and not of MDPI and/or the editor(s). MDPI and/or the editor(s) disclaim responsibility for any injury to people or property resulting from any ideas, methods, instructions or products referred to in the content. |
© 2026 by the authors. Licensee MDPI, Basel, Switzerland. This article is an open access article distributed under the terms and conditions of the Creative Commons Attribution (CC BY) license.