


Abstract
An X-ray fluorescence online analyzer was applied to the analysis of samples of known composition and concentration containing rare earth elements (REEs) and heavy metals (HMs), which were specially prepared by the authors (working samples). Reference samples were used for Th and U. The statistical parameters (detection limit, accuracy, and sensitivity) of the measurements of the spectra were calculated and a thorough assessment of the results was carried out. For large-volume samples, detection limits of 20–100 ppm for REEs and 10–140 ppm for HMs were achieved within 600 s. For thin-layer samples and similar geometries, detection limits for light and medium REEs improved to 3–20 ppm. The methodological possibilities for quantitative analysis of the REEs and HMs were examined and a rather simple approach with an easy implementation was developed. The method was tested in automatic measurements using concentrations in the range of 1000–4000 ppm, as a simulation of real-life measurements, and to determine the stability of the analyzer and the consistency of the results obtained. The results show that the online XRF analyzer can be applied for reliable detection and quantification of REEs and HMs at the ppm level. With these results, we are closer to obtaining results under conditions representative of those on real-world mining conveyor belts.
1. Introduction
Rare earth elements (REEs) are a group of 17 metals: Scandium (Sc), Yttrium (Y), and the 15 Lanthanides (La, Ce, Pr, Nd, Pm, Sm, Eu, Gd, Tb, Dy, Ho, Er, Tm, Yb, and Lu). All of these elements exhibit strong similarity in chemical and some physical properties, which is explained by the almost identical structure of the outer electron shells of their atoms. Conventionally, these elements are divided into light rare earths (from La to Sm) and heavy rare earths (from Eu to Lu, plus Y). The term “rare earth elements” historically emerged at the end of the 18th century, when it was mistakenly believed that minerals containing these elements were rarely found in the Earth’s crust. However, in terms of average concentration, rare earth elements are not rare: with the exception of radioactive Pm [1], their total abundance exceeds that of lead by 10 times, molybdenum by 50 times, and tungsten by 165 times [1,2,3,4]. The total content of REEs in the upper continental crust is 168 g/t [4].
Currently, there is an extremely high interest in the extraction of REEs due to the growth of their applications in various industries: radio electronics, instrumentation, nuclear technology, mechanical engineering, chemical industry, metallurgy, and others [3].
Mining of REEs is a complex multi-stage process that includes exploration, ore extraction, and processing. At all stages of mining and processing of REEs, control of their concentrations is required, which is extremely difficult and expensive under realistically low concentration levels [1,2,3]. For this reason, modern methods for analyzing REE concentrations play a critical role in obtaining the final product during process control.
A similar problem exists in certain industrial technologies for the extraction of heavy metals (HMs). The list of HMs is very large (more than 40 chemical elements) [5,6], and their properties and geological occurrence conditions (concentration ranges, associated elements, matrix materials, etc.) are so diverse that it makes sense to consider this group of HMs in terms of concentration monitoring during mining and processing only separately for each possible scenario. The existing research focuses on the technologies of mining and processing HMs that involve determining their low concentrations against a background of high concentrations of other elements. Such situations occur in the industrial extraction of HMs from low-grade ores, mine dumps, sedimentary materials, marine sediments, and other materials where these elements are present as impurities or at low industrial grades.
Currently, the most widely used method for analyzing both REEs and HMs during their extraction and processing is destructive chemical analysis; however, this method has significant disadvantages [7,8]. First of all, chemical analysis is expensive, requires specialized laboratories and highly qualified personnel, takes a long time, and is prone to human errors. In addition, chemical laboratories generate large volumes of chemical waste that pollute the environment. Green analytical chemistry (GAC) has made great progress [9] in reducing the negative impact of destructive chemical analysis methods on the environment. A large part of its success is the implementation of spectrometric techniques in the analytical process. However, the mining industry is still a challenge for GAC.
Alternatives to the chemical methods of the elemental analysis of ores are non-destructive analyses. These are performed through analyzers based on methods of nuclear physics and include X-ray fluorescence [10,11] and Neutron Activation Analysis (NAA), including Prompt Gamma Neutron Activation Analysis (PGNAA), Pulsed Fast Thermal Neutron Activation (PFTNA) [12], and Gamma Activation Analysis (GAA) [13]. NAA, PGNAA, and PFTNA use nuclear radiation from a generator or isotope, such as 232Cf. Such analyzers are very expensive due the need to periodically replace the expensive nuclear radiation source. Additionally, careful safety measures and constant monitoring are required to avoid the hazards associated with radiation at the measurement point. From a safety point of view, these analyzers are a source of nuclear radiation and subsequently a source of nuclear waste. On the other hand, GAA uses a linear accelerator as the essential part of the mechanism to activate the nuclei of the elements under analysis. The main drawback of GAA is the high cost.
Considering the aforementioned, the most suitable alternative is X-ray fluorescence analysis. The technique is highly developed nowadays, with a wide variety of very accurate and rather affordable analyzers [14]; the vast majority of these analyzers are meant for laboratory or hand-held applications. X-ray fluorescence is a spectrometric method that follows three of the 12 principles of green analytical chemistry [9]: safety, waste prevention, and real-time analysis. Therefore, XRF can help to bring together green analytical chemistry and the mining industry.
The most widely used implementation in laboratories and industry is wavelength-dispersive XRF (WDX) [15]. While extremely sensitive, such a method is impractical for real-time REE analysis. Due to the mechanism of WDX [16], a single-detector system can only measure one element at a time. REE-bearing minerals almost always contain a diverse mixture of REEs [1], requiring the applied WDX instrument to have variable geometry. Such devices require high-precision physical movement, negatively affecting measurement speed and equipment cost. For this reason, the interest and use of energy-dispersive XRF (EDX) analyzers are growing in the industrial sector. An EDX analyzer collects the entire fluorescence spectrum of a sample with a single statically mounted detector. This unlocks the possibility of monitoring multiple elements at once without affecting the equipment cost or speed of analysis. Of particular note are online XRF analyzers, given that they can be installed directly on the conveyor belt [17,18].
More specifically, applications in the mining industry allow the determination of element concentrations in real time at the point where the spectrometer is installed on the conveyor belt that transports material. The quantitative analysis is automated [19], which considerably reduces errors due to human intervention. At the same time, the automation of the analytical process enables remote control and immediate data transfer to the control room. Additionally, there is no need for special sample preparation, which simplifies the whole process. The online analyzers are not as accurate as laboratory XRF analyzers. Nevertheless, they have been successfully applied to the analysis of different materials [17,18], and this prompted us to aim for the application of the online XRF analyzer to the quantification of rare earth elements.
The quantification of REEs by means of online XRF analysis can be challenging. All REEs are distributed in ores of other metals exclusively as minor impurities, the processing of which requires complex technologies and significant investments [1,2,3]. Determining the concentrations of REEs in ore materials is a difficult task, even for laboratory XRF measurements [20,21,22]. The same can be said about monitoring HM concentrations during their extraction from environmental objects [23,24,25]. Such measurements require special algorithms for calculating low concentrations of elements against a background of high concentrations of other elements.
In this work, we present the analysis of the statistical parameters (detection limit, uncertainty, and sensitivity) of the measurements performed on working samples and reference materials and explore methodological possibilities for online quantitative analysis of rare earth elements and heavy metals using an online XRF spectrometer. The aim of this methodological exploration is to find a path for the adaptation and refinement of the tested analysis method, so that it can be applied in real-life analysis.
2. Materials and Methods
The methodological research for the quantitative analysis of REEs and HMs involved the preparation of one set of working samples (samples of known composition and defined concentration prepared specially for analysis) containing Ce, Pr, Sm, Dy, Ho, and Yb, and another set of working samples containing Ba, W, Hg, and Pb. Reference materials for Th and U were used. All of these samples were used to calibrate the online XRF analyzer.
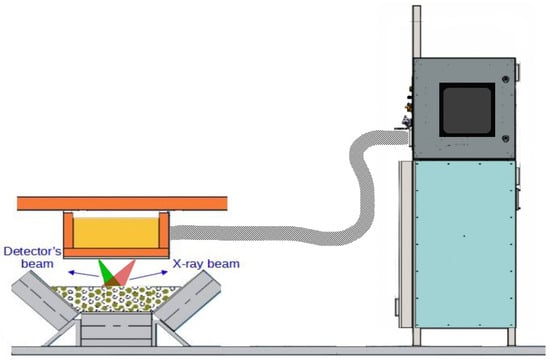
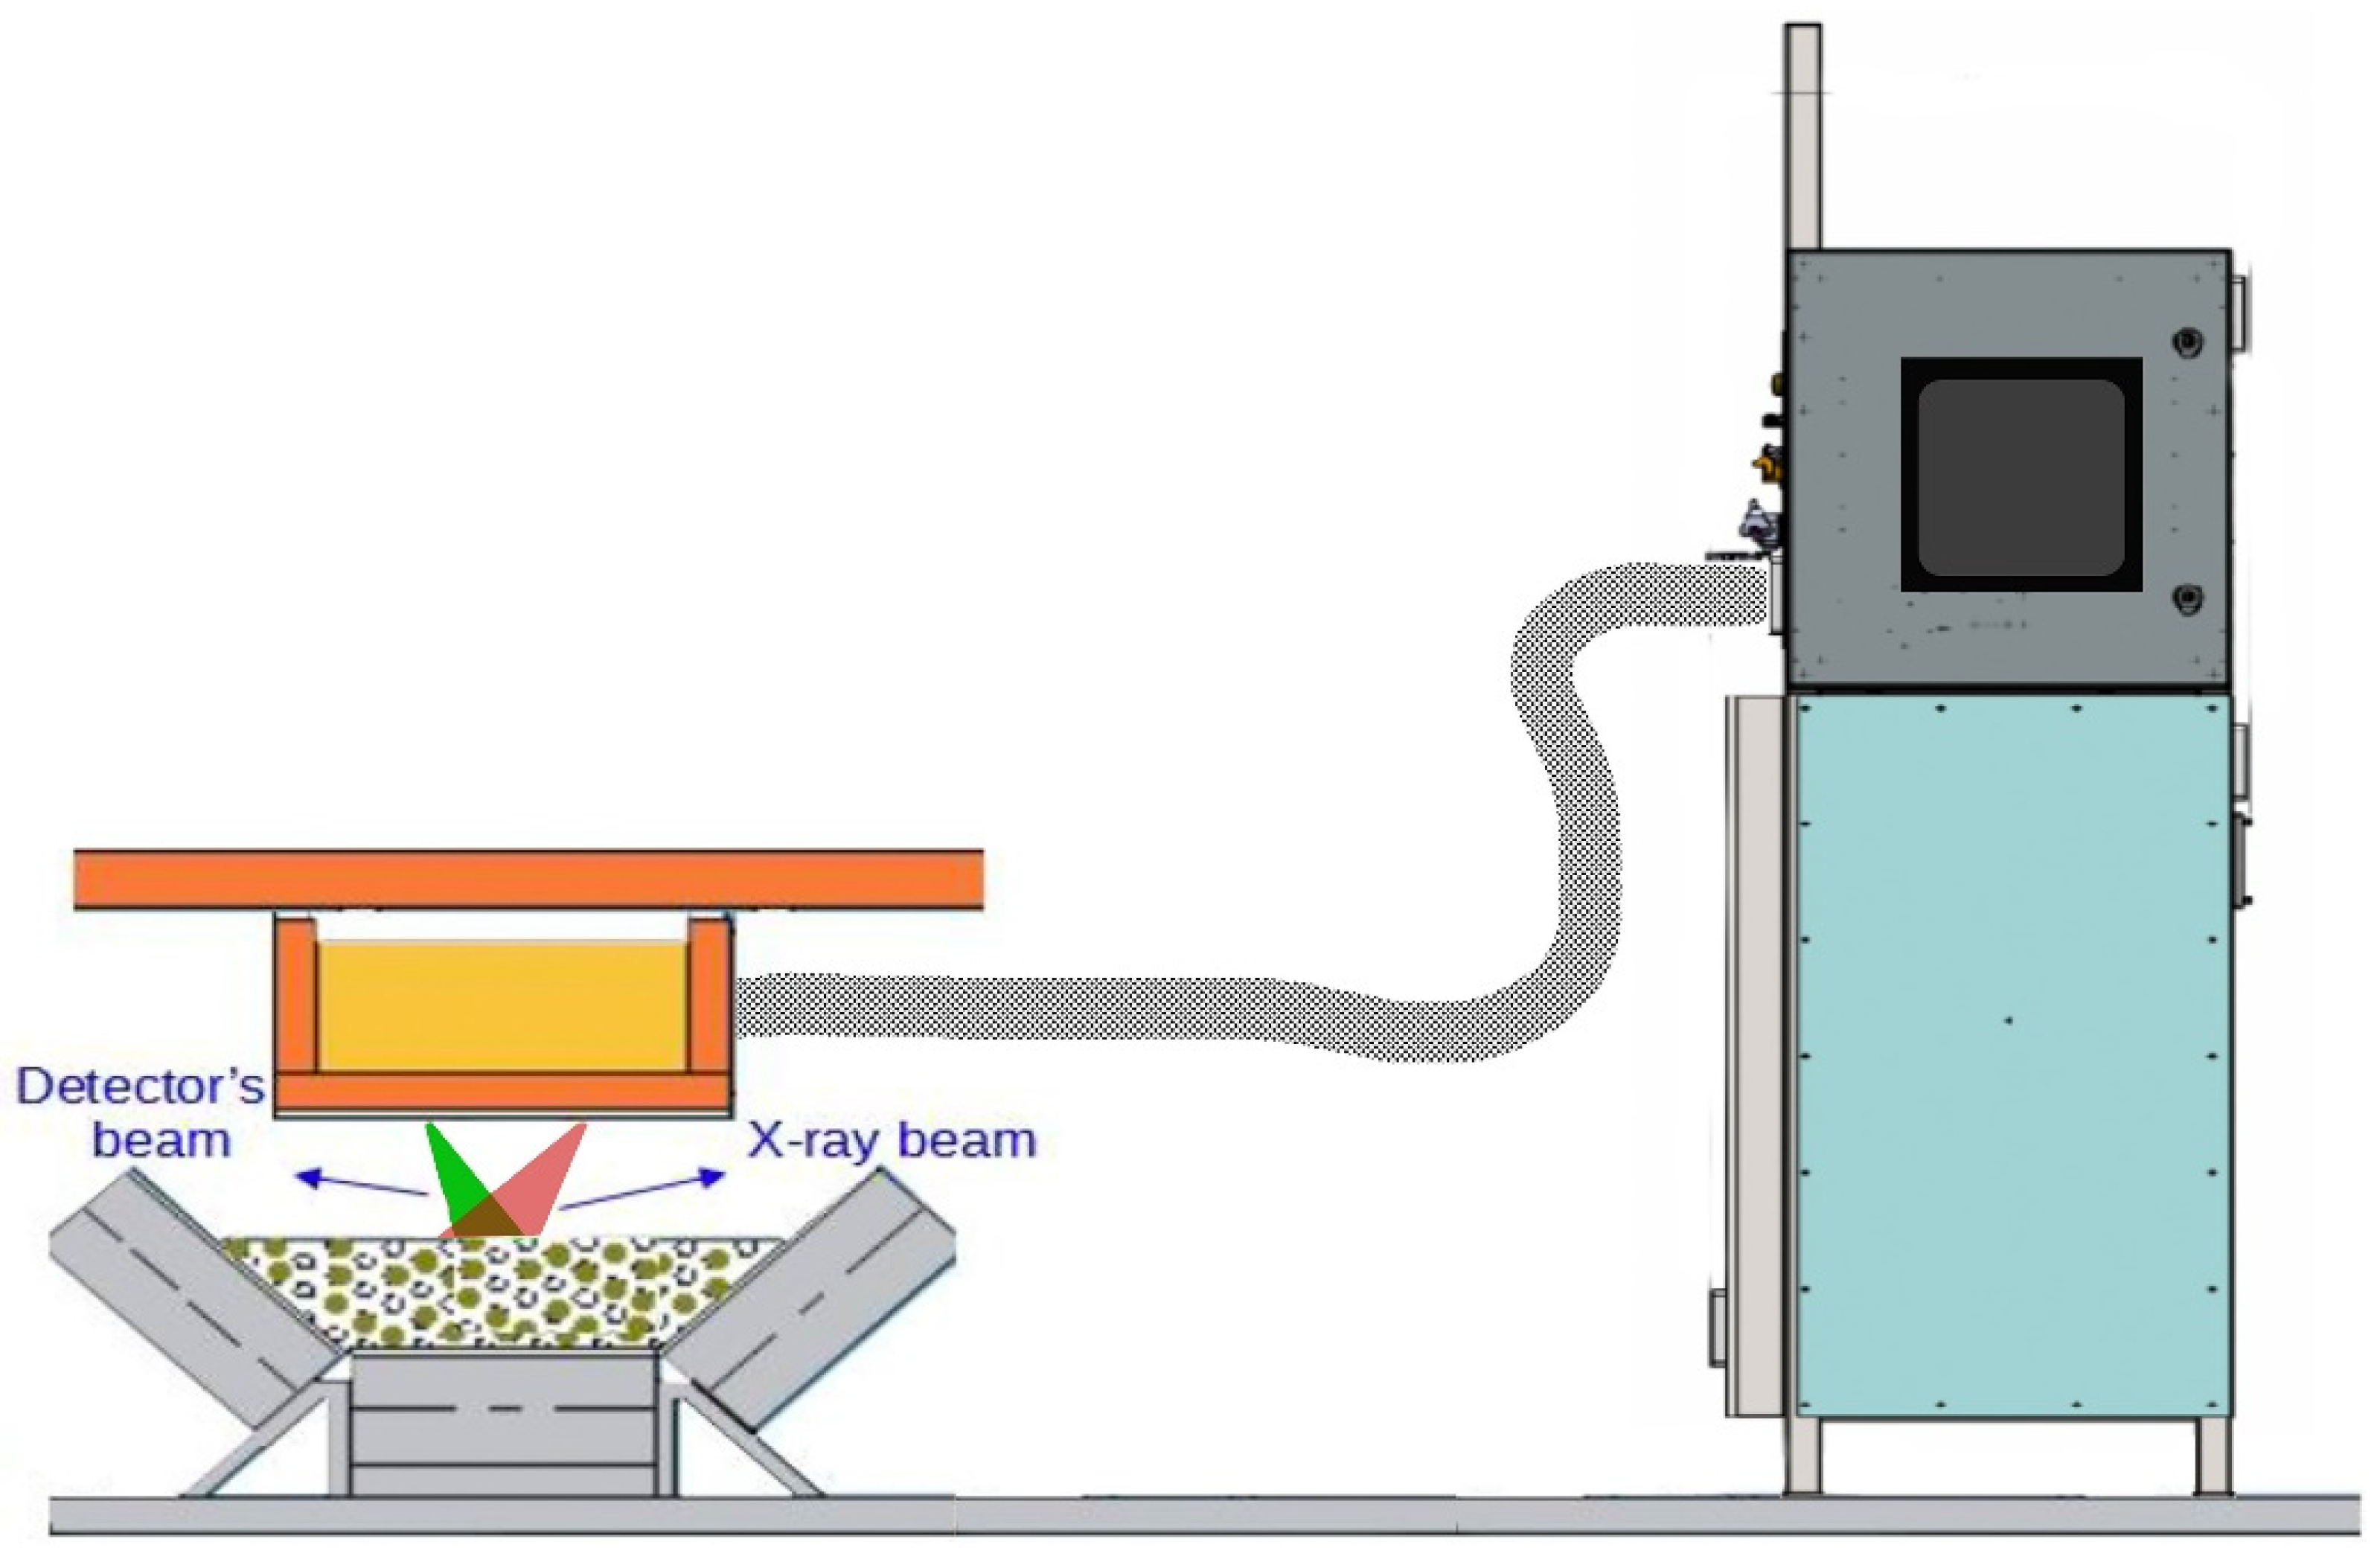
All of the X-ray fluorescence spectra were measured using the industrial online analyzer CON-X [26,27] using the included software Analyzer_CX, version 1.44, which was designed specifically for online analysis and proven in terms of metrological characteristics and reliability in many mining online applications [17,18]. The intended setup of the analyzer is depicted in Figure 1.
Figure 1.
Depiction of the intended setup of the CON-X online analyzer, which is connected to an industrial computer for control and communication.
In this study, samples were mounted statically using a sample holder underneath the analyzer, rather than traveling along a conveyor. Thus, instead of the conveyor belt moving the sample, they were manually moved to measure different areas.
2.1. Preparation of Samples
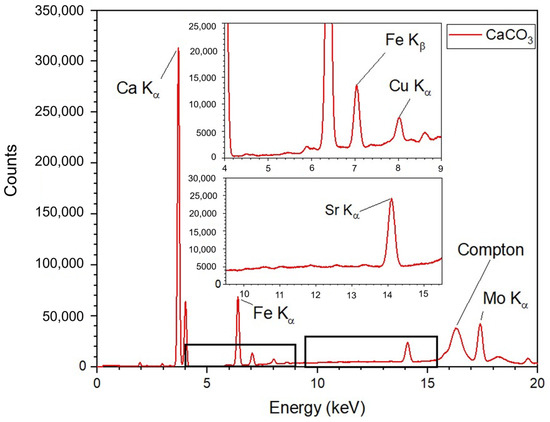
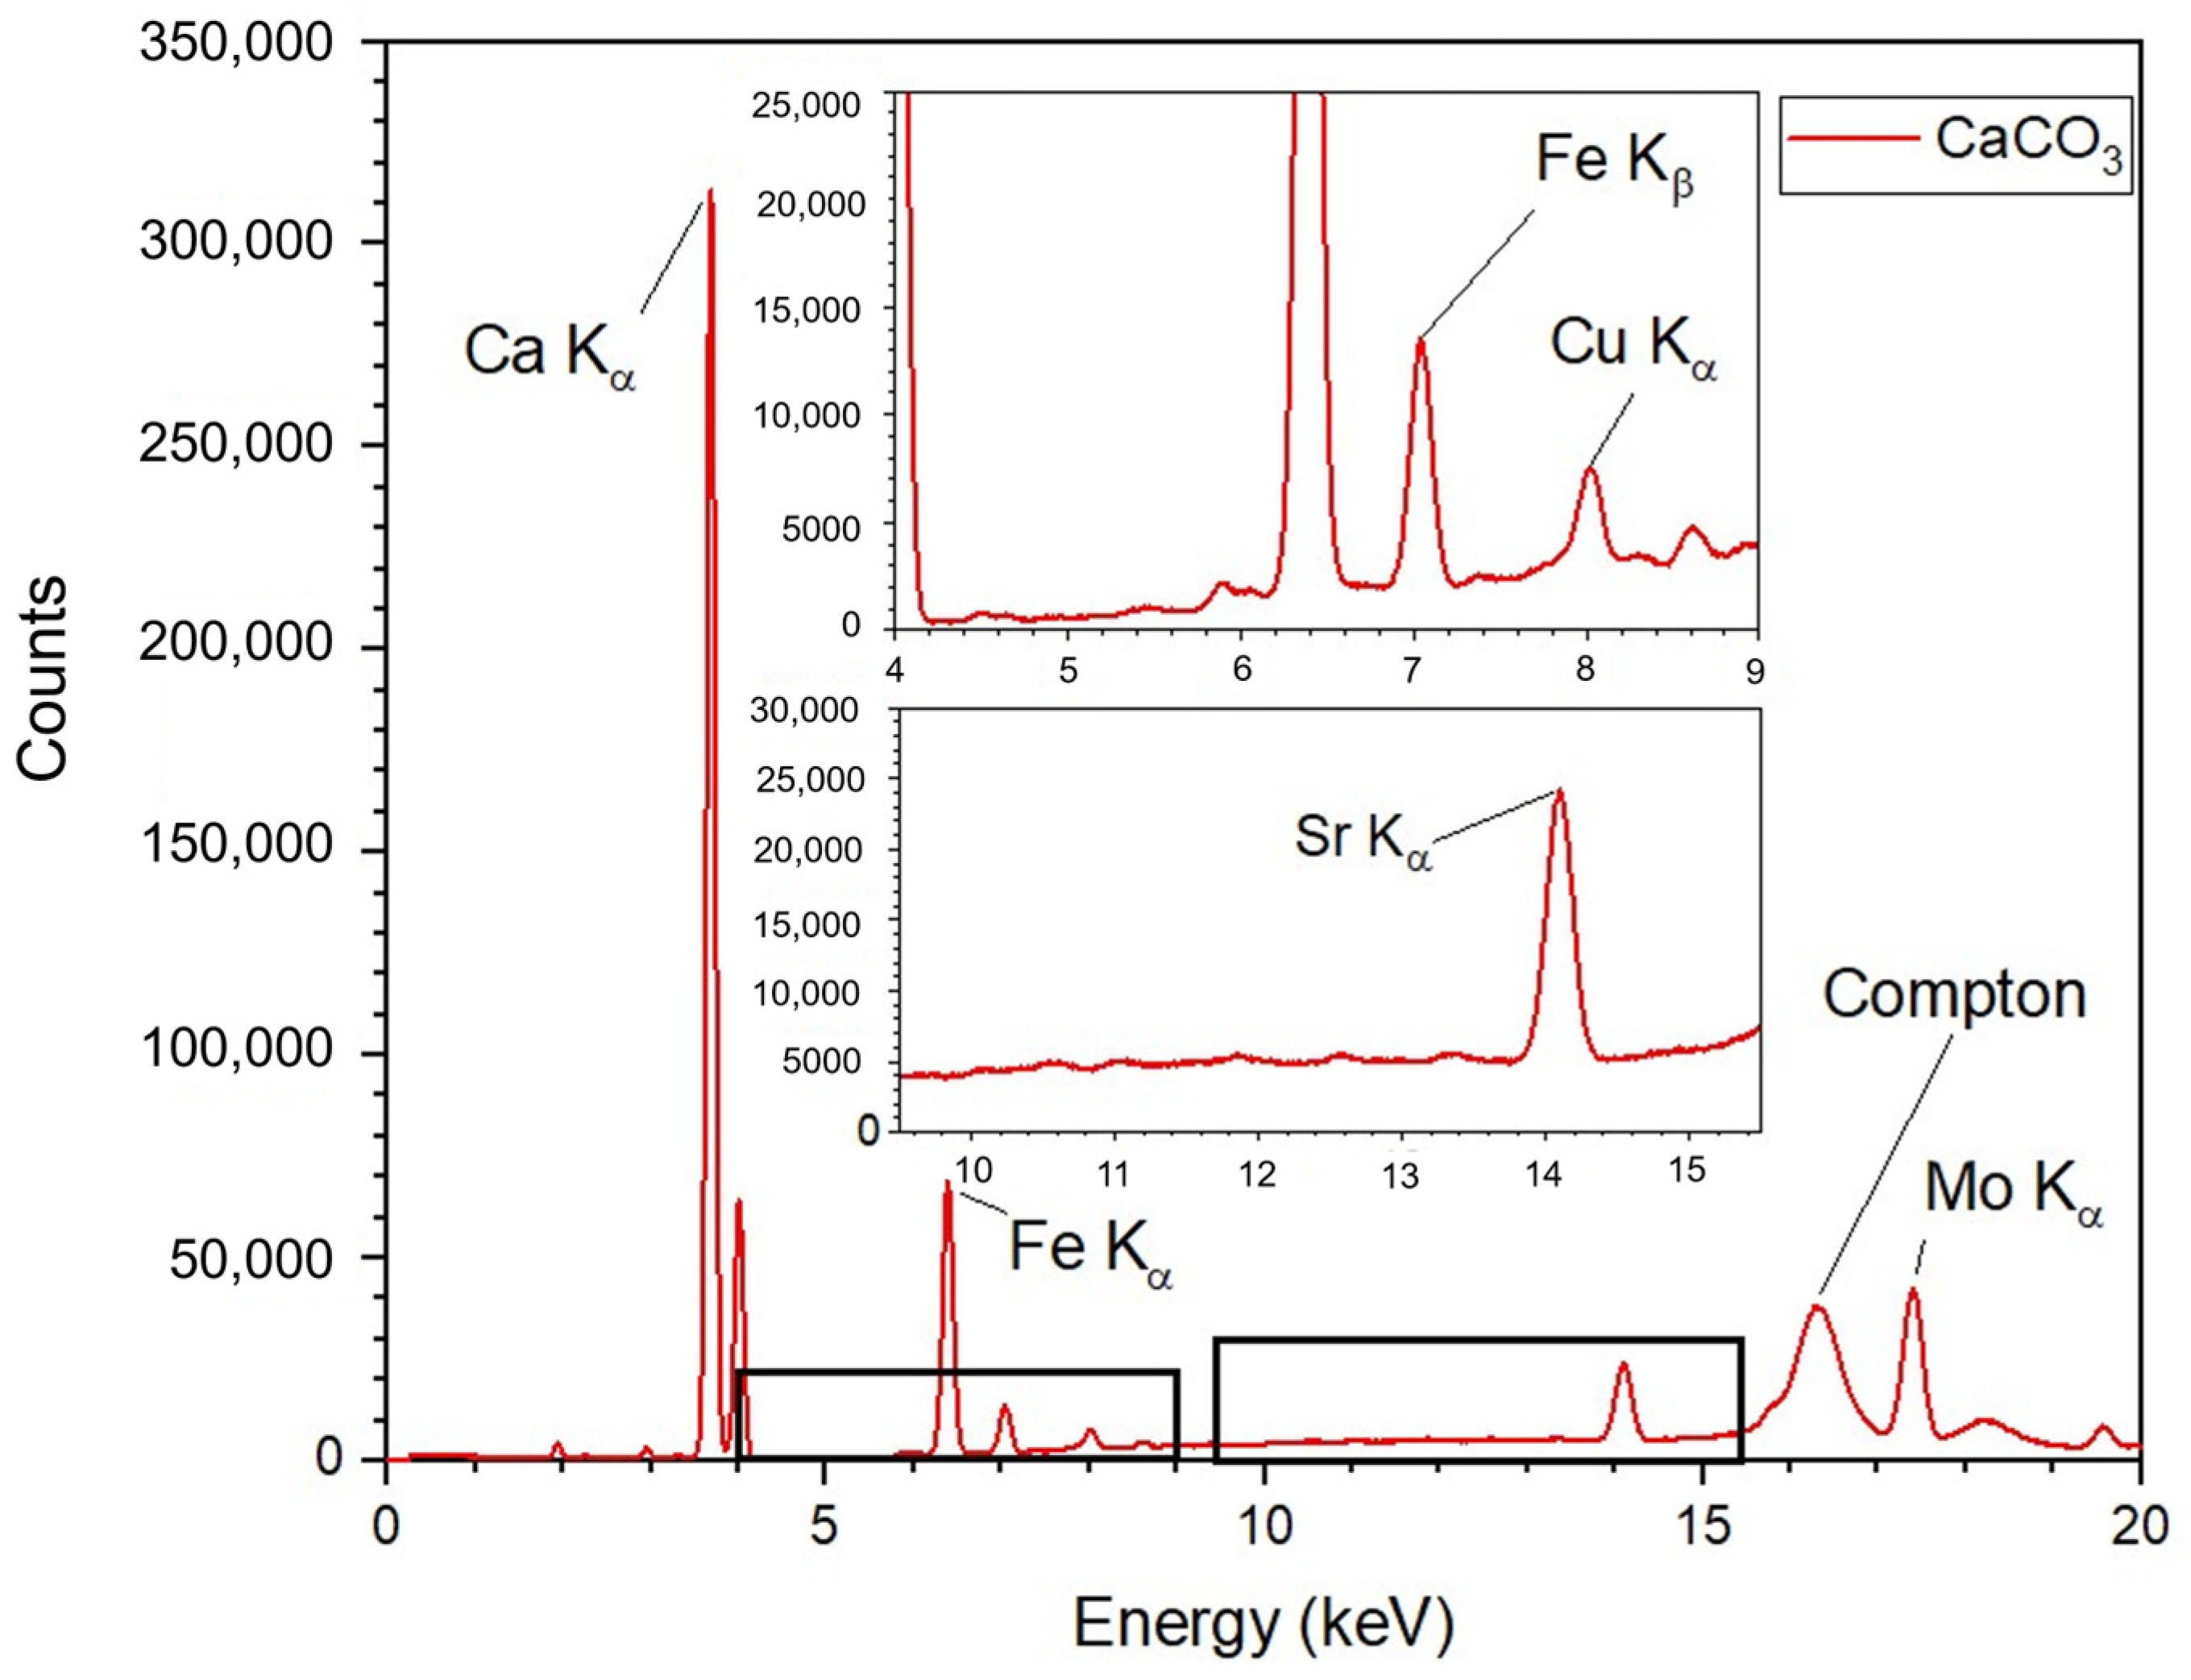
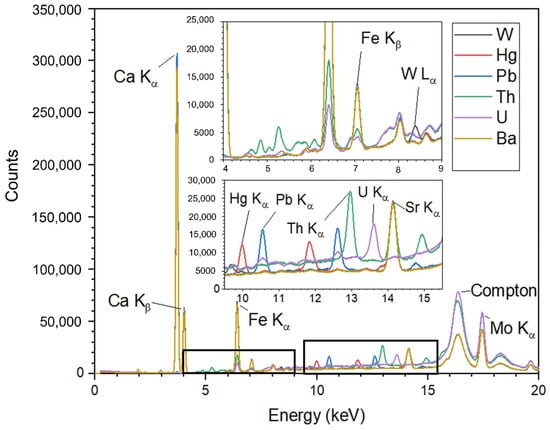
Different compounds of REEs and HMs were purchased from the Nanografi (Ankara, Turkey), ChemPur (Karlsruhe, Germany), and Enola (Riga, Latvia) chemical companies; Table 1 shows the chemical form of the REEs and HMs used. The working samples were prepared from micron-sized powders of the chemical compounds of the required metals. The powders were added to the sample matrix in amounts that provided a metal concentration of 2000 ppm in the final working calibration samples. In order to simulate a real ore matrix, industrial calcium carbonate containing significant impurities of iron, strontium, and barium was used as the matrix; Figure 2 shows the XRF spectrum of the matrix. Most of the elements listed in Table 1 do not have any significant overlap between their spectral lines and the matrix’s spectral lines. The exceptions to this are Ba, which is present in the matrix in significant amounts, and Dy, whose Lα fluorescence line (6.5 keV) is only 100 eV more energetic than the Kα fluorescence line of iron (6.4 keV). As a result, the measurement accuracy was greatly reduced for both elements.
Table 1.
Chemical form of the elements used in the preparation of the working calibration samples.
Figure 2.
Spectrum of the calcium carbonate used for the matrix of the prepared samples of REEs and HMs.
Each working calibration sample was prepared from dry ingredients weighed on a Nahita Blue 5134EX scale with an accuracy of 0.1 mg. The ingredients were mechanically mixed in a conical flask for about 5 min. Single batches weighing 60–70 g were prepared and measured for every entry in Table 1, resulting in 10 samples. The samples were placed into Petri dishes with a depth of 10 mm and a diameter of 85 mm. The Petri dishes were intentionally overfilled, and the resulting mound was flattened by the dishes’ lids. This technique produced samples with a thickness exactly equal to the Petri dish depth. With respect to the samples containing U and Th, we used the certified reference materials IAEA-RGU-1 [28], uranium ore, with a U concentration of 400 ppm, and IAEA-RGTh-1 [29], with a Th concentration of 800 ppm. The matrix of both reference materials is SiO2. Detailed information on all working and reference samples (U and Th) used in these studies (in the order of elements in the periodic table) is given in Table 2.
Table 2.
Characteristics of the working calibration samples prepared. Two reference samples appear in the table: Th and U.
For the sake of comparison, another set of working calibration samples of REEs was prepared containing the following elements: Y, Ce, Pr, Sm, Gd, and Ho, with one mixed sample containing several elements. The matrix used was ore from the Nkana South Orebody deposit (Zambia), consisting mostly of silicate minerals with minor inclusions of calcium salts, and bearing approximately 3% Fe and 3% Cu [30]. For the Gd and Ho working samples, chemically pure sodium carbonate was used as the matrix, providing a sufficiently light matrix. Since this work is a long-term project, this set of samples was prepared several months before all other samples described in this work. At the time of preparation of these samples, the shipments of REE oxides used in the rest of this work had not arrived. In addition, the ore used as the sample matrix was available in very limited amounts. As such, the samples could not be prepared in large quantities. Due to these constraints, every sample was prepared as a single 1 g batch. The samples were placed into Petri dishes with a diameter of 54 mm. Sample thickness was measured with a probe at several points, and did not exceed 1 mm in any of them. Table 3 presents the details of these samples.
Table 3.
Working samples containing REEs prepared with ore from the Nkana South Orebody deposit, Zambia.
2.2. Technical Details and Measurement Conditions
The analyzer contains a silicon drift detector (SDD) with a sensitive area of 20 mm2 and an energy resolution of 138 eV at 5.9 keV [31]. At this resolution, any spectral lines less than 150 eV apart were considered to be overlapped. The throughput of the spectrometer, determined by its processing electronics, was limited to 2000 counts/s over the entire detection range (4–20 keV).
The measurements of XRF spectra for working and reference (Th and U) calibration samples with CaCO3 and SiO2 matrices were performed under the following conditions:
- X-ray tube anode material—Mo;
- X-ray tube voltage—50 kV;
- X-ray tube current—500 μA;
- Distance from the analyzer window to the sample—110 mm;
- Measurement time—600 s.
The measurement conditions for the working samples with ore from the Nkana South Orebody deposit were as follows:
- X-ray tube anode material—Mo;
- X-ray tube voltage—35 kV;
- X-ray tube current—500 μA;
- Distance to the sample—70 mm;
- Measurement time—600 s.
A different spectrometer geometry (“near” geometry) was used for the ore samples, requiring a smaller measurement distance. During the measurements, the samples were placed under the analyzer in Petri dishes, and in single measurements, their position was kept fixed. However, during repeated measurements (<5) of the same sample, the position was changed so that the excitation area was different in each measurement. In simulations of real automatic measurements (>5 repeated measurements for one sample), the position of the sample was fixed.
2.3. Statistical Parameters of the Measurements
The detection limit (DL) is the minimum concentration that can be detected with certainty within a given measurement time. It is determined from the expression:
where Sp and Sb are the numbers of photons detected in the spectral line and its background, respectively, and C is the known concentration of the corresponding element. It is worth noting that Sp is itself proportional to C, meaning that the value of DL is independent of the element concentration in the sample used to calculate it.
The statistical accuracy (σ) shows the achievable repeatability of the determination of the element concentration at a fixed sample position. It is determined from the expression:
This formula is derived by modeling photon registration as a Poisson probabilistic process [32].
The sensitivity (ε) is defined as an increase in the number of photons in the spectral line arriving at the detector in one second, if the concentration is increasing by 1% (in terms of the measured element). It is computed from the expression:
where t is the measurement time.
2.4. Method for Elemental Quantification
The foundations of the method [33] in this work are the interaction between the primary radiation emitted by the X-ray tube and the atoms of the material being irradiated and the subsequent processes. The Bouguer–Beer–Lambert law [34] establishes that the intensity of the radiation after passing through a medium is proportional to e−lμ, where μ is the absorption coefficient at a given energy, and l is the distance traveled by the radiation inside the medium. Therefore, the intensity of the radiation emanating from depth D is equal to
where Is is the intensity of the radiation at the point of formation. In this case, Is is directly proportional to the intensity of the incoming radiation of the same energy, which also obeys the Bouguer–Beer–Lambert law and must reach depth D. From this, the following expression was obtained:
where I0 is the intensity of the radiation emitted by the source. For a sample of thickness L, the total intensity is equal to
which, for a sufficiently thick sample, can be approximated as
This result is in agreement with the findings of [35,36]. Accordingly, the recorded intensities of fluorescence and incoherent scattering radiation are related as follows:
where Ia and Iic are the recorded fluorescence of the element of interest and incoherent scattering intensities, respectively. Ia0 and Iic0 are the intensities of the radiation emitted by the source at the energy regions of Ia, while Iic and μa and μic are the absorption coefficients for these energy regions.
The values of Ia0 and Iic0 are parameters of the X-ray source and are independent of the sample. However, the proportionality coefficient between Ia and Ia0 includes the concentration of the fluorescing element. The ratio of Iic to Iic0 does not directly depend on the elemental composition of the sample, as it is caused by scattering, not fluorescence [12]. In addition, Ia and Iic are proportional to the areas of the corresponding peaks, since both peaks are in the same spectrum and are therefore recorded for the same length of time. To account for the radiation scattered by the parts of the device when measuring the intensity of incoherently scattered radiation [37], we use the correction coefficient N0. These facts substantiate the following expression:
where Na and Nic are peak areas corresponding to fluorescence and incoherent radiation, respectively, N0 and S are empirical spectrometer constants, and Ca is the concentration of the fluorescent element. By rearranging (9), we obtain the final expression for the calculated concentration of the element.
Thus, the calculated concentration of the element is determined not only by the values of the peak area corresponding to fluorescence and incoherent radiation, but also by the coefficients of the absorption of fluorescence and incoherent scattering energies in the sample.
In order to use Equation (10), it is necessary to determine the value of the correction coefficient N0. As the area of the peak of the element is proportional to the concentration, we verify the linear proportion between the ratio Na/Ca and Nic by plotting them and fitting a line. For this, we performed measurements of samples with different matrices and different concentrations of a chosen element. Table 4 shows the matrices and concentrations of the samples that were used for this.
Table 4.
Working calibration samples used to determine the value of N0. The reference element is Tm (chemical form: Tm2O3, purity ≥ 99.95%).
These particular matrices were chosen to cover a wide range of absorption behaviors to ensure high accuracy of the linear regression. In addition to this, REEs are often found associated with carbonatites [38,39], whose absorption coefficients in the studied energy range lie between those of CaCO3 and Na2CO3. Also, associations between REEs and sulfates in the minerals have been found, such as Na2SO4 and K2SO4 [40,41], and, as mentioned on the website of the Zandkopsdrift project [42], rare earth oxides and manganese oxide are found in the same deposit. As it was previously mentioned, the calculated values for detection limits do not depend on the concentration of the sample. At the same time, measurements of higher concentration samples have low relative error, which helps in creating a more accurate predictive model. For these reasons, we chose to use samples with unrealistically high concentrations of target elements.
3. Results and Discussion
3.1. Measurements at Optimal Distance
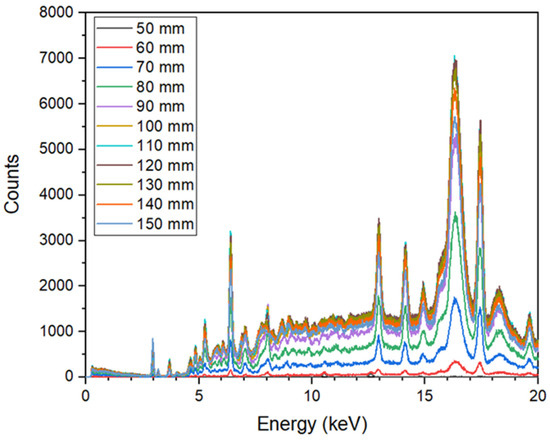
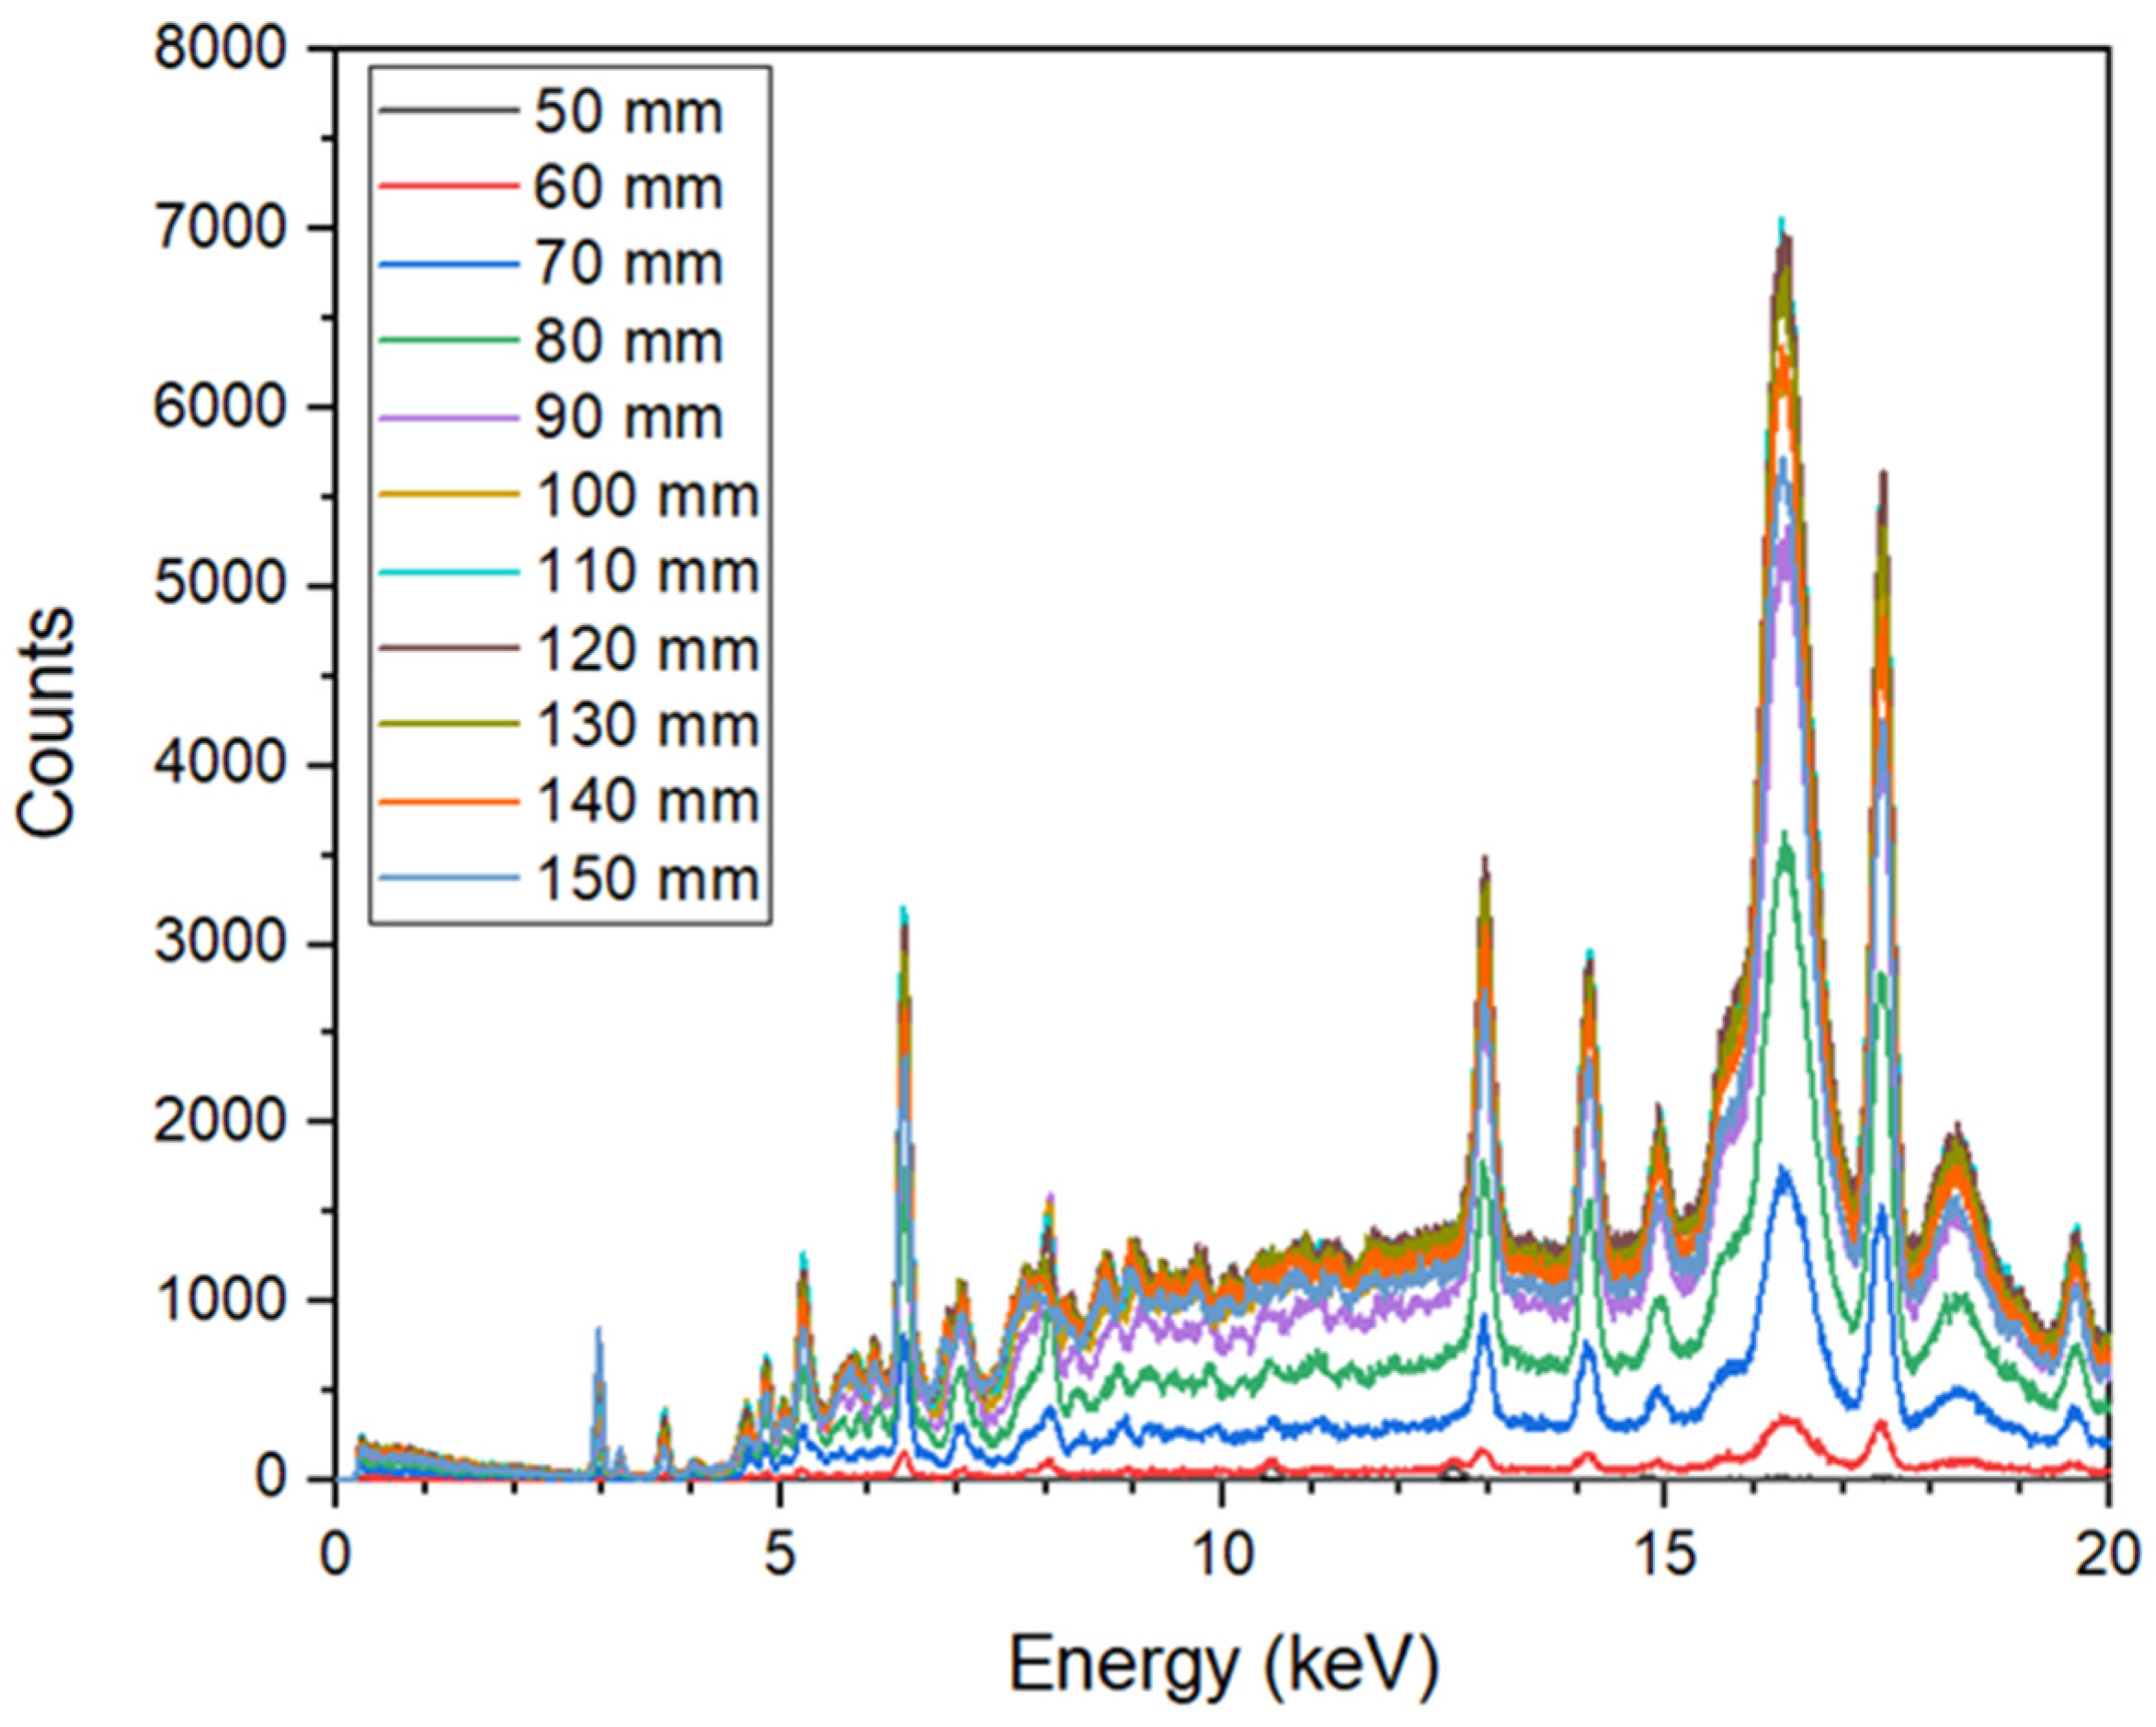
To find the optimal measurement distance for this X-ray optical configuration in order to ensure the maximum intensity of fluorescence radiation, spectra of the same samples were taken at varying distances. Figure 3 shows the spectra of the Th sample in Table 2, measured at different distances but with otherwise identical parameters.
Figure 3.
Spectra of 800 ppm Th in SiO2 matrix, taken at distances between 50 and 150 mm with identical X-ray tube parameters.
It is clear that measurement distance has a major effect on observed spectrum intensity. It is also apparent that the greatest overall intensity is achieved between 100 and 120 mm. The middle of this range, 110 mm, was used as the optimal distance. The “near” geometry optimal distance of 70 mm was found in an analogous way.
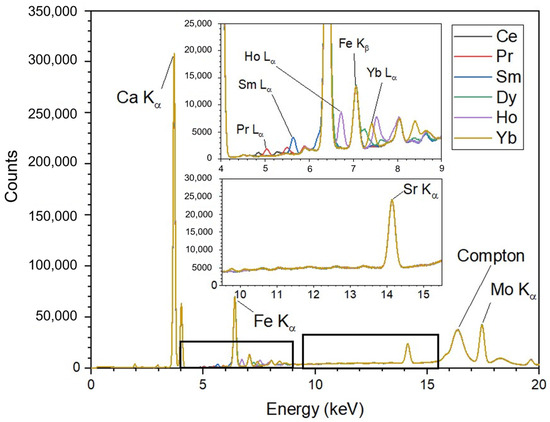
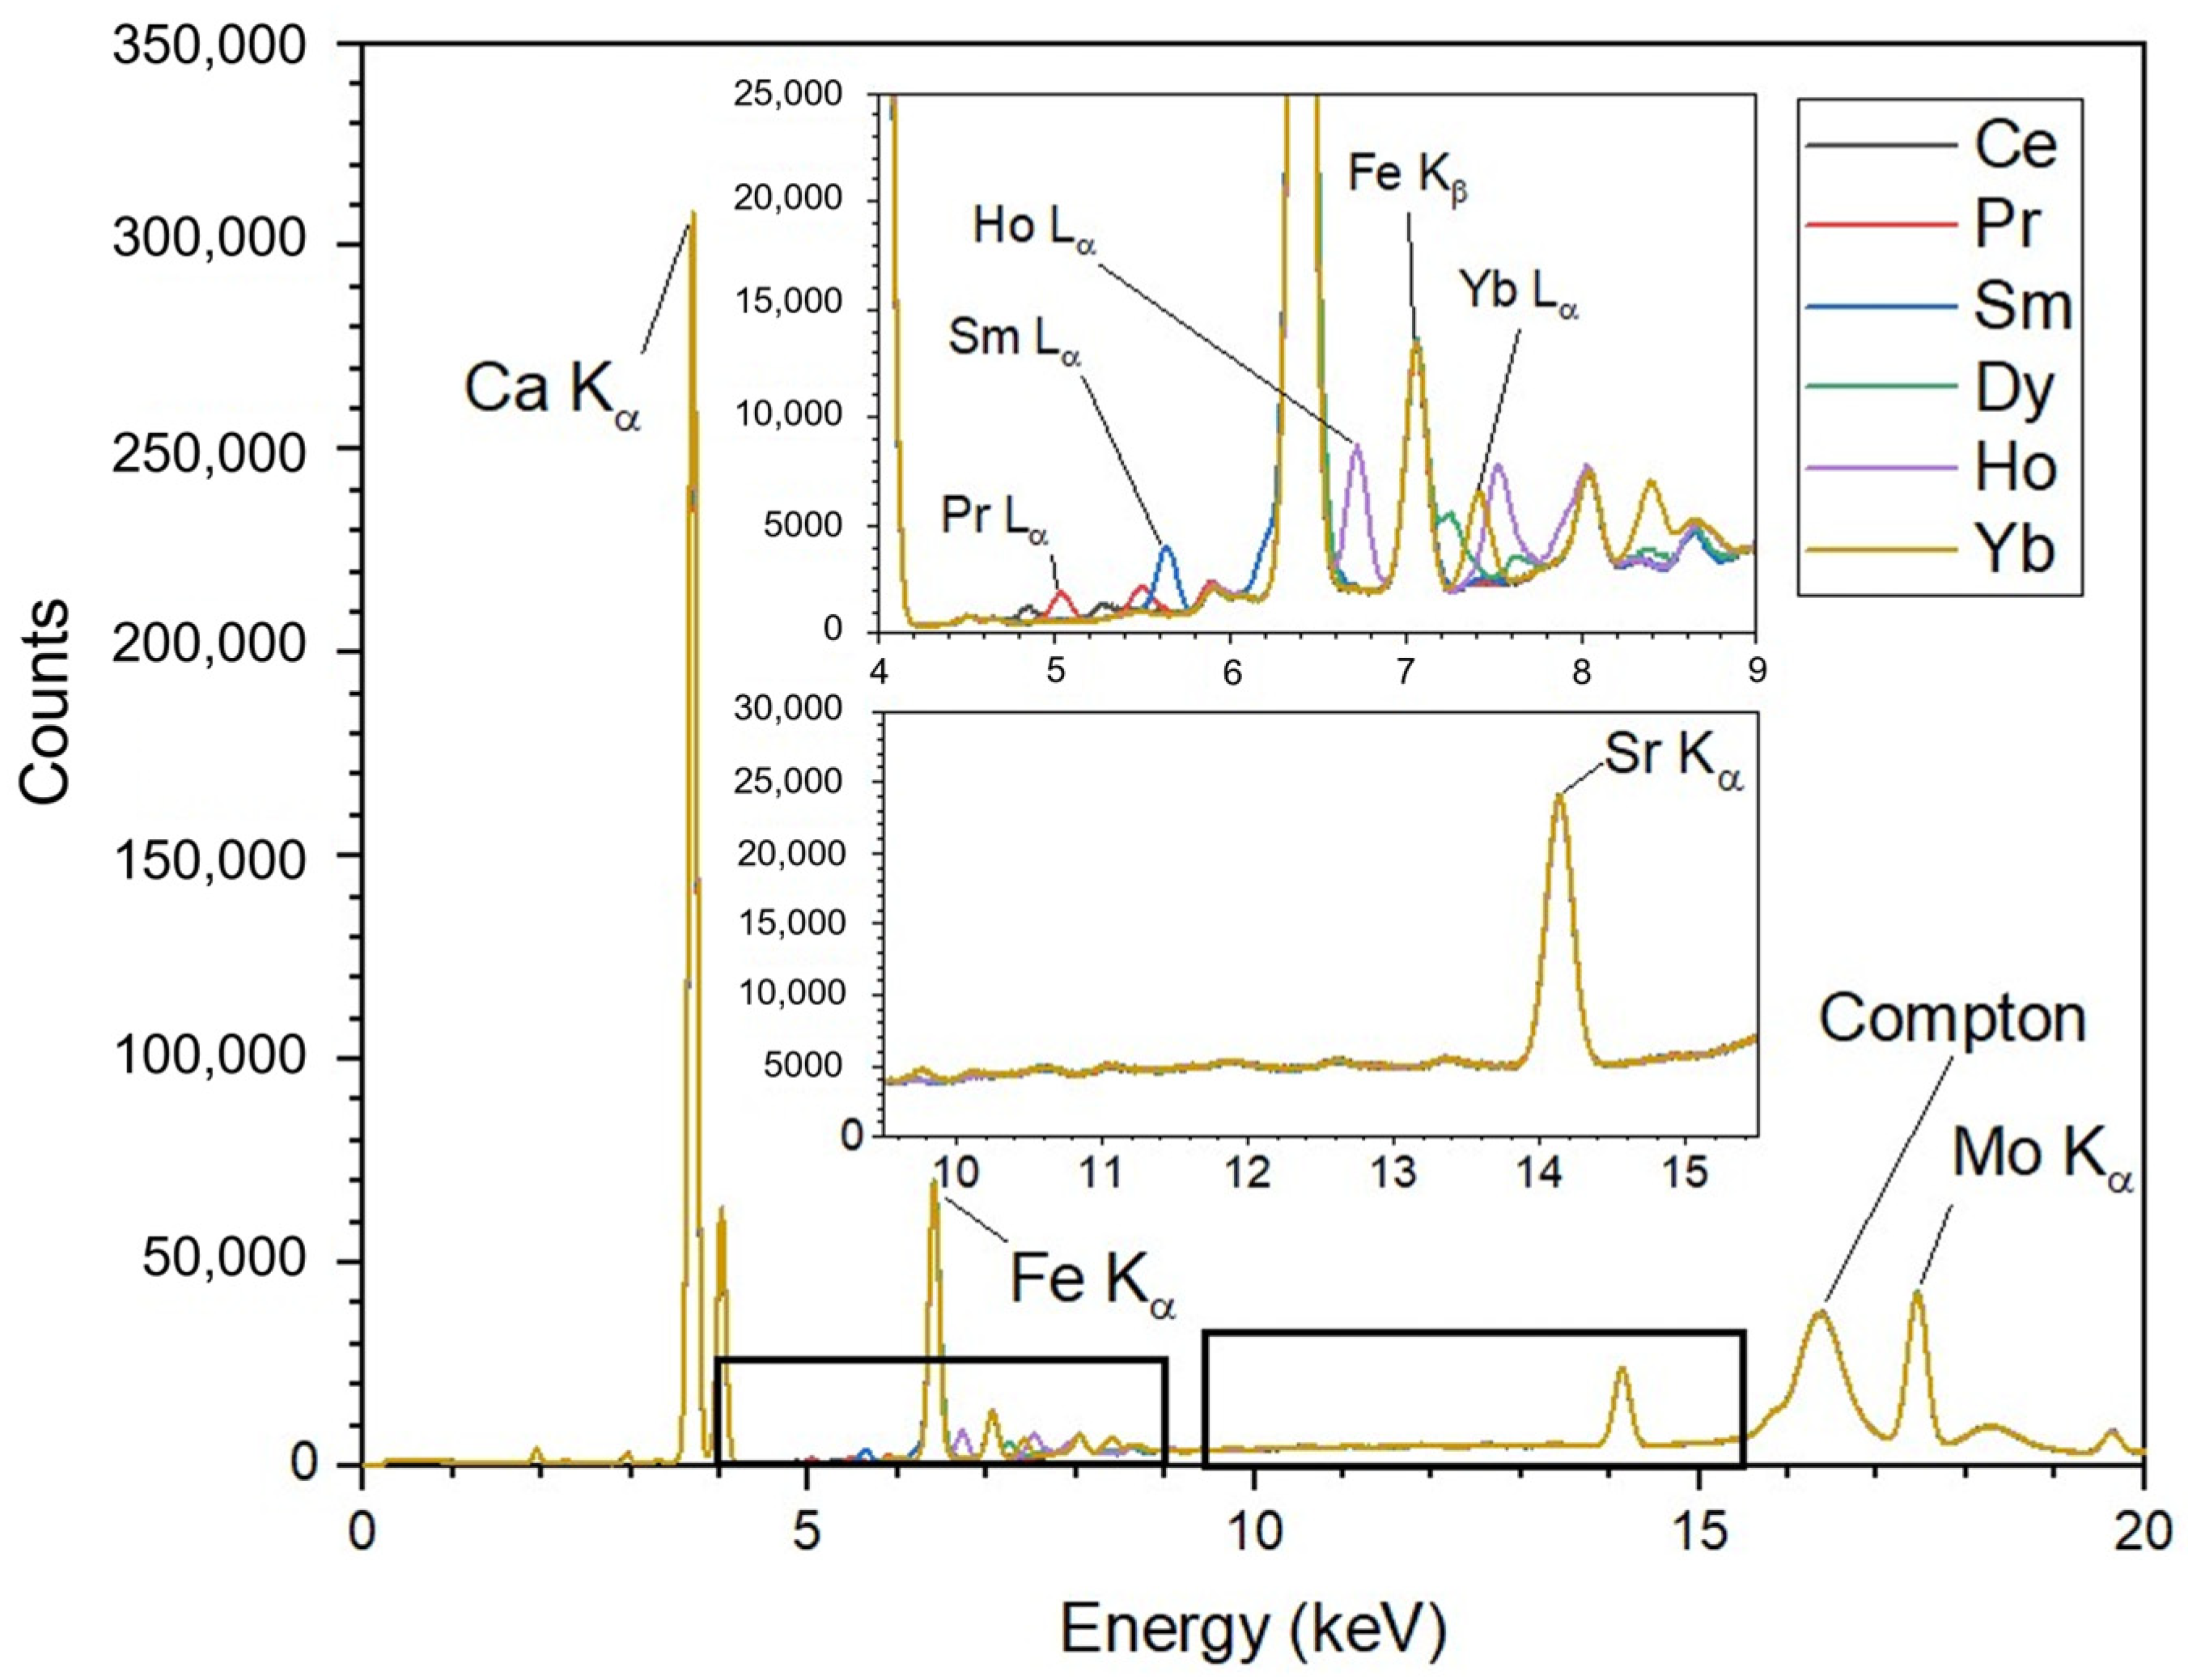
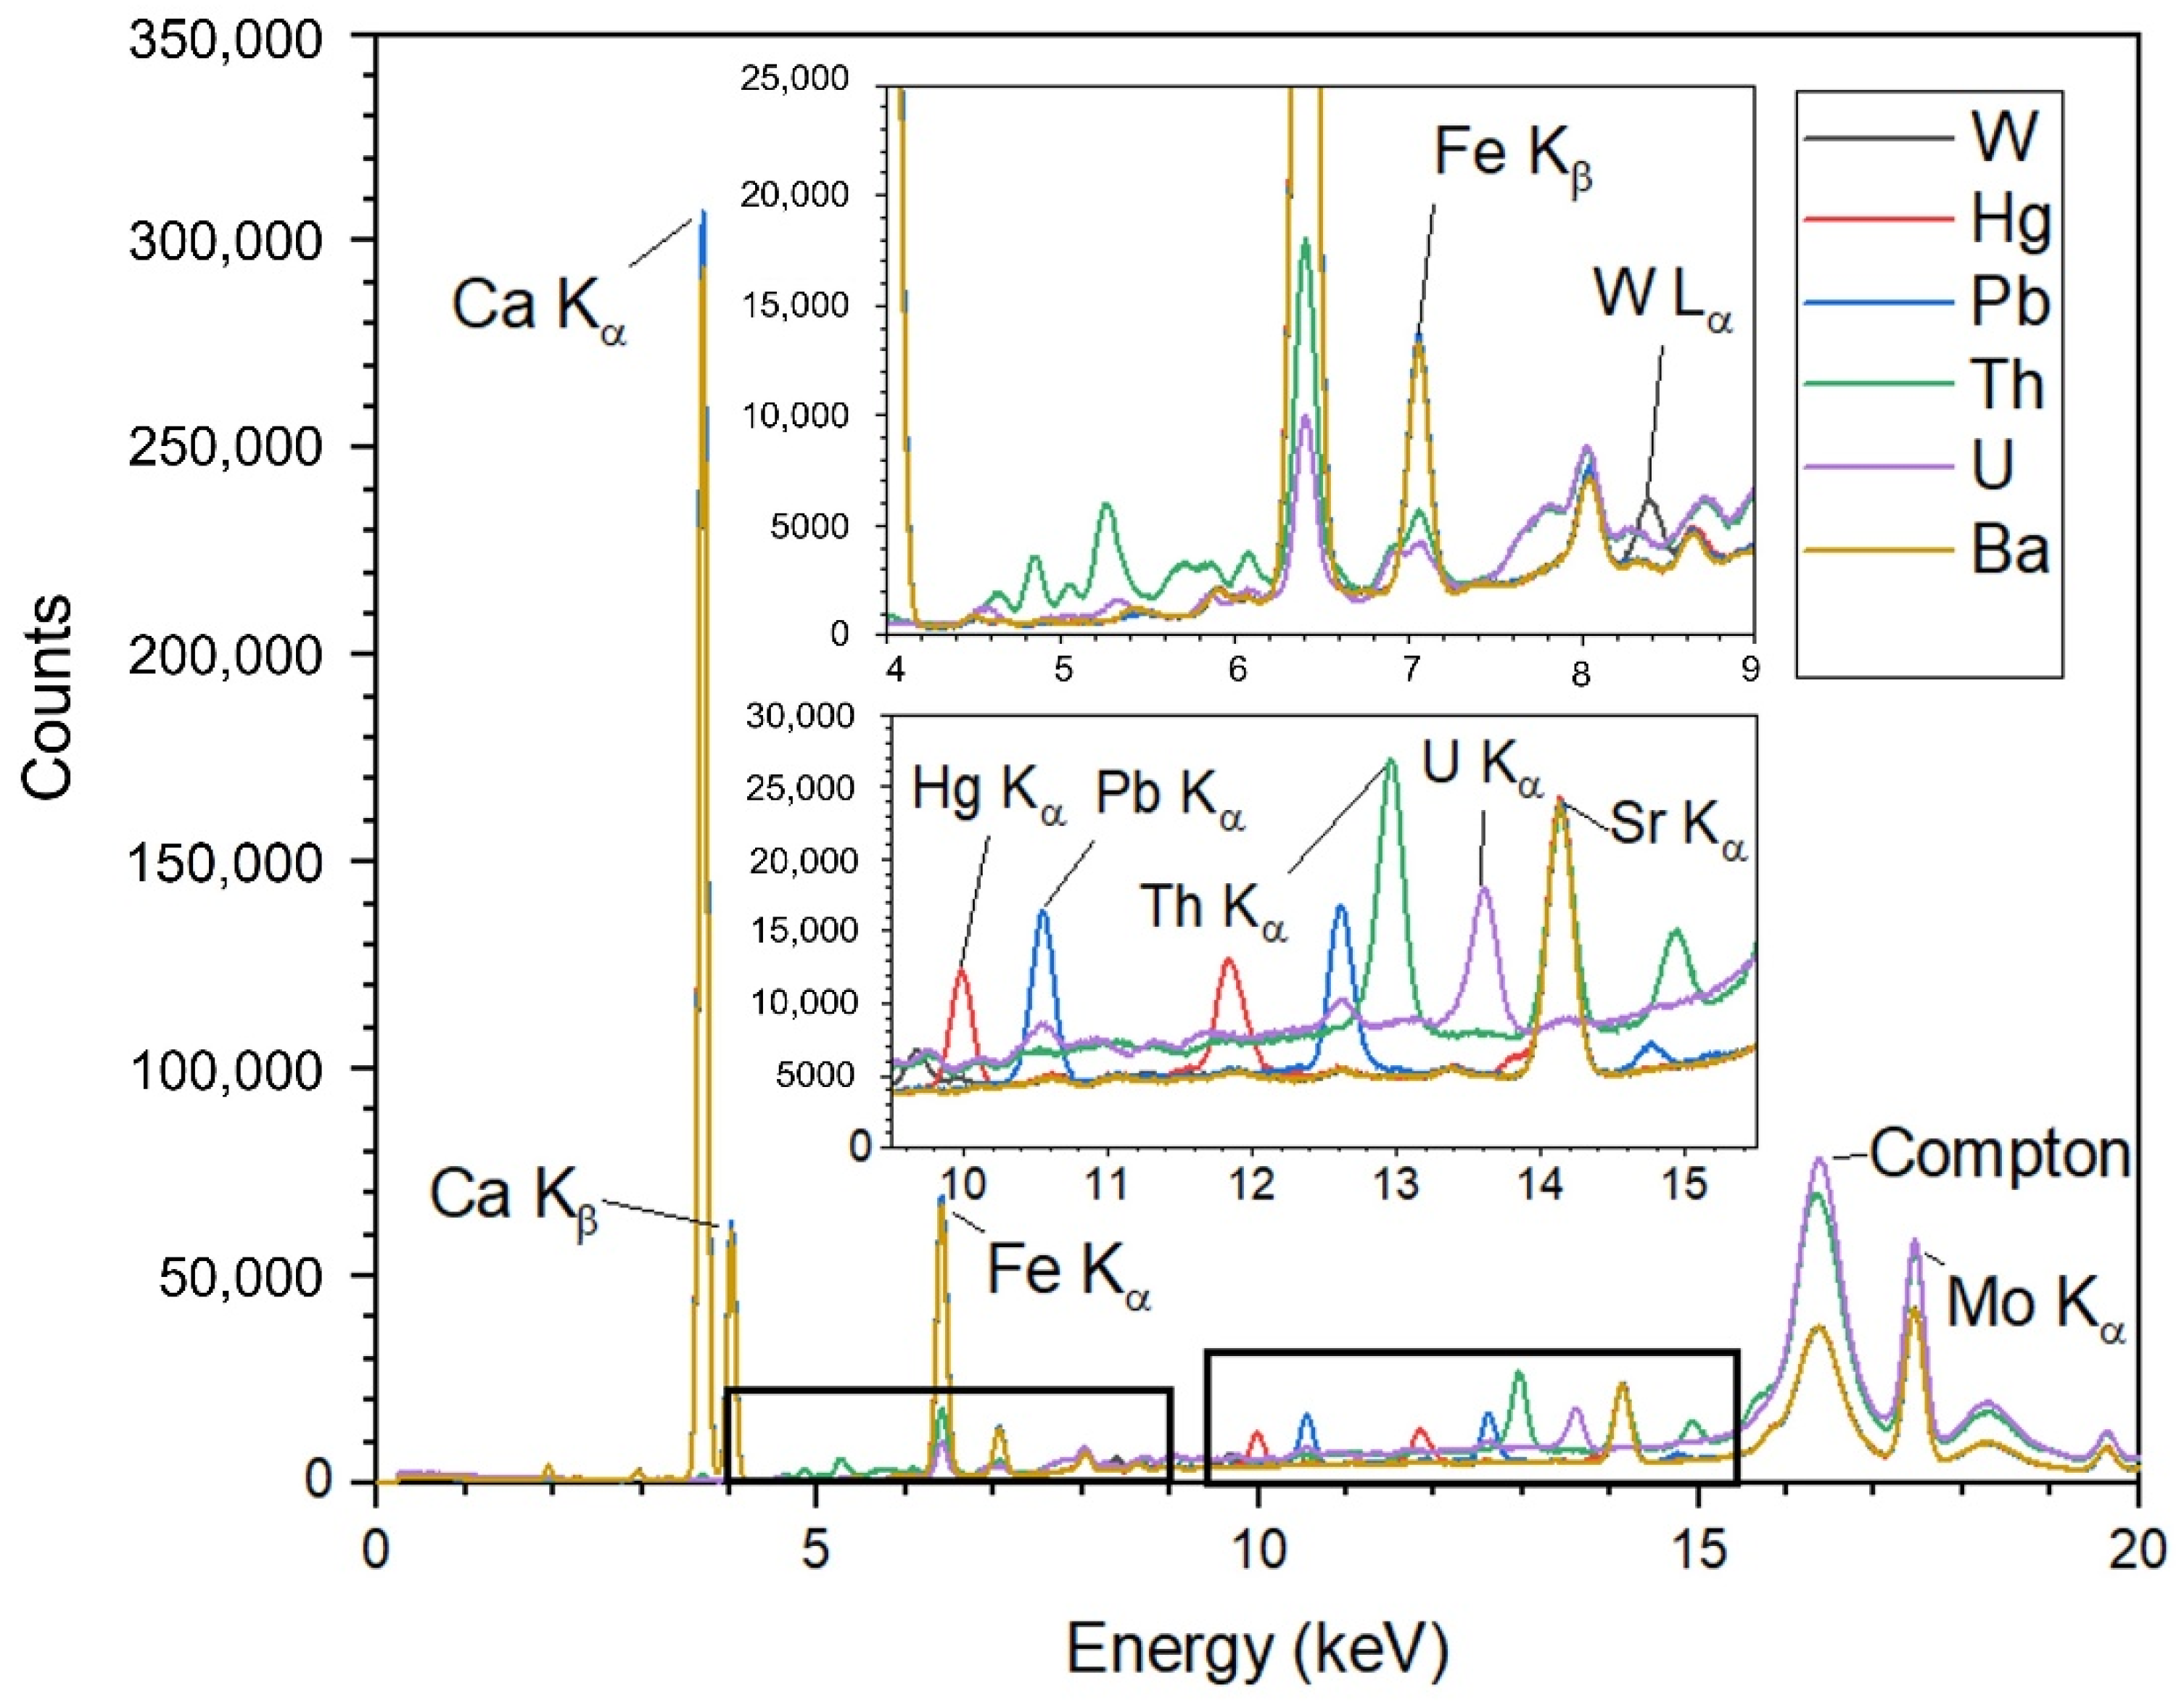
For each working sample, three spectrum measurements were performed, and the results were averaged over the three measurements. The averaged spectra of the samples with REEs are presented in Figure 4, and those of the HMs are presented in Figure 5.
Figure 4.
Spectra of all working calibration samples of REEs. Insets show the ranges containing L lines: the upper inset is from 4.0 keV to 9.0 keV; the lower inset is from 9.5 keV to 15.5 keV.
Figure 5.
Spectra of all working calibration samples of HMs. Insets show the ranges containing L lines: the upper inset is from 4.0 keV to 9.0 keV; the lower inset is from 9.5 keV to 15.5 keV.
3.2. Results of Statistical Parameters
The detection limits (DLs), statistical uncertainty (σ), and spectrometer sensitivity (ε) of the elements were calculated from each spectrum in accordance with Formulas (1)–(3). The results of these calculations are presented in Table 4. For the calculation of the spectral parameters for each element, spectra without peak overlaps and not requiring deconvolution were used. For almost all elements, these were Lα lines. For Dysprosium, we obtained a significantly worse DL than for the other REEs. As mentioned earlier, its Lα line overlaps with the iron Kα line, which was present in the matrix, and therefore only the weak Lβ1 line was clearly observed.
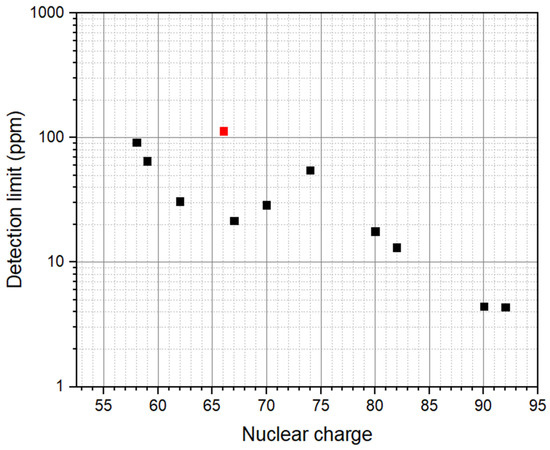
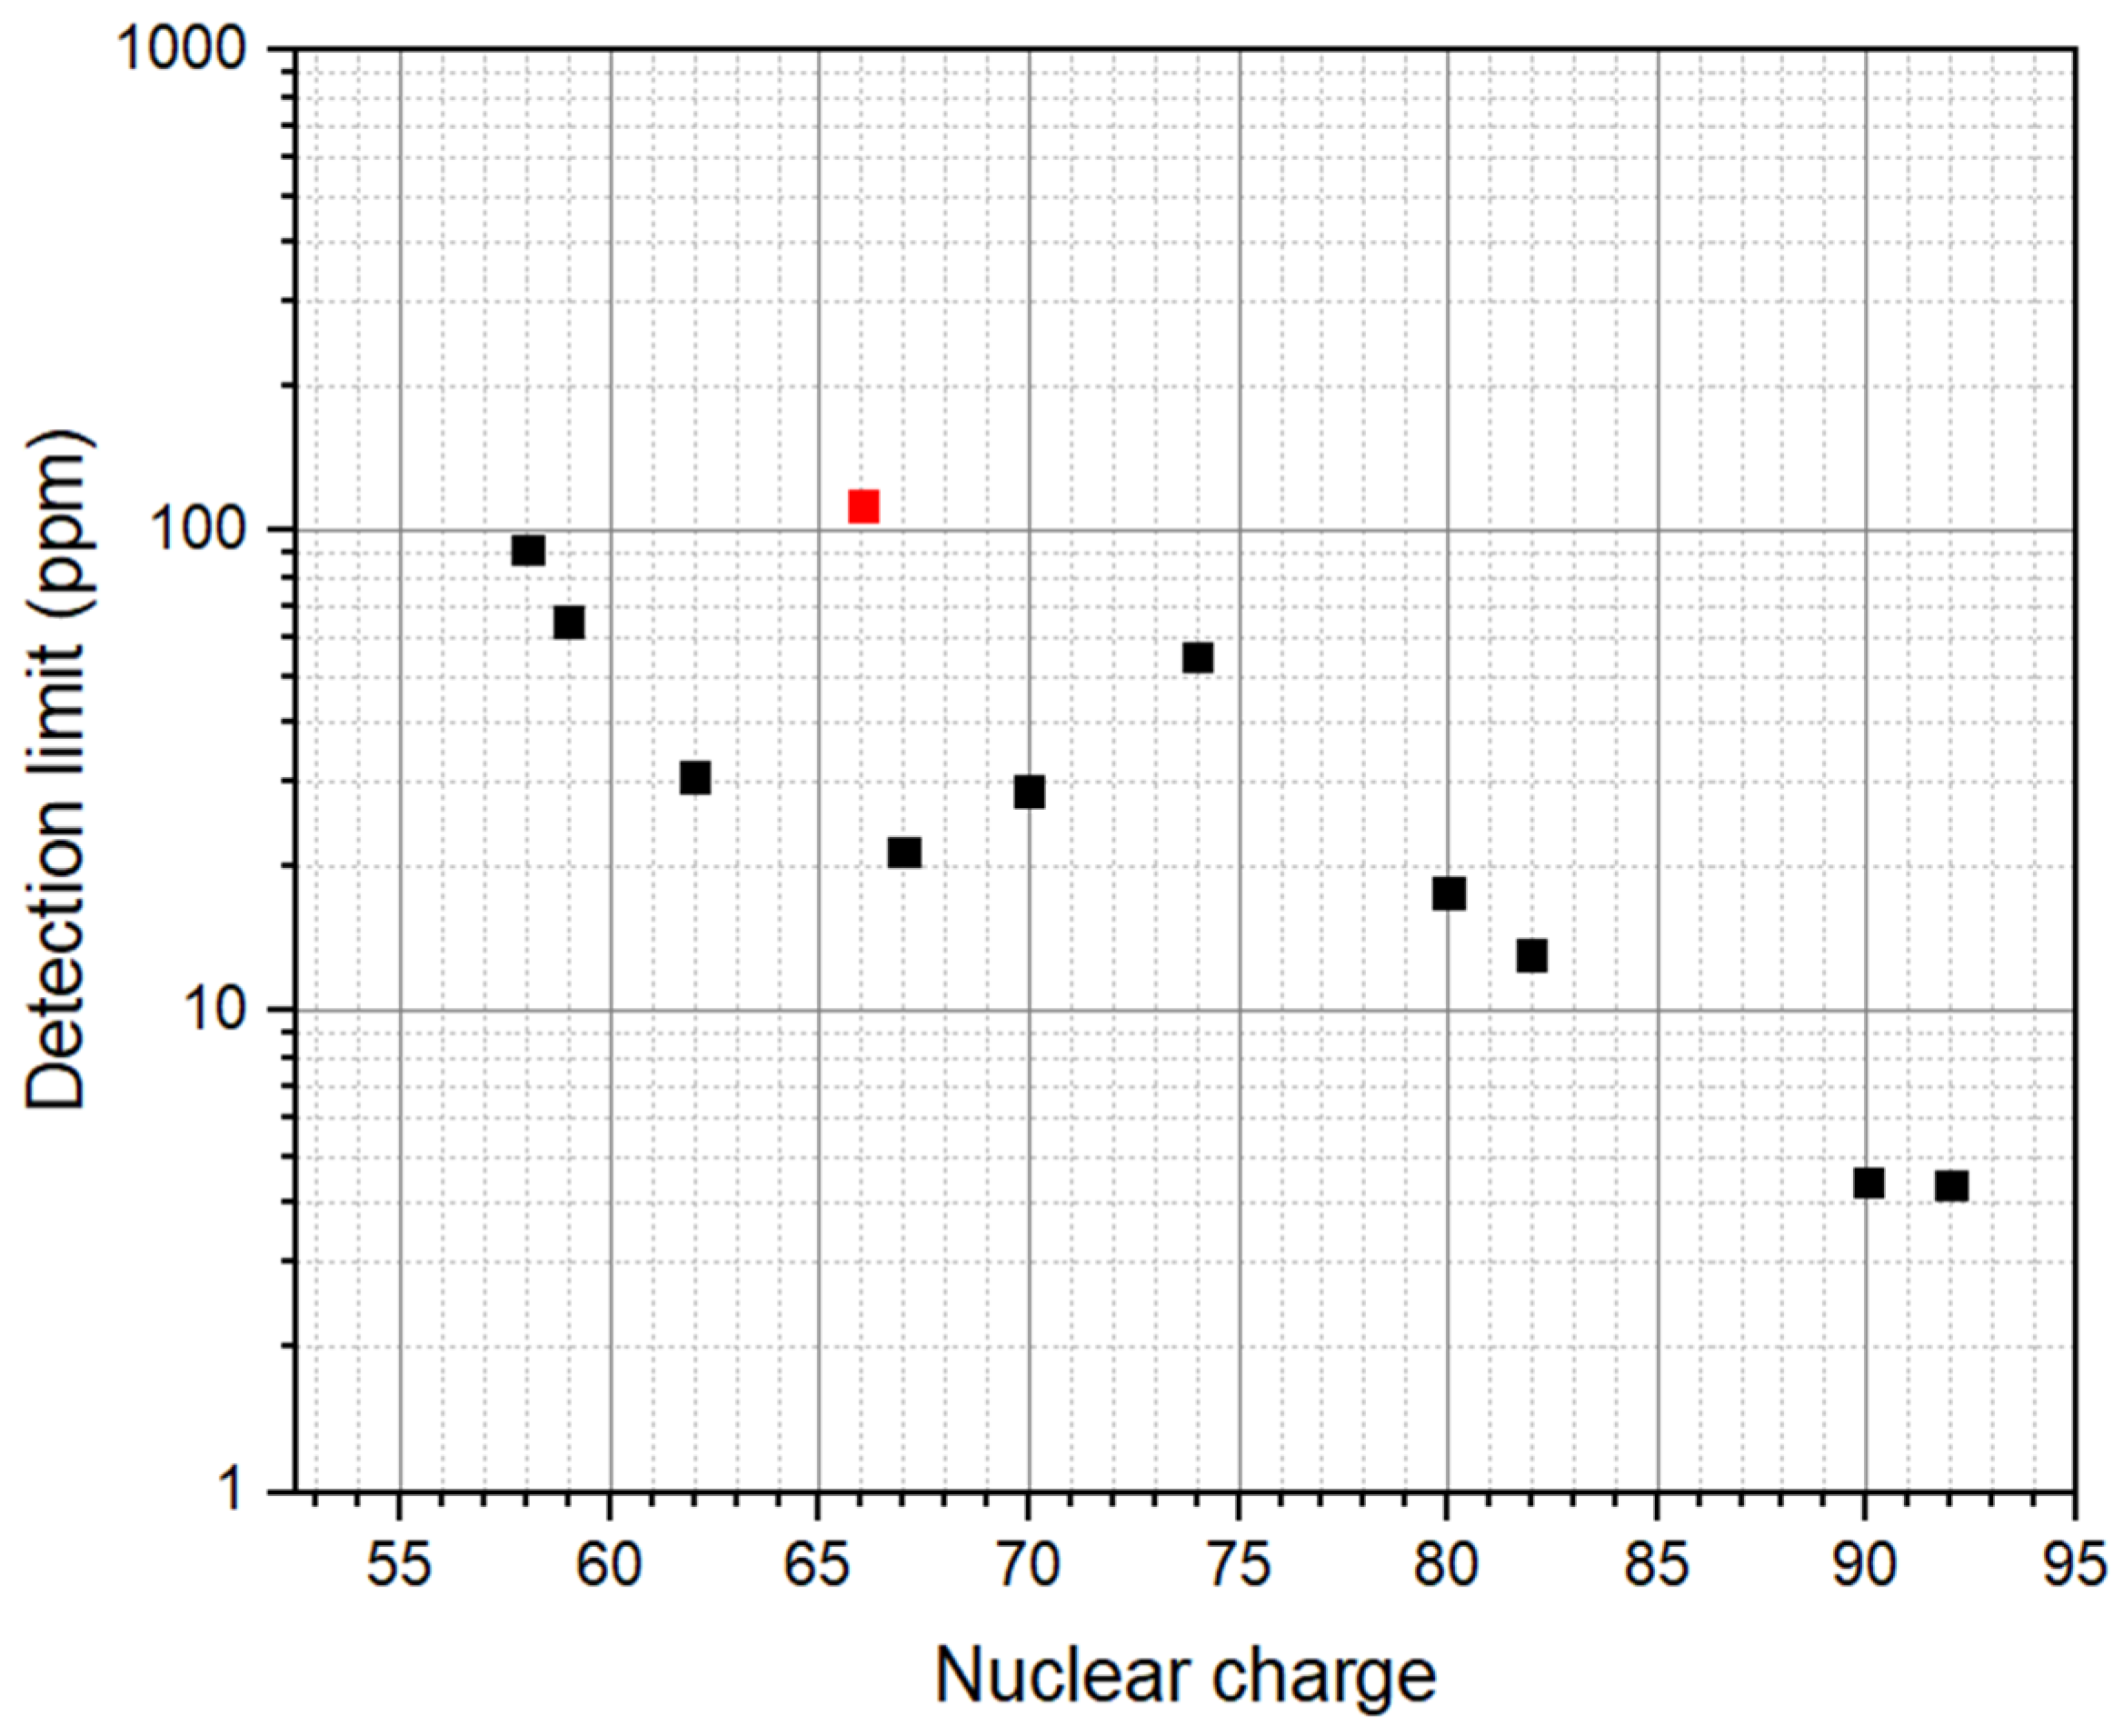
As can be seen in Table 5, the detection limits for REEs were 21.7–91.7 ppm, and for HMs 13.2–136 ppm. The dependence of the detection limit of the studied REEs and HMs on their nuclear charge is shown graphically in Figure 6.
Table 5.
Detection limit, measurement uncertainty, and sensitivity values for REEs and HMs in the prepared working and reference (Th and U) calibration samples.
Figure 6.
The dependence of the detection limits of REEs and HMs on their nuclear charge: 56Ba, 58Ce, 59Pr, 62Sm, 66Dy, 67Ho, 70Yb, 74W, 80Hg, 82Pb, 90Th, and 92U. The red point corresponds to Dy. The results were obtained using a Mo anode X-ray tube at 50 kV and 500 μA.
As can be seen, the detection limit values generally show a downward trend with increasing nuclear charge, with the exception of the section between Ho (Z = 67) and W (Z = 74). All studied REEs have DL values between 20 ppm and 100 ppm, with the best values for heavy Lanthanides. This is a promising result, since the total concentration of REEs in the Earth’s crust is approximately 168 g/t [4]. The studied elements that are heavier than REEs all have DL < 60 ppm, with the best values obtained for heavier elements. The lowest DL values, close to 4.4 ppm, were obtained for U and Th.
As can be seen in Table 5, the measurement uncertainties of concentration determination were 12.6–56.3 ppm for REEs and 7.51–68.1 ppm for HMs. The lowest measurement uncertainty of 2.28–2.49 ppm was achieved for U and Th. The maximum measurement sensitivity of 0.71–0.73 counts/s/ppm was also achieved for U and Th.
Thus, as the studies have shown, at a distance of 110 mm from the detector window to the surface of the working sample, and with the geometry optimized in terms of ensuring the maximum fluorescence intensity, the detection limits of REEs and HMs in online measurements can be 21.7–91.7 ppm and 13.2–136 ppm, respectively.
Considering the process in a mine, after grinding the ore that contains REEs into particles, it looks like a powder; its surface can be made quite smooth when moving along a conveyor [17]. This may allow the use of a shorter distance between the analyzer and the studied material, which should improve all metrological results.
It is expected that in real applications, the material will undergo some amount of crushing or grinding before REE analysis is performed. This stems from the fact that most REE extraction facilities employ beneficiation methods such as density separation and froth flotation, which require the material to be in the form of small particles.
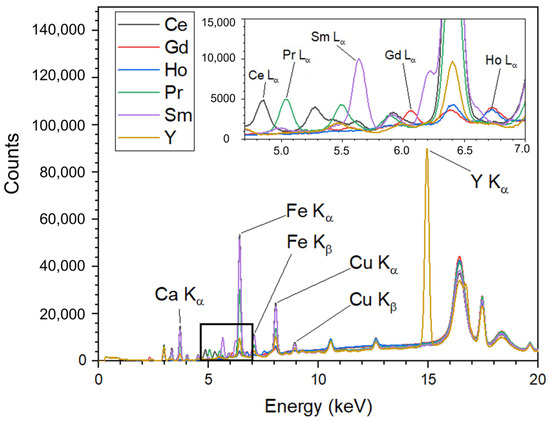
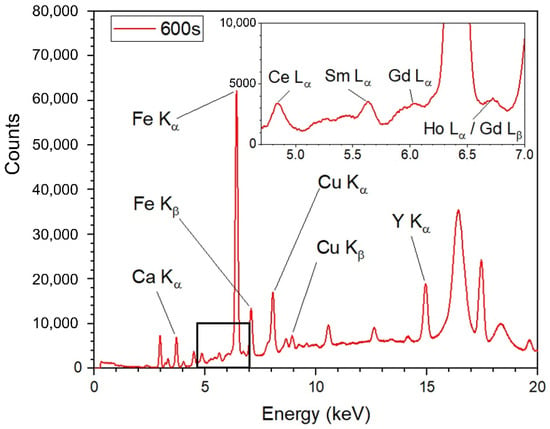
As mentioned in Section 2.2, the studies of the REE working samples with ore from the Nkana South Orebody deposit were performed using an XRF analyzer with a closer (“near”) geometry. The geometry of the X-ray tube–sample–detector elements had a significantly flatter reflection angle. For each sample, five spectrum measurements were performed, and the spectra averaged over the five measurements are shown in Figure 7 and Figure 8. In the upper part of Figure 7, the spectrum region from 4.0 to 7.0 keV is shown. It can be clearly seen that most L lines have the correct shape and are well suited for mathematical processing by the software due to the high energy resolution of the detector.
Figure 7.
Spectra of all single-element REE working samples prepared with ore from the Nkana South Orebody deposit.
Figure 8.
Spectrum of the mixed-element REE working sample prepared with ore from the Nkana South Orebody deposit, measured for 600 s.
Figure 8 also shows the spectrum region from 4.0 to 7.0 keV. Using the spectrum of the multi-element working sample, the detection limits, uncertainty, and sensitivity of REEs and trace elements in the ore were calculated in accordance with Formulas (1)–(3). The obtained values are presented in Table 6.
Table 6.
Detection limit, uncertainty, and sensitivity values for REE working samples prepared with ore from the Nkana South Orebody deposit.
Since the composition of the ore matrix was determined with low accuracy, it was not feasible to compensate for the spectral lines of Fe and Cu without major precision loss. For this reason, Gd was calculated from a separate sample without those elements. Pr was not available at the time of mixture measurement, and thus had to be measured and calculated independently.
As can be seen by comparing the data in Table 5 and Table 6, under near-geometry conditions, the detection limits are artificially improved by several times, even in the presence of a significantly larger number of interfering peaks from other elements. This is due to the 1 mm thickness of the samples. In this manner, light REEs provided detection limits from 3.40 to 57.2 ppm. Taking into account the trend of the graph in Figure 6, the detection limits of HMs under near-geometry conditions can be estimated in the range of 1–20 ppm.
While such a measurement setup does not reflect real conveyor belt conditions at mining enterprises, it is still applicable in practice. It is conceivable to direct a small fraction of the material onto a small secondary belt, where it may be measured as a thin layer before rejoining the main flow.
It should be noted that in Formulas (1) and (2), both Sb and Sp are proportional to the measurement duration. This means that the detection limit and uncertainty are proportional to the inverse square root of the measurement time and, therefore, arbitrarily low values can be achieved if sufficient measurement time is provided. Consequently, an obvious potential improvement in the analyzer should be increasing the detector count rate, which would allow achieving lower detection limits and uncertainties within the same measurement time. As noted in Section 2, the spectrometer used in this work is limited to 2000 counts/s over the entire detection range. However, technical solutions have now emerged for detectors with processing electronics capable of count rates up to 35000 counts/s [31]. Such a solution would reduce the detection limits of the registered elements by an additional factor of 4.
3.3. Results of Quantitative Analysis
The quantitative analysis of heavy REEs was tested using a different set of working samples, as is presented in Table 7. These samples were prepared using the same powder ore from the Nkana South Orebody deposit. As with the sample set from Section 2.1, a single 60–70 g batch was prepared for every composition and concentration.
Table 7.
Sets of working samples used for quantitative testing. The analytes in the samples are Gd (chemical form: Gd2O3, purity ≥ 99.95%), Ho (chemical form: Ho2O3, purity ≥ 99.95%), and Tm (chemical form: Tm2O3, purity ≥ 99.95%).
There is an overlap between the Lα line of Tm (7.2 keV) and the Kβ line of Fe (7.1 keV), which required an alternative line to be used. While the chosen Lβ1 line of Tm (8.1 keV) also has overlap with the Kα line of Cu (8.0 keV), it is significantly easier to isolate using subtraction deconvolution [33].
These combinations of elements and the matrix were chosen for several reasons. Firstly, heavy REEs present the main economic and strategic value of REE reserves [7] and are in the highest demand. Secondly, deposits rich in heavy REEs are most often associated with minor inclusions in silicate-based minerals [39], which is also the nature of the Fe/Cu ore matrix used in these tests.
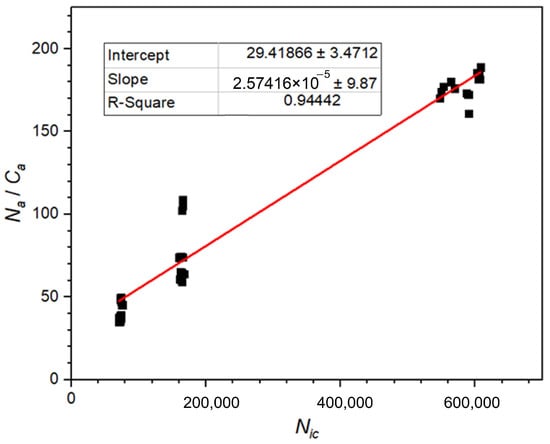
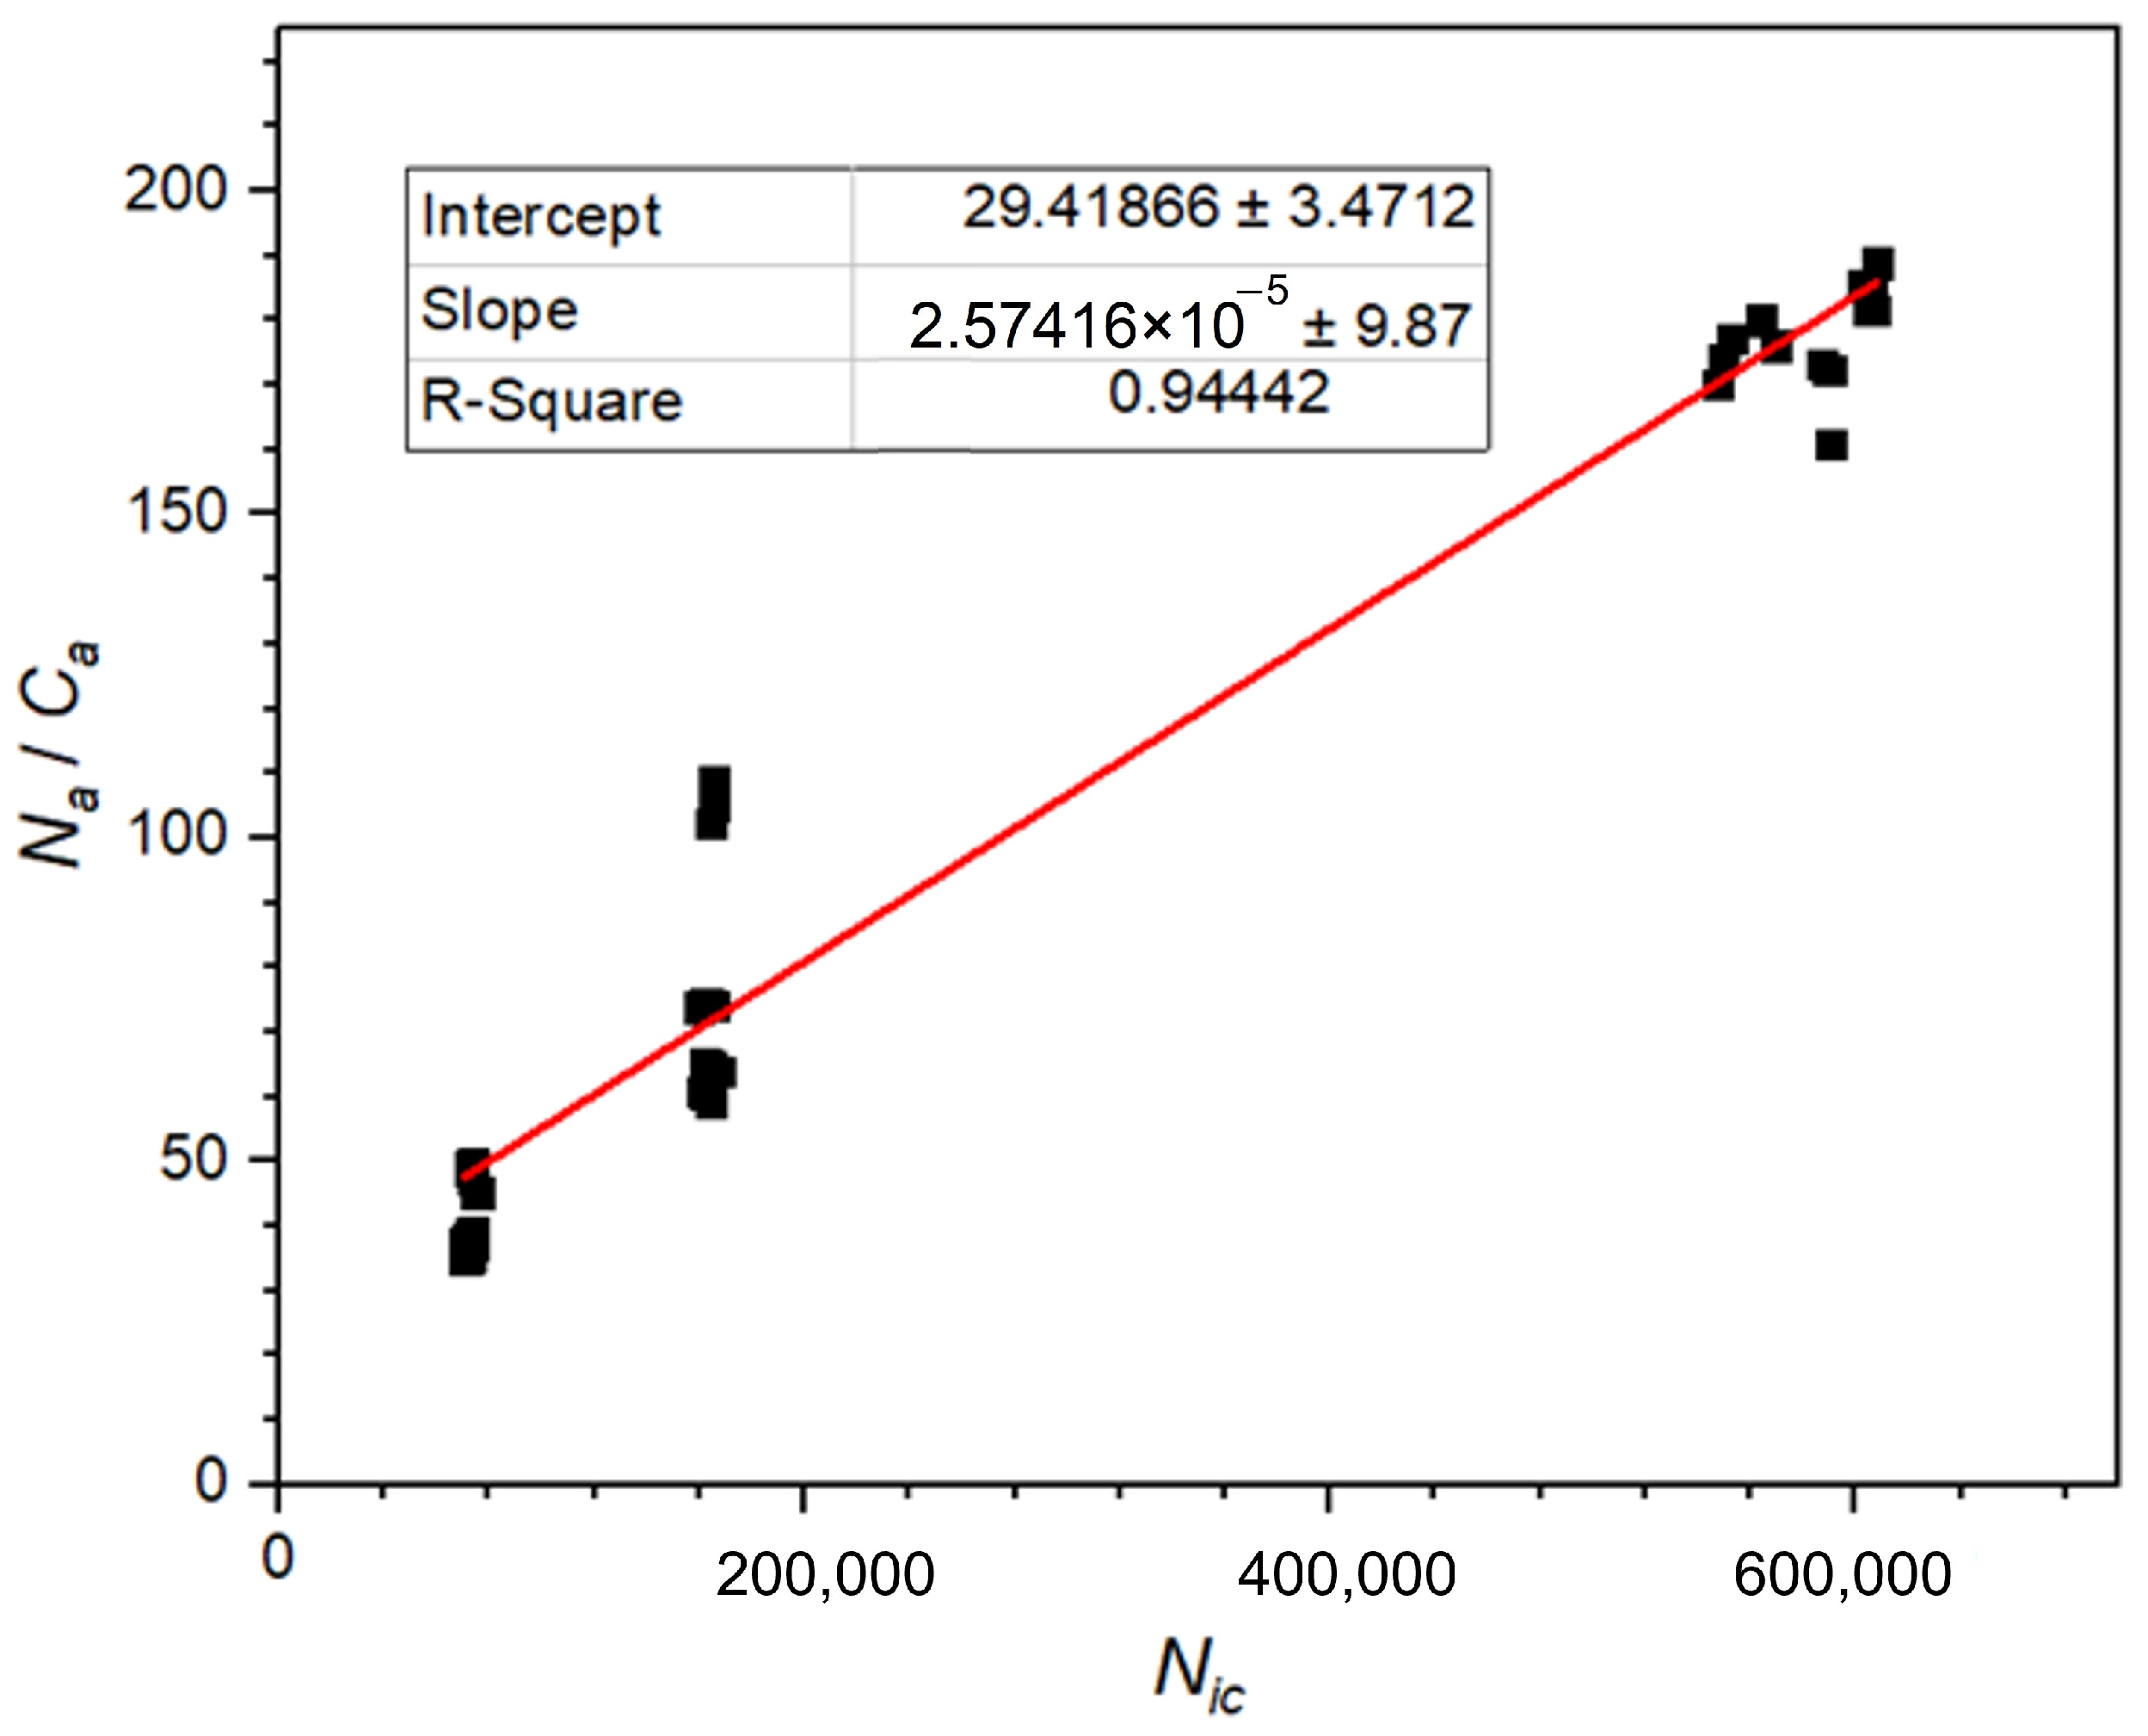
As was indicated at the end of Section 2.3, several measurements were carried out in order to verify the linear relationship between the ratio Na/Ca and Nic. The plot of these quantities is presented in Figure 9.
Figure 9.
Plot of the ratio of Na/Ca and Nic obtained from the spectra of working samples containing Tm in different matrices and different concentrations, with linear regression in red.
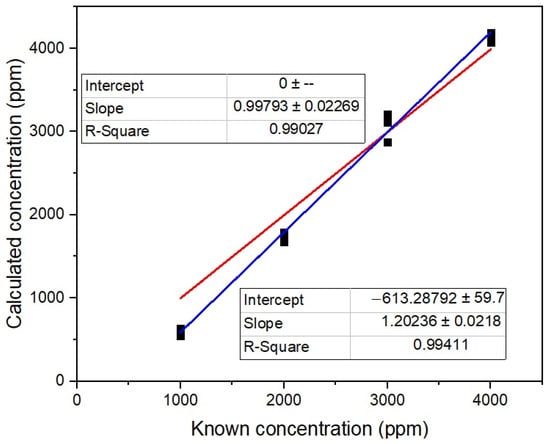
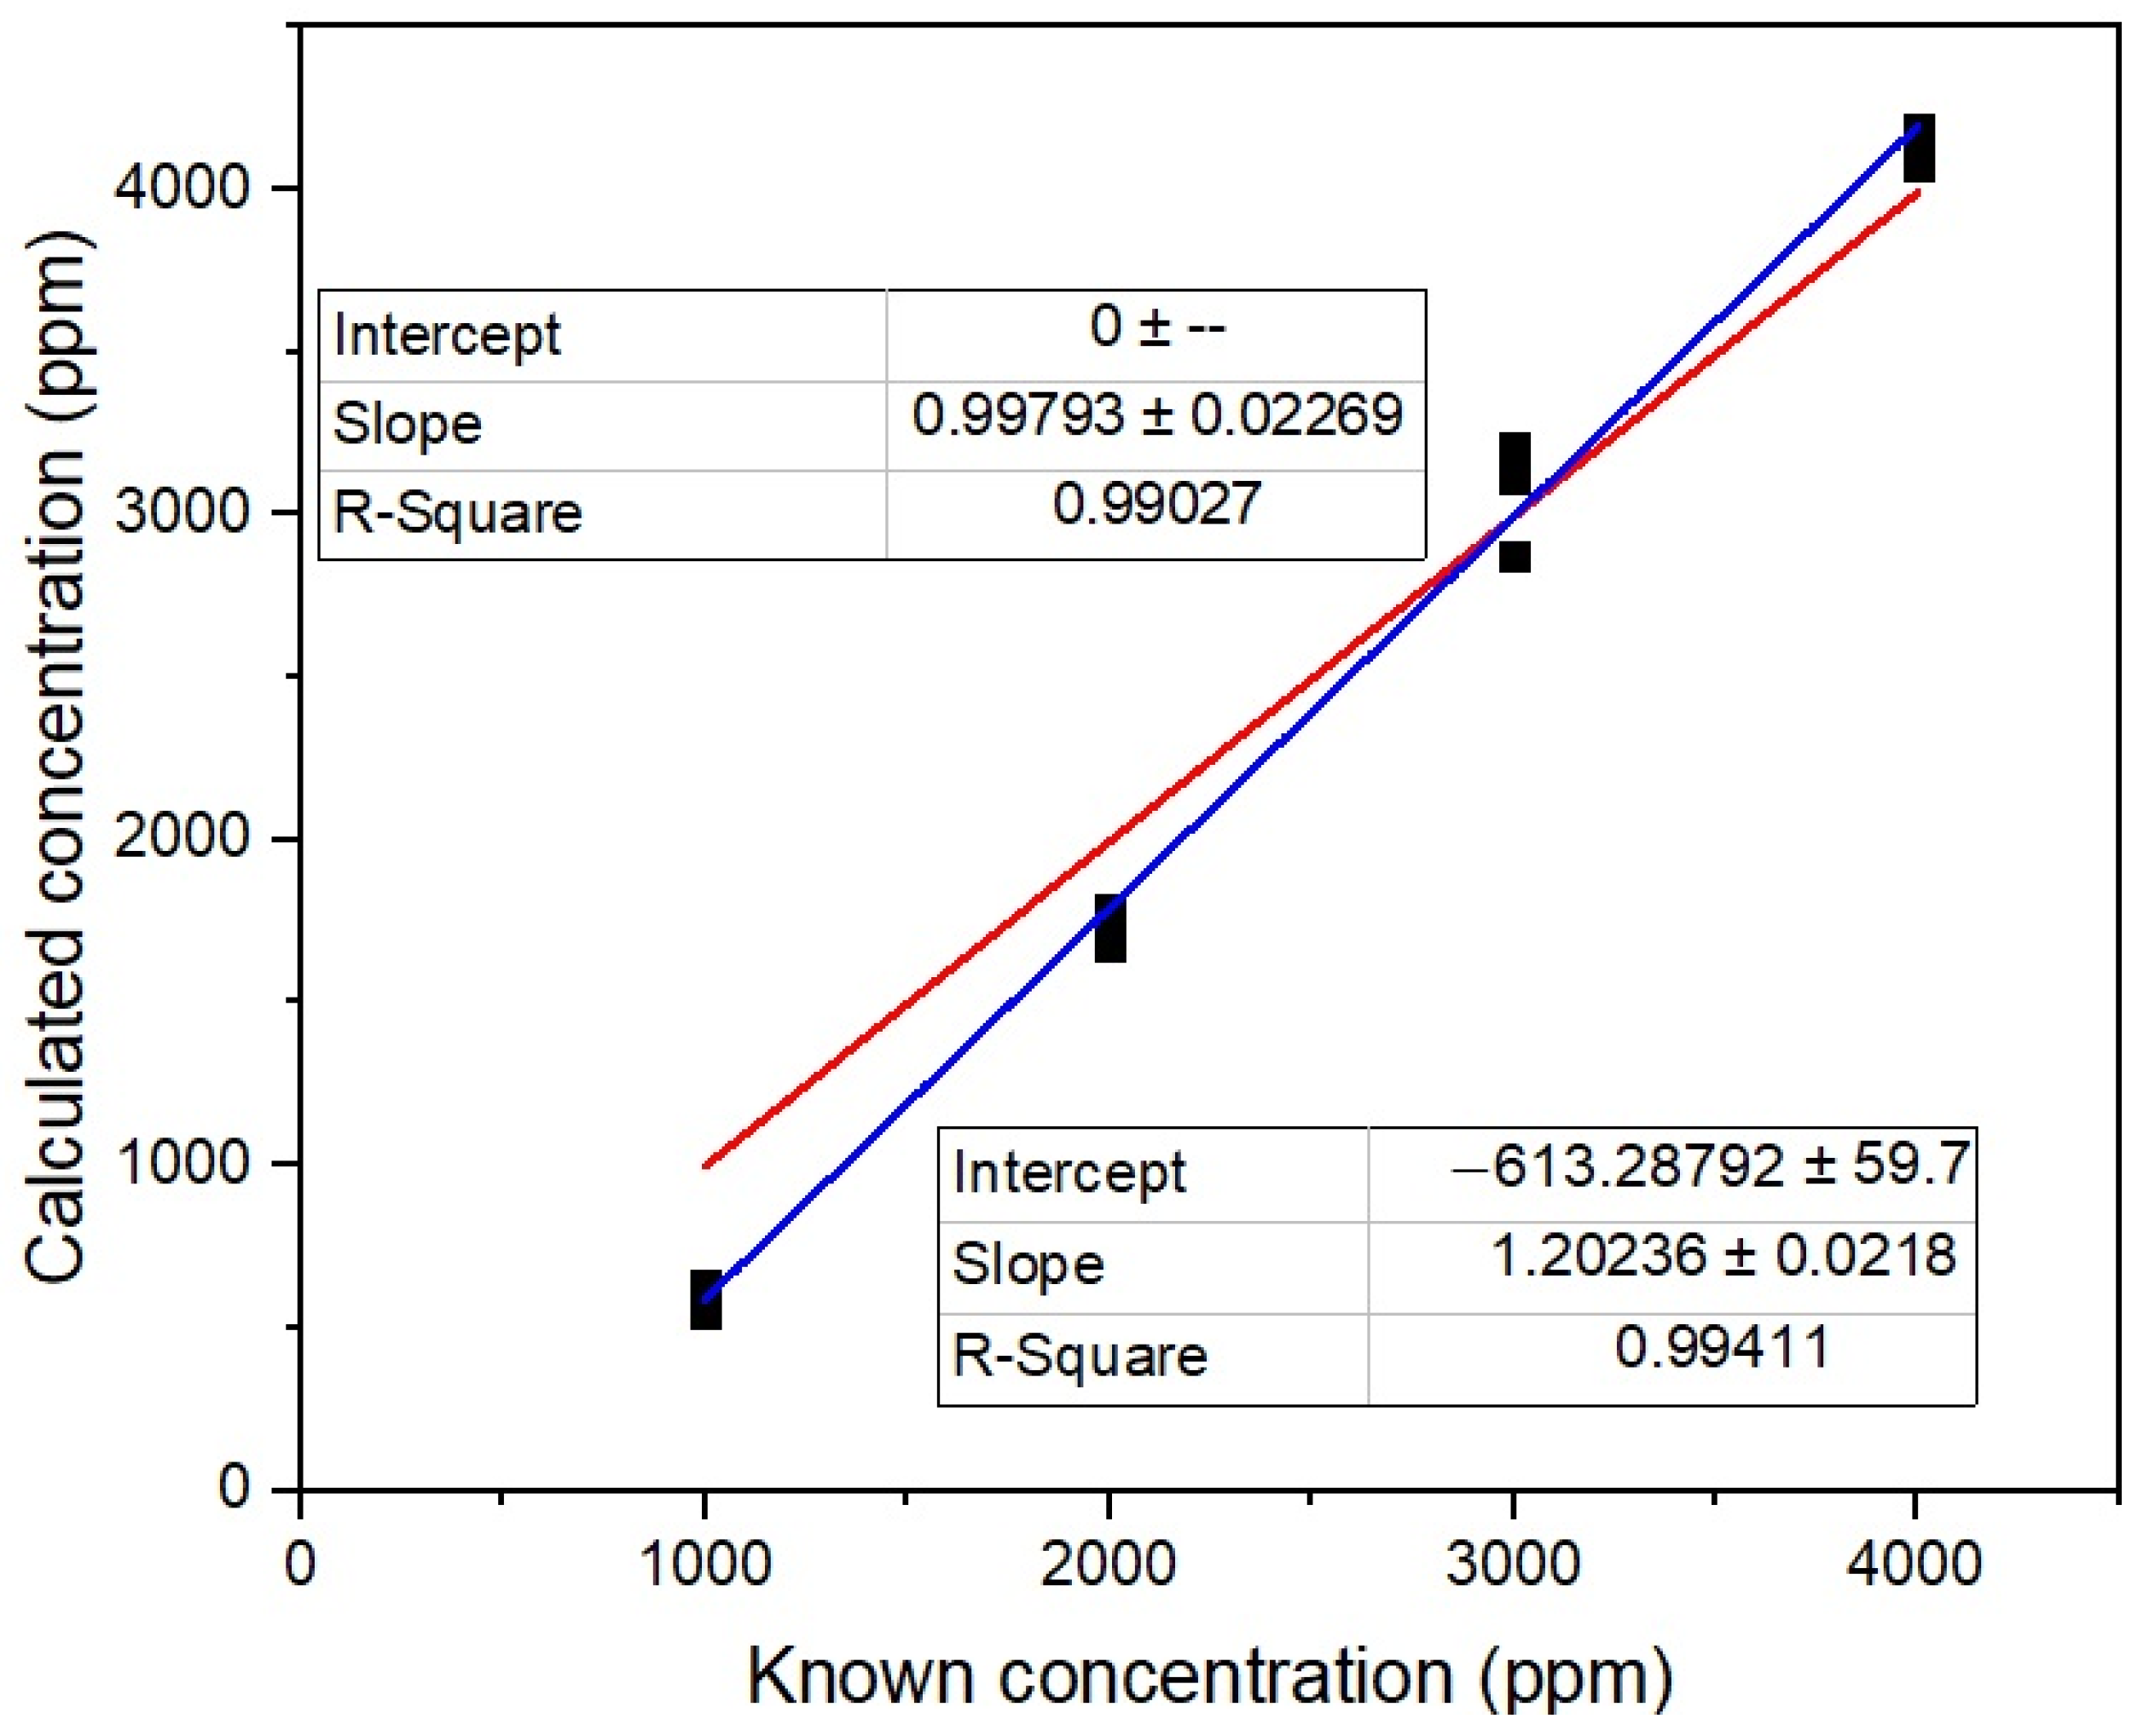
The presented plot confirms the assumptions of Section 2.4. While there is a linear relationship between Nic and Na/Ca, they are not directly proportional. N0 was introduced according to the condition that Na/Ca must be directly proportional to Nic + N0. In this way, the value of N0 is 1.1 × 10⁶. However, this is not sufficient to accurately predict known concentrations. A dependence obtained for Ho using Equation (10) together with an arbitrary value of S is shown in Figure 10.
Figure 10.
Plot of Ho concentration calculated with Equation (1) over its true value. S was chosen in such a way that the linear regression with intercept 0 (red) has a slope of 1. Also shown is the linear regression without a forced intercept (blue).
It can be clearly seen that a model of direct proportionality is insufficient. For this reason, a constant correction factor K was introduced to Equation (10):
The inclusion of this parameter resolves the above inconsistency, as shown in Figure 11.
Figure 11.
Plot of Ho concentration calculated with Equation (11) against its true value. The values of S and K to achieve a slope close to 1 and an intercept close to 0 were found numerically.
The same analysis was performed on samples with Gd and Tm. For the sample containing thulium, a simple subtraction deconvolution [33] was performed on the Lβ1 line to account for its overlap with the Kα line of copper. The plots are presented in Figure 12 and Figure 13.
Figure 12.
Plot of Gd concentration calculated with Equation (11) against its true value. The values of S and K to achieve a slope close to 1 and an intercept close to 0 were found numerically.
Figure 13.
Plot of Tm concentration calculated with Equation (11) against its true value. The values of S and K to achieve a slope close to 1 and an intercept close to 0 were found numerically.
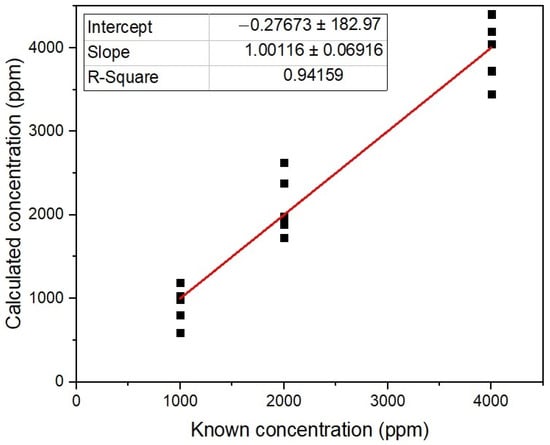
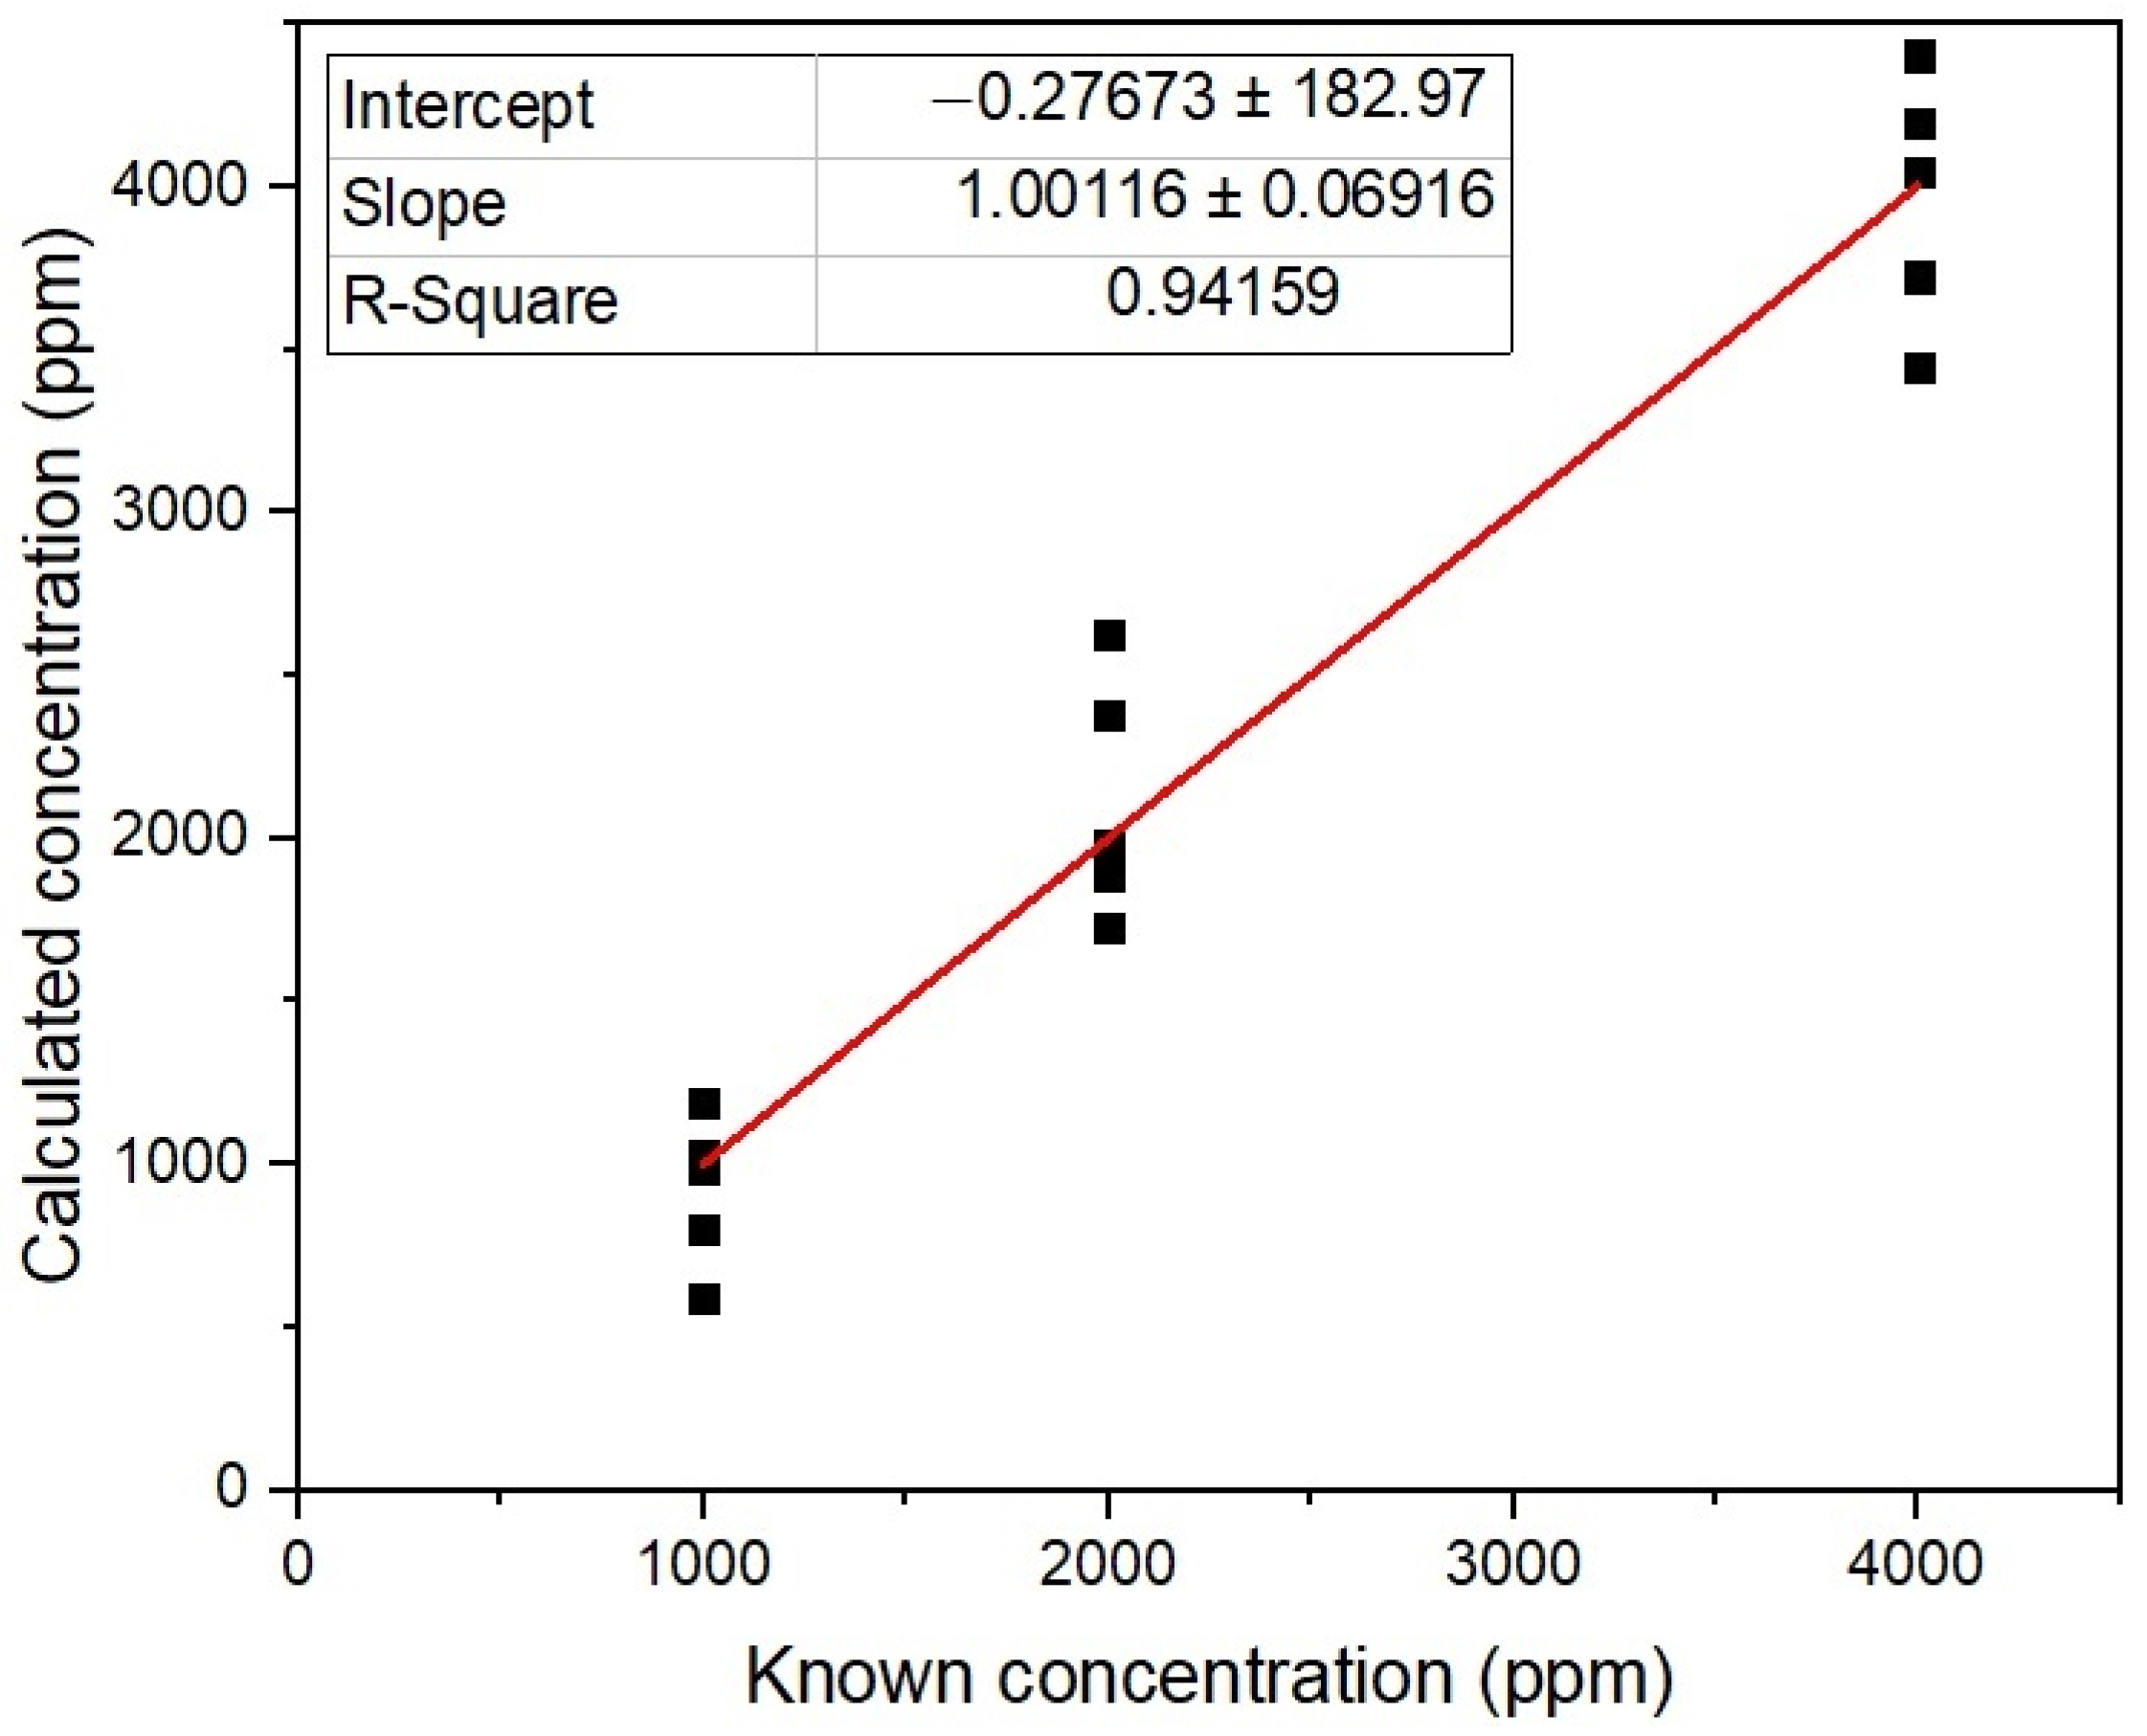
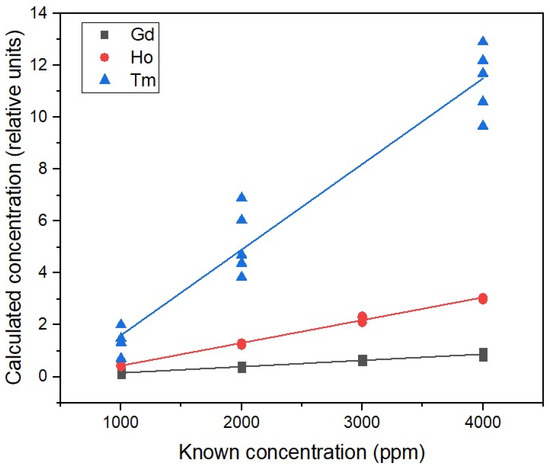
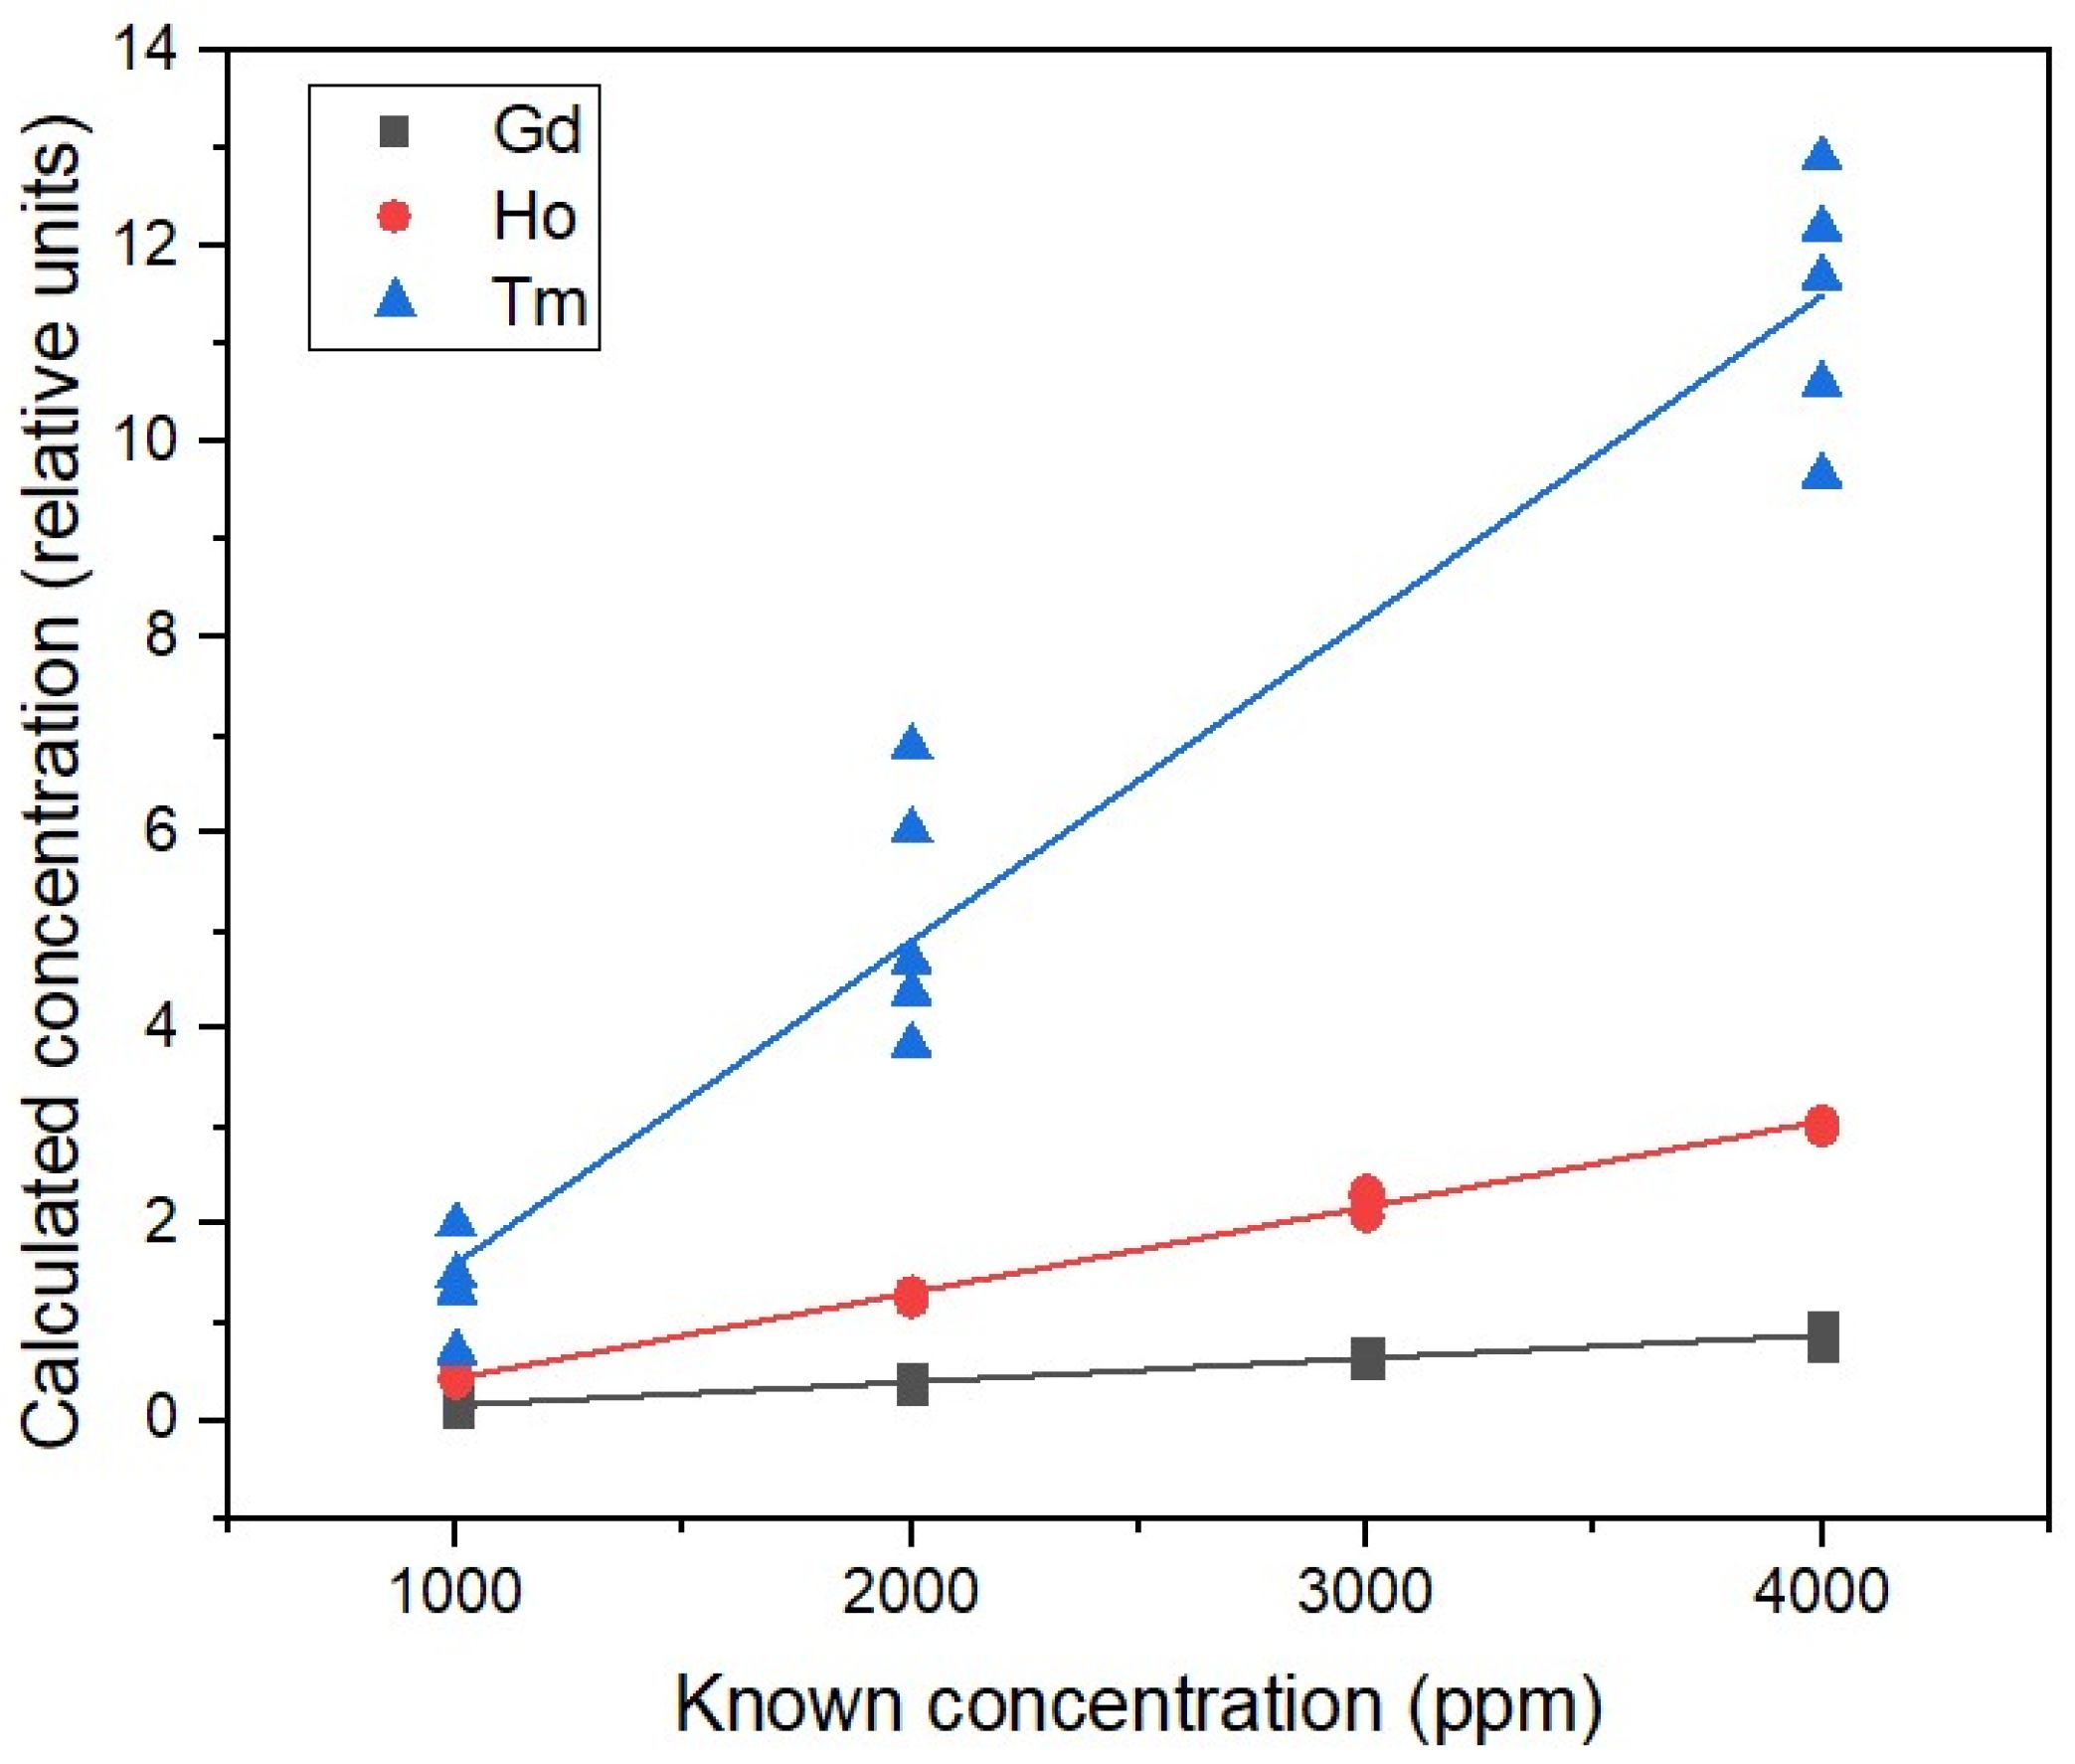
It must be noted that the S and K values used in Figure 11, Figure 12 and Figure 13 differ significantly between the samples despite having minimal differences in the matrix. Figure 14 shows the result of applying the same values of S and K to all measurements.
Based on Figure 14, it is clear that the coefficients in Equation 11 must be calibrated with reference (or standard whenever possible) samples independently for each measured element. On the other hand, the high linearity of the method only makes it necessary to create reference samples of two different concentrations.
3.4. Results of Automatic Measurements
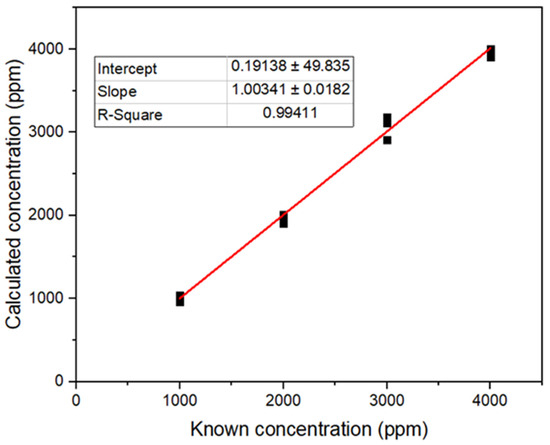
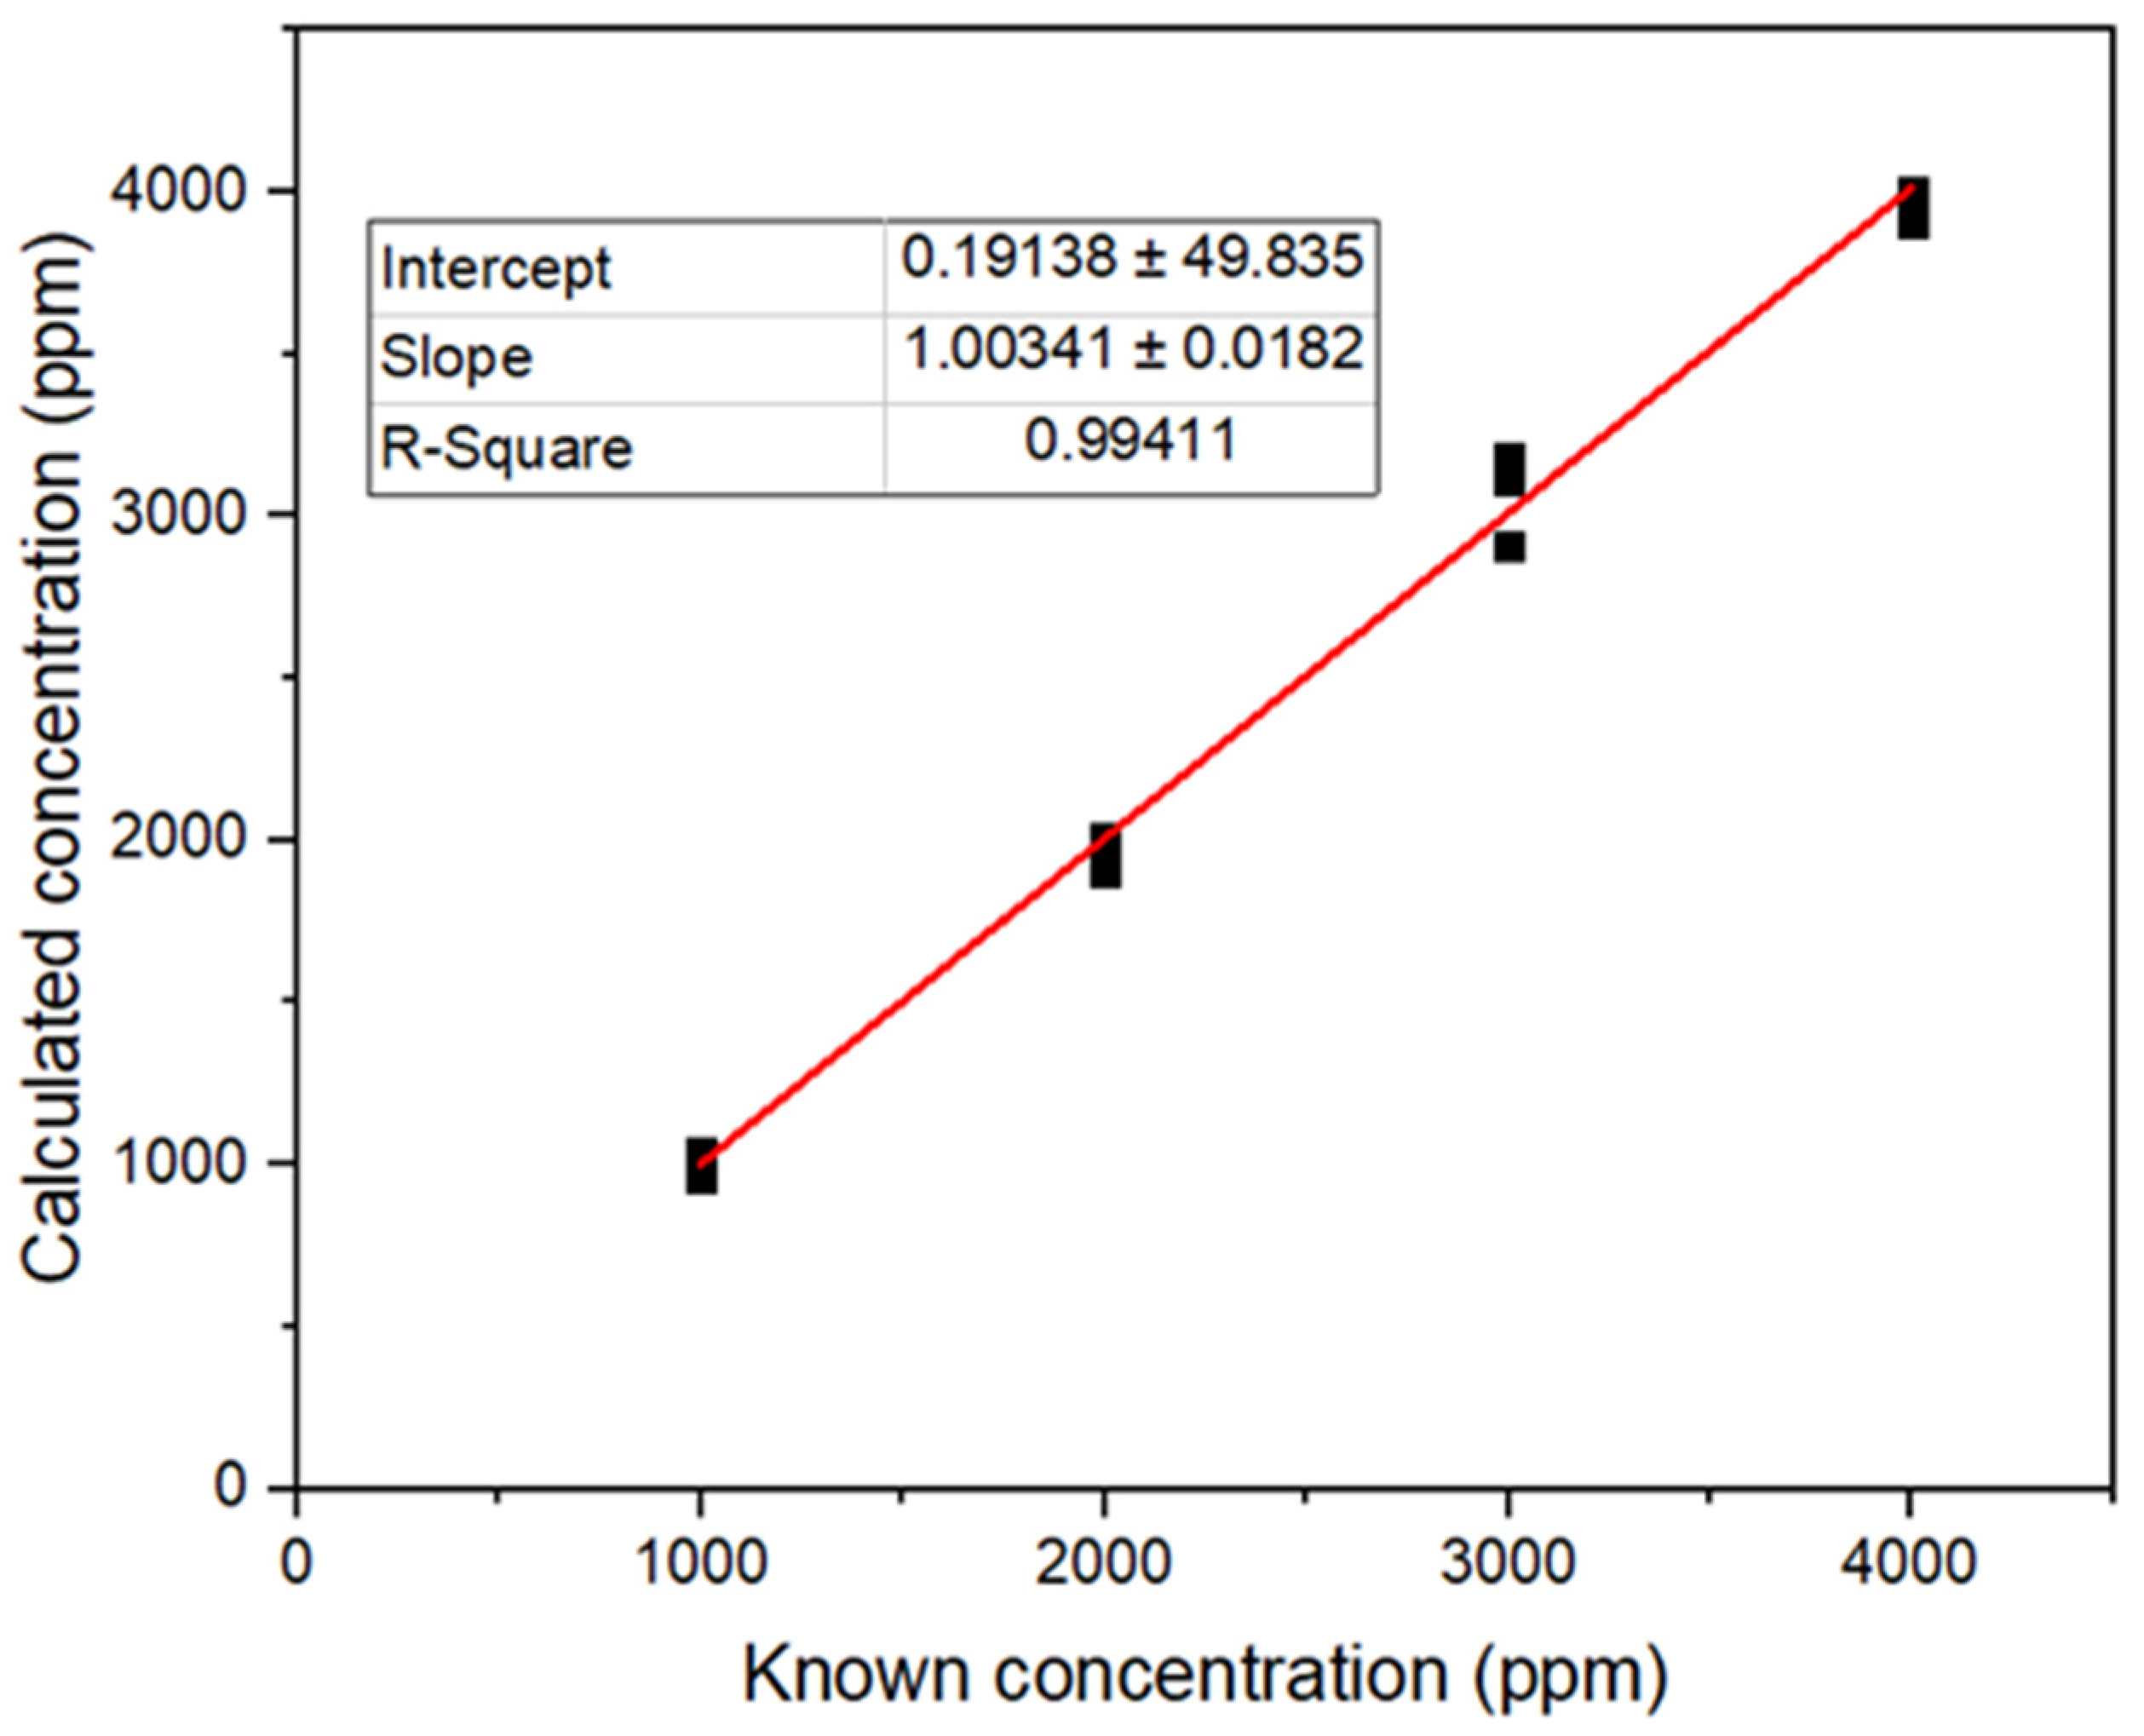
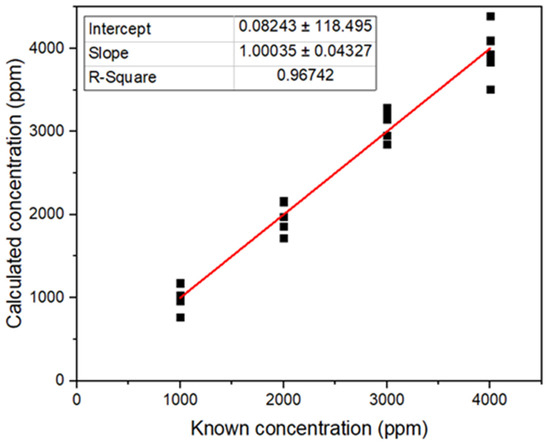
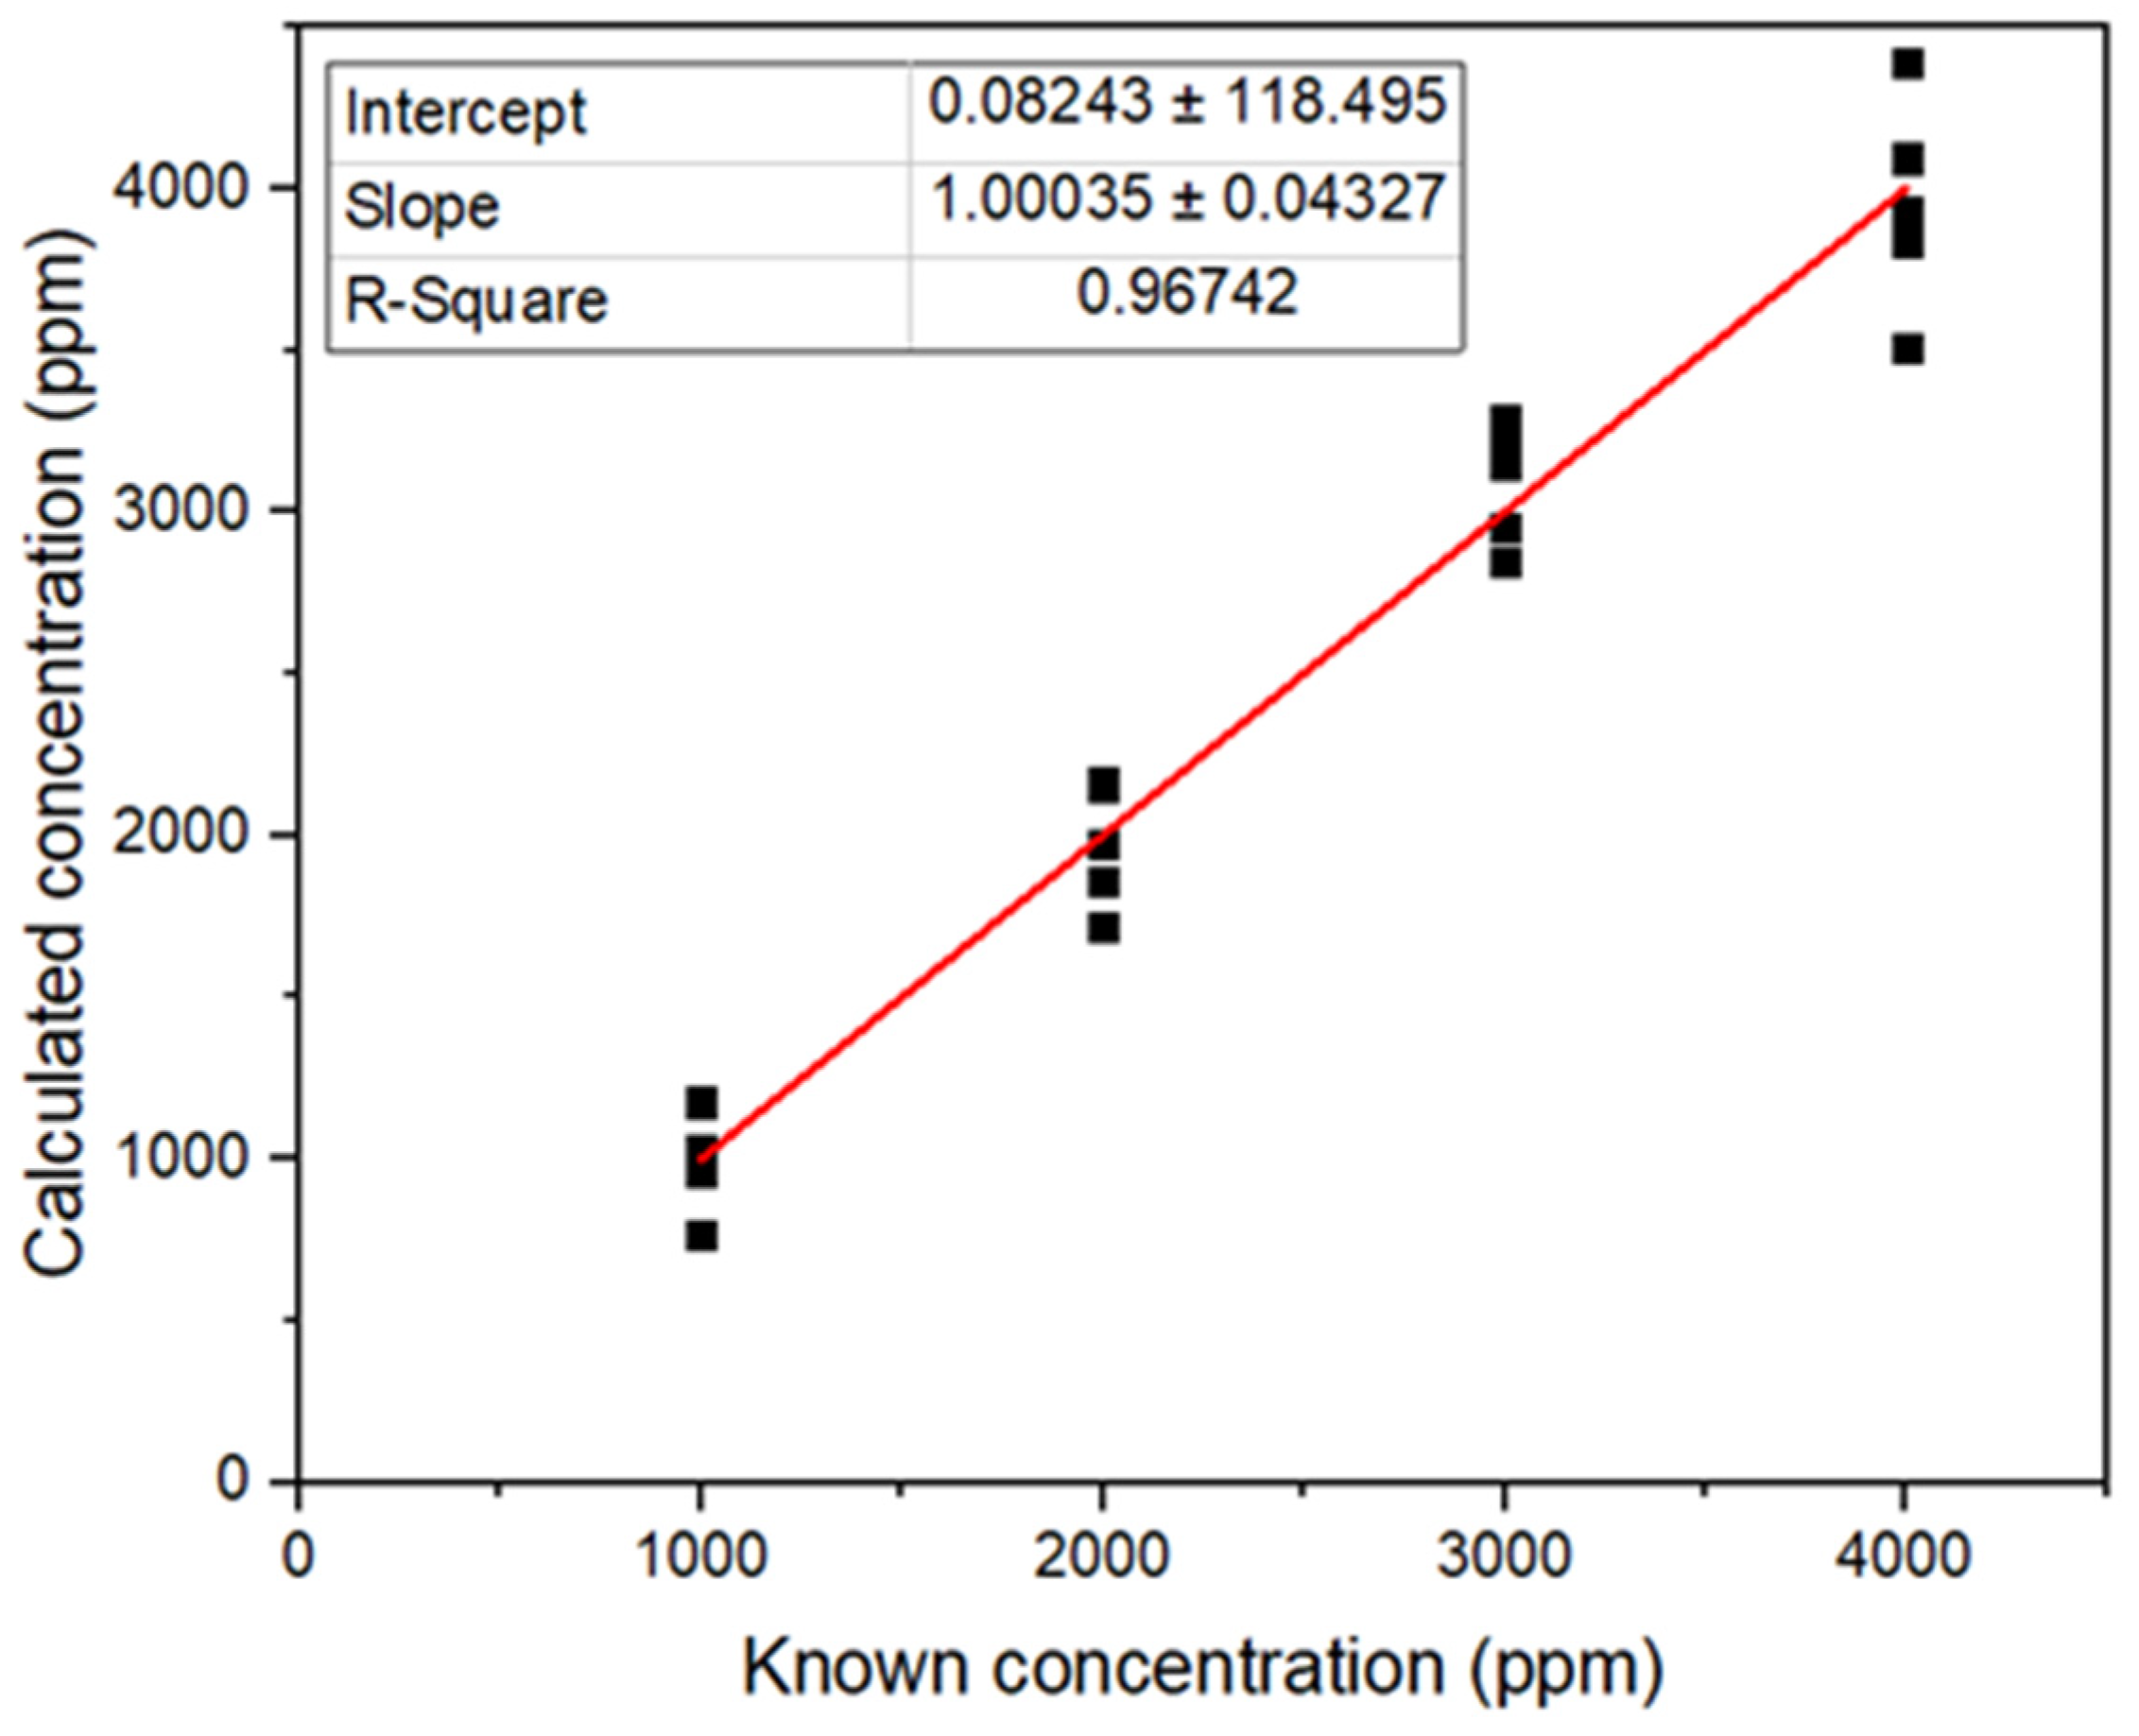
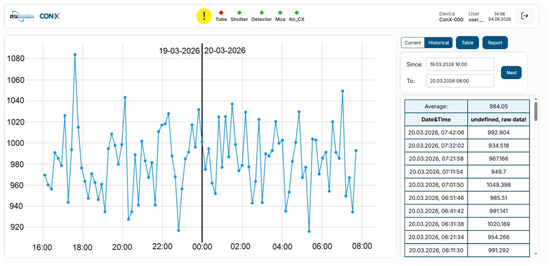
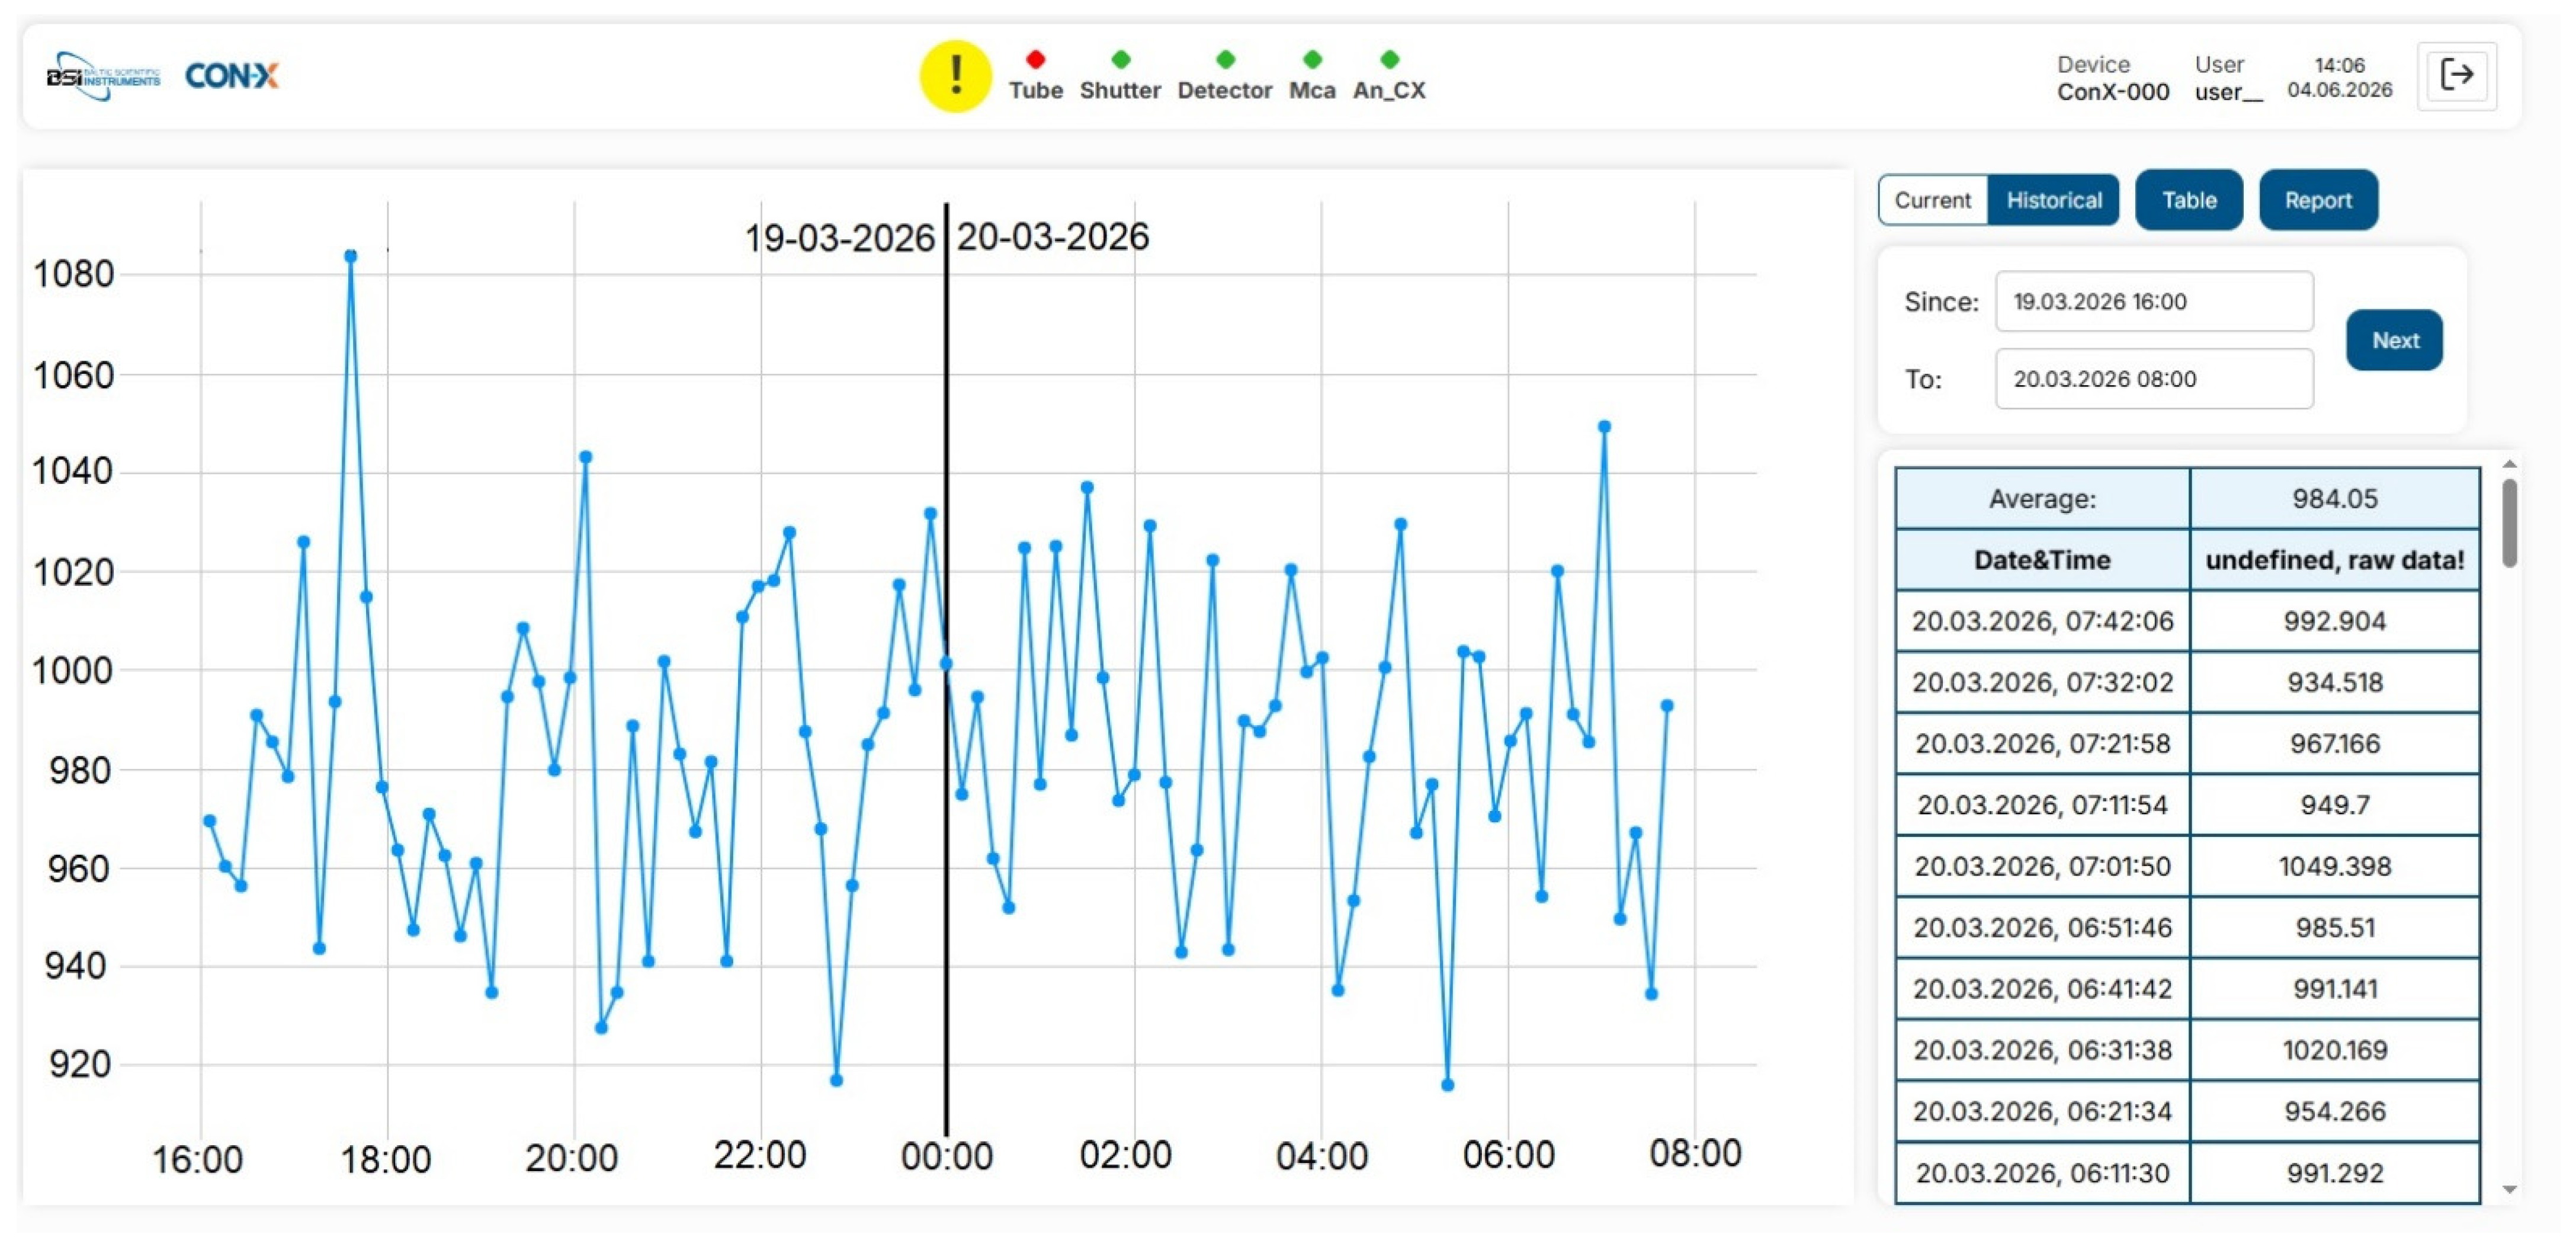
Automatic measurements were carried out to simulate real-life measurements and test the accuracy of the method described in the previous section once implemented in the software that controls the online analyzer. Calibration of the method was performed using reference samples of ore with Ho concentrations of 2000 ppm and 4000 ppm. A working sample of ore with a Ho concentration of 1000 ppm was measured during 3, 5, and 10 min. This means that every 3 min, we obtained a spectrum and the concentration of Ho in the ore analyzed. The same applies to the automatic measurements at 5 and 10 min. Figure 15 shows the trends of the automatic measurements of 5 min of Ho.
Figure 15.
Appearance of the interface for the operator showing the trends of the concentration of Ho computed from repeated measurements with a duration of 5 min. This figure is simply to show the image of the results as would be seen by the operator.
The results of 10 of the automatic measurements at the specified times of measurement are presented in Table 8. As can be seen, the results show that at 5 and 10 min we can obtain accurate results, with relative error <10%. The average concentration of Ho from 30 automatic 5 min measurements was 1000.8 ± 39.1 ppm. For 94 automatic 10 min measurements, the average was 984.1 ± 31.4 ppm.
Table 8.
The results of the Ho concentration analysis computed with the developed method using automatic measurements. The known concentration of the measured sample was 1000 ppm. The method was tested using measurement times of 3, 5, and 10 min. N is the number of measurements performed.
An equivalent calibration and measurement procedure was performed using samples of Hg. The results of 10 automatic 5 min measurements for ore containing Hg are presented in Table 9. The average concentration of Hg from 25 automatic 5 min measurements was 1015.8 ± 52.6 ppm.
Table 9.
The results of the Hg concentration analysis computed with the developed method using automatic measurements. The known concentration of the measured sample was 1000 ppm. The method was tested using a measurement time of 5 min. N is the number of measurements performed.
These results show that the method is stable and produces accurate results of concentration. Additionally, the method demonstrates good predictive power, as the measured samples had different concentrations than the calibration samples.
4. Conclusions
The CON-X online X-ray fluorescence analyzer was used for the methodological exploration of the analysis of REEs and HMs based on the L lines of the elements. Only for Y was it possible to analyze the Kα-line. The XRF spectra recorded an energy range from about 1.4 to 20 keV. Thus, the analyzer gives the possibility to analyze REEs and HMs simultaneously.
A method of analysis was developed and experimentally tested for determining REEs and HMs. The method is based on a simple approach that was implemented and used together with the industrial X-ray fluorescence analyzer CON-X. Special data-processing algorithms account for low concentrations of rare earth elements and heavy metals and strong matrix effects.
Experimental studies carried out using specially prepared working and reference (Th and U) calibration samples showed that under standard measurement geometry and conditions of bulk sample analysis, detection limits of approximately 20–100 ppm for rare earth elements and 10–140 ppm for heavy metals can be achieved within a measurement time of 600 s. These values indicate that the online XRF analyzer has a promising potential for monitoring technological processes in different areas of the mining industry.
It was shown that a significant improvement in analytical performance is achieved when using thin material layers and optimized measurement geometry as close as possible to finely dispersed ore on a conveyor belt. In this manner, the detection limits for several REEs were improved to the range of 3–20 ppm. The observed improvement is mainly explained by reduced absorption of fluorescent radiation within the sample and increased detected photon flux. Even though the conditions employed in this study are unrealistic, they may serve as an approximation of the state of ore during and after the beneficiation process.
The test of the method for quantitative analysis of REEs and HMs shows that high accuracy and stability can be reached for the measurement of individual elements, with concentrations in the range of 1000–4000 ppm. However, it is still necessary to calibrate the system for individual elements.
The approach followed in this study can be refined as a further step using standard samples of rare earth elements and heavy metals tested along with real samples containing the REEs and HMs studied.
The results obtained in this study show that the application of the CON-X to online XRF analysis can provide reliable detection of REEs and HMs at the ppm level under real industrial conditions. The developed method expands the potential applications of online X-ray fluorescence analysis for real-time monitoring and process control in the mining and mineral processing industry. Future studies can be carried out with the use of both certified reference materials and samples of real REE-bearing material. Additionally, studies could be performed on materials with multiple elements of interest for a better understanding of their effects on the detection limits of other elements.
Author Contributions
Conceptualization, U.M.O., V.K. and V.G.; methodology, P.K.; validation, U.M.O. and A.S.; formal analysis, U.M.O., P.K. and V.K.; investigation, U.M.O., P.K. and V.K.; resources, V.G.; data curation, P.K. and V.K.; writing—original draft preparation, U.M.O.; writing—review and editing, U.M.O., P.K., A.S. and V.G.; supervision, U.M.O., V.K. and V.G.; project administration, A.S. and V.G.; funding acquisition, A.S. and V.G. All authors have read and agreed to the published version of the manuscript.
Funding
The presented results were obtained within the framework of the “Research and development of an X-ray fluorescence analyzer for rare earths and heavy metals” research project, No. P1, supported by the European Regional Development Fund (project No. 1.2.1.2.i.2/1/24/A/CFLA/003 between the “Energy and Transport Competence Center” (http://etkc.lv/) and the “Central Finance and Contracting Agency of Latvia” (http://www.cfla.gov.lv/lv/)). The authors express their gratitude to these organizations for their support of the research and development of this study.
Data Availability Statement
The data presented in this study are available upon request from the corresponding author in compliance with the restrictions of the industrial customers.
Conflicts of Interest
All authors are employed by the company Baltic Scientific Instruments. The remaining authors declare that the research was conducted in the absence of any commercial or financial relationships that could be construed as a potential conflict of interest.
Abbreviations
The following abbreviations are used in this manuscript:
| XRF | X-Ray Fluorescence |
| REEs | Rare Earth Elements |
| HMs | Heavy Metals |
| WDX | Wavelength-dispersive XRF |
| EDX | Energy-dispersive XRF |
References
- Voncken, J.H.L. The Rare Earth Elements: An Introduction; Springer: Cham, Switzerland, 2016. [Google Scholar] [CrossRef] [Scilit]
- Murty, Y.V.; Alvin, M.A.; Lifton, J.P. Rare Earth Metals and Minerals Industries; Springer: Cham, Switzerland, 2023. [Google Scholar] [CrossRef] [Scilit]
- Spellman, F.R. The Science of Rare Earth Elements: Concepts and Applications; CRC Press: Boca Raton, FL, USA, 2023. [Google Scholar]
- Taylor, S.R.; McLennan, S.M. The Continental Crust: Its Composition and Evolution; Blackwell: Oxford, UK, 1985. [Google Scholar]
- Wederpohl, K.H. The Composition of the Upper Earth’s Crust and the Natural Cycles of Selected Metals. Metals in Natural Raw Materials. Natural Resources. In Metals in and Their Compounds in the Environment—Occurrence, Analysis and Biological Relevance; Merian, E., Ed.; VCH: Weinheim, Germany, 1991; pp. 3–17. [Google Scholar]
- Martin, R.B. Bioinorganic Chemistry of Toxicity. In Handbook on Toxicity of Inorganic Compounds; Seiler, H.G., Sigel, H., Sigel, A., Eds.; Marcel Dekker: New York, NY, USA, 1988; pp. 9–25. [Google Scholar]
- Whiten, B. Calculation of mineral composition from chemical assays. Miner. Process. Extr. Metall. Rev. 2007, 29, 83–97. [Google Scholar] [CrossRef] [Scilit]
- Coomber, D.I. Separation Methods for Inorganic Species. In Radiochemical Methods in Analysis; Coomber, D.I., Ed.; Springer: New York, NY, USA, 1975; pp. 175–218. [Google Scholar]
- Meher, A.K.; Zarouri, A. Green Analytical Chemistry—Recent Innovations. Analytica 2025, 6, 10. [Google Scholar] [CrossRef] [Scilit]
- Beckhoff, B.; Kanngießer, B.; Langhoff, N.; Wedell, R.; Wolff, H. Handbook of Practical X-Ray Fluorescence Analysis; Springer: Heidelberg, Germany, 2006. [Google Scholar]
- Van Grieken, R. Considering the Role of X-ray Spectrometry in Chemical Analysis and Outlining the Volume. In X-Ray Spectrometry: Recent Technological Advances; Tsuji, K., Injuk, J., van Grieken, R., Eds.; John Wiley & Sons: Sussex, UK, 2004; pp. 1–11. [Google Scholar]
- IAEA. Neutron Generators for Analytical Purposes, IAEA Radiation Technology Reports No. 1. 2012. Available online: https://www.iaea.org/publications/8505/neutron-generators-for-analytical-purposes (accessed on 27 February 2026).
- Sokolov, A.; Gostilo, V.; Demsky, M.; Hasikova, E. Performance optimization of an industrial gamma activation assay system for analysing gold and rare metal ores. J. S. Afr. Inst. Min. Metall. 2019, 119, 509–513. [Google Scholar] [CrossRef] [Scilit]
- XPRT-XRF Analyzers. XRF Analyzer Suppliers & Manufacturers. Available online: https://www.environmental-expert.com/companies/keyword-xrf-analyzer-67312 (accessed on 30 January 2026).
- Yamasaki, S.I.; Yamagishi, H.; Tsuchiya, N. Major element analysis of geological samples with wavelength Dispersive X-ray Fluorescence (WDXRF) spectrometry using glass disks and pressed powder pellets. Sustain. Environ. 2023, 9, 2251805. [Google Scholar] [CrossRef] [Scilit]
- Goldstein, J.I.; Newbury, D.E.; Echlin, P.; Joy, D.C.; Lyman, C.E.; Lifshin, E.; Sawyer, L.; Michael, J.R. Scanning Electron Microscopy and X-Ray Microanalysis; Springer: New York, NY, USA, 2003. [Google Scholar]
- Sokolov, A.; Kuzmovs, V.; Miranda Ordóñez, U.; Gostilo, V. Online XRF analysis of elements in minerals on a conveyor belt. Mining 2025, 5, 77. [Google Scholar] [CrossRef] [Scilit]
- Sokolov, A.; Letko, E.; Kuzmovs, V.; Miranda Ordonez, U.; Gostilo, V. Online XRF analysis of industrial sand impurities on a conveyor belt. Asp. Min. Miner. Sci. 2025, 13, 000809. [Google Scholar] [CrossRef] [Scilit]
- Volkov, A.; Alov, V. Automated systems for determining the chemical composition of bulk and bulk materials on the conveyor (review). Probl. Ferr. Metall. Mater. Sci. 2011, 75–88. Available online: https://www.chermet.net/upload/iblock/52b/52bde508bdd302de91b4ce67c89dfc4c.pdf (accessed on 4 March 2026).
- Kurniawati, S.; Santoso, M.; Lestiani, D.D.; Adventini, N.; Syahfitri, W.Y.N. Analytical capabilities of EDXRF for determination of rare earth elements. J. Sains Dan Teknol. Nukl. Indones. 2021, 22, 1–6. [Google Scholar] [CrossRef] [Scilit]
- Schmidt, F.; Cornejo-Ponce, L.; Bueno, M.I.M.S.; Poppi, R.J. Determination of some rare earth elements by EDXRF and artificial neural networks. X-Ray Spectrom. 2003, 32, 423–427. [Google Scholar] [CrossRef] [Scilit]
- Sabouang, J.F.; Ateba, J.F.B.; Shouop, C.J.G.; Maya, J.; Kamkumo, C.T.; Mohamadou, L.L.; Simo, A. Accuracy and precision of energy dispersive X-ray fluorescence (EDXRF) analysis of trace and major elements in rock standard reference materials using fine powder. J. Geosci. Environ. Prot. 2023, 11, 83–95. [Google Scholar] [CrossRef]
- González-Fernández, Ó.; Queralt, I.; Carvalho, M.L.; García, G. Elemental Analysis of Mining Wastes by Energy Dispersive X-ray Fluorescence (EDXRF). Nucl. Instr. Meth. Phys. Res. B 2007, 262, 81–86. [Google Scholar] [CrossRef] [Scilit]
- Kuhn, K.; Meima, J.A.; Rammlmair, D.; Ohlendorf, C. Chemical mapping of mine waste drill cores with laser-induced breakdown spectroscopy (LIBS) and energy dispersive X-ray fluorescence (EDXRF) for mineral resource exploration. J. Geochem. Explor. 2016, 161, 72–84. [Google Scholar] [CrossRef] [Scilit]
- da Silva, P.R.B.; Dalla Nora, F.E.; de Castro, R.J.; Wastowski, A.D.; Mauad, F.F. The environmental quality of sediments of rivers near prospection areas of semiprecious rocks. Environ. Monit. Assess. 2019, 191, 364. [Google Scholar] [CrossRef] [Scilit]
- Baltic Scientific Instruments. On-Line XRF Conveyor Analyzer CON-X. Available online: https://bsi.lv/en/products/ndt-analyzers/-line-xrf-conveyor-analyzer-con-x/ (accessed on 30 January 2026).
- Kondratjevs, V.; Landmans, K.; Sokolovs, A.; Gostilo, V. Performance improvement of on-line XRF analysis of minerals on a conveyor belt. J. Min. Sci. 2020, 56, 1061–1066. [Google Scholar] [CrossRef] [Scilit]
- IAEA. IAEA-RGU-1 Reference Material. Available online: https://analytical-reference-materials.iaea.org/iaea-rgu-1 (accessed on 30 January 2026).
- IAEA. IAEA-RGTh-1 Reference Material. Available online: https://analytical-reference-materials.iaea.org/iaea-rgth-1 (accessed on 30 January 2026).
- Brems, D.; Muchez, P.; Sikazwe, O.; Mukumba, W. Metallogenesis of the Nkana copper–cobalt South Orebody, Zambia. J. Afr. Ear. Sci. 2009, 55, 185–196. [Google Scholar] [CrossRef] [Scilit]
- Ketek. Creative Detector Solutions. Available online: https://www.ketek.net (accessed on 30 January 2026).
- Bertin, E.P. Principles and Practice of X-Ray Spectrometric Analysis; Plenum Press: New York, NY, USA, 1975. [Google Scholar]
- Kapitulskis, P.; Miranda Ordóñez, U.; Sokolov, A. Enhancement of the analytical capabilities in online XRF analysis of multi-element ores. Min. Eng. 2026, 238, 110055. [Google Scholar] [CrossRef] [Scilit]
- Mayerhöfer, T.G.; Pahlow, S.; Popp, J. The Bouguer-Beer-Lambert Law: Shining Light on the Obscure. ChemPhysChem 2020, 21, 2029–2046. [Google Scholar] [CrossRef] [Scilit] [PubMed]
- Reynolds, R.C. Matrix corrections in trace element analysis by X-ray fluorescence: Estimation of the mass absorption coefficient by Compton scattering. Am. Mineral. 1963, 48, 1133–1143. Available online: http://www.minsocam.org/ammin/AM48/AM48_1133.pdf (accessed on 4 March 2026).
- Reynolds, R.C. Estimation of mass absorption coefficients by Compton scattering: Improvements and extensions of the method. Am. Mineral. 1967, 52, 1493–1502. Available online: http://www.minsocam.org/ammin/AM52/AM52_1493.pdf (accessed on 4 March 2026).
- Bakhtiarov, A.V.; Zaitsev, V.A.; Makarova, T.A. Multielement X-ray fluorescence analysis of ores and products of their processing using the standard background method with a modified universal equation. J. Anal. Chem. 2007, 62, 355–361. [Google Scholar] [CrossRef] [Scilit]
- Chen, P.; Ilton, E.S.; Wang, Z.; Rosso, K.M.; Zhang, X. Global rare earth element resources: A concise review. Appl. Geochem. 2024, 175, 106158. [Google Scholar] [CrossRef] [Scilit]
- Nesbitt, H. Mobility and fractionation of rare earth elements during weathering of a granodiorite. Nature 1979, 279, 206–210. [Google Scholar] [CrossRef] [Scilit]
- Cui, H.; Zhong, R.; Xie, Y.; Yuan, X.; Liu, W.; Brugger, J.; Yu, C. Forming sulfate- and REE-rich fluids in the presence of quartz. Geology 2020, 48, 145–148. [Google Scholar] [CrossRef] [Scilit]
- Mororó, E.A.A.; Berkesi, M.; Zajacz, Z.; Guzmics, T. Rare earth element transport and mineralization linked to fluids from carbonatite systems. Geology 2024, 52, 240–244. [Google Scholar] [CrossRef] [Scilit]
- Zandkopsdrift. The Zandkopsdrift Project, Frontier Rare Earths. 2024. Available online: https://frontierrareearths.com/project (accessed on 19 March 2026).

Disclaimer/Publisher’s Note: The statements, opinions and data contained in all publications are solely those of the individual author(s) and contributor(s) and not of MDPI and/or the editor(s). MDPI and/or the editor(s) disclaim responsibility for any injury to people or property resulting from any ideas, methods, instructions or products referred to in the content. |
© 2026 by the authors. Licensee MDPI, Basel, Switzerland. This article is an open access article distributed under the terms and conditions of the Creative Commons Attribution (CC BY) license.