


Abstract
While conventional numerical studies often treat excavated stopes as empty voids or as backfilled, few investigations have simulated the post-mining void as a weak granular caved rock material that evolves naturally from a hanging wall failure. This study addresses this gap by modeling the caved rock progressively, which makes the excavation representation more realistic for sublevel caving operations. This study introduces stope stability for the Zarmitan gold mine in Uzbekistan, where mining occurs at about a 500 m depth in a narrow quartz vein. A hybrid approach combining empirical and numerical methods was adopted. The Mathews stability graph method provided initial design guidance, while three-dimensional FLAC3D numerical modeling was used to simulate the mining sequence with explicit representation of caved rock behavior. A various study was conducted, which included the effects of stress ratio, stope length along strike, and pillar thickness on overall stability. The obtained results show that the stress ratio is the dominant factor controlling stope behavior. Stope length significantly affects failure extent, with shorter stopes showing better performance under similar conditions. Pillar thickness was found to improve stability and reduce tensile stresses in critical areas, though in all cases, hanging wall support remains essential. The numerical results confirm empirical predictions while providing quantitative insights into stress distributions and failure mechanisms not captured by empirical methods alone. These results provide mine operators with quantitative, site-specific design criteria, most notably that, under the measured high horizontal stress, limiting stope length to 40 m and increasing pillar thickness to 8 m substantially improves hanging wall stability, which demonstrates how a hybrid empirical-numerical methodology can directly support safer and more economic extraction in deep, narrow-vein operations.
1. Introduction
As the global demand for minerals continues to rise, mining operations are progressively extending to greater depths to extract remaining ore resources. This transition to deep mining introduces significant geotechnical challenges, firstly characterized by high in situ stresses, which can lead to instability issues, such as rock bursts, excessive deformation, and uncontrolled dilution [1,2]. Ensuring the stability of underground excavations, particularly stopes, is the most important factor for both the safety of personnel and the economic viability of a mining operation [3].
Steeply dipping, thin-vein orebodies are especially challenging because excavations are narrow, exposed surfaces are often controlled by discontinuities, and production layouts commonly use multiple stopes close to each other. In these layouts, the interaction between adjacent stopes and the remaining pillar can dominate the stability response [4]. The problem becomes more sensitive when the horizontal-to-vertical stress ratio (K = σH/σv) is high, as larger horizontal stresses can increase the stress difference and promote yielding and tensile zones around openings and within pillars [5]. At the Zarmitan deposit, in situ stress measurements have confirmed the existence of significant tectonic stresses, with studies showing horizontal stresses can exceed vertical stresses by a factor of 1.0 to 1.4 [6,7].
For many years, the main tool for initial stope design has been the empirical stability graph method, first introduced by Mathews et al. [8] and subsequently modified by researchers like Potvin [9] and Mawdesley et al. [10]. This method uses a stability number (N’) and the hydraulic radius (HR) of a stope surface to predict whether it will be stable, unstable, or caved [11]. While invaluable for initial sizing, this method has limitations. It relies on a fixed database of case histories and may not fully capture the complex three-dimensional (3D) stress redistribution, the progressive nature of rock mass failure, or the specific interaction between multiple stopes and pillars in a high-stress environment [12].
To overcome these limitations, numerical modeling has become an essential tool in rock engineering [13,14]. Codes like FLAC3D allow for detailed simulation of the mining sequence, the explicit representation of geology (vein, host rock), and the analysis of stresses, displacements, and failure zones around excavations [15]. By combining empirical methods for initial guidance with numerical models for detailed validation, a more robust and reliable stope design can be achieved [16]. Recent multi-criteria optimization studies have demonstrated that the Mathews empirical graph method and FLAC3D numerical analysis yield safety assessments that are generally independent of each other, reinforcing the value of a hybrid evaluation [17]. Similarly, integrated economic-geomechanical models using heuristic algorithms have been applied to balance pillar failure, dilution, and profitability in sublevel open stoping operations [18]. In many mines, excavated voids are not left as long-term empty openings; instead, they are filled with broken rock from caving. Modeling the excavated zone as a weak granular “caved rock” medium represents a more realistic post-mining response.
This paper presents such a hybrid approach for the Zarmitan mine in Uzbekistan. The study has two main objectives. The first is to establish a baseline stability assessment for a proposed mining layout consisting of two 54 m high stopes separated by a 6 m pillar. The second, and primary, objective is to conduct a comprehensive parametric study using FLAC3D to investigate the combined influence of the in situ stress ratio (K), stope length along strike, and pillar thickness on stope stability. The stress ratios are chosen based on site-specific data: K = 1.0 (isotropic reference), K = 1.4 (the upper bound of measured in situ stresses [6,7]), and K = 2.0 (a conservative high-stress sensitivity case). A main finding of this numerical work is the explicit simulation of post-mining behavior, where the excavated stope is treated as a zone filled with caved, granular rock. By reconciling the empirical predictions with the numerical results, this study aims to provide design guidelines for the Zarmitan mine and offer insights for similar deep, narrow-vein mining operations.
Nevertheless, a clear research gap remains: the existing body of work has not yet combined a site-specific, high-stress parametric analysis of narrow-vein stope–pillar interactions with an explicit, post-caving granular fill model. In particular, this study has systematically investigated how the interplay between stress ratio, stope length, and pillar thickness governs hanging wall stability when the excavated void is realistically represented by a weak, bulked caved rock rather than an empty opening. Filling this gap is essential for providing reliable design guidelines for operations such as the Zarmitan mine, where high horizontal stresses and caved filling are simultaneously present.
2. Geological and Mining Conditions
2.1. Site Description
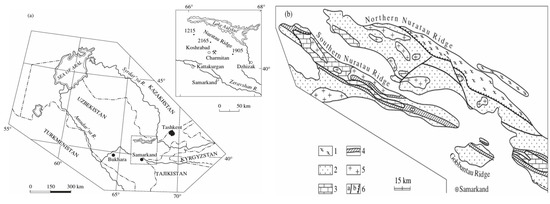
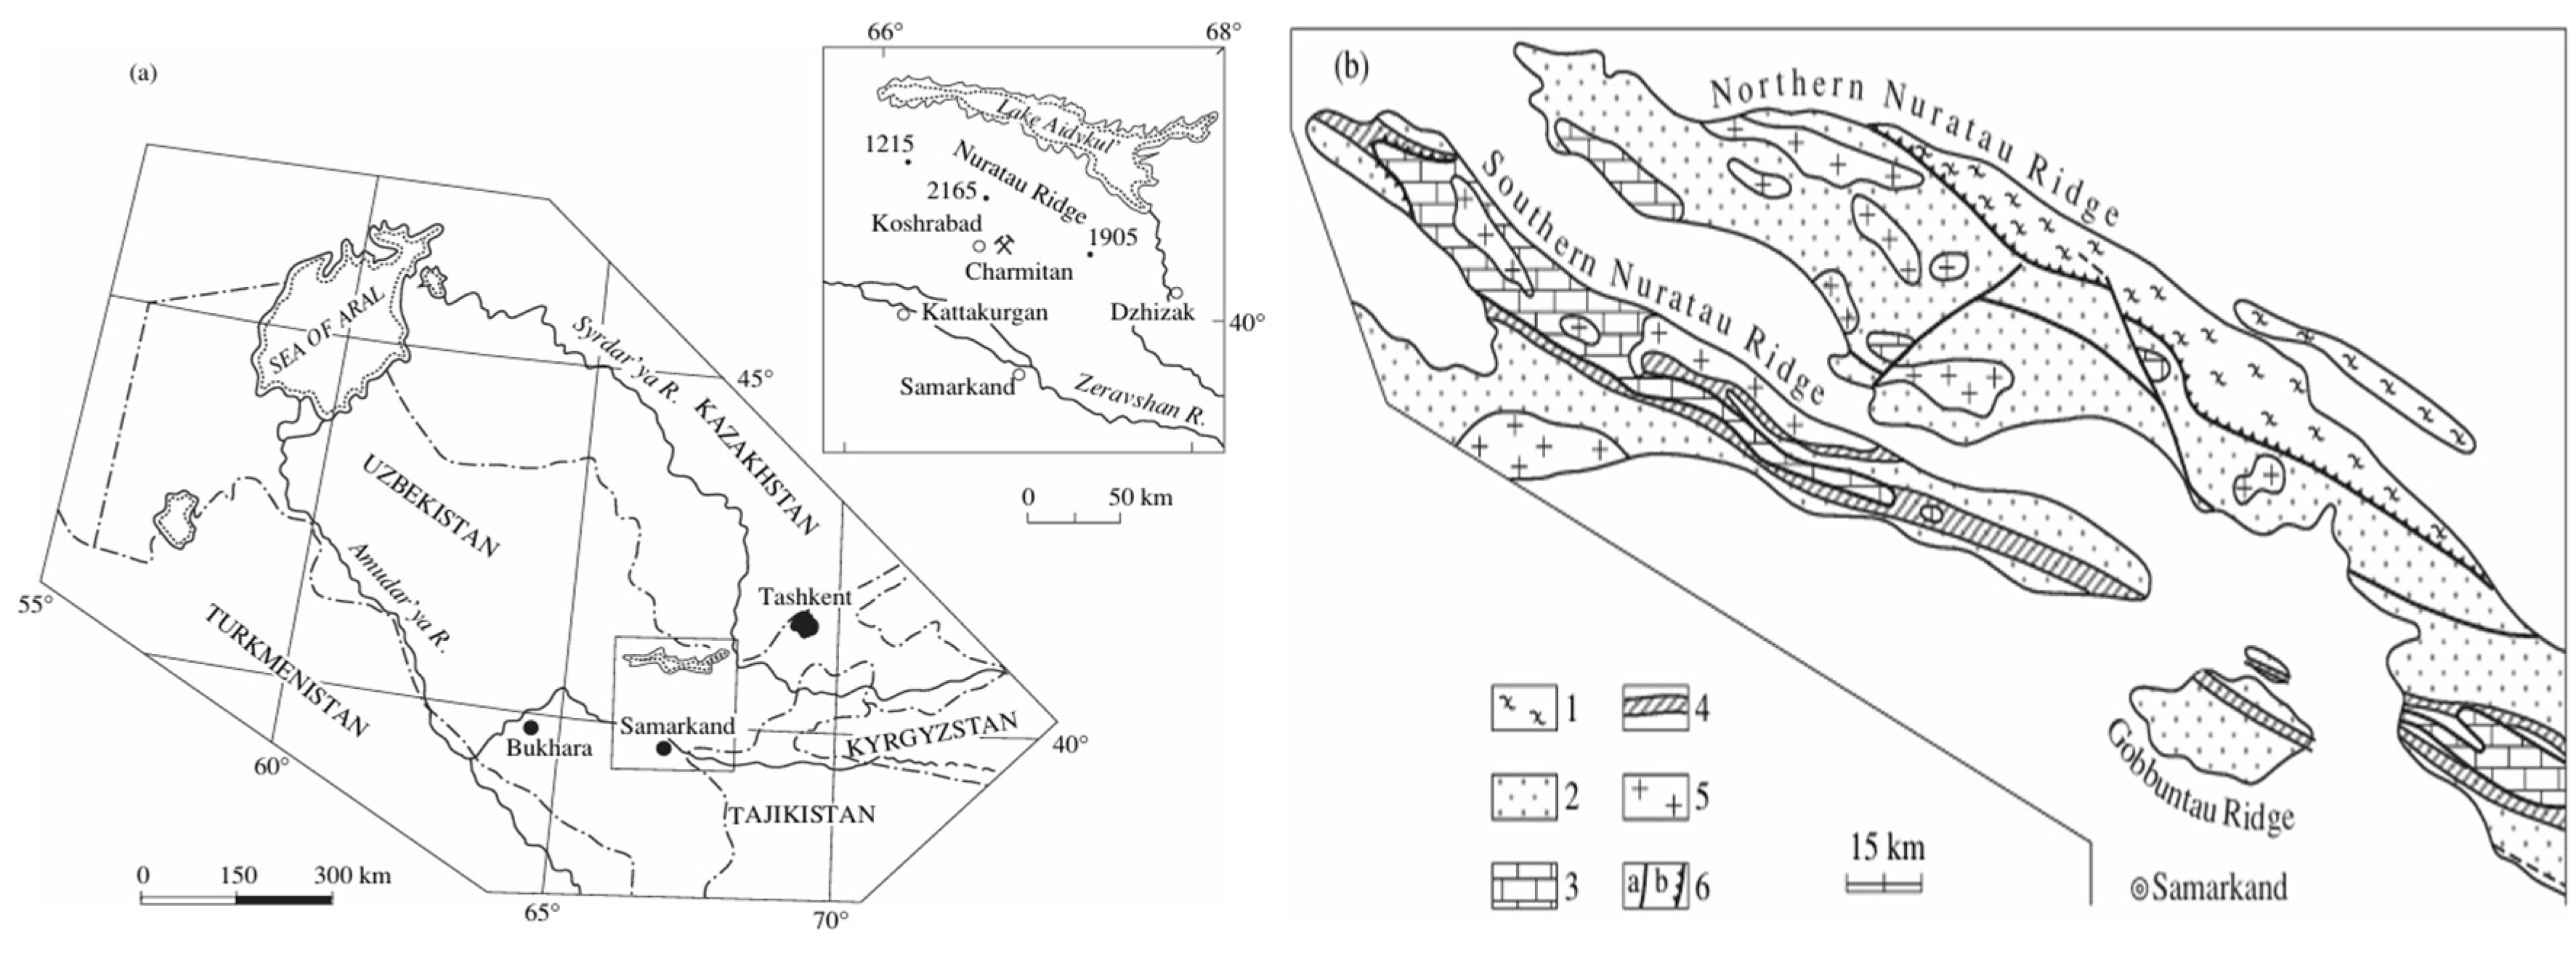
The Zarmitan gold deposit is located in the Nuratau region of central Uzbekistan and forms part of the Paleozoic Tian Shan orogenic belt [1,7]. This belt, one of the world’s richest gold provinces, formed as a result of Paleozoic orogenic collision [1]. The deposit is partially hosted by the Koshrabad granitoid intrusion and contains 84 major orebodies and numerous smaller veins [1,7]. The deposit geology has been extensively documented by Abzalov [19], who described the Koshrabad granitoid intrusion as the primary host. Mineralization is strongly controlled by structures, specifically high-angle faults that are splays off the regional Karaulkhana-Charmitan fault zone [1]. In administrative terms, the deposit is in the Samarkand region, approximately 100 km west-northwest of Samarkand city. Figure 1 shows the location of the mine site and the tectonic scheme.
Figure 1.
Location of the Zarmitan gold deposit (a) and tectonic scheme of Nuratau Mountains (b). 1, 2—Tectonostratigraphic terrains: 1—Turkestan–Alai, 2—Turkestan–Zarafshan; 3—Middle and Upper Paleozoic carbonate rocks and flysch; 4—Southern Nuratau shear zone; 5—granitoid; 6a—subvertical faults, 6b—thrusts. (Bortnikov et al., 1996) [20].
The Zarmitan deposit is classified as hydrogeologically simple. Water inflows into the underground workings are small, typically 3–5 L/s per 1000 m of tunnel and approximately 30 L/s for the entire mine and have not increased significantly as mining progressed deeper. For these reasons, the rock mass at the current mining depth of 500–520 m is considered essentially drained, and pore pressure was not included in the numerical model. However, it is recognized that in the immediate vicinity of major water-conducting faults, local pore pressure could reduce effective stress and worsen hanging-wall stability. The present dry analysis should, therefore, be regarded as a baseline; any future encounter with significant water inflows in fault zones would require a separate hydro-mechanical assessment.
2.2. Mining Method and Stope Design
The orebody is considered a steep, thin vein with an average dip of 75° and a thickness of 2 m (from mine planning and geomechanical dataset). Mining is planned at a depth of approximately 500–520 m. The vertical stress is estimated by the common overburden calculation (1):
σv = p g H
Using an average rock density of p = 2650 kg/m3, gravitational acceleration g = 9.81 m/s2, and depth H = 520 m, the vertical stress is calculated as σv = 13.5 MPa. The Zarmitan gold deposit extends from the surface to a proven depth of approximately 2000 m, with current underground mining reaching the 1000 m level [21]. In the active mining zone, the horizontal tectonic stress dominates, with measured stress ratios K > 1.4 (Sayidkosimov and Kazakov, 2018 [7]; Rakhimov and Kazakov, 2014 [6]). Empirical estimates based on the relationship K ≈ exp (0.735-0.005H) indicate that, under a relaxed tectonic regime, K would fall below unity at depths exceeding 500 m; however, the persistent tectonic compression at Zarmitan maintains K well above 1.0 throughout the entire depth range of current operations. The in situ stress field at the Zarmitan deposit has been characterized by multiple independent studies. Rakhimov and Kazakov conducted numerical modeling using the finite element method and determined that the horizontal stresses exceed the vertical stresses by a factor ranging from 1.0 to 1.4. This range represents the measured conditions at the mine. Subsequent research by Sayidkosimov and Kazakov (2018) [7] at the ISRM European Rock Mechanics Symposium confirmed these findings and further demonstrated through mathematical modeling and mine experiments that the horizontal squeezing tectonic tension exceeds the vertical tension by more than 1.4 times. Based on these comprehensive investigations, we adopt the following stress ratios for the major horizontal stress oriented across the strike of the vein (x-direction in the numerical model):
K = 1.0—shows the lower bound of the measured range (isotropic reference case);
K = 1.4—shows the upper bound of the measured range (site-supported baseline);
K = 2.0—conservative high-stress sensitivity case, justified by the statement that horizontal stresses exceed vertical stresses by more than 1.4 times [2], allowing for potential stress increases at greater depths or where tectonic zones are dominant.
This approach follows established practice in parametric geomechanical studies, where upper bound values are used to investigate system sensitivity and failure mechanisms [5,13]. The value K = 1.4 is the highest horizontal-to-vertical stress ratio that has been directly determined for the Zarmitan deposit and remains the most up-to-date published estimate. The K = 2.0 case is not based on a measured value but is included as a conservative sensitivity bound to test whether proposed stope dimensions remain acceptable if stresses were locally amplified near major tectonic structures.
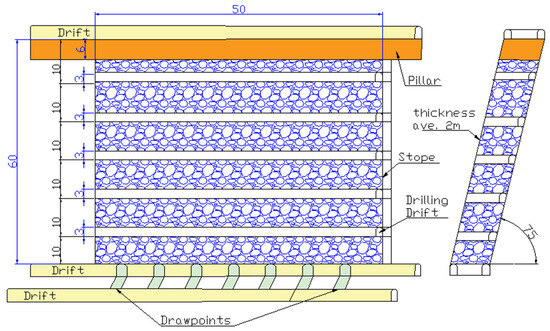
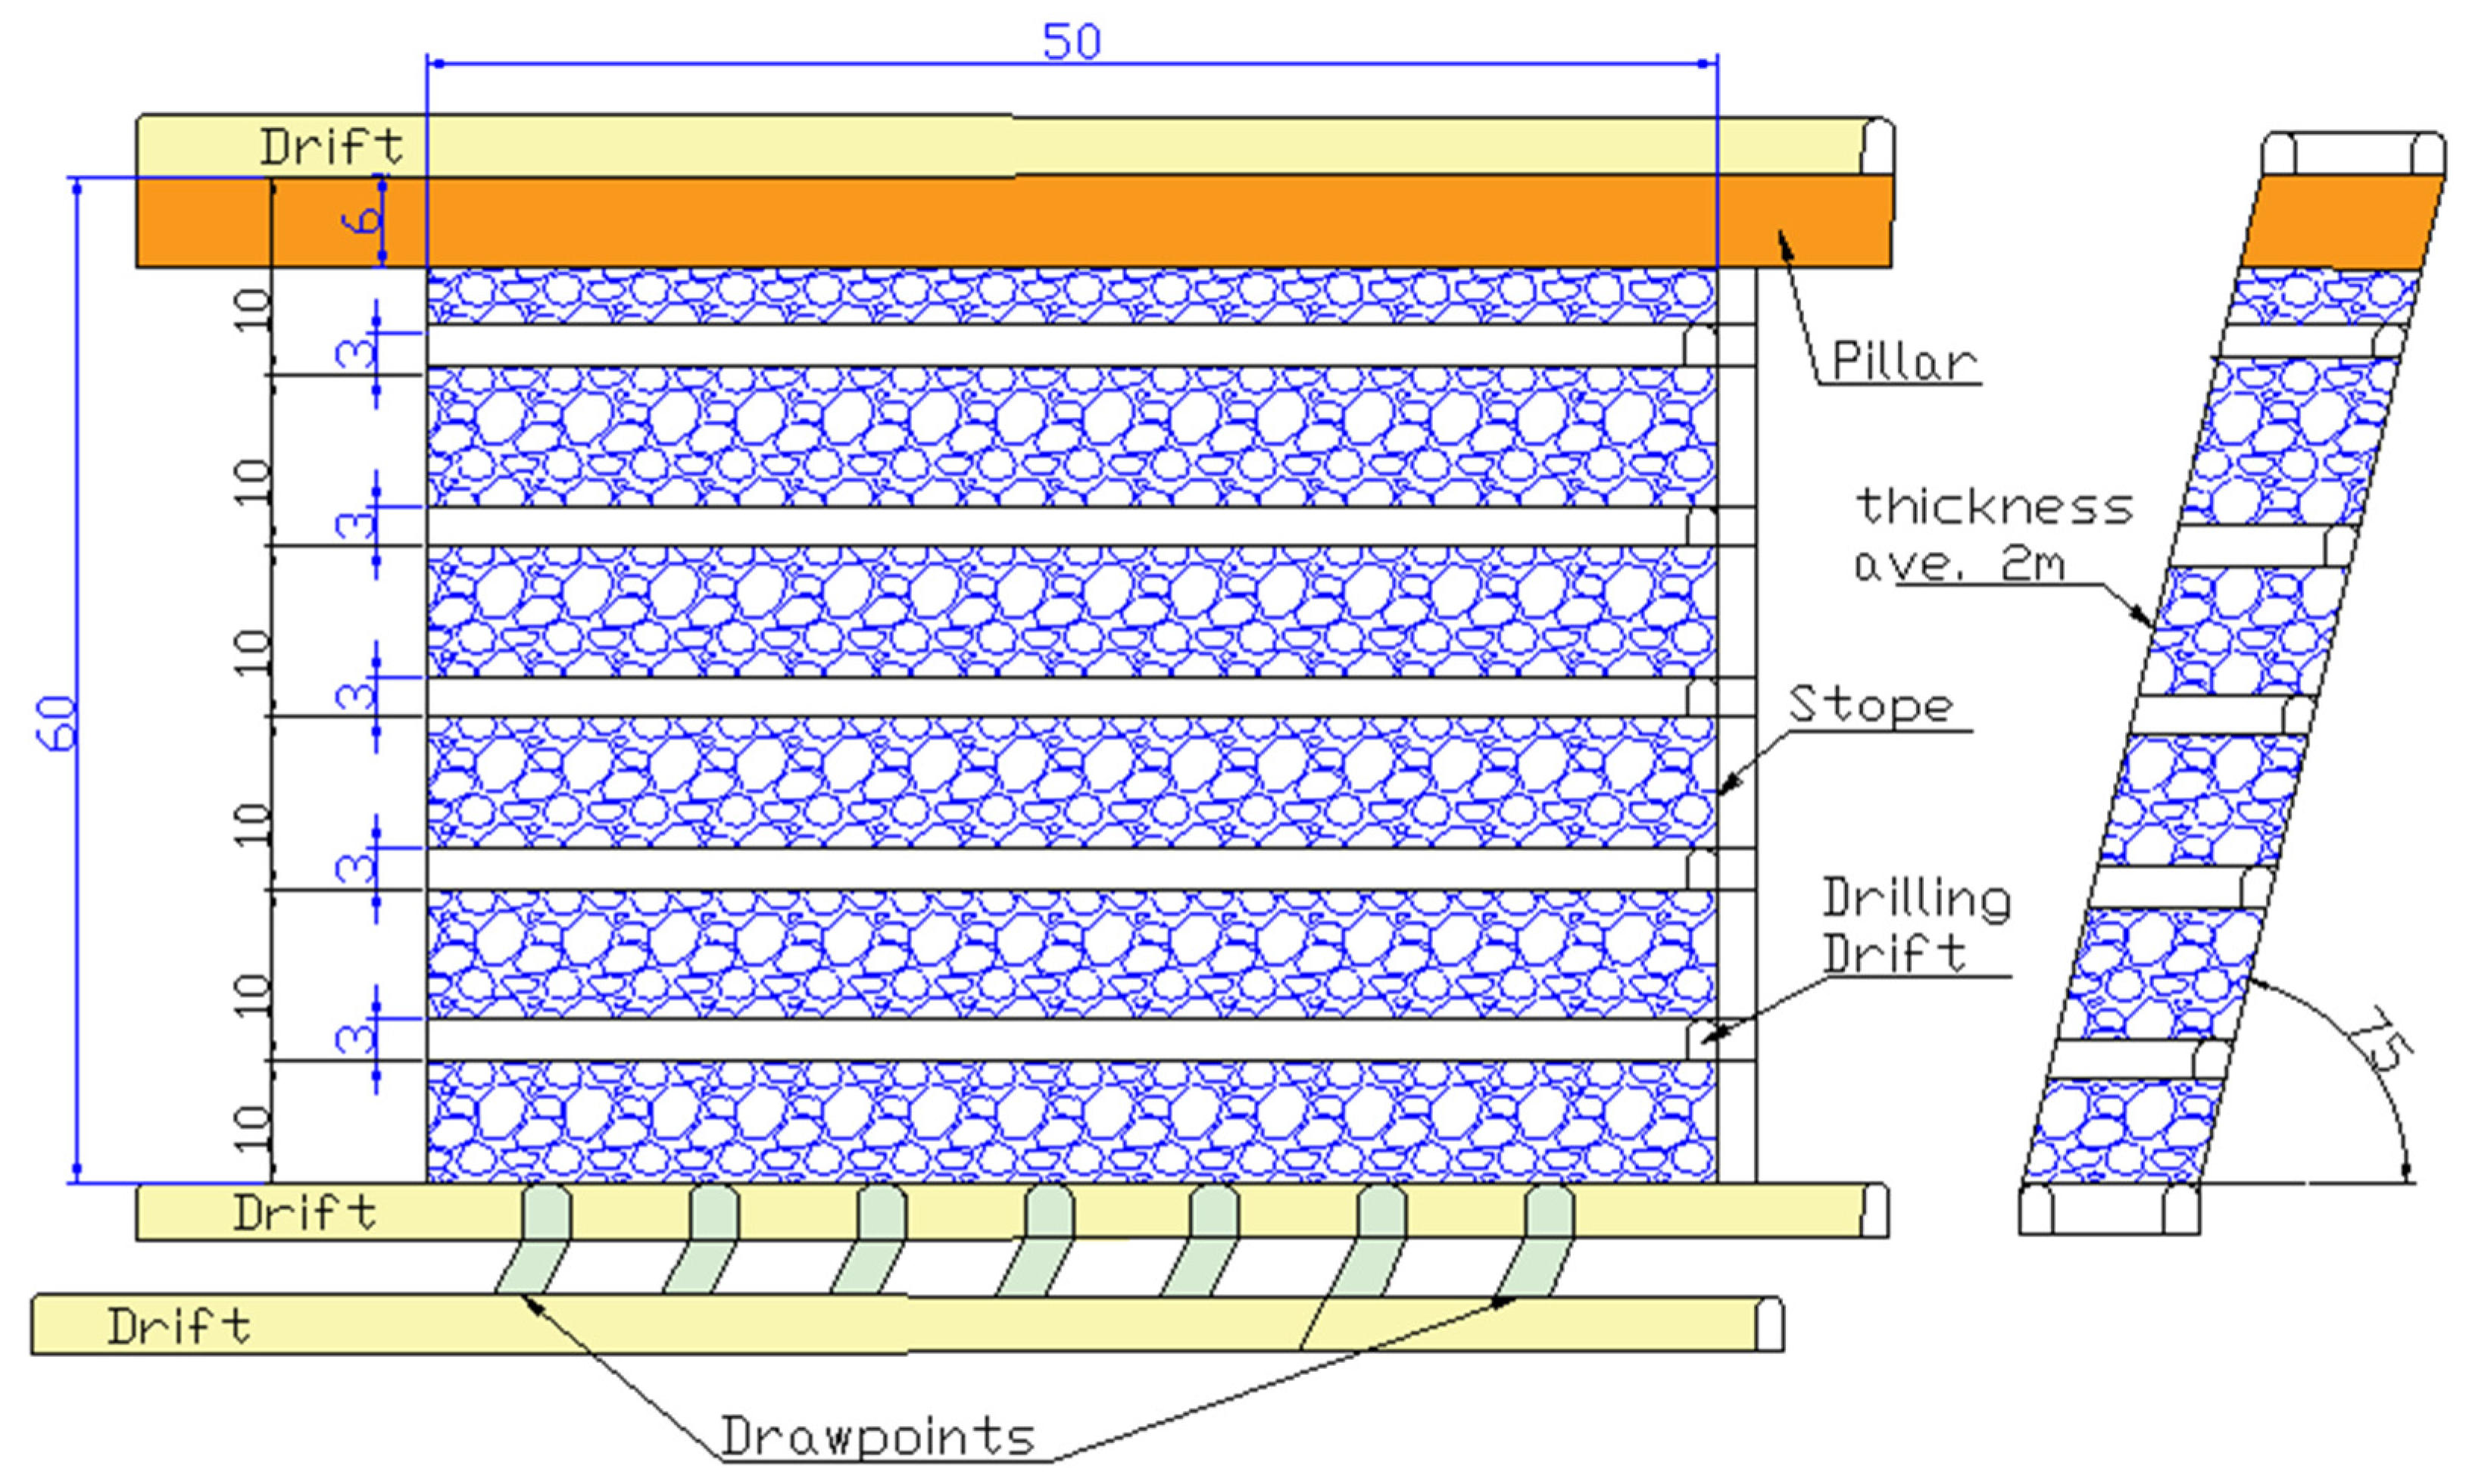
The proposed mining method for this deep, narrow vein is applied as a variant of sublevel stoping in which the mined-out volume is not assumed to remain as a long-term empty void. Instead, after extraction, the opening is expected to become occupied by broken (caved) rock originating from the hanging wall. This is the main feature of sublevel caving-type behavior, where ore is blasted and extracted at the same time overlying rock mass fractures and caves under gravity and mining-induced stresses, and the broken waste progressively fills the void. We analyzed in this paper target layout consists of two vertically stacked stopes, each 54 m high, separated by a 6 m inter-stope pillar. Investigating the stope–pillar interaction is the purpose of this layout under different stress ratios, because closely spaced stopes can transfer load into the remaining pillar and concentrate stresses in the pillar core and adjacent walls. Figure 2 shows the proposed geometry, which is used throughout the paper as the reference layout for both the empirical assessment and the FLAC3D simulations.
Figure 2.
Long section of the proposed mining layout showing 60 m stopes including 6 m pillar, steeply dipping vein (75°), drift (height 3 m), drilling drift (height 3 m) and drawpoints.
It is noted that the extent of caving and the volume of filling depend on the stability of the hanging wall; in cases where the hanging wall remains stable, incomplete filling may occur. The present study assumes full filling as a conservative scenario. Residual voids would further increase the effective roof span and reduce confinement, making the actual stability conditions potentially less favorable than those simulated. Hence, designs proven stable under full-filling conditions incorporate an inherent safety margin. Because full filling represents the maximum possible confinement from the granular caved material, any residual voids (incomplete filling) would increase roof tensile stresses and displacements, reinforcing the conclusion that careful stope dimensioning and support are critical.
2.3. Rock Mass Characterization
The rock mass at Zarmitan is divided into three main geotechnical units: the host rock (granosyenite), the vein (quartz), and the caved rock (post-mining). Intact rock properties are taken from laboratory testing. Rock mass strength for the host rock and vein is obtained using the generalized Hoek–Brown criterion with site-specific GSI and disturbance factor concepts, which properly accounts for the non-linear increase in strength with confining pressure [4,8]. The caved rock is modeled with constant, low Mohr–Coulomb parameters, corresponding to its loosest state immediately after caving. The caved rock is modeled with constant, very low stiffness and strength, corresponding to its state immediately after caving. Because subsequent compaction would increase its stiffness and confinement, these parameters yield a conservative lower-bound estimate of the stabilizing effect of the fill. The fill acts primarily as a passive confinement; its compaction evolution is a second-order effect for these mechanisms. Although the present study treats the caved fill as a time-independent Mohr–Coulomb material, recent investigations emphasize the role of consolidation and creep in backfill stability [22,23], and advanced coupled rock-backfill interaction models have been developed to capture the effects of closure and depth on fill behavior [24,25].
The present modeling scheme does not reproduce the transient caving process (detachment, bulking, and progressive closure of the excavation). The final post-caving state, a void occupied by granular debris, is captured directly by assigning the excavated zone a weak, cohesionless fill immediately after extraction. This simplification is conservative for roof stability because it omits the temporary open-void stage during which the roof rock experiences maximum tensile stress and potential cracking. Explicit simulation of the caving kinematics would require discrete-element or hybrid methods and extensive calibration data that are not available for the site; the constant-property fill approach is therefore preferred for this parametric design study.
For the host rock, E = 30 GPa was used. The bulk modulus (K) (2) and shear modulus (G) (3) required for FLAC3D were then calculated from E and Poisson’s ratio (ν) using standard elasticity equations:
The rock mass properties for the host rock and vein are based on the generalized Hoek–Brown criterion; meanwhile, the caved rock parameters in Table 1 are selected from typical values for broken, granular material. The low tensile strengths reflect the jointed nature of the rock mass, which is unable to sustain significant tensile stress [3].
Table 1.
Rock mass properties used in FLAC3D models.
The caved rock is assumed to behave as a loose, cohesionless granular material. The cohesion (0.01 MPa) is set to a value that is very close to zero—physically representing the fact that broken rock fragments do not stick together—but which avoids numerical instability in the FLAC3D solver. The friction angle (35°) reflects the residual frictional resistance typical of angular, broken hard-rock fragments and is consistent with values commonly adopted for granular rockfill in mining studies (e.g., Blachowski & Ellefmo, 2012 [26]; Lapcevic & Torbica, 2017 [27]). A direct calibration of these parameters against field measurements of caved rock behavior at the Zarmitan mine is not yet available and would be a valuable topic for future work. However, the chosen values are conservative (representing the loosest, weakest state) and are applied uniformly across all simulations, ensuring that comparative parametric conclusions remain robust.
3. Research Methodology
3.1. Empirical Stope Design Analyzes
Empirical methods are a useful way to assess stope stability because they rely on a large collection of past case studies. In underground mines for open stope design, the stability graph method is the most commonly used empirical approach [11]. It was first developed by Mathews et al. [8] and later modified by Potvin [9] and Mawdsley et al. [10]. This method looks at how stable a stope surface (such as the hanging wall, footwall, or back) is based on two main factors: the hydraulic radius (HR), which represents the effective span of the surface, and the modified stability number (N′), which considers rock mass quality, stress conditions, joint orientation, and gravity effects [12]. In this study, the stability graph method is used for the Zarmitan mine to figure out possible optimal stope shapes.
3.1.1. Input Parameters for Zarmitan Empirical Design
The empirical assessment uses data specific to the Zarmitan site. This data comes from laboratory tests, underground mapping, and the in situ stress model developed for the deposit. Table 2 provides a summary of the key parameters.
Table 2.
Zarmitan empirical design input parameters.
The rock mass quality at Zarmitan was evaluated using several classification systems. According to Raimjanov and Khasanov, 2020 [3], the RMR values for the granosyenite host rock range from 46 to 60, and the GSI values range from 41 to 50. This means the rock mass is of fair to good quality. These findings match what was observed in the field, where the rock is moderately jointed and has five to six steep joint sets.
For the granosyenite host rock, the following primary parameters were used:
- Intact Uniaxial Compressive Strength: σci = 100 MPa (representative of the laboratory range 63–141 MPa);
- Hoek–Brown constant for intact rock: mi = 30 (typical for granitoid rocks);
- Geological Strength Index: GSI = 45 (mid-range of the site-measured interval 41–50; Raimjanov & Khasanov, 2020 [3];
- Disturbance factor: D= 0.5 (moderate blast damage in conventional drill-and-blast excavations).
From these, rock-mass Hoek–Brown parameters, such as mb, s, and a (4)–(6) are calculated as follows:
The same procedure, with appropriate values, is applied to the quartz vein. The caved rock remains a cohesionless Mohr–Coulomb material (c = 0.01 MPa, φ = 35°, σt = 0), a conservative and physically reasonable representation of broken, granular filling. These values are commonly adopted for granular rockfill in mining studies [26,27].
3.1.2. Hydraulic Radius Calculation
The hydraulic radius (HR) (Equation (7)) is a geometry measurement that shows the effective span of a stope surface. It is calculated as the surface area divided by its perimeter:
For a rectangular surface with length (L) and height (H), the hydraulic radius is given by Equation (8):
For the planned stopes at Zarmitan, two cases are considered: the full stope height (54 m) that represents the maximum possible exposure, and the effective exposed height (Hexp) that accounts for the reduced exposure when the lower part of the stope is covered by broken ore, as in shrinkage and short ore storage methods [18,28]. Table 3 shows the HR values for the candidate stope shapes.
Table 3.
Hydraulic radius (HR) for Zarmitan candidate stope geometries.
As shown in Table 3, using the full 54 m stope height gives HR values between 9.6 m and 14.2 m. These are higher than the usual stable limits for fair rock mass quality [10]. However, if we use the idea of effective exposed height, meaning the lower part of the stope is covered by broken ore or fill, the HR values drop to 5.0–10.0 m. This brings them into a range where stability might be possible [18]. This concept has been supported by recent studies in narrow-vein mining, where controlling the effective exposed height helped a lot to reduce dilution [26].
3.1.3. Stability Number (N′) Calculation
The modified stability number (N′) (9) is calculated using the following equation (Potvin, 1988) [9]:
where Q′ is the modified rock quality index (Q-system without the stress reduction factor;), A is the stress factor, which accounts for induced stress compared to rock strength; B is the joint orientation factor, which accounts for how critical joints are oriented relative to the stope face; and C is the gravity adjustment factor, which accounts for the failure mode and face orientation.
N′ = Q′ × A × B × C
Modified Rock Quality Index (Q′)
Q′ (10) should be calculated separately by geotechnical domain, especially for fault damage zones (which make up about 10–15% of workings), because these zones control dilution and stope wall unraveling. The Zarmitan orebody is hosted in the Koshrabad granosyenite intrusion. The mine’s internal geomechanical assessment classifies the intrusive rock mass with Q′ in the range 50–200, while the sedimentary rocks present only at the deposit margins fall in the lower range of 20–45. Since the stopes analyzed in this study are located entirely within the intrusive unit, a representative mid-range value of Q′ = 100 is adopted.
Stress Factor (A)
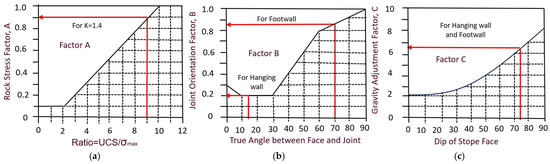
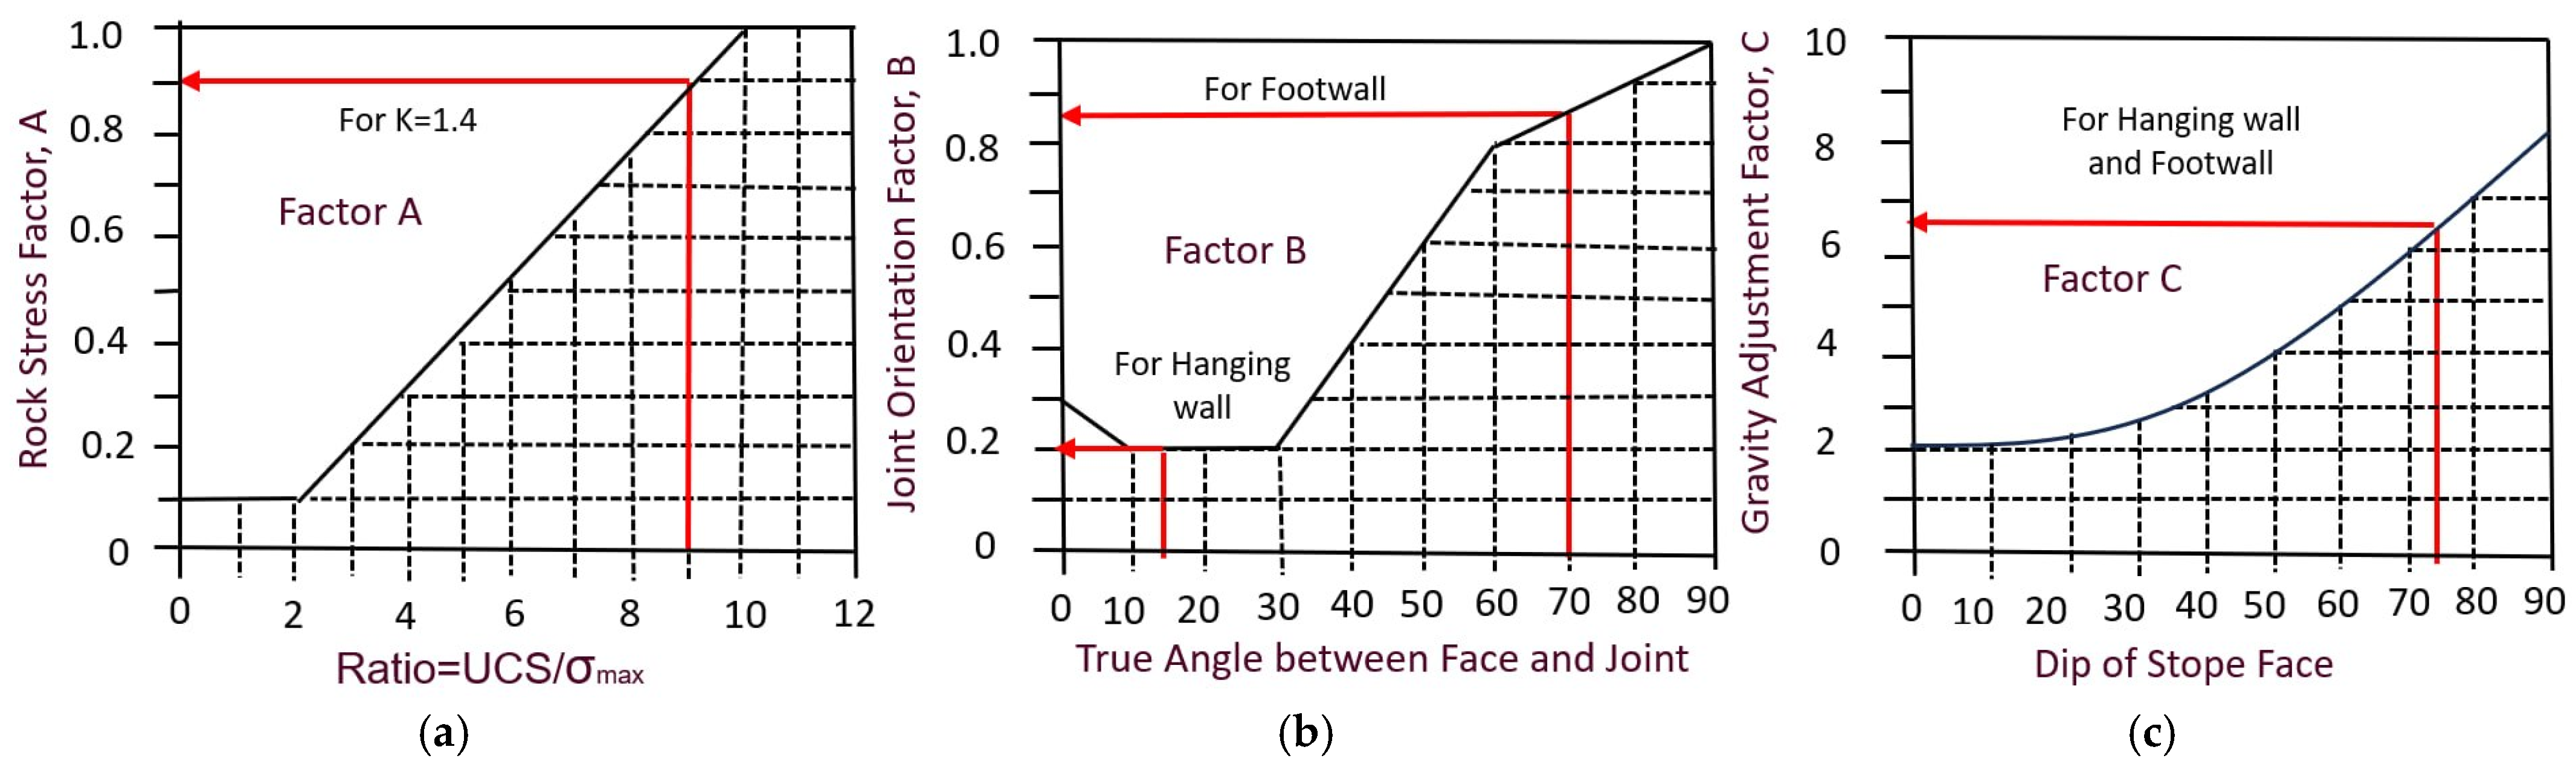
The stress factor (A), as shown in Figure 3a, accounts for the effect of induced compressive stress on the stability of stope walls. It is determined from the ratio of the intact rock uniaxial compressive strength (UCS) to the maximum induced compressive stress (σmax) acting on the stope face [9,29]. The stress factor A is taken directly from the mine’s own geomechanical assessment, which used a 3D boundary-element elastic model to obtain the maximum induced compressive stress on the stope walls under the current mining depth and in situ stress regime (K ≈ 1.4). The site-validated value is A = 0.9. Because the primary objective of the numerical modeling component of this study is to investigate the influence of varying the stress ratio K on stope–pillar stability, the empirical analysis is limited to this single, well-constrained baseline condition.
Figure 3.
(a) Rock stress factor A—modified from Potvin (1988) [9], (b) joint orientation factor B—modified from Potvin (1988) [9], (c) gravity adjustment factor C—modified from Hutchinson & Diederichs (1996) [30].
Joint Orientation Factor (B)
The joint orientation factor (B), as shown in Figure 3b, accounts for how likely structural failure is to occur. It is determined by the true angle (α) between the pole of the stope face and the pole of the critical joint set [9,15]. At Zarmitan, the joint sets are mostly steep (70–90°) and run nearly parallel to the vein orientation [3]. For the hanging wall (dip about 75°), the true angle α between the face and the main joint sets is approximately 15–30°. According to the B-factor chart, this gives the following:
- B ≈ 0.2–0.4 for the hanging wall;
- B ≈ 0.8–1.0 for the footwall (where the joint orientation is more favorable);
- B ≈ 0.8–1.0 for the Back,
This big difference in B factors explains why the hanging wall and footwall are expected to behave differently; in terms of stability, this is an important point to consider in narrow-vein mining [16].
Gravity Adjustment Factor (C)
The gravity factor (C) depends on how the stope face fails and which way it is oriented (Hutchinson & Diederichs, 1996 [30]; Bewick, R.P.; Kaiser, 2009 [31]). There are three main failure types: gravity fall, slabbing, and sliding. Figure 3c shows how C is chosen based on the failure mode and face orientation. For hanging walls and footwalls, C is determined from the dip of the face; for sliding failures, it depends on the joint dip. For the Zarmitan stopes the hanging wall dip ≈ 75°; for slabbing or gravity fall, C ≈ 7.0. For the footwall, the dip ≈ 75°, which is similar to the hanging wall, with C ≈ 7.0. And finally, for the back wall (near-horizontal), the gravity fall C ≈ 2–3.
Table 4 summarizes the components of the stability number for each stope surface under different K scenarios.
Table 4.
Stability number (N′) components for Zarmitan stope surfaces.
3.1.4. Stability Classification
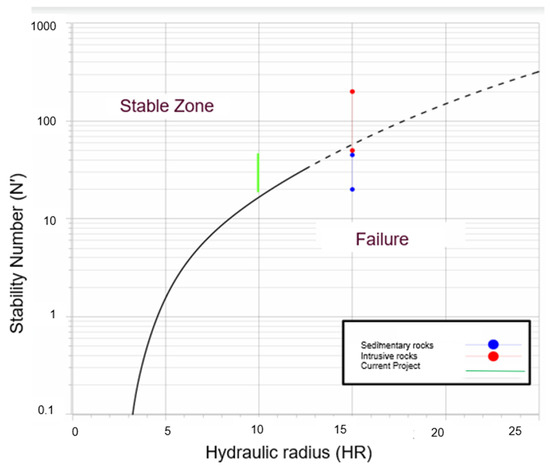
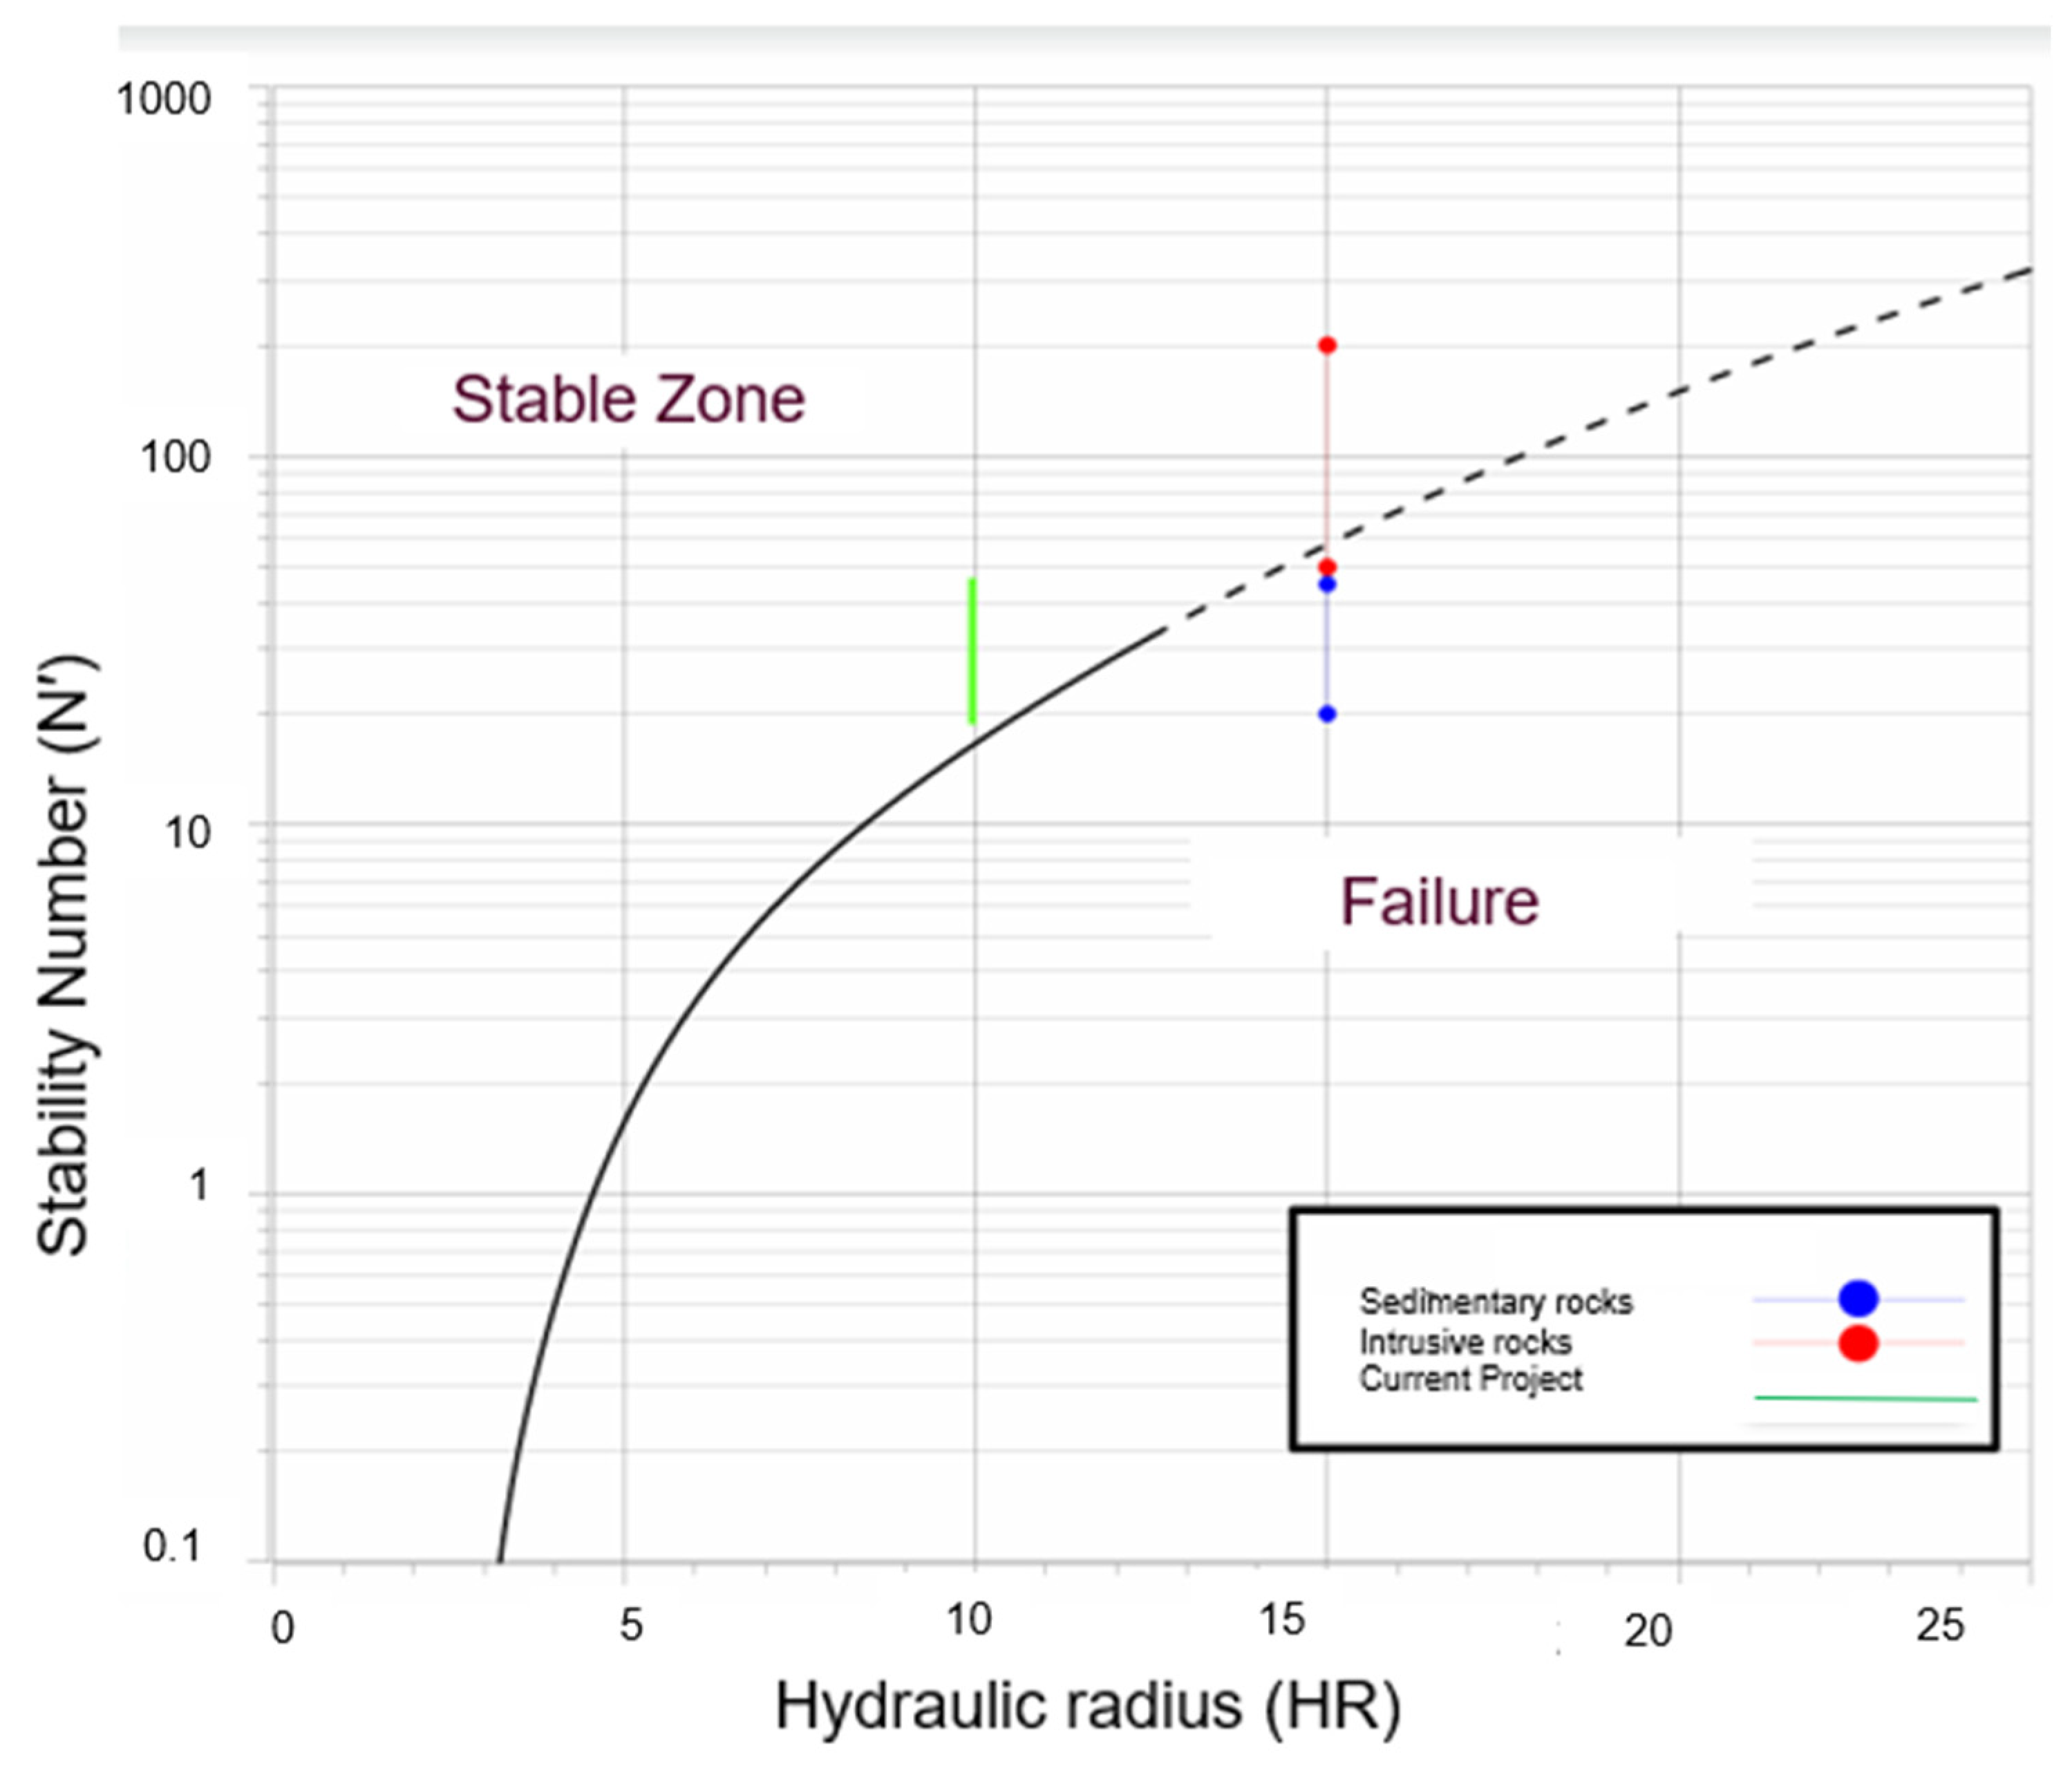
Once HR and N′ values are known for each stope surface and geometry, the stability classification can be read from the modified stability graph [10,29]. Figure 4 presents the stability graph with stability zones (stable and failure) defined by empirical boundaries obtained from a large database of stope case histories. For the stope surface, the combination of HR and N determines its predicted stability. Points plotted in the stable zone indicate that the surface is likely to remain intact under the given conditions. Points in the transitional zone suggest that some yielding or minor failure may occur.
Figure 4.
Modified stability graph showing stable, failure as functions of hydraulic radius (HR) and modified stability number (N′) (Mawdesley et al., 2001 [10]; Trueman & Mawdesley, 2003) [32].
The stability classification is performed for every candidate stope geometry and for both effective-height (filled) and full-height (unfilled) conditions. The results are summarized in Table 5.
Table 5.
Empirical stability predictions for Zarmitan stope surfaces.
3.1.5. Summary of Empirical Predictions and Implications for Numerical Modeling
The empirical stability analysis gave several important results that will guide the numerical modeling part of this study: the joint orientation is unfavorable on the hanging wall (B ≈ 0.2–0.4), it has lower N′ values and worse stability than the footwall. This shows how important joint orientation is in narrow-vein mining and means the hanging wall will likely need more support [15,16]. The empirical stability predictions, evaluated for the baseline stress condition (K ≈ 1.4), show that all three surfaces, hanging wall, footwall, and back, are stable for every stope length considered (40 m, 50 m, and 60 m) at an effective exposed height of 15 m. When the effective height increases to 30 m, the footwall and back remain stable at all lengths, but the hanging wall becomes transitional for the 50 m and 60 m stopes, while remaining stable for the 40 m stope length. For the fully unfilled condition (full 54 m height), the hanging wall is transitional at 40 m, fails at 50 m and 60 m, the footwall is stable at 40 m and becomes transitional at 50 m and 60 m, and the back is stable at 40 m but transitional at 50 m and fails at 60 m. These results confirm that maintaining a low effective fill height is essential for overall stope stability and that the hanging wall is the most vulnerable surface and will likely require systematic cable-bolt support as recommended by Nickson, 1992 and Hoek et al., 2000 [33,34].
Because the caved rock fill was found to provide little resistance to tensile failure in the upper hanging wall, the installation of pre-tensioned, fully grouted cable bolts from the sublevel drilling drifts into the hanging wall before blasting is recommended for all production stopes. Using Nickson’s (1992) [33] length criterion (0.5 × HR), a minimum cable length of approximately 4 m is required; to ensure anchorage beyond the predicted tensile zone, a design length of 6–10 m is proposed. Based on the Miller–Potvin empirical charts, for N′ ≈ 0.68, a cable spacing of 1.5–2.5 m is appropriate.
The empirical method looks at each stope surface separately and cannot capture the 3D interaction between two stopes and the pillar between them. Lunder & Pakalnis, 1997 [35] established basic principles for determining the strength of hard-rock pillars. The numerical modeling will fill this gap by showing how stress builds in the pillar, how the yield zone develops over time, and by giving quantitative design recommendations based on stress levels and displacement limits [17,36].
3.2. Numerical Modeling Methodology
3.2.1. Overview and Objectives
In order to check and improve the empirical design results from Section 3.1, a series of 3D numerical models was built using the finite difference code FLAC3D (version 5.01). The main goals were as follows:
- ⮚
- Simulate mining two stopes placed one above the other, and see how the stress, displacement, and failure zones change during excavation.
- ⮚
- Measure stope and pillar stability using stress values and displacement.
- ⮚
- Run a parametric study to see how the stress ratio (K = 1.0, 1.4, 2.0), stope length along strike (40, 50, 60 m), and pillar thickness (4, 6, 8 m) affect stability.
- ⮚
- Look at the effect of caved rock by modeling the mined-out area as a weak granular material.
3.2.2. Model Geometry and Mesh
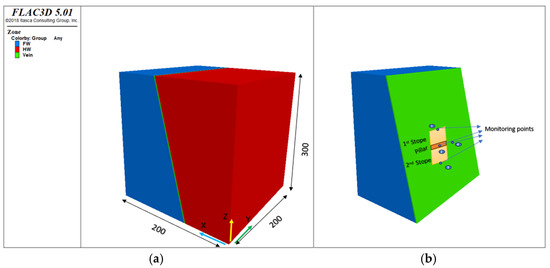
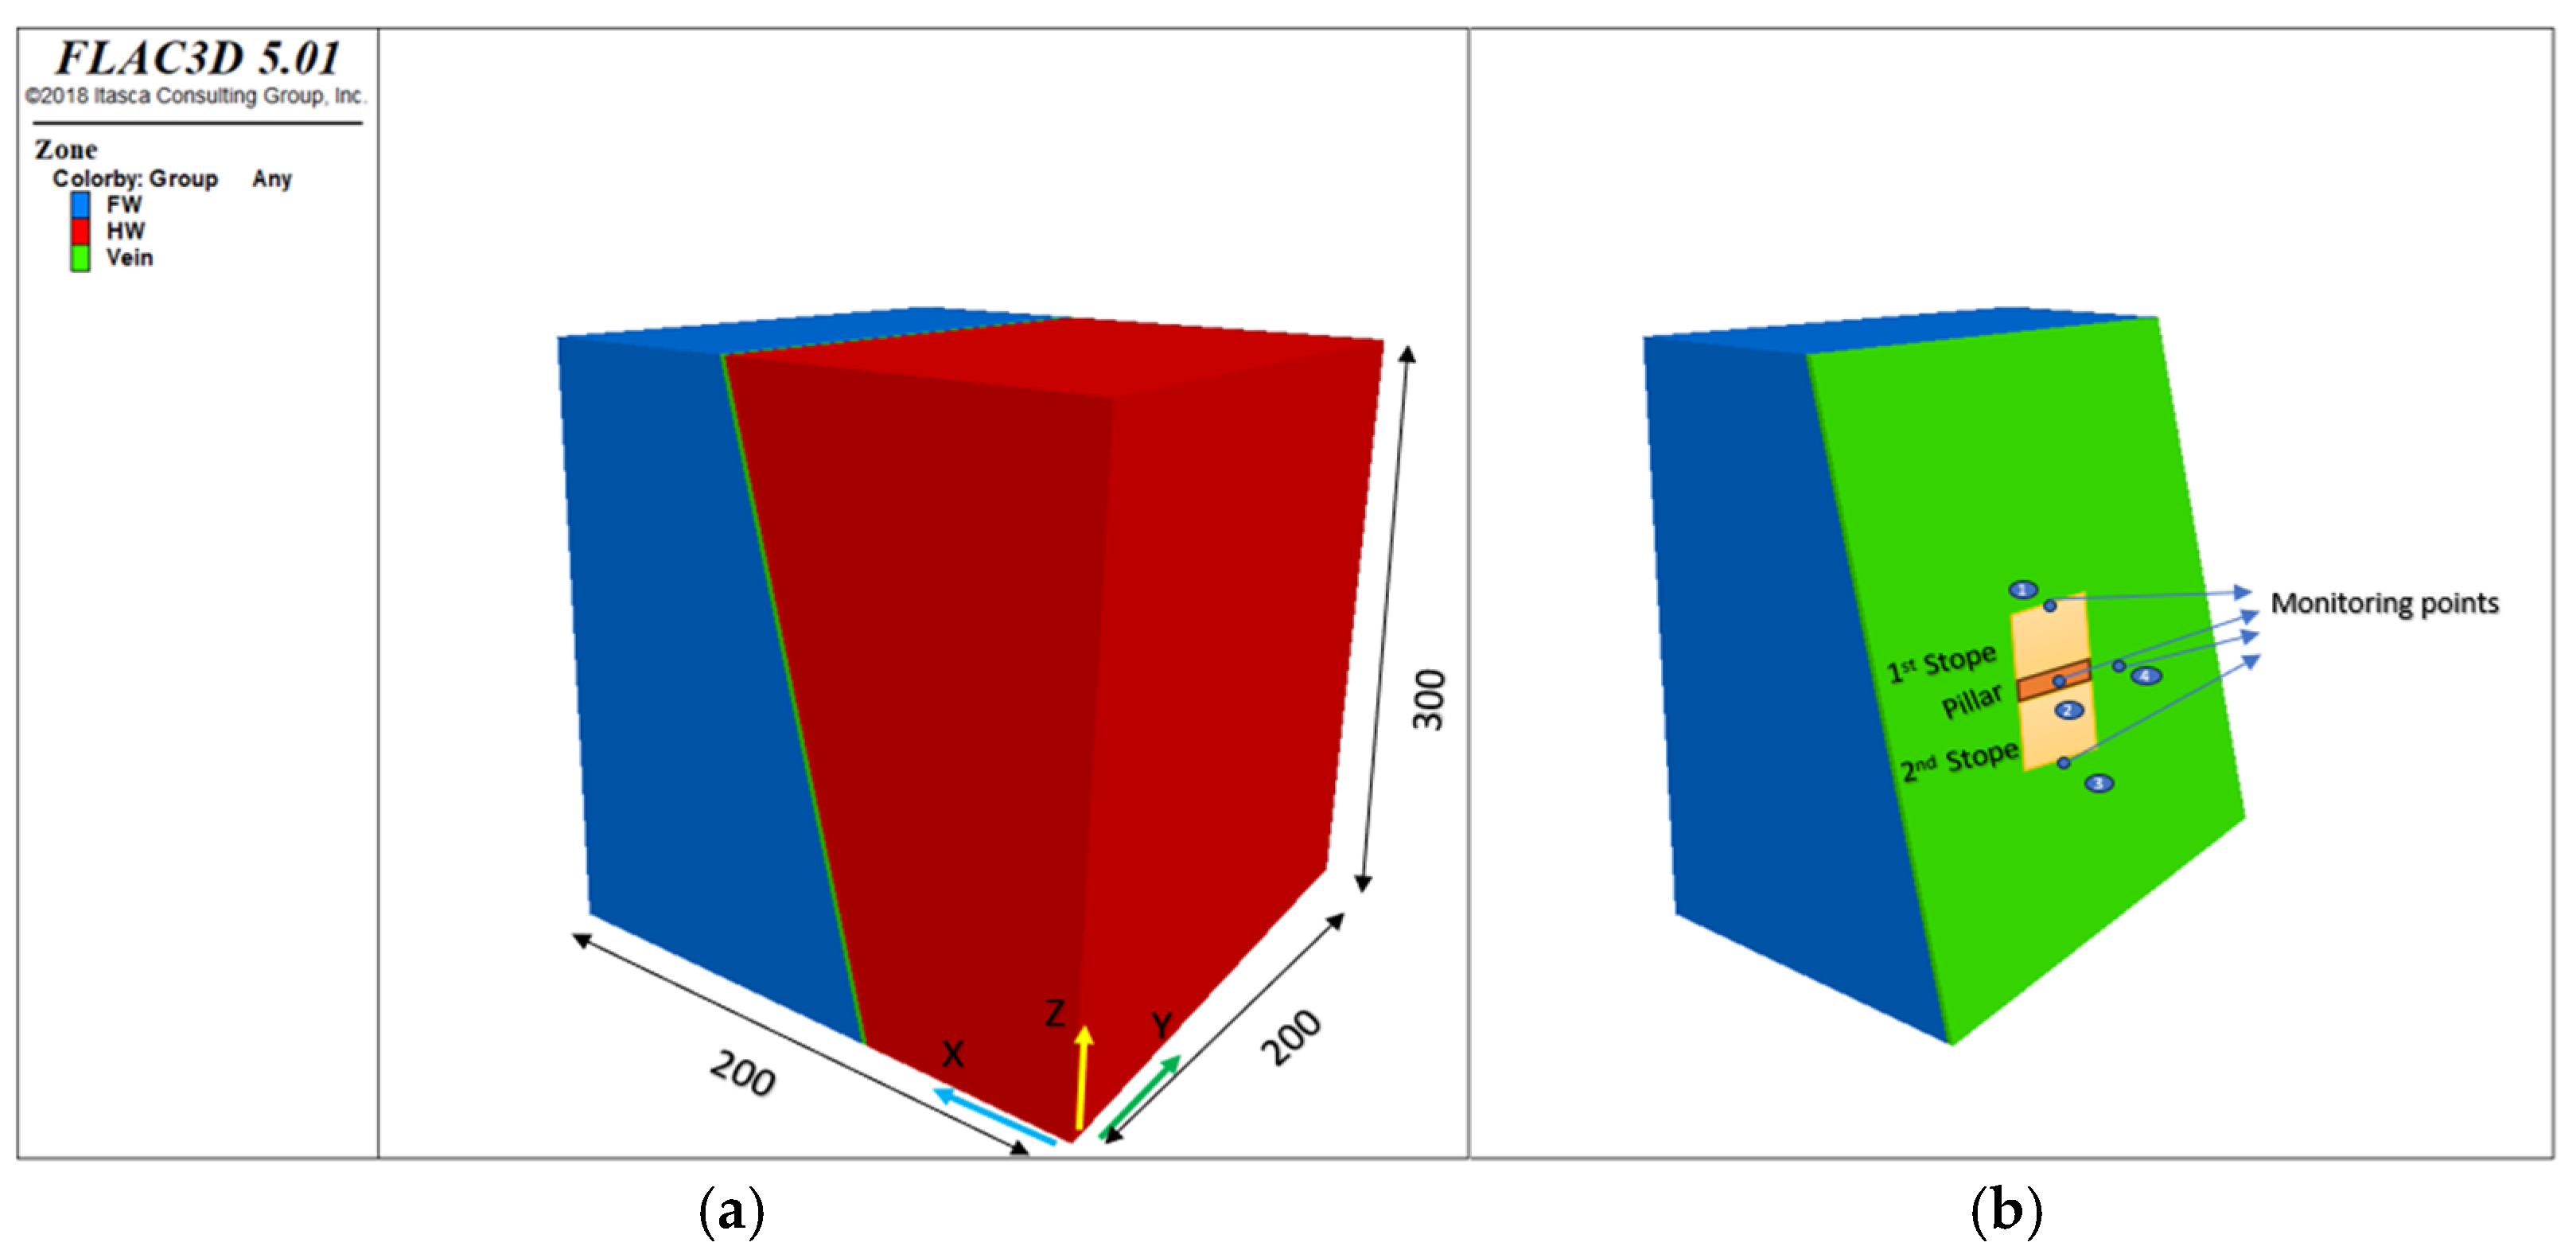
The FLAC3D model domain was 200 m × 200 m × 300 m (x, y, z), as shown in Figure 5, which was large enough to avoid boundary effects. Three zone groups were created: footwall, vein, and hanging wall. The vein is 2 m thick and dips at 75°. For mesh sensitivity analysis and because mesh density can significantly influence stress gradients and plastic zone development near excavation boundaries, particular attention was given to the vein–host rock interface. A basic mesh sensitivity analysis was conducted by considering two, four, and six zones across the 2 m thick quartz vein, corresponding to local mesh resolutions of 1.0 m, 0.5 m, and 0.33 m, respectively. The analysis showed that the difference in maximum displacement between the medium mesh (4 zones) and the fine mesh (6 zones) was less than 5%, indicating that the model response had become effectively mesh-independent.
Figure 5.
FLAC3D model geometry (Itasca Consulting Group, Inc., Minneapolis, MN, USA, 2012): (a) the full 200 × 200 × 300 m domain; (b) a close-up showing finer mesh around the two stopes and the pillar, with four monitoring points.
Based on these results, the mesh configuration with four zones across the vein thickness (local resolution ≈ 0.5 m) was adopted for all subsequent analyses, as it provided a reasonable balance between numerical accuracy and computational efficiency. The vein–host rock interface was modeled using a similar local mesh resolution to adequately capture stress redistribution and localized yielding around the excavation boundaries. All models reached a stable equilibrium under the standard FLAC3D convergence criterion. For future site-specific back-analyses aimed at quantitative support design, an even finer grid could be considered, but the present mesh is sufficient for the comparative parametric design objectives of this study.
3.2.3. Mining Sequence
The mining sequence was simulated in three stages:
- ⮚
- Initial Equilibrium: the model was solved to equilibrium under initial stresses.
- ⮚
- Excavation: the two stopes were excavated simultaneously by setting vein zones to model null. Stope A (lower) went from z = 90 to 144 m, and Stope B (upper) from z = 150 to 204 m, leaving a 6 m pillar between them (z = 144–150 m).
- ⮚
- Caved Rock placement: Then, the excavated zones were filled with caved rock material, and the model was solved to equilibrium.
A simultaneous excavation scheme was adopted for simplicity; this represents a conservative loading scenario compared with a sequential top-down mining sequence, which is the normal practice at the Zarmitan mine. The parametric sensitivity analysis over a range of stress ratios and geometries ensures that the final design recommendations are robust to the assumed extraction order. Stand-up time, exposure-dependent degradation, and creep are not explicitly captured. The empirical Mathews stability graph implicitly incorporates the effect of typical mining exposure times through its database of real case histories; however, the ‘transitional’ zone highlighted in our empirical predictions is particularly sensitive to exposure duration. Creep is not expected to be a dominant mechanism in the hard, brittle granosyenite at the current mining depth of 500 m, but its importance may increase at greater depths.
3.2.4. Monitoring and Outputs
The following monitoring points were placed at key locations (Figure 5b) to evaluate stope stability in all simulation cases. These points record displacements throughout the modeling. The main monitoring points are as follows:
- P1: Upper stope roof;
- P2: Pillar center;
- P3: Lower stope footwall;
- P4: Hanging wall.
For each case, the following values were extracted:
- Maximum roof displacement (from point P1);
- Pillar compression (from point P2);
- Footwall rebound (from point P3);
- Hanging wall displacement (from point P4);
- Peak major (σ1) and minor (σ3) principal stresses in critical zones (pillar, hanging wall, and roofs), yield state plots.
4. Results and Discussion
Before showing the full parametric study, we first need to understand how the stopes behave under different stress conditions. The baseline case represents the planned mining layout at 520 m depth, using the stress ratios described in Section 2.2. After excavation, the voids were filled with caved rock material. For each case, we look at the yield state, the major and minor principal stresses, and the displacement. Finally, we combine the findings into practical design recommendations and compare them with the empirical results from Section 3.1.
4.1. Baseline Cases
Three baseline cases were analyzed to see how the stress ratio affects stope stability. These are: the isotropic reference case (K = 1.0), the value measured at the site (K = 1.4) [2,6], and a conservative high-stress case (K = 2.0).
4.1.1. Isotropic Stress Condition
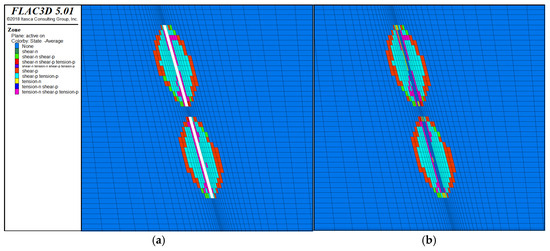
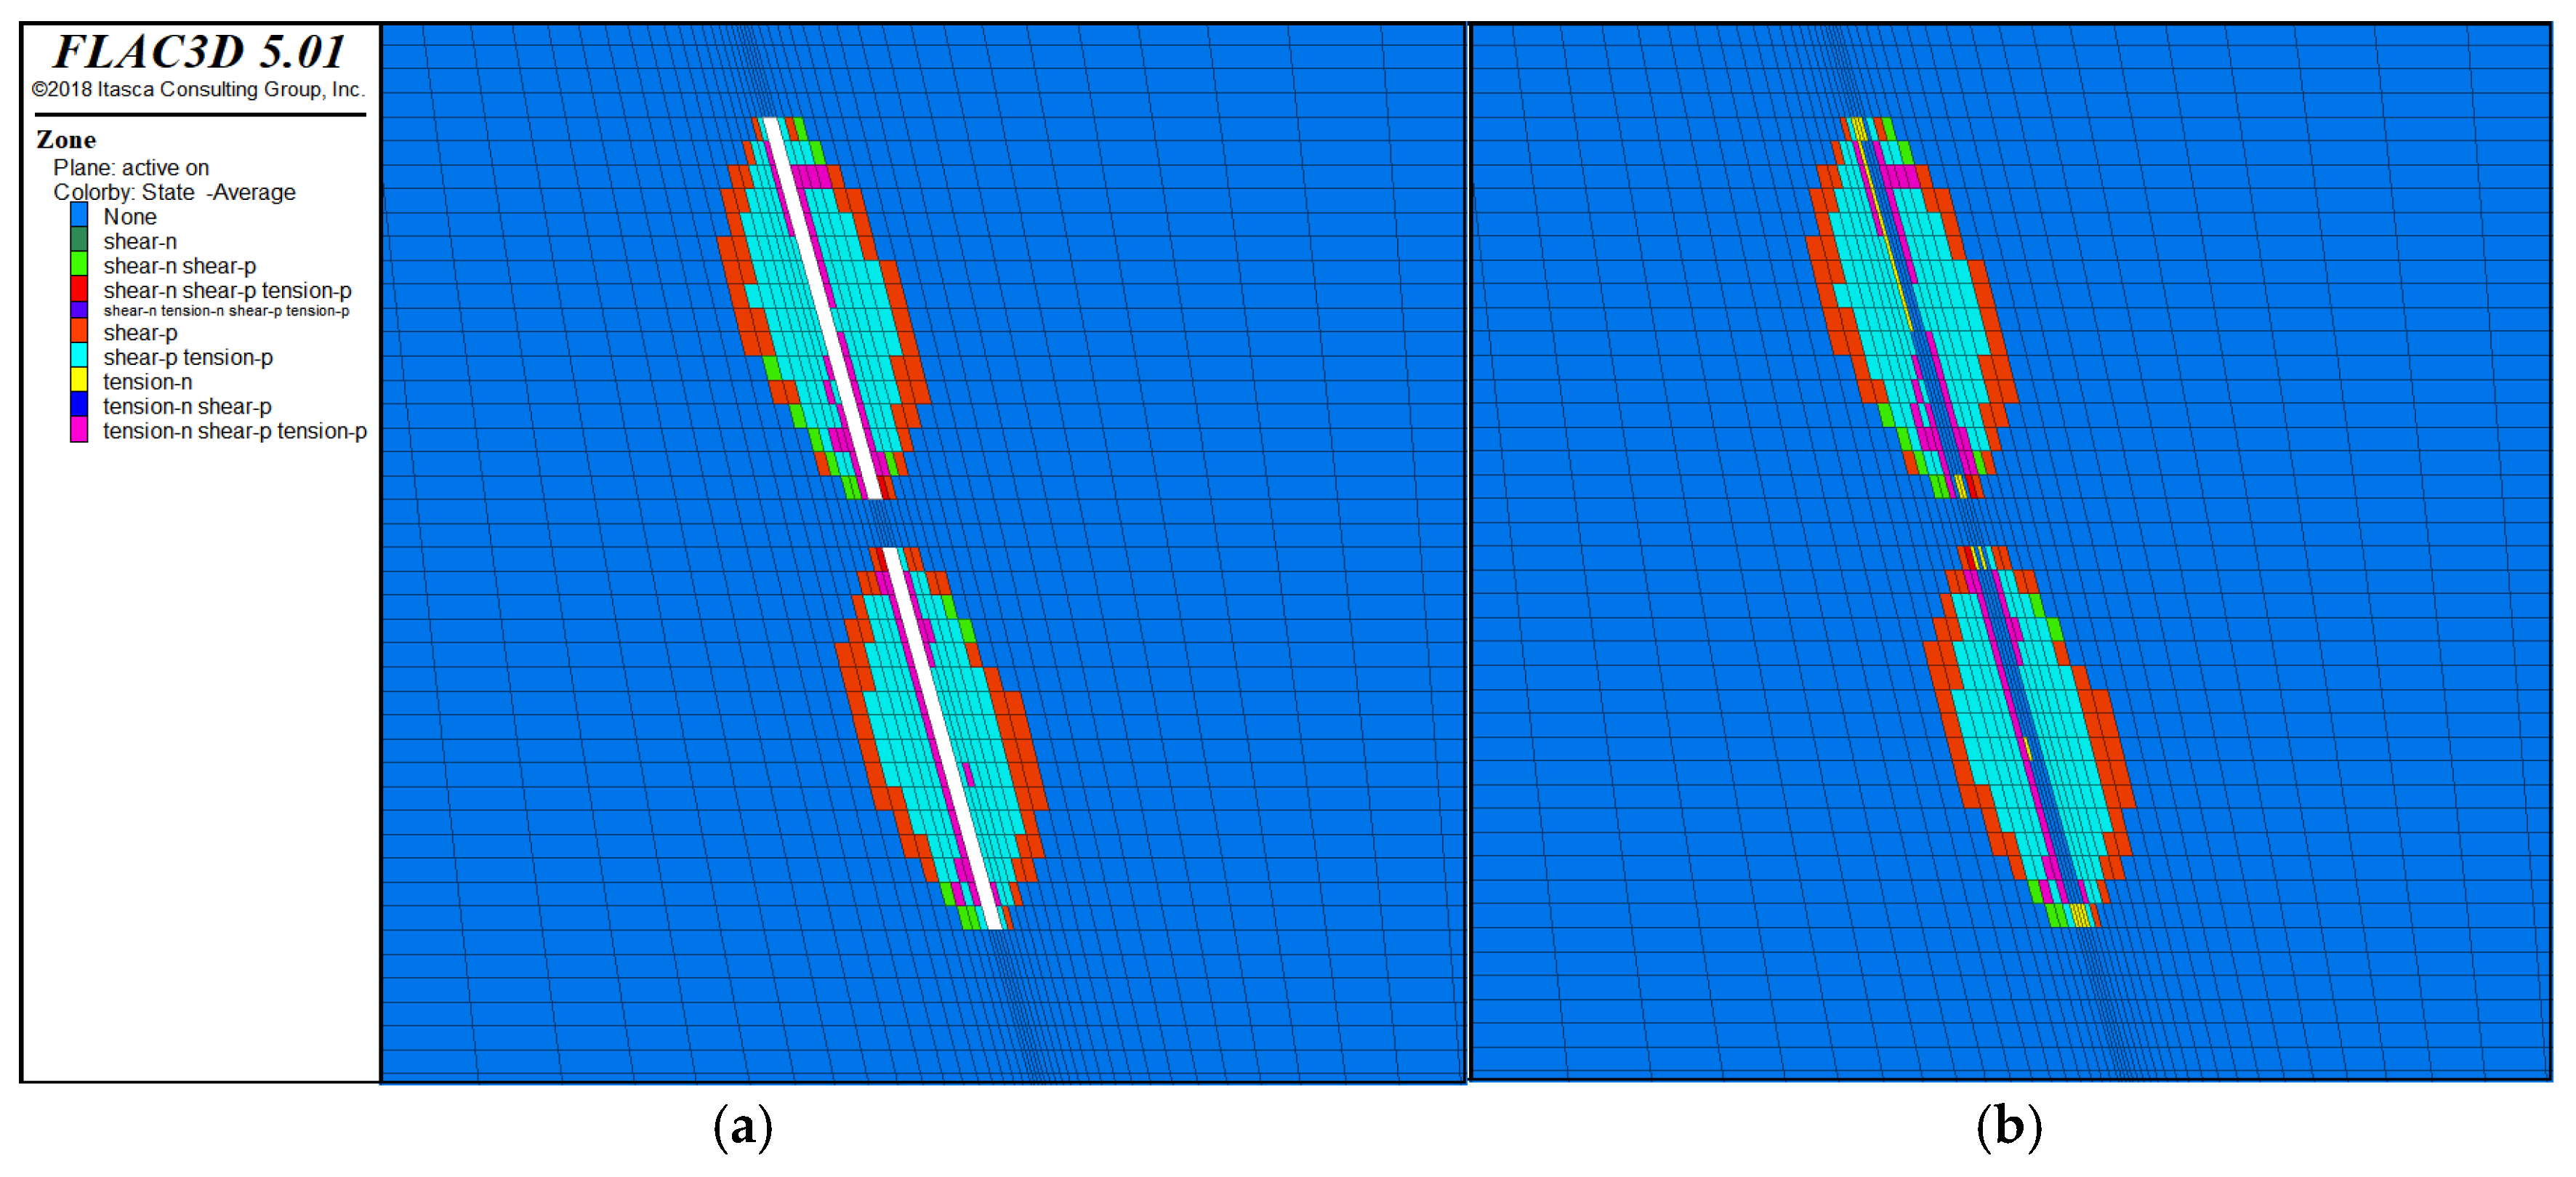
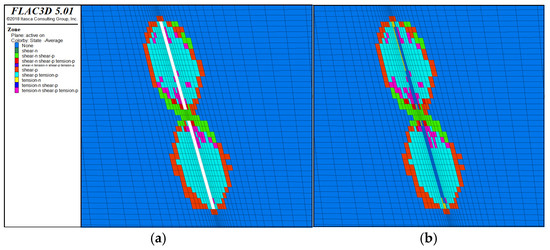
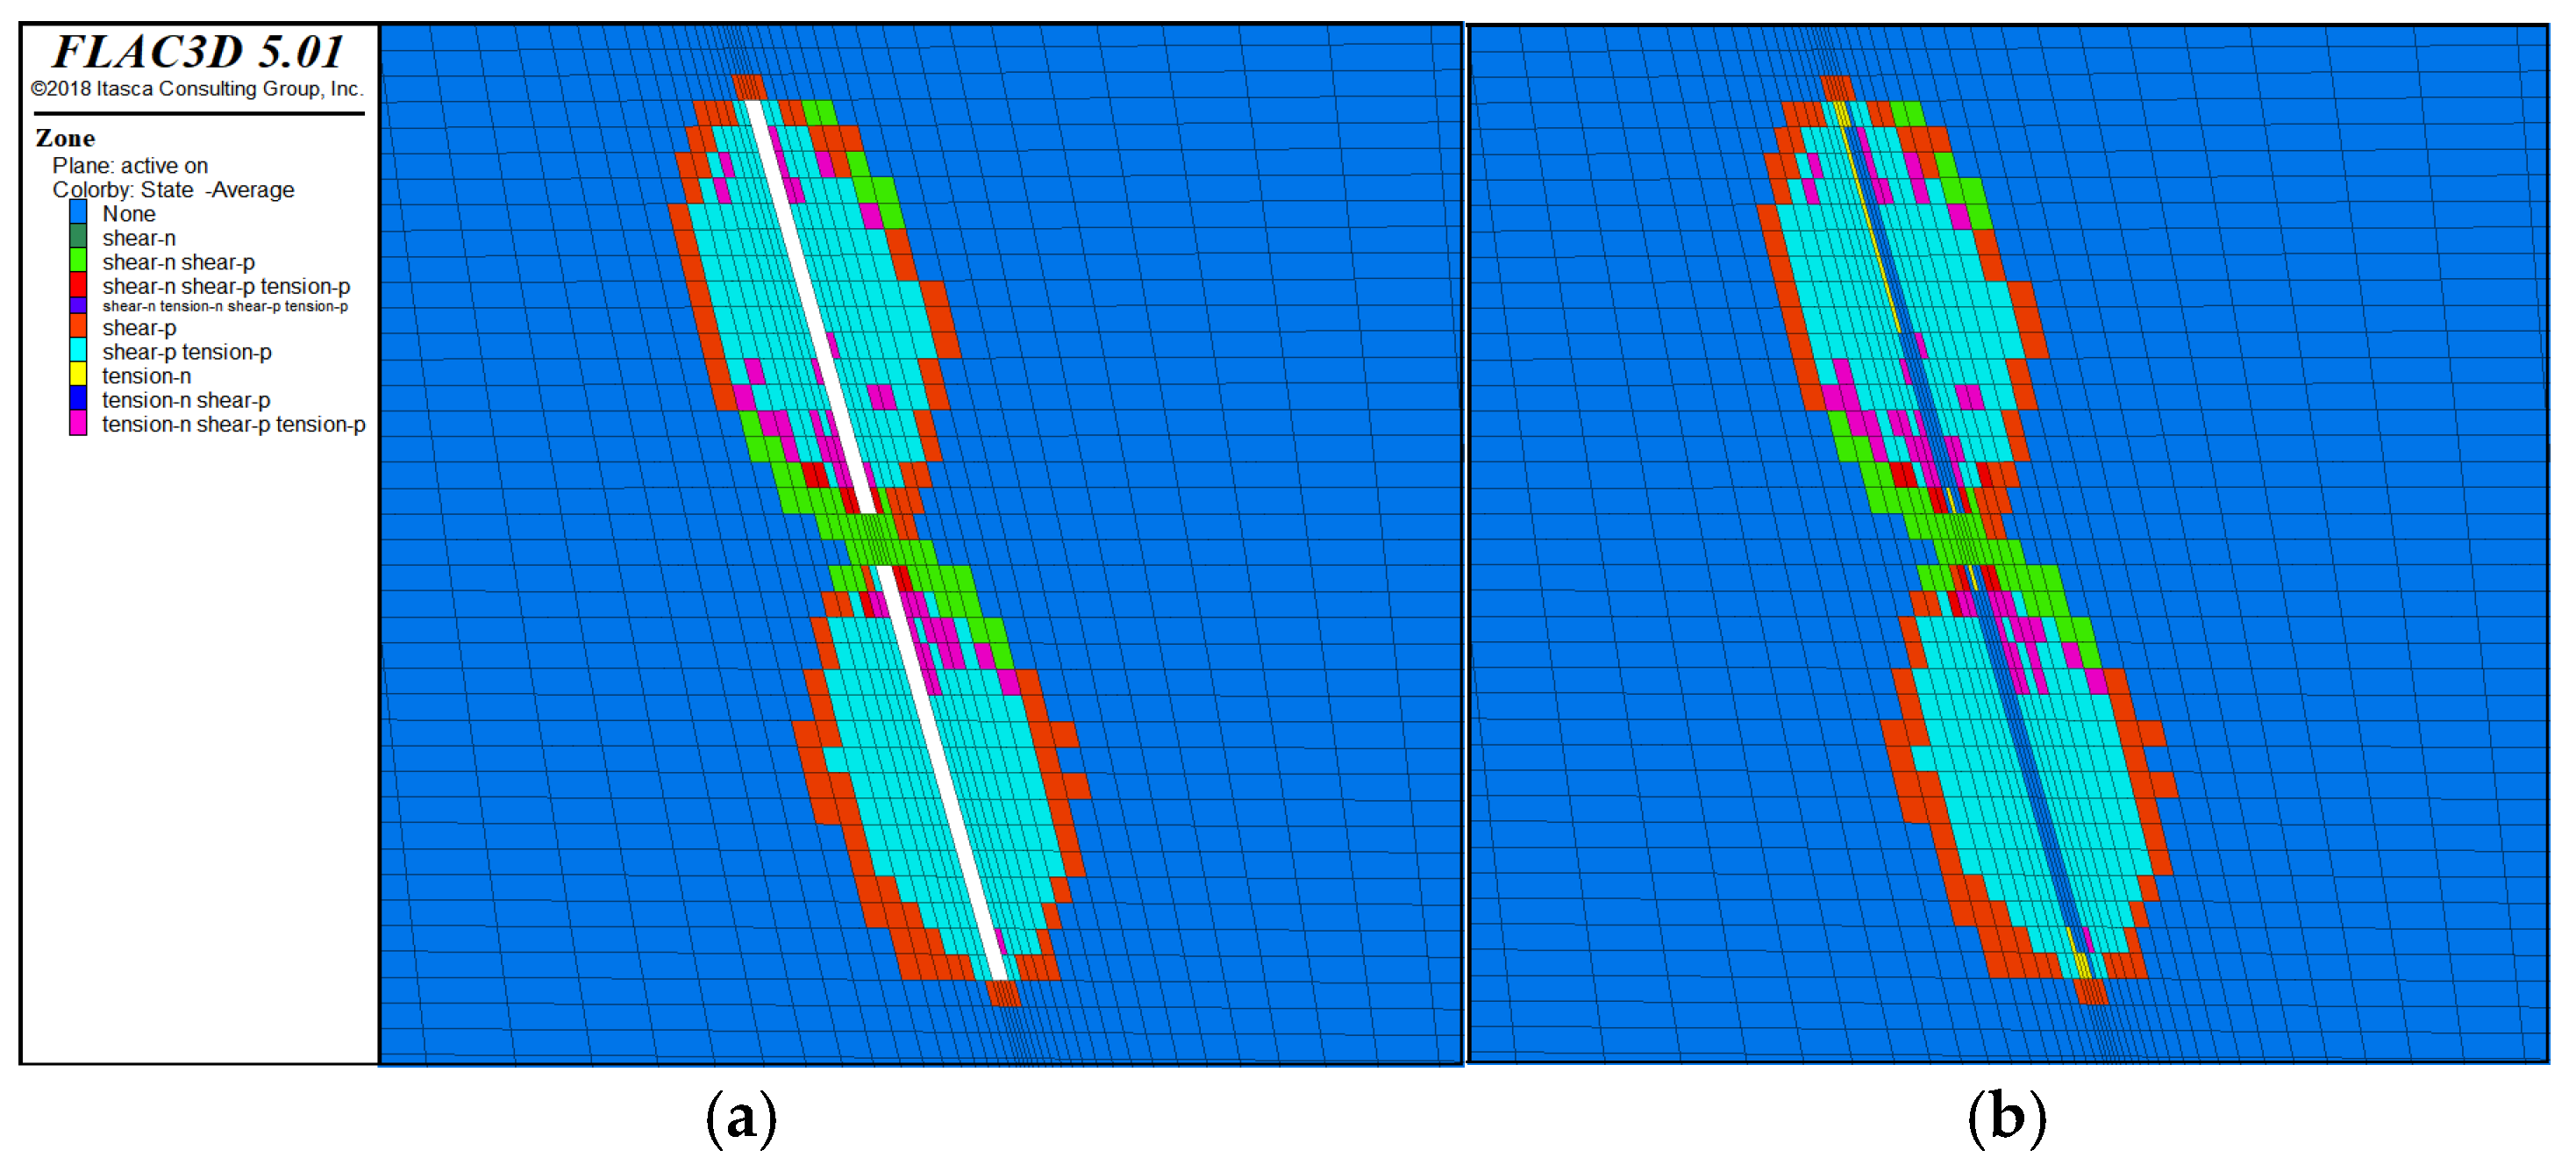
Figure 6 shows the yield state after excavation and after filling with caved rock for the isotropic case. After excavation (Figure 6a), the pillar and the surrounding rock exhibit a combination of shear failure and tensile failure (“shear-p tension-p”), and with an obvious “shear-n shear-p tension-p” zone extending through the pillar and into the hanging wall. This indicates that both active shear and tensile mechanisms are prompted immediately upon excavation. After the caved rock is placed (Figure 6b), the active shear zones in the pillar are reduced, and many areas convert to “shear-p” (past shear) or “none”. This shows that the granular fill provides passive confinement that captures further shear failure in the pillar. However, tensile failure in the hanging wall remains largely unchanged; the “tension-n” zones persist and even extend slightly. The broken material adds some confinement but does not restore rock that has already failed in tension.
Figure 6.
Yield state plots for K = 1.0 (L = 50 m, t = 6 m): (a) after excavation, (b) after caved rock fill.
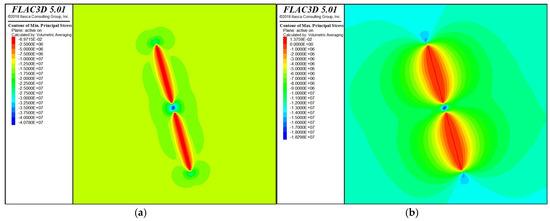
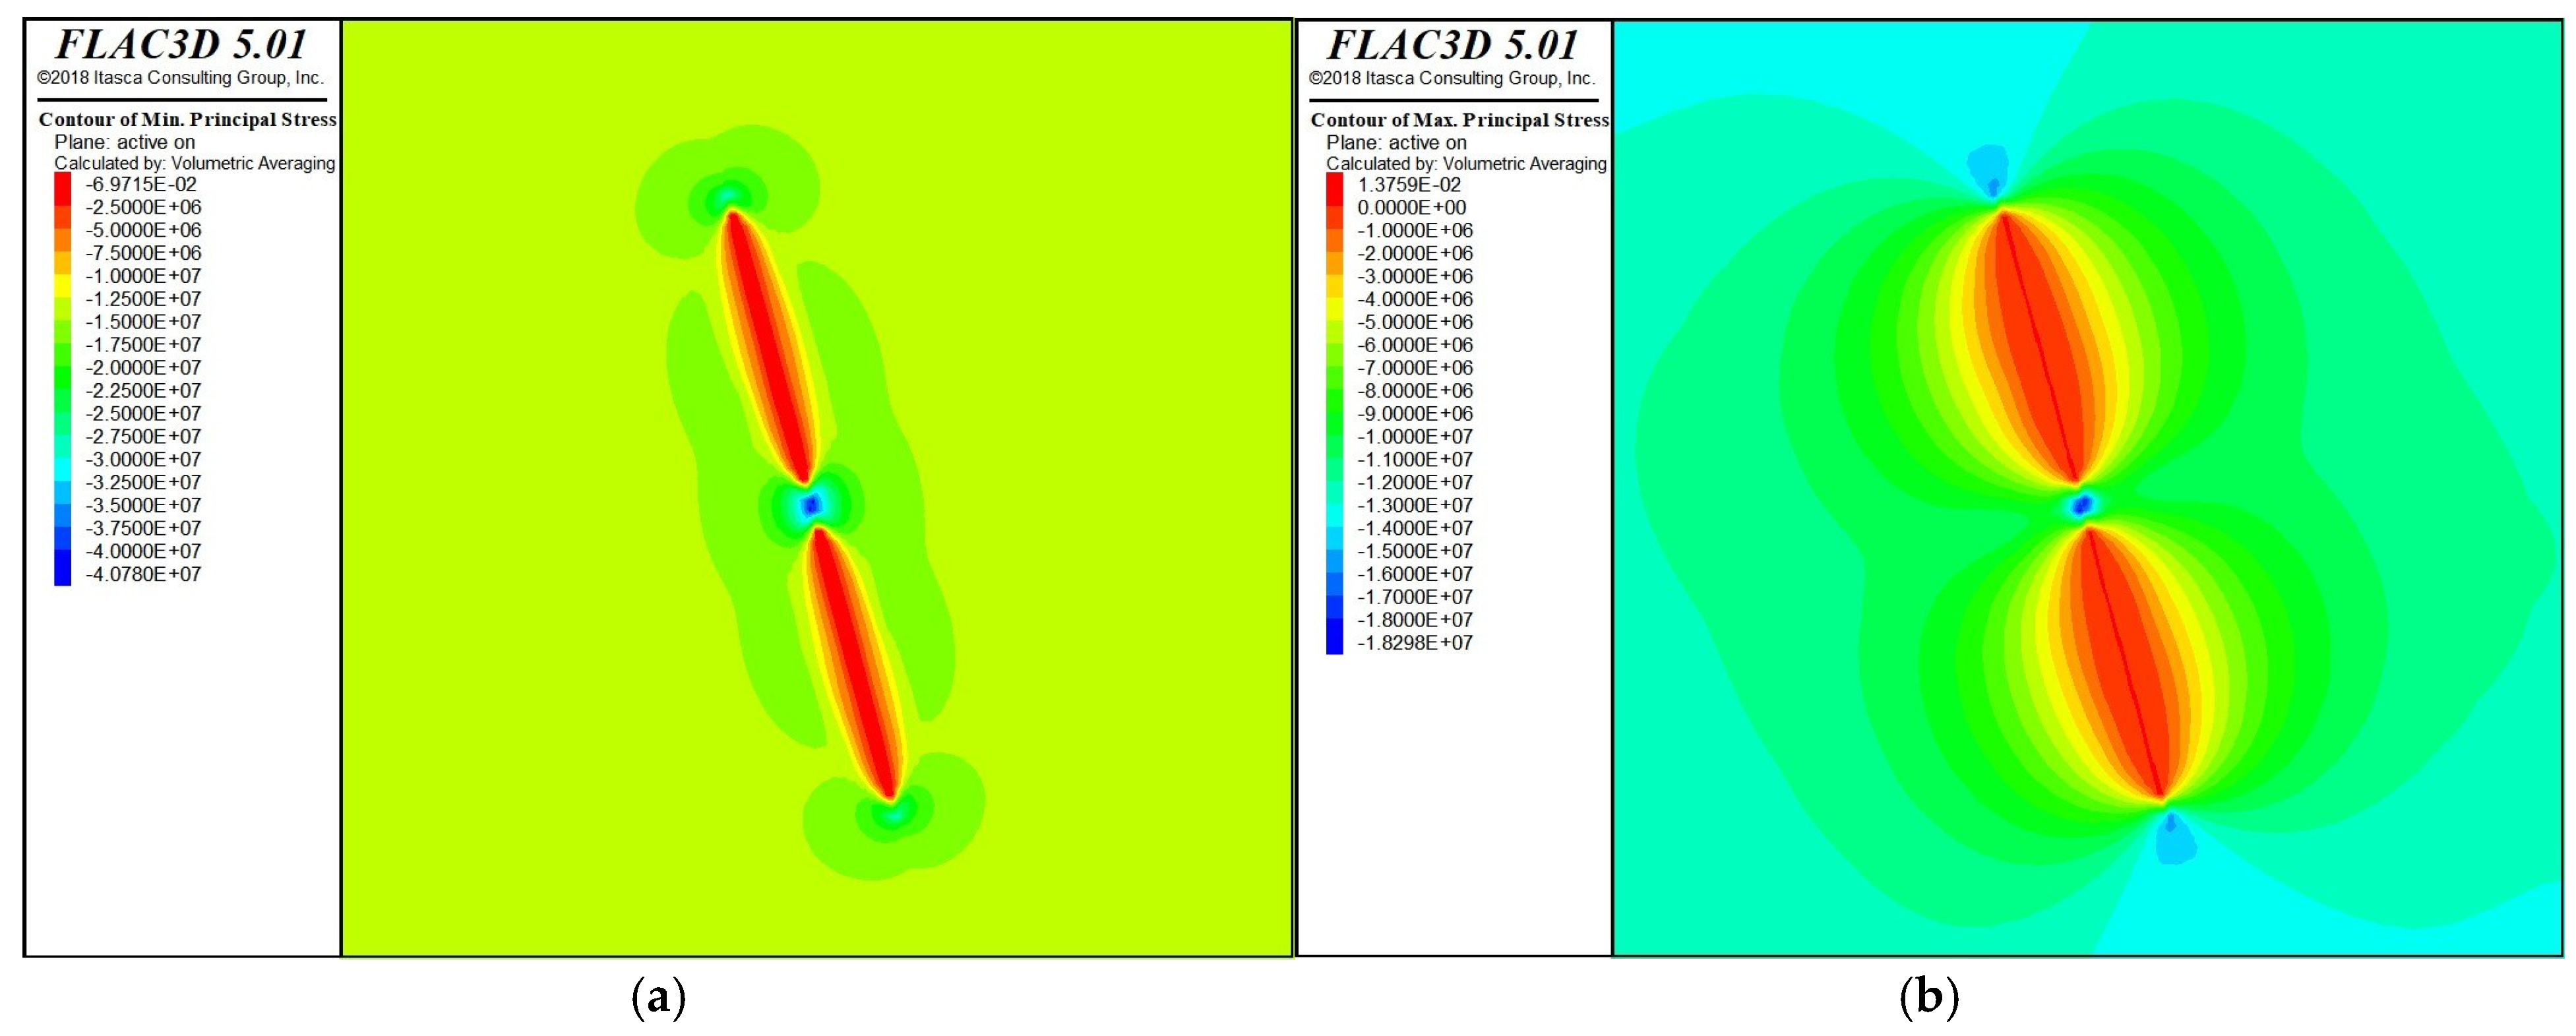
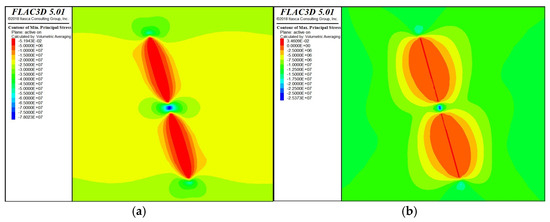
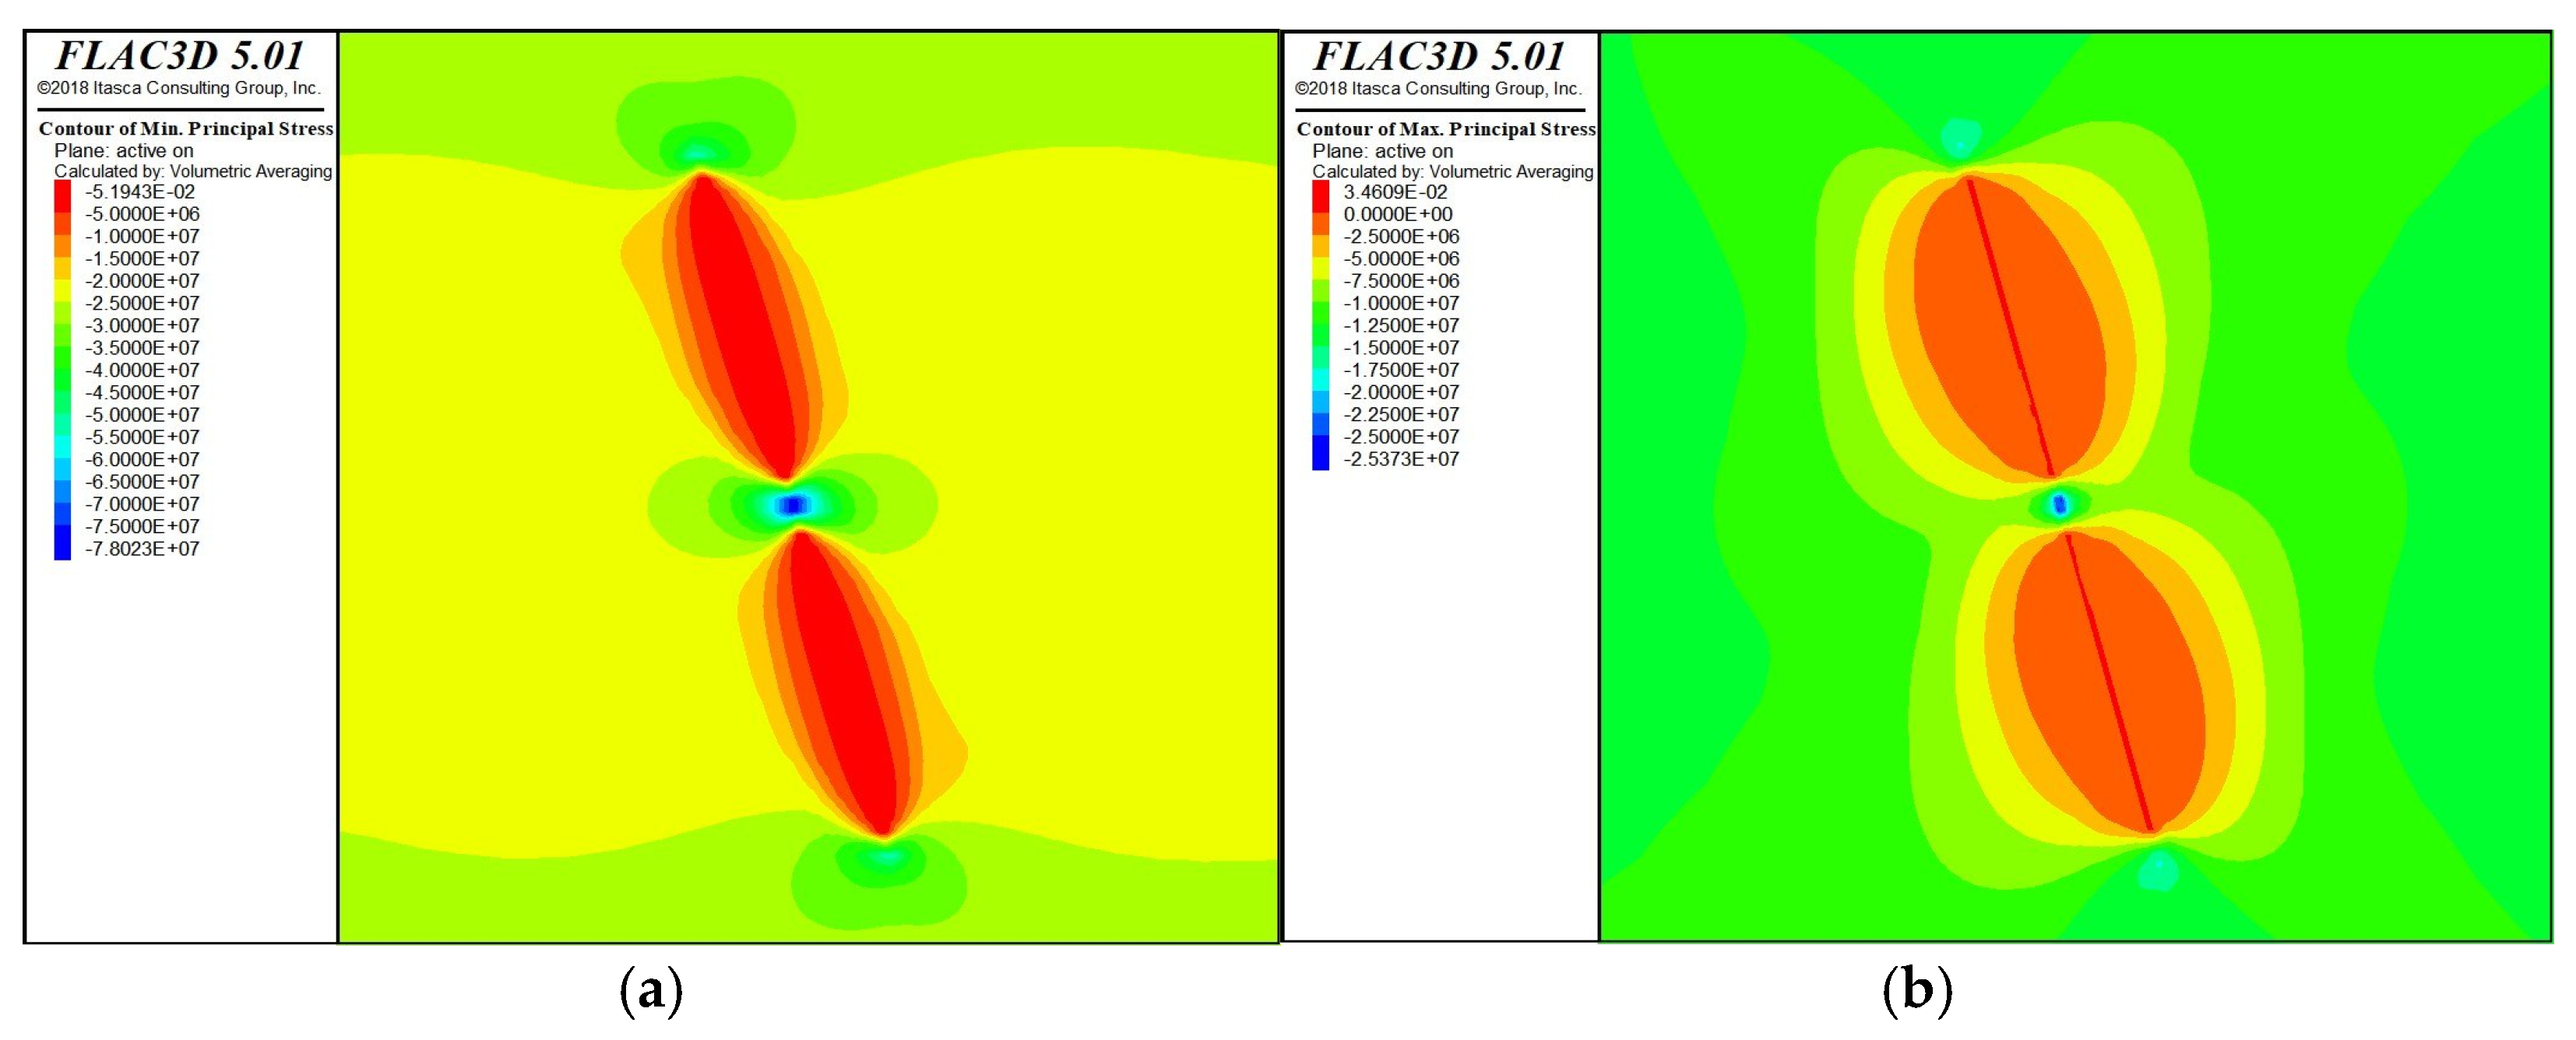
The minimum principal stress (σ1) contours (Figure 7a) show a strong stress concentration in the pillar, reaching −40.8 MPa (compressive). This is approximately 3.0 times the in situ vertical stress of 13.5 MPa, indicating that the pillar is significantly loaded even under isotropic conditions. The maximum principal stress (σ3) contours (Figure 7b) reveal a small tensile zone in the hanging wall, with a peak value of +0.0138 MPa. Although this tensile stress is modest, the rock mass is jointed (unfavorable joint orientation described in Section 3.1.3) and has a very low effective tensile strength, which explains why tensile failure (“tension-n” in Figure 6) occurs there even at such low tension.
Figure 7.
Principal stress contours for K = 1.0: (a) minimum principal stress (σ1), (b) maximum principal stress (σ3).
These results match well with the empirical stability graph predictions (from Section 3.1.4): the hanging wall is identified as the most critical surface, and the presence of tensile failure in the simulation supports the empirical prediction that the hanging wall requires support. However, the empirical method could not show how large the yielded zones were or capture the full 3D stress redistribution and pillar-stope interaction, which is a clear advantage of the numerical approach.
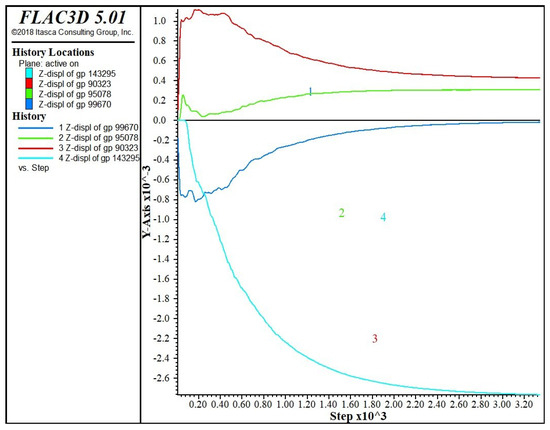
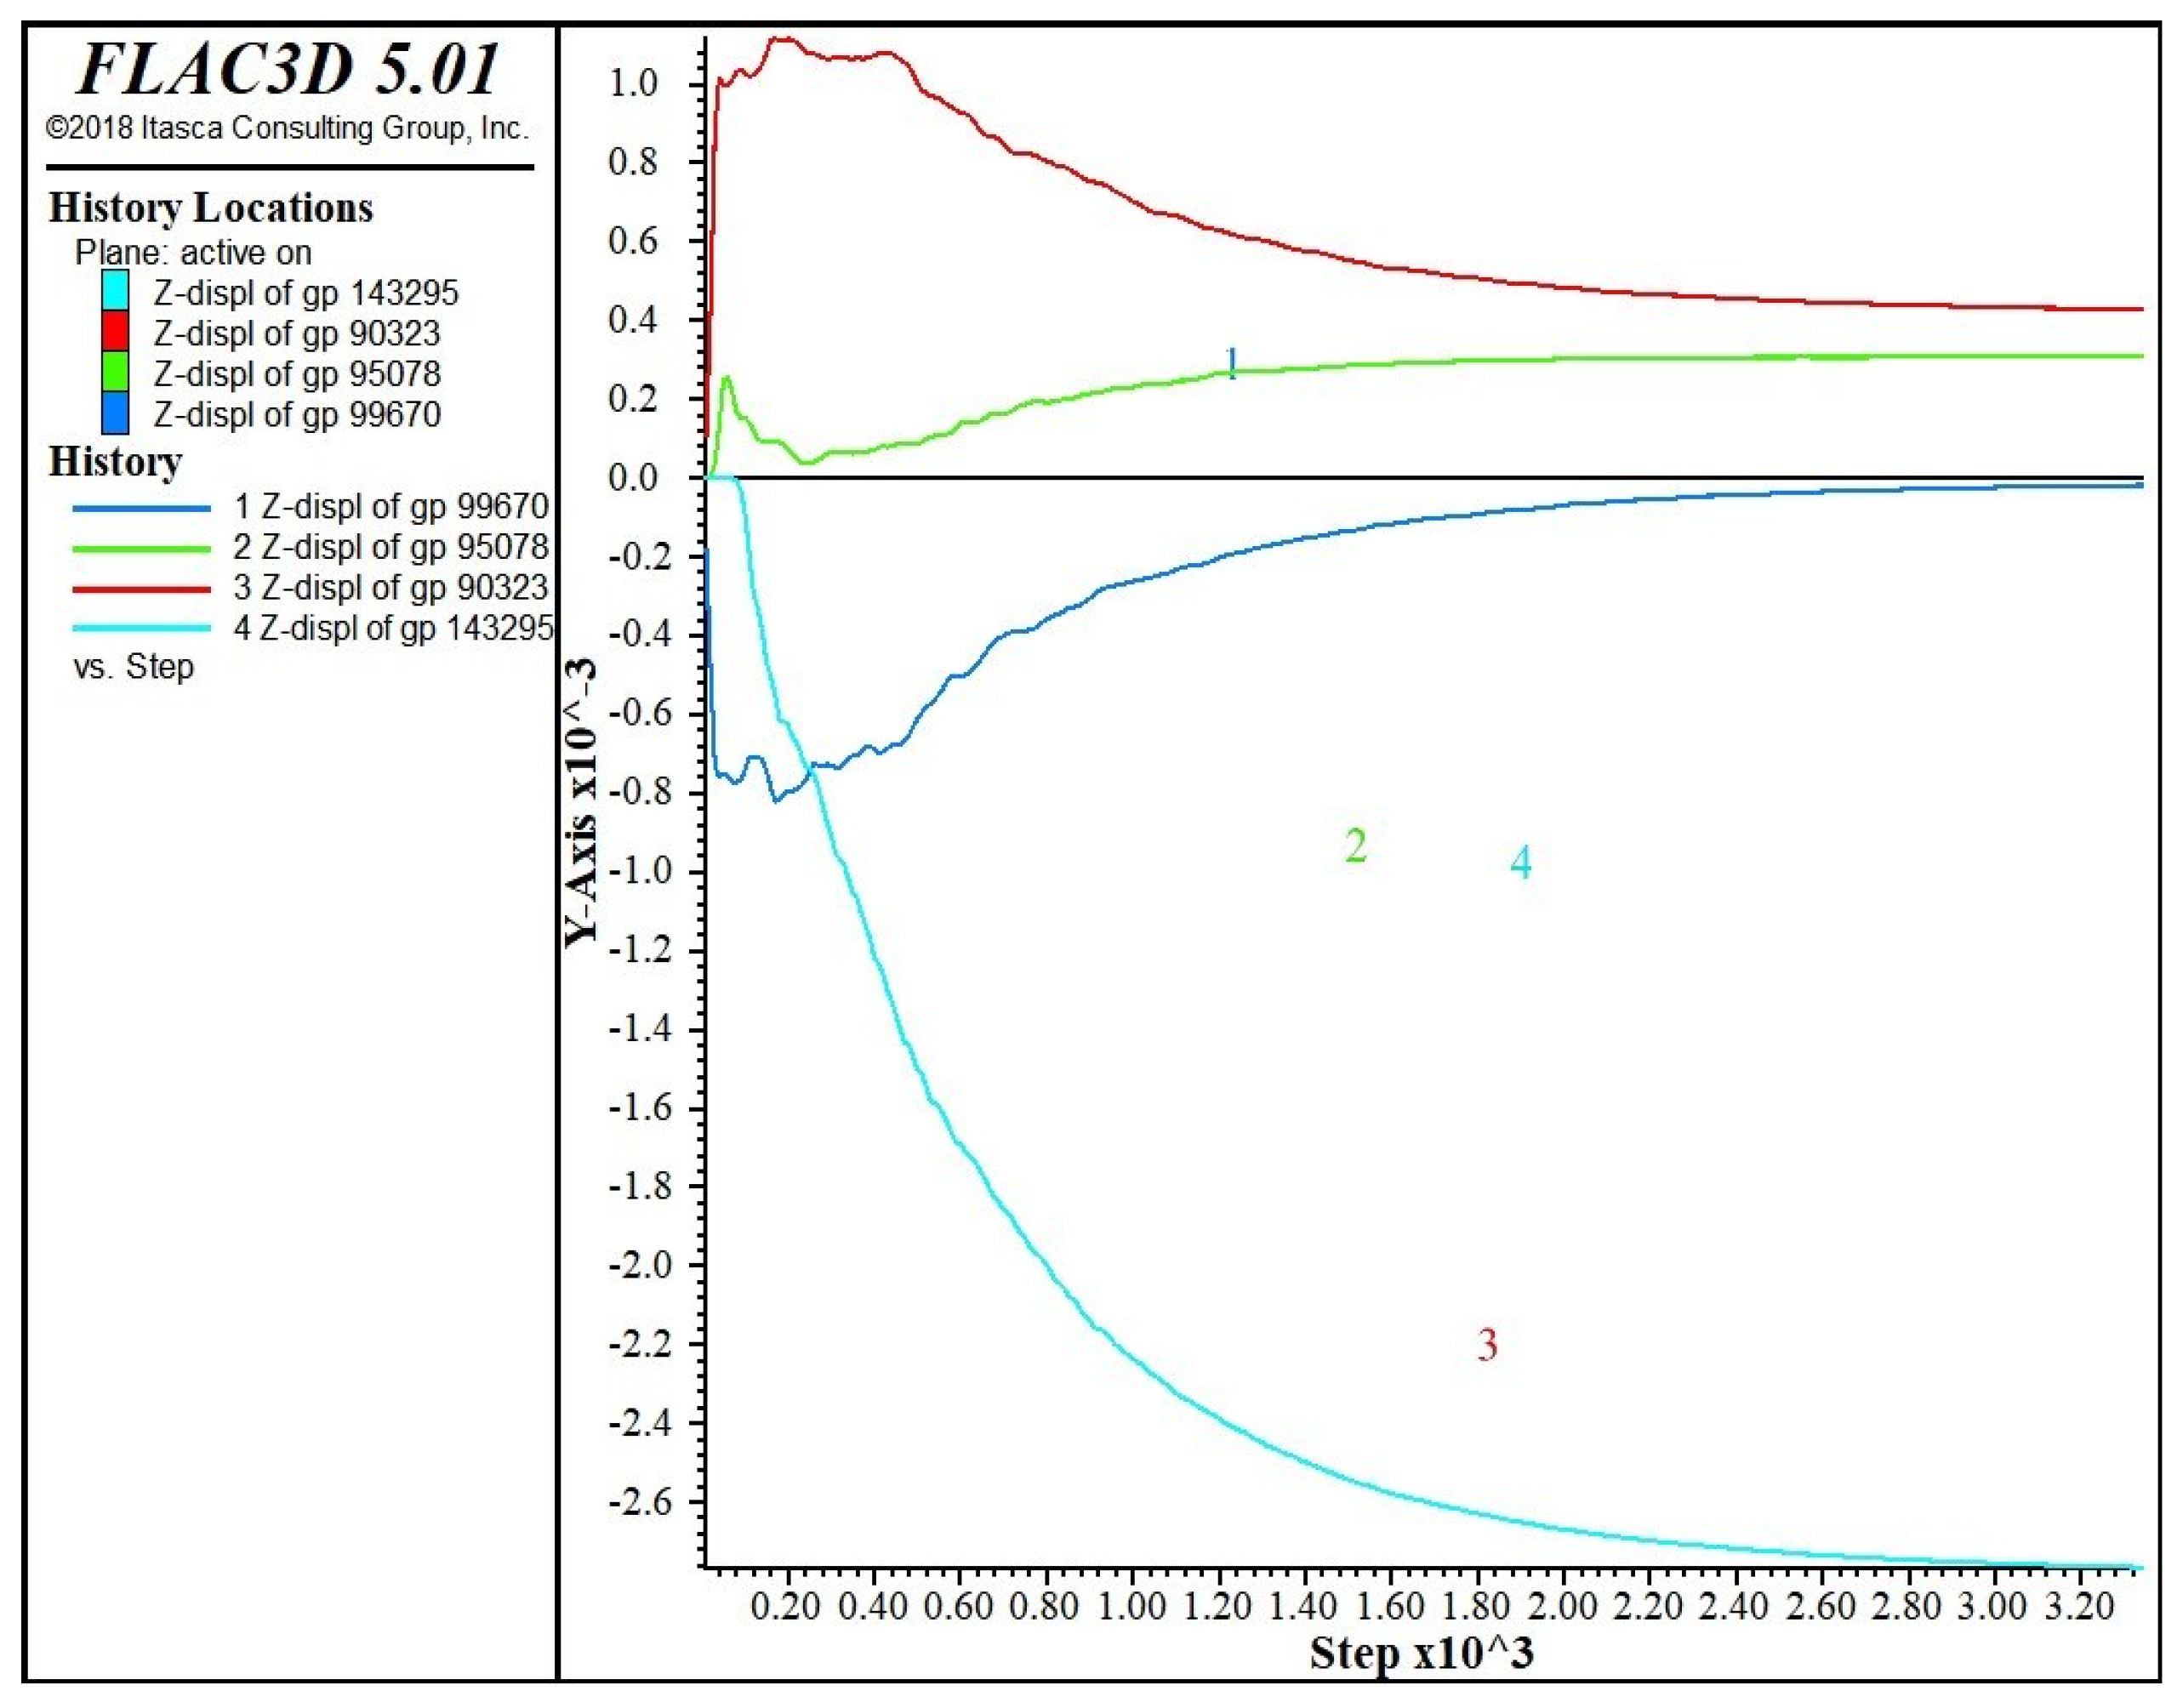
The displacement histories (Figure 8) show the evolution of vertical movement at the four monitoring points. By the end of the simulation (step 3340), the upper stope roof (P1) settled downward by −0.18 mm. The pillar center (P2) was displaced upward by 0.31 mm, indicating a minor elastic rebound; the actual pillar compression is negligible. The lower footwall (P3) lifted by 0.43 mm, typical of footwall rebound after excavation. The newly added hanging wall point (P4) shows a downward displacement of −2.77 mm, confirming that the hanging wall is the most deformable region, consistent with the tensile failure zones observed in Figure 6. All displacements stabilize after the caved rock is placed, indicating that the model reaches equilibrium and the granular fill provides passive confinement.
Figure 8.
Displacement histories for K = 1.0 showing vertical displacement at (P1) upper roof, (P2) pillar center, (P3) lower footwall and (P4) hanging wall.
4.1.2. Measured Stress Condition
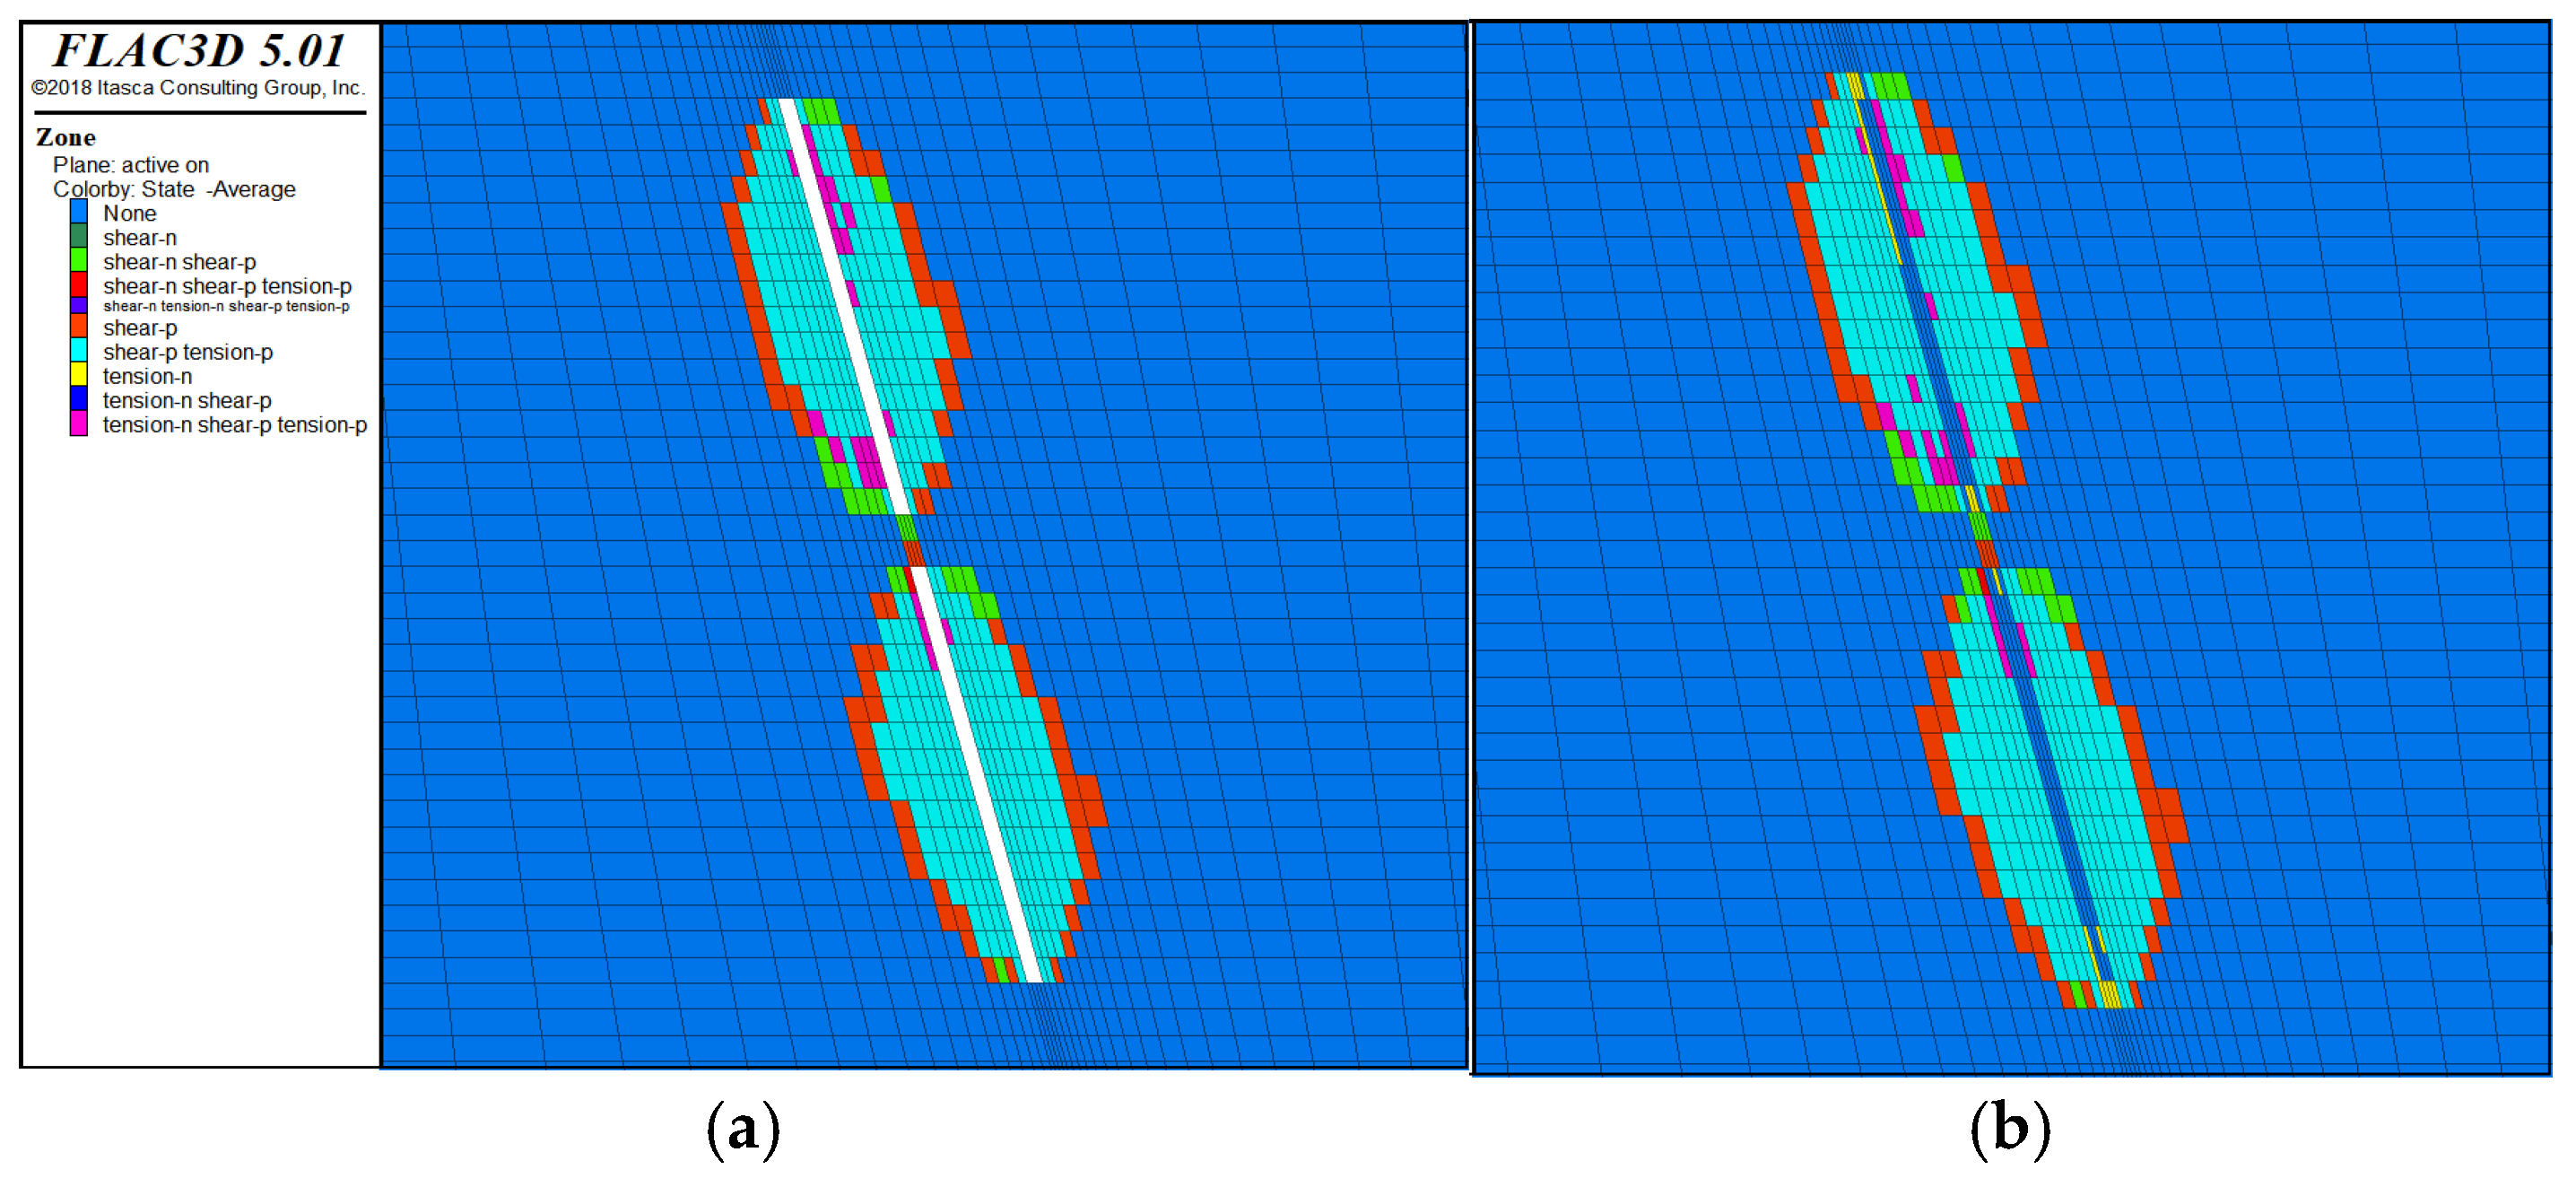
Figure 9 shows the yield state for K = 1.4, which is the upper bound of the measured in situ stresses at Zarmitan [2,6]. After excavation (Figure 9a), the pillar is divided into two distinct zones, approximately half shows “shear-n shear-p” (active ongoing shear failure mixed with past shear), while the other half shows only “shear-p”. This indicates that the pillar is already noticeably yielding, but active shear failure is not uniform throughout. The hanging wall exhibits “shear-n shear-p tension-p” (past tensile failure) near both stopes, with minor “shear-n shear-p” zones. After caved rock fill (Figure 9b), the pillar remains unchanged, and the same “shear-n shear-p” and “shear-p” zones persist, meaning the granular fill does not arrest active shear in the pillar. However, in the hanging wall, “tension-n” (active tension) appears and expands in the upper and lower parts of the stopes, while other areas stay as before. The fill, therefore, provides little benefit to either the pillar or the hanging wall under this stress condition. These results show that caved rock does not stop active shear failure in the pillar at K = 1.4. Independent support for both the pillar and the hanging wall is essential.
Figure 9.
Yield state plots for K = 1.4 (L = 50 m, t = 6 m): (a) after excavation, (b) after caved rock fill.
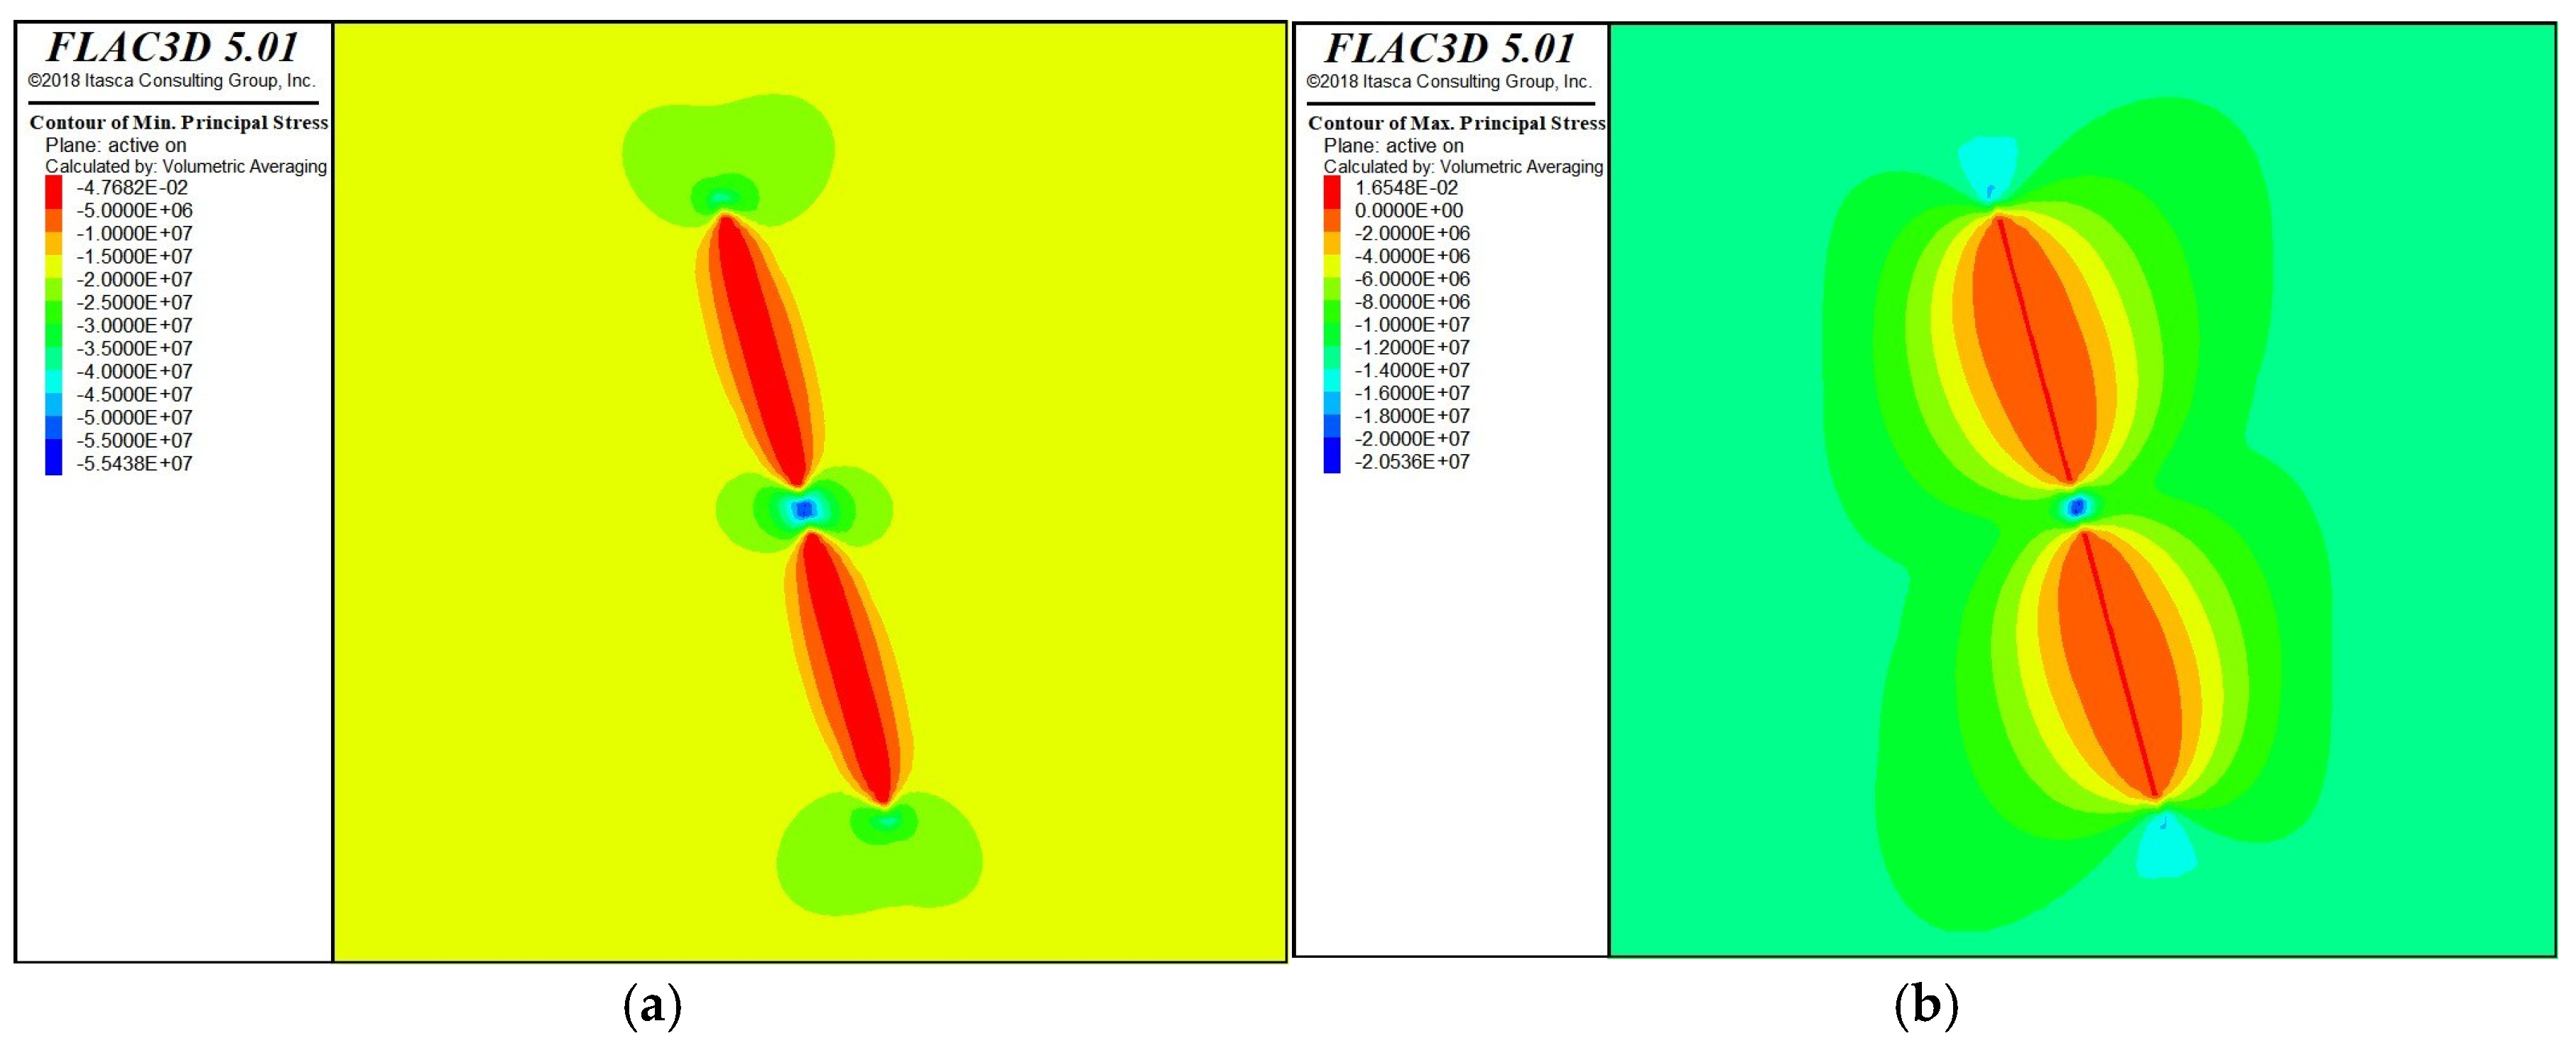
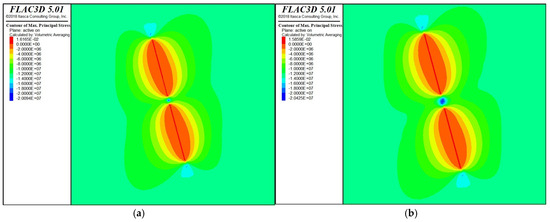
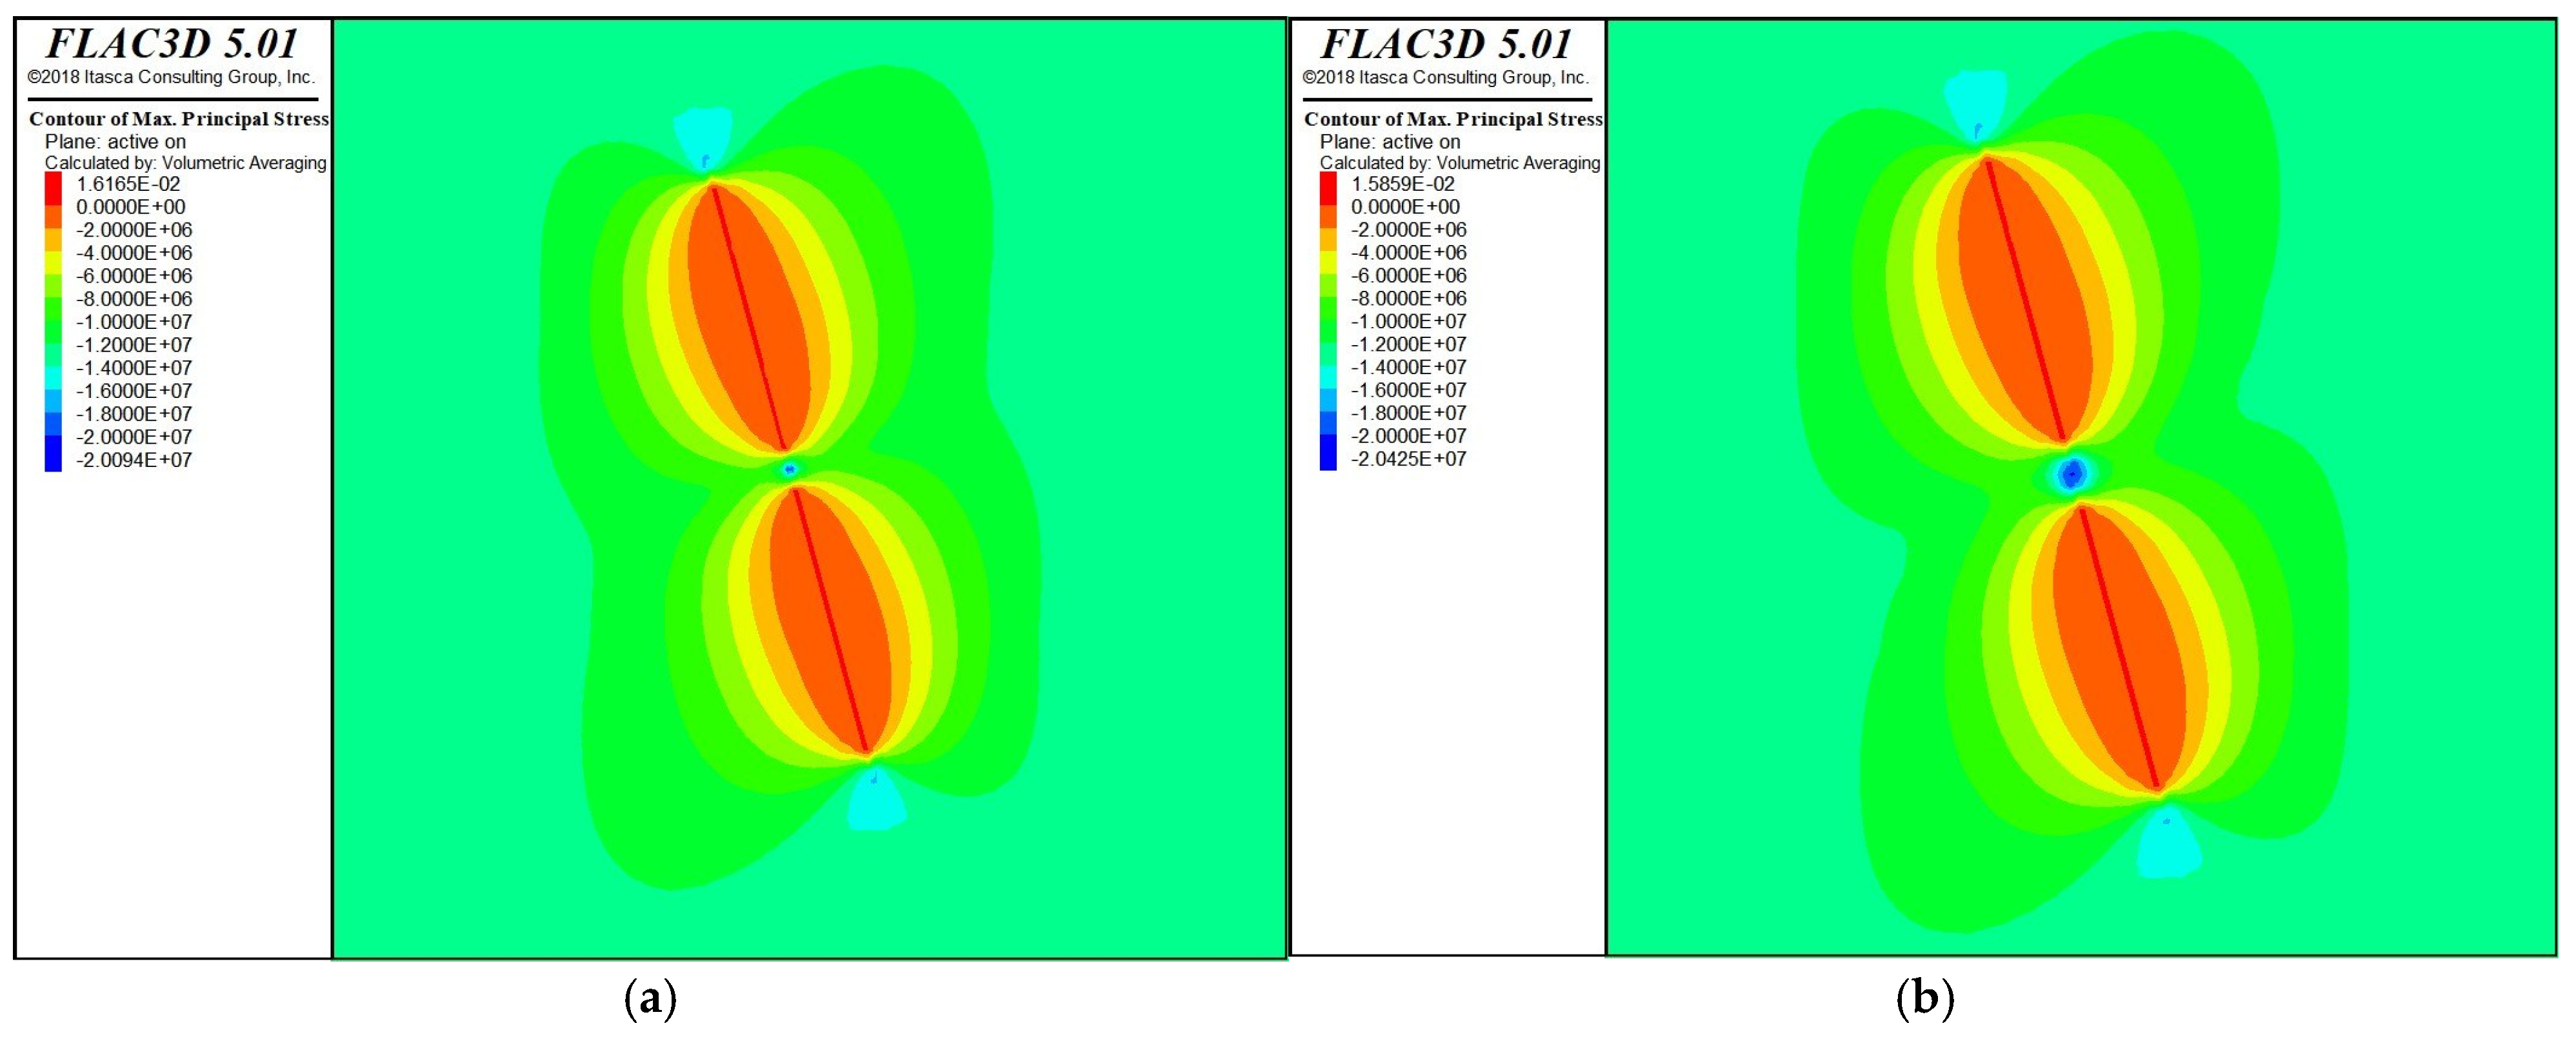
The minimum principal stress (σ1) contours (Figure 10a) show that the peak compressive stress in the pillar reaches −55.4 MPa, which corresponds to a stress concentration factor of approximately 4.1 relative to the in situ vertical stress of 13.5 MPa. This represents a 36% increase compared to the isotropic case (−40.8 MPa), clearly demonstrating how higher horizontal stress (K = 1.4) significantly increases the load on the pillar. The maximum principal stress (σ3) contours (Figure 10b) reveal a small tensile zone in the hanging wall, with a peak value of +0.0166 MPa. Although this tensile stress is modest, the rock mass is jointed (unfavorable joint orientation described in Section 3.1.3) and has a very low effective tensile strength. The presence of any tension, even at this low magnitude, can trigger tensile failure along unfavorably oriented discontinuities. This explains why the hanging wall exhibits active “tension-n” zones in Figure 9b. The hanging wall, therefore, remains a critical stability concern under the measured stress conditions.
Figure 10.
Principal stress contours: (a) minimum principal stress, (b) maximum principal stress.
The displacement histories show the evolution of vertical movement at the four monitoring points. By the end of the simulation, the hanging wall (P4) settled downward by 2.75 mm, the largest deformation among all points, consistent with the tensile failure zones observed in Figure 9. All displacements stabilize after the caved rock is placed, confirming that the granular fill provides passive confinement.
4.1.3. High-Stress Sensitivity Case
For the high-stress sensitivity case (K = 2.0), the yield state shows much worse conditions. After excavation (Figure 11a), the pillar is almost completely failed. Large volumes show “shear-n shear-p” (active mixed with past shear), with additional “shear-n shear-p tension-p” zones indicating that active shear and active tension occur simultaneously throughout the pillar. These failure zones connect the pillar to the hanging wall and the upper roof. The pillar has lost most of its load-carrying capacity. After caved rock fill (Figure 11b), the pillar shows only a minor reduction in active shear. The caved rock provides slight confinement at this extreme stress level. The hanging wall similarly retains active tension and shear zones. The fill does not occupy ongoing failure. These results show that at K = 2.0, even with caved rock support, the pillar is too damaged to carry the load properly, and the hanging wall is also extensively failed. Compared to K = 1.0 and K = 1.4, K = 2.0 shows that there is a clear limit where the proposed geometry (50 m stopes, 6 m pillar) cannot be used safely, even with caved rock. This confirms that the stress ratio is the main factor controlling stope stability.
Figure 11.
Yield state plots for K = 2.0 (L = 50 m, t = 6 m): (a) after excavation, (b) after caved rock fill.
Principal stress contours (Figure 12) show extreme conditions at K = 2.0. The minimum principal stress (σ1) contour (Figure 12a) reveals a peak compressive stress in the pillar of −78.0 MPa, corresponding to a stress concentration factor of approximately 5.8 relative to the in situ vertical stress of 13.5 MPa. The pillar is therefore severely overstressed, consistent with the widespread active shear and tension zones observed in the yield state. The maximum principal stress (σ3) contour (Figure 12b) shows a peak tensile stress of +0.0346 MPa in the hanging wall. The persistence of active tension zones in the yield state confirms that even this low tension is sufficient to drive tensile failure along discontinuities. The displacement histories show that the hanging wall (P4) settles downward by −2.42 mm, the largest deformation among all monitoring points, consistent with the extensive tensile failure observed.
Figure 12.
Principal stress contours for K = 2.0: (a) minimum principal stress (σ1), (b) maximum principal stress (σ3).
4.2. Effect of Stress Ratio
As we conclude from three baseline cases that the stress ratio K is the dominant control on stope stability. Table 6 summarizes all key results.
Table 6.
Summary of numerical results for all parametric runs.
As K increases, shear failure in the pillar becomes much more widespread (see yield state figures). For K = 1.0, the yielded zone is mostly in the middle of the pillar. For K = 1.4, it occupies more than half the pillar volume. For K = 2.0, the pillar is almost completely failed, and shear and tensile failure extend into the hanging wall and upper roof—the entire mining area becomes unstable. Peak principal stresses from the new mesh-corrected contour plots confirm the strong dependence on K:
- K = 1.0 → σ1 = −40.8 MPa (stress concentration factor ~3.0);
- K = 1.4 → σ1 = −55.4 MPa (factor ~4.1);
- K = 2.0 → σ1 = −78.0 MPa (factor ~5.8).
The peak tensile stress in the hanging wall remains very low (<+0.035 MPa) in all cases, yet the jointed rock mass develops active tension zones (see yield state figures), confirming that even modest tension triggers failure along discontinuities.
Displacement data for the baseline cases show that roof settlement increases from −0.018 mm at K = 1.0 to −1.14 mm at K = 2.0. The pillar shows upward movement (+0.31 mm to +1.28 mm) for all cases, indicating elastic rebound rather than crushing—even at K = 2.0, the pillar does not compact downward (the positive pillar displacement reflects dilation of the failed rock). The hanging wall consistently settles downward, with displacements of −2.77 mm at K = 1.0, −2.75 mm at K = 1.4, and −2.42 mm at K = 2.0, making it the most deformable feature. Comparison with empirical predictions remains valid: the hanging wall is identified as the most critical surface, and instability worsens with increasing K.
It must be noted that the present analysis uses the stress-to-strength ratio (Barton criterion) to evaluate rock burst potential. Although this method is widely applied and has been found to be relatively reliable in comparative studies, it does not directly quantify the sudden release of elastic strain energy that characterizes strain-bursts from overstressed pillar cores. Energy-based indices, such as the Energy Release Rate (ERR), the Strain Energy Storage Index (Wet), or the Burst Potential Index (BPI), would provide a more complete assessment. For the particularly critical K = 2.0 case, in which the pillar core accumulates high elastic strains, the incorporation of such energy-based indices in a future site-specific back-analysis is strongly recommended.
4.3. Effect of Stope Length
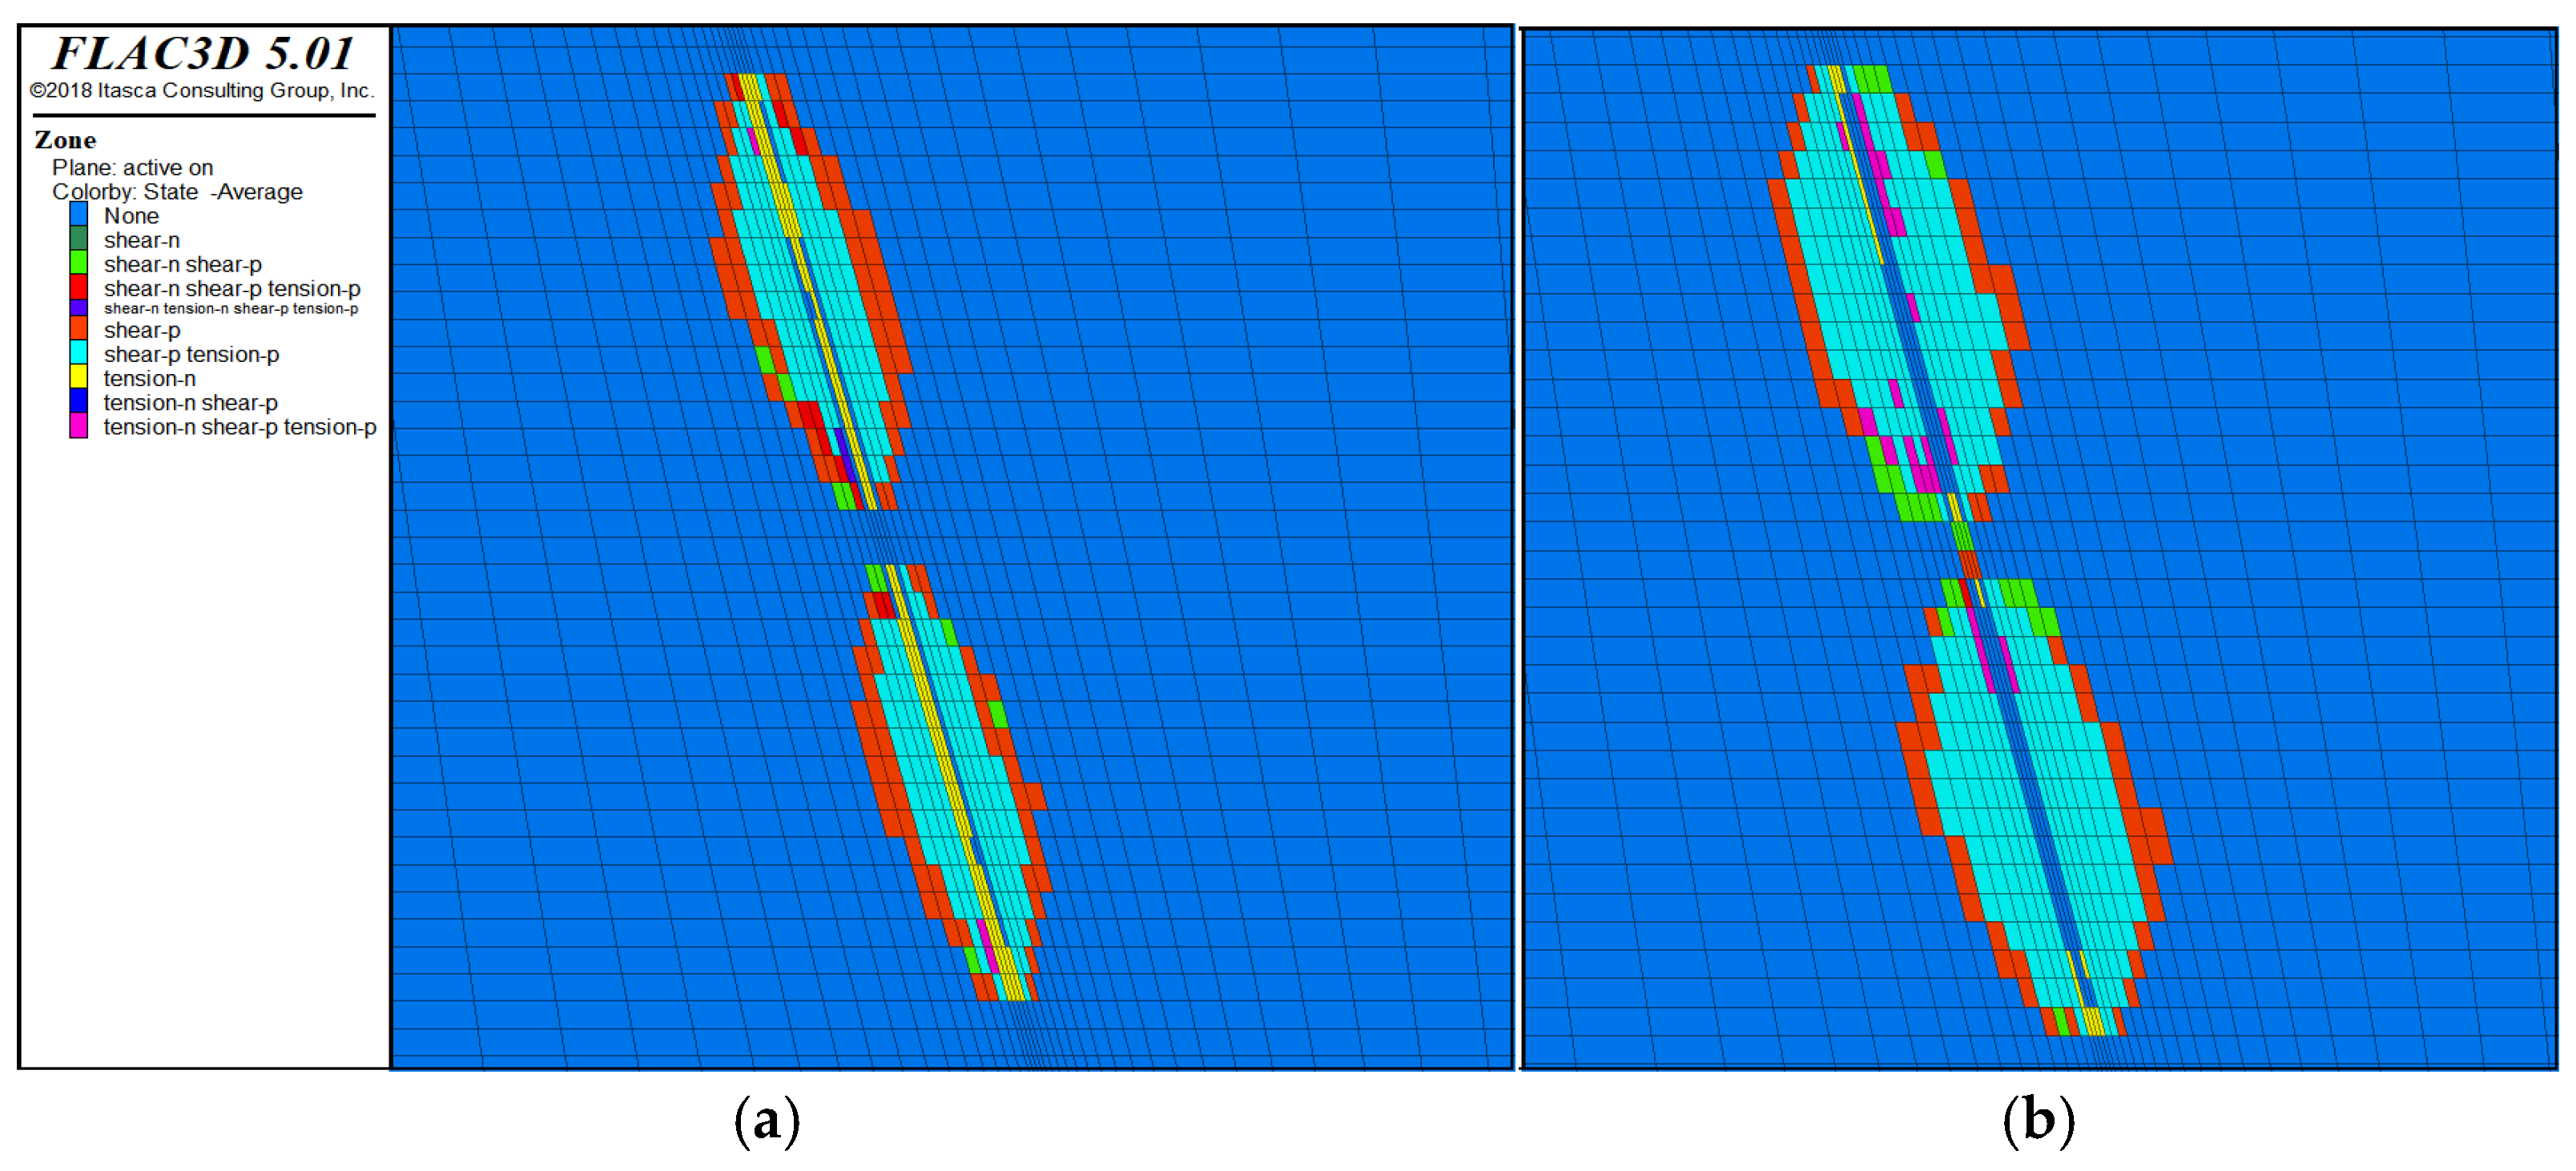
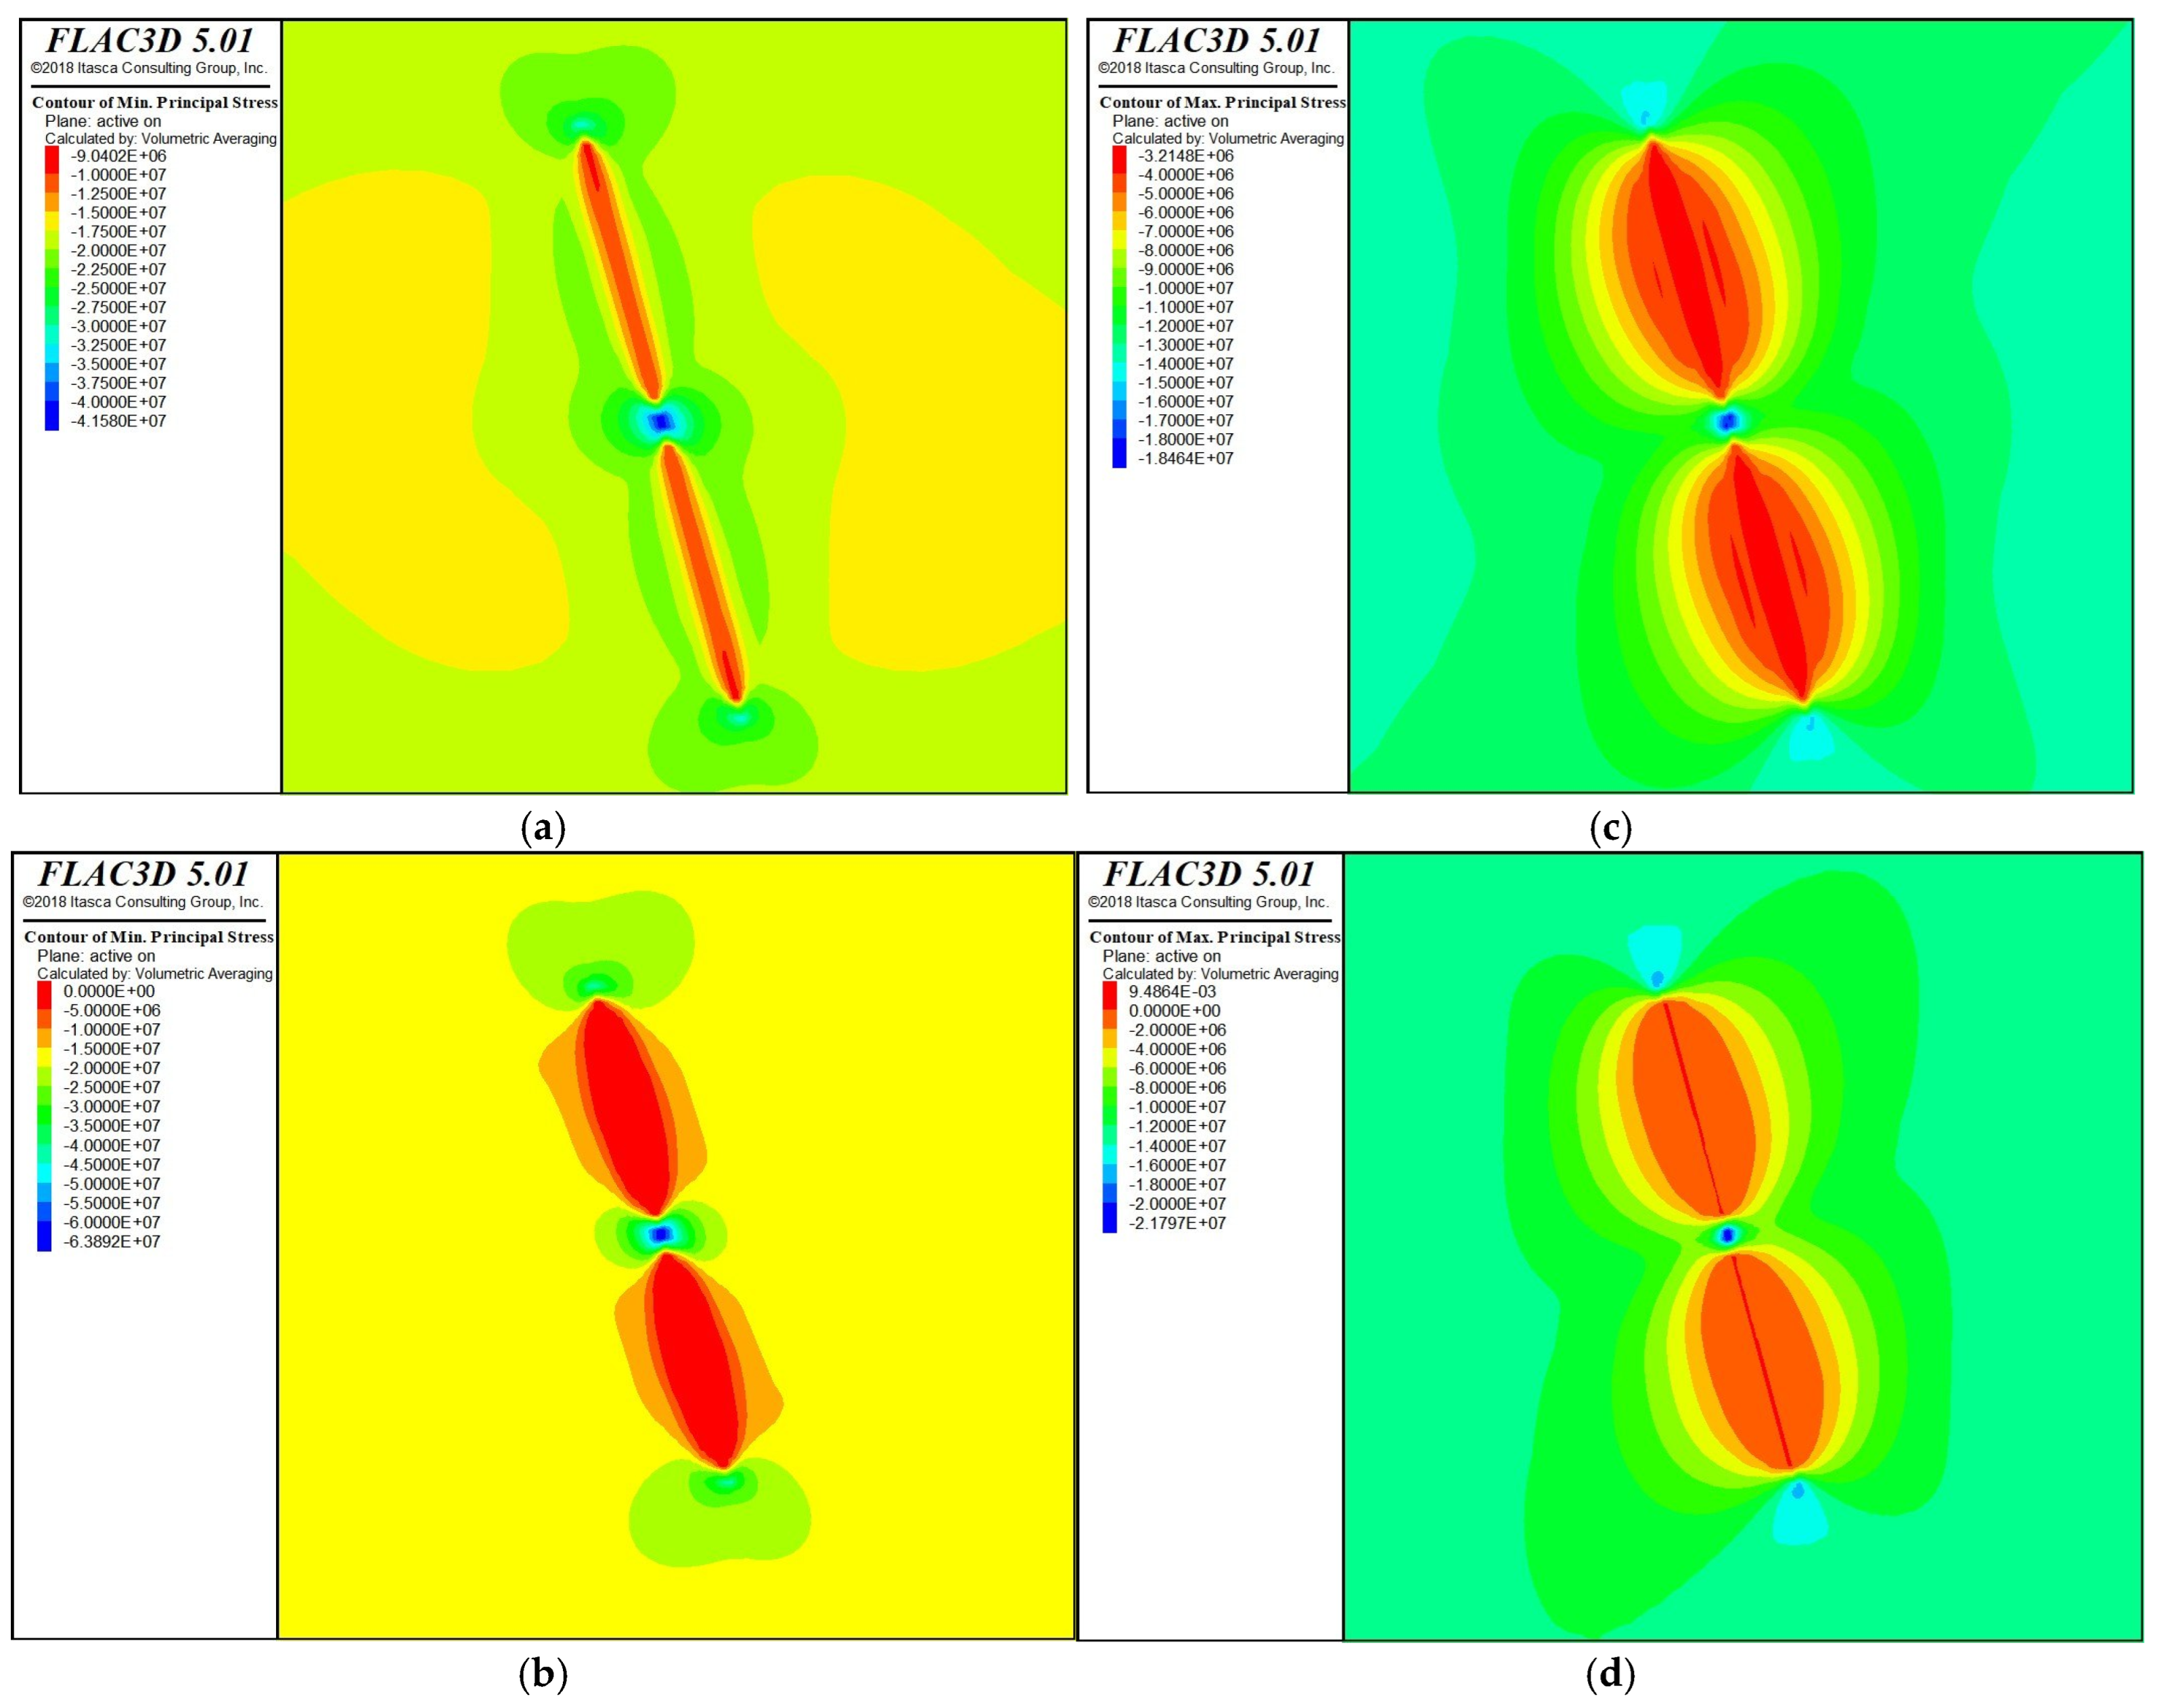
For a constant stress ratio (K = 1.4, the value measured at the site) and pillar thickness (6 m), the stope length along strike was changed to 40 m and 60 m. Figure 13 and Figure 14 compare these with the baseline case of L = 50 m.
Figure 13.
Yield state comparison for (a) L = 40 and (b) L = 60.
Figure 14.
Principal stress contours for (a) σ1 (SMin) and (c) σ3 (SMax) at L = 40 m, (b) σ1, and (d) σ3 at L = 60 m (K = 1.4, t = 6 m).
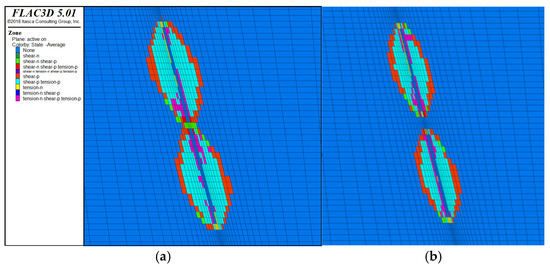
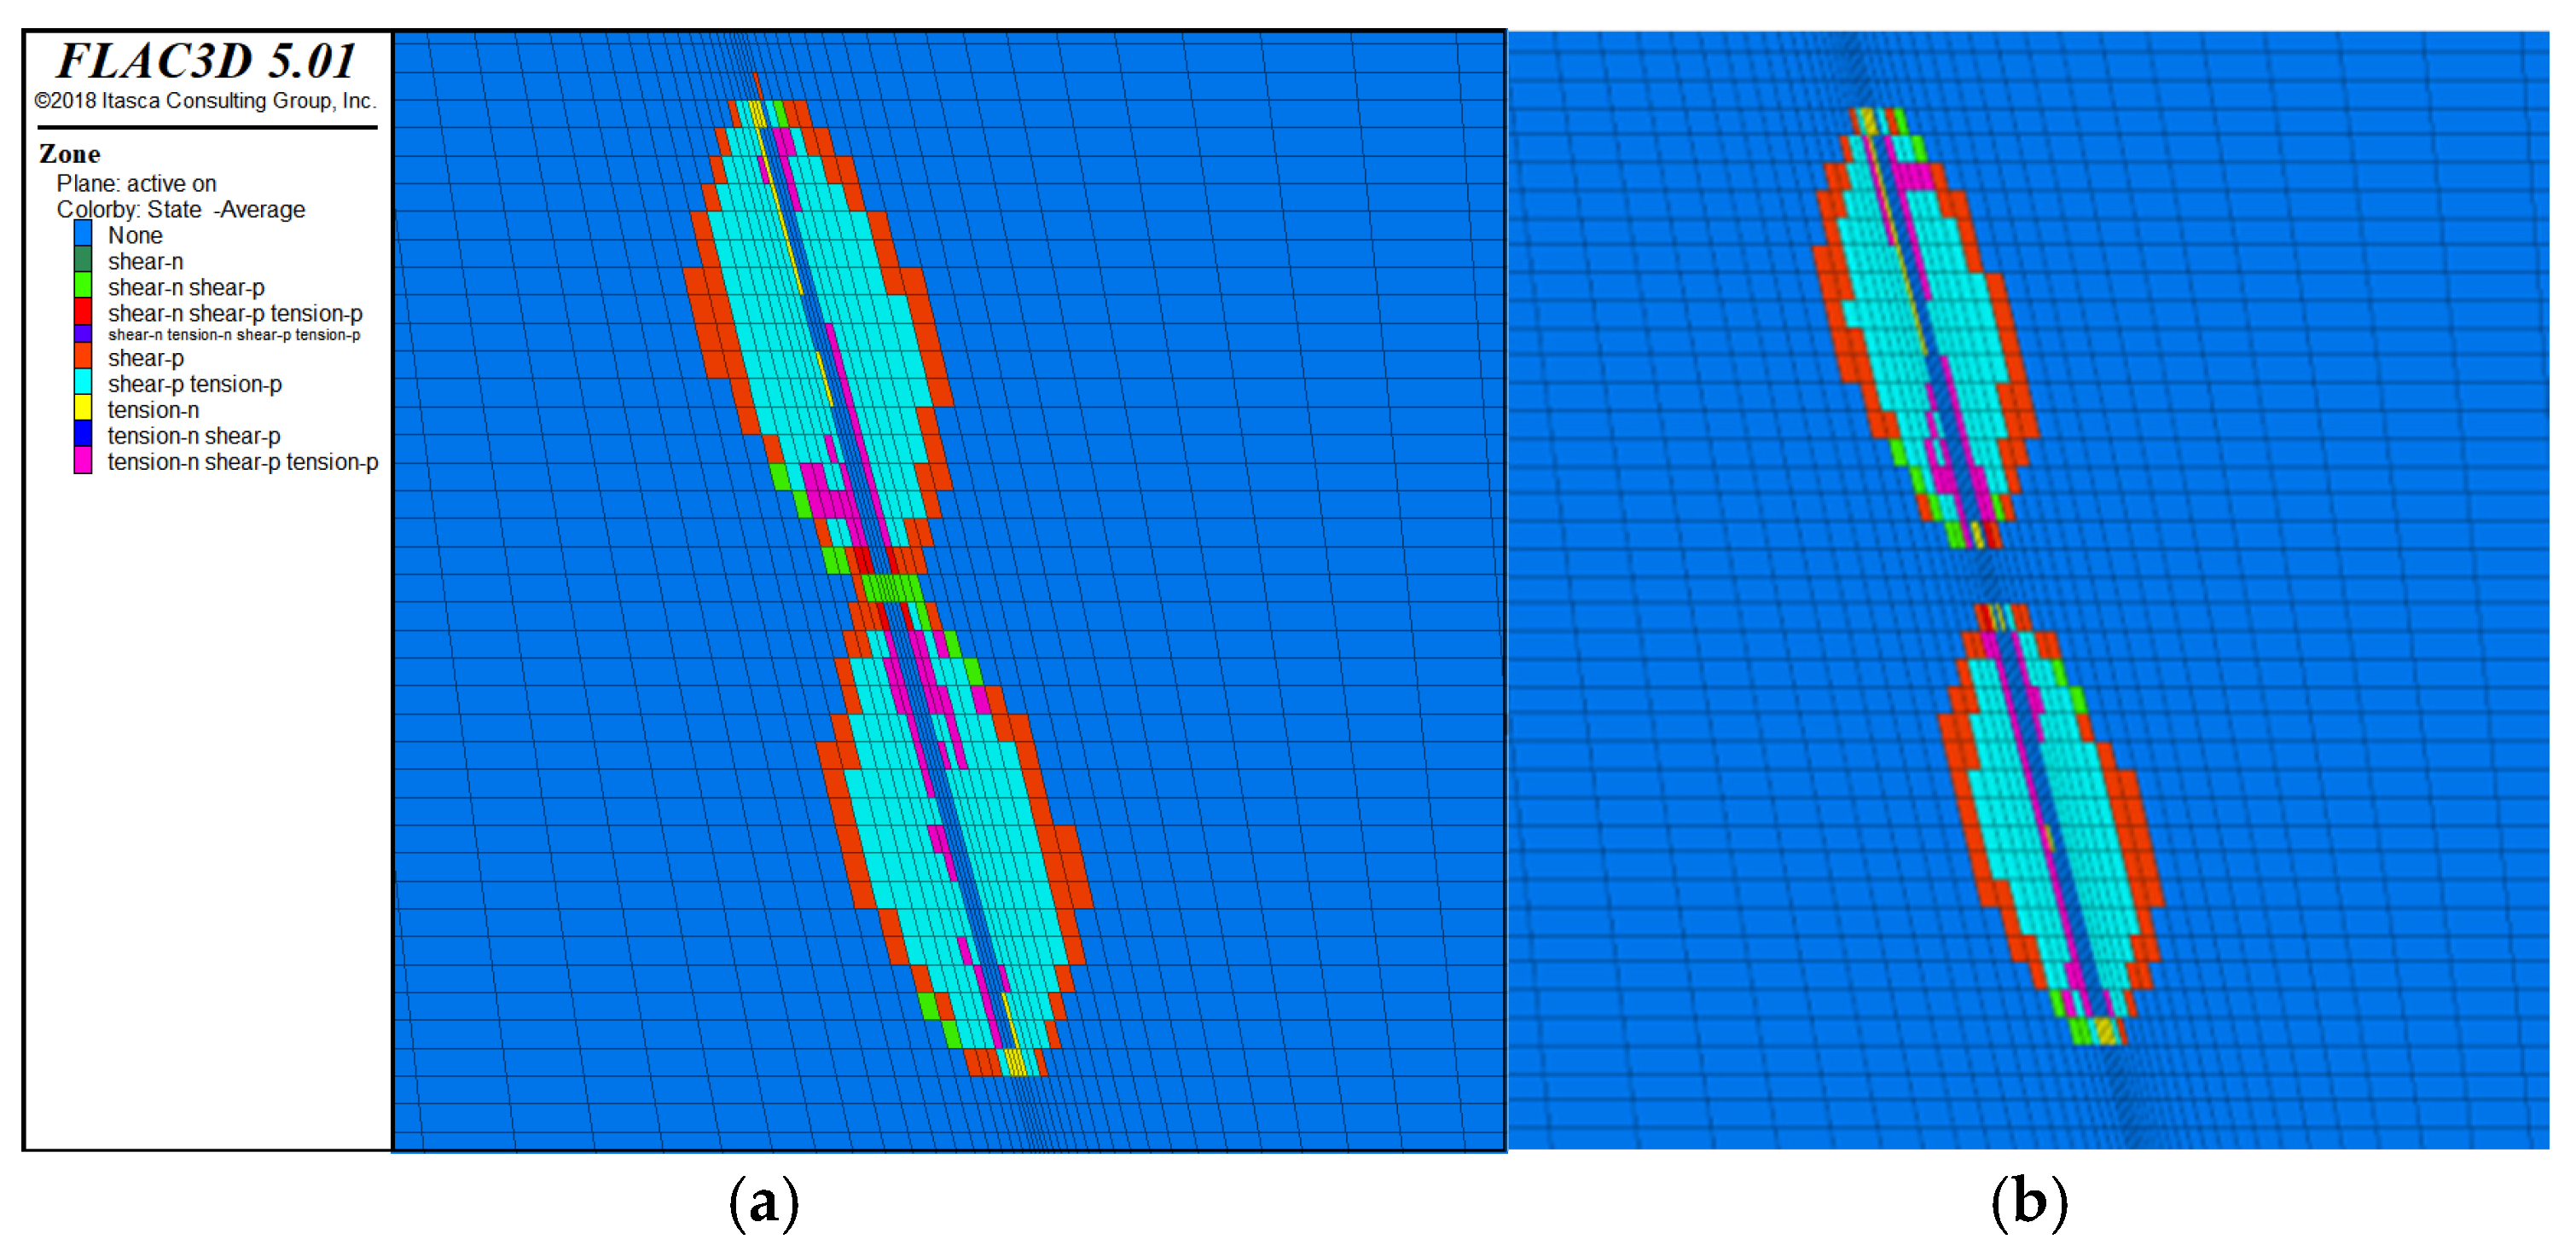
The shorter stope (L = 40 m, Figure 13a) shows much less shear failure in the pillar than the baseline. The pillar is completely stable, with no failure zones of any type appearing within the pillar. The “shear-p tension-p” areas are substantially smaller than in the 50 m and 60 m cases. Notably, the interior of the stope (the hanging wall and roof surfaces) is almost entirely occupied by “tension-n” (active tensile failure), indicating that even with a short span, the hanging wall is actively cracking under tension. However, because the pillar remains intact, the overall system is more stable than longer designs. For longer stopes (L = 60 m, Figure 13b), the pillar shows extensive “shear-n shear-p” (active shear mixed with past shear) throughout its volume. The “shear-p tension-p” are much larger, and “tension-n shear-p tension-p” appears along the stope boundaries, a failure state combining active tension and past shear. The hanging wall exhibits widespread active tension, and failure extends into the upper roof. The longer span worsens both pillar and hanging wall stability. This trend is consistent with well-established mining experience: shorter stope spans reduce the volume of rock affected by stress redistribution, limit the probability of intersecting large-scale joint-controlled wedges, and lower the absolute magnitudes of induced stresses because the total load transferred to the surrounding rock mass diminishes with excavation size. These factors combine to decrease the risk of both stress-induced yielding and structurally controlled failure.
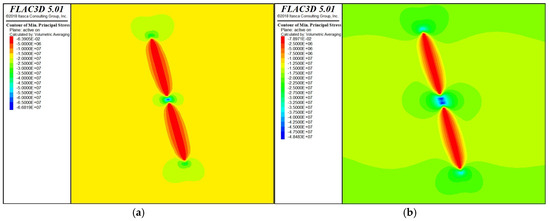
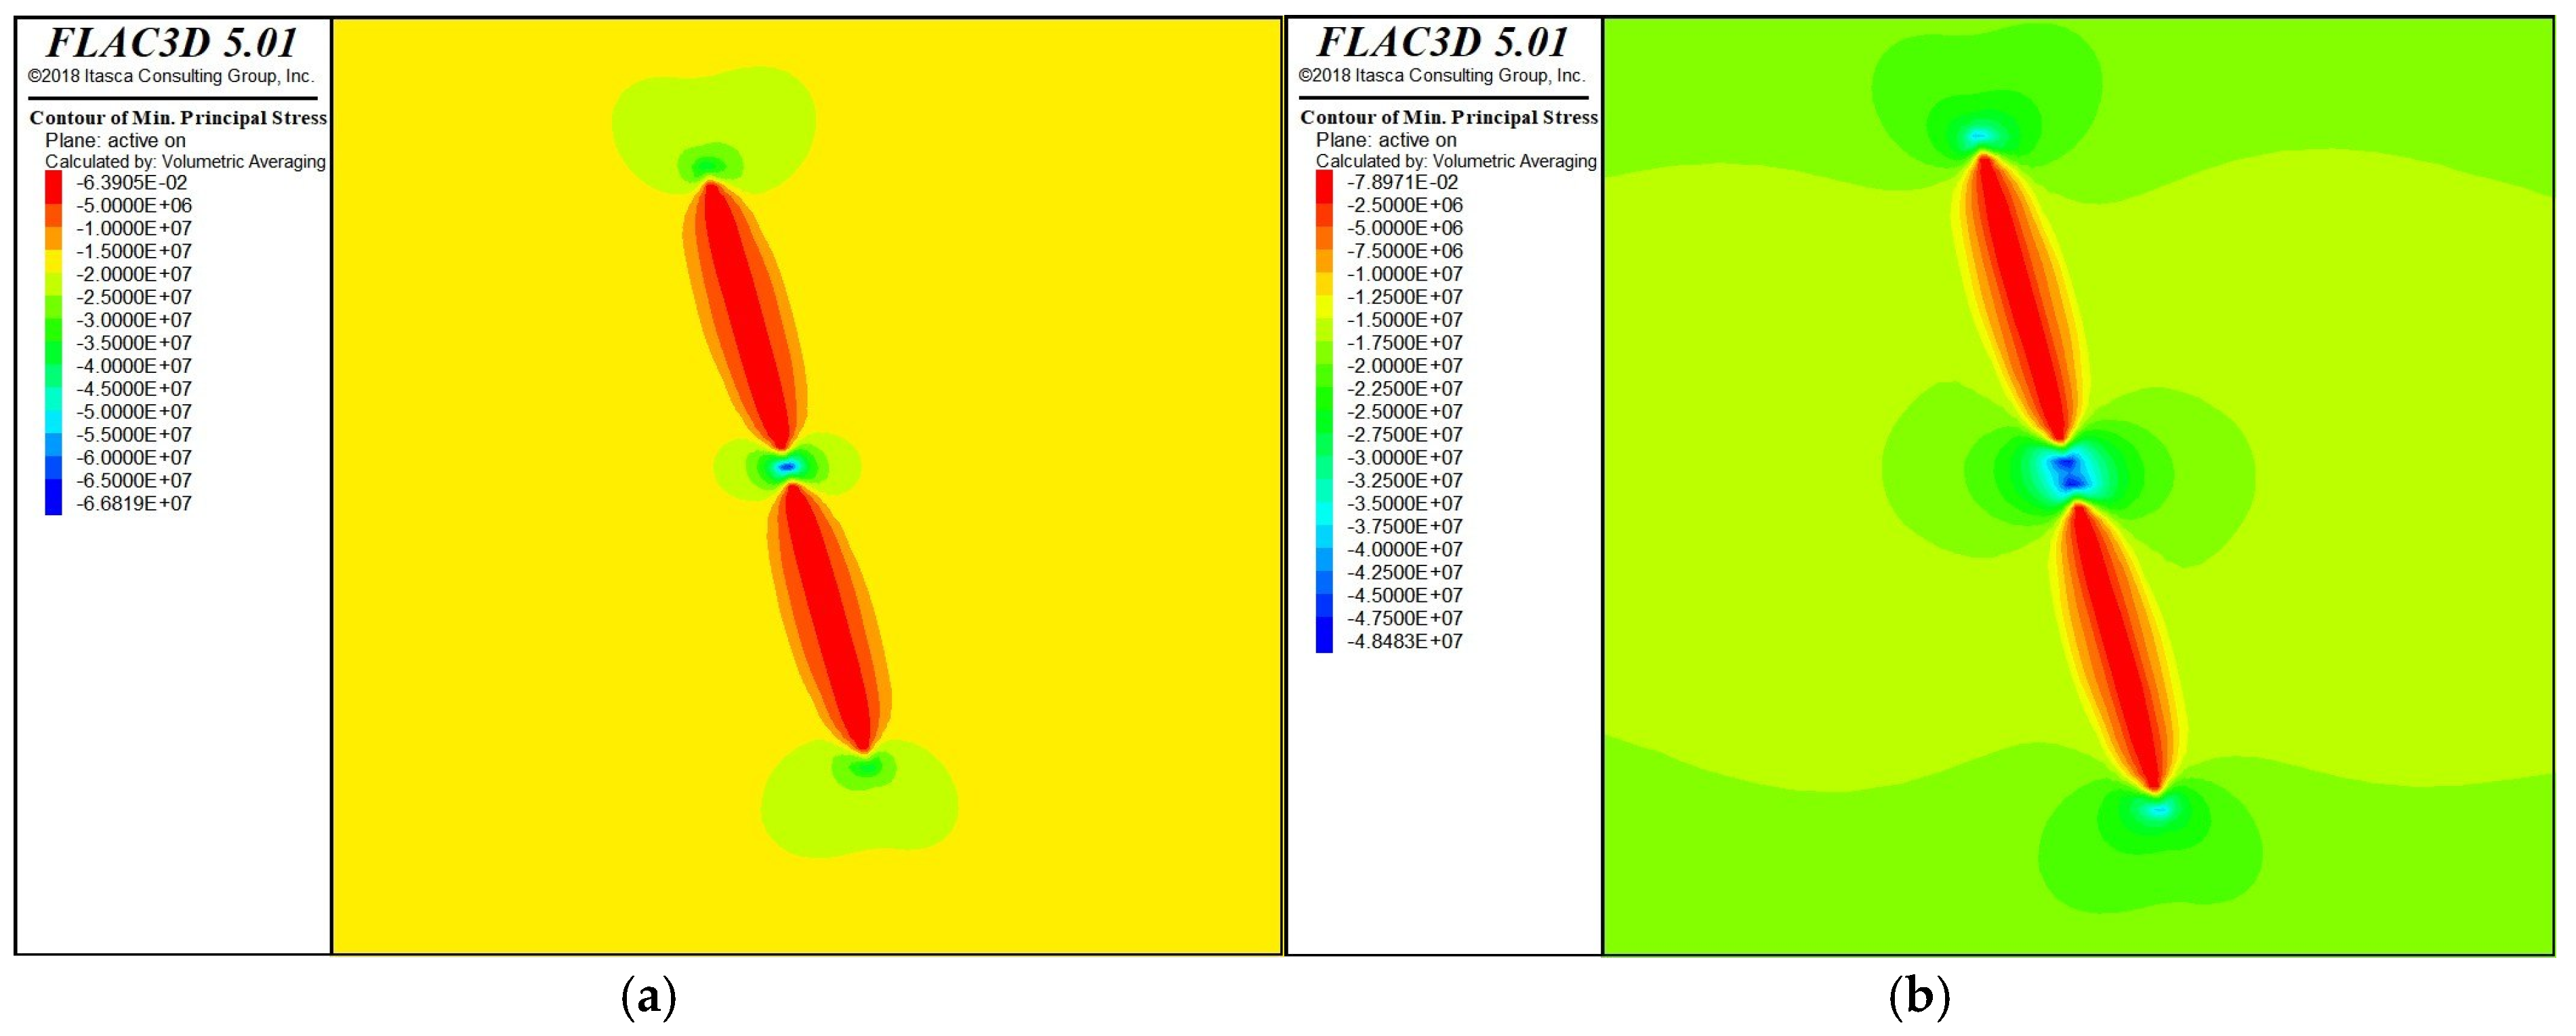
The minimum principal stress (σ1) contours (Figure 14a,b) show that peak compressive stress in the pillar increases with stope length: −41.6 MPa for L = 40 m, −55.4 MPa for L = 50 m, and −63.9 MPa for L = 60 m. This represents a 54% increase from the shortest to the longest stope, clearly demonstrating that longer spans impose substantially higher loads on the pillar. The maximum principal stress (σ3) contours (Figure 14c,d) reveal a critical difference in hanging wall tension. For L = 40 m, the contour shows no positive tensile stress (all values are compressive), consistent with the reduced active tension zones in the yield state. For L = 50 m, a small tensile peak of +0.0166 MPa appears. For L = 60 m, the tensile peak is +0.0095 MPa. Although these tensile values are modest, the jointed rock mass has very low effective tensile strength, so even small tensions trigger the active “tension-n” zones observed in the yield state.
Displacement data follow the same trend. Upper roof settlement is −0.80 mm for L = 40 m, −0.18 mm for L = 50 m, and −0.60 mm for L = 60 m (the 60 m roof displacement is unexpectedly similar to 50 m; this may reflect local redistribution). Pillar displacement remains small and positive (upward) for all lengths (from +0.34 to +0.49 mm), indicating that the pillar is not crushed under these spans at K = 1.4. The hanging wall shows the largest movement: −2.19 mm at L = 40 m, −2.75 mm at L = 50 m, and −3.17 mm at L = 60 m. The hanging wall is consistently the most deformable feature, and its displacement increases significantly when moving from 40 m to longer spans.
These results have clear practical implications. For the Zarmitan mine under the measured stress conditions (K = 1.4), a 40 m stope exhibits no pillar failure, no net tensile stress in the hanging wall, and the smallest hanging wall displacements. The 50 m and 60 m stopes show progressive pillar damage and active tensile failure. Therefore, limiting stope length to 40 m is strongly recommended for the current depth and stress regime. If longer stopes are required for production, additional pillar reinforcement or reduced effective exposed height must be considered.
4.4. Effect of Pillar Thickness
In this case, the pillar thickness was changed to t = 4 m and t = 8 m by keeping stress ratio (K = 1.4) and stope length (50 m) constant. Figure 15, Figure 16 and Figure 17 show the results compared to the baseline t = 6 m.
Figure 15.
Yield state comparison for pillar thickness (a) t = 4 and (b) t = 8.
Figure 16.
Minimum principal stress (σ1) contours for (a) t = 4 m and (b) t = 8 m (K = 1.4, L = 50 m).
Figure 17.
Maximum principal stress (σ3) contours for (a) t = 4 m and (b) t = 8 m (K = 1.4, L = 50 m).
For the thin pillar (t = 4 m, Figure 15a), most of the pillar shows “shear-n shear-p.” This means the pillar failed mainly in shear failure because it was too weak to carry the load. Some “shear p” areas are also present in the hanging wall, showing past shear failure. The hanging wall shows extensive “shear p,” meaning tensile failure happened everywhere. According to the thick pillar (t = 8 m, Figure 15b), both “ shear-n shear-p “ and “shear-p” areas are noticeably smaller. The pillar has no failure overall, with more stable rock in the center. The hanging wall still shows “shear-p,” but the failure is not as widespread as in the thin pillar case. When pillar thickness increases from 4 m to 8 m, both tensile failure and past shear failure decrease. The thick pillar (8 m) performs better, or less failure overall, with a more stable core. However, even the thick pillar cannot completely stop hanging wall failure; it still needs independent support.
The minimum principal stress (σ1) contours in Figure 16 provide detailed information on pillar loading. For the thin pillar (t = 4 m, Figure 16a), the peak compressive stress reaches −66.8 MPa, higher than the baseline 6 m pillar (−55.4 MPa). Because the pillar is narrower, this stress is concentrated over a smaller volume, leading to the extensive active failure observed in Figure 15a. For the thick pillar (t = 8 m, Figure 16b), the peak compressive stress is −48.5 MPa lower than the baseline. This indicates that increasing pillar thickness reduces the peak stress concentration by distributing the load over a larger cross-section, allowing a stable core to remain. This is considered typical pillar behavior that is well known in the mining literature [37].
The maximum principal stress (σ3) contours in Figure 17 reveal one of the most important findings of this study. For the thin pillar (t = 4 m, Figure 17a), the peak tensile stress in the hanging wall is approximately +0.0162 MPa. For the thick pillar (t = 8 m, Figure 17b), the peak tensile stress decreases slightly to approximately +0.0159 MPa. Although the reduction in tensile stress is relatively small, the thicker pillar still improves the overall stress distribution and stability conditions around the excavation. This demonstrates that a thicker pillar does more than just support the roof; it also helps reduce stress concentration and deformation in the hanging wall, which is an important consideration in narrow vein mining where hanging wall stability is often the main limiting factor.
Displacement data confirm the overall trend. For the thin pillar (t = 4 m), pillar compression is relatively large (approximately 6 mm downward), indicating significant deformation that matches the widespread failure observed in Figure 15a. Hanging wall displacement reaches approximately −3.18 mm downward, while the footwall displacement is about 0.17 mm upward. For the thick pillar (t = 8 m), the pillar displacement is much smaller (approximately 0.05 mm downward), confirming that the thicker pillar is considerably stiffer and resists deformation more effectively. Hanging wall displacement is also reduced to approximately −2.33 mm downward, and footwall movement decreases to about 0.31 mm upward. Roof and hanging wall displacements, therefore, follow a similar trend, with the thicker pillar reducing overall deformation and improving excavation stability.
Practical implications are as follows: Increasing pillar thickness from 4 m to 8 m improves overall pillar stability and reduces deformation in the hanging wall and surrounding rock mass by distributing compressive loads more evenly. The main trade-off is the loss of ore left within the pillar. For the measured stress conditions at Zarmitan, an 8 m pillar thickness is strongly recommended where stability is the primary concern, while 4 m pillars show significantly greater deformation and are therefore less suitable for long-term stability.
5. Conclusions
By concluding this study, we looked at stope stability for the Zarmitan mine using both empirical and numerical methods. One of the main contributions is that we modeled the caved rock directly, instead of just leaving the stopes as empty spaces. These followings are the main conclusions: Stress ratio is the most important factor for stability. When K increased from 1.0 to 2.0, the peak compressive stress in the pillar rose from −40.8 MPa to −78.0 MPa (a 91% increase), and roof settlement increased from −0.18 mm to −1.14 mm. The hanging wall remained the most deformable feature, with displacements of −2.77 mm at K = 1.0 and −2.42 mm at K = 2.0. For K ≥ 1.4, the baseline geometry (50 m stopes, 6 m pillar) becomes critically unstable, with extensive active shear and tension zones throughout the pillar and hanging wall. The stope length has a large effect on failure. For K = 1.4, when we reduced the length from 60 m to 40 m, the peak pillar stress decreased from −63.4 MPa to 41.6 MPa (a 35% reduction). The 40 m stope is clearly more stable under the stress conditions measured at the site.
Pillar thickness improves stability and reduces deformation around the excavation. Increasing pillar thickness from 4 m to 8 m (at K = 1.4, L = 50 m) slightly reduced the peak tensile stress in the hanging wall from approximately +0.0162 MPa to +0.0159 MPa. Although the reduction in tensile stress magnitude was limited, the thicker pillar significantly improved the overall mechanical response by reducing active shear, preserving a more stable pillar core, and substantially decreasing failure zones and displacement magnitudes. The hanging wall still exhibited tensile behavior in all cases, confirming that independent hanging wall support (e.g., cable bolts) remains essential regardless of pillar thickness. Caved rock helps with stability, but it does not stop tensile failure. After caved rock fill was placed, active shear in the pillar decreased or converted to past shear in most cases, but tensile failure in the hanging wall continued in all cases except when the pillar was thick.
The hybrid approach supports and improves upon the empirical predictions. The numerical results matched what the Mathews stability graph predicted; both methods showed that the hanging wall is the most critical surface, and that instability becomes worse with higher K and longer stopes. However, the empirical method could not show how much rock failed, what the actual stress values were, or how the pillar and stopes interacted in 3D. This shows the advantage of using numerical modeling.
Practical design recommendations for the Zarmitan mine are as follows:
- For the current measured stress condition (K ≈ 1.4, depth ≈ 500 m), a 40 m stope length with a 6 m pillar is recommended. This design exhibits no pillar failure, no net tensile stress in the hanging wall, and small displacements.
- If a 50 m stope is required for production, increasing the pillar thickness to 8 m substantially reduces hanging-wall tension (by ~90%) and improves overall stability, though at the cost of some ore loss.
- For higher stress ratios (corresponding to depths or local tectonic zones), even 40 m stopes require thicker pillars (≥8 m) and additional ground support. In such conditions, alternative mining methods, such as cut-and-fill with rapid backfill, should be considered.
The systematic approach used here provides practical design guidance for the Zarmitan mine and shows a method that can be used for other similar deep, steep, narrow-vein mines.
Author Contributions
Conceptualization, B.U., B.B.-E. and S.K.; methodology, B.U.; software, B.U. and B.B.-E.; validation, B.U. and B.B.-E.; formal analysis, B.U.; investigation, B.U.; resources, A.H. and S.K.; data curation, B.U.; writing—original draft preparation, B.U.; writing—review and editing, B.U.; visualization, B.U.; supervision, H.S. and T.S.; project administration, A.H.; funding acquisition, A.H. All authors have read and agreed to the published version of the manuscript.
Funding
The authors are deeply grateful to the Japan International Cooperation Agency (JICA) Kizuna Program for its generous financial support of this research and doctoral program. The authors also thank Kyushu University for permitting the use of all licensed software in this research.
Data Availability Statement
The FLAC3D model input files and the displacement results generated during this study are available from the corresponding author upon reasonable request. Some of the data used in this study, including specific mine planning and geomechanical parameters from the Zarmitan mine, are confidential. These data are not publicly available.
Conflicts of Interest
The authors declare no conflicts of interest.
References
- Li, Z.-B.; Qiao, D.-P.; Yang, T.-Y. Stability control of open stopes in high-stress deep mining: A structural parameter design methodology based on the improved Mathews stability graph method. Front. Earth Sci. 2025, 13, 1610234. [Google Scholar] [CrossRef] [Scilit]
- Sayyidkosimov, S.; Nizamova, A. Forecasting the parameters of displacement of rocks and the earth’s surface on the basis of mathematical modeling in the conditions of underground mining of gold ore deposits. IOP Conf. Ser. Earth Environ. Sci. 2022, 970, 012026. [Google Scholar] [CrossRef] [Scilit]
- Raimjanov, B.R.; Khasanov, A.R. Ratings of structural rock mass quality for Zarmitan gold mines. Min. Inf. Anal. Bull. 2020, 5, 115–127. [Google Scholar] [CrossRef] [Scilit]
- Suorineni, F.T. The stability graph after three decades in use: Experiences and the way forward. Int. J. Min. Reclam. Environ. 2010, 24, 307–339. [Google Scholar] [CrossRef] [Scilit]
- Martin, C.D. Seventeenth Canadian Geotechnical Colloquium: The effect of cohesion loss and stress path on brittle rock strength. Can. Geotech. J. 1997, 34, 698–725. [Google Scholar] [CrossRef]
- Rakhimov, V.R.; Kazakov, A.N. Finite element analysis of stress–strain state of rocks considering tectonic stresses. Min. Inf. Anal. Bull. (Sci. Tech. J.) 2014, 151–162. (In Russian) [Google Scholar]
- Sayyidkosimov, S.; Kazakov, A. Forecast of Probability of Shock Hazard in Conditions of Underground Development of Zarmitan Gold Deposit Zones. In Proceedings of the ISRM European Rock Mechanics Symposium—EUROCK 2018, St. Petersburg, Russia, 22–25 May 2018. [Google Scholar]
- Mathews, K.E.; Hoek, E.; Wyllie, D.C.; Stewart, S.B.V. Prediction of Stable Excavation Spans for Mining at Depths Below 1000 Metres in Hard Rock; CANMET Report; Canada Department of Energy, Mines and Resources: Ottawa, ON, Canada, 1981.
- Potvin, Y. Empirical Open Stope Design in Canada; University of British Columbia: Vancouver, BC, Canada, 1988. [Google Scholar]
- Mawdesley, C.; Trueman, R.; Whiten, W.J. Extending the Mathews stability graph for open-stope design. Min. Technol. 2001, 110, 27–39. [Google Scholar] [CrossRef] [Scilit]
- Suorineni, F.T.; Tannant, D.D.; Kaiser, P.K. Determination of fault-related sloughage in open stopes. Int. J. Rock Mech. Min. Sci. 1999, 36, 891–906. [Google Scholar] [CrossRef] [Scilit]
- Diederichs, M.S.; Kaiser, P.K.; Eberhardt, E. Damage initiation and propagation in hard rock during tunnelling and the influence of near-face stress rotation. Int. J. Rock Mech. Min. Sci. 2004, 41, 785–812. [Google Scholar] [CrossRef] [Scilit]
- Zhang, Q.; Huang, M.; Guo, J. A simulation analysis of the stability of tall and collapse-prone stopes: A case study of the Dongguashan Copper Mine. Appl. Sci. 2024, 14, 10608. [Google Scholar] [CrossRef] [Scilit]
- Itasca Consulting Group Inc. FLAC3D—Fast Lagrangian Analysis of Continua in 3 Dimensions, Version 5.0, User‘s Manual; Itasca Consulting Group: Minneapolis, MN, USA, 2012. [Google Scholar]
- Clark, L.M.; Pakalnis, R.C. An empirical design approach for estimating unplanned dilution from open stope hanging walls and footwalls. In Proceedings of the 99th CIM Annual General Meeting, Vancouver, BC, Canada, 27 April–1 May 1997; Canadian Institute of Mining, Metallurgy and Petroleum: Westmount, QC, Canada, 1997. [Google Scholar]
- Kaiser, P.K.; Diederichs, M.S.; Martin, C.D.; Sharp, J.; Steiner, W. Underground works in hard rock tunnelling and mining. In Proceedings of the GeoEng2000, Melbourne, Australia, 19–24 November 2000; Technomic Publishing: Lancaster, PA, USA, 2000; pp. 841–926. [Google Scholar]
- Wang, X.; Liu, S.; Yang, J.; Chen, M. Collaborative optimization of the Mathews stability graph method and numerical simulation for the limit exposure area in stope. Sci. Rep. 2025, 15, 26420. [Google Scholar] [CrossRef] [Scilit] [PubMed]
- Musingwini, C.; Dlamini, T. A heuristic methodology for economic and geomechanical optimization in sublevel open stoping mining method. Min. Eng. 2024, 41, 1645–1657. [Google Scholar]
- Abzalov, M. Zarmitan granitoid-hosted gold deposit, Tian Shan belt, Uzbekistan. Econ. Geol. 2007, 102, 519–532. [Google Scholar] [CrossRef] [Scilit]
- Bortnikov, N.S.; Prokof‘ev, V.Y.; Razdolskaya, V.V.; Krivolutskaya, N.A. Origin of the Charmitan gold–quartz deposit (Uzbekistan). Geol. Ore Depos. 1996, 38, 208–226. [Google Scholar]
- PorterGeo Database. Zarmitan, Charmitan, Guzhumsai—Uzbekistan. Available online: https://portergeo.com.au/database/mineinfo.asp?mineid=mn1005 (accessed on 12 May 2026).
- Saiang, D. Back analysis of narrow vein open stope stability and verification using kinematic and empirical methods. In Proceedings of the Rocscience International Conference 2023, Virtual, 25–26 April 2023. [Google Scholar] [CrossRef] [Scilit]
- Wang, R.; Liu, L.; Zhu, M.; Qiu, H.; Tu, B.; Qu, H.; Cui, H. Assessing ground stability of a vertical backfilled stope considering creep behaviors of surrounding rocks. J. Rock Mech. Geotech. Eng. 2025, 17, 187–199. [Google Scholar] [CrossRef] [Scilit]
- Liu, G.; Li, X.; Li, D. Improved model-based study of backfill stress distribution considering rock-backfill closure, mine depth, and position along stope length. Front. Earth Sci. 2025, 32, 2717–2731. [Google Scholar] [CrossRef] [Scilit]
- Li, C.; Liu, G.; Guo, L.; Zheng, D.; Yuan, X. A New CRITIC-GRA Model for Stope Dimension Optimization Considering Open Stoping Stability, Mining Capacity and Costs. Appl. Sci. 2024, 14, 5249. [Google Scholar] [CrossRef] [Scilit]
- Blachowski, J.; Ellefmo, S. Numerical modelling of rock mass deformation in sublevel caving mining system. Acta Geodyn. Geomater. 2012, 9, 379–388. [Google Scholar]
- Lapcevic, V.; Torbica, S. Numerical investigation of caved rock mass friction and fragmentation change influence on gravity flow formation in sublevel caving. Minerals 2017, 7, 56. [Google Scholar] [CrossRef] [Scilit]
- Gao, Z.; Lin, L.; Huang, M.; Wang, Z.; Li, C.; Zhang, H.; Luo, Y. Synergistic optimization of stope structural parameters and blasting technology for dilution control in narrow-vein deep-hole mining. Gold 2026, 47, 37–41. [Google Scholar]
- Zhang, M.; Liu, H.; Yang, Y.; Wei, J.; Zha, W. Modified rock stress factor for the Mathews stability graph method and its application. Geomat. Nat. Hazards Risk 2024, 15, 2344792. [Google Scholar] [CrossRef] [Scilit]
- Hutchinson, D.J.; Diederichs, M.S. Cable Bolting in Underground Mines; BiTech Publishers: Richmond, BC, Canada, 1996. [Google Scholar]
- Bewick, R.P.; Kaiser, P.K. Numerical assessment of Factor B in Mathews ‘method for open stope design. In Proceedings of the 3rd CANUS Rock Mechanics Symposium, Toronto, ON, Canada, 9–12 May 2009. [Google Scholar]
- Trueman, R.; Mawdesley, C. Predicting cave initiation and propagation. CIM Bull. 2003, 96, 54–59. [Google Scholar]
- Nickson, S.D. Cable Support Guidelines for Underground Hard Rock Mine Operations. Master’s Thesis, University of British Columbia, Vancouver, BC, Canada, 1992. [Google Scholar]
- Hoek, E.; Kaiser, P.K.; Bawden, W.F. Support of Underground Excavations in Hard Rock; CRC Press: Boca Raton, FL, USA, 2000. [Google Scholar] [CrossRef] [Scilit]
- Lunder, P.J.; Pakalnis, R.C. Determination of the strength of hard-rock mine pillars. CIM Bull. 1997, 90, 51–55. [Google Scholar]
- Sand, N.S.; Trinh, Q.N. Rana Gruber rock mechanics challenges connection with the establishment of a new main level and the transition to new mining method. In Proceedings of the 45th US Rock Mechanics Symposium, ARMA 11-223, San Francisco, CA, USA, 26–29 June 2011; Available online: https://www.researchgate.net/publication/294505540 (accessed on 14 May 2026).
- Lin, Y.; Zhou, R.; Zhou, K.; Li, J.; Yang, C.; Que, C.; Wu, F.; Xiao, Y. Simulation Study on Optimization of Structural Parameters of Stope Based on Ground Pressure Control. Appl. Sci. 2025, 15, 9998. [Google Scholar] [CrossRef] [Scilit]

Disclaimer/Publisher’s Note: The statements, opinions and data contained in all publications are solely those of the individual author(s) and contributor(s) and not of MDPI and/or the editor(s). MDPI and/or the editor(s) disclaim responsibility for any injury to people or property resulting from any ideas, methods, instructions or products referred to in the content. |
© 2026 by the authors. Licensee MDPI, Basel, Switzerland. This article is an open access article distributed under the terms and conditions of the Creative Commons Attribution (CC BY) license.