


Highlights
- This study presents a multi-relational knowledge graph framework for drug repurposing and side-effect burden prediction by integrating complex relationships among genes, drugs, diseases, and adverse effects. Rather than examining these biomedical relationships independently, the proposed approach represents them within a unified graph structure and applies graph-based machine learning to learn meaningful patterns across different types of biological and clinical associations. The framework supports the identification of potential new therapeutic uses for existing drugs while providing insights into potential adverse effects. By combining drug repurposing and safety-related prediction within the same knowledge-driven framework, this study provides a computational approach that may help with prioritizing promising drug candidates for further investigation and contribute to more efficient and informed therapeutic discovery.
Abstract
This study addresses two key challenges in computational pharmacology: identifying novel therapeutic uses for existing drugs and modeling drug safety-related characteristics. We propose a multi-relational biomedical knowledge graph that integrates gene, drug, and disease associations with adverse effect data, enabling joint modeling of therapeutic and safety-related properties. A Relational Graph Convolutional Network (R-GCN) is employed to learn relationally aware embeddings that capture complex biological interactions across heterogeneous entities. The framework is evaluated on two tasks: (1) drug–disease link prediction for drug repurposing and (2) prediction of drug side-effect burden based on adverse event patterns. The experimental results demonstrate that the R-GCN model outperforms baseline methods, achieving 94.63% accuracy in drug–disease link prediction, while embedding-based classifiers attain up to 97.14% F1-score in side-effect burden classification. Additionally, multi-hop relational reasoning enables the discovery of biologically plausible connections between drugs, genes, and diseases. These findings highlight the effectiveness of knowledge graph-based representation learning in jointly supporting therapeutic discovery and safety-related analysis. While side-effect burden is used as a surrogate measure rather than a direct indicator of drug quality, the proposed framework provides a scalable foundation for integrating real-world pharmacovigilance and regulatory data in future studies.
1. Introduction
Developing new drugs from scratch has become an increasingly costly and time-consuming process, often taking many years and carrying a high risk of failure. Because of these challenges, researchers are placing more emphasis on drug repurposing, which involves finding new uses for drugs that are already approved or previously tested [1]. Since these drugs already have established safety profiles and known pharmacological data, repurposing them can significantly shorten the development timeline and reduce costs. As noted by Schcolnik-Cabrera [2], this approach allows scientists to build on existing knowledge and data to quickly identify potential treatments, making it a practical and efficient alternative to traditional drug discovery—especially in urgent or under-researched therapeutic areas.
Simultaneously, the proliferation of biomedical data has facilitated the construction of knowledge graphs (KGs)—structured, multi-relational networks that capture diverse biological entities (e.g., genes, drugs, diseases) and their interactions. These graphs provide a robust framework for integrating heterogeneous data sources, enabling computational inference through link prediction, node classification, and path-based reasoning [3]. In the context of drug repurposing, KGs serve as powerful tools to uncover hidden associations between drugs and diseases, offering a scalable, data-driven approach to therapeutic discovery. This study emphasizes that the integration of computational methods, including network-based models and machine learning algorithms, significantly improves the identification of potential drug–target interactions [3]. Recent studies have demonstrated the utility of KGs in drug repurposing. For instance, the Drug Repurposing Knowledge Graph (DRKG) aggregates data from multiple sources including DrugBank, Hetionet, and GNBR, supporting high-performance graph-based learning models for drug–disease link discovery [4]. These models have shown promise in identifying novel therapeutic candidates by leveraging the complex interplay between genes, drugs, and diseases.
Knowledge graphs (KGs) encode entities (e.g., drugs, genes, diseases) and their relationships in a structured, graph-based format, enabling the discovery of novel associations through link prediction and graph embedding techniques [5]. Recent advancements in multi-relational knowledge graphs have further enhanced this capability by allowing for the modeling of diverse and semantically rich relationships, such as therapeutic effects, molecular mechanisms, and adverse interactions [5].
Several studies have demonstrated the effectiveness of graph-based models in drug repurposing. For instance, Ref. [6] employed Graph Convolutional Networks (GCNs) to integrate gene expression data, protein interactions, and drug–target relationships, successfully identifying candidate drugs for infectious diseases like Zika and COVID-19. Similarly, in [5] developed Drug-CoV, a multi-relational knowledge graph specifically designed for COVID-19 drug repurposing, which outperformed existing models in link prediction tasks [5].
Despite these advancements, substandard and falsified (SF) medicines remain a critical yet understudied issue in computational pharmacology. SF drugs, often circulating in low- and middle-income countries, can result from inadequate manufacturing and/or storage, or deliberate fraud, posing serious threats to global health (World Health Organization (WHO), 2017 [7]). Although pharmacovigilance systems and regulatory agencies attempt to monitor medicine quality, they lack predictive and integrative tools for early detection.
While prior work has extensively explored knowledge graphs and graph neural networks for drug repurposing, most approaches focus solely on therapeutic link prediction using large-scale integrated datasets. In contrast, this study explores a compact, curated knowledge graph setting and introduces a multi-task learning perspective, where both therapeutic relationships and safety-related patterns are modeled within a unified framework. This design enables the simultaneous extraction of complementary signals from the same graph representation.
Contributions
The main contributions of this work are as follows:
- We construct a compact multi-relational biomedical knowledge graph from curated gene–drug–disease associations and adverse effect data, enabling unified representation learning without relying on large-scale multi-source integration.
- We propose a multi-task learning framework using a Relational Graph Convolutional Network (R-GCN) to jointly model drug–disease link prediction and drug side-effect burden prediction.
- We demonstrate that relational graph embeddings can capture both therapeutic and safety-related signals, achieving strong performance on link prediction and side-effect burden classification.
- We provide interpretable case studies based on multi-hop reasoning paths (drug → gene → disease) to support hypothesis-driven drug repurposing.
2. Related Work
2.1. Drug Repurposing Using Knowledge Graphs
Drug repurposing has gained significant momentum in recent years as an efficient alternative to traditional drug development. In this context, knowledge graphs (KGs) have emerged as powerful tools to integrate heterogeneous biomedical entities—such as genes, drugs, proteins, and diseases—and represent them through a network of interrelated triples. Early works like that of Himmelstein demonstrated the utility of heterogeneous networks in predicting drug–disease associations by combining multiple biomedical datasets into a unified graph structure [8]. He proposed Hetionet v1.0, a comprehensive biomedical knowledge graph that integrates 11 types of entities and 24 types of relationships from 29 public data sources. His framework, known as Project Rephetio, leveraged graph-derived features—specifically metapaths—to predict new drug–disease indications. The study showed that integrating diverse biological and pharmacological data into a unified graph structure enables interpretable and scalable prediction of therapeutic hypotheses [8]. Building upon this framework, Zhu et al. developed a comprehensive drug knowledge graph integrating diverse biomedical entities and applied path-based and graph embedding approaches with machine learning models for effective and interpretable drug repurposing prediction [9].
The application of knowledge graphs (KGs) has gained traction as a potent strategy in drug repurposing, particularly during the COVID-19 pandemic [5,10,11]. One notable contribution is the development of Drug-CoV, a domain-specific knowledge graph tailored for COVID-19 drug repurposing. This KG integrates multi-relational data from four major biomedical databases and is designed to originate from known COVID-19-related drugs. By incorporating diverse entity types and relationships, Drug-CoV enables more accurate link prediction between drugs and diseases. The study employed knowledge graph embedding (KGE) techniques to learn vector representations of entities and relations, which significantly improved the prediction of novel drug-disease associations. The authors demonstrated that Drug-CoV outperformed existing general-purpose KGs in identifying potential COVID-19 treatments, highlighting the importance of domain-specific graph construction in urgent public health scenarios [5].
In [10], the authors developed the CAS Biomedical Knowledge Graph by integrating curated biomedical data to identify 1350 small molecules potentially effective against COVID-19. A graph-based ranking algorithm was implemented to prioritize drugs based on gene and biological process rarity, with kinase inhibitors and HDAC inhibitors emerging as promising candidates—some of which are already in clinical trials. In parallel, Ref. [11] presented the COVID-19 Knowledge Graph (COVID-KG), a comprehensive cause-and-effect network encoded in Biological Expression Language (BEL), encompassing over 10,000 mechanistic relationships. This KG supports hypothesis generation and omics data integration through a dedicated web platform, enabling researchers to explore interactions between viral proteins, host factors, and drug targets. Complementing these efforts, Ref. [12] proposed a large-scale COVID-19 KG integrating data from 14 public bioinformatics databases. By employing motif-based analysis, PageRank, and graph embedding scores, they successfully ranked drug candidates for repurposing, identifying over 100 drugs—including antivirals, statins, and immunomodulators—with high therapeutic potential.
In addition, a comparative study on knowledge graph embeddings for vector-borne disease drug repurposing evaluated the performance of seven popular KGE models, including TransE, DistMult, and RESCAL. The study focused on diseases such as malaria and dengue, and assessed how different embedding strategies influence the accuracy of drug-disease predictions. The findings revealed that while simpler models like TransE are computationally efficient, more expressive models like RESCAL offer better performance in capturing complex biomedical relationships [13].
2.2. Knowledge Graph Embeddings and Link Prediction
Knowledge graph embeddings (KGEs) and link prediction techniques have become foundational in computational drug repurposing, particularly for modeling complex biomedical relationships such as gene–drug–disease associations. These approaches transform heterogeneous biomedical data into low-dimensional vector representations, enabling the discovery of novel therapeutic associations [13,14,15]. Recently, Tayebi and BabaAli proposed EKGDR, an end-to-end knowledge graph-based framework that utilized graph neural networks and relation-aware representation learning to improve drug repurposing prediction from heterogeneous biomedical graphs [14]. More recently, Huang et al. introduced TxGNN, a graph foundation model trained on large-scale biomedical knowledge graphs for zero-shot drug repurposing and therapeutic indication prediction, demonstrating strong generalization and interpretable reasoning capabilities [15].
Another significant contribution is the DTD-GNN model (Drug-Target-Disease Graph Neural Network), which introduces a heterogeneous graph structure to capture ternary relationships among drugs, targets, and diseases [16]. Unlike traditional binary models, DTD-GNN incorporates both graph convolutional and attention mechanisms to learn complex multi-feature interactions. The model demonstrated superior performance in link prediction tasks, outperforming other GNN-based approaches in terms of AUC, precision, and F1-score. This approach is particularly aligned with the goals of this research, as it supports the modeling of intricate gene–drug–disease associations and provides a robust framework for identifying substandard or misclassified medicines.
Additionally, Cohen et al. [17] extended the Dr-COVID model by integrating collaborative filtering and high-performance computing techniques to enhance link prediction in biomedical KGs. Their approach ranked candidate drugs for COVID-19 treatment, with 32 of the top 100 predictions being validated in clinical trials. This study underscores the scalability and real-world applicability of embedding-based link prediction models in urgent drug repurposing scenarios.
2.3. Substandard Medicines and Data-Driven Detection
As drug repurposing accelerates the identification of new therapeutic uses for existing compounds, it also introduces new challenges in ensuring the quality and safety of repurposed drugs, particularly in low-resource settings. Substandard and falsified medicines (SFMs) can undermine the success of repurposing strategies by introducing variability in treatment outcomes, resistance development, and public mistrust [18]. Consequently, data-driven detection methods have become essential for monitoring the integrity of repurposed drugs throughout the supply chain.
Recent advancements in computational drug repurposing have emphasized the integration of machine learning and network-based models to not only predict drug-disease associations but also assess the reliability and consistency of drug formulations.
In parallel, deep learning models have been applied to large-scale biomedical datasets to predict drug–target interactions, drug–drug similarities, and adverse effects. These models, as reviewed by Askr et al. [19], are increasingly being used to monitor post-market drug performance, offering a scalable solution for identifying substandard medicines in real time. For instance, unexpected shifts in drug response patterns across populations can be detected using convolutional neural networks (CNNs) and autoencoders, which are capable of learning subtle deviations in pharmacological behavior.
Moreover, the integration of knowledge graphs in drug repurposing pipelines has enabled the construction of multi-relational networks that include not only therapeutic associations but also metadata related to manufacturing sources, batch quality, and regulatory alerts. Nature Research Intelligence [20] emphasized that biomedical knowledge graphs, when enriched with real-world evidence and pharmacovigilance data, can serve as a foundation for early detection of substandard medicines during repurposing efforts.
2.4. Gaps in Literature
Despite significant progress in biomedical knowledge graph applications, most existing studies focus on single-task objectives such as drug–disease link prediction or drug–target interaction modeling. Limited attention has been given to leveraging learned graph representations for complementary tasks that capture both therapeutic and safety-related properties of drugs.
Furthermore, many approaches rely on large-scale integration of multiple heterogeneous biomedical databases, which, while powerful, introduces challenges in data harmonization and scalability. There is a need to investigate whether compact, curated knowledge graphs can still provide meaningful predictive performance.
To address these gaps, this study proposes a multi-task graph representation learning framework that jointly models drug repurposing and side-effect burden prediction using a unified relational graph structure.
3. Materials and Methods
3.1. Dataset Description
The dataset used in this study is sourced from Zenodo (https://doi.org/10.5281/zenodo.7982976, accessed on 20 April 2025) and contains structured biomedical associations among genes, drugs, and diseases. Specifically, the dataset consists of the following three matrices:
- Gene–Drug Matrix (items.csv): A bipartite matrix representing binary interactions between 151 genes and 614 drugs. Each non-zero entry indicates that a gene is associated with a given drug.
- Gene–Disease Matrix (users.csv): a gene–disease interaction matrix where each element indicates the association between a specific gene and disease.
- Drug–Disease Matrix (ratings_mat.csv): this matrix denotes the potential therapeutic effect or association between a drug and a disease.
Each of these matrices was stored in a sparse format and subsequently flattened into edge lists for the purpose of constructing a multi-relational knowledge graph.
3.2. Knowledge Graph Construction
Knowledge graphs (KGs) are structured representations in which biomedical entities such as genes, drugs, and diseases are modeled as nodes, while their interactions are represented as edges. Initially introduced for web-scale information retrieval, KGs have become increasingly important in biomedical research due to their ability to integrate heterogeneous data sources, including genomic data, drug–target interactions, clinical phenotypes, and adverse event records [21].
In healthcare applications, biomedical KGs support tasks such as drug repurposing, disease mechanism discovery, and clinical decision-making by capturing complex multi-relational interactions among biological entities [21,22]. Unlike traditional tabular models, KGs preserve hierarchical and contextual relationships, enabling advanced machine learning tasks such as link prediction, node classification, and anomaly detection. For example, a biomedical KG can simultaneously represent that a drug treats a disease, interacts with a gene, and causes a side effect within a unified graph structure.
Recent studies have demonstrated the effectiveness of KG-based learning for biomedical discovery and therapeutic inference. Hänsel et al. [22] highlighted the role of KGs in integrating real-world clinical data and supporting precision medicine, while graph neural network approaches have successfully identified novel drug–disease associations for infectious diseases such as COVID-19 and Zika [6].
A domain-specific, multi-relational biomedical knowledge graph was constructed to support drug repurposing and substandard medicine detection. Unlike prior approaches that rely on complex integration of multiple public databases (e.g., DrugBank, PharmGKB, SIDER), our graph was derived from a curated matrix-format dataset available through Zenodo. This dataset contains three interlinked modalities: gene–drug, gene–disease, and drug–disease associations.
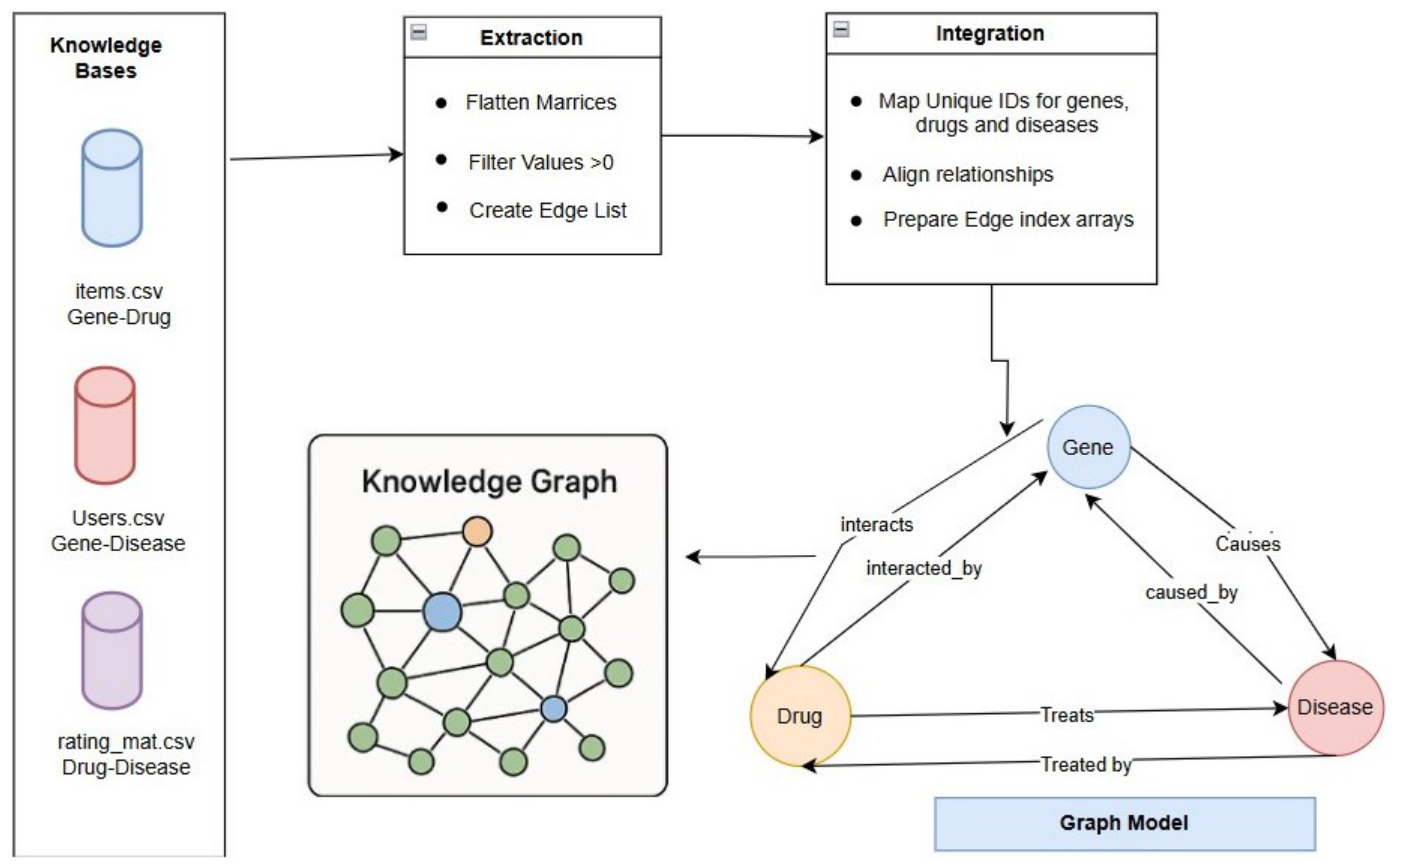
The process begins (Figure 1) with the Knowledge Bases, which are structured datasets stored in CSV files. These include items.csv, representing a matrix of gene–drug interactions; users.csv, capturing gene–disease associations; and ratings_mat.csv, detailing drug–disease treatment relationships. Each file is a sparse matrix where rows and columns represent biological entities, and the cell values indicate the presence or strength of a relationship.
Figure 1.
Steps in the construction of a drug knowledge graph.
In the Extraction phase, these matrices are transformed into edge lists suitable for graph construction. This is done by flattening each matrix using the stack() method, which converts the 2D structure into a long-form table of entity pairs with associated values. Only entries with values greater than zero are retained, ensuring that only meaningful relationships are included. The result is three edge lists: gene–drug, gene–disease, and drug–disease.
The Integration step involves harmonizing these edge lists into a unified format for graph modeling. Unique identifiers are assigned to each gene, drug, and disease using mapping dictionaries. These mappings convert entity names into integer indices, which are required by graph libraries like DGL. The edge lists are then converted into source and destination index arrays, aligning all relationships across the datasets.
Next, the Graph Data Model is defined using DGL’s heterogeneous graph structure. This model includes three node types—gene, drug, and disease—and six edge types to represent both forward and reverse relationships. Specifically, genes interact with drugs (interacts), cause diseases (causes), and drugs treat diseases (treats). Reverse edges such as interacted_by, caused_by, and treated_by are also included to enable bidirectional traversal and richer graph learning. The final edge schema is summarized in Table 1.
Table 1.
Knowledge graph schema.
Finally, the knowledge graph is constructed using the DGL heterograph API. This graph encodes the biological relationships as typed edges between typed nodes, enabling advanced graph-based machine learning tasks. The resulting structure can be used for applications such as link prediction, node classification, and biomedical discovery, leveraging the interconnected nature of genes, drugs, and diseases.
3.3. Graph-Based Representation Learning
3.3.1. Knowledge Graph Embedding
Knowledge graph embedding (KGE) refers to the process of transforming entities and relationships in a knowledge graph into continuous low-dimensional vector representations that preserve semantic, relational, and structural information. These embeddings enable downstream models to exploit graph-structured biomedical data for predictive tasks such as drug–disease link prediction, drug repurposing, and adverse event forecasting.
Traditional embedding methods—such as TransE, TransH, and TransR—represent relationships as translations in vector space, where a valid triple is modeled such that [23]. These approaches have been widely used in biomedical applications for modeling drug–target interactions, gene–disease associations, and disease phenotypes. However, shallow embedding techniques treat all nodes and edges uniformly and fail to capture the complex semantics of heterogeneous biomedical networks that consist of multiple entity and relation types.
3.3.2. From Embedding to Graph Neural Networks
More recently, graph neural networks (GNNs) have become popular due to their ability to capture complex local and global topologies by propagating messages between connected nodes. In biomedical applications, GNNs outperform shallow embedding methods by leveraging node features and multiple relation types [3]. These models generalize well to unseen links and entities by aggregating neighborhood information iteratively.
A particularly effective variant is the Relational Graph Convolutional Network (R-GCN), introduced by [24], which explicitly models multi-relational edge types using separate transformation matrices for each relation. This is especially valuable for biomedical knowledge graphs, where node semantics and relation semantics vary significantly (e.g., treats, causes, interacts).
3.3.3. Relational-Graph Convolution Network
To effectively capture the multi-relational structure of the biomedical knowledge graph constructed from gene–drug–disease associations, we adopted the Relational Graph Convolutional Network (R-GCN) architecture [24]. Unlike traditional GCNs that assume homogeneous edge types, R-GCN extends graph convolutions to heterogeneous graphs by introducing distinct transformation matrices for each relation type. This enables the model to learn how different types of biological interactions (e.g., “treats”, “causes”, “interacts”) affect information propagation through the network.
In our implementation, we constructed a heterogeneous graph using DGL (Deep Graph Library), consisting of three node types (gene, drug, and disease) and six edge types, including bidirectional relations. Each entity type was initialized with a learnable 64-dimensional embedding vector based on the assumption that no high-quality feature vectors were externally available. The R-GCN consisted of two relational convolutional layers with ReLU activation:
- Layer 1: R-GCN (input: 64 → hidden: 64);
- Layer 2: R-GCN (hidden: 64 → output: 64).
The model was trained using DGL’s HeteroGraphConv, which supports multi-relation message passing and aggregates information across all neighboring nodes for each edge type. Each relation (e.g., gene-interacts-drug, drug-treats-disease) was assigned a distinct transformation matrix to preserve semantic integrity.
A two-layer R-GCN was employed to learn low-dimensional embeddings for each node, initialized with 64-dimensional trainable vectors. The learned embeddings serve as the input for two downstream tasks: (1) link prediction for drug repurposing, and (2) classification of substandard drugs. The R-GCN model enables the integration of local neighborhood signals and multi-hop paths, allowing the embeddings of drugs and diseases to encode not only their direct associations but also indirect gene-mediated dependencies, a critical aspect for meaningful biological inference.
Formally, for each node u in the graph, its hidden representation at layer , denoted by , is computed using:
where:
- is the set of relation types in the graph.
- denotes the set of neighbors of node u connected by relation r.
- is the relation-specific transformation matrix at layer l.
- is the transformation matrix for the self-loop.
- is a normalization constant (e.g., the degree of node u under relation r).
- is the activation function, for which we used ReLU.
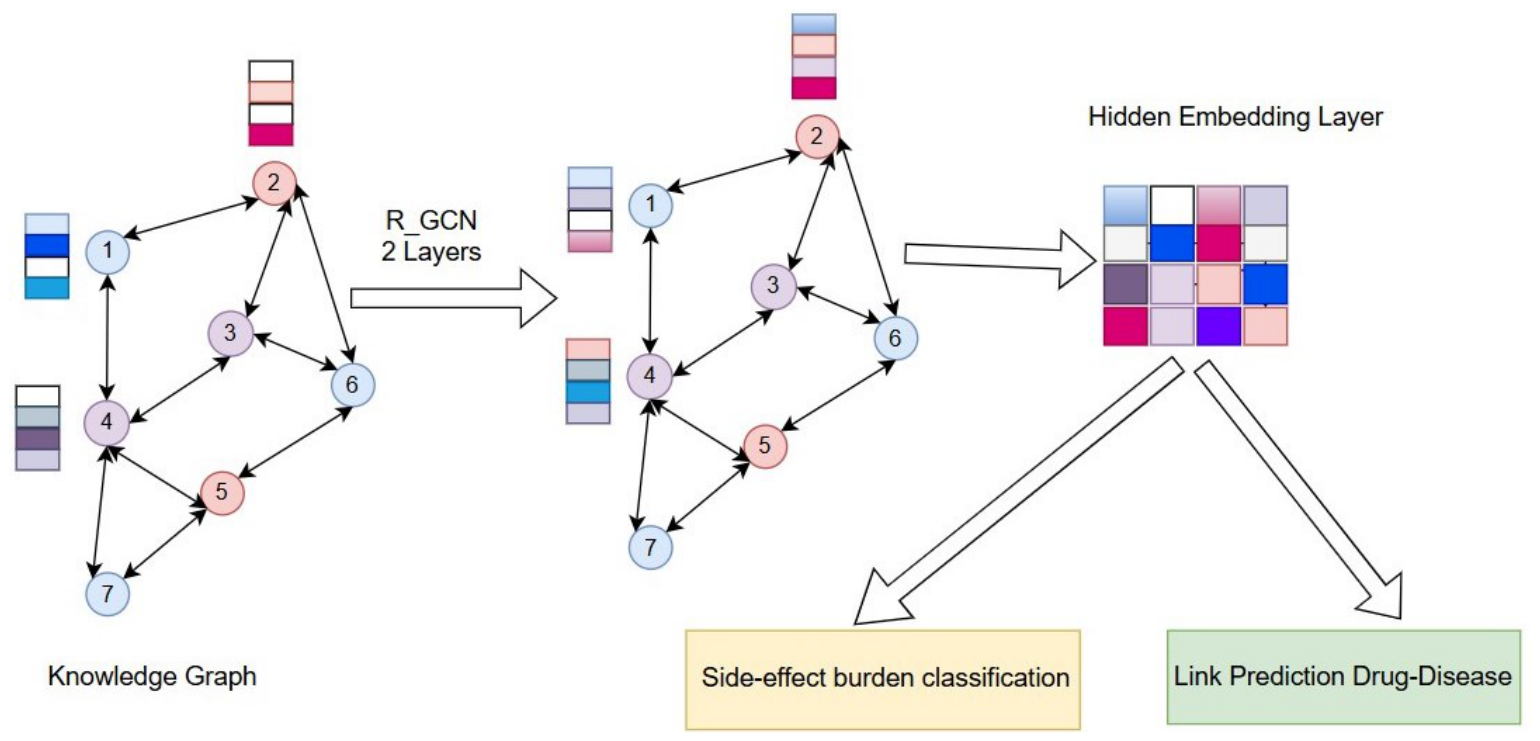
This formulation ensures that each node aggregates relationally aware messages from its neighborhood while preserving its own embedding through the self-loop transformation. The resulting embeddings are semantically rich and encode the diverse types of interactions present in the biomedical knowledge graph. The overall pipeline for graph-based embedding and prediction is illustrated in Figure 2.
Figure 2.
Graph-based embedding and learning pipeline. A multi-relational biomedical knowledge graph is constructed with gene, drug, and disease nodes. A two-layer R-GCN is used to learn low-dimensional embeddings, which are subsequently used in downstream tasks: drug–disease link prediction and side-effect burden classification.
3.4. Predictive Tasks and Evaluation
After learning node embeddings using the R-GCN model, we evaluate their effectiveness through two downstream predictive tasks: (1) drug–disease link prediction and (2) drug side-effect burden classification. These tasks demonstrate the ability of the learned representations to capture both therapeutic and safety-related information from the multi-relational knowledge graph.
3.4.1. Drug–Disease Link Prediction
Drug–disease link prediction is formulated as a binary classification problem, where the goal is to determine whether a given drug can treat a specific disease. For a drug node d and disease node s, we compute a compatibility score using a bilinear function:
where and denote the learned embeddings of drug and disease nodes, respectively, W is a trainable weight matrix, and is the sigmoid activation function.
Training Setup:
- Positive samples are obtained from known drug–disease associations.
- Negative samples are generated by randomly pairing drugs and diseases with no observed links.
- The dataset is split into 70% training and 30% testing. To prevent information leakage, embeddings were learned using only the training subgraph constructed from the training split, rather than the full knowledge graph.
- The model is optimized using binary cross-entropy loss with the Adam optimizer.
Evaluation metrics: performance is evaluated using accuracy, precision, recall, and F1-score.
Ranking evaluation: In addition to classification metrics, we evaluate ranking performance using Mean Reciprocal Rank (MRR) and Hits@K (K = 1, 3, 10). A filtered evaluation protocol is used, where known positive pairs are excluded from candidate rankings except the target pair.
3.4.2. Baseline Models
To benchmark the proposed R-GCN framework, we compared its performance with two widely used knowledge graph embedding (KGE) models: TransE and DistMult. These models are commonly employed as baseline methods in biomedical link prediction and drug-repurposing studies due to their simplicity, scalability, and effectiveness in modeling relational data [23,25].
TransE, introduced by Bordes et al. [23], represents relationships as translations in embedding space, where a valid triplet is modeled such that , with h, r, and t representing the head entity, relation, and tail entity embeddings, respectively. TransE is computationally efficient and performs well for simple relational structures; however, it has limited capacity to model complex many-to-many biomedical relationships.
DistMult, proposed by Yang et al. [25], employs a bilinear scoring function using diagonal relation matrices to measure compatibility between entities and relations. Compared to TransE, DistMult can better capture symmetric interactions but still lacks explicit neighborhood aggregation and relational message-passing mechanisms.
Unlike these shallow embedding approaches, R-GCN performs relation-aware message propagation across neighboring nodes, enabling the model to capture multi-hop biological dependencies and heterogeneous semantic interactions among genes, drugs, and diseases.
To ensure fair comparison, all models were trained and evaluated using the same train/test split, negative sampling strategy, embedding dimension, and evaluation protocol. Performance was assessed using Accuracy, precision, recall, F1-score, Mean Reciprocal Rank (MRR), and Hits@K metrics.
3.4.3. Summary of Evaluation Metrics
We employ the following standard metrics across tasks:
- Accuracy: overall correctness of predictions.
- Precision: ratio of true positives among predicted positives.
- Recall: ratio of true positives among actual positives.
- F1-score: harmonic mean of precision and recall.
- MRR: average reciprocal rank of true associations.
- Hits@K: proportion of true associations ranked within top K predictions.
3.4.4. Drug Side-Effect Burden Prediction
Instead of modeling substandard drug quality, which requires validated manufacturing and regulatory data, we formulate a related but distinct task: predicting the side-effect burden of drugs using graph-based representations. We define side-effect burden as the number of unique adverse effects associated with a drug, derived from an external adverse event dataset. Drugs with higher numbers of reported side effects may indicate more complex safety profiles, increased off-target interactions, or broader pharmacological activity.
To construct a supervised learning task, we adopt a surrogate labeling strategy. Drugs are categorized into two classes based on the distribution of side-effect counts. Specifically, drugs above the 60th percentile are labeled as “high side-effect burden,” while those below the threshold are labeled as “low side-effect burden.” We emphasize that this labeling does not correspond to regulatory definitions of substandard or falsified medicines, but rather serves as a proxy for modeling safety-related characteristics in the absence of standardized quality datasets.
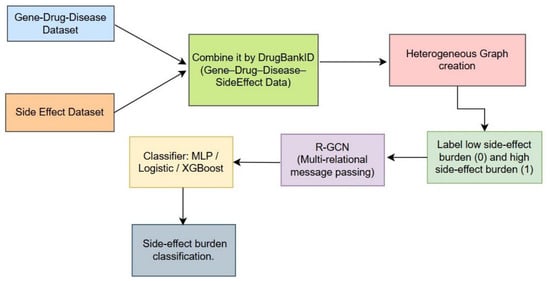
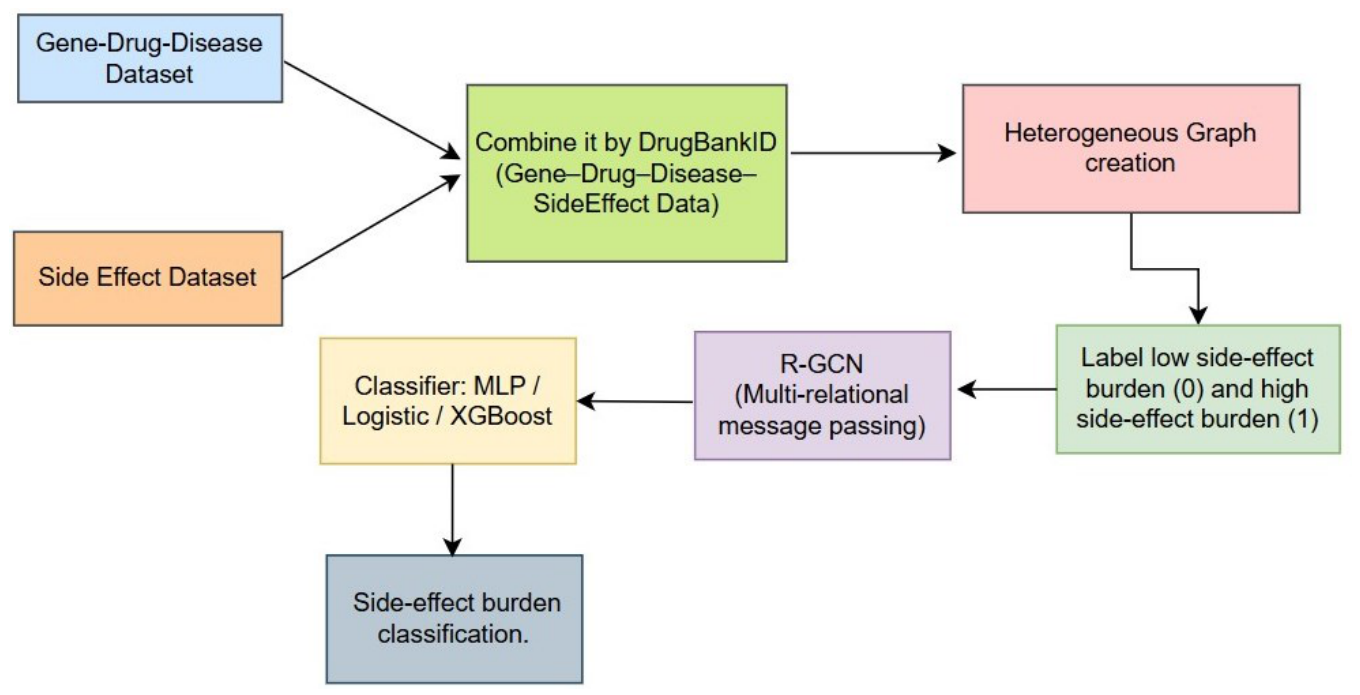
The overall workflow for integrating side effect data with the gene–drug–disease knowledge graph and classifying substandard drugs is illustrated in Figure 3.
Figure 3.
Pipeline for side-effect burden classification. The gene–drug–disease dataset is integrated with side effect data via DrugBank ID mapping to form a unified biomedical knowledge graph. A heterogeneous graph is created and labeled based on side-effect burden, where drugs above a threshold are considered substandard. A relational graph convolutional network (R-GCN) is used to learn node embeddings, which are then fed into classifiers (MLP, Logistic Regression, XGBoost) to predict substandard drug candidates.
- Mapping Side Effect Data
We utilized an adverse effect dataset (drugs_side_effects_drugs_com.csv) sourced from https://www.kaggle.com/ (accessed on 15 May 2025), which contains a curated list of known side effects for marketed drugs. Each entry in this dataset includes a drug name, the medical condition for which it is prescribed, and the associated adverse effects. To align this external source with our internal graph structure, we first mapped each drug name in the side-effect dataset to its corresponding DrugBank ID using a mapping table (drug-mappings.tsv), which contains DrugBank IDs and drug names. This mapping ensures a unified identifier schema across all datasets—gene–drug–disease associations and adverse event profiles—facilitating accurate node integration in the graph.
- Graph Integration and Structure
Once the DrugBank ID mapping was complete, we merged the side effect data into the graph structure. The resulting heterogeneous graph included five node types: gene, drug, disease, condition, and side effect, and multiple directed edge types, such as:
- (gene, interacts, drug).
- (gene, causes, disease).
- (drug, treats, disease).
- (drug, treats_condition, condition).
- (drug, causes_side_effect, side_effect).
Bidirectional edges (e.g., treated_by, interacted_by) were also included to ensure richer message propagation during graph convolution. This multi-relational graph structure was implemented using DGL’s heterograph API, allowing for fine-grained representation of biological semantics.
- Side-Effect Burden Label Generation
Due to the absence of a publicly available ground-truth dataset for substandard drugs, we adopted a **data-driven surrogate labeling strategy** based on the side-effect burden. For each drug node, we calculated the number of unique side effects linked to it via the causes_side_effect relation. The distribution of side effect counts was analyzed, and drugs falling above the 60th percentile threshold were labeled as high side-effect burden (label = 1), under the assumption that an unusually high burden of adverse effects may signal problematic efficacy, formulation, or off-target toxicity. Drugs below this threshold were labeled as low side-effect burden (label = 0). The result was a binary classification problem on the set of drug nodes, where labels reflected real-world side effect patterns.
- Embedding and Classification
The heterogeneous graph was encoded using a two-layer Relational Graph Convolutional Network (R-GCN), trained to learn 64-dimensional embeddings for each node type. These embeddings captured both local and multi-hop neighborhood information, including gene–disease–drug–side-effect pathways, which are critical for inferring quality signals. The drug node embeddings were extracted and used as input features for three downstream classifiers:
- Multilayer Perceptron (MLP): a simple neural network with two dense layers (64 → 32 → 2) and ReLU activation.
- Logistic Regression: a linear model trained with L2 regularization using scikit-learn.
- XGBoost: a tree-based ensemble classifier optimized for binary classification, known for its robustness to feature interactions and imbalanced data.
4. Results and Discussion
This section presents the experimental results for the two primary predictive tasks: (1) drug–disease link prediction, and (2) drug side-effect burden classification. The results demonstrate the effectiveness of relational graph learning in capturing both therapeutic and safety-related patterns.
4.1. Drug–Disease Link Prediction Performance
The R-GCN model achieves strong performance in the link prediction task, demonstrating its ability to recover missing therapeutic associations from the knowledge graph. The classification results are summarized in Table 2.
Table 2.
Performance comparison of link prediction models for drug–disease association prediction.
The R-GCN model significantly outperforms both baseline methods across all classification metrics. These metrics indicate strong model generalization, particularly its ability to recover missing or unknown drug–disease associations. The high recall is particularly valuable in drug-repurposing contexts, where false negatives (i.e., missing a true repurposable drug) are more costly than false positives.
The effectiveness of the model can be attributed to the multi-relational graph structure, which allows the R-GCN to capture indirect paths such as:
These paths encode plausible biological mechanisms, such as a drug modulating a gene that is implicated in the pathology of a disease. Without incorporating gene nodes, such transitive reasoning would not be possible.
4.2. Ranking Performance Evaluation
To further assess model effectiveness, we evaluate ranking performance using MRR and Hits@K. The results are shown in Table 3.
Table 3.
Ranking performance comparison.
R-GCN achieves the highest ranking performance, with an MRR of 0.2505 and Hits@10 of 0.4463. While DistMult performs competitively in ranking tasks, it lacks the ability to incorporate relational neighborhood information. TransE shows the weakest performance due to its limited representational capacity for complex biomedical relationships.
These results highlight that relational message passing is essential for prioritizing biologically meaningful drug–disease associations.
4.3. Validation Using a Held-Out FDA-Approved Association
To validate that high prediction scores correspond to clinically meaningful therapeutic relationships, we analyzed a known FDA-approved drug–disease association that was intentionally held out during training and included in the test set. Specifically, we evaluated Cladribine (DB00242) for Hairy Cell Leukemia (C1851945), a well-established FDA-approved indication. Cladribine received FDA approval in 1993 as a first-line treatment for hairy cell leukemia and remains a standard therapy for this disease [26].
Using the same evaluation protocol applied to all test pairs, we computed the prediction score and ranking for this held-out association among all disease candidates for Cladribine. The R-GCN model assigned a perfect prediction score of 1.0000 and ranked Hairy Cell Leukemia as the top prediction (Rank 1).
This result demonstrates the model’s ability to successfully recover clinically validated therapeutic relationships that were not observed during training. The experiment further confirms that the generated link prediction scores capture biologically and clinically meaningful drug–disease associations, supporting the framework’s utility for drug repurposing and therapeutic hypothesis generation.
4.4. Drug Side-Effect Burden Classification
To evaluate safety-related predictions, we classify drugs based on side-effect burden using R-GCN embeddings as input features. Three classifiers were evaluated: Multilayer Perceptron (MLP), Logistic Regression, and XGBoost. The results are summarized in Table 4.
Table 4.
Side-effect burden classification performance.
The classification task demonstrates that the learned embeddings for drugs retain sufficient information to distinguish between drugs with high and low side-effect burden. This reflects the model’s ability to capture safety-related patterns from the graph structure rather than identifying true substandard medicines. It is important to note that the labels are derived from side-effect counts and do not correspond to regulatory definitions of substandard or falsified drugs. Among the evaluated models, XGBoost achieves the best performance, significantly outperforming both MLP and Logistic Regression.
While the substandard labels were synthetically generated due to the lack of public quality control datasets, this task serves as a proof-of-concept that relational graph embeddings can support auxiliary surveillance tasks in pharmaceutical informatics. In a real-world scenario, integrating additional metadata (e.g., manufacturing site, recall history, regulatory flags) into the graph could make this classification even more effective.
4.5. Comparison with Prior Work
While prior studies have demonstrated the effectiveness of knowledge graph embeddings and graph neural networks for drug repurposing, most approaches focus on a single predictive task. In contrast, our framework demonstrates that a unified R-GCN-based representation can support multiple downstream tasks, including both drug–disease link prediction and side-effect burden prediction.
Additionally, unlike large-scale knowledge graphs such as DRKG that require extensive data integration, our approach shows that a compact, curated graph can still achieve competitive performance. This highlights the efficiency and practicality of the proposed framework, particularly in data-constrained settings.
In [9], a drug knowledge graph was constructed using multiple public biomedical databases, and embedding- and path-based features were used for predicting treatment links. Our approach builds on this by using a single-source dataset but applying a deep graph model capable of capturing multi-hop semantics without manual feature engineering.
Ref. [4] introduced large-scale knowledge graphs for COVID-19 drug repurposing (DRKG). While their models rely on extensive integration of omics and literature data, our work demonstrates that even relatively compact graphs focused on gene–drug–disease triads can yield competitive results when powered by relational GNNs.
4.6. Interpretability and Practical Implications
One of the key strengths of the knowledge-graph-based framework is its interpretability. Through techniques such as edge attention weighting or path scoring, one can identify biologically meaningful chains of interactions that led to a high prediction score for a drug–disease pair. This aligns with emerging practices in explainable AI (XAI) for biomedical applications.
From a deployment perspective, this approach has potential use cases in:
- Pre-screening: identifying promising candidates for wet-lab validation in drug repurposing.
- Pharmacovigilance: detecting quality or safety risks by observing deviations in the graph neighborhood of a drug.
- Data completion: filling in missing annotations in public biomedical databases using graph inference.
4.7. Limitations and Future Directions
Despite demonstrating strong performance in both drug-repurposing and side-effect burden drug classification tasks, this study has several limitations that warrant future improvement.
Limitations: First, the classification task relied on surrogate labels derived from side-effect burden rather than validated drug quality data. While this enables modeling of safety-related patterns, it does not reflect true regulatory definitions of substandard medicines. Second, the knowledge graph was built from a single-source dataset without integration of additional biomedical modalities such as pathway information, gene expression profiles, or real-world evidence (e.g., pharmacovigilance records or manufacturing data). Third, while R-GCN provides relational learning capabilities, it lacks mechanisms to capture higher-order semantic dependencies and attention-based contextualization that could further enhance interpretability and performance. Additionally, the graph lacks temporal granularity, such as dosage duration or longitudinal side-effect trends, which are critical for pharmacodynamic modeling.
Looking ahead, expanding the graph to include additional biomedical modalities—such as signaling pathways, gene expression profiles, and pharmacovigilance alerts—could enrich the representation and support more nuanced predictions. Moreover, incorporating advanced graph architectures like Heterogeneous Graph Transformers or relation-aware attention mechanisms may further boost the model’s interpretability and performance. The integration of temporal dynamics and self-supervised learning techniques also presents a promising direction, allowing the framework to adapt to evolving biomedical knowledge while maintaining scalability and robustness.
4.8. Case Study: R-GCN Prediction of Hidden Drug–Disease Associations
To demonstrate the practical value of the R-GCN-based framework, we present two case studies involving multiple drug–disease pairs that were not directly connected in the training knowledge graph but were predicted with high confidence by the link prediction model. These cases highlight the model’s ability to uncover biologically meaningful and potentially novel therapeutic relationships through multi-hop semantic reasoning.
4.8.1. Case Study 1: DB00091 → Cancer and Inflammatory Diseases
The R-GCN model predicts DB00091 as a high-confidence candidate associated with multiple diseases, including Breast Cancer (C0004626) and Colon Cancer (C0010346). To validate these predictions, we analyze intermediate gene-mediated paths:
- DB00091 → AKR1C3 → Colon Cancer.
- DB00091 → CEBPB → Breast Cancer.
AKR1C3 is strongly associated with hormone-dependent cancers and plays a role in tumor progression and drug resistance [27]. Similarly, CEBPB regulates inflammatory and oncogenic signaling pathways, contributing to cancer development [28].
These findings suggest that the predicted drug–disease associations are supported by shared biological mechanisms involving metabolic regulation and inflammation.
4.8.2. Case Study 2: DB00091 → Neurological and Immune Disorders
The model also predicts associations between DB00091 and diseases such as multiple sclerosis (C0020179) and asthma (C0004096), supported by the following paths:
- DB00091 → OLIG1 → multiple sclerosis.
- DB00091 → FOLR1 → asthma.
OLIG1 plays a central role in oligodendrocyte differentiation and remyelination, processes that are critically impaired in multiple sclerosis [29]. Additionally, FOLR1 (folate receptor alpha) is involved in folate-mediated cellular proliferation and is overexpressed in various disease conditions, supporting its relevance in proliferative and inflammatory pathways [30].
These results indicate that the model captures biologically meaningful pathways connecting drug activity to neurological and immune-related diseases.
- Interpretation
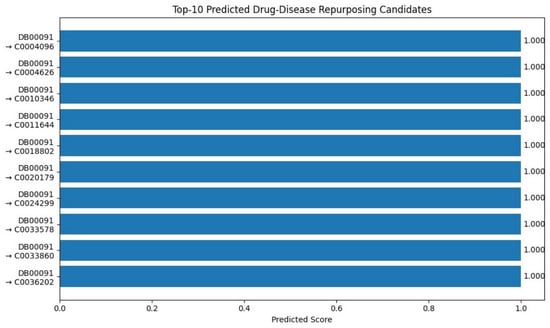
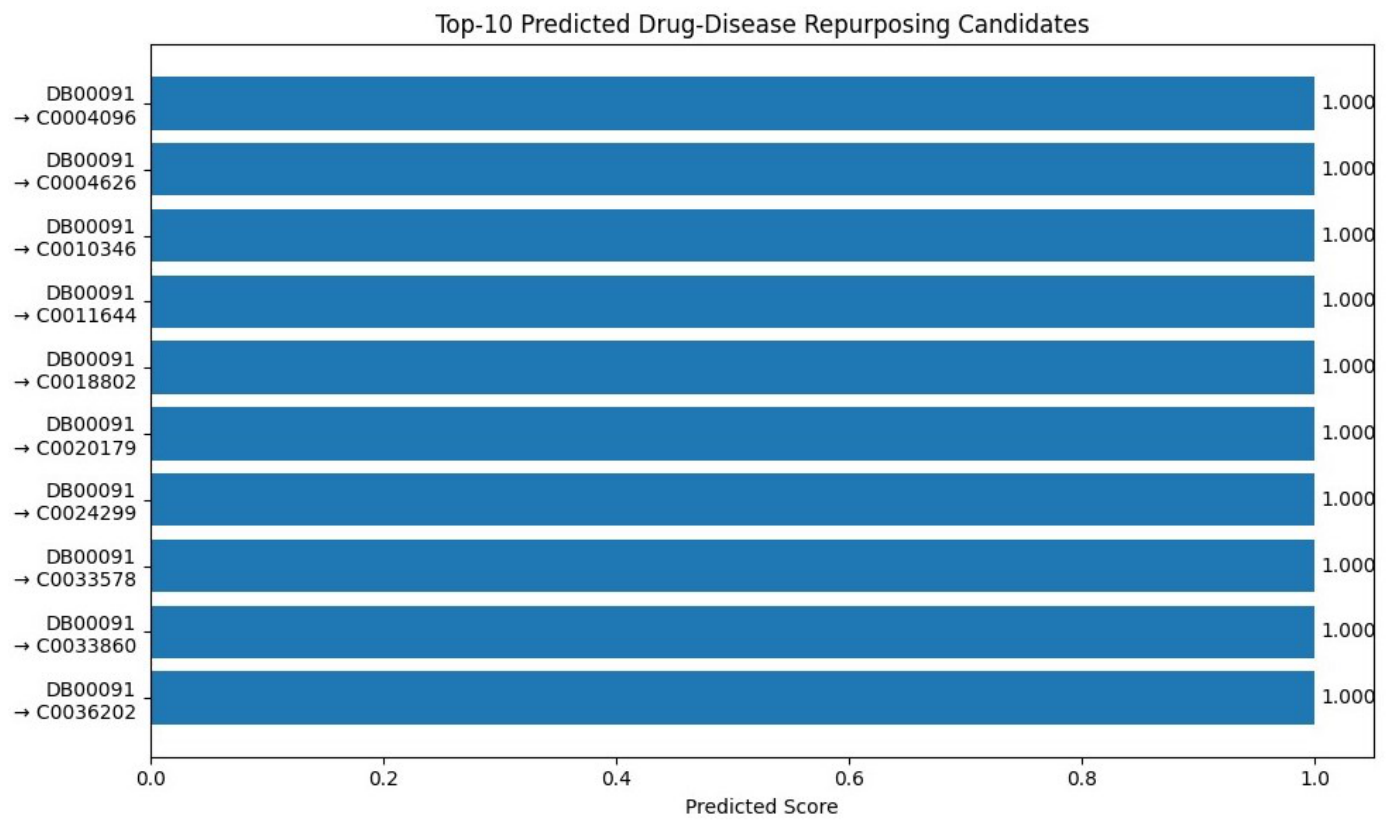
These two cases illustrate how the R-GCN framework leverages two-hop relational paths (drug → gene → disease) to identify potentially novel drug–disease associations. The biological plausibility of these paths, supported by high-confidence predictions and structured graph signals, demonstrates the model’s capacity to guide hypothesis-driven drug repurposing. These predictions warrant further investigation through experimental validation and literature synthesis. Figure 4 shows the top 10 predicted drug–disease associations from the R-GCN model. Each predicted pair received a maximum confidence score of 1.0000 and was not present in the training graph, highlighting the model’s ability to infer hidden associations.
Figure 4.
Top 10 predicted drug–disease repurposing candidates by the R-GCN model. All predictions involve the drug DB00091 (Cyclosporine) and diseases for which no direct edge existed in the training knowledge graph. Each pair received the maximum prediction score of 1.0000. These results suggest strong confidence in potential repositioning hypotheses, driven by multi-hop graph structure.
5. Conclusions
This work highlights the effectiveness of a multi-task graph representation learning approach, demonstrating that a single relational embedding space can support both therapeutic discovery and safety-related analysis. By constructing a heterogeneous knowledge graph from gene–drug–disease associations and applying a relational graph convolutional network (R-GCN), we demonstrated the ability to learn biologically meaningful node embeddings that support multiple predictive tasks.
Our approach achieved strong performance in drug–disease link prediction, attaining an accuracy of 94.63% and a recall of 95.87%, showcasing the utility of graph-based inference for uncovering hidden therapeutic relationships. Additionally, we evaluated the feasibility of side-effect burden classification using surrogate labels, where our embedding-based classifiers achieved up to 97.14% F1-score, with XGBoost outperforming other models.
These results confirm that R-GCN significantly outperforms classical embedding methods such as TransE and DistMult, highlighting the importance of relational message passing in capturing complex biomedical interactions.
The proposed methodology provides a scalable and explainable alternative to traditional drug-repurposing pipelines, especially in data-limited settings. While our current implementation relies on a single-source dataset and surrogate quality labels, it lays a solid foundation for future integration of real-world adverse event, manufacturing, and regulatory data.
Future work will focus on extending the graph schema to include additional biomedical modalities such as pathways, gene expression profiles, and pharmacovigilance data, as well as exploring advanced architectures including heterogeneous graph transformers and self-supervised learning frameworks.
Author Contributions
Conceptualization, A.S. and B.U.M.; methodology, A.S.; software, A.S.; validation, B.U.M. and A.S.; formal analysis, B.U.M. and A.S.; investigation, B.U.M. and A.S.; resources, B.U.M.; data curation, B.U.M.; writing—original draft preparation, A.S. and B.U.M.; writing—review and editing, B.U.M. and A.S.; visualization, A.S.; supervision, B.U.M.; project administration, B.U.M. All authors have read and agreed to the published version of the manuscript.
Funding
This research received no external funding.
Institutional Review Board Statement
Not applicable.
Informed Consent Statement
Not applicable.
Data Availability Statement
Data are contained within the article.
Conflicts of Interest
The authors declare no conflicts of interest.
References
- Pushpakom, S.; Iorio, F.; Eyers, P.A.; Escott, K.J.; Hopper, S.; Wells, A.; Doig, A.; Guilliams, T.; Latimer, J.; McNamee, C.; et al. Drug repurposing: Progress, challenges and recommendations. Nat. Rev. Drug Discov. 2019, 18, 41–58. [Google Scholar] [CrossRef] [Scilit] [PubMed]
- Schcolnik-Cabrera, A. Drug repurposing: Strategies and study design for bringing back old drugs to the mainline. In The Quintessence of Basic and Clinical Research and Scientific Publishing; Springer: Singapore, 2023; pp. 595–615. [Google Scholar]
- Wang, Q.; Mao, Z.; Wang, B.; Guo, L.; Zhang, L. Knowledge graph embedding: A survey of approaches and applications. IEEE Trans. Knowl. Data Eng. 2017, 29, 2724–2743. [Google Scholar] [CrossRef] [Scilit]
- Gysi, D.M.; Valle, Í.d.; Zitnik, M.; Ameli, A.; Gan, X.; Varol, O.; Ghiassian, S.D.; Patten, J.; Davey, R.; Loscalzo, J.; et al. Network medicine framework for identifying drug repurposing opportunities for COVID-19. Proc. Natl. Acad. Sci. USA 2021, 118, e2025581118. [Google Scholar] [CrossRef] [Scilit]
- Li, S.; Wong, K.W.; Zhu, D.; Fung, C.C. Drug-CoV: A drug-origin knowledge graph discovering drug repurposing targeting COVID-19. Knowl. Inf. Syst. 2023, 65, 5289–5308. [Google Scholar] [CrossRef] [Scilit]
- Yue, R.; Dutta, A. Repurposing drugs for infectious diseases by graph convolutional network with sensitivity-based graph reduction. Interdiscip. Sci. Comput. Life Sci. 2025, 17, 185–199. [Google Scholar] [CrossRef] [Scilit]
- World Health Organization. A Study on the Public Health and Socioeconomic Impact of Substandard and Falsified Medical Products; World Health Organization: Geneva, Switzerland, 2017. [Google Scholar]
- Himmelstein, D.S.; Lizee, A.; Hessler, C.; Brueggeman, L.; Chen, D.; Hadley, D.; Green, A.; Khankhanian, P.; Baranzini, S.E. Systematic integration of biomedical knowledge prioritizes drugs for repurposing. eLife 2017, 6, e26726. [Google Scholar] [CrossRef] [Scilit]
- Zhu, Y.; Che, C.; Jin, B.; Zhang, N.; Su, C.; Wang, F. Knowledge-driven drug repurposing using a comprehensive drug knowledge graph. Health Inform. J. 2020, 26, 2737–2750. [Google Scholar] [CrossRef] [Scilit] [PubMed]
- Al-Saleem, J.; Granet, R.; Ramakrishnan, S.; Ciancetta, N.A.; Saveson, C.; Gessner, C.; Zhou, Q. Knowledge graph-based approaches to drug repurposing for COVID-19. J. Chem. Inf. Model. 2021, 61, 4058–4067. [Google Scholar] [CrossRef] [Scilit]
- Domingo-Fernández, D.; Baksi, S.; Schultz, B.; Gadiya, Y.; Karki, R.; Raschka, T.; Ebeling, C.; Hofmann-Apitius, M.; Kodamullil, A.T. COVID-19 Knowledge Graph: A computable, multi-modal, cause-and-effect knowledge model of COVID-19 pathophysiology. Bioinformatics 2021, 37, 1332–1334. [Google Scholar] [CrossRef] [Scilit] [PubMed]
- Yan, V.K.C.; Li, X.; Ye, X.; Ou, M.; Luo, R.; Zhang, Q.; Tang, B.; Cowling, B.J.; Hung, I.; Siu, C.W.; et al. Drug repurposing for the treatment of COVID-19: A knowledge graph approach. Adv. Ther. 2021, 4, 2100055. [Google Scholar] [CrossRef] [Scilit] [PubMed]
- Yse, D.L.; Torres, D. Drug repurposing using knowledge graph embeddings with a focus on vector-borne diseases: A model comparison. In Cloud Computing, Big Data & Emerging Topics; Springer: Cham, Switzerland, 2023; pp. 105–117. [Google Scholar]
- Tayebi, J.; BabaAli, B. EKGDR: An End-to-End Knowledge Graph-Based Method for Computational Drug Repurposing. J. Chem. Inf. Model. 2024, 64, 1868–1881. [Google Scholar] [CrossRef] [Scilit]
- Huang, K.; Chandak, P.; Wang, Q.; Havaldar, S.; Vaid, A.; Leskovec, J.; Nadkarni, G.N.; Glicksberg, B.S.; Gehlenborg, N.; Zitnik, M. A foundation model for clinician-centered drug repurposing. Nat. Med. 2024, 30, 3601–3613. [Google Scholar] [CrossRef] [Scilit] [PubMed]
- Li, W.; Ma, W.; Yang, M.; Tang, X. Drug repurposing based on the DTD-GNN graph neural network: Revealing the relationships among drugs, targets and diseases. BMC Genom. 2024, 25, 584. [Google Scholar] [CrossRef] [Scilit]
- Cohen, S.; Hershcovitch, M.; Taraz, M.; Kißig, O.; Wood, A.; Waddington, D.; Chin, P.; Friedrich, T. Drug Repurposing Using Link Prediction on Knowledge Graphs with Applications to Non-volatile Memory. In Complex Networks & Their Applications X; Springer: Cham, Switzerland, 2022; pp. 742–753. [Google Scholar]
- Teo, D.C.H.; Huang, Y.; Dorajoo, S.R.; Ng, M.S.Y.; Choong, C.T.; Phuah, D.S.T.; Tan, D.H.M.; Tan, F.M.; Huang, H.; Tan, M.S.H.; et al. Automated Classification of Quality Defect Issues Relating to Substandard Medicines Using a Hybrid Machine Learning and Rule-Based Approach. Drug Saf. 2023, 46, 975–989. [Google Scholar] [CrossRef] [Scilit]
- Zhai, Y.; Chen, L.; Deng, M. scGAD: A new task and end-to-end framework for generalized cell type annotation and discovery. Brief. Bioinform. 2023, 24, bbad045. [Google Scholar] [CrossRef] [Scilit]
- Bang, D.; Lim, S.; Lee, S.; Kim, S. Biomedical knowledge graph learning for drug repurposing by extending guilt-by-association to multiple layers. Nat. Commun. 2023, 14, 3570. [Google Scholar] [CrossRef] [Scilit]
- Peng, C.; Xia, F.; Naseriparsa, M.; Osborne, F. Knowledge graphs: Opportunities and challenges. Artif. Intell. Rev. 2023, 56, 13071–13102. [Google Scholar] [CrossRef] [Scilit] [PubMed]
- Hänsel, K.; Dudgeon, S.N.; Cheung, K.-H.; Durant, T.J.S.; Schulz, W.L. From data to wisdom: Biomedical knowledge graphs for real-world data insights. J. Med. Syst. 2023, 47, 65. [Google Scholar] [CrossRef] [Scilit]
- Bordes, A.; Usunier, N.; Garcia-Durán, A.; Weston, J.; Yakhnenko, O. Translating embeddings for modeling multi-relational data. In Proceedings of the 27th International Conference on Neural Information Processing Systems, Lake Tahoe, NV, USA, 5–10 December 2013; Volume 26. [Google Scholar]
- Schlichtkrull, M.; Kipf, T.N.; Bloem, P.; Berg, R.v.; Titov, I.; Welling, M. Modeling relational data with graph convolutional networks. arXiv 2018, arXiv:1703.06103. [Google Scholar] [CrossRef] [Scilit]
- Ji, G.; He, S.; Xu, L.; Zhao, J. Knowledge graph embedding via dynamic mapping matrix. In Proceedings of the 53rd Annual Meeting of the Association for Computational Linguistics and the 7th International Joint Conference on Natural Language Processing (Volume 1: Long Papers); Association for Computational Linguistics: Beijing, China, 2015; pp. 687–696. [Google Scholar] [CrossRef] [Scilit]
- Goodman, G.R.; Burian, C.; Koziol, J.A.; Saven, A. Extended follow-up of patients with hairy cell leukemia after treatment with cladribine. J. Clin. Oncol. 2003, 21, 891–896. [Google Scholar] [CrossRef] [Scilit] [PubMed]
- Penning, T.M. AKR1C3 (type 5 17β-hydroxysteroid dehydrogenase/prostaglandin F synthase): Roles in malignancy and endocrine disorders. Mol. Cell. Endocrinol. 2019, 489, 82–91. [Google Scholar] [CrossRef] [Scilit] [PubMed]
- Wang, X.; Luo, L.; Zhang, Y.; Liu, G.; Fang, Z.; Xu, Z.; Hu, X. CENPB promotes the proliferation of hepatocellular carcinoma and is directly regulated by miR-29a. Aging 2023, 15, 12171–12191. [Google Scholar] [CrossRef] [Scilit]
- Arnett, H.A.; Mason, J.; Marino, M.; Suzuki, K.; Matsushima, G.K.; Ting, J.P. Functional genomic analysis of remyelination reveals importance of inflammation in oligodendrocyte regeneration. J. Neurosci. 2003, 24, 8494–8503. [Google Scholar] [CrossRef] [Scilit] [PubMed]
- Low, P.S.; Kularatne, S.A. Folate-targeted therapeutic and imaging agents for cancer. Curr. Opin. Chem. Biol. 2009, 13, 256–262. [Google Scholar] [CrossRef] [Scilit] [PubMed]

Disclaimer/Publisher’s Note: The statements, opinions and data contained in all publications are solely those of the individual author(s) and contributor(s) and not of MDPI and/or the editor(s). MDPI and/or the editor(s) disclaim responsibility for any injury to people or property resulting from any ideas, methods, instructions or products referred to in the content. |
© 2026 by the authors. Licensee MDPI, Basel, Switzerland. This article is an open access article distributed under the terms and conditions of the Creative Commons Attribution (CC BY) license.