


Simple Summary
Owls are night predators that eat mainly small animals such as rodents, birds, and large insects. Many owl species live in the same regions and often hunt similar prey, but they differ in body size, hunting behavior, and habitat use. Most studies of owl diets focus on lists of prey species, which show what owls eat but not how diverse their food is in ecological or evolutionary terms. In this study, we examined the diets of nine owl species breeding in East-Central and South-Eastern Europe using a broader approach. We compared not only how many prey species each owl consumed, but also how evenly prey were used, how different prey were in their ecological traits, and how closely related prey species were. We found large differences among owl species. Some owls ate many prey species but relied mainly on a few dominant ones, while others consumed fewer prey species but drew from a wider range of evolutionary lineages. These results show that owl diets are more complex than species lists alone suggest. A better understanding of owl feeding strategies can help scientists predict how owl populations may respond to environmental change and guide conservation efforts in agricultural and natural landscapes.
Abstract
Diet diversity of owls has traditionally been studied using prey taxonomic composition, but species identities alone do not necessarily capture ecological roles, energetic dominance, or evolutionary breadth of prey. Here we quantified diversity across taxonomic, functional, and phylogenetic dimensions of prey of nine European owl species: Aegolius funereus, Asio otus, Athene noctua, Bubo bubo, Glaucidium passerinum, Otus scops, Strix uralensis, Strix aluco, and Tyto alba. Using a unified Hill-number framework we estimated richness- and evenness-sensitive diversity and evaluated prey assemblage structures using standardized effect sizes from richness-controlled null models. Prey diversity varied strikingly among owls. Diet strongly relied on a limited set of functionally and phylogenetically similar prey. Bubo bubo showed high richness but low evenness, Otus scops specialization, Glaucidium passerinum high evenness, and Athene noctua high phylogenetic breadth. Large differences in taxonomic richness were frequently decoupled from functional or evolutionary breadth, for example in Bubo bubo and Athene noctua. Structural analyses revealed phylogenetic overdispersion in Athene noctua and Otus scops, clustering in Glaucidium passerinum, and extreme functional clustering in Tyto alba and Asio otus. Together, these results show that owl diets are structured along multiple, partially independent axes, best revealed by combining Hill-number profiles with null-model analyses.
1. Introduction
Owls (Strigiformes) are key nocturnal predators in terrestrial ecosystems. Across Europe, multiple owl species coexist at regional scales and exploit broadly similar prey—predominantly small terrestrial vertebrates, in some species, large invertebrates—while differing in body size, hunting strategies, and habitat use [1,2]. Owls can be treated as a foraging guild, defined as a group of species exploiting the same class of food resources in a broadly similar way [3,4], within which dietary overlap is structured by niche partitioning along multiple axes, including prey size, prey type, habitat, and temporal activity [5,6,7,8].
Traditionally, owl diet studies have focused on the taxonomic composition of prey and prey frequencies derived from pellet analyses. This approach has generated extensive knowledge on diet characteristics, prey selection, seasonal and geographic variation, and interspecific dietary overlap of owls (e.g., [2,9,10,11,12,13]). Many studies of owl diets also considered limited elements of functional traits of prey, like biomass, or habitat use (e.g., [5,12,14,15,16]). More recently, some studies have applied multidimensional approaches. Vrezec et al. [17] combined taxonomic composition with several prey functional traits to examine geographic variation in the diet of Strix uralensis. Comay & Dayan [7] integrated prey taxonomy, numerous prey traits, predator identity, and environmental variables to analyze prey selection in five sympatric owl species. Ramellini et al. [8] showed that trophic niches within an owl foraging guild segregate along multiple dietary axes, such as prey size, diet diversity, evenness, and environmental gradients, rather than taxonomic composition alone. In general, diet diversity of owls has been associated mainly with species (taxonomic) richness, but taxonomic richness alone may provide an incomplete picture of trophic niche structure, because species identities do not necessarily capture ecological roles or energetic dominance of prey [18,19]. Diets that may be taxonomically highly diverse can be functionally narrow if prey share similar traits, ecological roles, or evolutionary origin, whereas diets with modest species richness may include ecologically or evolutionarily diverse prey [20,21]. Consequently, separation of taxonomic, functional, and phylogenetic dimensions of prey diversity is needed for understanding dietary specialization, generalism, and vulnerability to environmental change, because these dimensions of prey diversity do not necessarily covary [22,23,24].
While some studies have addressed multiple aspects of owl diet diversity [7,8,17], they have not integrated different dimensions of diet diversity within a single, consistent analytical framework. In this study, we apply a unified framework of Hill numbers [25] to simultaneously quantify prey diversity across taxonomic, functional, and phylogenetic dimensions. Hill numbers express diversity as the effective number of species and provide a replication-consistent framework that integrates richness and evenness and extends rigorously to functional (FD) and phylogenetic (PD) diversity, enabling direct comparisons in common units across facets [25,26,27]. Applied to owl diets, this multidimensional approach allows a more comprehensive assessment of prey diversity that cannot be fully captured by taxonomic diversity (TD) alone [25,26]. In addition to quantifying prey diversity across these dimensions, we also evaluate the structural organization of prey assemblages by testing whether they are more clustered or overdispersed than expected under null models, independently of richness [20,22,28].
We assessed the taxonomic, functional, and phylogenetic diversity of prey of nine owl species (Aegolius funereus, Asio otus, Athene noctua, Bubo bubo, Glaucidium passerinum, Otus scops, Strix uralensis, Strix aluco, and Tyto alba) breeding in the East-Central and South-Eastern parts of Europe. Our objectives were to: (i) quantify multidimensional prey diversity and dominance structure in the nine owl species; and (ii) explore how differences in taxonomic, functional, and phylogenetic diversity and structure may reflect resource partitioning within the owl guild. We hypothesize that in owl diets: (i) taxonomic diversity will not necessarily correspond to functional and phylogenetic diversity; (ii) prey assemblages will be dominated by a limited number of taxa; and (iii) owl species will differ in the functional and phylogenetic structure of prey. By applying a unified Hill-based framework, we aim to provide a consistent, multidimensional view of trophic diversity and a framework for interpreting patterns relevant to owl guild coexistence.
2. Materials and Methods
2.1. Diet Data
We used published dietary data to study the diet diversity of nine owl species that maintain breeding populations across the East-Central and South-Eastern Europe: Aegolius funereus, Asio otus, Athene noctua, Bubo bubo, Glaucidium passerinum, Otus scops, Strix uralensis, Strix aluco, and Tyto alba. To gather dietary information, we selected one representative peer-reviewed study (Table 1) for each of the nine studied owl species. The selected studies had mammalian and avian prey items identified to species level, quantitative estimates of prey abundance (number of individuals or frequency of occurrence), and sufficient sample sizes for ecological inference. Studies were conducted between 1974 and 2015, representing breeding-season and/or year-round sampling periods across local to regional spatial scales in East-Central and South-Eastern Europe. Prey material in the studies was obtained through pellet analysis, in some cases, complemented by examination of nest prey remains. Depending on the owl species, the material was obtained from different habitat types, including coniferous and mixed forests, meadows, and agricultural landscapes (Table 1). Because the dietary datasets originated from different regions, time periods, sampling efforts, and study designs, they were aggregated to characterize broad species-level dietary patterns and not local or temporal variation. While this pooling increases overall sample size and allows robust estimation of multidimensional diversity metrics, it may obscure spatial and temporal variability, and results should therefore be interpreted as generalized species-level patterns rather than site-specific assemblages. For each owl species, we recorded the taxonomic identity of prey items and their relative abundance as reported in the original study. For each owl species, original data from multiple locations, years, and/or seasons were pooled to obtain a single prey assemblage per owl species. Prey taxonomic names were standardized to ensure comparability. Data matrix is provided in Supplementary Table S1.
Table 1.
Owl species that maintain breeding populations across the East-Central and South-Eastern Europe and associated sources of prey data for each species, including information on study location, sampling year, period, habitat, sampling method, and number of prey items (N).
2.2. Multidimensional Diversity
We quantified owl prey diversity across taxonomic, functional, and phylogenetic dimensions using the Hill-number framework [36]. Hill numbers measure diversity as the effective number of entities and provide a unified, replication-consistent framework for direct and interpretable comparisons among assemblages [19,37]. For all three dimensions, we estimated Hill numbers of orders q = 0, 1, 2, which differentially weight rare to dominant entities and allow richness and evenness components of diversity to be evaluated on a common scale. Functional and phylogenetic Hill numbers extend the taxonomic framework by incorporating trait distances and evolutionary branch lengths, respectively, while retaining the same effective-number interpretation [26,27]. All diversity estimates were computed using the iNEXT.3D R package version 1.0.12 [38].
Taxonomic Diversity—For TD analysis, prey data were organized into a rectangular abundance matrix with prey taxa as rows and owl species as columns (Supplementary Table S1). TD was quantified using Hill numbers of orders q = 0, 1, 2 representing species richness (q = 0), the effective number of common species corresponding to the exponential of Shannon entropy (q = 1), and the effective number of dominant species corresponding to the inverse Simpson index (q = 2). TD was estimated using the iNEXT.3D R package version 1.0.12 based solely on the prey abundance matrix (argument diversity = “TD”) following the Hill–Chao framework [25,38]. All TD estimates were expressed in effective numbers of species, allowing direct comparison among the diets of the owl species.
Functional Diversity—Functional traits relevant to prey ecology were compiled from published literature and trait databases. For each prey taxon, we recorded body mass (g), body length (mm), predominant diet category (e.g., herbivore, carnivore, insectivore, scavenger), and primary habitat use (e.g., edaphic, epigeic, arboreal, aerial) (Supplementary Table S2). Trait selection was constrained by the need for consistent availability across all prey groups. Trait data for mammals were primarily obtained from the Handbook of the Mammals of the World [39], for birds from The Birds of the Western Palearctic [1], for reptiles and amphibians from the Handbuch der Reptilien und Amphibien Europas [40], and for freshwater fishes from The Freshwater Fishes of Europe [41]. For invertebrate prey groups, trait information was compiled from the authors’ own curated trait database. Continuous traits were log-transformed to reduce skewness, while categorical traits were converted to binary variables. When species-level data were unavailable, missing values were imputed using genus- or family-level means. Trait imputation may introduce some uncertainty in functional diversity estimates, but when applied consistently across taxa, it is unlikely to substantially bias the main diversity patterns. Pairwise functional dissimilarities among prey taxa were computed using Gower distances on the mixed-type trait matrix via the distmix() function in the kmed version 0.4.2 for R (method = “gower”) [42]. FD was estimated as Hill numbers (orders q = 0, 1, 2) using the iNEXT.3D R package version 1.0.12 based on prey abundances and the Gower distance matrix [38]. FD values represent the effective number of functionally distinct entities derived from trait dissimilarities among prey taxa, where q = 0 represented functional richness, q = 1 emphasized common functional trait combinations, and q = 2 emphasized dominant functional trait combinations in prey assemblages. FD was summarized as the area under the FD–τ curve (AUC), integrating FD across the full range of the functional threshold parameter τ [38].
Phylogenetic Diversity—To construct a phylogenetic tree including all prey taxa, we retrieved mitochondrial cytochrome b gene sequences for each taxon from GenBank (Supplementary Table S3) via the NCBI portal. Sequences were aligned and a maximum-likelihood phylogeny was inferred in MEGA11 version 11.0.10 [43]. The resulting phylogenetic tree was exported in NEWICK format (Supplementary Table S4). PD was then quantified as Hill numbers (orders q = 0, 1, 2) by supplying the prey abundance matrix and the NEWICK tree to iNEXT.3D version 1.0.12 (argument diversity = “PD”). PD estimates are expressed as effective total branch length and can be interpreted as effective lineage diversity when standardized by total tree depth (mean-PD sensu Chao et al. [27]). Here, q = 0 corresponded to Faith’s phylogenetic diversity (the total branch length connecting all prey species), whereas q = 1 and q = 2 quantified the effective number of common and dominant evolutionary lineages, respectively.
2.3. Standardized Effect Sizes (SES) and Null-Model Framework
Using the prey assemblages described in Section 2.1 Diet Data, we quantified phylogenetic and functional community structure for each owl species using standardized effect sizes (SESs) based on mean pairwise distances (MPDs). SES values compare the observed MPD of each prey assemblage to the distribution of MPD values generated from null communities, allowing assessment of whether prey assemblages are more phylogenetically or functionally dispersed or more clustered than expected by chance [20,28]. Null communities were generated by randomizing prey identities while preserving the observed prey species richness for each owl species, following commonly applied richness-controlled null models implemented in the picante framework version 1.8.2 [28]. Positive SES values indicate overdispersion, while negative SES values indicate clustering relative to the null expectation.
Phylogenetic SES (PD_z) was computed using phylogenetic distance matrices, and functional SES (FD_z) using trait-based distance matrices [44]. For clarity, we report standardized effect sizes (PD_z and FD_z) in the main text and figures, while all underlying MPD values and null-model parameters (mpd.obs, mpd.rand.mean, mpd.rand.sd, ranks, p-values, and number of randomizations) are provided in Supplementary Tables S5 and S6.
3. Results
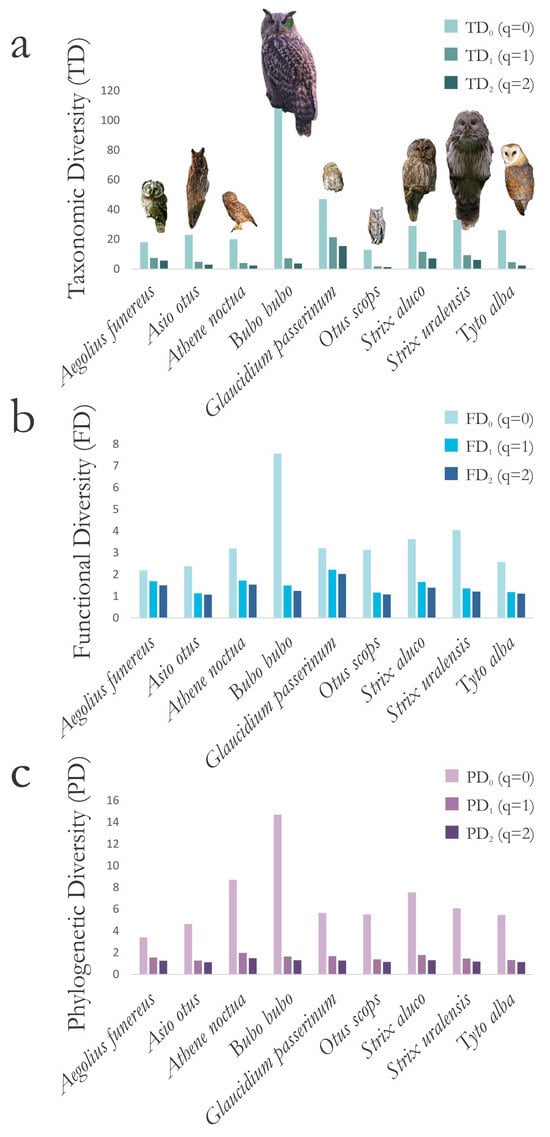
Across all nine owl species, taxonomic diversity exceeded functional and phylogenetic diversity at all Hill-number orders (Supplementary Table S7, Figure 1). Differences in taxonomic prey richness were not necessarily matched by proportional differences in functional or evolutionary breadth. Taxonomic richness (TD0) ranged from 13 prey taxa in Otus scops to 108 taxa in Bubo bubo, whereas functional and phylogenetic richness varied over much narrower ranges (FD0 = 2.19–7.56; PD0 = 3.42–14.70) spanning from Aegolius funereus to Bubo bubo, respectively. In all three dimensions, a pronounced decline in diversity with increasing Hill-number order (q = 0 to 2) was present in most owl species, except, for example, in FD in Aegolius funereus. This decline was a result of low frequencies of a large number of prey taxa that contributed little to the overall diet in individual owl species (Supplementary Table S1). Low effective functional and phylogenetic diversity values at the q = 2 order (FD2 = 1.08–2.02 and PD2 = 1.13–1.49) also indicated that the dominant prey taxa were functionally and evolutionarily similar, even if the diet was taxonomically rich.
Figure 1.
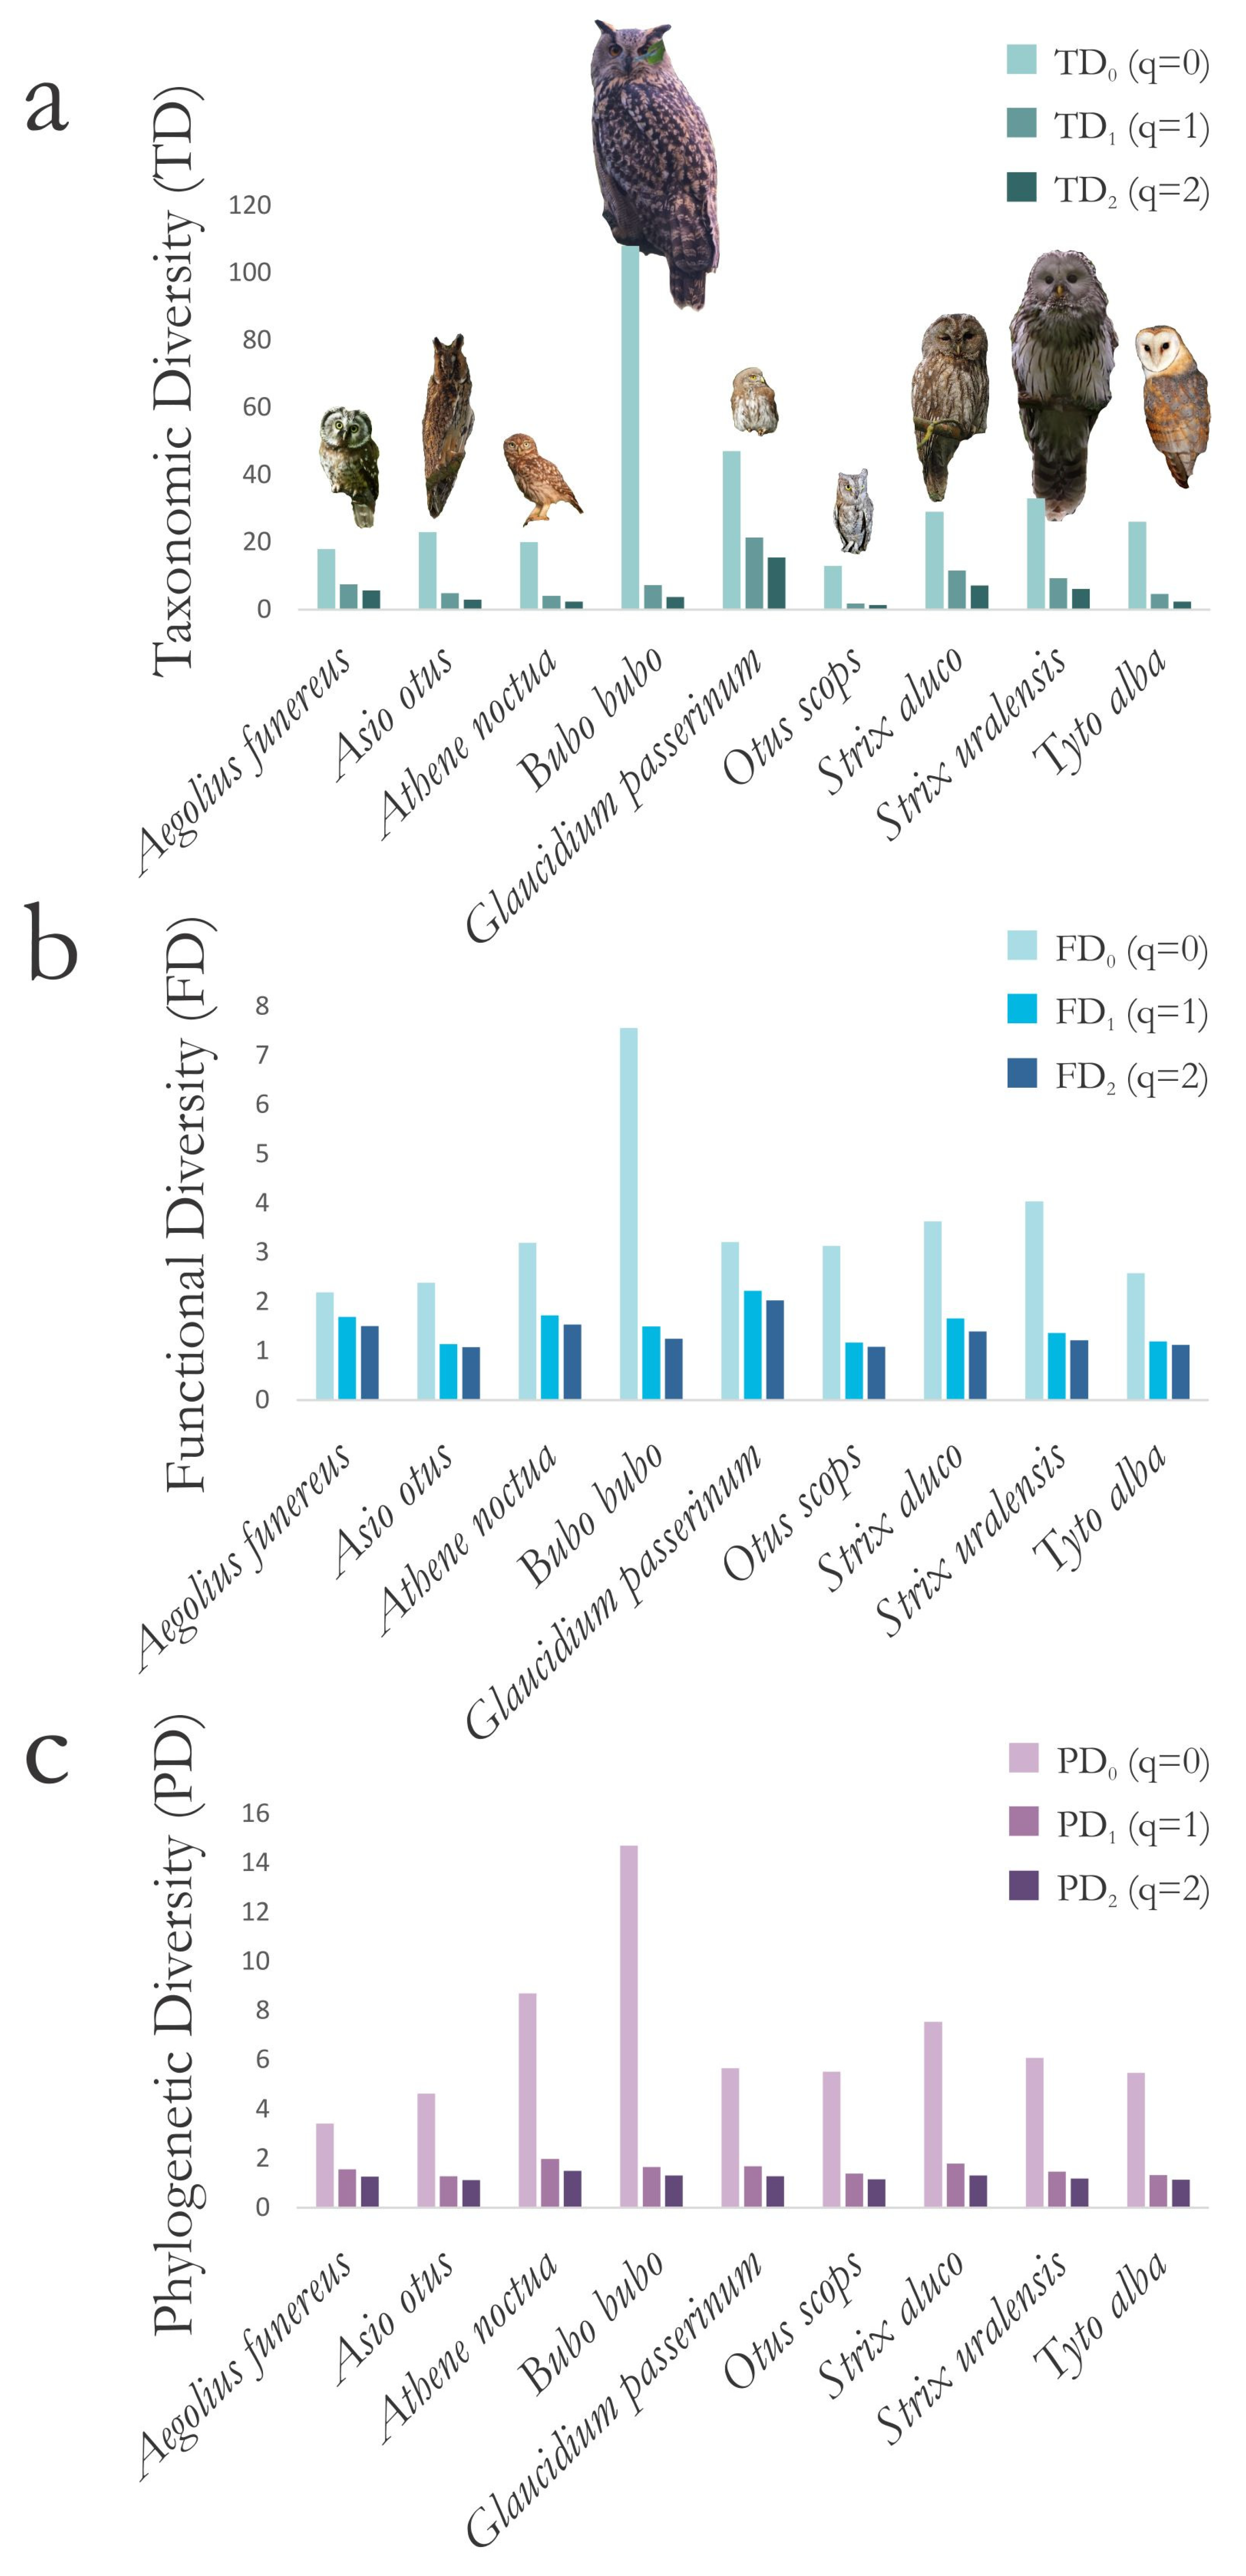
Visualization of (a) taxonomic diversity (TD), (b) functional diversity (FD), and (c) phylogenetic diversity (PD) of the prey of nine European owl species. Histograms illustrate Hill-number profiles (q = 0 (richness), 1 (effective number of common entities), and 2 (effective number of dominant entities)) for each dimension of diversity, highlighting contrasts in richness and evenness among species.
Prey diversity varied substantially among the nine owl species. Bubo bubo had the highest prey diversity richness at all three levels. However, effective diversity of its prey dropped greatly with increasing Hill-number order of q (TD2 = 3.74; FD2 = 1.24; PD2 = 1.31), because its diet was highly uneven and strongly dominated by a few prey species or taxa, mostly anurans, Microtus arvalis and Arvicola terrestris (Supplementary Table S1). On the other end of the TD0 spectrum, Otus scops also showed strongly uneven taxonomic diversity (drop from TD0 = 13 to TD2 = 1.30), with diet dominated by Orthoptera, but greater phylogenetic dispersion indicated by a smaller drop in PD from q = 0 to 2 than in Bubo bubo. In contrast to Bubo bubo or Otus scops, the high taxonomic richness of the Glaucidium passerinum diet (TD0 = 47) was accompanied by exceptionally high taxonomic evenness (TD1 = 21.38; TD2 = 15.41). High evenness was also evident in functional diversity, with only a small decline from FD0 = 3.21 to FD2 = 2.02. In contrast to TD and FD, phylogenetic diversity showed lower evenness and a more limited evolutionary breadth (PD0 = 5.66). PD0 of Glaucidium passerinum was even lower than in some owls with fewer prey taxa (e.g., Athene noctua and Strix aluco). In fact, Athene noctua had one of the most phylogenetically rich diets (PD0 = 8.70) despite the diet being taxonomically narrow (TD0 = 20) and uneven (TD2 = 2.37). In phylogenetic richness, Athene noctua and Strix aluco (PD0 = 7.55) were the closest to Bubo bubo, implying prey spanning evolutionarily distinct evolutionary lineages. Strix aluco and Strix uralensis were also among the highest in functional richness (FD0 = 3.63 and 4.04), suggesting diets that incorporate prey from different ecological niches. Nevertheless, FD2 values were relatively low (1.39 and 1.22), indicating that a few functional types dominate energy intake even when functional richness is high.
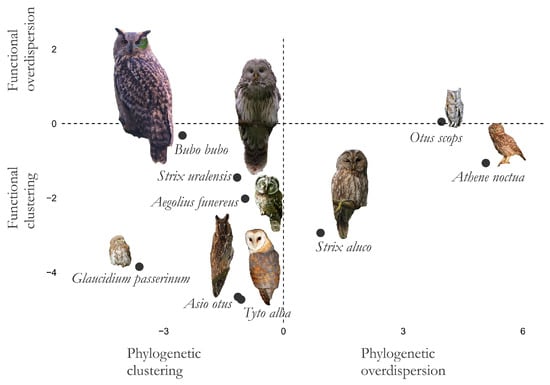
Across the nine owl species, standardized effect sizes (SES) revealed pronounced interspecific differences in both phylogenetic and functional structure of prey assemblages (Table 2; Figure 2). Functional SES values (FD_z) were predominantly negative (ranging from −4.73 to −0.32), indicating widespread functional clustering of prey relative to null expectations. In contrast, phylogenetic SES values (PD_z) had a broader range, from strong negative values (−3.61) to high positive values (5.07), indicating substantial taxonomic variation in phylogenetic structure. Species such as Athene noctua and Otus scops exhibited strong phylogenetic overdispersion (high positive PD_z), which indicated prey assemblages composed of evolutionarily distant lineages relative to null expectations. In terms of functional structure, prey assemblages were moderately clustered in Athene noctua (FD_z = −1.06) and close to random expectations in Otus scops (FD_z = 0.05). In contrast, Glaucidium passerinum, as well as Bubo bubo, showed pronounced phylogenetic clustering (negative PD_z), suggesting prey concentrated within closely related evolutionary lineages. The strongest functional clustering was characteristic for Tyto alba and Asio otus (FD_z < −4.6).
Table 2.
Standardized effect sizes (SESs) of functional diversity (FD_z) and of phylogenetic diversity (PD_z) for owl prey assemblages. Positive values reflect overdispersion; negative values indicate clustering. Full null-model statistics (mpd.obs, mpd.rand.mean, mpd.rand.sd, p-values, ranks, runs) are available in Supplementary Tables S5 and S6. p-values are shown in bold when the SES value significantly differs from the null model.
Figure 2.
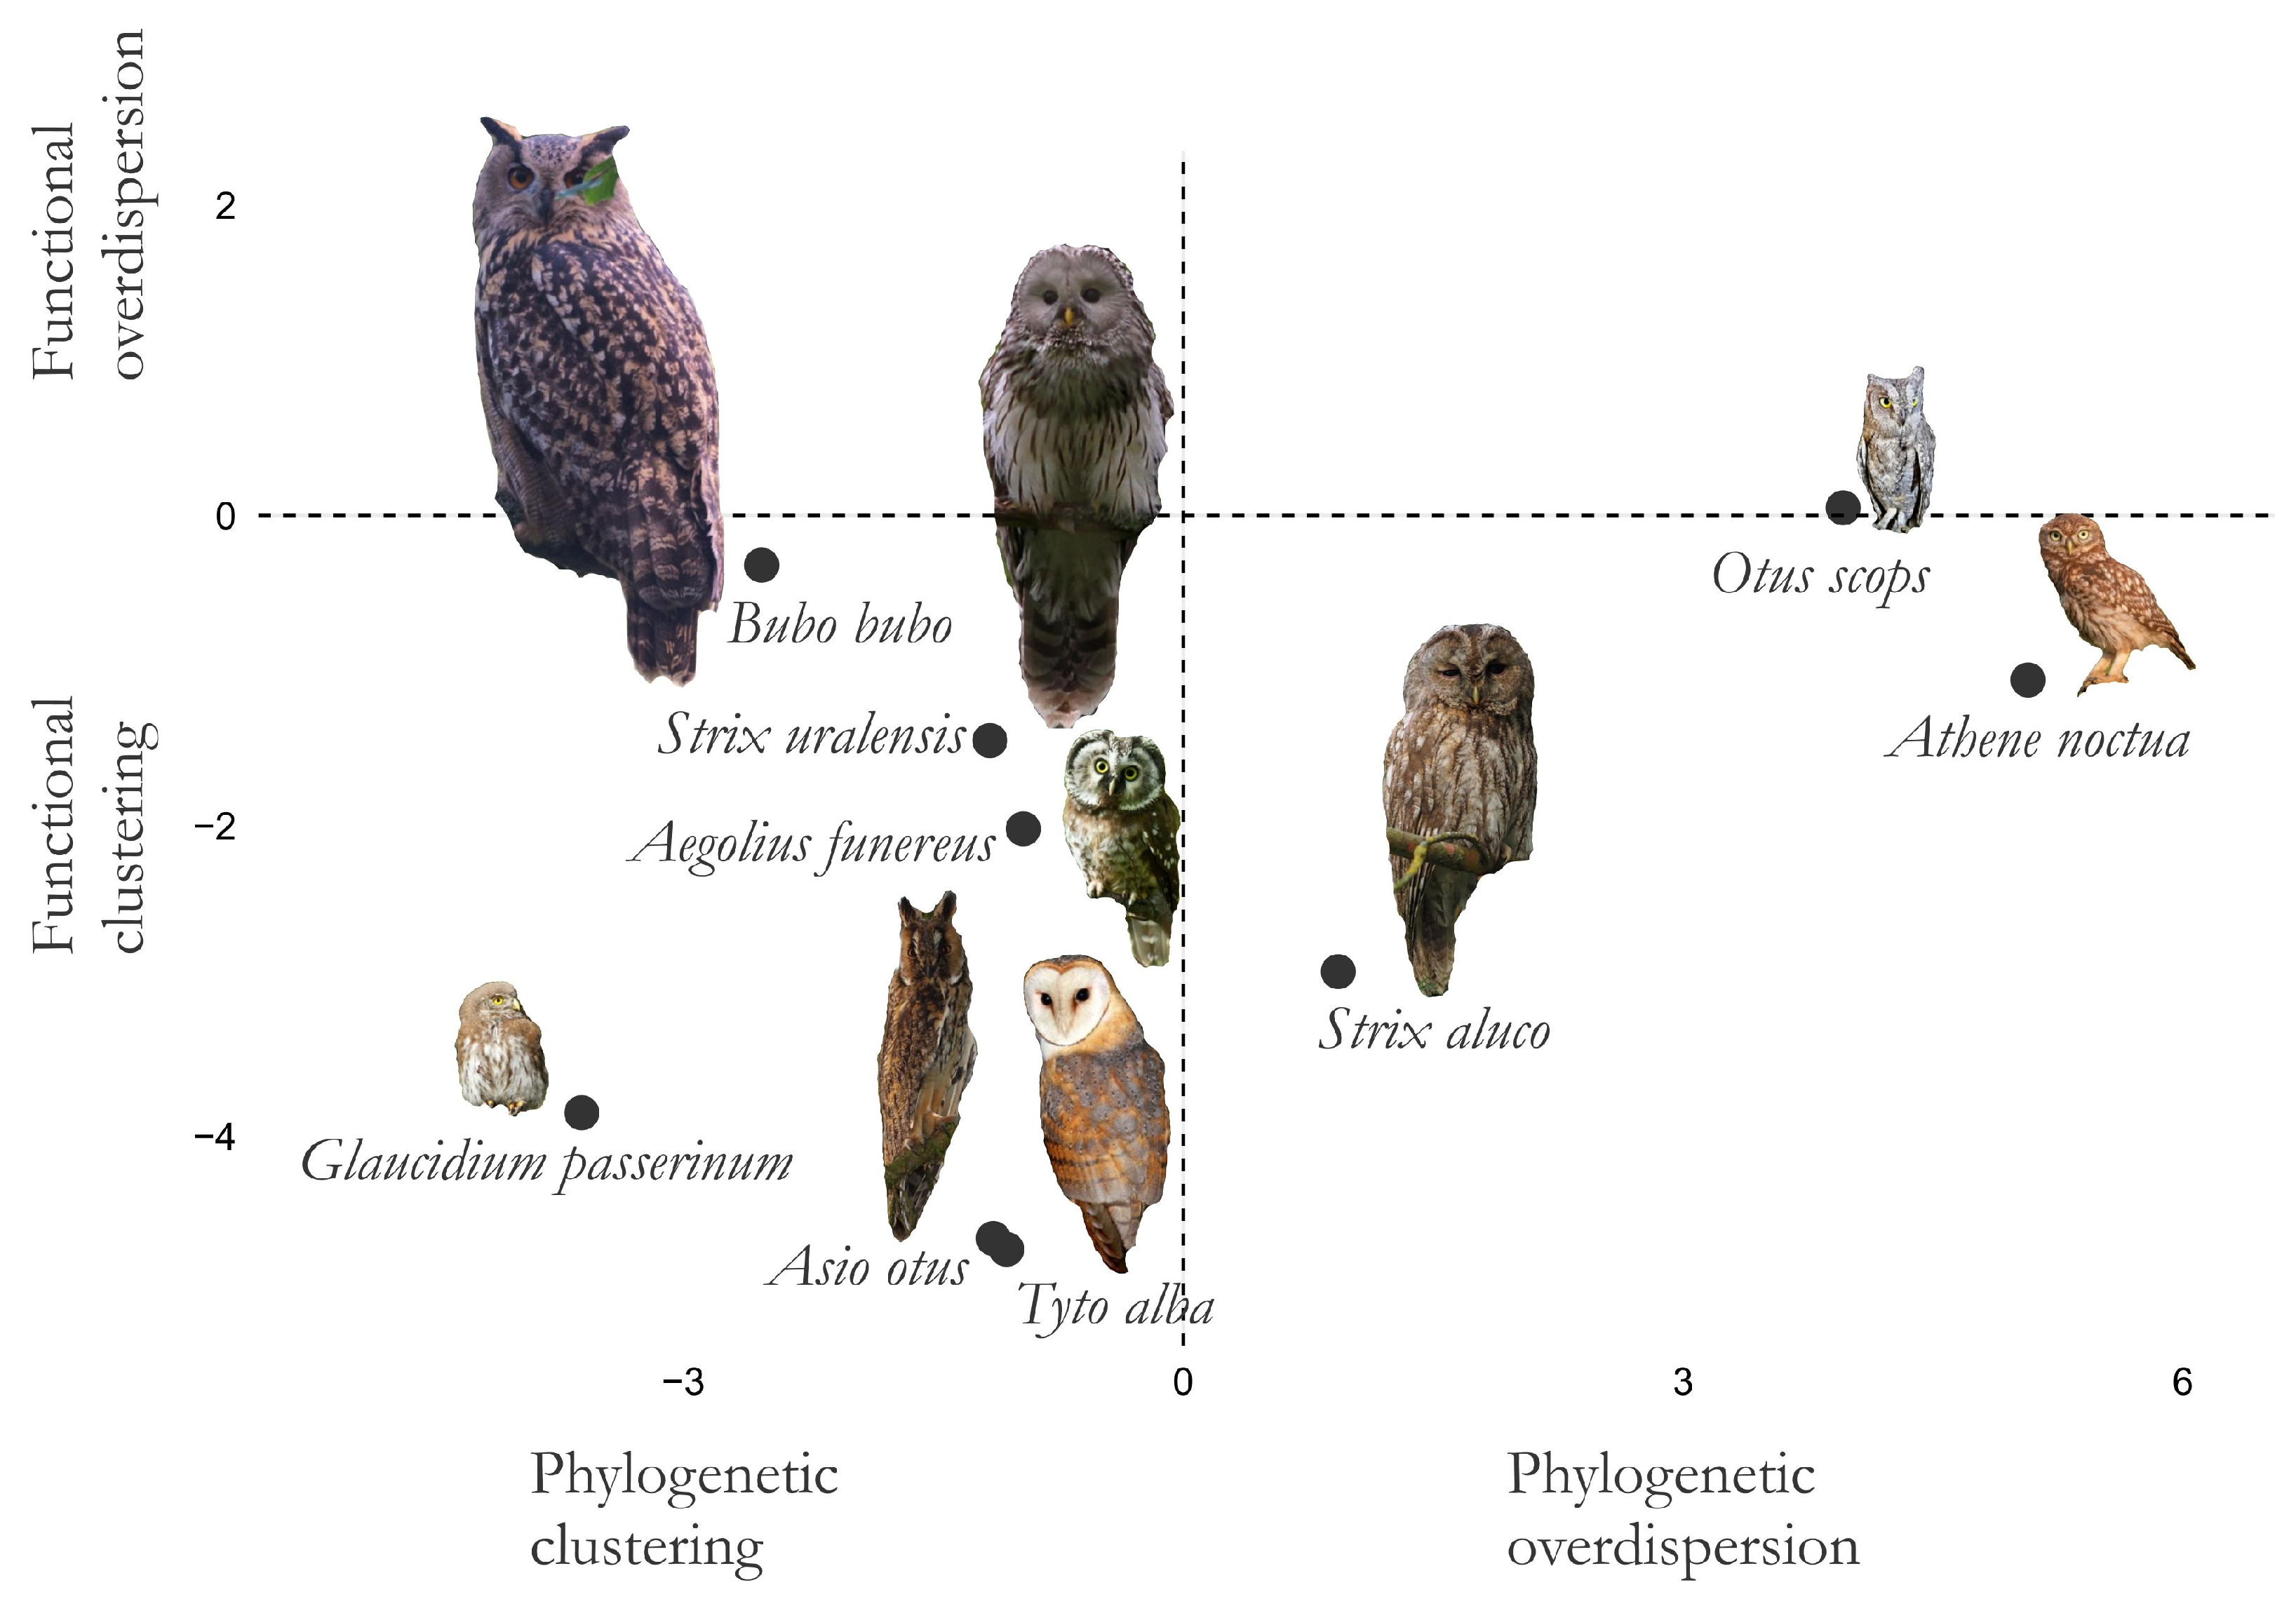
Standardized effect size (SES) values for phylogenetic (PD_z) and functional (FD_z) structure of prey assemblages for nine owl species breeding in East-Central and South-Eastern Europe. Positive SES values indicate overdispersion, negative SES values indicate clustering relative to richness-controlled null communities.
4. Discussion
The diets of the nine owl species breeding in East-Central and South-Eastern Europe significantly differed in prey biodiversity across taxonomic, functional, and phylogenetic facets. Despite a broadly shared focus on small vertebrates in the owls’ diets, the Hill-number profiles (q = 0, 1, 2) demonstrated pronounced variation in prey richness, evenness, functional breadth, and evolutionary span. Taxonomic diversity of all nine prey assemblages exceeded functional and phylogenetic diversity at all Hill-number orders. Large differences in taxonomic richness (TD0 = 13–108) were not reflected in proportional differences in functional or phylogenetic richness (FD0 = 2.19–7.56; PD0 = 3.42–14.70). Moreover, a pronounced decline from q = 0 to q = 2 in prey diversity was observed in most owls, reflecting strong dominance by a small subset of prey taxa, for example, anurans, Microtus arvalis, and Arvicola terrestris in the diet of Bubo bubo [31], and Microtus arvalis, Microtus agrestis, and Apodemus sylvaticus in the diet of Asio otus [15]. Low effective diversity at higher Hill orders in all nine owls (FD2 = 1.08–2.02 and PD2 = 1.13–1.49) showed that dominant prey taxa were also functionally and phylogenetically similar, even in owls whose diets were taxonomically rich. For example, extreme taxonomic richness in Bubo bubo (TD0 = 108) dropped significantly with higher Hill orders of effective functional and evolutionary diversity (FD2= 1.24; PD2= 1.31). Conversely, Athene noctua with low taxonomic richness (TD0 = 20) maintained relatively high phylogenetic richness (PD0 = 8.70) despite strong taxonomic dominance (TD2 = 2.37). This decoupling was evident not only in richness (q = 0) but also in abundance-weighted diversity, emphasizing that dominance structure was a key axis of dietary differentiation among the studied owls. Another example is Glaucidium passerinum, which had relatively high taxonomic richness (TD0 = 47) and, unlike most other owls, exceptionally high taxonomic evenness (TD1 = 21.38; TD2 = 15.41), indicating a balanced prey composition in which many taxa contribute substantially to the diet. Otus scops mirrored Bubo bubo in taxonomic dominance structure despite lying at the opposite end of the richness gradient (TD0 = 13). This convergence in dominance structure demonstrates that dietary evenness is largely independent of taxonomic prey richness and highlights the importance of considering evenness when characterizing owl diets.
High functional richness in Bubo bubo, together with elevated FD0 in Strix uralensis and Strix aluco, indicated ecologically diverse diets and access to prey with varied traits, like body length, mass, habitat use, and trophic level. Nevertheless, convergence toward low FD2 values (≈1.2–1.4) in these species revealed strong dominance by a few functional types and functional redundancy (occurrence of multiple prey taxa sharing similar ecological roles [45]), consistent with trait-based interpretations of functional similarity [22]. In contrast to this pattern, Glaucidium passerinum maintained relatively high functional evenness (FD0 = 3.21; FD2 = 2.02).
Bubo bubo, Athene noctua, and Strix aluco exploited prey spanning evolutionarily distant lineages of small vertebrates and invertebrates, as reflected by high phylogenetic richness (PD0). Because phylogenetic diversity accounts for branch-length differences among prey taxa [25,27], it can reveal lineage-level breadth even when taxonomic richness is moderate, as in Strix aluco, or relatively low, as in Athene noctua. Ecologically, high PD0 coupled with low abundance-weighted PD is consistent with access to multiple evolutionary lineages but energetic reliance on a limited subset, like in Bubo bubo, which is a dietary generalist that opportunistically targets many taxa but energetically depends on a limited number of functional prey types, e.g., easily accessible profitable prey [31,46].
Together with Hill-number TD, FD, and PD profiles, SES analyses further revealed that owl species differ in how their prey were structured along evolutionary and functional axes. Glaucidium passerinum showed significant clustering of prey in both phylogenetic and functional dimensions, suggesting specialization on closely related prey with similar ecological roles, as expected under functional and evolutionary filtering [20,21,22]. Tyto alba and Asio otus showed extreme functional clustering (FD_z < −4.6), revealing strong ecological filtering that favored a narrow set of functionally similar prey and resulted in dominance of a single functional prey type (FD2 ≈ 1.1) [22], e.g., small terrestrial mammals [15,35]. Prey of Athene noctua and Otus scops exhibited phylogenetic overdispersion, drawing prey from evolutionarily distant lineages. However, the weakly negative and non-significant functional SES in Athene noctua indicated focus on a narrow set of functional traits in prey despite broad lineage representation. This is consistent with the framework of Webb et al. [20] showing that phylogenetic structure alone does not necessarily reflect functional differentiation. In Otus scops, high functional dominance (FD2 = 1.08) did not deviate from random expectations (FD_z ≈ 0), suggesting that functional structure in this species was driven primarily by a limited prey pool rather than strong ecological filtering among many prey options. Indeed, the diet of Otus scops is exceptionally specialized on insects, particularly Orthoptera [47]. But, because insects in this study were identified only to higher taxonomic levels, this likely led to conservative estimates of diversity metrics in Otus scops, compared to owl species relying predominantly on mammalian and avian prey (e.g., Aegolius funereus, Glaucidium passerinum), which were identified to species level. Multidimensional diet partitioning in the studied owls was consistent with differentiation within a trophic guild of species exploiting similar prey resources [3,4]. Species reduce overlap by diverging along evolutionary and/or functional axes. These patterns highlighted the need to interpret phylogenetic and functional structure jointly, as reliance on a single dimension can lead to ambiguous inferences about ecological filtering versus competition [22,25]. From an eco-evolutionary perspective, high functional and phylogenetic richness reflects potential dietary breadth, whereas low abundance-weighted diversity indicates energetic dependence on a limited set of prey traits and lineages. This combination helps to explain how generalist predators can be simultaneously broad but vulnerable to disruptions affecting dominant prey groups, as changes in prey dominance can occur without losses of richness [21,22,24,48,49]. Conversely, species with higher dietary evenness distribute energy intake more uniformly across functional prey types they exploit, and may achieve greater stability, although within a narrower range of prey traits and evolutionary lineages.
Comparative diet studies of sympatric owls reported diet segregation through several mechanisms, such as differences in prey size, functional prey traits, taxonomic preference, temporal activity, selective habitat use, or hunting strategies, e.g., [2,5,6,7,16]. Owl species considered in this study maintain breeding populations across the eastern part of Central and Southern Europe, but do not all coexist in sympatry; instead, they occupy partially distinct climatic regions, habitats, or elevational zones [1]. Therefore, the findings of this study could be additionally evaluated in a spatial and environmental context. Moreover, dietary patterns of owls may, among other factors, vary with season, interannual prey fluctuations, habitat structure, geographic range, environmental factors, or sympatry with other owls, e.g., [8,17,48,49,50], all of which can influence prey dominance and diversity in addition to species-specific foraging strategies. Taken together, several sources of variability that may influence owl diet structure and diversity were not controlled for in this study and should be considered when interpreting the observed patterns. Datasets pooled in this study varied in sampling locations, time periods, sampling efforts, and study designs. Such heterogeneity may influence diversity estimates; for example, larger sample sizes may increase taxonomic richness (TD0) by detecting rare prey, whereas limited sampling may underestimate diversity. Pooling dietary data across locations, years, and seasons may obscure spatial and temporal variation in prey availability and composition. Therefore, the results should be interpreted as reflecting comparative species-level patterns in diet structure rather than direct equivalence of local prey composition, which is inherently shaped by regional and temporal variability. Nevertheless, consistent trends across diversity dimensions and Hill-number orders (q = 0–2), especially at higher q values, suggest that the main patterns remain ecologically meaningful.
To sum up, by integrating taxonomic, functional, and phylogenetic diversity with abundance-weighted metrics and null-model expectations, our results demonstrate that owl diets are structured along multiple, partially independent axes, revealing both shared reliance on dominant prey groups and pronounced interspecific differences in dominance structure, trait composition, and evolutionary breadth of prey. This multidimensional perspective refines the understanding of trophic niche differentiation within owl guilds and highlights the value of combining Hill-number diversity profiles with SES analyses to separate ecological generalism, specialization, and niche partitioning in predator–prey systems. Although not the primary focus of this study, multidimensional diet metrics may provide a useful framework for assessing potential vulnerability of predator species to environmental change through their dependence on specific functional prey types or evolutionary lineages.
Supplementary Materials
The following supporting information can be downloaded at https://www.mdpi.com/article/10.3390/birds7030040/s1: Table S1: Prey abundance matrix; Table S2. Functional trait matrix for prey taxa; Table S3. List of mitochondrial cytochrome-b sequences used for phylogeny reconstruction; Table S4. NEWICK phylogeny of prey taxa used for PD estimation; Table S5. Full SES outputs for functional (FD_z) structure; Table S6. Full SES outputs for phylogenetic (PD_z) structure. Table S7. Taxonomic, functional, and phylogenetic diversity in Hill numbers (q = 0–2).
Author Contributions
Conceptualization, F.J.; data collection and methodology, F.J. and T.K.; validation, T.K. and F.J.; original draft preparation, F.J.; data interpretation, manuscript writing, F.J. and T.K.; visualization, F.J. All authors have read and agreed to the published version of the manuscript.
Funding
This work was partially supported by the Slovenian Research and Innovation Agency (Ljubljana, Slovenia) through research programs P1-0403 and I0-0029.
Institutional Review Board Statement
Not applicable.
Informed Consent Statement
Not applicable.
Data Availability Statement
The original contributions presented in this study are included in the article/Supplementary Material. Further inquiries can be directed to the corresponding author.
Acknowledgments
The authors have reviewed and edited the output and take full responsibility for the content of this publication. The Microsoft 365 Copilot was used to support language editing of the manuscript. All data gathering, including references, all analyses, tables, figures, Supplementary Material, and writing were done by the authors. All scientific content, interpretations and conclusions are the authors’ own work.
Conflicts of Interest
The authors declare no conflicts of interest. The funders had no role in the design of the study; in the collection, analyses, or interpretation of data; in the writing of the manuscript; or in the decision to publish the results.
Abbreviations
The following abbreviations are used in this manuscript:
| SES | Standardized Effect Size |
| TD | Taxonomic Diversity |
| FD | Functional Diversity |
| PD | Phylogenetic Diversity |
| FD_z | Functional Standardized Effect Size |
| PD_z | Phylogenetic Standardized Effect Size |
| AUC | Area Under the Curve tau-profile |
| NCBI | National Center for Biotechnology Information |
| MPD | Mean Pairwise Distances |
References
- Cramp, S. (Ed.) Handbook of the Birds of Europe, the Middle East and North Africa: The Birds of the Western Palearctic, Vol. 4: Terns to Woodpeckers; Oxford University Press: Oxford, UK, 1985. [Google Scholar]
- Herrera, C.M.; Hiraldo, F. Food-niche relationships among European owls. Ornis Scand. 1976, 7, 104–111. [Google Scholar] [CrossRef] [Scilit]
- Root, R.B. The niche of the Blue gray Gnatcatcher (Polioptila caerulea) within a deciduous forest. Ecol. Monogr. 1967, 37, 317–350. [Google Scholar] [CrossRef] [Scilit]
- Simberloff, D.; Dayan, T. The guild concept and the structure of ecological communities. Annu. Rev. Ecol. Syst. 1991, 22, 115–143. [Google Scholar] [CrossRef]
- Capizzi, D.; Luiselli, L. A comparative study of the variability of owl diets in three localities of central Italy. Rev. Ecol.-Terre Vie 1998, 53, 367–385. [Google Scholar] [CrossRef] [Scilit]
- Leader, Z.; Yom-Tov, Y.; Motro, U. Diet comparison between two sympatric owls-Tyto alba and Asio otus-in the Negev Desert, Israel. Isr. J. Ecol. Evol. 2010, 56, 207–216. [Google Scholar] [CrossRef] [Scilit]
- Comay, O.; Dayan, T. What determines prey selection in owls? Roles of prey traits, prey class, environmental variables, and taxonomic specialization. Ecol. Evol. 2018, 8, 3382–3392. [Google Scholar] [CrossRef] [Scilit] [PubMed]
- Ramellini, S.; Crepet, E.; Lapadula, S.; Romano, A. Trophic niche segregation in a guild of top predators within the Mediterranean Basin. Curr. Zool. 2024, 70, 697–706. [Google Scholar] [CrossRef] [Scilit] [PubMed]
- Hardy, A.R. Hunting Ranges and Feeding Ecology of Owls in Farmlands. Ph.D. Thesis, University of Aberdeen, Aberdeen, UK, 1977. [Google Scholar]
- Marti, C.D. A long-term study of food-niche dynamics in the Common Barn Owl: Comparisons within and between populations. Can. J. Zool. 1988, 66, 1803–1812. [Google Scholar] [CrossRef] [Scilit]
- Tome, D. Diet composition of the Long-eared Owl in central Slovenia: Seasonal variation in prey use. J. Raptor Res. 1994, 28, 253–258. [Google Scholar]
- Birrer, S. Synthesis of 312 studies on the diet of the Long-eared Owl Asio otus. Ardea 2009, 97, 615–624. [Google Scholar] [CrossRef] [Scilit]
- Obuch, J. The diet of the Eurasian eagle-owl (Bubo bubo) in various natural environments across Eurasia. Slovak Raptor J. 2024, 18, 25–46. [Google Scholar] [CrossRef] [Scilit]
- Mikusek, R.; Kloubec, B.; Obuch, J. Diet of the Pygmy Owl (Glaucidium passerinum) in eastern Central Europe. Buteo 2001, 12, 47–60. [Google Scholar]
- Tome, D. Functional response of the Long-eared Owl (Asio otus) to changing prey numbers: A 20-year study. Ornis Fenn. 2003, 80, 63–70. [Google Scholar]
- Alivizatos, H.; Goutner, V.; Zogaris, S. Contribution to the study of the diet of four owl species (Aves, Strigiformes) from mainland and island areas of Greece. Belg. J. Zool. 2005, 135, 109–118. [Google Scholar]
- Vrezec, A.; Saurola, P.; Avotins, A.; Kocijančič, S.; Sulkava, S. A comparative study of Ural Owl Strix uralensis breeding season diet within its European breeding range, derived from nest box monitoring schemes. Bird Study 2018, 65, S85–S95. [Google Scholar] [CrossRef] [Scilit]
- Díaz, S.; Cabido, M. Vive la différence: Plant functional diversity matters to ecosystem processes. Trends Ecol. Evol. 2001, 16, 646–655. [Google Scholar] [CrossRef] [Scilit]
- Jost, L. Entropy and diversity. Oikos 2006, 113, 363–375. [Google Scholar] [CrossRef] [Scilit]
- Webb, C.O.; Ackerly, D.D.; McPeek, M.A.; Donoghue, M.J. Phylogenies and community ecology. Annu. Rev. Ecol. Syst. 2002, 33, 475–505. [Google Scholar] [CrossRef] [Scilit]
- Villéger, S.; Mason, N.W.H.; Mouillot, D. New multidimensional functional diversity indices for a multifaceted framework in functional ecology. Ecology 2008, 89, 2290–2301. [Google Scholar] [CrossRef] [Scilit] [PubMed]
- Mouchet, M.A.; Villéger, S.; Mason, N.W.H.; Mouillot, D. Functional diversity measures: An overview of their redundancy and their ability to discriminate community assembly rules. Funct. Ecol. 2010, 24, 867–876. [Google Scholar] [CrossRef] [Scilit]
- Tucker, C.M.; Cadotte, M.W.; Carvalho, S.B.; Davies, T.J.; Ferrier, S.; Fritz, S.A.; Grenyer, R.; Helmus, M.R.; Jin, L.S.; Mooers, A.O.; et al. A guide to phylogenetic metrics for conservation, community ecology and macroecology. Biol. Rev. 2017, 92, 698–715. [Google Scholar] [CrossRef] [Scilit] [PubMed]
- Cooke, R.S.C.; Bates, A.E.; Eigenbrod, F. Global trade-offs of functional redundancy and functional dispersion for birds and mammals. Glob. Ecol. Biogeogr. 2019, 28, 484–495. [Google Scholar] [CrossRef] [Scilit]
- Chao, A.; Chiu, C.-H.; Jost, L. Unifying species diversity, phylogenetic diversity, functional diversity, and related similarity and differentiation measures through Hill numbers. Annu. Rev. Ecol. Syst. 2014, 45, 297–324. [Google Scholar] [CrossRef] [Scilit]
- Chiu, C.H.; Chao, A. Distance based functional diversity measures and their decomposition: A framework based on Hill numbers. PLoS ONE 2014, 9, e100014. [Google Scholar] [CrossRef] [Scilit] [PubMed]
- Chao, A.; Chiu, C.-H.; Jost, L. Phylogenetic diversity measures based on Hill numbers. Philos. Trans. R. Soc. B Biol. Sci. 2010, 365, 3599–3609. [Google Scholar] [CrossRef] [Scilit] [PubMed]
- Kembel, S.W.; Ackerly, D.D.; Blomberg, S.P.; Cornwell, W.K.; Cowan, P.D.; Helmus, M.R.; Morlon, H.; Webb, C.O. Picante: Integrating Phylogenies and Ecology, R package version 1.8.2; CRAN: Vienna, Austria, 2020. [CrossRef] [Scilit] [PubMed]
- Rajković, Z.D. Diet composition and prey diversity of Tengmalm’s owl Aegolius funereus (Linnaeus, 1758; Aves: Strigidae) in central Serbia during breeding. Turk. J. Zool. 2018, 42, 346–351. [Google Scholar] [CrossRef] [Scilit]
- Romanowski, J.; Altenburg, D.; Żmihorski, M. Seasonal variation in the diet of the little owl, Athene noctua in agricultural landscape of Central Poland. North-West. J. Zool. 2013, 9, 310–318. [Google Scholar]
- Obuch, J.; Karaska, D. The Eurasian eagle-owl (Bubo bubo) diet in the Orava Region (N Slovakia). Slovak Raptor J. 2013, 4, 83–98. [Google Scholar] [CrossRef] [Scilit]
- Latkova, H.; Sandor, K.A.; Krištin, A. Diet composition of the Scops Owl (Otus scops) in central Romania. Slovak. Raptor J. 2012, 6, 17–26. [Google Scholar] [CrossRef] [Scilit]
- Janžekovič, F.; Polc, M.; Petovar, P.; Klenovšek, T. Diet of the Tawny Owl Strix aluco in the area of Slovenske gorice (NE Slovenia). Acrocephalus 2017, 37, 45–53. [Google Scholar] [CrossRef] [Scilit]
- Obuch, J.; Danko, Š.; Mihók, J.; Karaska, D.; Šimák, L. Diet of the Ural owl (Strix uralensis) in Slovakia. Slovak. Raptor J. 2013, 7, 59–71. [Google Scholar] [CrossRef] [Scilit]
- Szép, D.; Horváth, G.F.; Krčmar, S.; Purger, J.J. Connection between prey composition and the landscape structure in the hunting area of Barn Owls (Tyto alba) in Baranja (Croatia). Period. Biol. 2018, 120, 125–133. [Google Scholar] [CrossRef] [Scilit]
- Chao, A.; Chiu, C.-H.; Jost, L. Phylogenetic diversity measures and their decomposition: A framework based on Hill numbers. In Biodiversity Conservation and Phylogenetic Systematics; Springer International Publishing: Cham, Switzerland, 2022; pp. 141–172. Available online: https://link.springer.com/chapter/10.1007/978-3-319-22461-9_8 (accessed on 19 May 2025).
- Hill, M. Diversity and evenness: A unifying notation and its consequences. Ecology 1973, 54, 427–432. [Google Scholar] [CrossRef] [Scilit]
- Chao, A.; Hu, K.H.; Chuang, P.Y. iNEXT.3D: Interpolation and Extrapolation for Three Dimensions of Biodiversity (Package Manual); CRAN: Vienna, Austria, 2021; Available online: https://cran.r-project.org/package=iNEXT.3D (accessed on 5 December 2025).
- Wilson, D.E.; Mittermeier, R.A. (Eds.) Handbook of the Mammals of the World; Lynx Edicions: Barcelona, Spain, 2019; Volume 9. [Google Scholar]
- Böhme, W.; Grossenbacher, K.; Thiesmeier, B.; Fritz, U. (Eds.) Handbuch Der Reptilien und Amphibien Europas; AULA Verlag/Akademische Verlagsgesellschaf: Wiebelsheim, Germany, 2003; Volume 6. [Google Scholar]
- Bănărescu, P.M.; Paepke, H.-J. (Eds.) Cyprinidae 2, Part III: Carassius to Cyprinus, Gasterosteidae. In The Freshwater Fishes of Europe; Aula Verlag: Wiebelsheim, Germany, 2001; Volmue 5. [Google Scholar]
- Budiaji, W. kmed: Distance Based K Medoids, R package version 0.4.2; Comprehensive R Archive Network; CRAN: Vienna, Austria, 2022. Available online: https://CRAN.R-project.org/package=kmed (accessed on 2 February 2023).
- Tamura, K.; Stecher, G.; Kumar, S. MEGA11: Molecular Evolutionary Genetics Analysis version 11. Mol. Biol. Evol. 2021, 38, 3022–3027. [Google Scholar] [CrossRef] [Scilit] [PubMed]
- Swenson, N.G. Functional and Phylogenetic Ecology in R; Springer: New York, NY, USA, 2014. [Google Scholar] [CrossRef] [Scilit]
- Walker, B. Biodiversity and ecological redundancy. Conserv. Biol. 1992, 6, 18–23. [Google Scholar] [CrossRef] [Scilit]
- Tobajas, J.; Rouco, C.; Fernandez-de-Simon, J.; Diaz-Ruiz, F.; Castro, F.; Villafurte, R.; Ferreras, P. Does prey abundance affect prey size selection by the Eagle Owl (Bubo bubo)? J. Ornithol. 2021, 162, 699–708. [Google Scholar] [CrossRef] [Scilit]
- Torre, I.; Grajera, J.; Olmo Vidal, J.M. Selective predation and chick provisioning rhythms in the European Scops Owl (Otus scops). Diversity 2026, 18, 34. [Google Scholar] [CrossRef] [Scilit]
- Balestrieri, A.; Gazzola, A.; Formenton, G.; Canova, L. Long term impact of agricultural practices on the diversity of small mammal communities: A case study based on owl pellets. Environ. Monit. Assess. 2019, 191, 725. [Google Scholar] [CrossRef] [Scilit] [PubMed]
- Obuch, J. Spatial and temporal changes in the diet composition of the Eurasian eagle-owl (Bubo bubo) in Slovakia comparing three historical periods. Raptor J. 2021, 15, 17–55. [Google Scholar] [CrossRef] [Scilit]
- Janžekovič, F.; Klenovšek, T. The biogeography of diet diversity of barn owls on Mediterranean islands. J. Biogeogr. 2020, 47, 2353–2361. [Google Scholar] [CrossRef] [Scilit]

Disclaimer/Publisher’s Note: The statements, opinions and data contained in all publications are solely those of the individual author(s) and contributor(s) and not of MDPI and/or the editor(s). MDPI and/or the editor(s) disclaim responsibility for any injury to people or property resulting from any ideas, methods, instructions or products referred to in the content. |
© 2026 by the authors. Licensee MDPI, Basel, Switzerland. This article is an open access article distributed under the terms and conditions of the Creative Commons Attribution (CC BY) license.