


Simple Summary
Although the Oriental Magpie Pica serica does not occur naturally in Japan, it has been frequently observed in Hokkaido, Japan’s northernmost major island, since the 1980s. We compiled records on the distribution of magpies as of 2012–2016—approximately 30 years after the first sighting—and estimated potential suitable habitats. Of the 185 municipalities on Hokkaido Island, magpies were confirmed through field surveys or citizen reports in 28 municipalities in western Hokkaido but were absent from the eastern region. Although dozens or more magpies have become established in three municipalities on the Pacific coast, they do not yet appear to be established elsewhere. Suitable habitats were limited to urban residential areas, which are fragmented into island-like patches by agricultural land; therefore, the expansion of magpies’ distribution will continue at a relatively slow pace. Such island-like habitat patches, together with conspicuous plumages and distinctive calls, make magpies well-suited for citizen science. Long-term monitoring of Hokkaido’s magpies in the collaboration with experts and citizens can contribute to understanding bird distributions and the establishment of invasive species.
Abstract
The Oriental Magpie Pica serica invaded Hokkaido, Japan, in the 1980s, but little is known about its current population status or potential for further range expansion. Here, we compile records on the distribution of magpies from 2012 to 2016 and estimate potential suitable habitats. Field surveys and citizen science reports revealed that breeding and individual birds occurred in 28 municipalities located in western Hokkaido. Although dozens or more birds have become established in three of these municipalities on the Pacific coast, populations in the other 25 appear not self-sustaining. Suitable habitats for magpies were almost exclusively limited to urban residential areas, presumably due to the availability of anthropogenic food resources. While these apparently suitable habitats occur throughout Hokkaido Island, no sightings have been recorded in eastern Hokkaido, suggesting that magpies have not crossed the forest area that runs north–south through the central part of the island. Suitable habitats, estimated based on the habitat selection by the largest population in Tomakomai, are concentrated near the centers of each municipality, separated by agricultural land, which may have slowed down the range expansion of the magpie through the Allee effect. The island-like fragmentation of suitable habitats is advantageous for comparative studies of magpie populations, food resources, predators, and competitors. Furthermore, the magpie has a distinctive black-and-white coloration and a unique, loud call, making it well-suited for citizen science surveys. Continuous monitoring of Hokkaido’s magpie population by experts and citizens will provide excellent opportunities to ask ecological questions involving bird distributions and the establishment of invasive species.
1. Introduction
Invasive species are a major threat to biodiversity. In Japan alone, as many as 43 species of invasive birds have been recorded to breed [1]. Recent studies on invasive animals have often used new methods, such as species distribution models (SDMs) or ecological niche models (ENMs), to predict potential range expansion from environmental factors, driven by improvements in computer performance and advances in geographic information systems (GISs) [2,3,4,5]. However, it has been pointed out that the indiscriminate use of large-scale databases of sightings and environments carries the risk of “garbage-in, gospel-out” [6]. The environmental factors used tend to be biased toward meteorological and topographic factors, and few studies evaluate biological factors such as habitat selection, interspecific competition, predators, parasites, pathogens, and food resources [7].
Invasive species can be viewed as natural experiments or as a model that sheds light on biological and ecological principles [6,8,9,10,11,12]. For example, some invasive species experience rapid population growth immediately after invasion (such as the Muskrat, Ondatra zibethicus, in Europe); while others undergo a long delay before explosive population growth (such as the Eurasian Collared Dove, Streptopelia decaocto, also in Europe) [8]. This may be related to the Allee effect [13,14,15,16], a general ecological principle whereby survival and reproductive rates decline when population density is low.
The magpie genus (Pica spp.) is widely distributed in the temperate Northern Hemisphere, and includes seven currently recognized species, with the Oriental Magpie Pica serica (hereafter “magpie”) being an independent species, according to the International Ornithological Committee (IOC) World Bird List [17]. Although Pica species originally inhabited rural areas [18], they have rapidly adapted to urbanization in the Old World [19,20]. In East Asia, the Oriental Magpie has become one of the most successful invasive birds in urban areas [21,22]. The Oriental Magpie does not occur in Japan except in northern Kyushu, where an introduced population has become established [23]. On Hokkaido Island, northern Japan, the Oriental Magpie has been observed along the southern Pacific coast since the 1980s [24]. Subsequently, the largest population became established in Tomakomai City, where they frequently utilize anthropogenic food resources, such as pet food [25,26]. To understand how population dynamics and environmental conditions shape biological invasions, it is essential to conduct continuous monitoring from the earliest possible stage and to clarify the environmental factors underlying establishment and range expansion. Since magpies have a very distinctive appearance and call that are easy to identify, and are highly sedentary in urban areas in Hokkaido, targeted citizen science may provide a suitable technique for monitoring their status and distribution [27,28,29].
Our primary objective in this study is to encourage the continuous monitoring of the Oriental Magpie in Hokkaido through the collaboration of experts and citizens. For this objective, we (1) document the distribution and status of magpies in Hokkaido from 2012 to 2016, approximately 30 years after the first recorded sighting; (2) estimate the distribution of potential habitats in Hokkaido based on data obtained by intensive field investigations of the largest population in Tomakomai; and (3) examine the factors limiting their population size and range, hypothesizing that food resources and the Allee effect may play important roles.
2. Materials and Methods
2.1. Study Areas
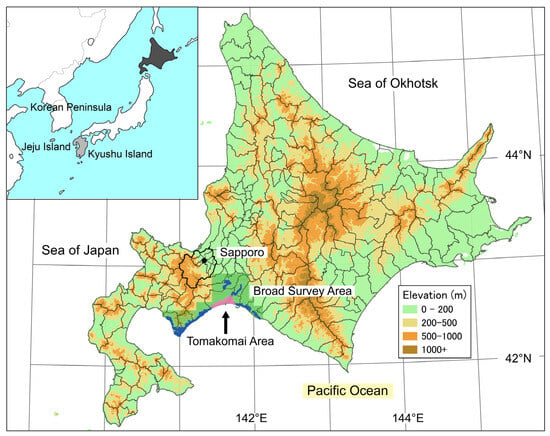
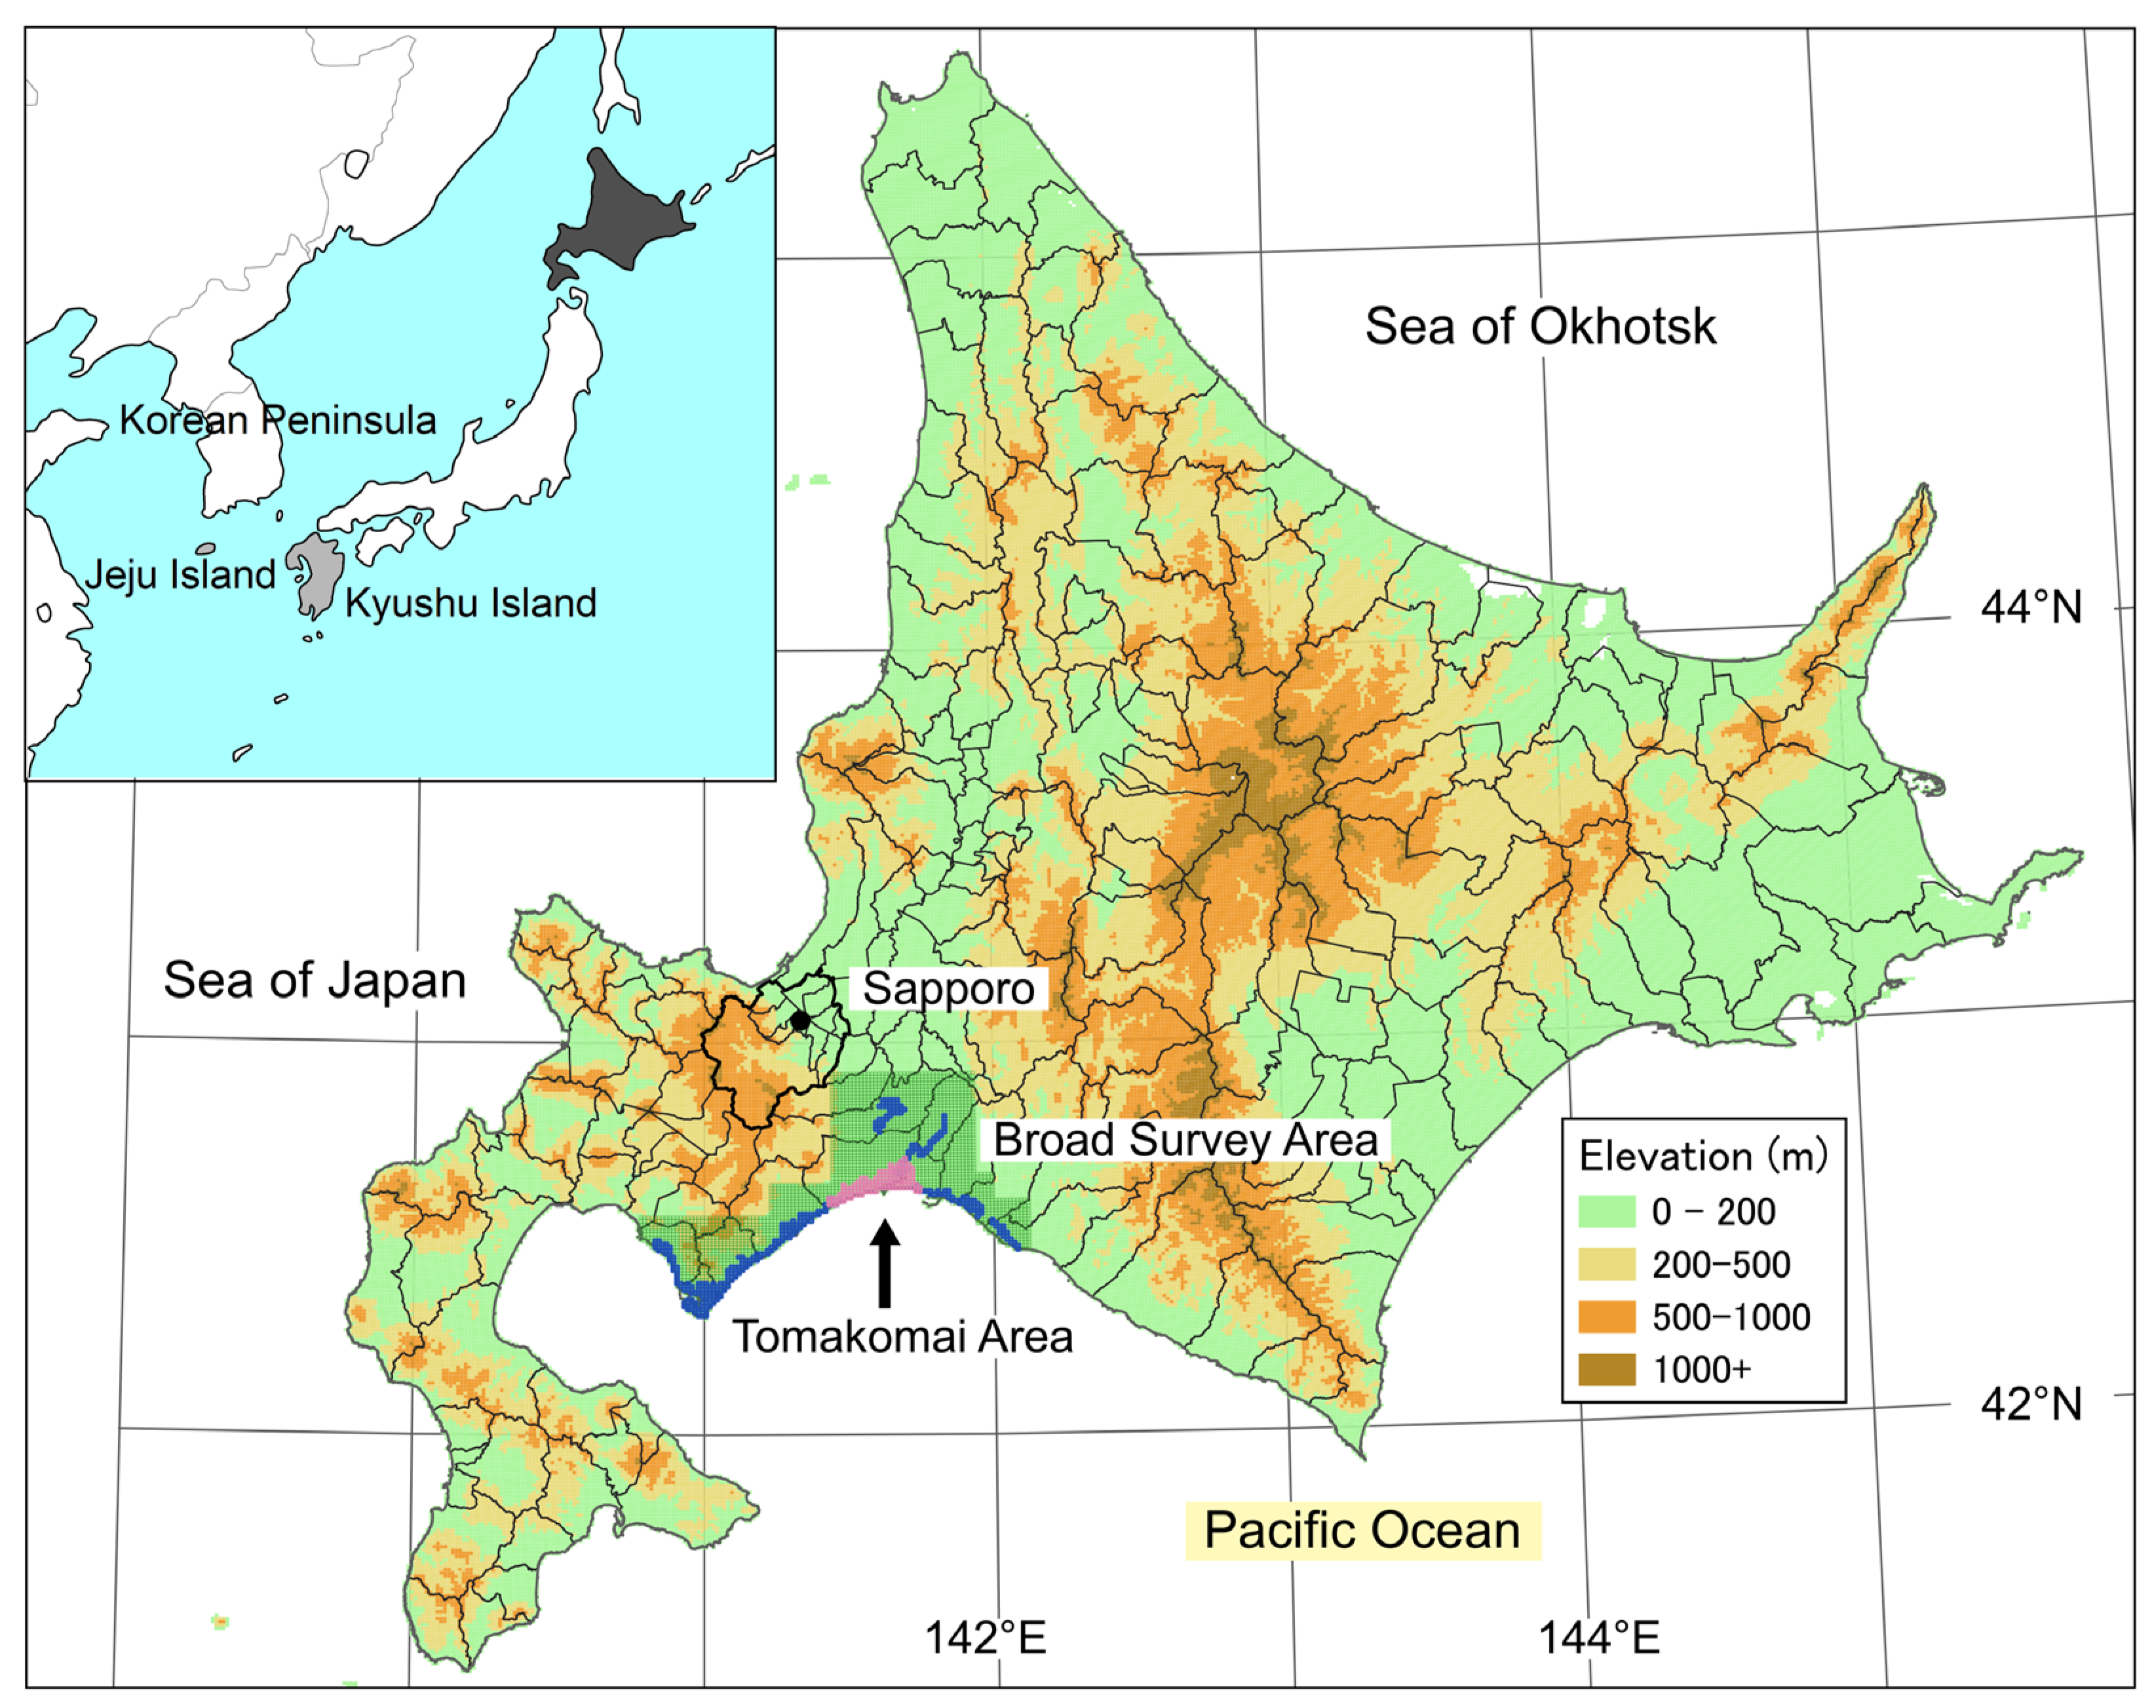
Hokkaido Island is Japan’s second-largest island after Honshu, covering an area of 77,984 km2. Located in the northernmost part of Japan, it faces Sea of Japan to the west, Sea of Okhotsk to the northeast, and Pacific Ocean to the southeast (Figure 1). Snowfall occurs across most of the island during winter, with average snow depths frequently exceeding one meter even in the plains, especially on the Sea of Japan side. As of 2015, the human population was approximately 5.38 million, of which approximately 1.95 million (36%) were concentrated in the capital, Sapporo (43°03′52″ N, 141°20′49″ E). Most of the plains have been rapidly developed into farmland and urban areas since the Meiji Restoration in 1868, but the mountainous areas are mostly covered by dense forests with closed canopies.
Figure 1.
Study areas. The “Tomakomai Area” is the target area for census surveys of magpies, and the “Broad Survey Area” is the area for irregular searching surveys, with visited grids in dark blue. In addition to these field surveys, sighting records were collected from citizens throughout Hokkaido Island. Thin lines indicate municipal boundaries. The locations of Kyushu Island, Korean Peninsula, and Jeju Island, which are mentioned in the text, are also shown.
We analyzed records of magpies collected at three spatial scales (Figure 1). First, we used census data from a previous study conducted from 2012 to 2013 at the smallest spatial scale, the plains of Tomakomai City (the “Tomakomai Area”), to evaluate magpies’ habitat selection [25]. We conducted irregular field surveys at the second spatial scale, the “Broad Survey Area” (hereafter referred to as “BSA”) in south-central Hokkaido, which encompassed 11 municipalities, ensuring comprehensive coverage of residential areas, where magpies primarily reside. Finally, citizen sightings were collected across the island of Hokkaido, excluding affiliated islands. We analyzed the relationship between magpie records and the environment at “standard grid” units across all the above spatial scales. The standard grid is defined by the Japanese government, and a single cell measures 45 s east–west and 30 s north–south (approximately 1018 m east–west and 926 m north–south in Sapporo).
2.2. Field Surveys
To count the magpie population in the Tomakomai Area, census surveys were conducted in May and September 2012, and January 2013 [25]. We traversed the survey area thoroughly, primarily using bicycles, looking for magpies. The total survey period was 26 days, with a total of 206 survey bouts and a total survey time of 249.2 h. More detailed descriptions can be found in [25].
Within the BSA excluding Tomakomai, we conducted irregular surveys searching for magpies 45 times over 18 days between 20 May 2012, and 18 November 2016, amounting to 80.9 h. Surveys by bicycle (8.9 h) or on foot (7.3 h) were limited; 81% (64.8 h) involved observer pairs using automobiles. Surveys were primarily conducted in residential areas, with no surveys in marshes and mountain forests. Survey timing was not restricted and was conducted primarily during breaks from surveys in Tomakomai. Monthly survey hours were highest in March (24.6 h) and July (26.6 h), accounting for 63% of the total. Survey tracks were recorded only for 28 of the 45 surveys, representing 52.8 h (65.3%) of the total 80.9 h. In Eniwa, located at the northernmost part of the BSA, we only confirmed one instance of an individual entering and leaving a specific nest (not included in the survey time). In addition, we looked for roosts and counted the number of individuals roosting six times, 5.1 h, in total, in three municipalities: Mukawa, Muroran, and Shiraoi.
Within the BSA, excluding Tomakomai, searching surveys were only conducted irregularly, and we failed to visit some areas far from Tomakomai. Therefore, an intensive audio-playback survey was conducted over seven days from 12–18 November 2016, in which a magpie call was broadcast and any magpie appearances were recorded. This survey was conducted 26 times, totaling 43.6 h, in seven municipalities within the BSA. Among these, the surveys in Tomakomai (3 sessions, 6.7 h) were conducted to verify the effectiveness of the playback survey in areas where magpies were already known to be present by the earlier census surveys. The audio-playback source was a 26-s recording of the Oriental Magpie recorded in eastern Mongolia [30]. This audio was the most frequently heard vocalization in magpie habitats, known as “chattering” [31]. Audio playback was conducted using a battery-operated amplifier-equipped speaker (Melody Shower BK-701, Toshiba, Kawasaki, Japan) set to maximum volume in repeat mode. The sound reached over 200 m to the human ear. Two teams with two observers each traveled by car primarily through residential areas, parking at locations with good visibility approximately every several hundred meters, and playing back the audio for a few minutes. If magpies appeared in the vicinity, the number of individuals and their locations were recorded. Individuals discovered during the survey that were unrelated to the playback were also recorded in the same manner.
In compiling the results of the above field surveys, records confirmed in close proximity during the same breeding or non-breeding season were considered to be possible duplicates, so one of them was removed.
2.3. Collecting Sightings by Citizens
In parallel with the field research, a website was launched in March 2015 to collect citizen sightings of magpies within Hokkaido [32]. We analyzed the 407 reports submitted by November 2016, provided by the website’s administrator, Osamu Hasegawa. Only records meeting the following criteria were used for further analysis: sightings occurred between 2012 and 2016 (the same period as our field surveys), clearly identified the species as the magpie, and included precise location data. If multiple records were reported by the same person at the same location within a week, only one record was retained. Records for nests where no individual activity (e.g., entry/exit) was confirmed were excluded, as these could represent old nests. These procedures left 366 valid sighting records.
2.4. Collecting Environmental Information
For land use (or land cover), we used the “Land Use Mesh Data” from the “National Land Numerical Information” [33]. This data set aggregates 100 subdivision data within every standard grid. Each subdivision contains one of 12 land use categories determined based on aerial photographs within approximately 100 m squares. We consolidated the original 11 categories, excluding sea surface, into seven main classifications: farmland (paddy fields, other farmlands and golf courses), forest, wasteland, building site, road (roads and railroads), waterside (rivers, lakes and seaside), and others (hereafter referred to as “open land” because this category contains parks, schools, sports fields, developed land, and port areas). We then determined the most dominant category within each grid. To ensure that suitable habitats adjacent to forests or farmland were not overlooked, in grids where the dominance of these categories was less than 80%, we designated the second-largest land use category as the dominant category for those grids.
Our earlier study in the Tomakomai Area has shown that magpies use parks and schools most frequently and rarely do so port areas and developed land [25], but these were classified as the same category, “others” in the Land Use data. Similarly, no distinction is made between residential areas and commercial or industrial areas within “building sites.” To address these issues, we used the “Urban-Plan Zoning Data,” a digitized version of the urban planning maps created by municipalities [33]. We consolidated the original 12 categories into four main classifications: “Residential-A” districts for low-rise housing, “Residential-B” districts for other areas intended for human habitation, “Industrial” districts for dedicated industrial land excluding human habitation, and “Commercial” districts intended for commercial and business use. Note that the actual situation of land at the time of our field surveys may not have been as the urban-plans. As these maps are provided as vector data, not grid data, we overlay the maps with the standard grids using the QGIS’s vector overlay function, and calculated the area of each urban planning zone within each standard grid cell. The planning scope is limited to urban areas; thus, we added two classifications: “Exurban,” which means outside the urban planning zones included within a grid and “Rural,” which means grids containing no urban planning zones, resulting in six categories. In the following analysis, the most dominant category within each grid was used as the representative value for that grid.
For snow depth, we used the “Mesh Agricultural Meteorological Data” provided by the National Agriculture and Food Research Organization [34]. These data are interpolated estimates of daily snow depth at the standard grid level based on observed values from locations such as the Japan Meteorological Agency’s stations [35]. Although data are available for the same period as our field survey period, we adopted the February 2014 average as the representative value because of the enormous data volume. The average snow depth at 19 Japan Meteorological Agency observation points west of Hokkaido was 51.6 cm in February 2014, which did not differ statistically from the average February value of 50.9 cm at these same locations over our field survey period, from 2012 to 2016 (Wilcoxon signed rank test, V = 82.5, p = 0.795) [36].
2.5. Statistical and Spatial Analyses
The following statistical analyses were performed using R ver. 4.5.1 [37], and spatial analyses were performed using QGIS ver. 3.44. Means are given with 1 SD, p values are shown to three decimal places (p = 0.000 was taken as p < 0.001), and p < 0.05 is considered significant. Nonparametric methods were used for statistical testing because none of our data sets met the assumptions of a normal distribution and constant variance.
Since long-term monitoring is crucial for understanding the range expansion of introduced species, all the data used in this study were compressed into “source_data.zip” in the Supplemental Materials. These data sets are ready to be incorporated into any GIS, and can be used additively in future monitoring. In the Supplemental Materials, we also provide PNG image files, compressed into “tracks&magpies.zip.” These PNG files show the survey tracks, magpie locations and habitat suitability in the Broad Survey Area, for easy viewing without GIS software.
3. Results
3.1. Magpie Abundance by Municipalities
In the Tomakomai Area, a total of 321 groups comprising 662 individuals were confirmed in the three census surveys, while a total of 38 groups and 56 individuals were confirmed by irregular searching in the six municipalities within the BSA excluding Tomakomai (Table 1). The number of individuals per survey hour in the six municipalities was less than half that of Tomakomai. More than 20 magpies were confirmed in Shiraoi and Mukawa, and we counted 30 magpies leaving their communal roost on 18 November 2016 in Mukawa. In contrast, only 1–4 individuals were recorded in Chitose, Muroran, and Noboribetsu, and no magpies were confirmed in Abira though the survey period was short.
Table 1.
Efforts of the searching and audio-playback surveys and numbers of magpies found with respect to municipalities in the “Broad Survey Area.” The municipalities are listed in order of human population.
The audio-playback survey was conducted in November 2016 in seven municipalities, including Date, at the western end of the BSA, and Hidaka, at the eastern end (Table 1). In Tomakomai, the survey was conducted in an area where magpies were relatively numerous, and 17 flocks of 57 birds were confirmed. A total of 16 flocks of 30 birds were recorded in Mukawa, Shiraoi, Muroran, and Noboribetsu, but the absolute numbers and numbers per unit effort were low in Muroran and Noboribetsu. No magpies were confirmed in Date or Hidaka.
3.2. Habitat Selection of Magpies in Tomakomai
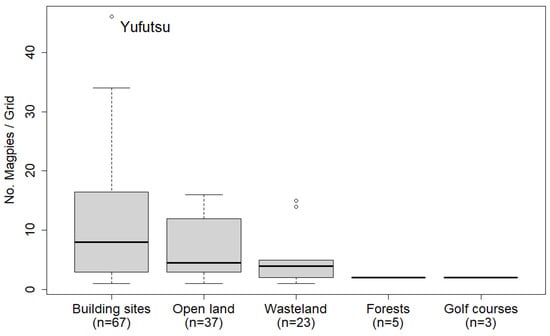
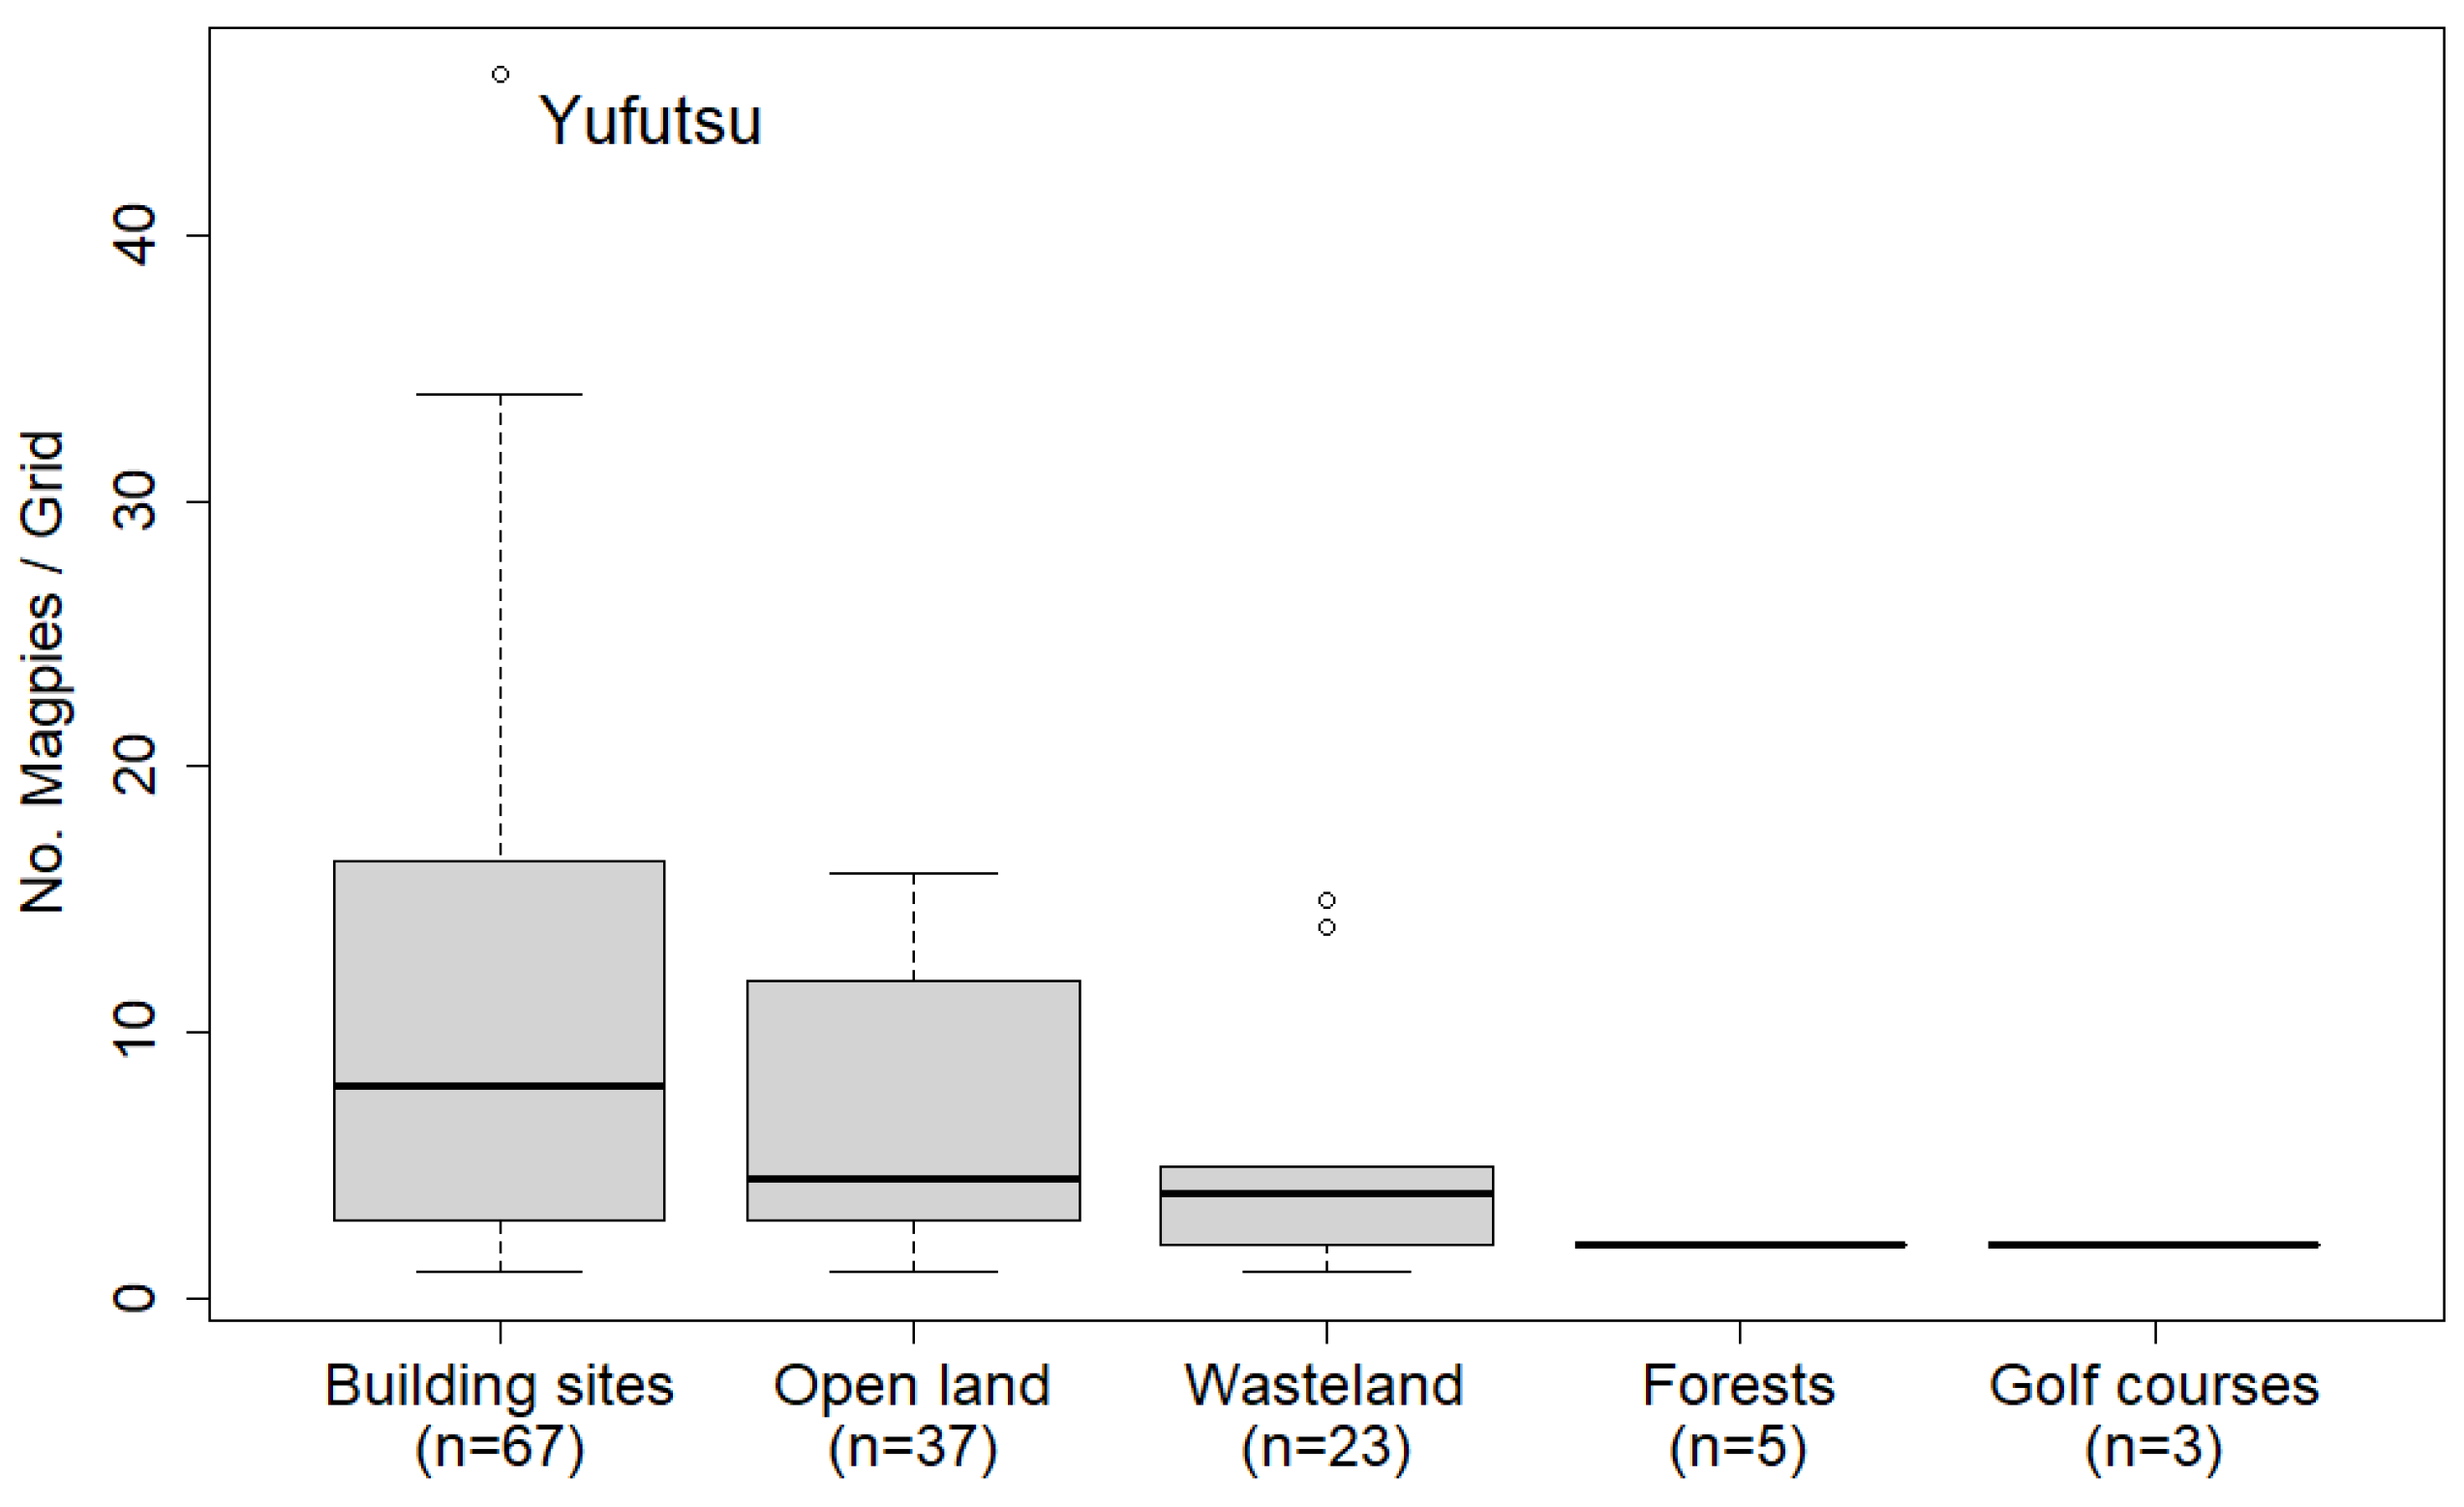
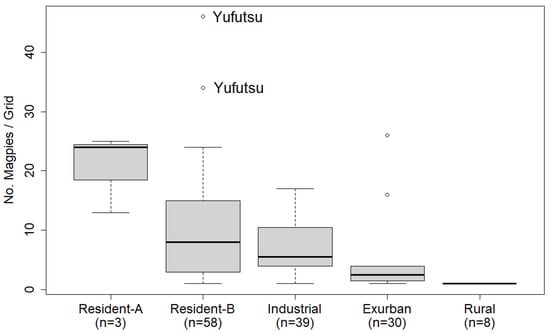
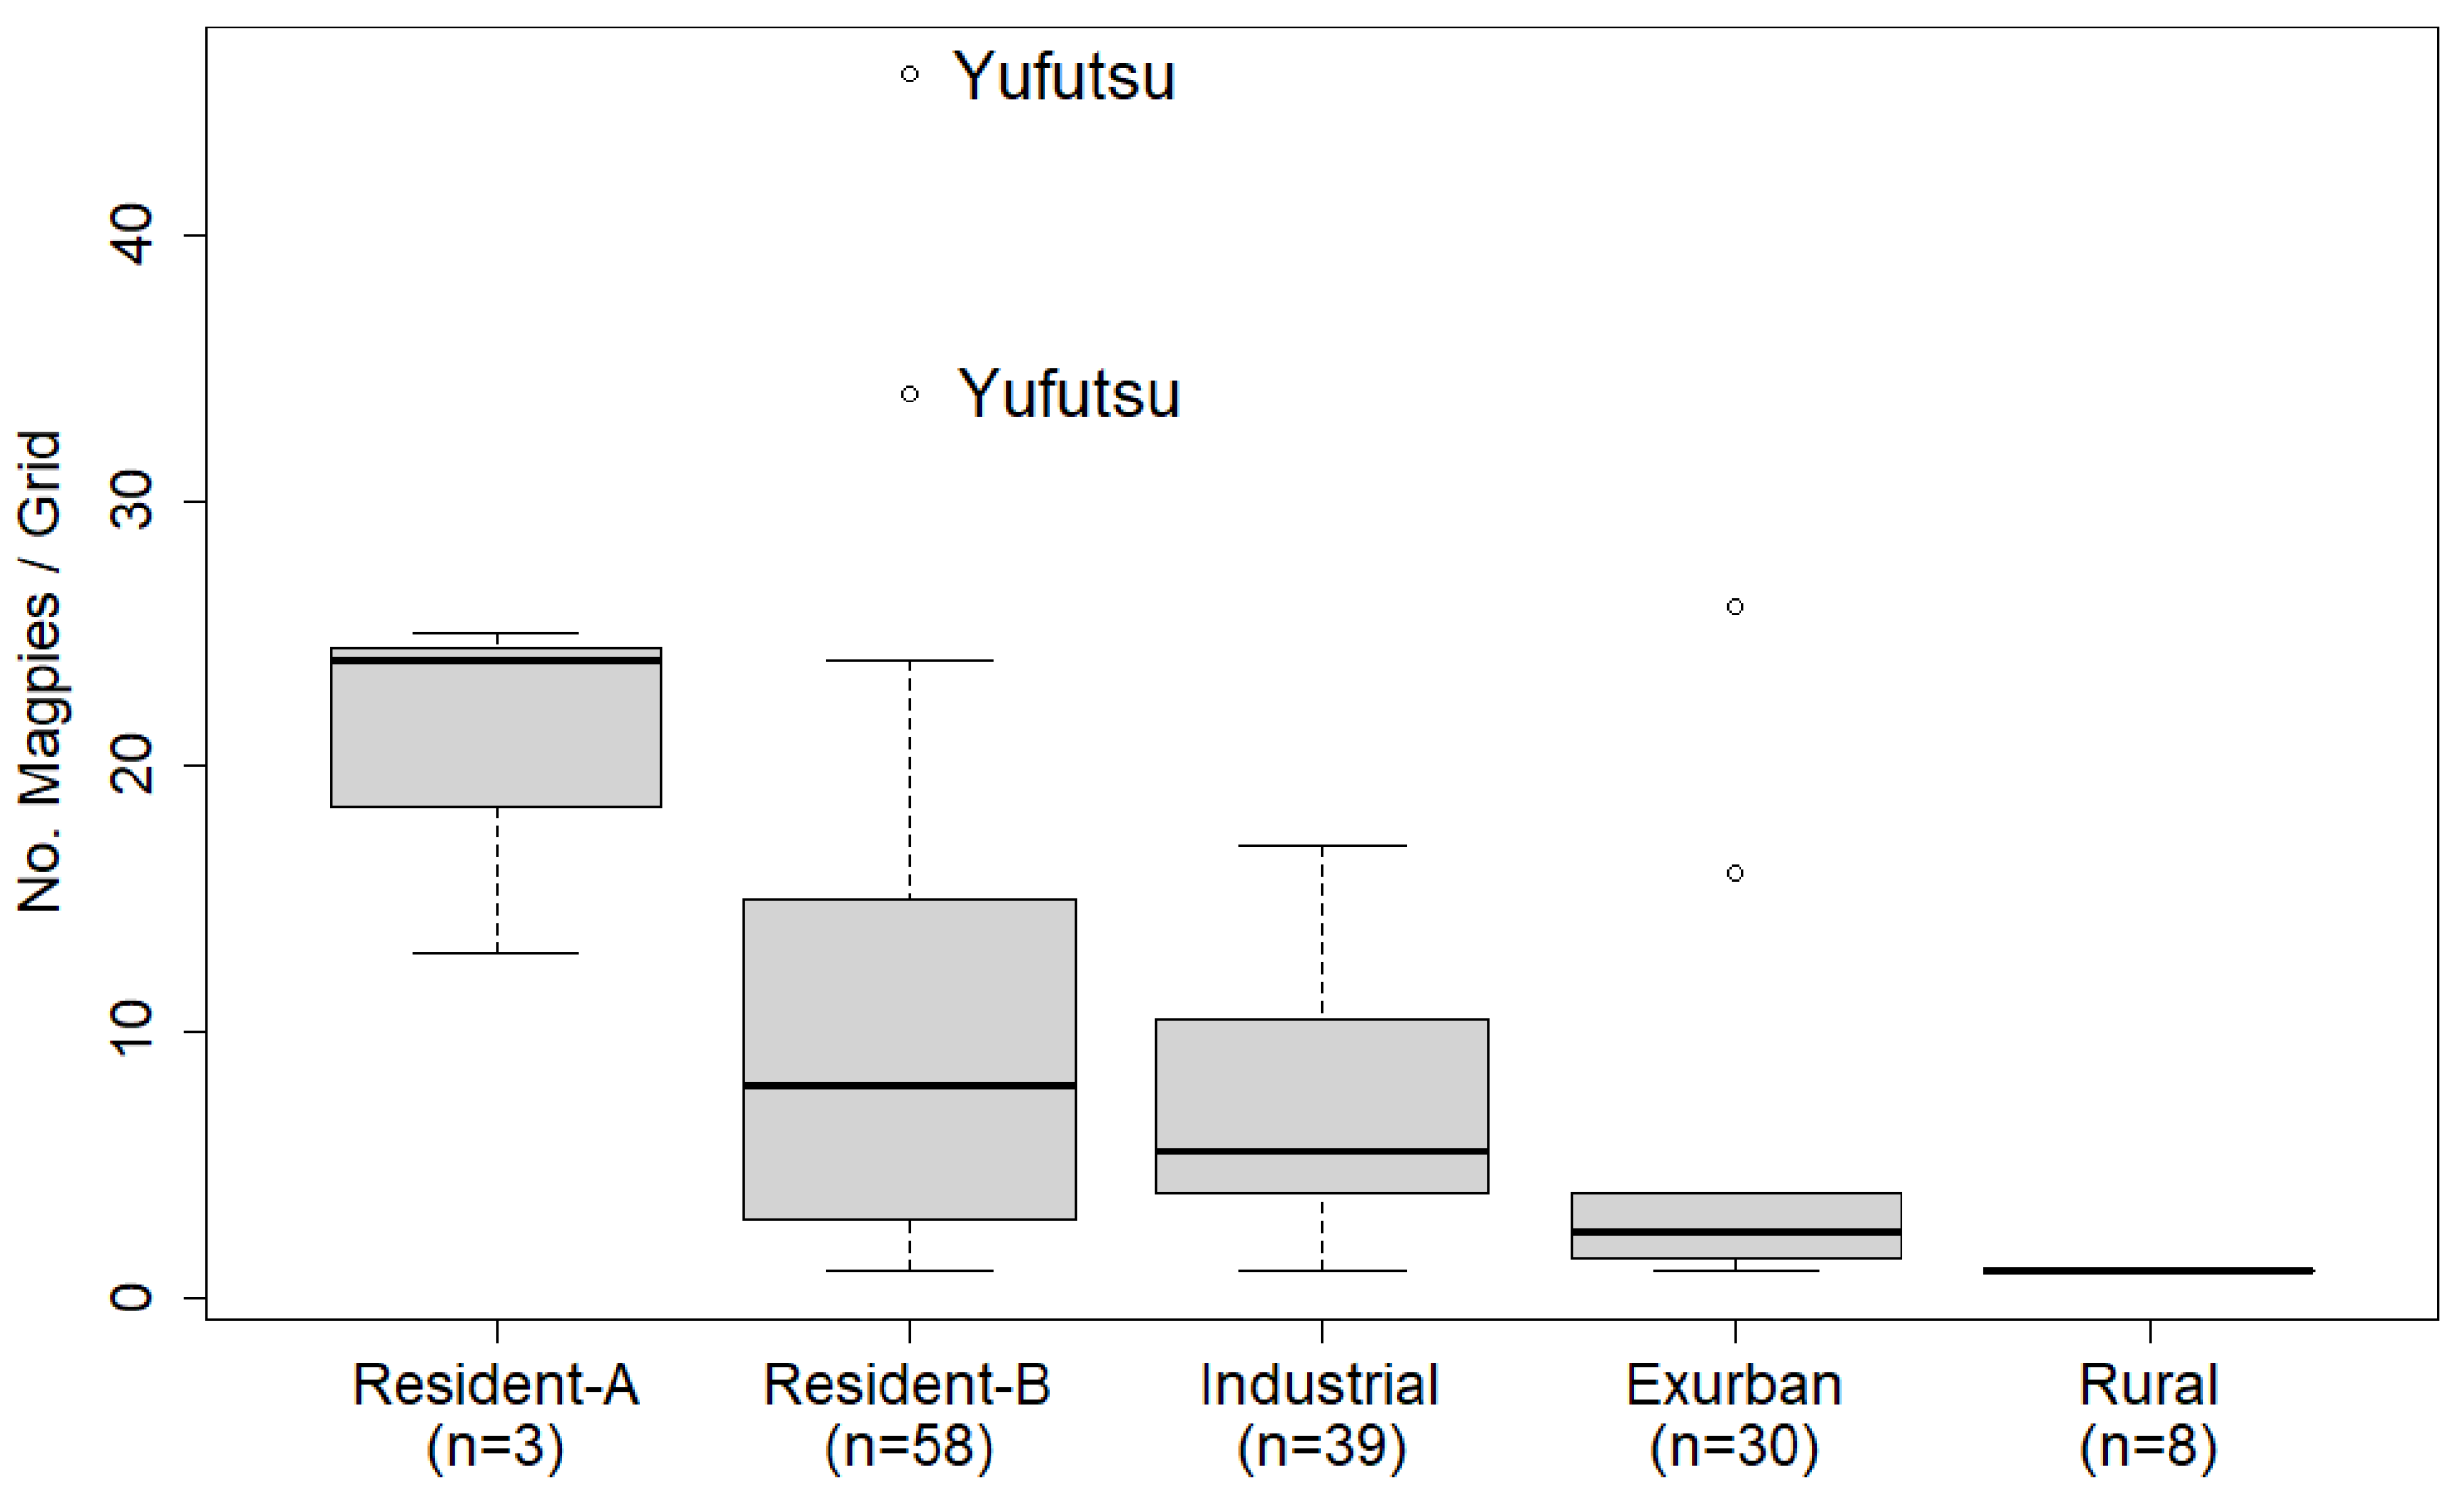
Figure 2 shows the relationship between the most dominant land use category within each grid and the number of magpies. Magpies were overwhelmingly more numerous in building sites (including residential areas), followed by open land (including parks and schools), and wasteland. They were rare in forests and on golf courses (two magpies in a grid, each). Similarly, Figure 3 shows the relationship between the dominant urban planning zone and the number of magpies. Magpies were most numerous in low-rise residential areas (Resident-A), followed by general residential areas (Resident-B). Magpies were almost nonexistent in the Rural grids far from urban areas (only one magpie). Grids in the southeastern Yufutsu district showed exceptionally high magpie densities, representing outliers in both land use and urban planning categories (Figure 2 and Figure 3).
Figure 2.
Differences in magpie densities by the most dominant land-use category within grids in the Tomakomai Area. The outlier labeled “Yufutsu” in the upper left indicates a grid at the southeastern edge of the survey area where magpies were concentrated. Note that, except for one grid that consisted entirely of forest, the remaining 138 grids contained multiple land-use categories. Since there were only two grids dominated by waterside or roads, these have been omitted.
Figure 3.
Differences in magpie densities by the most dominant urban planning category within grids in the Tomakomai Area. “Yufutsu” outliers in Resident-B represent grids at the southeastern edge of the survey area where magpies were concentrated. “Exurban” refers to areas outside urban planning zones, and “Rural” refers to grids that do not contain any urban planning zones. Most grids except for “Rural” contained multiple urban planning categories. Since there was only one grid dominated by commercial districts, it has been omitted.
Since the land use and urban planning categories have their shortcomings, as mentioned above, we evaluated magpie habitat by using the combination of these two land features. First, we calculated the number of magpies (total from three census surveys) for each combination of a dominant land use category and a dominant urban planning zone within grids in the Tomakomai Area. We classified grids with the combinations where the number of magpies per grid exceeded the mean as “suitable habitat” (or “suitable grids”) and those where the number was at or below the mean but at least 1.0 as “possible habitat” (Table 2). We ignored combinations that appeared only in one grid.
Table 2.
Numbers of magpies per grid in the Tomakomai Area in relation to the combination of land use and urban planning categories with grid numbers in parentheses. Bold and italicized text means combinations that are deemed “suitable habitat” or “possible habitat” for magpies, respectively.
3.3. Magpie Status in the Broad Survey Area
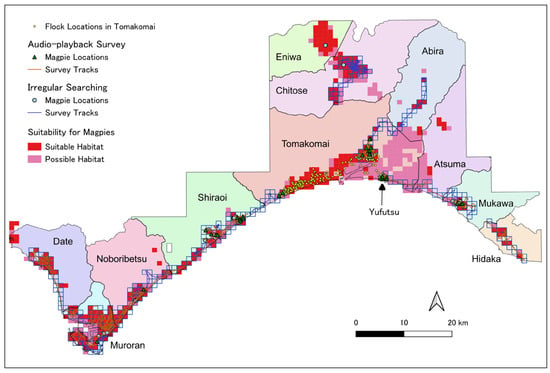
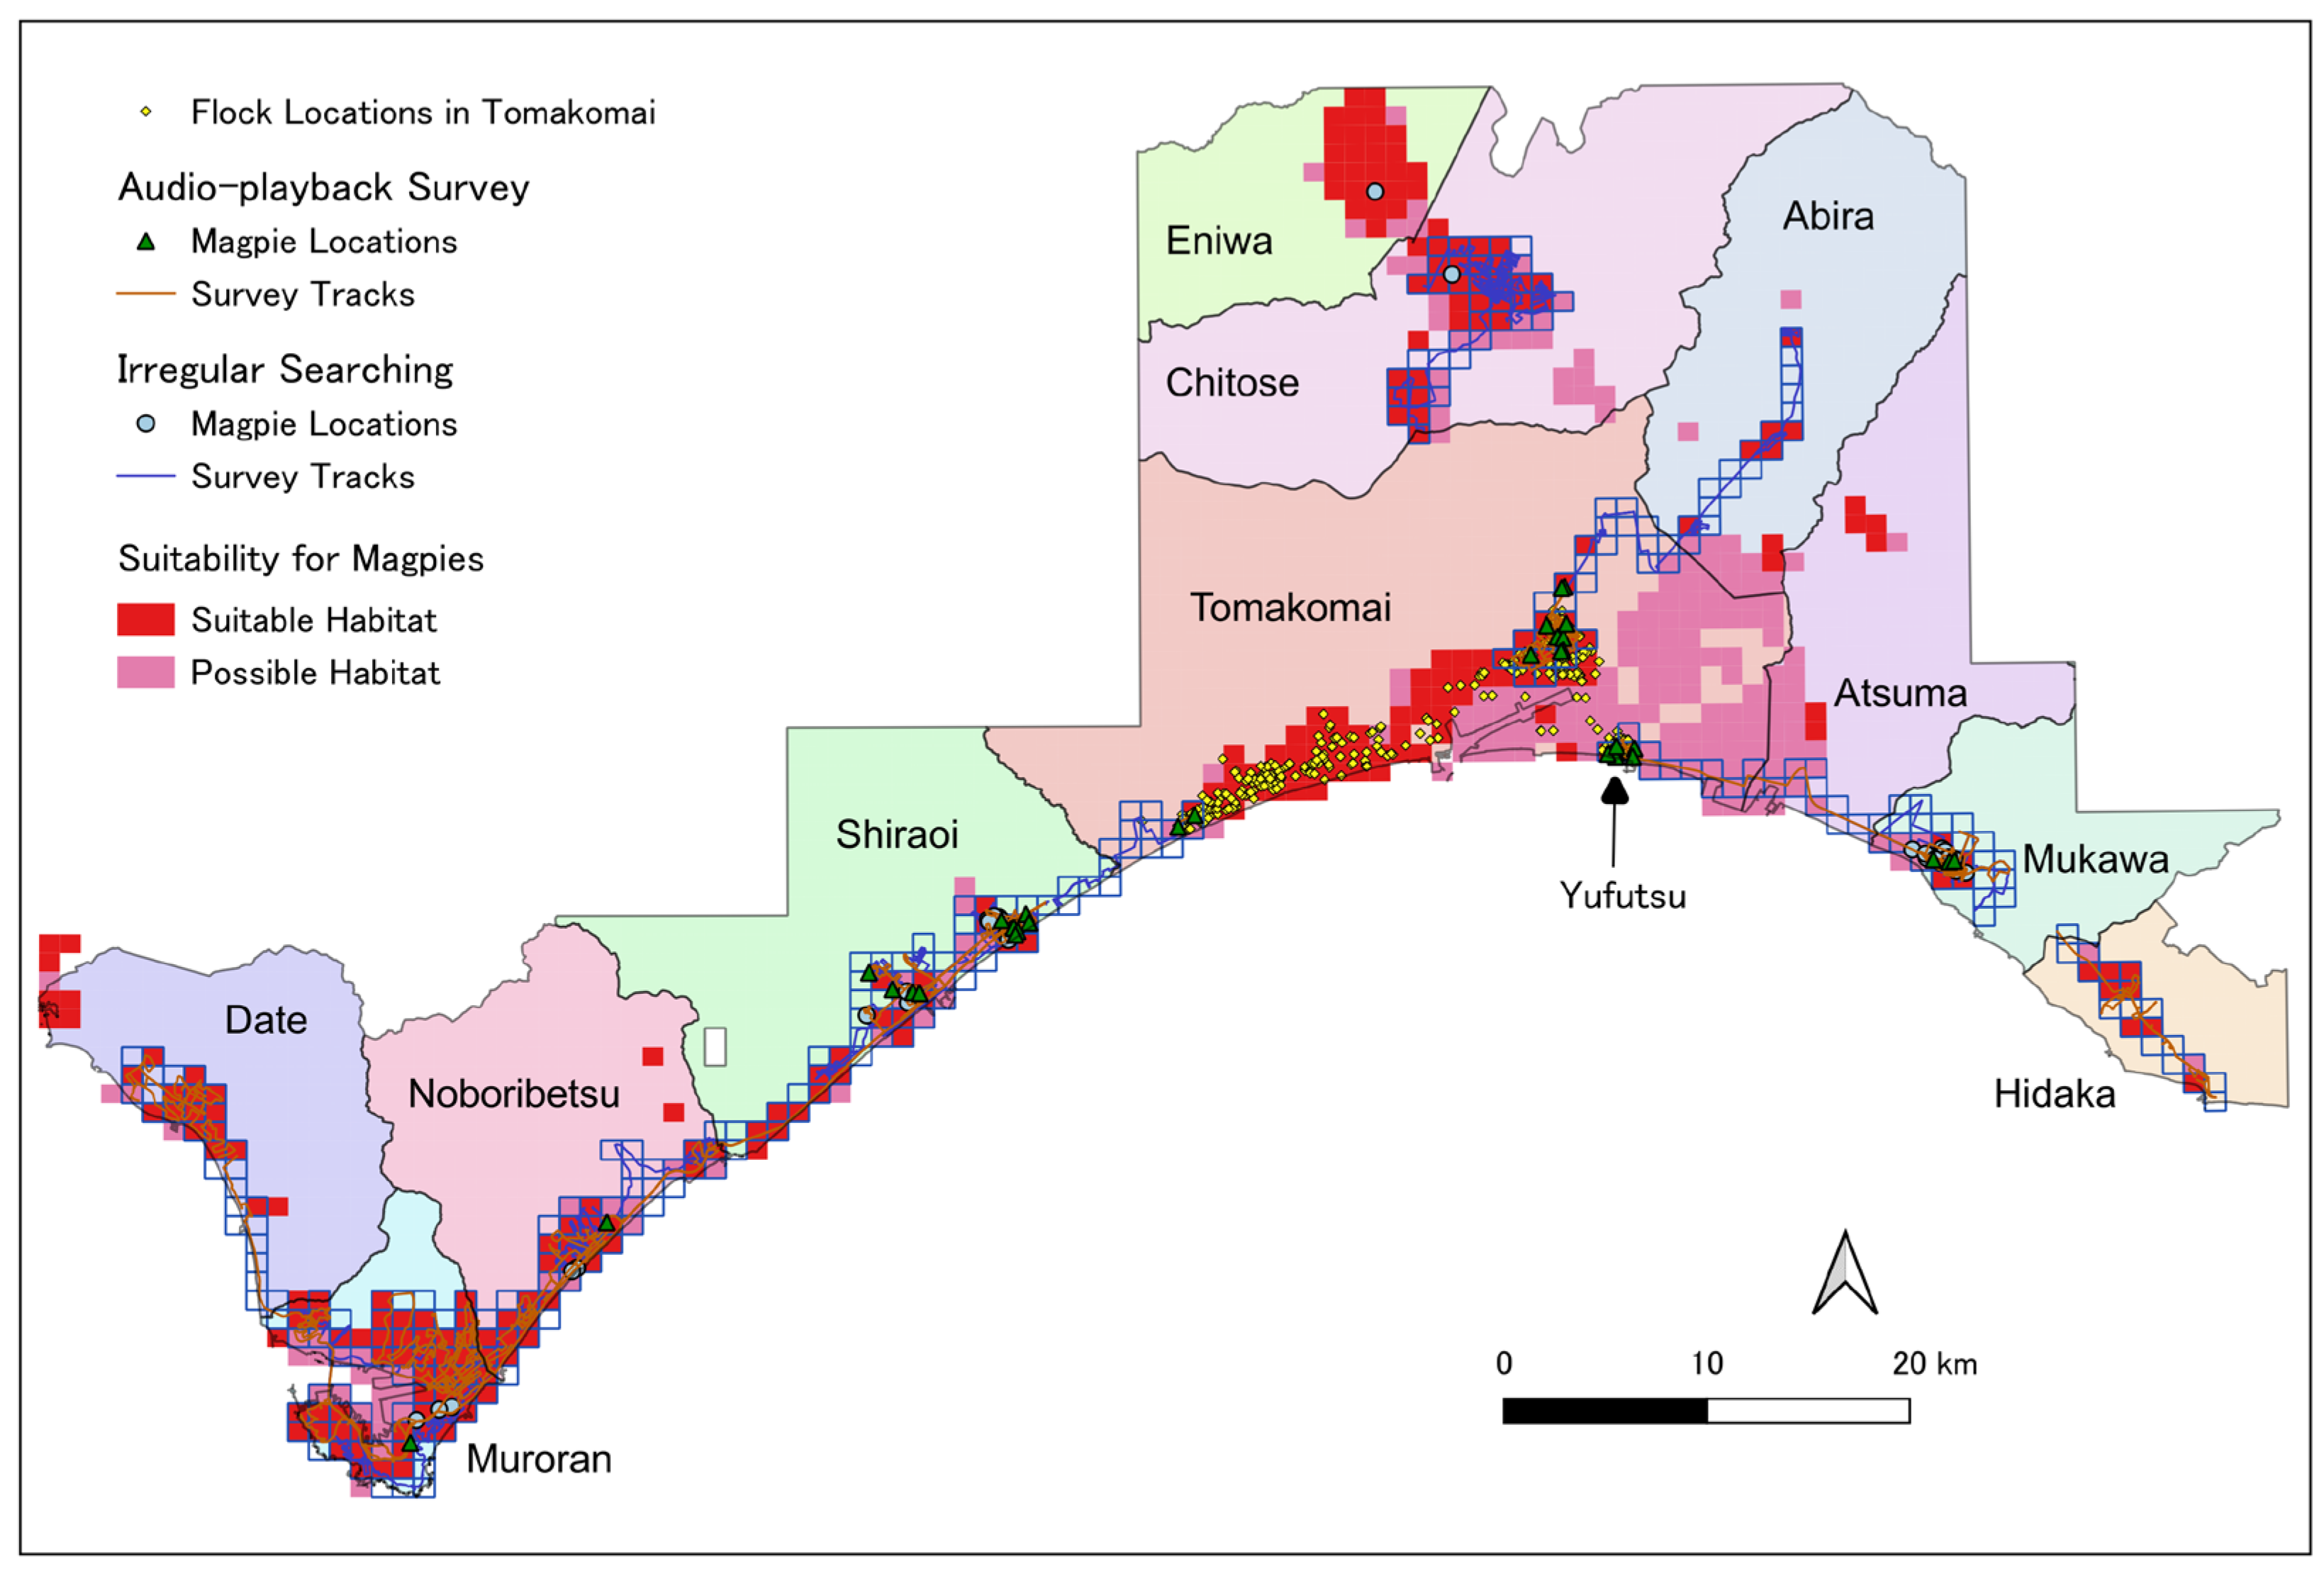
In the 363 grids where we actually searched for magpies within the BSA, magpies were found in 24 (14.2%) of 169 suitable grids with 122 individuals in total and in 5 (8.1%) of 62 possible grids with 16 individuals, whereas in 3 (2.3%) of 132 unsuitable grids with 5 individuals (Figure 4 and Table 3, Fisher’s exact test, p < 0.001). By municipality, magpies were found in 25–80% of suitable grids in Tomakomai, Shiraoi, and Mukawa. In contrast, magpies were found in 9% or less of suitable grids in the other municipalities (Table 3).
Figure 4.
Distribution of suitable grids in the “Broad Survey Area” and the locations of magpies observed by our field surveys. The blue-bordered grids indicate that they contain tracks from search surveys and/or audio-playback surveys. Small yellow circles indicate the locations of magpie flocks found by the three census surveys in the Tomakomai Area.
Table 3.
Numbers of grids where we conducted irregular searching and/or audio-playback surveys and those with magpies in relation to the municipality and suitability in the Wide Survey Area. Municipalities are identical to those in Table 1 except Atsuma, which was added in this table.
3.4. Magpies Status on Hokkaido Island
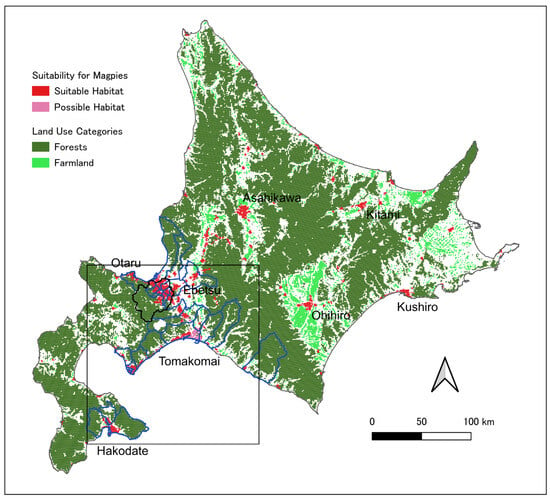
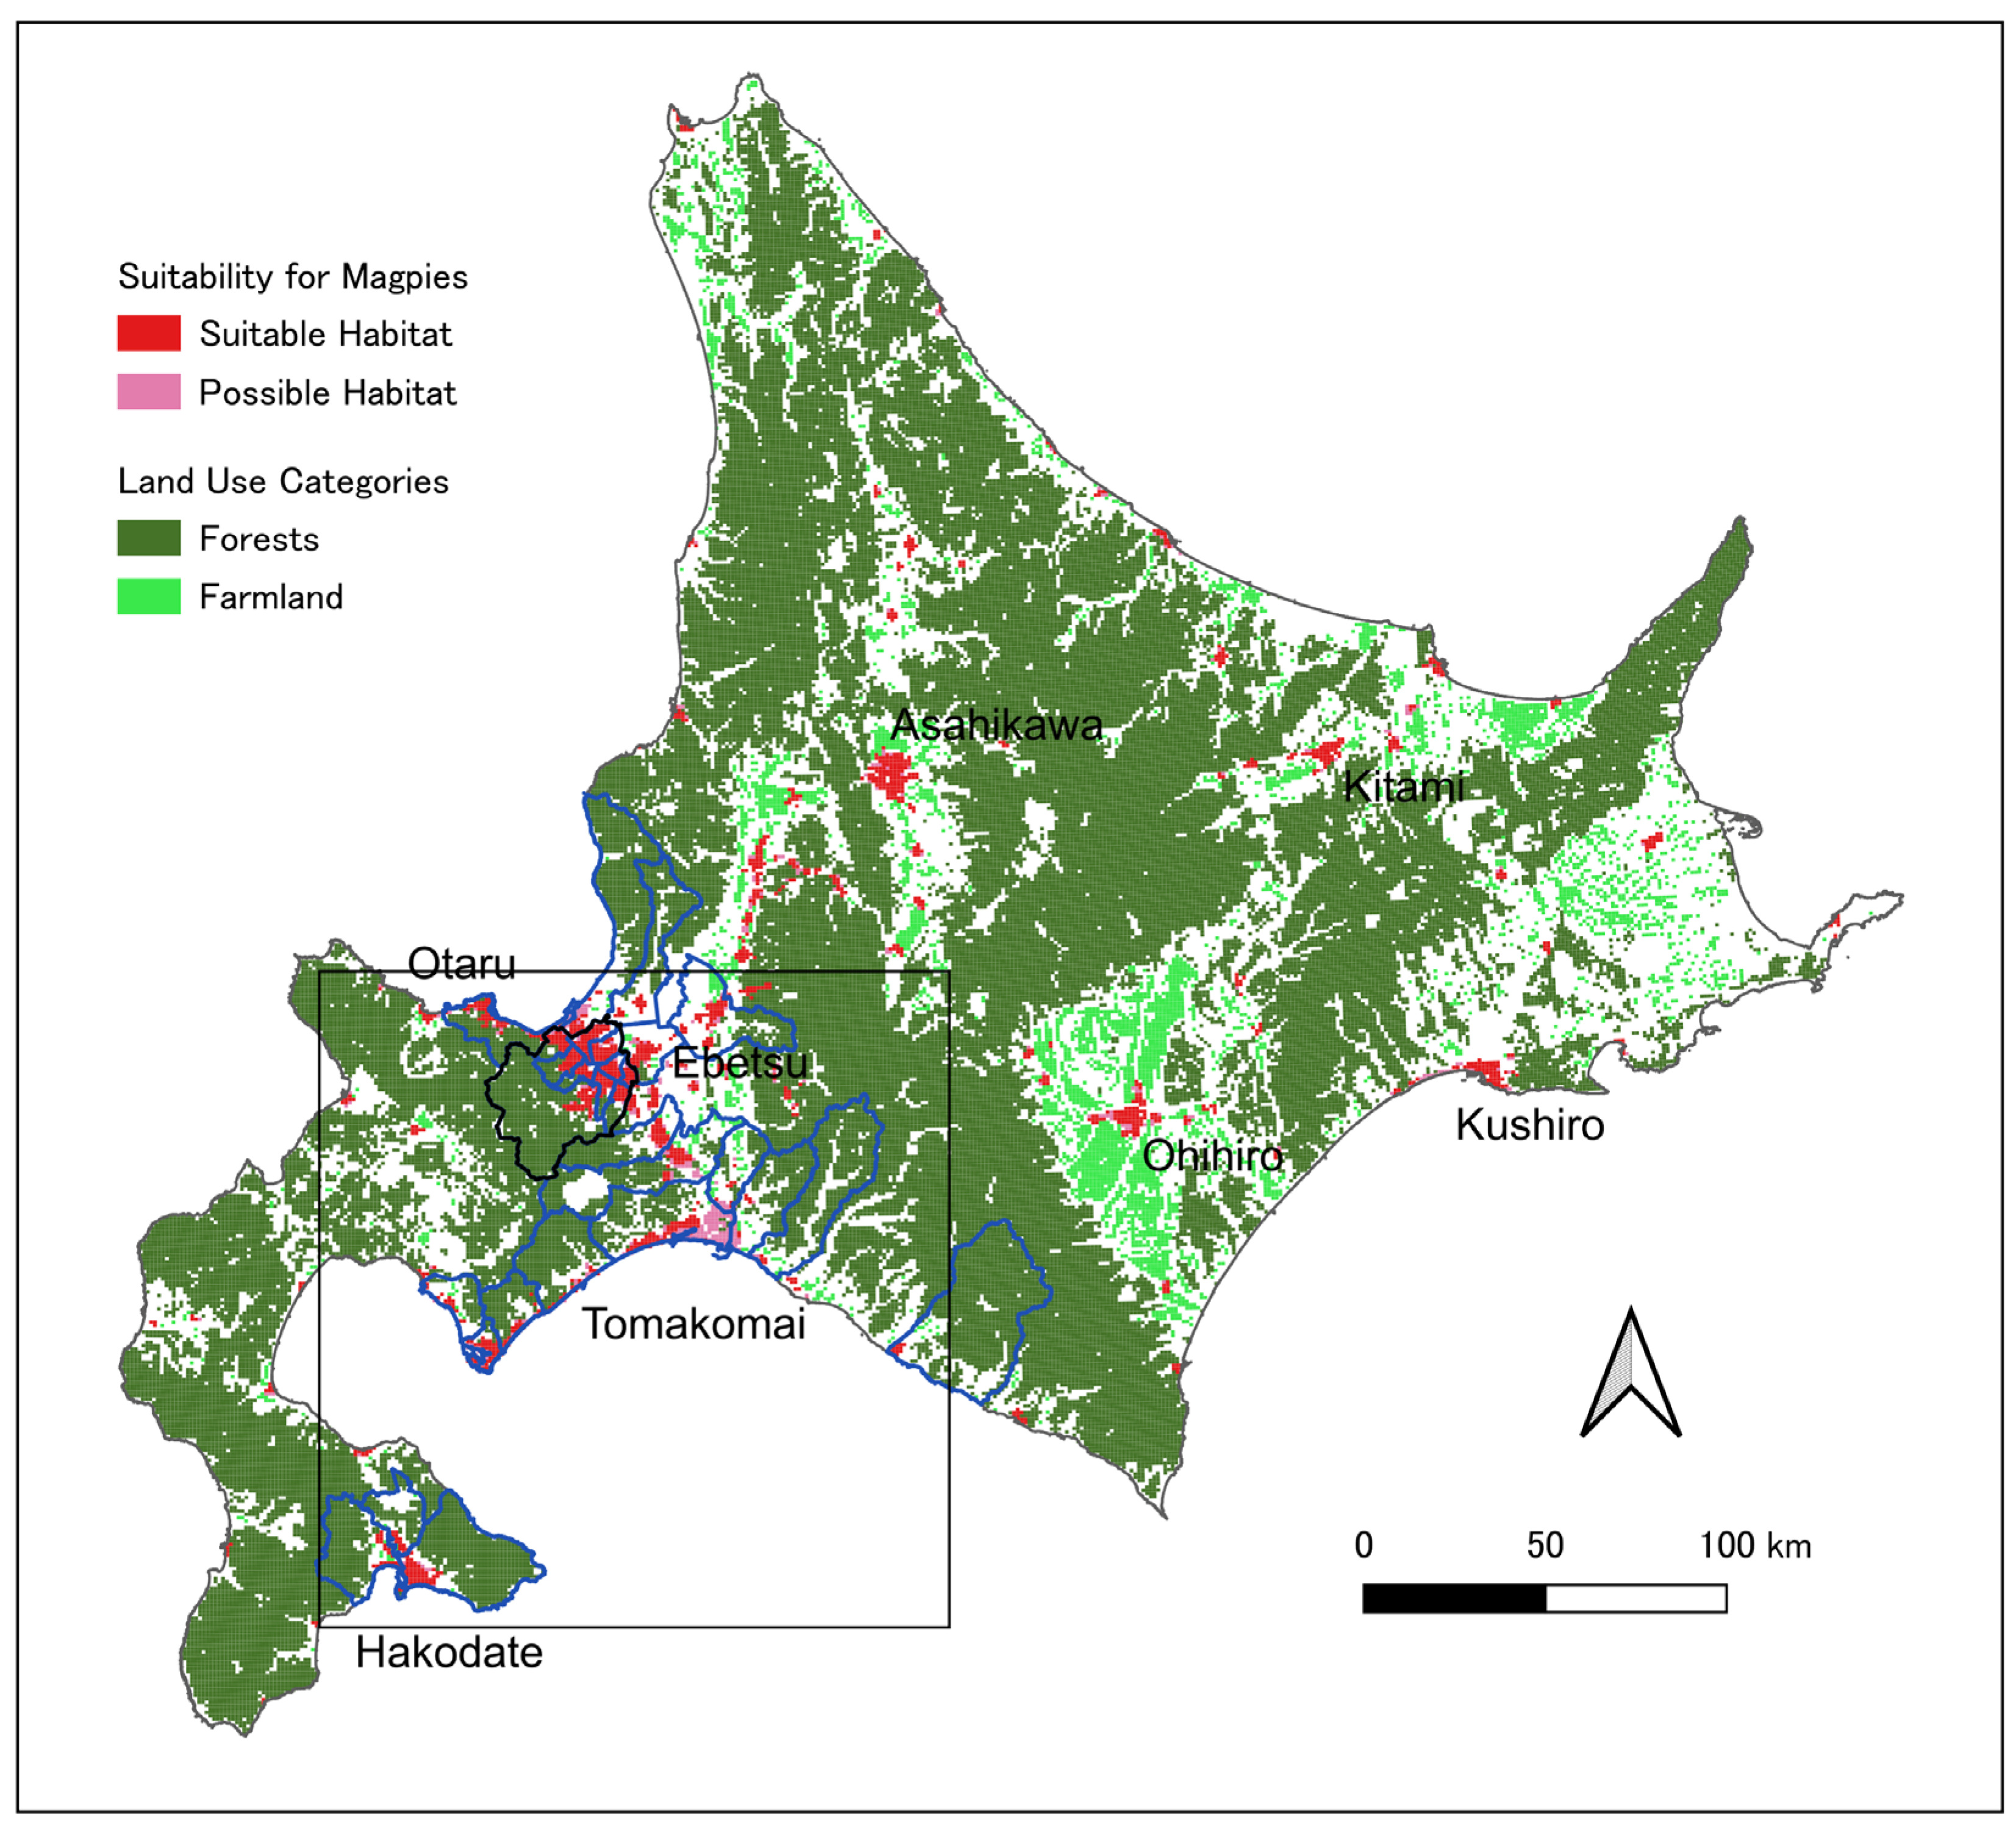
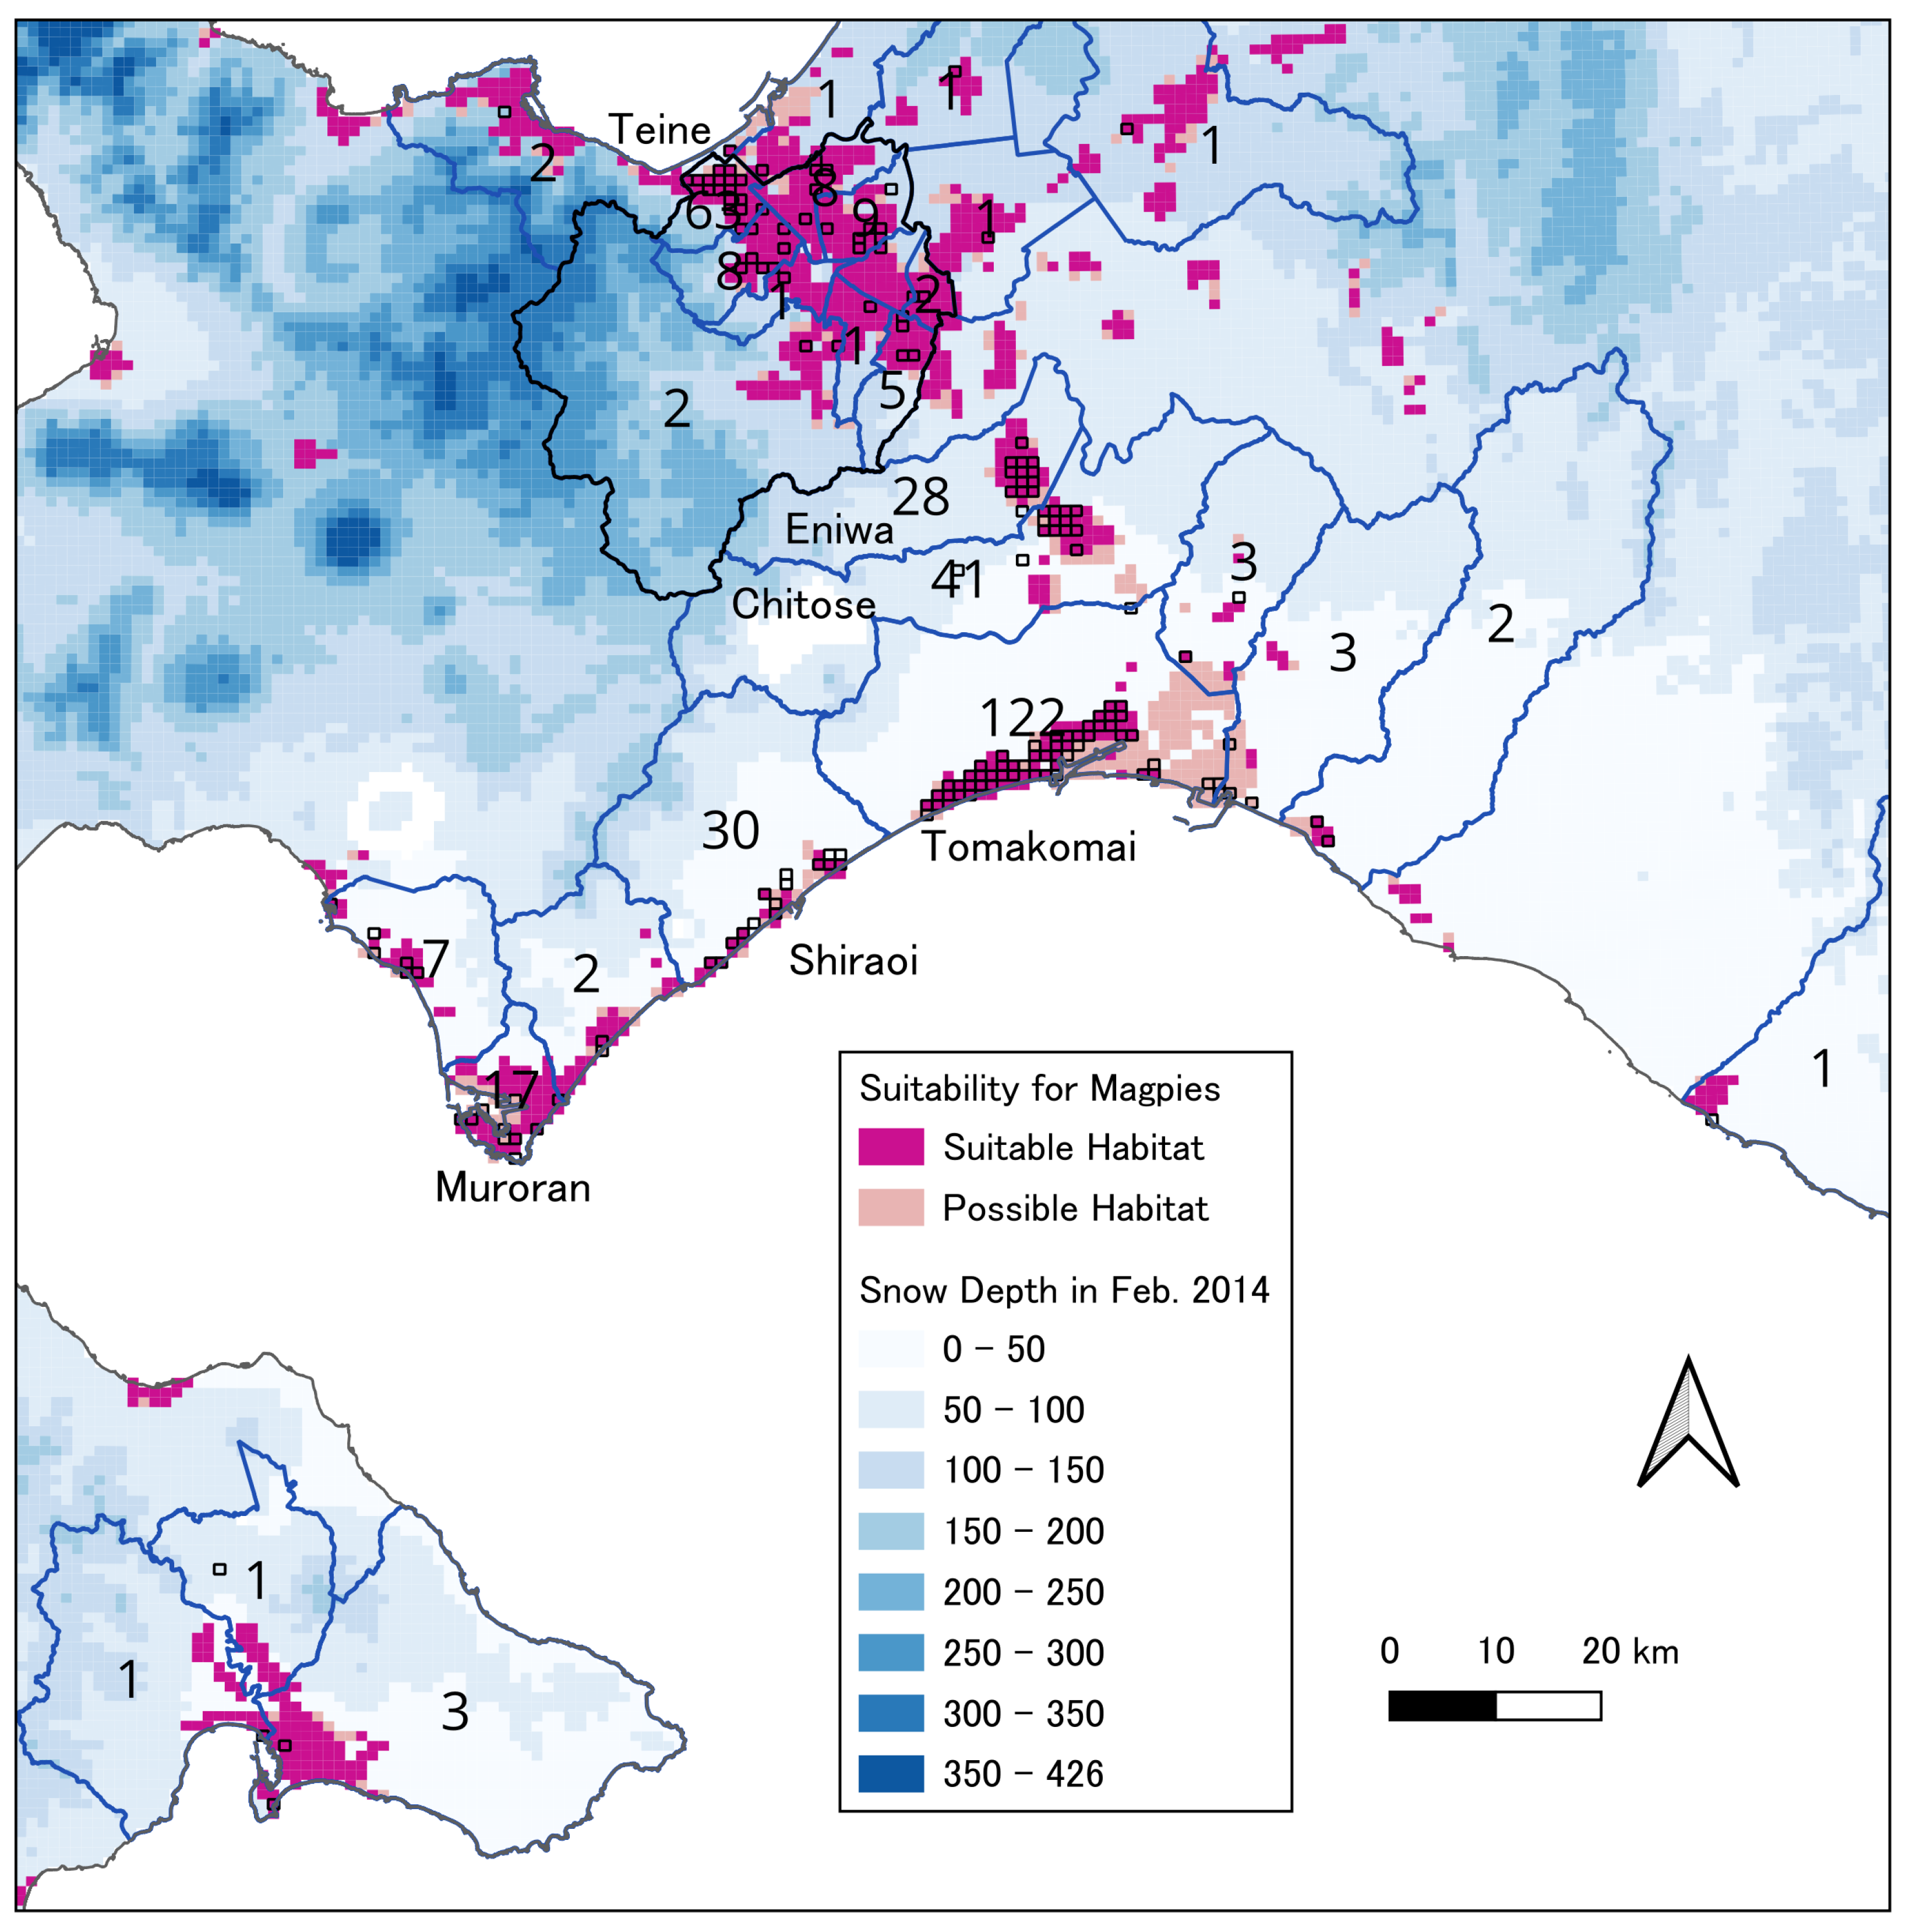
Of the 366 valid sightings reported by residents, 288 provided population count information, resulting in 527 magpies (at least 605 birds by adding 78 reports without count data) being observed, with many presumable overlaps. Although suitable habitat was widely scattered across the flat areas of Hokkaido, magpies were only recorded in 28 municipalities of western Hokkaido (Figure 5). Six municipalities recorded more than 10 sightings: Tomakomai (122 sightings, 195 birds), Teine ward, Sapporo (63 sightings, 67 birds), Chitose (41 sightings, 66 birds), Shiraoi (30 sightings, 52 birds), Eniwa (28 sightings, 39 birds), and Muroran (17 sightings, 31 birds) (Figure 5). In Sapporo, 100 sightings and 105 birds were recorded in nine wards except Shiroishi ward, with few sightings in the downtown area.
Figure 5.
Distribution of suitable habitats, possible habitats, and two land use categories. forests and farmland, where magpies rarely used, across the island of Hokkaido. White parts were dominated by other land use categories. The names of major cities with populations of 100,000 or more are displayed, and Sapporo City is outlined in bold. Sightings of magpies were reported by citizens only in the 28 municipalities outlined in blue. Refer to Figure 6 for the area enclosed by the square, which contains all sighting records.
The following statistical analysis focused only on the 28 municipalities where magpie sightings were reported (10,294 grids), rather than the entire Hokkaido Island (82,839 grids). Sightings were reported in 141 (16.2%) of 868 suitable grids and in 16 (6.3%) of 253 possible grids, whereas only in 16 (0.2%) of 9173 unsuitable grids (Fisher’s exact test, p < 0.001).
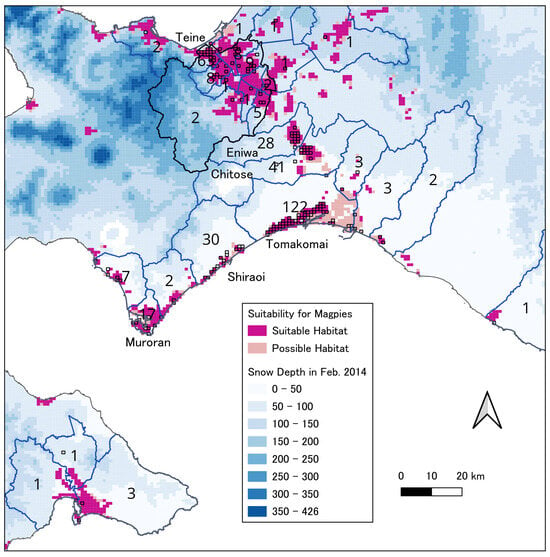
The mean snow depth on Hokkaido Island in February 2014 was 106.5 ± 64.7 cm (n = 82,736 grids). Such deep snow may reduce the habitat suitability for magpies. The 28 above-mentioned municipalities included many areas with little snowfall, such as Tomakomai, as well as mountainous areas with extremely heavy snowfall (Figure 6). Therefore, we examined the effect of snow depth by limiting the analysis to 1307 grids in Sapporo City, where both snowfall and magpie sightings were common. A logistic regression, with the presence/absence of magpies as the response variable, and habitat suitability and snow depth as predictor variables, showed that snow depth significantly decreased the probability of sightings, while higher habitat suitability (suitable or possible grids) significantly increased that (AIC = 27.4; odds ratio = 0.92, p < 0.001 for snow depth; odds ratio = 5.83, p = 0.001 for suitability). The mean snow depth in the 48 grids where magpies were sighted was 101.5 ± 8.1 SD cm with a range from 91.5 cm to 119.4 cm.
Figure 6.
Suitable and possible habitats in areas with any magpie sightings, along with snow depth (average daily snow depth in February 2014). Grids where sightings were reported are outlined in bold, and the number of sightings in each municipality is shown, along with the names of municipalities where 10 or more reports were received.
4. Discussion
4.1. Distributional Range of Magpies in 2012–2016
The results of this study show that, as of 2012–2016, Tomakomai had by far the highest total number of magpies observed and the highest number of magpies per unit effort (Table 1). Following Tomakomai, Shiraoi and Mukawa had the next highest number of records per unit effort. The maximum number of individuals confirmed in a single season was 21 and 30, respectively, and nesting was confirmed every year from 2012 to 2016 in these two municipalities. The distance from Tomakomai to the nearest sighting point in Shiraoi and Mukawa was approximately 9 km and 15 km, respectively, separated by open environments such as pastures. Therefore, these three municipalities may have maintained loosely interconnected magpie populations.
On the other hand, in Muroran and Noboribetsu—where the earliest sightings and nesting of the Oriental Magpie were recorded in Hokkaido [24]—the total number of individuals recorded and the number of individuals per unit effort were considerably lower than in Tomakomai, Shiraoi, and Mukawa (Table 1). Approximately 20 to 30 years had passed between Horimoto’s [24] first observation record in 1984 and first nesting record in 1993 and this study; during that time, the number of individuals does not seem to have increased significantly in Muroran and Noboribetsu.
Among other areas, there have been more than 10 sightings in Chitose and Eniwa, located north of Tomakomai, as well as in Teine ward, Sapporo (Figure 6), and nesting has also been reported. In Date, located northwest of Muroran, nesting records have been reported in the past [38]; however, no magpies were confirmed during our field surveys. There have also been sightings in the Ishikari Plain and various urban areas to its southwest (Figure 5 and Figure 6). It appears that magpies in these areas are attempting to breed, but at the time of this study (2012–2016), they were not yet able to consistently do so successfully.
The invasion and dispersal routes of magpies in Hokkaido remain unknown. The Oriental Magpie is widely distributed from East Asia to the Russian Far East [17]. In Japan, breeding records exist in 15 of the 47 prefectures, plus non-breeding sightings reported in 19 others; it is believed that, aside from the seven prefectures in Kyushu where the species is thought to have originated from introduced individuals [23], there has been some natural dispersal from the Asian continent [39]. Regarding magpies in Tomakomai, Kryukov et al. [40] suggest that this population was established by a large number of founders, based on their high genetic diversity in the control region of mtDNA. Since the authors have frequently observed magpies roosting in groups inside buildings such as factories, it is plausible that they entered moored ships and were transported unintentionally to Hokkaido. Tomakomai Port, which ranks first in Hokkaido in terms of trade volume, 2054 ocean-going vessels called at the port in 2016 alone, 262 of which were car carriers—structures with roofed multi-level parking areas that are considered easy for magpies to enter [41]. Kurosawa and Horimoto [38] suggested that magpies spread to the east and west from Muroran along the southern Pacific coast over several decades. However, we need to know the lineage relationships between individuals determined by detailed genetic analysis using such as microsatellites to reveal the dispersal process.
4.2. Potential Suitable Habitats for Magpies
We evaluated habitat suitability for magpies based on the results of repeated census surveys conducted across the entire approximately 80 km2 Tomakomai study area [25]. As environmental factors, we used only the combination of land use and urban planning categories (Table 2), and did not consider human populations and topographic features, which are likely to be correlated with the land use and urban planning categories. Although our results offer merely qualitative, non-quantitative, estimates of suitability, they can play a role in promoting future research. Our suitability estimates largely coincided with magpie records in the BSA and in municipalities where sightings had been reported within Hokkaido Island (Table 3, Figure 4 and Figure 6). However, since most of the estimated suitable habitats were inhabited by humans, sightings reported by citizens may be overestimated compared to those in non-inhabited areas. Suitable habitats extended into the eastern part of Hokkaido Island (Figure 5), but the absence of sightings suggests that magpies have not yet reached that area.
4.3. Factors Limiting the Abundance and Distribution of Magpies
4.3.1. Various Patterns in Range Expansion
The invasion of alien species involves three steps: introduction into a new range, establishment, and spread [42]. The results of this study suggest that the Oriental Magpie is already spreading in Hokkaido. According to Jeschke and Strayer [42], a review of invasive vertebrate species between Europe and North America, birds typically took approximately 50 years to establish themselves after introduction and less than 10 years to spread after establishment (see [27] for examples of several avian species). However, the speed of spread in the invaded area and the final distribution range vary even within the genus Pica. Oriental Magpies were introduced to Kyushu Island, Japan (36,782 km2) from the Korean Peninsula approximately 400 years ago, but their distributional range was limited to rural areas along the Ariake Sea until around 1960 [23]. In contrast, on Jeju Island (1845 km2) in South Korea, approximately 350 km west of Kyushu, 48 magpies introduced in 1989 spread rapidly throughout the island [43]. On the island of Ireland (84,420 km2), the Eurasian Magpie (Pica pica) had once disappeared during historical times, but after re-invading in the 17th century, it quickly expanded its distribution throughout the island [18]. Although the Oriental Magpie in Hokkaido has become a frequent sight in urban areas on the western side of the island by the 2010s, 30 years after the earliest records (Figure 5 and Figure 6), areas with self-sustaining populations are still limited. Here, we discuss the factors limiting the abundance and distribution of magpies in Hokkaido.
4.3.2. Spread Capability
Young Eurasian Magpies that remained close to their natal home range survived significantly better than those moving further away [18]. This suggests that magpies are unlikely to disperse far from their place of birth unless factors such as the density effect cause their habitat to deteriorate. However, since sightings have already been reported across a wide area in western Hokkaido, dispersal capacity is unlikely to limit their range in this region. Nevertheless, a forest belt stretching north to south lies between the current sighting range and suitable habitats scattered across eastern Hokkaido, with a minimum width of 5 km. The area along the Ishikari River—which flows from Asahikawa City on the eastern side to the Ishikari Plain on the western side—appears to be the only dispersal route, but range expansion along this route might be slow if it occurs at all.
4.3.3. Snowfall
Hokkaido is one of the world’s rare areas with heavy snowfall for human settlement. In Sapporo, which has a population of approximately 1.97 million as of 2020, the average snow depth in February reaches 95 cm. It has long been reported that magpies mainly forage on the ground [18], and this was also the case in Tomakomai [25]. Deep snow not only makes it difficult for magpies to forage on the ground, but it also makes it difficult for pet owners to keep pets outdoors, potentially reducing opportunities for pet food theft [26]. Although the logistic regression showed a significant negative effect of snow depth on the probability of sightings in Sapporo, the average snow depth in the grids where magpies were sighted exceeded 100 cm. We observed magpies feeding on the berries of Japanese rowans Sorbus commixta and other trees during winter in Tomakomai. In Sapporo, nearly 30,000 rowan trees are planted as street trees [44]. If food resources are secured by such berries of planted trees or through feeding by citizens, snowfall may not restrict the distribution of magpies.
4.3.4. Food Resources
Stable isotope analysis revealed that magpies in Tomakomai rely on pet food for more than 40% of their nutritional intake during the egg-laying season [26]. Fujioka and Murayama [25] reported that the most frequently identified food item was pet food (30 birds in 18 cases), followed by garden feeders (12 birds in seven cases) in Tomakomai. Citizen sightings in this study also included six reports of magpies eating dog food and 14 reports of them visiting bird feeders. These records strongly suggest that the use of such anthropogenic food resources is a widespread behavior among magpies in Hokkaido. Opportunities for dogs and cats to be fed outdoors are likely to be more common in residential areas with yards, and in this study, the density of magpies was highest in low-rise residential areas among the urban planning categories (Figure 3).
Takeishi [45] described that magpies in Kyushu were found feeding in chicken coops and pigpens within rural settlements, which were once their main habitat there, and in adjacent farmland after the harvest of wheat and rice. However, there are no studies on the food resources of magpies in Kyushu after his work. According to Benmazouz et al. [46], who reviewed the urbanization of corvids worldwide, the most important factor in the successful urbanization of corvids, including the magpie in Kyushu, Japan, was not the abundance of nesting sites or the scarcity of predators, but rather the abundance of food resources (see also [47,48]). Recently, De la Cruz et al. [28] revealed that the diet of the Eurasian Magpie, which has been expanding its range into urban areas in the southern tip of Spain, largely consisted of insects and snails, with no records of anthropogenic food. However, their estimate was obtained through pellet analysis, which may have underestimated the proportion of food such as pet food and bread.
4.3.5. The Allee Effect
Mathematical analysis has shown that the Allee effect can delay the spread of invasive species [14,49]. Empirical studies have also shown that the House Finch (Haemorhous mexicanus), which is now established across most of eastern North America, initially spread slowly due to the Allee effect after it was first released around New York City in the 1940s [50]. In Tomakomai, magpies are often observed in pairs, presumably mated, but territorial defense behavior is not observed even during the breeding season. They often forage in flocks and form communal roosts of several dozen individuals [25]. This loose flocking lifestyle may be related to the fact that artificial food resources such as pet food are difficult to pinpoint in terms of location and time, though appearing in large quantities at times. During our field surveys, we frequently observed magpies waiting at vantage points such as utility poles and residential antennas, then flying tens to hundreds of meters in a single trip when lured by other individuals. Such behavior suggests that magpies can easily access food resources discovered by other single individuals or pairs. If the behavior of other individuals is crucial for locating food resources, isolated individuals or pairs would likely experience lower survival and reproductive success rates due to their reduced efficiency in discovering food.
In Hokkaido, suitable habitats for magpies are rarely continuous across municipalities; they are often fragmented by farmland (Figure 5 and Figure 6). While such open environments do not hinder magpie movement as much as forested areas do, they may impede magpies’ movements in flocks or gradual spread of their home ranges. As a result, only a small number of individuals reach new habitats, and the Allee effect may prevent them from becoming established. In Japan, breeding and sighting records of magpies exist in many prefectures as described above [39]. However, the lack of continuous records outside Kyushu and Hokkaido is likely also due to the Allee effect.
Regarding the Allee effect in invasive species, genetic effects resulting from a small number of founders—namely, inbreeding depression—are sometimes cited [51]. However, given the large number of founders in Tomakomai [40] and the widespread establishment of the species in Kyushu derived from a few individuals [23], this is considered inapplicable, at least for the Oriental Magpie in Japan.
4.3.6. Nesting Sites
The Oriental Magpie in northern Kyushu expanded from the 1980s through the 2010s by acquiring the habit of nesting on utility poles [45,52]. Similarly, in Europe, the Eurasian Magpie has expanded from agricultural areas into urban areas since the 1980s, with factors cited for this including an increase in trees suitable for nesting in urban areas [53] and the adoption of nesting in artificial structures [18]. Regarding the Oriental Magpie in Tomakomai, Nakahara et al. [54] examined nest site characteristics and reported that magpies have adapted to the anthropogenic urban environment and flexibly select nesting sites. Such cases can be interpreted to mean that a shortage of nesting sites does not limit their abundance and distribution range [19].
Although nesting sites are sometimes considered a resource that limits the distribution of bird species, there are few cases where this has been demonstrated at the population scale. Even among cavity nesters, which are often thought to face a shortage of nesting sites, the Golden-cheeked Woodpecker (Melanerpes chrysogenys) in Mexico, for example, switches its nesting site selection in response to human-induced environmental changes but is constrained by a decline in foraging habitat [55]. Regarding competition among secondary users of tree cavities in Canada, where the Common starling (Sturnus vulgaris) has invaded, there has been little long-term impact on the Mountain Bluebird (Sialia currucoides) or the Tree Swallow (Tachycineta bicolor) [56,57]. In this study, even in areas where magpies were scarce, there were plenty of trees and transmission towers suitable for nesting, so it is unlikely that a shortage of nesting sites is limiting the magpie abundance.
4.3.7. Predators and Competitors
In Hokkaido, magpies often have their nests taken over by two species of crows, the Large-billed Crow (Corvus macrorhynchos) and the Carrion Crow (Corvus corone), and there are many cases in which eggs, nestlings, and fledglings are presumed to have been preyed upon by these crows. Crows are also competitors for food for magpies. It was not uncommon to observe crows alongside magpies at locations where pet food or a carcass of wild animals was available. However, these crow species are widely distributed throughout Hokkaido, and although quantitative data are lacking, there is no evidence of a clear negative relationship between the abundance of crows and that of magpies within the study area.
4.3.8. Culling and Hunting
In Europe, Eurasian Magpies were widely culled as a nuisance animal in the past [18,28]. In Japan, however, though nests built on power towers and utility poles are sometimes removed by power companies, magpies are not killed through either hunting or culling. To the best of our knowledge, aside from fecal contamination in roosting areas within factories, there are currently no known instances of damage caused by magpies in Hokkaido, including adverse effects on crops or other species. Rather, magpies are viewed favorably by local residents, and many residents actively welcome them, even offering them bread.
5. Conclusions
The geographic distribution of the Oriental Magpie in Hokkaido has expanded at a relatively slow pace so far, likely due to the Allee effect. As of 2012–2016, the largest population was observed in Tomakomai, with approximately 200 birds, and several dozen birds have established populations in Shiraoi and Mukawa, both located along the same Pacific coast. While there are records of their presence and breeding in other urban areas in western Hokkaido, they have not been able to sustain a stable population. In the near future, magpie numbers in several municipalities may, through successful breeding or further immigration from already established areas, reach a size that is sufficient to diminish the Allee effect, leading to their establishment. Although suitable habitats exist in eastern Hokkaido as well, there were no sightings as of 2016, suggesting that magpies have not crossed the forest area that runs north–south through the central part of the island.
The distribution range of the magpie in Hokkaido is likely to ultimately be determined by the quantity and accessibility of anthropogenic food resources. While the practice of keeping pets outdoors and feeding stray cats is on the decline in Japan, the number of households placing bird feeders in their gardens is expected to continue increasing. Although Hokkaido is a region with heavy snowfall, snowfall may not hinder magpie occurrence, provided that enough food resources are available. Direct observation of magpie food resources in densely built residential areas is difficult, but if samples such as feathers can be obtained, the degree of dependence on anthropogenic food resources can be estimated using stable isotope ratios [26]. The amount of sample required for such analysis is only a few mg in dry weight, and isotope ratios remain stable after death, so it is possible to estimate past dietary resources during the molting period using feathers from museum specimens and so on. If organs with relatively rapid turnover, such as the liver, are available, it is also possible to estimate dietary resources immediately prior to death. Since feathers and carcasses are also important for genetic analysis, it is desirable to establish a system for collecting and preserving carcasses within Hokkaido.
Magpies are well-suited for citizen-led monitoring surveys due to their striking black and white coloration, distinctive loud calls, and their non-migratory nature, primarily inhabiting urban residential areas. While their large, conspicuous nests are also an advantage, it is important to note that they often remain in place for several years. To confirm that a nest is in use at the time of observation, observers should verify that parent birds are entering and/or exiting the nest. It is also important to note that nests built in trees, particularly in evergreen conifers, are harder to find than those built on man-made structures such as utility poles.
In the audio-playback surveys we conducted, the number of individuals confirmed per hour was approximately three times higher than that obtained by conventional searching (Table 1). Audio playback has also been effectively used in Japan for the studies of the Chinese Hwamei (Garrulax canorus), which is widely established in central Honshu and Kyushu [58], and the Red-billed Blue Magpie (Urocisissa erythrorhyncha), which has recently invaded southwestern Shikoku [59].
Since magpies in Hokkaido inhabit urban residential areas almost exclusively, their suitable habitats form island-like fragmentations (“urban island” [9]). Consequently, it should be relatively easy to compare not only magpie population size, which is directly related to the Allee effect, but also the abundance of nesting sites, predators, and competitors (such as corvids) among these urban islands. Regarding food resources, comparisons could be made regarding the installation of bird feeders, the feeding of dogs and cats outdoors, livestock pens, garbage bin management, and the distribution of well-managed grasslands, which is most preferred as a foraging habitat [25]. If possible, such as by obtaining the understanding of local residents, long-term food supplementation may allow for direct verification of whether food resources are limiting magpie abundance. We would like to emphasize that by appropriately combining such intensive field investigations by experts with citizen data, research on magpies in Hokkaido holds great potential for uncovering more general patterns regarding bird distribution and the establishment of invasive species.
Supplementary Materials
The following supporting information can be downloaded at: https://www.mdpi.com/article/10.3390/birds7030041/s1. Locations of magpies and grid data used for the analysis in this study are available in the form of csv files, compressed into “source_data.zip.” Survey tracks, magpie locations and habitat suitability by municipality in the Broad Survey Area are provided as PNG image files, compressed into “tracks&magpies.zip,” primarily for readers who may find GIS software difficult to use.
Author Contributions
Conceptualization, M.F. and H.M.; methodology, M.F. and H.M.; formal analysis, M.F. and H.M.; investigation, M.F. and H.M.; resources, M.F.; writing—original draft preparation, M.F.; writing—review and editing, H.M.; supervision and project administration, M.F. All authors have read and agreed to the published version of the manuscript.
Funding
This work was in part supported by the Japan Society for the Promotion of Science (JSPS) KAKENHI Grant Number JP26440232.
Institutional Review Board Statement
Not applicable.
Informed Consent Statement
Not applicable.
Data Availability Statement
The source data sets used for this study are included in the article/Supplementary Materials. Further inquiries can be directed to the corresponding author.
Acknowledgments
Osamu Hasegawa managed the website for collecting citizen reports and provided data for this study. Narumi Oyake, Sayaka Mori, Yuko Hayashi, Miho Suzuki, Asuka Takahashi, and Kana Furuki assisted with the field surveys. Toru Morita stored and managed our survey gear brought from our remote institute. We would like to thank all of the above persons. We are also grateful to the citizens who reported their sightings. We would also like to express our special thanks to the team of the American Ornithological Society’s Peer Editing Program for their English proofreading and three reviewers for their critical and constructive comments.
Conflicts of Interest
The authors declare no conflicts of interest.
References
- Eguchi, K.; Amano, H. Invasive birds in Japan. Glob. Environ. Res. 2004, 8, 29–39. [Google Scholar] [CrossRef] [PubMed]
- Peterson, A.T.; Vieglais, D.A. Predicting species invasions using ecological niche modeling: New approaches from bioinformatics attack a pressing problem. BioScience 2001, 51, 363–371. [Google Scholar] [CrossRef] [Scilit]
- Guisan, A.; Petitpierre, B.; Broennimann, O.; Daehler, C.; Kueffer, C. Unifying niche shift studies: Insights from biological invasions. Trends Ecol. Evol. 2014, 29, 260–269. [Google Scholar] [CrossRef] [Scilit] [PubMed]
- Magory Cohen, T.; McKinney, M.; Kark, S.; Dor, R. Global invasion in progress: Modeling the past, current and potential global distribution of the common myna. Biol. Invasions 2019, 21, 1295–1309. [Google Scholar] [CrossRef] [Scilit]
- Ramellini, S.; Andrea, S.; Francesco, F.G.; Falaschi, M. Modelling the potential spread of the Red-billed Leiothrix Leiothrix lutea in Italy. Bird Study 2019, 66, 550–560. [Google Scholar] [CrossRef] [Scilit]
- Hui, C. The dos and don’ts for predicting invasion dynamics with species distribution models. Biol. Invasions 2023, 25, 947–953. [Google Scholar] [CrossRef] [Scilit]
- Liu, C.; Wolter, C.; Xian, W.; Jeschke, J.M. Species distribution models have limited spatial transferability for invasive species. Ecol. Lett. 2020, 23, 1682–1692. [Google Scholar] [CrossRef] [Scilit] [PubMed]
- Crooks, J.; Soulé, M. Lag times in population explosions of invasive species: Causes and implications. In Invasive Species and Biodiversity Management; Sandlund, T., Schei, P., Viken, A., Eds.; Kluwer Academic Publishers: Dordrecht, The Netherlands, 1999; pp. 103–125. [Google Scholar]
- Clergeau, P.; Croci, S.; Jokimäki, J. How useful are urban island ecosystems for defining invader patterns? Environ. Conserv. 2004, 31, 181–184. [Google Scholar] [CrossRef] [Scilit]
- Richardson, D.M.; Pyšek, P.; Elton, C.S. 1958: The ecology of invasions by animals and plants. London: Methuen. Prog. Phys. Geog. 2007, 31, 659–666. [Google Scholar] [CrossRef] [Scilit]
- Svenning, J.-C.; Gravel, D.; Holt, R.D.; Schurr, F.M.; Thuiller, W.; Münkemüller, T.; Schiffers, K.H.; Dullinger, S.; Edwards, T.C., Jr.; Hickler, T.; et al. The influence of interspecific interactions on species range expansion rates. Ecography 2014, 37, 1198–1209. [Google Scholar] [CrossRef] [Scilit] [PubMed]
- Stuart, K.C.; Hofmeister, N.R.; Zichello, J.M.; Rollins, L.A. Global invasion history and native decline of the common starling: Insights through genetics. Biol. Invasion 2023, 25, 1291–1316. [Google Scholar] [CrossRef] [Scilit]
- Courchamp, F.; Clutton-Brock, T.; Grenfell, B. Inverse density dependence and the Allee effect. Trends Ecol. Evol. 1999, 14, 405–410. [Google Scholar] [CrossRef] [Scilit] [PubMed]
- Shigesada, N.; Kawasaki, K. Invasion and the range expansion of species: Effects of long-distance dispersal. In Dispersal Ecology; The 42 Symposium of the British Ecological Society; Bullock, J., Kenward, R., Hails, R., Eds.; Blackwell Science: London, UK, 2002; pp. 350–373. [Google Scholar]
- Taylor, C.M.; Hastings, A. Allee effects in biological invasions. Ecol. Lett. 2005, 8, 895–908. [Google Scholar] [CrossRef] [Scilit]
- Berec, L.; Angulo, E.; Courchamp, F. Multiple Allee effects and population management. Trends Ecol. Evol. 2007, 22, 185–191. [Google Scholar] [CrossRef] [Scilit] [PubMed]
- Gill, F.; Donsker, D.; Rasmussen, P. IOC World Bird List (v15.2), 2026. Available online: https://www.worldbirdnames.org/ (accessed on 23 April 2026).
- Birkhead, T.R. The Magpies; T &AD Poyser: London, UK, 1991. [Google Scholar]
- Jerzak, L. Synurbanization of the magpie in the Palearctic. In Avian Ecology and Conservation in an Urbanizing World; Marzluff, J., Bowman, R., Donnelly, R., Eds.; Springer: Boston, MA, USA, 2001; pp. 403–425. [Google Scholar]
- François, C.; Alexandre, L.; Julliard, R. Effects of landscape urbanization on magpie occupancy dynamics in France. Landsc. Ecol. 2008, 23, 527–538. [Google Scholar] [CrossRef] [Scilit]
- Wang, Z.; Wang, Y.; Jerzak, L.; Zhang, Z. Nest site selection of the magpie Pica pica sericea in Beijin of China. Stud. Biol. 2010, 4, 71–82. [Google Scholar] [CrossRef] [Scilit]
- Kim, S.; Srygley, R.; Lee, J.; Lee, S.; Choe, J. Urban and natural components of Korean Magpie (Pica pica sericea) territories and their effects on prey density. Pol. J. Ecol. 2012, 60, 407–417. [Google Scholar]
- Eguchi, K.; Kubo, H. The origin of the Magpie Pica pica sericea in Japan: An investigation of historical records. J. Yamashina Inst. Ornithol. 1992, 24, 32–39, (In Japanese with English Summary). [Google Scholar] [CrossRef] [Scilit]
- Horimoto, T. Records of Magpie Pica pica in Iburi District, south-western Hokkaido. J. Yamashina Inst. Ornithol. 2004, 36, 87–90, (In Japanese with English Summary). [Google Scholar] [CrossRef] [Scilit]
- Fujioka, M.; Murayama, H. The distribution, population size, and habitat preferences of a newly established population of the Oriental Magpie Pica serica in Tomakomai City, Hokkaido, Northern Japan. Birds 2024, 5, 656–670. [Google Scholar] [CrossRef] [Scilit]
- Oyake, N.; Fujioka, M.; Nakashita, R.; Mori, S. Stable isotope analysis reveals intensive exploitation of pet food by the newly established Oriental Magpie Pica serica population in Hokkaido, Japan. Ornithol. Sci. 2024, 23, 77–89. [Google Scholar] [CrossRef] [Scilit]
- Downs, C.T.; Hart, L. Invasive Birds: Global Trends and Impacts; CAB International: Boston, MA, USA, 2020. [Google Scholar]
- De la Cruz, A.; Morales, A.; Korneeva, Y.; Castro, M. Analysing citizen science data to address the demographic expansion of the Eurasian Magpie (Pica pica) in southern Spain. J. Ornithol. 2024, 165, 805–813. [Google Scholar] [CrossRef] [Scilit]
- Callaghan, C.T.; Martin, J.M.; Kingsford, R.T.; Brooks, D.M. Unnatural history: Is a paradigm shift of natural history in 21st century ornithology needed? Ibis 2018, 160, 475–480. [Google Scholar] [CrossRef] [Scilit]
- XC61975 Oriental Magpie Pica serica. Available online: https://xeno-canto.org/ (accessed on 23 April 2026).
- Baeyens, G. Description of the social behaviour of the Magpie Pica pica. Ardea 1979, 67, 28–41. [Google Scholar]
- Magpies in Hokkaido. Available online: http://magpie.kapiu.org/ (accessed on 23 April 2026). (In Japanese)
- Digital National Land Information. Available online: https://nlftp.mlit.go.jp/ksj/index.html (accessed on 23 April 2026). (In Japanese)
- Mesh Agricultural Meteorological Data. Available online: https://amu.rd.naro.go.jp/wiki_open/doku.php?id=start (accessed on 23 April 2026). (In Japanese)
- Kominami, Y.; Yamaguchi, T. Snow cover data of the Agro-Meteorological Grid Square Data, NARO. J. Agric. Meteorol. 2026, 82, 2–6. [Google Scholar] [CrossRef] [Scilit]
- Japan Meteorological Agency. Available online: https://www.jma.go.jp/jma/index.html (accessed on 23 April 2026). (In Japanese)
- R Core Team. R: A Language and Environment for Statistical Computing; R. Foundation for Statistical Computing: Vienna, Austria, 2025; Available online: https://www.r-project.org/ (accessed on 23 April 2026).
- Kurosawa, R.; Horimoto, T. Changes of distribution of the Eurasian Magpie Pica pica in the Iburi Region of southern Hokkaido. J. Yamashina Inst. Ornithol. 2015, 46, 83–88, (In Japanese with English Summary). [Google Scholar] [CrossRef] [Scilit]
- Ornithological Society of Japan. Check-List of Japanese Birds, 8th ed.; The Ornithological Society of Japan: Sanda, Japan, 2024. [Google Scholar]
- Kryukov, A.P.; Spiridonova, L.N.; Mori, S.; Arkhipov, V.Y.; Red’kin, Y.A.; Goroshko, O.A.; Lobkov, E.G.; Haring, E. Deep phylogeographic breaks in Magpie Pica pica across the Holarctic: Concordance with bioacoustics and phenotypes. Zool. Sci. 2017, 34, 185–200. [Google Scholar] [CrossRef] [Scilit]
- Survey on Port and Harbour. Available online: https://www.e-stat.go.jp/statistics/00600280 (accessed on 23 April 2026).
- Jeschke, J.; Strayer, D. Invasion success of vertebrates in Europe and North America. Proc. Natl. Acad. Sci. USA 2005, 102, 7198–7202. [Google Scholar] [CrossRef] [Scilit] [PubMed]
- Jeong, Y.-H.; Kim, S.E.; Kunwar, B.; Oh, H.-S. Long term trends in introduced Eurasian Magpie (Pica pica) abundance: Agricultural land expansion effects on Jeju Island. Agric. Environ. Sci. 2025, 44, 377–385. [Google Scholar] [CrossRef] [Scilit]
- Street trees in City of Sapporo. Available online: https://www.city.sapporo.jp/ryokuka/midori/machi/hanamidori/gairojyu/ (accessed on 23 April 2026). (In Japanese)
- Takeishi, M. A study on the ecological factors in the population dynamics and distribution of the Black-billed Magpie Pica pica sericea in Japan. Bull. Kitakyushu Mus. Nat. Hist. 1995, 14, 55–97. [Google Scholar] [CrossRef]
- Benmazouz, I.; Jokimäki, J.; Lengyel, S.; Juhász, L.; Kaisanlahti-Jokimäki, M.-L.; Kardos, G.; Paládi, P.; Kövér, L. Corvids in urban environments: A systematic global literature review. Animals 2021, 11, 3226. [Google Scholar] [CrossRef] [Scilit] [PubMed]
- Marzluff, J. Worldwide urbanization and its effects on birds. In Avian Ecology and Conservation in an Urbanizing World; Marzluff, J., Bowman, R., Donnelly, R., Eds.; Springer: New York, NY, USA, 2001; pp. 19–47. [Google Scholar]
- Clergeau, P.; Vergnes, A. Bird feeders may sustain feral Rose-ringed parakeets Psittacula krameri in temperate Europe. Wildl. Biol. 2011, 17, 248–252. [Google Scholar] [CrossRef] [Scilit] [PubMed]
- Leung, B.; Drake, J.; Lodge, D. Predicting invasions: Propagule pressure and the gravity of Allee effects. Ecology 2004, 85, 1651–1660. [Google Scholar] [CrossRef] [Scilit]
- Veit, R.; Lewis, M. Dispersal, population growth, and the Allee effect: Dynamics of the House Finch invasion of eastern North America. Am. Nat. 1996, 148, 255–274. [Google Scholar] [CrossRef] [Scilit]
- Luque, G.M.; Vayssade, C.; Facon, B.; Guillemaud, T.; Courchamp, F.; Fauvergue, X. The genetic Allee effect: A unified framework for the genetics and demography of small populations. Ecosphere 2016, 7, e01413. [Google Scholar] [CrossRef] [Scilit]
- Eguchi, K. Recent increase of nesting on utility poles by the Black-billed Magpie Pica pica sericea. Jpn. J. Ornithol. 1996, 45, 101–107. [Google Scholar] [CrossRef] [Scilit]
- Tatner, P. Factors influencing the distribution of Magpies Pica pica in an urban environment. Bird Study 1982, 29, 227–234. [Google Scholar] [CrossRef] [Scilit]
- Nakahara, T.; Kuroe, M.; Hasegawa, O.; Hayashi, Y.; Mori, S.; Eguchi, K. Nest site characteristics of the newly established Eurasian Magpie Pica pica population in Hokkaido, Japan. Ornithol. Sci. 2015, 14, 99–109. [Google Scholar] [CrossRef] [Scilit]
- Maya-Elizarrarás, E.; Renton, K.; De la Mora-Hernández, J.A.; Maya-Elizarrarás, L.M. A tropical paradise for all? Nest-site selection shifts by an endemic Neotropical woodpecker associated with human settlements. Ornitho. Appl. 2025, 127, duaf007. [Google Scholar] [CrossRef] [Scilit]
- Koch, A.J.; Martin, K.; Aitken, K.E.H. The relationship between introduced European Starlings and the reproductive activities of Mountain Bluebirds and Tree Swallows in British Columbia, Canada. Ibis 2012, 154, 590–600. [Google Scholar] [CrossRef] [Scilit]
- Drake, A.; Martin, K. Rainfall and nest site competition delay Mountain Bluebird and Tree Swallow breeding but do not impact productivity. Auk 2020, 137, ukaa006. [Google Scholar] [CrossRef] [Scilit]
- Kawakami, K.; Yamaguchi, Y. The spread of the introduced Melodious Laughing Thrush Garrulax canorus in Japan. Ornithol. Sci. 2004, 3, 13–21. [Google Scholar] [CrossRef] [Scilit]
- Matsuda, H.; Kawamura, K.; Higa, M.; Sato, S.; Tanioka, H.; Yamaura, Y. Non-native Red-billed Blue Magpie Urocissa erythrorhyncha expanded into lowland areas with moderate forest cover, with no significant impact on native common bird occupancy, in Shikoku, southern Japan. Ornithol. Sci. 2025, 24, 85–98. [Google Scholar] [CrossRef] [Scilit]

Disclaimer/Publisher’s Note: The statements, opinions and data contained in all publications are solely those of the individual author(s) and contributor(s) and not of MDPI and/or the editor(s). MDPI and/or the editor(s) disclaim responsibility for any injury to people or property resulting from any ideas, methods, instructions or products referred to in the content. |
© 2026 by the authors. Licensee MDPI, Basel, Switzerland. This article is an open access article distributed under the terms and conditions of the Creative Commons Attribution (CC BY) license.