


Simple Summary
Bulk RNA-sequencing is commonly performed using established cell lines which may not reflect the heterogeneity observed in patient samples. This limitation may affect the downstream identification of clinically relevant biomarkers and therapeutic targets. Additionally, accumulating evidence suggests that combination therapy is more effective against cancer cells than monotherapy. In our current study, we performed bulk RNA-sequencing on triple-negative breast cancer (TNBC) patient-derived organoids treated with radiotherapy and a Polo-like kinase 4 (PLK4) inhibitor. We found that combination treatment altered cell death and migration pathways, including the upregulation of melanoma cell adhesion molecule (MCAM). This study provides an avenue for further validation of our findings in clinically relevant models.
Abstract
Identification of novel biomarkers in triple-negative breast cancer (TNBC), one of the most aggressive breast cancer subtypes, is of critical clinical importance. Although radiation treatment (RT) is a cornerstone of TNBC treatment, resistance to RT compromises its therapeutic efficacy. Combining RT with radiosensitizing drugs may help overcome treatment resistance. The Polo-like kinase 4 (PLK4) inhibitor, CFI-400945, has been shown to exert anticancer effect when combined with RT, likely through perturbations in centriole and cell cycle regulation, and DNA-damage response pathways. We aimed to gain insight into the molecular mechanisms underlying the anticancer effects of these treatment modalities in TNBC. We performed exploratory bulk RNA-sequencing on a TNBC patient-derived organoid model treated with CFI-400945, RT or a combination of the two treatments. We found that RT alone and its combination with CFI-400945 led to gene expression changes and the enrichment of various pathways, such as cell division and DNA replication. Compared to RT alone, combination treatment resulted in a substantially greater number of differentially expressed genes and perturbed pathways. Validation of selected differentially expressed genes using RT-qPCR in TNBC patient-derived organoids and immortalized cell lines identified that melanoma cell adhesion molecule (MCAM) gene expression is upregulated upon combination treatment compared to control. Our findings provide insights regarding bulk gene expression changes following treatment of TNBC patient-derived organoids with radiation and its combination with PLK4 inhibitor CFI-400945. They also set a foundation for future studies into the identification of novel treatment-response biomarkers and therapeutic targets in TNBC.
1. Introduction
Triple-negative breast cancer (TNBC) is an aggressive and often treatment-resistant subtype of breast cancer, which remains one of the leading causes of cancer-related deaths in women [1,2]. In contrast to other subtypes, TNBC lacks canonical biomarkers, such as estrogen receptor, progesterone receptor and HER2 (human epidermal growth factor receptor 2), leading to limited therapeutic options. To improve patient outcomes in this highly heterogeneous disease, identifying novel clinically meaningful biomarkers and developing novel multimodality treatment approaches are of critical clinical importance [3]. Radiation treatment (RT) remains one of the cornerstones of TNBC treatment, and resistance to RT can be tackled by co-administration of radiosensitizing drugs [4]. This multimodality approach is a promising strategy in oncology in general and TNBC in particular.
One such novel drug, Polo-like kinase 4 (PLK4) inhibitor CFI-400945 (also known as ocifisertib), is an orally administered small molecule inhibitor that has entered the clinical trial investigation stage in cancer patients [5,6] and has been shown to have significant anticancer synergy with RT [7,8]. PLK4 is known to regulate centriole duplication [9,10], and its inhibition by CFI-400945 leads to the deregulation of centriole duplication and genomic instability [11]. The anticancer mechanisms of RT are complex and multifaceted. In addition to RT’s anticancer effects through the induction of DNA damage with ensuing genomic instability, perturbations in other molecular mechanisms, such as deregulation of cell cycle control or reactive oxygen species response pathways, are also implicated [4]. The synergistic anticancer effect of CFI-400945 and RT in TNBC is, at least in part, associated with centriole overamplification, dysregulation of cell cycle control and disruption of the DNA-damage response [7,8,12]. However, the mechanisms of synergy of RT with targeted and chemotherapeutic drugs require further granular understanding to identify novel biomarkers and drug targets.
Breast cancer patient-derived organoids (PDOs) and patient-derived xenograft organoids (PDXOs, hereinafter PDOs) are developed to better capture the high degree of heterogeneity and to provide more translationally relevant preclinical research systems [13,14]. Unlike the established cell line models, PDOs preserve mutational profiles identified in the primary tumor [13]. To the best of our knowledge, a large-scale gene expression analysis of PDOs upon RT and/or CFI-400945 treatment is lacking. To nuance the mechanisms of the combination of RT and CFI-400945 treatment in clinically relevant model of TNBC, we performed exploratory bulk RNA-sequencing on a single TNBC PDO model to identify gene expression changes and cellular pathway perturbations following single agents (RT or CFI-400945) or combination treatment. Our exploratory study provides new information regarding gene expression changes following RT and CFI-400945 treatment that can serve as a foundation for future validation studies using additional TNBC PDO models for the subsequent development of novel biomarkers and drug targets in TNBC.
2. Materials and Methods
2.1. Cell Culture, Reagents and Treatments
All work with PDOs was carried out under protocols approved by Western University’s Health Sciences Research Ethics Board (HSREB; protocols #118019 and 118685). The organoid model was established from a patient-derived xenograft (PDX) tumor that originated from a TNBC liver metastasis of a pretreated breast cancer patient and was characterized by the Cescon lab in collaboration with the Princess Margaret Living Biobank (University Health Network, UHN REB#14-8358, Toronto, ON, Canada), from whom the model was obtained. Organoids were propagated as per previously described protocols [13] using growth factor reduced basement membrane-like extract, type 2 (BME-2) (Bio-Techne, Minneapolis, MN, USA), Cat. No. 3533-010-02). Approximately 20,000 cells per 50 µL of BME were prepared and plated in 24-well plates. Once organoids formed, they were exposed to 2.5 Gy of RT or no RT (control) using the Cobalt-60 unit at the Verspeeten Family Cancer Centre (London, ON, Canada). Following RT, culture media was replenished with fresh media containing 5 nM of CFI-400945 (Selleck Chemicals, Pittsburgh, PA, USA, Cat. No. S7552) or vehicle control (dimethyl sulfoxide, DMSO). The RT doses and drug concentrations were selected based on previously identified and published concentrations of the drug and doses of RT at which the maximum synergy of the combination treatment was observed [8].
TNBC cell lines, MDA-MB-231 (ExPASy Cellosaurus Research Resource Identifier (RRID): CVCL_0062) and MDA-MB-468 (RRID: CVCL_0419) were used to validate gene targets using reverse transcription quantitative polymerase chain reaction (RT-qPCR). MDA-MB-231 and MDA-MB-468 cell lines were obtained from Dr. Ann Chambers (London Regional Cancer Program; London, ON, Canada). All cell lines were authenticated using third party testing (IDEXX BioAnalytic, Columbia, MO, USA) using short tandem repeat profiling with 9 markers. MDA-MB-231 cells were cultured using Dulbecco’s modified Eagle medium (DMEM)/F12 and MDA-MB-468 cells were cultured using Minimum Essential Medium α, both supplemented with 10% fetal bovine serum (FBS). Following ~24 h after seeding at a density of 1000 cells/cm2, TNBC cells were exposed to 2 Gy RT using the Cobalt-60 unit at the Verspeeten Family Cancer Centre (London, ON, Canada). After RT, cells were treated with previously defined IC50 concentrations (4 nM for MDA-MB-231 or 10 nM for MDA-MB-468) of CFI-400945 [8]. Calibration of the Cobalt-60 unit was originally completed in June 2001 (activity: 4000 Curies, dose rate at 7 cm: 728.2 cGy/min, shutter correction: 0.01 min) and most recently verified in June 2024. Based on the source decay, the dose rate was calculated on the day of administring radiation to cells. The target distance is 31.2 cm, the field size at this distance is 17.5 cm, and dose heterogeneity is ±5%.
2.2. Bulk RNA-Seq and Analysis
After 72 h of initiating treatment, total RNA was isolated using TRIzol (Thermo Fisher Scientific, Waltham, MA, USA) as per the manufacturer’s instructions. RNA quantity and quality were measured using NanoDrop One (ThermoFisher Scientific, Madison, WI, USA). All experiments were performed with three biological replicates (n = 3) in two batches. The treatment distribution across batches is reported in Table S1. Quality assessment (Figure S1A), rRNA reduction and creation of indexed libraries were performed using an Agilent 2100 Bioanalyzer at the London Regional Genomics Centre (LRGC). RNA-sequencing was performed using an Illumina NextSeq High 75 cycle Sequencing Kit (Illumina, Inc., San Diego, CA, USA). RNA-seq analysis was performed using R software (v.4.5.2) [15]. The data was first pre-processed by removing any genes detected in only one of the two batches. Sample library sizes were plotted, and no outlier library samples were identified (Figure S1B). Data normalization was performed using Trimmed Mean of M-values (TMM). To account for the two different batches, batch normalization was performed after normalization using Combat-seq from the sva package (v.3.58.0) [16], a batch effect adjustment tool for bulk RNA-seq count data, using a negative binomial regression to model batch effects (Figure S1C). We summed the counts of the technical replicates. Multi-dimensional scaling (MDS) was plotted for raw samples, after TMM normalization, and after batch correction and technical replicate summing (Figure S1C, D, & E, respectively). This shows a satisfactory grouping by treatment arms. Genes were filtered using edgeR’s filterByExpr() function with default parameters, retaining 21,606 of 30,683 genes for downstream analysis.
Differentially expressed genes (DEGs) were identified using the edgeR package (v.4.8.2) [17,18,19]. For each pairwise treatment comparison, gene-wise dispersion parameters were first estimated, a negative binomial generalized linear model was then fitted to the read counts for each gene, and likelihood ratio tests were performed to identify DEGs. To account for multiple testing, p-values were adjusted using the Benjamini–Hochberg (BH) method, and genes with an adjusted p-value corresponding to a False Discovery Rate (FDR) of <0.05 were considered significant. Volcano plots were generated using ggplot2 (v.3.5.1) [20,21] and ggrepel (v.0.9.5) [21] packages.
Gene set enrichment analysis (GSEA) [22] was also performed on the full ranked gene list from each comparison, without applying a differential expression threshold, using ReactomePA (v.1.54.0) [23], which implements the fgsea algorithm [24]. Genes were ranked by the sign of logFC multiplied by -log10 of the p-value, and enrichment was tested against Reactome pathway gene sets. Normalized enrichment scores (NES) and FDR < 0.05 (based on BH-adjusted p-values) were used to identify significantly enriched pathways, with the sign of the NES indicating the direction of enrichment (positive = enriched among upregulated genes, negative = enriched among downregulated genes).
2.3. Reverse Transcription Quantitative PCR (RT-qPCR)
Cells were exposed to predetermined doses (ID50 for each cell line) of RT or no-RT (control) using the Cobalt-60 unit at the Verspeeten Family Cancer Centre (London, ON, Canada). Following RT, culture media was replenished with fresh media containing predetermined IC50 concentrations [8] of CFI-400945 or DMSO. Moreover, 72 h following treatment, total RNA was isolated. In total, 1 µg RNA was used for cDNA synthesis using Superscript IV VILO Master Mix following manufacturer’s instructions (Invitrogen, Waltham, MA, USA, Cat. No. 11756050). cDNA was stored at −20 °C between uses. Gene expression changes under different treatment conditions were assessed by RT-qPCR using GB-Amp InFluor Green qPCR Master Mix (Gene Biosystems Inc., Burlington, ON, Canada, Cat. No. P2092, 0.1 U/µL Taq polymerase, 4 mM dNTPs) (step 1—initial denaturation: 95 °C for 5 s, annealing: 60 °C for 12 s, repeat 40 cycles) on the QuantStudio 3 Real-Time PCR System (Applied Biosystems, Waltham, MA, USA). Technical triplicates for each biological replicate (n = 3) were averaged, and the fold difference in treatment group versus control was calculated using the 2−ΔΔCt method as previously described [25] and as per MIQE-compliant reporting. GAPDH gene expression was used for normalization in all RT-qPCR experiments. All primers were designed using NCBI Primer-BLAST (https://www.ncbi.nlm.nih.gov/tools/primer-blast/index.cgi, accessed on 1 March 2025) (Table S2). Primer specificity was validated using qPCR melt curve analysis. PCR products were run on a 2% agarose gel for further validation.
2.4. The Cancer Genome Atlas (TCGA) and Clinical Proteomic Tumor Analysis Consortium (CPTAC) Data Analysis
Clinical data from TCGA and CPTAC was analyzed using the University of ALabama at Birmingham CANcer (UALCAN) (https://ualcan.path.uab.edu/index.html; accessed on 15 April 2026) data analysis portal. Transcript and protein levels of DEGs in breast cancer patients were analyzed using the TCGA and CPTAC breast invasive carcinoma (BRCA) data set. Transcript per million (TPM) values from RNA-seq from TCGA were used to calculate expression data. Calculated z-values were used from the CPTAC data set.
3. Results
3.1. Effects of Treatments on Gene Expression
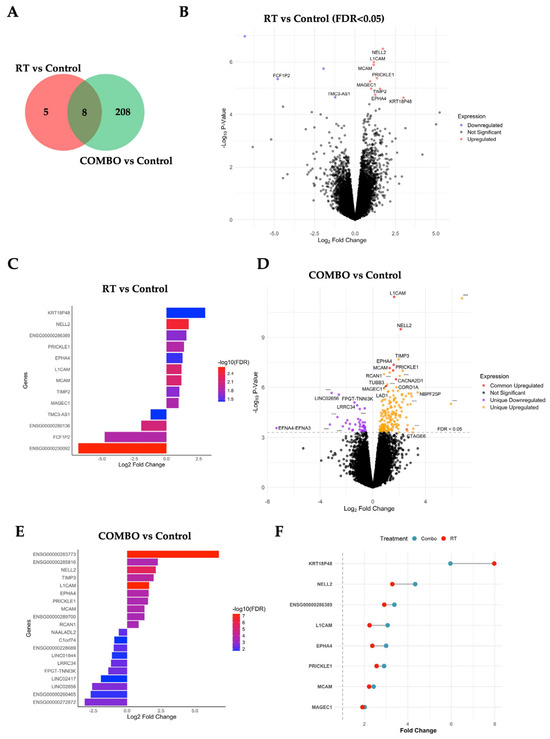
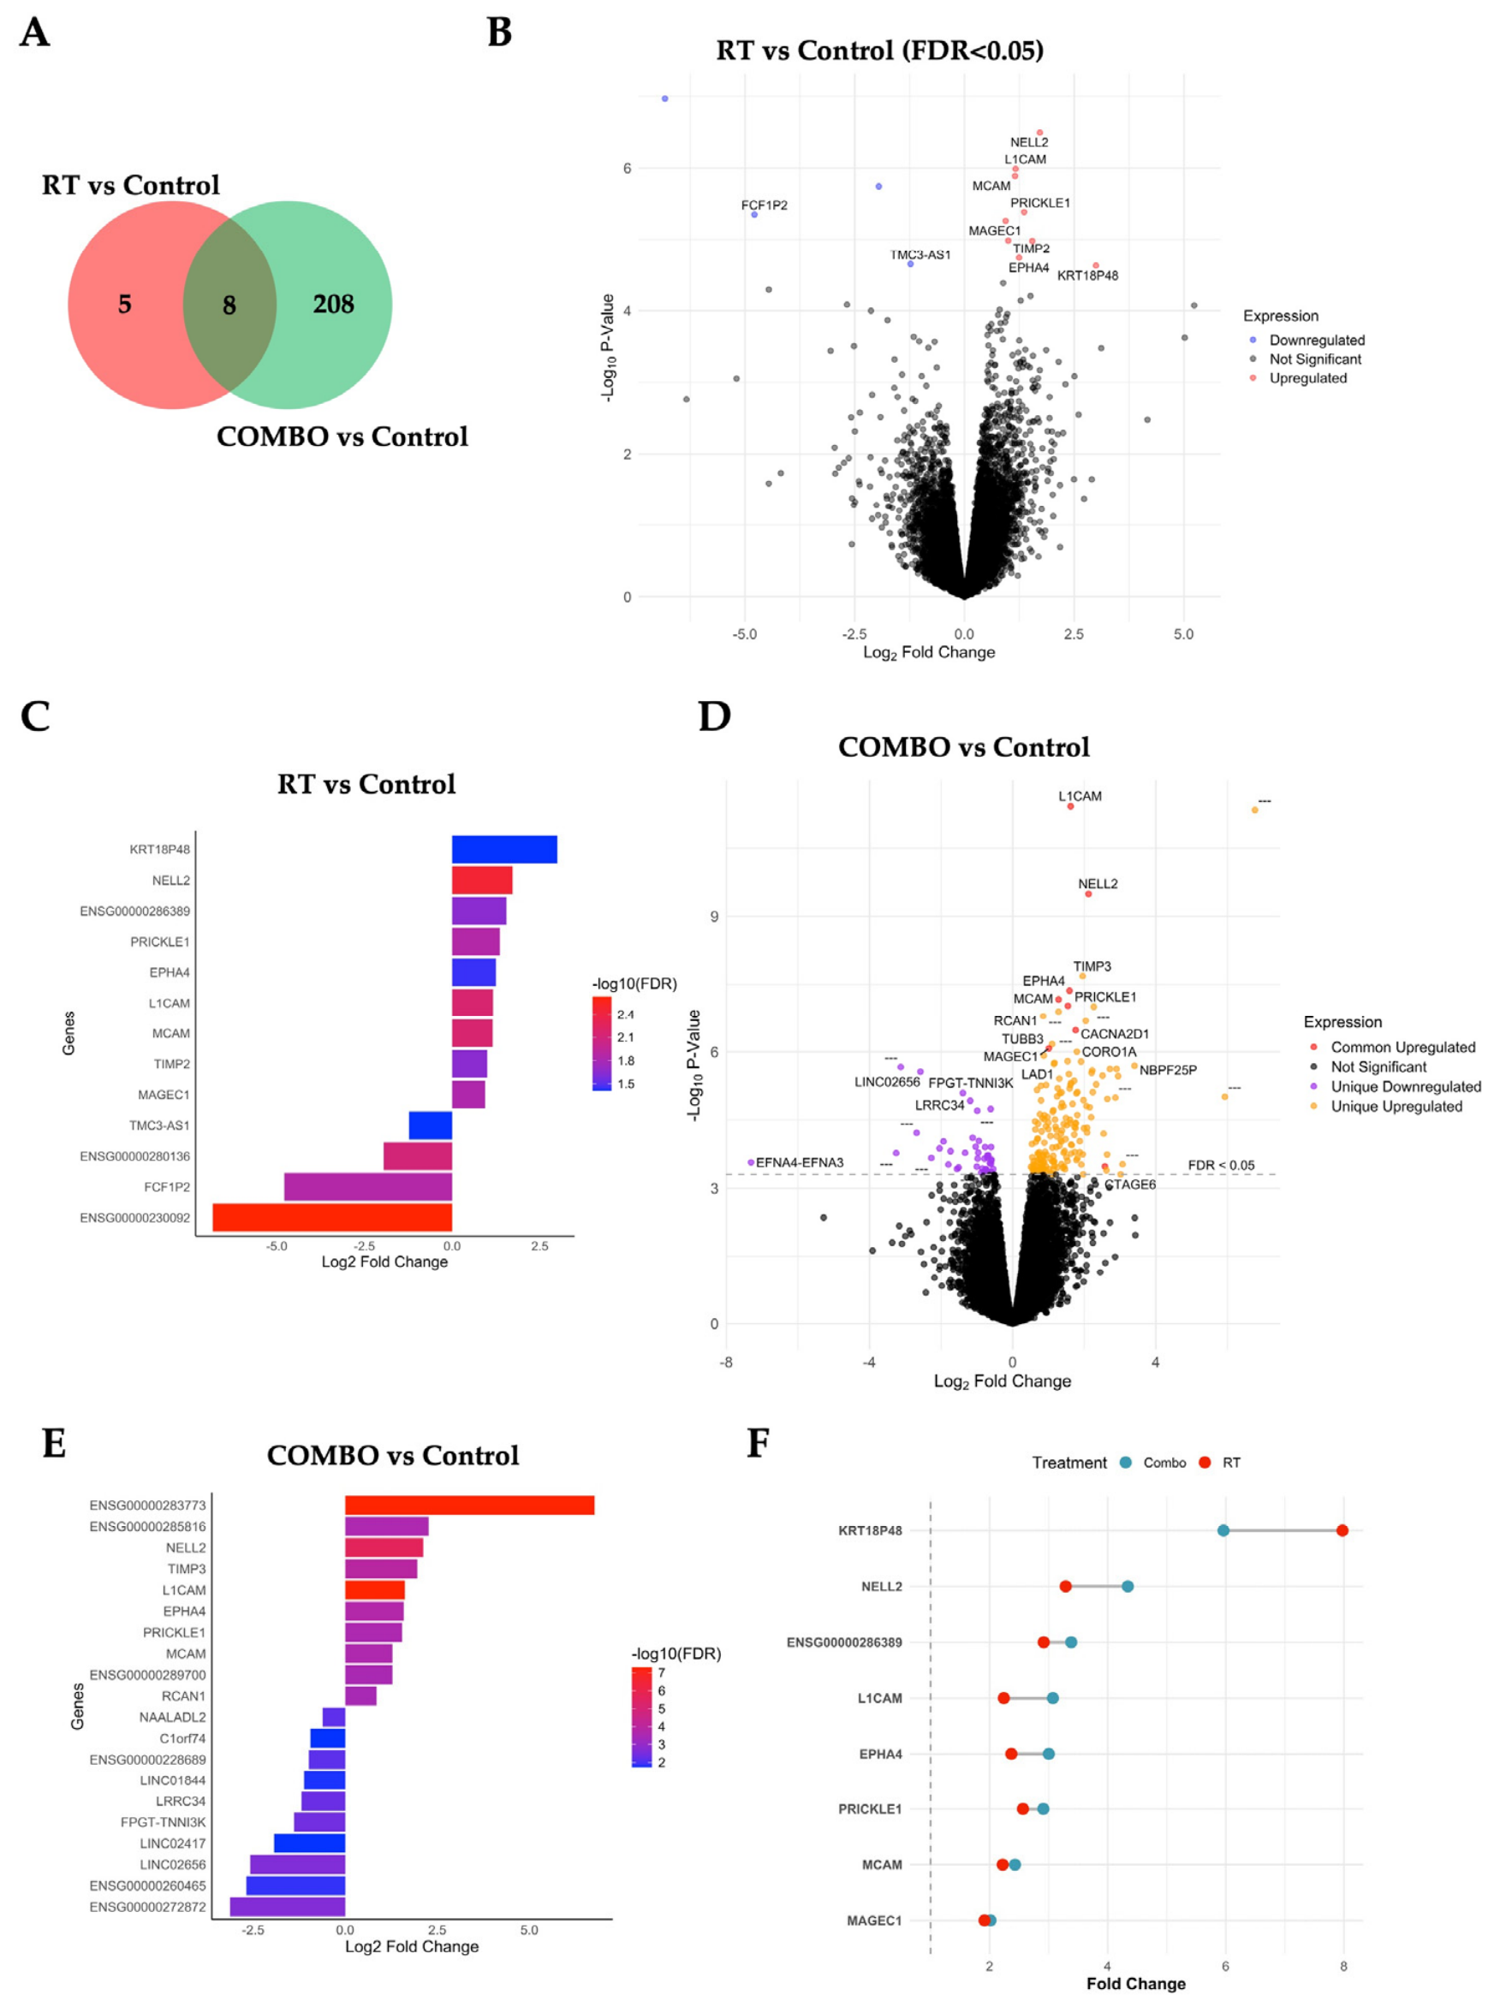
First, we assessed DEGs between single agent and control treatments. Based on the FDR cutoff of <0.05, 1 gene, ENSG00000291219, a novel transcript, was downregulated between CFI-400945 and vehicle control treated cells. RT alone, compared to control, resulted in a significant upregulation of 9 and a downregulation of 4 genes (Figure 1A–C). Expression of genes encoding KRT18P48 (keratin 18 pseudogene 48), NELL2 (a neural epidermal growth factor-like 2 protein), long noncoding RNA (lncRNA) ENSG00000286389, PRICKLE1 (Prickle-like protein 1), EPHA4 (ephrin type-A receptor 4), L1CAM (L1 cell adhesion molecule), MCAM (melanoma cell adhesion molecule), TIMP2 (tissue inhibitor of metalloproteinase 2), and MAGEC1 (melanoma-associated antigen C1) proteins were found to be upregulated. Among significantly downregulated DEGs, TMC3-AS1 (transmembrane channel-like 3 antisense RNA 1), FBXO25P (F-Box only protein 25 pseudogene, ENSG00000230092), FCF1P2 (FCF1 small subunit processome component homolog pseudogene 2) and a lncRNA (ENSG00000280136) were identified (Figure 1B,C).
Figure 1.
Effect of treatments on gene expression in TNBC patient-derived organoids. (A) Venn diagram showing the number of DEGs that are common and unique to radiation treatment (RT) + combination (COMBO) treatment. Volcano plot showing upregulated and downregulated genes in response to (B) RT and (D) COMBO treatment compared to control. Y-axis depicts negative Log p-values, with higher values indicating greater statistical significance. In (B), significantly (FDR < 0.05) upregulated and downregulated DEGs following RT vs. control treatment are shown in red and blue dots, respectively. In (D), red dots represent significantly upregulated DEGs following COMBO treatment, which are also found upregulated in RT versus control treatment (DEGs common for RT and COMBO treatment). Orange dots represent significantly upregulated DEGs unique to COMBO treatment versus control. Purple dots represent significantly downregulated DEGs. Black dots represent genes with no significant changes in expression comparing two groups. Top 10 upregulated and downregulated DEGs comparing (C) RT or (E) COMBO treatment versus control. (F) Lollipop plot shows the DEGs common to RT and COMBO treatment and their corresponding fold-change differences between COMBO treatment and RT. FDR—false discovery rate.
Combination (COMBO) treatment with RT and CFI-400945, compared to control, resulted in upregulation of 175 and downregulation of 41 genes (Figure 1A,D,E). In RT-only treatment, NELL2, L1CAM, EPHA4, PRICKLE1, and MCAM were among the top ten significantly upregulated genes following COMBO treatment compared to control (Figure 1D,E). Compared to RT-only treatment, COMBO treatment increased fold-change expression of several genes such as, NELL2, L1CAM, EPHA4, PRICKLE1, MCAM and MAGEC1 by 32%, 37%, 27%, 13%, 9% and 5% respectively (Figure 1F). Other top 10 upregulated DEGs upon COMBO treatment included pseudogenes, readthrough genes, lncRNAs and known protein coding genes, such as TIMP3 (tissue inhibitor of metalloproteinase 3) and RCAN1 (Regulator of calcineurin 1) (Figure 1D,E). The top 10 downregulated DEGs upon COMBO treatment, compared to control, were strongly represented by various lncRNAs, together with pseudo- and readthrough genes (Figure 1D,E).
A direct comparison between COMBO treatment and RT identified a protein coding gene HNRNPA1L2 (heterogenous nuclear ribonucleoprotein A1 like 2), Ring finger protein 123 (RNF123) pseudogene (ENSG00000283773), and a lncRNA (ENSG00000285314) to be significantly upregulated in combination treatment (Figure S2A). Additionally, comparison between COMBO treatment and CFI-400945 treatment identified upregulation of genes encoding CEACAM5 (carcinoembryonic antigen-related cell adhesion molecule 5), NELL2, L1CAM, ENSG00000285505 (sodium/potassium-transporting ATPase subunit alpha), ENSG00000283773 (ring finger protein 123 (RNF 123) pseudogene), and lncRNA including ENSG00000291219 and ENSG00000291231. Gene encoding for AGAP11 (ArfGAP with GTPase domain, ankyrin repeat and PH domain 11) was significantly downregulated in COMBO treatment relative to CFI-400945 treatment (Figure S2B). Furthermore, an interaction contrast was used to assess whether the gene expression response to RT differed in the presence versus absence of CFI-400945 by testing (COMBO − RT) − (CFI − DMSO). Consequently, AGAP11 was identified to be significantly downregulated and ENSG00000285505 (sodium/potassium-transporting ATPase subunit alpha) to be significantly upregulated (Figure S2C).
3.2. Effects of Treatments on Pathway Changes
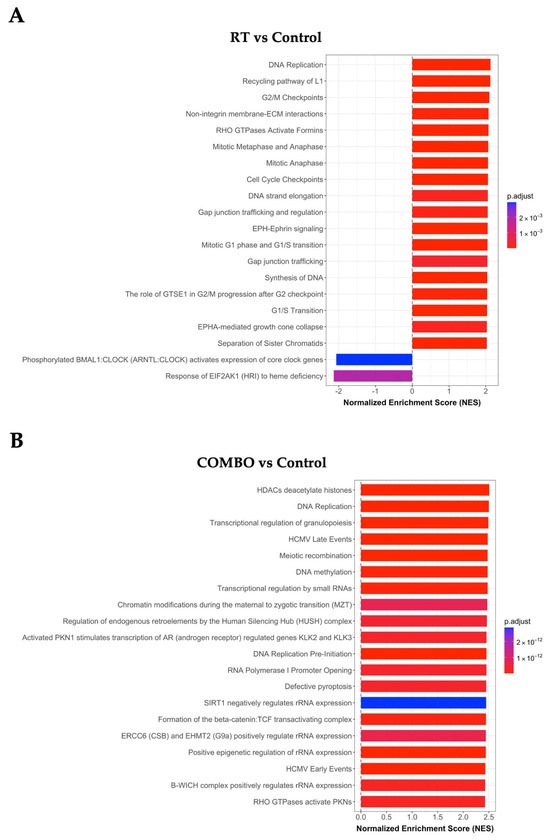
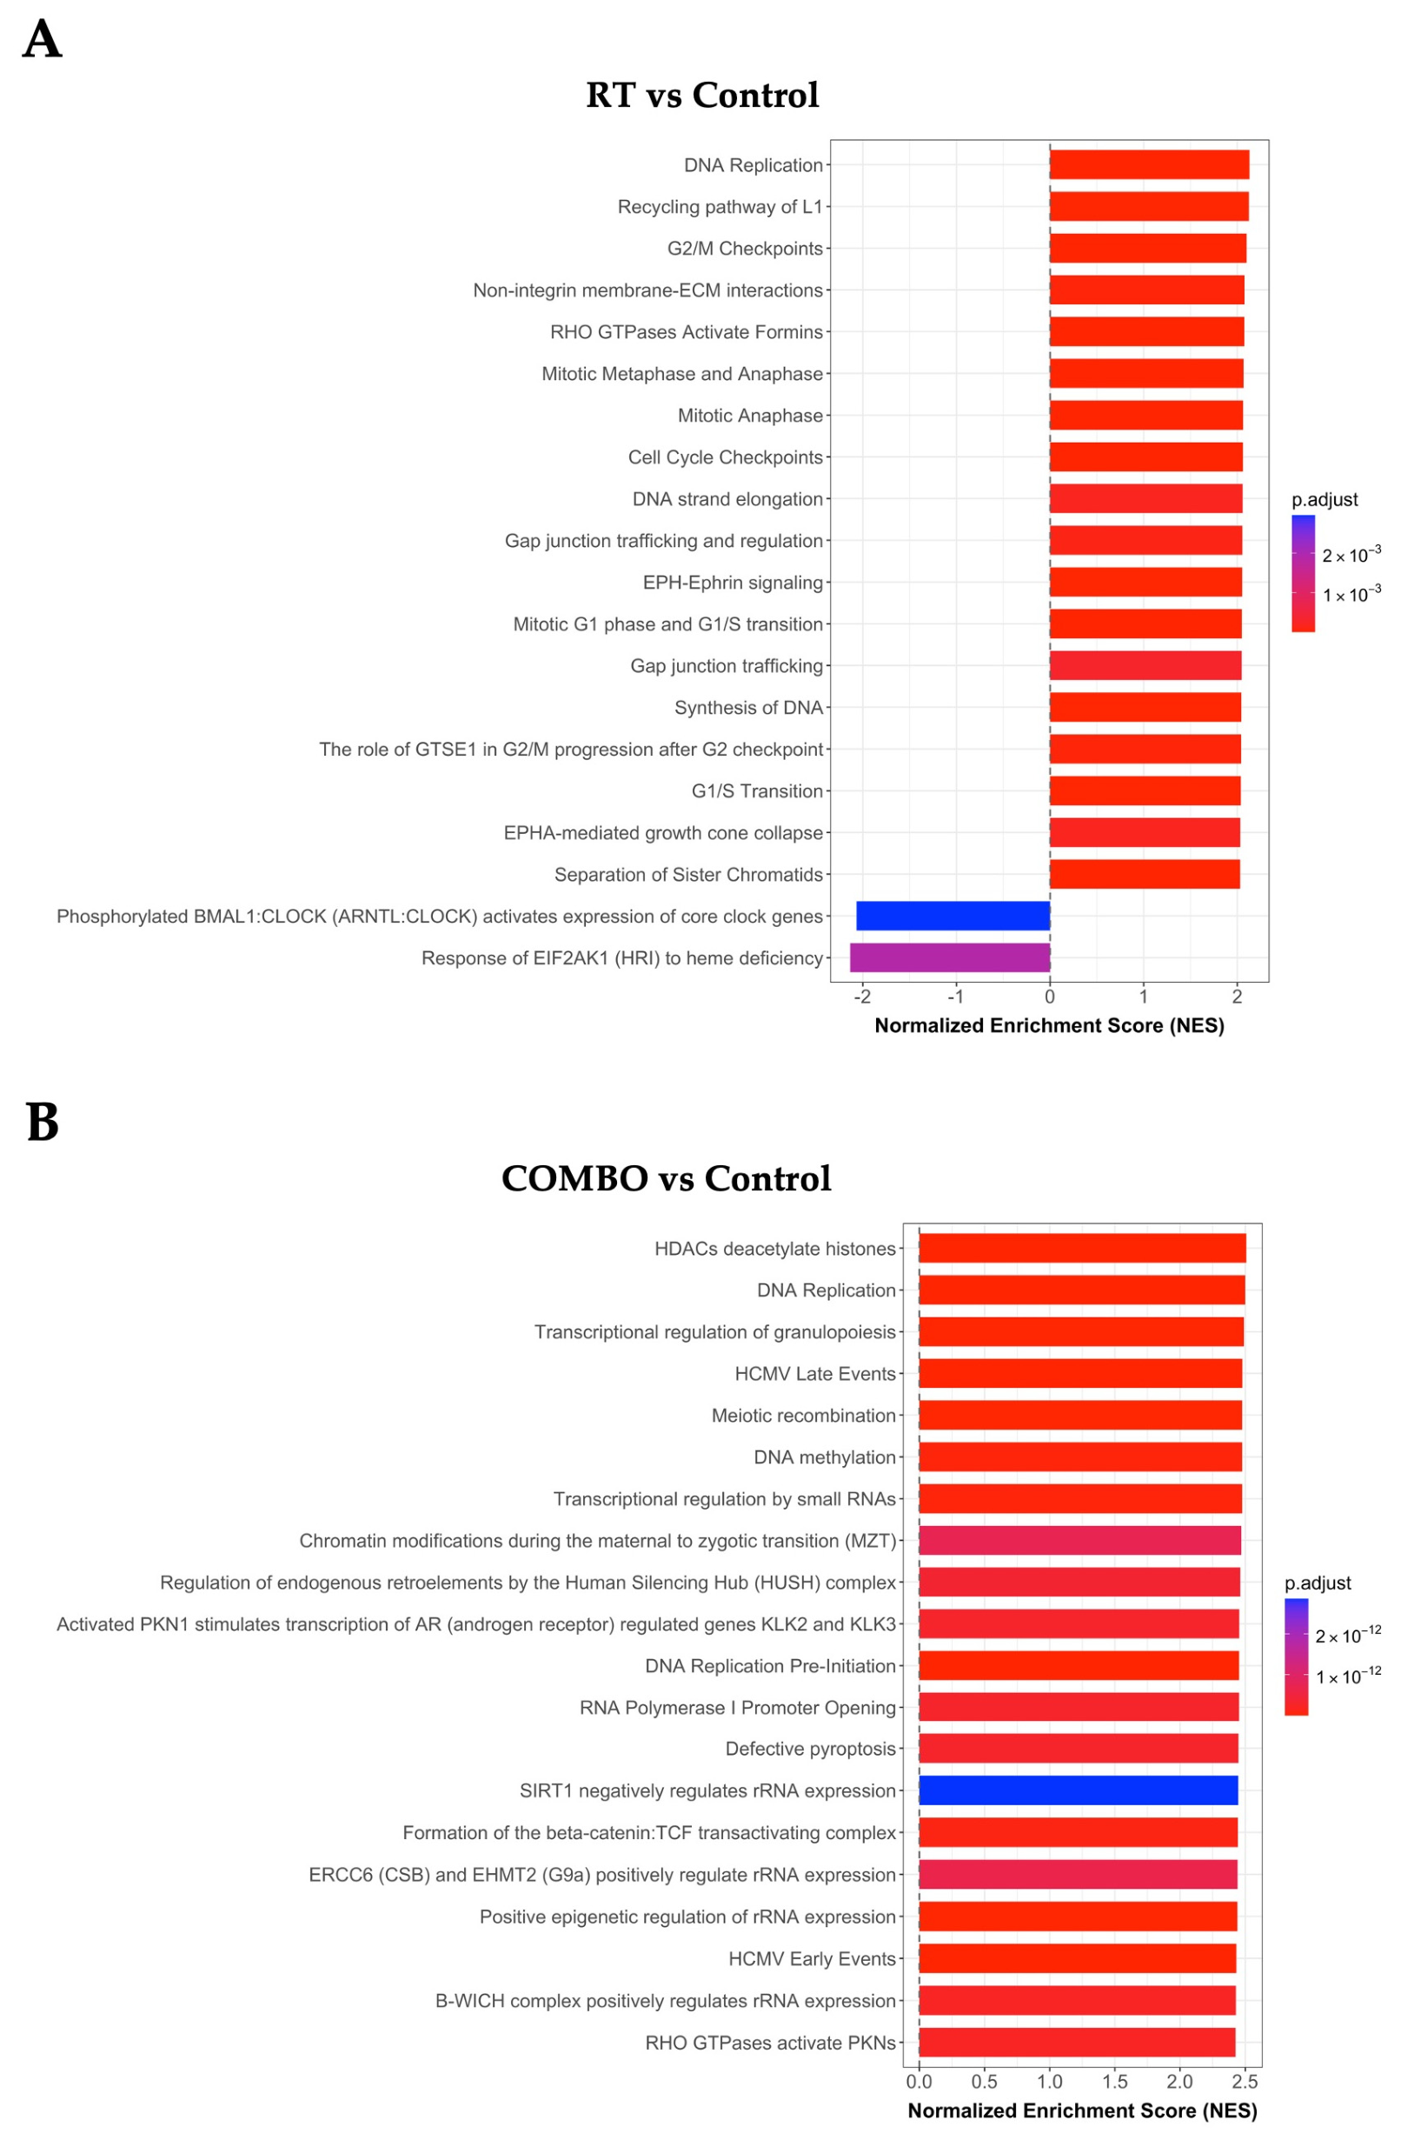
We then performed GSEA on the full ranked gene list to assess enrichment of Reactome pathways upon various treatments. Compared to control, in RT, we identified 365 significantly (FDR < 0.05) enriched Reactome pathways, with the top 20 (ranked by absolute normalized enrichment scores (NES)) represented by those related to DNA replication, cell cycle checkpoint, cell division, Rho GTPase signaling, as well as cell–cell communication (Figure 2A). Comparing the COMBO treatment to the control arm, we identified a total of 369 significantly (FDR < 0.05) enriched Reactome pathways, the top 20 (ranked by absolute NES score) of which included pathways related to cell cycle checkpoints, RhoGTPase signaling, and DNA replication (Figure 2B).
Figure 2.
Reactome gene set enrichment analysis showing the top 20 pathways ranked by absolute normalized enrichment score following (A) radiation treatment (RT) treatment versus control and (B) combination (COMBO) treatment versus control. False discovery rate (FDR) cutoff is 0.05. The color gradient corresponds to the Benjamini–Hochberg (BH)-adjusted p-value with the blue color representing lower adjusted p-values (higher significance) and red color representing higher adjusted p-values (lower significance).
3.3. RT and CFI-400945 Treatment Leads to Upregulation of MCAM Expression in TNBC
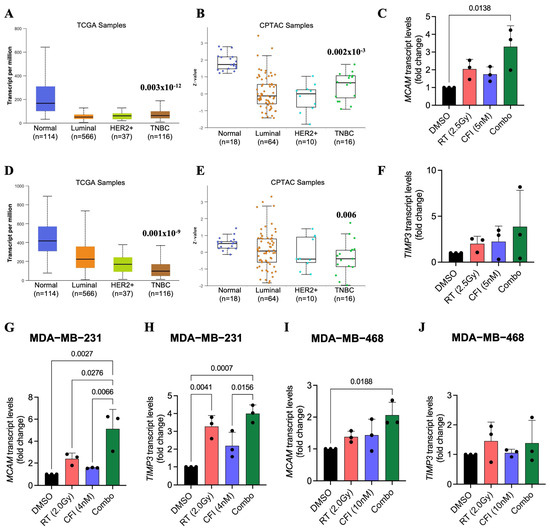
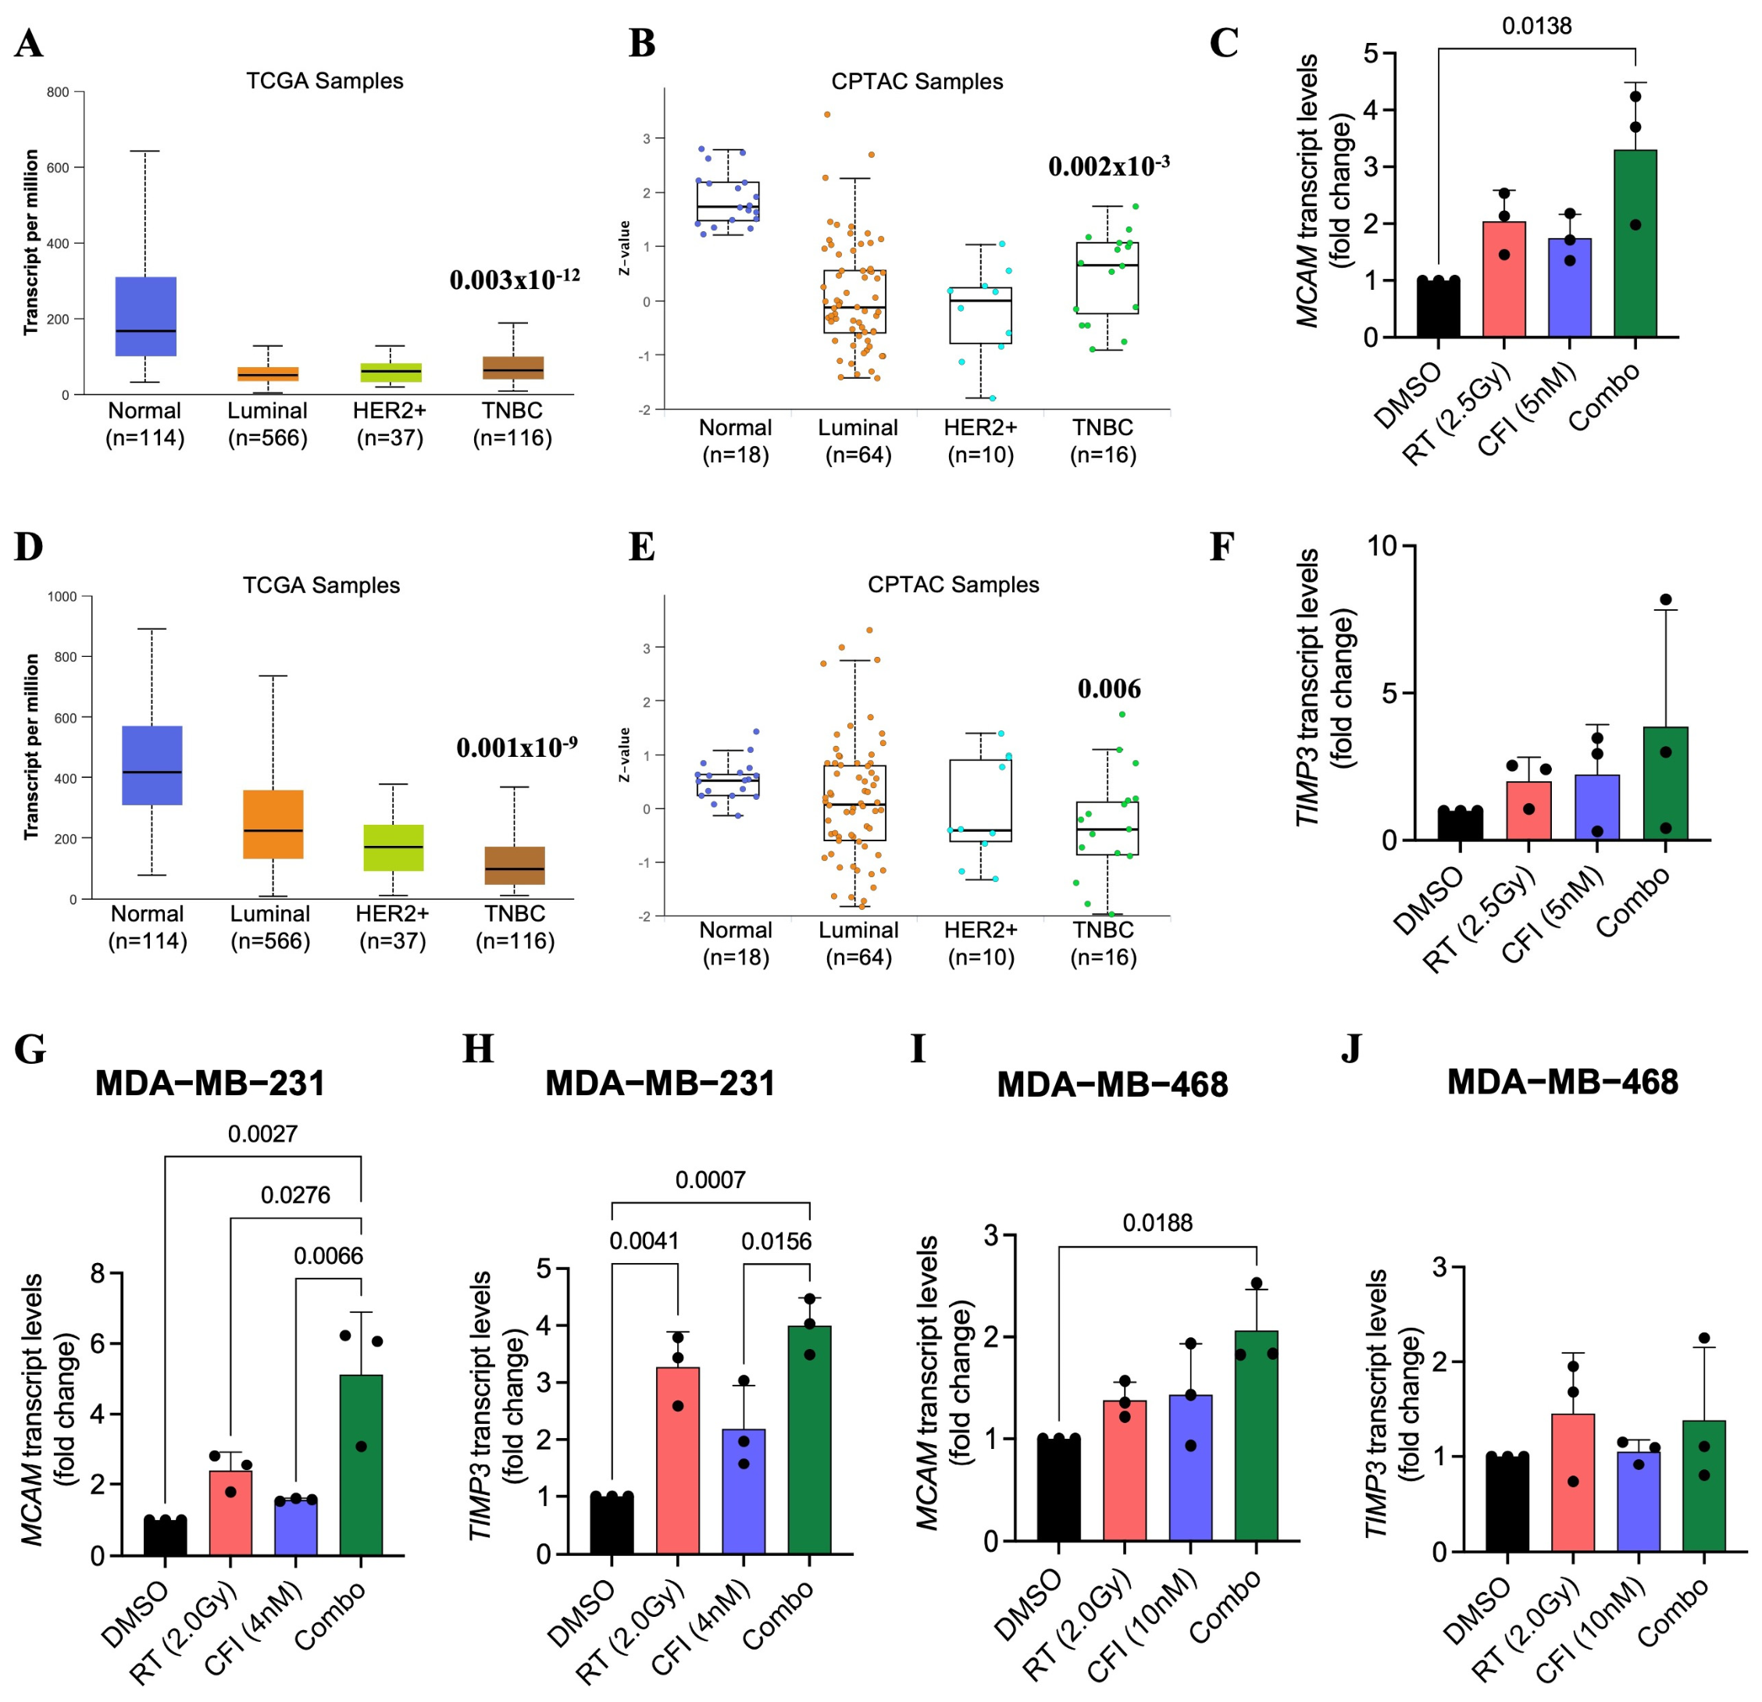
To determine the translational potential of DEGs following RT alone or COMBO treatment, we analyzed available transcript and protein data from TCGA and CPTAC breast cancer databases using the UALCAN interactive web-based tool. Our analysis revealed that transcript and protein levels of MCAM (Figure 3A,B) and TIMP3 (Figure 3D,E) were significantly downregulated in TNBC samples compared to normal breast tissue.
Figure 3.
Effects of combination treatment on MCAM and TIMP3 expression in TNBC. TCGA (A,D) and CPTAP (B,E) analyses show transcript and protein levels of MCAM (A,B) and TIMP3 (D,E) in TNBC samples relative to luminal and HER2+ breast cancer subtypes and normal tissue samples. RT-qPCR validation of MCAM (C) and TIMP3 (F) in the PDO model following radiation treatment (RT), CFI-400945 (CFI) or combination (COMBO) treatment. RT-qPCR validation of MCAM expression in MDA-MB-231 (G) and MDA-MB-468 (I) TNBC cells. RT-qPCR validation of TIMP3 expression in MDA-MB-231 (H) and MDA-MB-468 (J) TNBC cells. Error bars indicate standard deviation.
Therefore, we focused on validating the expression of MCAM and TIMP3 in different TNBC models. COMBO treatment in the PDO model significantly increased MCAM transcript levels compared to control (Figure 3C). Although no significant increase in TIMP3 transcript level was observed upon treatment, a trend towards increased expression following COMBO treatment was seen in the PDO model (Figure 3F). Additionally, MCAM transcript levels were significantly increased in TNBC cell lines MDA-MB-231 and MDA-MB-468 following COMBO treatment compared to control (Figure 3G,I). Significantly increased TIMP3 expression was detected in MDA-MB-231 upon COMBO treatment (compared to control), but not in MDA-MB-468 cells (Figure 3H,J). Overall, our findings suggest that COMBO treatment upregulates MCAM expression in TNBC models and may potentially act as a candidate treatment-associated transcript.
4. Discussion
TNBC is an aggressive and treatment-resistant breast cancer subtype. The scarcity of reliable biomarkers is reflected in limited therapeutic options and poor overall survival outcomes compared to other breast cancer subtypes [1,26]. This dictates a need to better understand mechanisms of treatment response and to identify novel biomarkers, drug targets, and rational multimodality combination treatment strategies. Here, we provide new insights into gene expression and pathway changes following treatment with RT and/or the PLK4 inhibitor CFI-400945 in a translationally relevant TNBC PDO model, and we validate our findings in both PDO and immortalized TNBC cell lines.
In our previous studies, we showed that the PLK4 inhibitor, CFI-400945, synergizes with RT to produce anticancer effects in TNBC cell lines, PDOs and mouse xenograft models [7,8]. Mechanistic studies suggest that this synergy may occur, at least in part, through the overamplification of centrioles and perturbations in the DNA-damage response and cell cycle regulation, indicating a multifaceted mechanism of action of combined RT and PLK4 inhibition [4,8,12,27]. Therefore, we employed a bulk RNA-sequencing approach to explore a broader view of molecular changes accompanying anticancer effects following combination treatment.
To obtain translationally relevant data, we treated a TNBC PDO model with doses of RT and drug concentrations that showed the highest degree of synergy in our previous studies [8]. In this model, 5 nM of CFI-400945 produced a 1.1-fold reduction in organoid formation compared to controls, whereas 2.5 Gy of RT led to a 1.2-fold reduction in organoid formation [8]. Notably, the COMBO treatment at these parameters led to a 12.7-fold decrease in organoid formation compared to untreated controls [8]. We reasoned that using this previously optimized RT dose and drug concentration would allow us to identify gene and pathway-related changes specifically associated with the COMBO treatment, with minimal off-target effects.
We only observed one DEG following CFI-400945 treatment compared to control (upregulation of AGAP11), and thirteen DEGs were identified following RT-only treatment versus control. The small number of DEGs observed following single agent treatment likely reflects the low drug concentration and RT dose selected for the study. RT-only treatment resulted in the upregulation of NELL2, MCAM and L1CAM, genes whose roles in breast cancer pathogenesis and treatment response require further investigation. NELL2 may act as a tumor suppressor in some cancers, including hepatocellular carcinoma [28] and breast cancer [29]. However, its role in radiation response remains poorly understood.
MCAM is an adhesion molecule implicated in several cellular processes, including vascular and lymphatic metastasis and tumor angiogenesis [30], through mechanisms involving Rho GTPase signaling [31,32]. Although substantial evidence supports a tumor promoting role of MCAM, other studies suggest that it may function as a tumor suppressor in breast cancer, indicating a context-dependent role in oncogenesis [33,34,35,36]. MCAM can induce epithelial–mesenchymal transition (EMT), which is associated with poor prognosis and high tumor grade [32] and may contribute to the maintenance of aggressive basal-like phenotypes such as TNBC [37]. MCAM has been shown to promote radiation resistance in breast cancer cells [38], whereas its inhibition improves radiosensitivity in cervical cancer cells [39].
We also identified upregulation of L1CAM following RT, along with pathway alterations related to L1CAM-mediated signal transduction, interactions and recycling. In breast cancer, L1CAM promotes cell proliferation, migration, EMT and metastases [40,41,42]. Its expression is preferentially observed in TNBC [43], where it has been associated with pro-tumorigenic effects [42]. L1CAM has been reported to be linked to radioresistance in ovarian cancer cells [44] and neuroblastoma [45]. Mechanistically, L1CAM can regulate DNA damage checkpoint responses and RNA interference-mediated suppression of DNA damage checkpoint activation and repair, thereby sensitizing glioblastoma stem cells to radiation [46]. L1CAM regulates the MRN (Mre11, Rad50, and Nbs1) complex, which activates ataxia telangiectasia mutated (ATM) kinase and early checkpoint response leading to radioresistance through MRN-ATM-Chk2 signaling [46].
Reactome analysis identified an enrichment of pathways associated with Rho GTPase signaling following a low dose of RT. Rho GTPases are also important mediators of breast cancer initiation, metastasis and therapeutic response [47]. Notably, the top genes upregulated following RT, including L1CAM [48], MCAM [31,32] and NELL2 [49], have been implicated in Rho GTPase signaling. Although most available evidence supports an oncogenic role of Rho GTPases, tumor suppressor functions have also been reported, emphasizing their context-dependent roles in cancer biology [47]. Altered Rho GTPase activation may contribute to chemoresistance and radioresistance, potentially through regulation of stem-like phenotypes in breast and other cancers [47,50]. However, few studies have examined the roles of Rho GTPase family proteins in breast cancer radiation resistance, highlighting an important area of research for their investigation. Thus, the gene expression and pathway changes observed following RT in our study are consistent with potential modulation of radiotherapy response and align with our previous findings suggesting perturbations of the DNA-damage response following RT [4,12].
The combination treatment of CFI-400945 and RT resulted in a substantially higher number of DEGs and overrepresented pathways compared to RT-alone treatment, supporting the potential anticancer effects of this COMBO on gene expression changes and aligning with our previously observed anticancer synergy [7,8]. NELL2, MCAM and L1CAM expression were further upregulated by the COMBO treatment, compared to RT-only, suggesting that CFI-400945 may enhance RT-induced expression of these genes. Most DEGs unique to combination treatment have been implicated in breast cancer pathogenesis. For example, EPHA4 has pro-oncogenic properties [51,52,53], and has also been linked to radioresistance [54,55]). Overall, however, the role of most DEGs following combination treatment in cancer responses remain unclear. We also found that RT or COMBO treatments altered the expression of several pseudogenes, lncRNAs and readthrough genes compared to control. Although the role of pseudogenes and lncRNAs in cancer, including TNBC, is still evolving [56], both pseudogenes [57] and lncRNAs [58,59] are increasingly recognized as key contributors to cancer biology and radioresistance [56,59].
We next validated gene expression of two identified DEGs, MCAM and TIMP3, using RT-qPCR. These genes were selected as our in silico analyses showed that their transcript expression and protein levels were significantly altered in TNBC patient samples compared to normal breast tissue. In our study, COMBO treatment increased MCAM expression across multiple TNBC models, including PDO and TNBC cell lines, MDA-MB-231 and MDA-MB-468. This consistent upregulation across experimental systems suggests that MCAM may represent a treatment-response associated gene. Further mechanistic studies will be required to determine how upregulation of MCAM expression contributes to the effects of COMBO treatment in TNBC.
In our in silico analysis, TIMP3 transcript and protein levels were significantly lower in TNBC patient samples compared to normal breast tissues. TIMP3 generally functions as a tumor suppressor by reducing cancer invasion and metastases, and EMT, while promoting apoptosis and inhibiting angiogenesis [60,61]. Its expression has also been associated with better patient outcomes [60,62,63]. TIMP3 may further promote breast cancer cell sensitivity to RT and hormonal therapy [64,65]. We observed a heterogeneous response to COMBO treatment, with a significant upregulation of TIMP3 in MDA-MB-231 cells and a trend towards upregulation in PDOs. This heterogeneity suggests that TIMP3 regulation may depend on the cell intrinsic genomic and molecular profiles of cancer cells. Overall, our findings suggest that COMBO treatment modulated both pro-tumorigenic and tumor suppressor signals, which may influence treatment response or resistance in TNBC.
Overall, to the best of our knowledge, this study provides the first insight into gene expression changes following low dose RT-only and in combination with a radiosensitizing agent in TNBC PDO. Only a limited number of studies have examined bulk transcriptomics to assess gene expression changes in response to RT, and most have used immortalized cell lines such as MDA-MB-231 TNBC. These studies have used high doses of RT (≥9 Gy) and reported over a thousand DEGs following RT [66], along with pathway changes related to cell cycle and gene transcription [66]. In radioresistant MDA-MB-231RR cells, upregulation of genes involved in signal transduction, cell adhesion, transcription regulation, inflammatory response, DNA methylation and angiogenesis has been reported [67]. Similar findings have been observed in non-TNBC cell lines [68,69] treated with 9 and 23 Gy of RT, where dose-dependent gene-expression changes were detected in pathways regulating transcription, cell cycle and inflammatory processes.
5. Conclusions
Together, these studies indicate that RT strongly influences gene expression changes, and that high doses may induce broader, potentially less specific gene expression changes. In contrast, our study used a relatively low RT dose in a more translationally relevant PDO model. This approach allowed us to identify potential novel genes implicated in RT responses in TNBC and to obtain a broader view of molecular and pathway associated changes with augmentation of RT effects by CFI-400945. Furthermore, we identified MCAM and TIMP3 as potential treatment-response associated molecules in TNBC. Additional studies are warranted to determine whether MCAM and TIMP3 function as mediators or biomarkers of response to a combination of RT and PLK4 inhibition.
The findings from this study identify molecular and pathway-level changes that may help improve our understanding of TNBC biology, including responses and resistance to RT, targeted therapies, and multimodality treatment strategies. This data may also support the future identification of more effective therapeutic approaches, biomarkers, and drug targets in TNBC.
Limitations: This study was performed using a single PDO model, which limits the generalizability of the findings. Given the heterogeneity of TNBC, further studies using additional PDO models are warranted. Moreover, validation of findings from the bulk transcriptomics, particularly assessing transcript and protein levels of selected targets under various treatment conditions, is imperative to confirm the observed changes and translational relevance. Our current RNA-seq analysis was performed to assess DEGs following different treatments, and this approach does not comprehensively capture transcript- or isoform-specific regulations of gene expression changes [70]. Interpretation of gene perturbations as an exhaustive representation of the transcriptomic response needs further investigation. Overall, this study provides a broad view of potential molecular targets associated with RT response in TNBC and opens new avenues for identifying clinically relevant biomarkers and therapeutic targets in this disease.
Supplementary Materials
The following supporting information can be downloaded at: https://www.mdpi.com/article/10.3390/radiation6040036/s1; Figure S1: Read counts normalized using Trimmed Mean of M-values (TMM). Figure S2: Interaction between RT and CFI. Table S1: Treatment distribution of samples across batches. Table S2: Primer sequences used in RT-qPCR experiment.
Author Contributions
A.P., A.L.A., V.B. and H.K.A. conceptualized the project. V.B., I.K. and H.K.A. performed the experiments. A.P., I.K., S.J. and V.B. performed data analysis and prepared the figures. I.K., A.P., S.J. and V.B. wrote the manuscript. A.P., H.K.A., I.K., S.J. and V.B. contributed to the literature review. P.H. assisted with project data analysis planning and analysis itself. All authors have read and agreed to the published version of the manuscript.
Funding
This research was supported by Grant#942549 from the Cancer Research Society (CRS) and Canadian Institutes of Health Research (CIHR, Funding Reference Number 184668)/Institute of Cancer Research (ICR), Operating Grants 2022 Competition, Targeted Funding Opportunity to A.P. A.P. research is supported by the Young Investigator Startup Grant, Department of Surgery, Western University; the Clinician Scientist Award, Department of Surgery, Western University, and has been supported by the Opportunities Fund of the Academic Health Sciences Centre Alternative Funding Plan of the Academic Medical Organization of Southwestern Ontario (AMOSO, Project #F20–007). A.A., A.P., I.K. and V.B. have been supported by Breast Cancer Canada. I.K. is supported by Canadian Institutes of Health Research (Canadian Graduate Research Scholarship Masters (CGRS-M)). S.J. is supported by Canadian Institutes of Health Research (Canadian Graduate Scholarship—Doctoral (CGRS-D)).
Institutional Review Board Statement
The study was conducted in accordance with the Declaration of Helsinki and approved by the Institutional Review Board (or Ethics Committee) of Western University, London, ON (HSREB; protocols #118019 (25 January 2021) and 118685 (30 March 2021) for studies involving humans.
Informed Consent Statement
TNBC tissue was obtained after participant’s consent and established by the Cescon lab in collaboration with the Princess Margaret Living Biobank (University Health Network, UHN REB#14-8358 Toronto, ON).
Data Availability Statement
Dataset available on request from the authors.
Acknowledgments
We thank Kaytlin Wade for assistance with data analysis at the initial stages of the project.
Conflicts of Interest
The authors declare no conflicts of interest.
Abbreviations
The following abbreviations are used in this manuscript.
| AGAP11 | ArfGAP with GTPase domain, ankyrin repeat and PH domain 11 |
| ATM | Ataxia telangiectasia mutated |
| BME-2 | Basement membrane-like extract, type 2 |
| BRCA | Breast invasive carcinoma |
| CEACAM5 | Carcinoembryonic antigen-related cell adhesion molecule 5 |
| COMBO | Combination treatment |
| CPTAC | Clinical Proteomic Tumor Analysis Consortium |
| DEG | Differentially expressed genes |
| DMEM | Dulbecco’s modified eagle medium |
| DMSO | Dimethyl sulfoxide |
| DNA-PK | DNA-activated protein kinase |
| EGFL | Epidermal growth factor-like |
| EMT | Epithelial–mesenchymal transition |
| EPHA4 | Ephrin (EPH) receptor A4 |
| FBS | Fetal bovine serum |
| FBXO25P | F-Box only protein 25 pseudogene |
| FCF1P2 | FCF1 small subunit processome component homolog pseudogene 2 |
| FDR | False discovery rate |
| GTP | Guanosine triphosphate |
| HER2 | Human epidermal growth factor receptor 2 |
| KRT18P48 | Keratin 18 pseudogene 48 |
| L1CAM | L1 cell adhesion molecule |
| lncRNA | Long non-coding RNA |
| LRGC | London Regional Genomics Centre |
| LRRC34 | Leucine rich repeat containing 34 |
| MAGEC1 | Melanoma-associated antigen C1 |
| MCAM | Melanoma cell adhesion molecule |
| MDS | Multi-dimensional scaling |
| NELL2 | Neural epidermal growth factor-like (EGFL) like protein 2 |
| NES | Normalized enrichment scores |
| ORC | origin recognition complex |
| PDO | Patient-derived organoids |
| PDXO | Patient-derived xenograft organoids |
| PLK4 | Polo-like kinase 4 |
| PRICKLE1 | Prickle-like protein 1 |
| RCAN1 | Regulator of calcineurin 1 |
| RT | Radiation treatment |
| RT-qPCR | Reverse transcription quantitative polymerase chain reaction |
| TCGA | The Cancer Genome Atlas |
| TIMP2/3 | Tissue inhibitor of metalloproteinase 2/3 |
| TMC3-AS1 | Transmembrane channel-like 3 antisense RNA 1 |
| TMM | Trimmed mean of M-values |
| TNBC | Triple-negative breast cancer |
| UALCAN | University of Alabama at Birmingham CANcer |
References
- Bai, X.; Ni, J.; Beretov, J.; Graham, P.; Li, Y. Triple-negative breast cancer therapeutic resistance: Where is the Achilles’ heel? Cancer Lett. 2021, 497, 100–111. [Google Scholar] [CrossRef] [Scilit] [PubMed]
- Arnold, M.; Morgan, E.; Rumgay, H.; Mafra, A.; Singh, D.; Laversanne, M.; Vignat, J.; Gralow, J.R.; Cardoso, F.; Siesling, S.; et al. Current and future burden of breast cancer: Global statistics for 2020 and 2040. Breast 2022, 66, 15–23. [Google Scholar] [CrossRef] [Scilit] [PubMed]
- Xiong, N.; Wu, H.; Yu, Z. Advancements and challenges in triple-negative breast cancer: A comprehensive review of therapeutic and diagnostic strategies. Front. Oncol. 2024, 14, 1405491. [Google Scholar] [CrossRef] [Scilit] [PubMed]
- Bhat, V.; Pellizzari, S.; Allan, A.L.; Wong, E.; Lock, M.; Brackstone, M.; Lohmann, A.E.; Cescon, D.W.; Parsyan, A. Radiotherapy and radiosensitization in breast cancer: Molecular targets and clinical applications. Crit. Rev. Oncol. Hematol. 2022, 169, 103566. [Google Scholar] [CrossRef] [Scilit] [PubMed]
- Veitch, Z.W.; Cescon, D.W.; Denny, T.; Yonemoto, L.M.; Fletcher, G.; Brokx, R.; Sampson, P.; Li, S.W.; Pugh, T.J.; Bruce, J.; et al. Safety and tolerability of CFI-400945, a first-in-class, selective PLK4 inhibitor in advanced solid tumours: A phase 1 dose-escalation trial. Br. J. Cancer 2019, 121, 318–324. [Google Scholar] [CrossRef] [Scilit] [PubMed]
- Cescon, D.; Pezo, R. CFI-400945 in Patients with Advanced/Metastatic Breast Cancer. Available online: https://clinicaltrials.gov/ct2/show/NCT03624543?term=CFI-400945&draw=2&rank=3 (accessed on 30 October 2025).
- Parsyan, A.; Cruickshank, J.; Hodgson, K.; Wakeham, D.; Pellizzari, S.; Bhat, V.; Cescon, D.W. Anticancer effects of radiation therapy combined with Polo-Like Kinase 4 (PLK4) inhibitor CFI-400945 in triple negative breast cancer. Breast 2021, 58, 6–9. [Google Scholar] [CrossRef] [Scilit] [PubMed]
- Pellizzari, S.; Bhat, V.; Athwal, H.; Cescon, D.W.; Allan, A.L.; Parsyan, A. PLK4 as a potential target to enhance radiosensitivity in triple-negative breast cancer. Radiat. Oncol. 2024, 19, 24. [Google Scholar] [CrossRef] [Scilit] [PubMed]
- Bettencourt-Dias, M.; Rodrigues-Martins, A.; Carpenter, L.; Riparbelli, M.; Lehmann, L.; Gatt, M.K.; Carmo, N.; Balloux, F.; Callaini, G.; Glover, D.M. SAK/PLK4 is required for centriole duplication and flagella development. Curr. Biol. 2005, 15, 2199–2207. [Google Scholar] [CrossRef] [Scilit] [PubMed]
- Habedanck, R.; Stierhof, Y.D.; Wilkinson, C.J.; Nigg, E.A. The Polo kinase Plk4 functions in centriole duplication. Nat. Cell Biol. 2005, 7, 1140–1146. [Google Scholar] [CrossRef] [Scilit] [PubMed]
- Mason, J.M.; Lin, D.C.; Wei, X.; Che, Y.; Yao, Y.; Kiarash, R.; Cescon, D.W.; Fletcher, G.C.; Awrey, D.E.; Bray, M.R.; et al. Functional characterization of CFI-400945, a Polo-like kinase 4 inhibitor, as a potential anticancer agent. Cancer Cell 2014, 26, 163–176. [Google Scholar] [CrossRef] [Scilit] [PubMed]
- Athwal, H.; Bhat, V.; Allan, A.L.; Parsyan, A. Investigation of effects of CFI-400945 and ionizing radiation on DNA damage response in triple-negative breast cancer. Transl. Cancer Res. 2025, 14, 3822–3832. [Google Scholar] [CrossRef] [Scilit] [PubMed]
- Sachs, N.; de Ligt, J.; Kopper, O.; Gogola, E.; Bounova, G.; Weeber, F.; Balgobind, A.V.; Wind, K.; Gracanin, A.; Begthel, H.; et al. A Living Biobank of Breast Cancer Organoids Captures Disease Heterogeneity. Cell 2018, 172, 373–386 e310. [Google Scholar] [CrossRef] [Scilit] [PubMed]
- Guillen, K.P.; Fujita, M.; Butterfield, A.J.; Scherer, S.D.; Bailey, M.H.; Chu, Z.; DeRose, Y.S.; Zhao, L.; Cortes-Sanchez, E.; Yang, C.H.; et al. A human breast cancer-derived xenograft and organoid platform for drug discovery and precision oncology. Nat. Cancer 2022, 3, 232–250. [Google Scholar] [CrossRef] [Scilit] [PubMed]
- R_Core_Team. R: A Language and Environment for Statistical Computing; R Foundation for Statistical Computing: Vienna, Austria, 2025; Available online: https://www.R-project.org/ (accessed on 15 April 2025).
- Zhang, Y.; Parmigiani, G.; Johnson, W.E. ComBat-seq: Batch effect adjustment for RNA-seq count data. NAR Genom. Bioinform. 2020, 2, lqaa078. [Google Scholar] [CrossRef] [Scilit] [PubMed]
- Robinson, M.D.; McCarthy, D.J.; Smyth, G.K. EdgeR: A Bioconductor package for differential expression analysis of digital gene expression data. Bioinformatics 2010, 26, 139–140. [Google Scholar] [CrossRef] [Scilit] [PubMed]
- McCarthy, D.J.; Chen, Y.; Smyth, G.K. Differential expression analysis of multifactor RNA-Seq experiments with respect to biological variation. Nucleic Acids Res. 2012, 40, 4288–4297. [Google Scholar] [CrossRef] [Scilit] [PubMed]
- Chen, Y.; Chen, L.; Lun, A.T.L.; Baldoni, P.L.; Smyth, G.K. EdgeR v4: Powerful differential analysis of sequencing data with expanded functionality and improved support for small counts and larger datasets. Nucleic Acids Res. 2025, 53, gkaf018. [Google Scholar] [CrossRef] [Scilit] [PubMed]
- Wickham, H. ggplot2, 2nd ed.; Springer: Cham, Switzerland, 2016. [Google Scholar]
- Slowikowski, K.; Schep, A.; Hughes, S.; Dang, T.K.; Lukauskas, S.; Irisson, J.-O.; Kamvar, Z.N.; Ryan, T.; Christophe, D.; Hiroaki, Y.; et al. ggrepel: Automatically Position Non-Overlapping Text Labels with ‘ggplot2’. 2026. Available online: https://ggrepel.slowkow.com/authors (accessed on 15 April 2025).
- Subramanian, A.; Tamayo, P.; Mootha, V.K.; Mukherjee, S.; Ebert, B.L.; Gillette, M.A.; Paulovich, A.; Pomeroy, S.L.; Golub, T.R.; Lander, E.S.; et al. Gene set enrichment analysis: A knowledge-based approach for interpreting genome-wide expression profiles. Proc. Natl. Acad. Sci. USA 2005, 102, 15545–15550. [Google Scholar] [CrossRef] [Scilit] [PubMed]
- Yu, G.; He, Q.-Y. ReactomePA: An R/Bioconductor package for reactome pathway analysis and visualization. Mol. BioSyst. 2016, 12, 477–479. [Google Scholar] [CrossRef] [Scilit] [PubMed]
- Korotkevich, G.; Sukhov, V.; Budin, N.; Shpak, B.; Artyomov, M.N.; Sergushichev, A. Fast gene set enrichment analysis. bioRxiv 2021. [Google Scholar] [CrossRef] [Scilit]
- Livak, K.J.; Schmittgen, T.D. Analysis of relative gene expression data using real-time quantitative PCR and the 2−ΔΔCT Method. Methods 2001, 25, 402–408. [Google Scholar] [CrossRef] [Scilit] [PubMed]
- Dent, R.; Trudeau, M.; Pritchard, K.I.; Hanna, W.M.; Kahn, H.K.; Sawka, C.A.; Lickley, L.A.; Rawlinson, E.; Sun, P.; Narod, S.A. Triple-negative breast cancer: Clinical features and patterns of recurrence. Clin. Cancer Res. 2007, 13, 4429–4434. [Google Scholar] [CrossRef] [Scilit] [PubMed]
- Athwal, H.; Kochiyanil, A.; Bhat, V.; Allan, A.L.; Parsyan, A. Centrosomes and associated proteins in pathogenesis and treatment of breast cancer. Front. Oncol. 2024, 14, 1370565. [Google Scholar] [CrossRef] [Scilit] [PubMed]
- Liu, S.; Wu, H.; Zhang, P.; Zhou, H.; Wu, D.; Jin, Y.; Yang, H.; Xing, R.; Wu, Y.; Wu, G. NELL2 suppresses epithelial-mesenchymal transition and induces ferroptosis via notch signaling pathway in HCC. Sci. Rep. 2025, 15, 10193. [Google Scholar] [CrossRef] [Scilit] [PubMed]
- Nakamura, R.; Oyama, T.; Inokuchi, M.; Ishikawa, S.; Hirata, M.; Kawashima, H.; Ikeda, H.; Dobashi, Y.; Ooi, A. Neural EGFL like 2 expressed in myoepithelial cells and suppressed breast cancer cell migration. Pathol. Int. 2021, 71, 326–336. [Google Scholar] [CrossRef] [Scilit] [PubMed]
- Wang, Z.; Xu, Q.; Zhang, N.; Du, X.; Xu, G.; Yan, X. CD146, from a melanoma cell adhesion molecule to a signaling receptor. Signal Transduct. Target Ther. 2020, 5, 148. [Google Scholar] [CrossRef] [Scilit] [PubMed]
- Joshkon, A.; Heim, X.; Dubrou, C.; Bachelier, R.; Traboulsi, W.; Stalin, J.; Fayyad-Kazan, H.; Badran, B.; Foucault-Bertaud, A.; Leroyer, A.S.; et al. Role of CD146 (MCAM) in Physiological and Pathological Angiogenesis-Contribution of New Antibodies for Therapy. Biomedicines 2020, 8, 633. [Google Scholar] [CrossRef] [Scilit] [PubMed]
- Zeng, Q.; Li, W.; Lu, D.; Wu, Z.; Duan, H.; Luo, Y.; Feng, J.; Yang, D.; Fu, L.; Yan, X. CD146, an epithelial-mesenchymal transition inducer, is associated with triple-negative breast cancer. Proc. Natl. Acad. Sci. USA 2012, 109, 1127–1132. [Google Scholar] [CrossRef] [Scilit] [PubMed]
- Mannion, A.J.; Odell, A.F.; Baker, S.M.; Matthews, L.C.; Jones, P.F.; Cook, G.P. Pro- and anti-tumour activities of CD146/MCAM in breast cancer result from its heterogeneous expression and association with epithelial to mesenchymal transition. Front. Cell Dev. Biol. 2023, 11, 1129015. [Google Scholar] [CrossRef] [Scilit] [PubMed]
- Ouhtit, A.; Abdraboh, M.E.; Hollenbach, A.D.; Zayed, H.; Raj, M.H.G. CD146, a novel target of CD44-signaling, suppresses breast tumor cell invasion. Cell Commun. Signal. 2017, 15, 45. [Google Scholar] [CrossRef] [Scilit] [PubMed]
- Chakraborty, G.; Rangaswami, H.; Jain, S.; Kundu, G.C. Hypoxia regulates cross-talk between Syk and Lck leading to breast cancer progression and angiogenesis. J. Biol. Chem. 2006, 281, 11322–11331. [Google Scholar] [CrossRef] [Scilit] [PubMed]
- Shih, L.M.; Hsu, M.Y.; Palazzo, J.P.; Herlyn, M. The cell-cell adhesion receptor Mel-CAM acts as a tumor suppressor in breast carcinoma. Am. J. Pathol. 1997, 151, 745–751. [Google Scholar] [PubMed]
- Balcioglu, O.; Gates, B.L.; Freeman, D.W.; Hagos, B.M.; Mehrabad, E.M.; Ayala-Talavera, D.; Spike, B.T. Mcam stabilizes a luminal progenitor-like breast cancer cell state via Ck2 control and Src/Akt/Stat3 attenuation. npj Breast Cancer 2024, 10, 80. [Google Scholar] [CrossRef] [Scilit] [PubMed]
- Liang, Y.; Zhou, X.; Xie, Q.; Sun, H.; Huang, K.; Chen, H.; Wang, W.; Zhou, B.; Wei, X.; Zeng, D.; et al. CD146 interaction with integrin β1 activates LATS1-YAP signaling and induces radiation-resistance in breast cancer cells. Cancer Lett. 2022, 546, 215856. [Google Scholar] [CrossRef] [Scilit] [PubMed]
- Cheng, H. Inhibiting CD146 by its Monoclonal Antibody AA98 Improves Radiosensitivity of Cervical Cancer Cells. Med. Sci. Monit. 2016, 22, 3328–3333. [Google Scholar] [CrossRef] [Scilit] [PubMed]
- Shtutman, M.; Levina, E.; Ohouo, P.; Baig, M.; Roninson, I.B. Cell adhesion molecule L1 disrupts E-cadherin-containing adherens junctions and increases scattering and motility of MCF7 breast carcinoma cells. Cancer Res. 2006, 66, 11370–11380. [Google Scholar] [CrossRef] [Scilit] [PubMed]
- Dippel, V.; Milde-Langosch, K.; Wicklein, D.; Schumacher, U.; Altevogt, P.; Oliveira-Ferrer, L.; Janicke, F.; Schroder, C. Influence of L1-CAM expression of breast cancer cells on adhesion to endothelial cells. J. Cancer Res. Clin. Oncol. 2013, 139, 107–121. [Google Scholar] [CrossRef] [Scilit] [PubMed]
- Zhang, F.; Xu, Y.; Lin, J.; Pan, H.; Giuliano, A.E.; Cui, X.; Cui, Y. Reciprocal regulation of forkhead box C1 and L1 cell adhesion molecule contributes to triple-negative breast cancer progression. Breast Cancer Res. Treat. 2024, 204, 465–474. [Google Scholar] [CrossRef] [Scilit] [PubMed]
- Doberstein, K.; Milde-Langosch, K.; Bretz, N.P.; Schirmer, U.; Harari, A.; Witzel, I.; Ben-Arie, A.; Hubalek, M.; Muller-Holzner, E.; Reinold, S.; et al. L1CAM is expressed in triple-negative breast cancers and is inversely correlated with androgen receptor. BMC Cancer 2014, 14, 958. [Google Scholar] [CrossRef] [Scilit] [PubMed]
- Terraneo, N.; Jacob, F.; Peitzsch, C.; Dubrovska, A.; Krudewig, C.; Huang, Y.L.; Heinzelmann-Schwarz, V.; Schibli, R.; Behe, M.; Grunberg, J. L1 Cell Adhesion Molecule Confers Radioresistance to Ovarian Cancer and Defines a New Cancer Stem Cell Population. Cancers 2020, 12, 217. [Google Scholar] [CrossRef] [Scilit] [PubMed]
- Rached, J.; Nasr, Z.; Abdallah, J.; Abou-Antoun, T. L1-CAM knock-down radiosensitizes neuroblastoma IMR-32 cells by simultaneously decreasing MycN, but increasing PTEN protein expression. Int. J. Oncol. 2016, 49, 1722–1730. [Google Scholar] [CrossRef] [Scilit] [PubMed]
- Cheng, L.; Wu, Q.; Huang, Z.; Guryanova, O.A.; Huang, Q.; Shou, W.; Rich, J.N.; Bao, S. L1CAM regulates DNA damage checkpoint response of glioblastoma stem cells through NBS1. EMBO J. 2011, 30, 800–813. [Google Scholar] [CrossRef] [Scilit] [PubMed]
- Humphries, B.; Wang, Z.; Yang, C. Rho GTPases: Big Players in Breast Cancer Initiation, Metastasis and Therapeutic Responses. Cells 2020, 9, 2167. [Google Scholar] [CrossRef] [Scilit] [PubMed]
- Rodenburg, W.S.; van Buul, J.D. Rho GTPase signalling networks in cancer cell transendothelial migration. Vasc. Biol. 2021, 3, R77–R95. [Google Scholar] [CrossRef] [Scilit] [PubMed]
- Jayabal, P.; Zhou, F.; Lei, X.; Ma, X.; Blackman, B.; Weintraub, S.T.; Houghton, P.J.; Shiio, Y. NELL2-cdc42 signaling regulates BAF complexes and Ewing sarcoma cell growth. Cell Rep. 2021, 36, 109254. [Google Scholar] [CrossRef] [Scilit] [PubMed]
- Pranatharthi, A.; Ross, C.; Srivastava, S. Cancer Stem Cells and Radioresistance: Rho/ROCK Pathway Plea Attention. Stem Cells Int. 2016, 2016, 5785786. [Google Scholar] [CrossRef] [Scilit] [PubMed]
- Buckens, O.J.; El Hassouni, B.; Giovannetti, E.; Peters, G.J. The role of Eph receptors in cancer and how to target them: Novel approaches in cancer treatment. Expert Opin. Investig. Drugs 2020, 29, 567–582. [Google Scholar] [CrossRef] [Scilit] [PubMed]
- Light, T.P.; Gomez-Soler, M.; Wang, Z.; Karl, K.; Zapata-Mercado, E.; Gehring, M.P.; Lechtenberg, B.C.; Pogorelov, T.V.; Hristova, K.; Pasquale, E.B. A cancer mutation promotes EphA4 oligomerization and signaling by altering the conformation of the SAM domain. J. Biol. Chem. 2021, 297, 100876. [Google Scholar] [CrossRef] [Scilit] [PubMed]
- Nikas, I.; Giaginis, C.; Petrouska, K.; Alexandrou, P.; Michail, A.; Sarantis, P.; Tsourouflis, G.; Danas, E.; Pergaris, A.; Politis, P.K.; et al. EPHA2, EPHA4, and EPHA7 Expression in Triple-Negative Breast Cancer. Diagnostics 2022, 12, 366. [Google Scholar] [CrossRef] [Scilit] [PubMed]
- de Marcondes, P.G.; Morgado-Diaz, J.A. The Role of EphA4 Signaling in Radiation-Induced EMT-Like Phenotype in Colorectal Cancer Cells. J. Cell. Biochem. 2017, 118, 442–445. [Google Scholar] [CrossRef] [Scilit] [PubMed]
- Pan, C.; Shao, S.; Gu, Y.; Ni, Q. Radiation prevents tumor progression by inhibiting the miR-93-5p/EphA4/NF-κB pathway in triple-negative breast cancer. Oncol. Rep. 2023, 49, 78. [Google Scholar] [CrossRef] [Scilit] [PubMed]
- Kannampuzha, I.; Ghasemi, F.; Parsyan, A. Pseudogenes in breast cancer pathogenesis and their clinical utility. Crit. Rev. Oncol. Hematol. 2026, 218, 105078. [Google Scholar] [CrossRef] [Scilit] [PubMed]
- Nakamura-Garcia, A.K.; Espinal-Enriquez, J. Pseudogenes in Cancer: State of the Art. Cancers 2023, 15, 4024. [Google Scholar] [CrossRef] [Scilit] [PubMed]
- Huarte, M. The emerging role of lncRNAs in cancer. Nat. Med. 2015, 21, 1253–1261. [Google Scholar] [CrossRef] [Scilit] [PubMed]
- Sideris, N.; Dama, P.; Bayraktar, S.; Stiff, T.; Castellano, L. LncRNAs in breast cancer: A link to future approaches. Cancer Gene Ther. 2022, 29, 1866–1877. [Google Scholar] [CrossRef] [Scilit] [PubMed]
- Su, C.W.; Lin, C.W.; Yang, W.E.; Yang, S.F. TIMP-3 as a therapeutic target for cancer. Ther. Adv. Med. Oncol. 2019, 11, 1758835919864247. [Google Scholar] [CrossRef] [Scilit] [PubMed]
- Qi, J.H.; Ebrahem, Q.; Moore, N.; Murphy, G.; Claesson-Welsh, L.; Bond, M.; Baker, A.; Anand-Apte, B. A novel function for tissue inhibitor of metalloproteinases-3 (TIMP3): Inhibition of angiogenesis by blockage of VEGF binding to VEGF receptor-2. Nat. Med. 2003, 9, 407–415. [Google Scholar] [CrossRef] [Scilit] [PubMed]
- Kotzsch, M.; Farthmann, J.; Meye, A.; Fuessel, S.; Baretton, G.; Tjan-Heijnen, V.C.; Schmitt, M.; Luther, T.; Sweep, F.C.; Magdolen, V.; et al. Prognostic relevance of uPAR-del4/5 and TIMP-3 mRNA expression levels in breast cancer. Eur. J. Cancer 2005, 41, 2760–2768. [Google Scholar] [CrossRef] [Scilit] [PubMed]
- Mylona, E.; Magkou, C.; Giannopoulou, I.; Agrogiannis, G.; Markaki, S.; Keramopoulos, A.; Nakopoulou, L. Expression of tissue inhibitor of matrix metalloproteinases (TIMP)-3 protein in invasive breast carcinoma: Relation to tumor phenotype and clinical outcome. Breast Cancer Res. 2006, 8, R57. [Google Scholar] [CrossRef] [Scilit] [PubMed]
- Zhou, Y.; Zhang, T.; Wang, S.; Yang, R.; Jiao, Z.; Lu, K.; Li, H.; Jiang, W.; Zhang, X. Targeting of HBP1/TIMP3 axis as a novel strategy against breast cancer. Pharmacol. Res. 2023, 194, 106846. [Google Scholar] [CrossRef] [Scilit] [PubMed]
- Gan, R.; Yang, Y.; Yang, X.; Zhao, L.; Lu, J.; Meng, Q.H. Downregulation of miR-221/222 enhances sensitivity of breast cancer cells to tamoxifen through upregulation of TIMP3. Cancer Gene Ther. 2014, 21, 290–296. [Google Scholar] [CrossRef] [Scilit] [PubMed]
- Bravata, V.; Cammarata, F.P.; Minafra, L.; Musso, R.; Pucci, G.; Spada, M.; Fazio, I.; Russo, G.; Forte, G.I. Gene Expression Profiles Induced by High-dose Ionizing Radiation in MDA-MB-231 Triple-negative Breast Cancer Cell Line. Cancer Genom. Proteom. 2019, 16, 257–266. [Google Scholar] [CrossRef] [Scilit] [PubMed]
- Perez-Añorve, I.X.; Flores-Fortis, M.; Patiño-Morales, C.C.; Ortiz-Gutierrez, E.; Del Moral-Hernandez, O.; Gonzalez-De la Rosa, C.H.; Soto-Reyes, E.; Bonilla-Moreno, R.; Saldaña, M.C.; Landero-Huerta, D.A.; et al. Integrated Transcriptome Analysis of Radioresistant Cells Revealed Genes and Pathways Predictive of Tumor Response to Radiotherapy and Chemotherapy in Breast Cancer. Adv. Ther. 2024, 7, 2300274. [Google Scholar] [CrossRef] [Scilit]
- Minafra, L.; Bravata, V.; Russo, G.; Forte, G.I.; Cammarata, F.P.; Ripamonti, M.; Candiano, G.; Cervello, M.; Giallongo, A.; Perconti, G.; et al. Gene Expression Profiling of MCF10A Breast Epithelial Cells Exposed to IOERT. Anticancer Res. 2015, 35, 3223–3234. [Google Scholar] [PubMed]
- Bravata, V.; Minafra, L.; Russo, G.; Forte, G.I.; Cammarata, F.P.; Ripamonti, M.; Casarino, C.; Augello, G.; Costantini, F.; Barbieri, G.; et al. High-dose Ionizing Radiation Regulates Gene Expression Changes in the MCF7 Breast Cancer Cell Line. Anticancer Res. 2015, 35, 2577–2591. [Google Scholar] [PubMed]
- Chen, H.; Wang, Z.; Gong, L.; Wang, Q.; Chen, W.; Wang, J.; Ma, X.; Ding, R.; Li, X.; Zou, X.; et al. A distinct class of pan-cancer susceptibility genes revealed by an alternative polyadenylation transcriptome-wide association study. Nat. Commun. 2024, 15, 1729. [Google Scholar] [CrossRef] [Scilit] [PubMed]
Disclaimer/Publisher’s Note: The statements, opinions and data contained in all publications are solely those of the individual author(s) and contributor(s) and not of MDPI and/or the editor(s). MDPI and/or the editor(s) disclaim responsibility for any injury to people or property resulting from any ideas, methods, instructions or products referred to in the content. |
© 2026 by the authors. Licensee MDPI, Basel, Switzerland. This article is an open access article distributed under the terms and conditions of the Creative Commons Attribution (CC BY) license.