


Abstract
Stand-up paddleboarding (SUP) at Sun Moon Lake, Taiwan, requires selective attribute prioritisation under operational and environmental constraints. This study develops a five-stage theoretical–procedural framework that organises participant needs through Schmitt’s experiential modules, classifies asymmetric quality functions using Kano analysis, links attributes to acceptable price and behavioural intention, and compares Kano-derived priorities with an evaluation–outcome priority matrix (EOPM). A quantitatively dominant sequential mixed-method design combined interviews with four operators and one certified coach, field observations, online reviews, and an electronic survey administered from 8 to 24 May 2023 to a purposive convenience sample of participants with prior SUP experience at Sun Moon Lake; 450 of 499 responses were usable (90.1%). Analyses included descriptive statistics, Kano classification, Satisfaction Improvement and Dissatisfaction Reduction Coefficients (SIC/DRC), 5000-resample bootstrap subgroup comparisons, correlation analysis, exploratory factor analysis, multiple regression, and the EOPM. Relaxation (SIC = 0.749) and happiness (SIC = 0.744) produced the largest satisfaction gains, whereas safety (DRC = −0.636) and shower facilities (DRC = −0.607) showed the strongest dissatisfaction sensitivity. Professional coaching (r = 0.349), skill instruction (r = 0.339), and safety (r = 0.331) were the strongest correlates of composite behavioural intention (Cronbach’s α = 0.941). Exploratory factor analysis identified experiential–relational enhancement and operational–competence support; both predicted behavioural intention (β = 0.174 and 0.296, respectively; adjusted R2 = 0.182). The EOPM identified safety and skill instruction as strategic strengths, while professional coaching remained an improvement priority, illustrating partial convergence between asymmetric quality and outcome-based prioritisation. The framework supports selective investment in non-negotiable operational foundations and high-leverage experiential enhancements in eco-sensitive sport tourism.
1. Introduction
Stand-up paddleboarding (SUP) has become a prominent form of low-impact, participatory water recreation. As a non-motorised “soft adventure” activity, SUP combines physical effort, skill acquisition, perceived risk, and direct engagement with natural environments, while potentially encouraging environmental awareness and pro-environmental behaviour (Hong & Lee, 2023). In Taiwan, SUP was formally incorporated into national water-recreation governance in 2016 (Ministry of Transportation and Communications, 2024), contributing to its growth at destinations such as Sun Moon Lake. The scale of demand is reflected in the 2022 Sun Moon Lake Open Water Swimming Championship and SUP Competition, which attracted 1613 contestants over three waves (Nantou County Government, 2022).
The rapid growth of water-based recreation has increased management pressure at Sun Moon Lake, a multipurpose reservoir supporting hydropower generation, irrigation, and domestic water supply. In September 2022, recurring white, turbid wastewater discharge led to more than ten inspections and three penalties totalling NT$650,000, highlighting the lake’s vulnerability to tourism-related environmental impacts (Nantou County Government Environmental Protection Bureau, 2022). Pollution concerns at launch areas also prompted calls for stronger environmental management (Yi & Glauert, 2022). In December 2023, the Sun Moon Lake National Scenic Area Administration amended regulations governing paddle-based recreation, including SUP, to strengthen activity safety and visitor protection (Sun Moon Lake National Scenic Area Headquarters, 2023; Sun Moon Lake, 2022). Together, these developments identify environmental protection and operational safety as concrete site-level priorities requiring sustained oversight. More broadly, systematic evidence indicates that recreational activities can place pressure on both biotic and abiotic environments, reinforcing the need to manage participation and site operations carefully in ecologically sensitive destinations (Sardar & Islam, 2025).
Beyond environmental pressure, variation in coaching, safety management, equipment provision, facilities, and experiential design may influence participants’ evaluations of SUP services. These concerns are particularly important in active water recreation, where experiences are shaped by perceived risk, bodily effort, competence development, emotional arousal, and social interaction. Inadequate safety, instruction, or facilities may undermine confidence and generate dissatisfaction, whereas relaxation, enjoyment, photography, and social interaction may enrich the experience and encourage revisit and recommendation intentions.
However, sport and tourism research has generally modelled service quality, experiential value, satisfaction, and behavioural intention as linear and symmetric relationships (Yoshida & James, 2010; Biscaia et al., 2023; Jia et al., 2025; S. Y. Lee et al., 2024). Although leisure satisfaction and sport tourism service quality are associated with continued participation and future behavioural intentions (Ahn, 2025; Jia et al., 2025; Jiang et al., 2025), this symmetric logic does not explain why the absence of some attributes may produce disproportionate dissatisfaction, while the presence of others may generate additional satisfaction. Moreover, limited research has integrated experiential attribute classification, asymmetric evaluation, and downstream outcomes such as acceptable price, revisit intention, and recommendation intention. Consequently, managers lack a systematic basis for deciding which attributes should be prioritised when financial, staffing, infrastructural, and environmental resources are constrained.
To address this problem, the present study develops a five-stage theoretical–procedural framework for sustainable SUP attribute prioritisation at Sun Moon Lake. Participant needs are organised through Schmitt’s experiential modules and classified using Kano’s asymmetric quality model. The resulting classifications and Satisfaction Improvement and Dissatisfaction Reduction Coefficients are then linked to acceptable price, revisit intention, and recommendation intention. Finally, Kano-derived priorities are compared with an evaluation–outcome priority matrix to distinguish operational foundations, strategic strengths, improvement priorities, and lower-priority attributes. This framework provides a behaviourally grounded basis for allocating limited resources while balancing experiential value, operational reliability, and environmental responsibility.
2. Literature Review
Building on experiential marketing and asymmetric quality theory, this study proposes a theoretical-procedural approach to sustainable attribute prioritisation. Schmitt’s experiential modules structure the content of participant needs, Kano analysis identifies the asymmetric satisfaction function of each attribute, and behavioural outcomes indicate its downstream relevance. Integrating these stages provides a systematic basis for distinguishing essential baseline attributes, experiential differentiators, and strategic priorities under limited managerial resources.
2.1. Experiential Value in Active Sport Tourism
Stand-up paddleboarding (SUP) has become an increasingly prominent form of participatory water-based tourism. Unlike passive tourism consumption, SUP involves physical exertion, skill acquisition, perceived risk, emotional arousal, and interaction with natural and social environments. Research on adventure and sport tourism similarly identifies affective arousal, perceived competence, and risk perception as interrelated elements shaping participants’ motivations and overall experience appraisals (Buckley, 2012; Pomfret & Bramwell, 2016). Understanding participant evaluations therefore requires consideration of both operational service quality and the broader experiential value created through participation.
Sport and tourism research has commonly linked service quality and satisfaction to continued participation, revisit intention, recommendation, and advocacy (Yoshida & James, 2010; Biscaia et al., 2023; Jia et al., 2025). Tangible conditions, such as facilities and equipment, and process-related encounters, such as coaching, staff interaction, and safety management, contribute to participants’ perceived value and satisfaction (Theodorakis et al., 2014; Yoshida & James, 2010). These relationships have generally been modelled as linear and symmetric, assuming that better service performance proportionally increases satisfaction and favourable behavioural intentions.
Leisure satisfaction encompasses psychological, educational, social, relaxation, physiological, and aesthetic evaluations (Beard & Ragheb, 1980). Similarly, Schmitt’s (1999) experiential marketing framework identifies sensory, affective, cognitive, behavioural, and relational experiences, which have been used to explain satisfaction, loyalty, and word of mouth in tourism and leisure contexts (Hosany & Witham, 2010; J. H. Kim et al., 2012; T. C. Lee & Peng, 2021). In SUP, scenery may provide sensory value, coaching may stimulate learning, skill instruction supports active participation, relaxation and enjoyment shape affective responses, and group activities create relational value.
Nevertheless, experiential attributes may perform different functions. Because active water recreation is embodied, effortful, and risk-sensitive, safety, facilities, and professional instruction may primarily prevent dissatisfaction, whereas relaxation, enjoyment, photography, and social interaction may generate additional experiential rewards. Linear models may therefore obscure whether these attributes function as essential conditions, proportional performance factors, or sources of unexpected delight.
2.2. Asymmetric Quality Theory and Kano Analysis
Kano’s two-dimensional quality model challenges the assumption that attribute performance and satisfaction are linearly related (Kano et al., 1984). Must-be attributes represent basic expectations whose absence produces substantial dissatisfaction, although their presence may generate little additional satisfaction. One-dimensional attributes produce greater satisfaction when provided and dissatisfaction when absent, whereas attractive attributes create disproportionate satisfaction when present but are not strongly missed when absent. Indifferent and reverse attributes have limited or potentially negative evaluative effects. Subsequent research has operationalised these asymmetric effects through Kano classification and satisfaction and dissatisfaction coefficients (Matzler & Hinterhuber, 1998; Mikulić & Prebežac, 2011). Tourism and service studies similarly show that attribute improvements and failures may produce unequal evaluative responses (Ji et al., 2024; J. M. Kim et al., 2023), making Kano analysis particularly relevant to risk-sensitive sport participation.
Previous studies have combined Schmitt’s experiential modules with Kano analysis to identify and prioritise experiential attributes in ICT-enabled services, product design, and call-centre services (Yu & Ko, 2012; Tu & Yang, 2019; Putri & Septiana, 2021). Related Kano-based experiential applications have also appeared in wine tourism and hotel service design (Rüdiger & Wegener, 2023; Chang & Chiu, 2023). These studies demonstrate that experiential marketing can provide a conceptual structure for identifying customer requirements, while Kano analysis can distinguish their satisfaction-enhancing and dissatisfaction-reducing functions.
Nevertheless, this integration remains limited in participatory sport tourism. Embodied risk, physical competence, emotional reward, and social interaction may cause experiential attributes to perform different functions from those observed in conventional products or general service settings. Applying the integrated framework to SUP therefore provides an opportunity to examine whether operational attributes function primarily as baseline conditions and whether affective and relational attributes operate more strongly as satisfaction amplifiers.
2.3. From Experiential Attribute Classification to Behavioural Outcomes
Behavioural outcomes indicate whether an experience generates value beyond immediate satisfaction. Revisit intention reflects a participant’s likelihood of returning, while recommendation intention represents willingness to advocate the experience to others (Zeithaml et al., 1996; Yoshida & James, 2010; Jia et al., 2025). Acceptable price reflects perceived monetary value and the amount considered reasonable in relation to the benefits received (Zeithaml, 1988; Dodds et al., 1991). Together, these indicators represent future participation, word-of-mouth advocacy, and price–value evaluation.
Different Kano attributes may relate to these outcomes through distinct mechanisms. The absence of safety, professional coaching, skill instruction, or basic facilities may weaken perceived reliability and discourage future participation. Conversely, relaxation, happiness, photography, cultural interpretation, and social interaction may enrich the experience and strengthen recommendation or revisit intentions. Competence-supportive attributes, such as coaching, instruction, and certification, may also enhance confidence and perceived value.
Prior integrations of experiential marketing and Kano analysis have generally focused on attribute identification, classification, and service-improvement priorities. They have rarely examined whether Schmitt-based experiential attributes and their asymmetric Kano evaluations are subsequently associated with acceptable price, revisit intention, recommendation intention, or organisational performance. Although separate research streams have linked experiential marketing to behavioural intentions and Kano attributes to willingness to pay or visit intention, these relationships have seldom been examined within a single empirical framework.
The present study therefore extends the integration of experiential marketing and Kano analysis from attribute classification to behavioural evaluation. Rather than treating Kano classification as the final outcome, it examines whether functional and dysfunctional responses, satisfaction and dissatisfaction coefficients, and broader experiential dimensions are associated with participants’ price evaluations and future behavioural intentions.
2.4. Sustainable Attribute Prioritisation, Methodological Gap, and Research Questions
Sustainable sport recreation management requires balancing experience quality, environmental responsibility, operational capacity, and economic viability (Cury et al., 2023; McCullough et al., 2020). Because financial, staffing, environmental, and infrastructural resources are limited, operators cannot improve all service attributes equally. Sustainable management therefore requires distinguishing essential attributes that prevent service failure from discretionary enhancements that generate substantial experiential and behavioural value (Trendafilova et al., 2014). Selective management may therefore be preferable to uniform service expansion, as sustainable tourism strategies can target participant segments and service configurations with stronger pro-environmental potential (Dolnicar & Leisch, 2008).
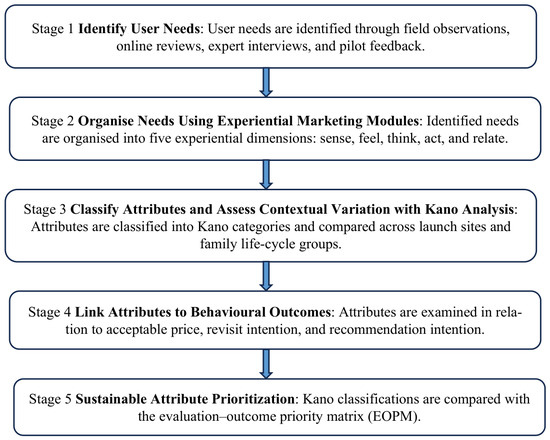
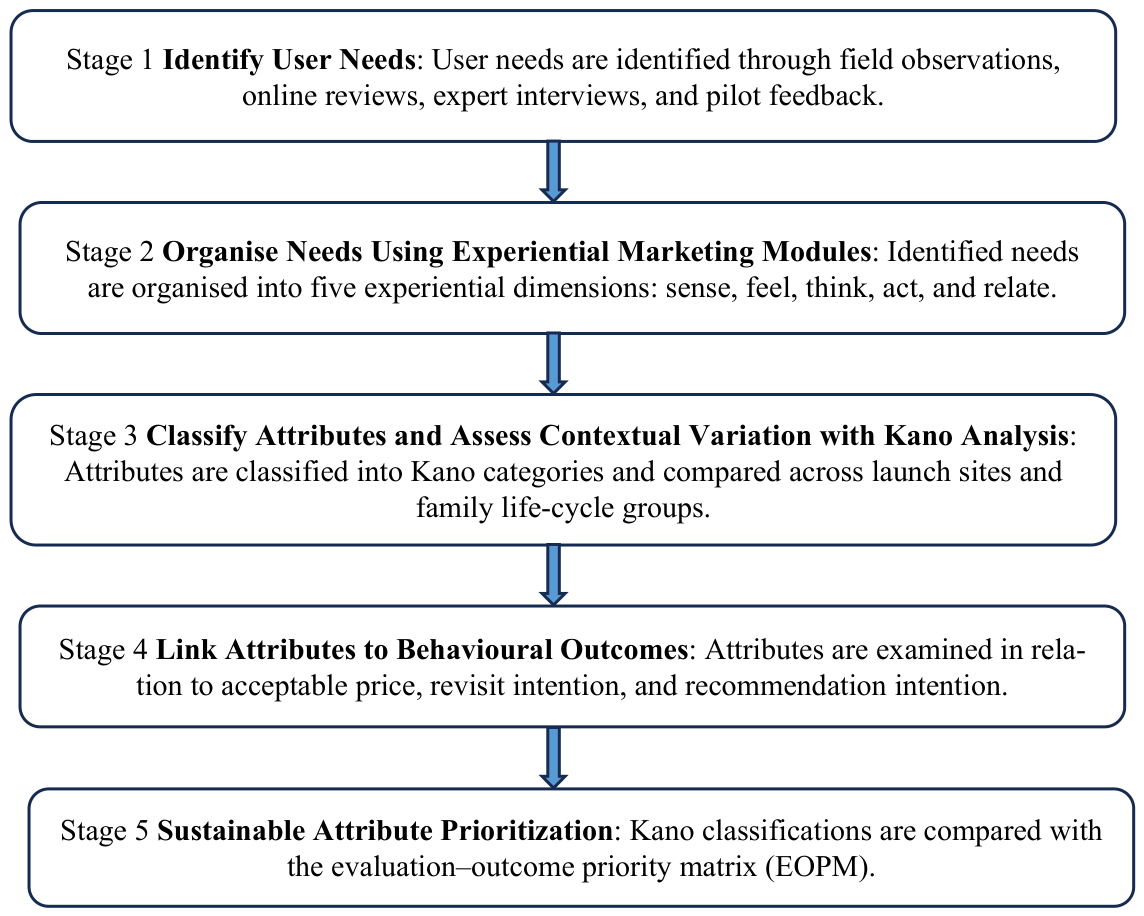
Accordingly, this study adopts a five-stage theoretical–procedural framework. User needs are first identified and organised through Schmitt’s experiential modules. Kano analysis then distinguishes baseline, performance, attractive, indifferent, and reverse attributes. These attributes are subsequently linked to acceptable price, revisit intention, and recommendation intention, before the results are integrated to establish sustainable management priorities (Figure 1).
Figure 1.
Conceptual–Procedural Framework Linking Experiential Attributes, Kano Classifications, Behavioural Outcomes, and Sustainable Prioritisation.
Three gaps motivate this framework. First, experiential marketing and asymmetric quality theory have rarely been integrated in embodied and risk-sensitive sport tourism. Second, Kano-based studies commonly conclude with attribute classification without examining downstream behavioural relevance. Third, the traditional Kano questionnaire requires paired functional and dysfunctional questions for every attribute. This structure increases questionnaire length, while the wording of hypothetical absence conditions has been criticised as ambiguous and cognitively demanding, potentially affecting response consistency and classification reliability (Mikulić & Prebežac, 2011; Song, 2018; Chapman & Callegaro, 2022). Although alternative regression- and importance-based methods have been developed, their convergence with traditional Kano classifications remains context-dependent (Chen, 2012; Slevitch, 2025).
To address the third gap, this study introduces an exploratory evaluation–outcome priority matrix (EOPM). One dimension represents participants’ evaluation of each attribute, while the other represents its derived behavioural relevance, estimated through its association with behavioral values. The matrix distinguishes strategic strengths (high evaluation–high relevance), improvement priorities (low evaluation–high relevance), maintained baselines (high evaluation–low relevance), and lower-priority attributes (low evaluation–low relevance). This approach is consistent with importance–performance and derived-importance traditions that combine attribute performance with its contribution to broader outcomes, as well as hybrid approaches that integrate Kano logic with improvement-priority analysis (Matzler et al., 2004; Deng, 2007; Tontini et al., 2014).
The EOPM is not assumed to reproduce Kano categories directly because it does not measure reactions to both attribute presence and absence. Instead, the study examines whether the two approaches generate convergent managerial priority profiles. Evidence of convergence would support the EOPM as a parsimonious screening or complementary decision architecture requiring only one attribute-evaluation item per attribute, together with shared behavioural outcome measures. It could therefore reduce respondent burden when a full paired Kano instrument is impractical, while traditional Kano analysis remains necessary for formally identifying satisfaction–dissatisfaction asymmetry and reverse attributes. Regression-based research has similarly shown that more economical data-collection designs can produce classifications broadly comparable with Kano under particular conditions, although equivalence should be empirically demonstrated rather than assumed (Chen, 2012).
Accordingly, the study addresses the following research questions (RQ) in Table 1.
Table 1.
Research Questions.
Theoretically, this study integrates experiential content, asymmetric quality functions, and downstream behavioural relevance within a single framework and extends their application to embodied and risk-sensitive sport tourism. Practically, it combines Kano analysis with the EOPM to help operators distinguish non-negotiable operational foundations from behaviourally relevant experiential enhancements under financial, operational, and environmental constraints.
3. Research Methods
This study employed a quantitatively dominant sequential mixed-method design. Practitioner interviews, field observations, and online reviews first informed the development and refinement of the questionnaire. The survey and Kano analysis constituted the primary quantitative phase, after which the qualitative evidence was used to contextualize and triangulate the quantitative findings.
3.1. Research Design and Analytical Framework
This study adopted a quantitatively dominant sequential mixed-methods design. Qualitative evidence from practitioner interviews, field observations, and online reviews informed the contextualization of SUP experiential attributes, while the questionnaire survey constituted the primary quantitative phase. Experiential marketing theory provided the conceptual structure for organizing the attributes into sense, feel, think, act, and relate dimensions, whereas Kano’s two-dimensional quality model (Kano et al., 1984) served as the analytical framework for examining asymmetric satisfaction and dissatisfaction.
The framework assumes that experiential attributes may perform different evaluative functions: some primarily prevent dissatisfaction when absent, whereas others enhance satisfaction when present (Kano et al., 1984; Matzler & Hinterhuber, 1998). Acceptable price, revisit intention, and recommendation intention were incorporated as behavioural outcomes reflecting perceived value, future participation, and word-of-mouth advocacy (Zeithaml et al., 1996; Yoshida & James, 2010; Biscaia et al., 2023; Jia et al., 2025). The proposed framework was implemented sequentially. Participant needs were first identified and organised using Schmitt’s experiential modules, after which Kano analysis was used to classify their asymmetric quality functions. The resulting attributes and coefficients were then examined in relation to behavioural outcomes to support sustainable attribute prioritisation.
3.2. Instrument Development and Measures
The instrument was developed through a multi-stage process to ensure theoretical grounding, contextual relevance, and content validity. Items were based on Schmitt’s (1999) five experiential marketing dimensions and informed by sport service research. Semi-structured interviews with four SUP operators and one certified coach, together with field observations and publicly available online reviews, were used to identify context-specific service encounters, safety concerns, facility needs, and experiential attributes.
The 15 attributes were mapped onto the five experiential dimensions. Items 1–3 represented Think through learning and cognitive interpretation; Items 4–6 represented Act through skill acquisition and participation; Items 7–9 represented Sense through sensory, tangible, and physical-comfort experiences; Items 10–12 represented Feel through perceived safety and affective responses; and Items 13–15 represented Relate through family, social, and destination connections. Shower facilities were classified under Sense because they concern physical comfort, whereas nearby tourism information was classified under Relate because it connects the SUP experience with the broader destination environment. Each attribute was measured using paired functional and dysfunctional items assessing respondents’ reactions to its presence and absence.
Three behavioural outcomes were also measured: acceptable price, revisit intention, and recommendation intention. Acceptable price referred to a two-hour SUP experience including coaching, equipment, insurance, and venue use and reflected perceived monetary value (Zeithaml, 1988; Dodds et al., 1991). Revisit and recommendation intentions were rated on 10-point scales and represented future participation and word-of-mouth advocacy (Zeithaml et al., 1996; Hosany & Witham, 2010; Yoshida & James, 2010; Jia et al., 2025). When combined as a behavioural-intention index for multivariate analysis, the two items demonstrated high internal consistency (); internal-consistency reliability was not applicable to the single-item acceptable-price measure.
Content validity was first established through literature-based item development, practitioner consultation, field observations, and online reviews. During this expert-review stage, redundant items were identified and removed, and the content coverage of the questionnaire was refined. Six participants then completed a cognitive pretest and brief follow-up interviews to assess face validity, item clarity, interpretation, and response burden; their feedback was used only to refine wording and instructions rather than to determine item inclusion.
3.3. Research Site and Sampling Procedure
Sun Moon Lake was selected because it is a prominent, eco-sensitive, and regulated water recreation destination in Taiwan, with established SUP infrastructure and designated operational zones (Ministry of Transportation and Communications, 2024; Taiwan Today, 2025; Lin, 2024). The site accommodates guided, semi-autonomous, and independent participation formats. This diversity provides an appropriate setting for examining SUP experiential attributes and behavioural evaluations.
A purposive convenience sampling approach was used to recruit individuals with prior SUP experience at Sun Moon Lake. To enhance coverage across different launch sites, the electronic questionnaire was distributed through SUP communities, social media platforms, and cooperating operators serving multiple locations between 8 and 24 May 2023. Of the 499 responses received, 49 were excluded because respondents lacked prior SUP experience at Sun Moon Lake, did not complete the questionnaire, or showed invariant response patterns, leaving 450 usable responses and a usable-response rate of 90.1% (450/499).
3.4. Data Analysis, Triangulation, and Validation
Data analysis proceeded in five stages. First, descriptive statistics were used to profile respondents and summarise the functional and dysfunctional responses to the 15 experiential attributes. Second, paired responses were classified as Attractive, One-dimensional, Must-be, Indifferent, Reverse, or Invalid using the standard Kano procedure. Satisfaction Improvement Coefficients (SIC) and Dissatisfaction Reduction Coefficients (DRC) were then calculated to estimate each attribute’s satisfaction-enhancing and dissatisfaction-reducing functions.
Third, the stability of the Kano results across launch sites and family life-cycle groups was examined by comparing SIC and absolute DRC values. Bootstrap confidence intervals based on 5000 resamples were used to evaluate selected between-group differences. Fourth, bivariate correlations examined the associations of functional and dysfunctional responses with acceptable price, revisit intention, and recommendation intention. Revisit and recommendation intentions were averaged to form a composite behavioural-intention measure (Cronbach’s α = 0.941). Exploratory factor analysis was then applied to the 15 functional attributes, followed by multiple regression models examining whether the resulting dimensions predicted behavioural intention and acceptable price after controlling for age, gender, and launch location.
Fifth, an exploratory evaluation–outcome priority matrix (EOPM) was constructed by positioning each attribute according to its mean functional evaluation and its correlation with composite behavioural intention. The overall means of the two indicators served as quadrant cutoffs for identifying strategic strengths, improvement priorities, maintained baselines, and lower-priority attributes. These priorities were subsequently compared with the Kano classifications and coefficients to assess convergence between the two approaches.
Triangulation was conducted using qualitative evidence from practitioner interviews, field observations, and online reviews (Denzin, 2017). Interviews focused on recurring service failures, safety concerns, operational issues, and experiential highlights, whereas online reviews captured spontaneous evaluations of satisfaction, dissatisfaction, recommendation, and perceived value. Integration occurred at two stages: qualitative evidence first informed questionnaire development and was later compared with the Kano results to contextualize the quantitative findings.
Validation was based on convergence across the quantitative and qualitative evidence. Attributes with high DRC values and recurring qualitative references to dissatisfaction when absent were interpreted as baseline attributes, whereas attributes with high SIC values and predominantly positive references were interpreted as satisfaction-enhancing attributes. This cross-source validation reduced reliance on a single method and strengthened the contextual credibility of the interpretation.
3.5. Ethical Considerations
Participation in this study was voluntary, and all responses were collected anonymously. Before completing the questionnaire, respondents were informed that the survey was conducted for academic research purposes and that no directly identifiable personal information would be collected. Consent to participate was implied by respondents’ voluntary completion and submission of the anonymous questionnaire.
Because the study involved a minimal-risk, non-interventional questionnaire survey, collected no directly identifiable personal data, and analysed the data only in aggregate form, formal institutional review board approval was not obtained. This treatment is consistent with Article 5 of Taiwan’s Human Subjects Research Act (Ministry of Justice, 2019) and the Ministry of Health and Welfare notice issued on 5 July 2012 (No. 1010265075), which identify certain categories of human-subject research that may be exempt from formal ethics review (Rootlaw, 2012; Taiwan Centers for Disease Control, 2012). Artificial intelligence tools were used only to assist with language refinement and manuscript editing. The study design, data collection, statistical analysis, interpretation of findings, and final scholarly judgments were conducted by the authors.
4. Results
4.1. Respondent Profile
Table 2 summarizes the respondent characteristics (N = 450). Participants were primarily aged 31–40 (39.3%), followed by 41–50 (26.7%) and ≥51 (24.4%), and were predominantly male (67.8%). Half worked in the public sector (50.0%), with others in the service industry (19.6%), manufacturing (9.3%), or freelancing (7.8%). Most held a university/college degree (60.2%) and resided in central Taiwan (80.7%). Regarding family life cycle, singles comprised the largest group (25.6%), followed by those with children aged ≥19 years (21.1%) and 6–12 years (15.3%). Crescent Bay was the most common SUP launch point (61.3%), followed by Hanbi Trail (23.8%) and Fish Harbor (8.0%).
Table 2.
Demographic Profile of Respondents.
4.2. Descriptive Responses to Kano Functional and Dysfunctional Items
4.2.1. Functional (Positive) Responses
Table 3 reports respondents’ functional (positive) reactions to 15 SUP service attributes across five experiential dimensions (Think, Act, Sense, Feel, Relate). Overall, responses clustered toward “5 = Satisfied” and “4 = Taken for granted” for most items. The highest “Satisfied” counts were observed in the Feel dimension, especially for relaxation (Item 11: 343 “Satisfied”) and happiness (Item 12: 342 “Satisfied”), followed by perceived safety (Item 10: 309 “Satisfied”). Several Act and Sense items also received high satisfaction, including learning SUP techniques (Item 4: 326 “Satisfied”), shower facilities (Item 9: 326 “Satisfied”), and photo-taking service (Item 8: 300 “Satisfied”). In contrast, music in the preparation area (Item 7) showed greater dispersion across response categories than most other items.
Table 3.
Results of Positive Phrasing of the Items.
4.2.2. Dysfunctional (Negative) Responses
Table 4 reports respondents’ dysfunctional (negative) reactions to the absence of each attribute. The largest dissatisfaction counts (i.e., “1 = Dissatisfied”) appeared for safety (Item 10: 257 “Dissatisfied”) and shower facilities (Item 9: 248 “Dissatisfied”). High dissatisfaction was also observed for learning SUP techniques (Item 4: 215 “Dissatisfied”) and professional coaching (Item 1: 212 “Dissatisfied”). By comparison, the absence of music in the preparation area (Item 7) and cultural interpretation (Item 3) elicited relatively more neutral and tolerable responses, indicating weaker absence sensitivity than the safety- and facility-related attributes.
Table 4.
Results of Negative Phrasing of the Items.
4.2.3. Functional vs. Dysfunctional Contrast
Across items, functional responses indicated generally high evaluations when attributes were present (Table 2), whereas dysfunctional responses showed that certain attributes triggered substantially stronger negative reactions when absent (Table 3). The strongest absence sensitivity was concentrated in safety assurance and basic facilities (Items 10 and 9), followed by instruction- and coaching-related items (Items 4 and 1). This contrast suggests an emerging asymmetric pattern, in which safety and facility-related attributes function as baseline stability conditions, while affective outcomes operate as high-impact satisfaction amplifiers.
4.3. Kano Classification and Coefficient Analysis
4.3.1. Kano Classification Outcomes
Following the Kano classification procedure (Table 5), each attribute was categorized based on paired functional–dysfunctional responses. Table 6 displays the classification percentages for all 15 items across the five Kano categories (Attractive, One-dimensional, Must-be, Indifferent, and Reverse), along with their corresponding Satisfaction Improvement Coefficients (SIC) and Dissatisfaction Reduction Coefficients (DRC) (Matzler & Hinterhuber, 1998). The SIC is calculated as (Attractive + One-dimensional)/(Attractive + One-dimensional + Must-be + Indifferent), while the DRC is computed as (One-dimensional + Must-be)/(Attractive + One-dimensional + Must-be + Indifferent) × (−1). Across items, many attributes were primarily classified as Attractive and One-dimensional. For example, social connection (Item 15) showed the highest Attractive proportion (45.3%), and nearby tourism information (Item 14) also showed a high Attractive proportion (39.3%). Several operational/functional items showed relatively high One-dimensional proportions, including shower facilities (Item 9: 42.2% One-dimensional) and safety during the activity (Item 10: 40.2% One-dimensional).
Table 5.
Classification Table.
Table 6.
Classification Results.
4.3.2. Satisfaction Improvement (SIC) and Dissatisfaction Reduction (DRC) Patterns
SIC values were consistently moderate-to-high across the 15 attributes (range: 0.575–0.749), indicating that the presence of these attributes was associated with meaningful satisfaction gains (Table 5). The highest SIC values were observed for relaxation (Item 11: SIC = 0.749) and happiness (Item 12: SIC = 0.744), followed by several Relate items (e.g., Item 15: SIC = 0.721; Item 13: SIC = 0.717) (Table 5). In contrast, the lowest SIC values were observed for music in the preparation area (Item 7: SIC = 0.575) and cultural interpretation about Sun Moon Lake (Item 3: SIC = 0.579), suggesting that while these features contribute positively to the overall experience, their marginal impact on satisfaction enhancement is comparatively limited relative to affective and relational attributes.
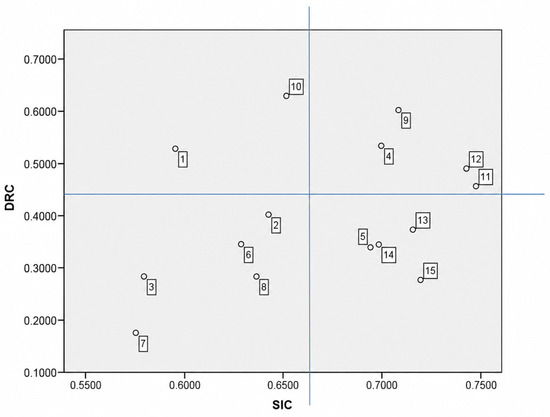
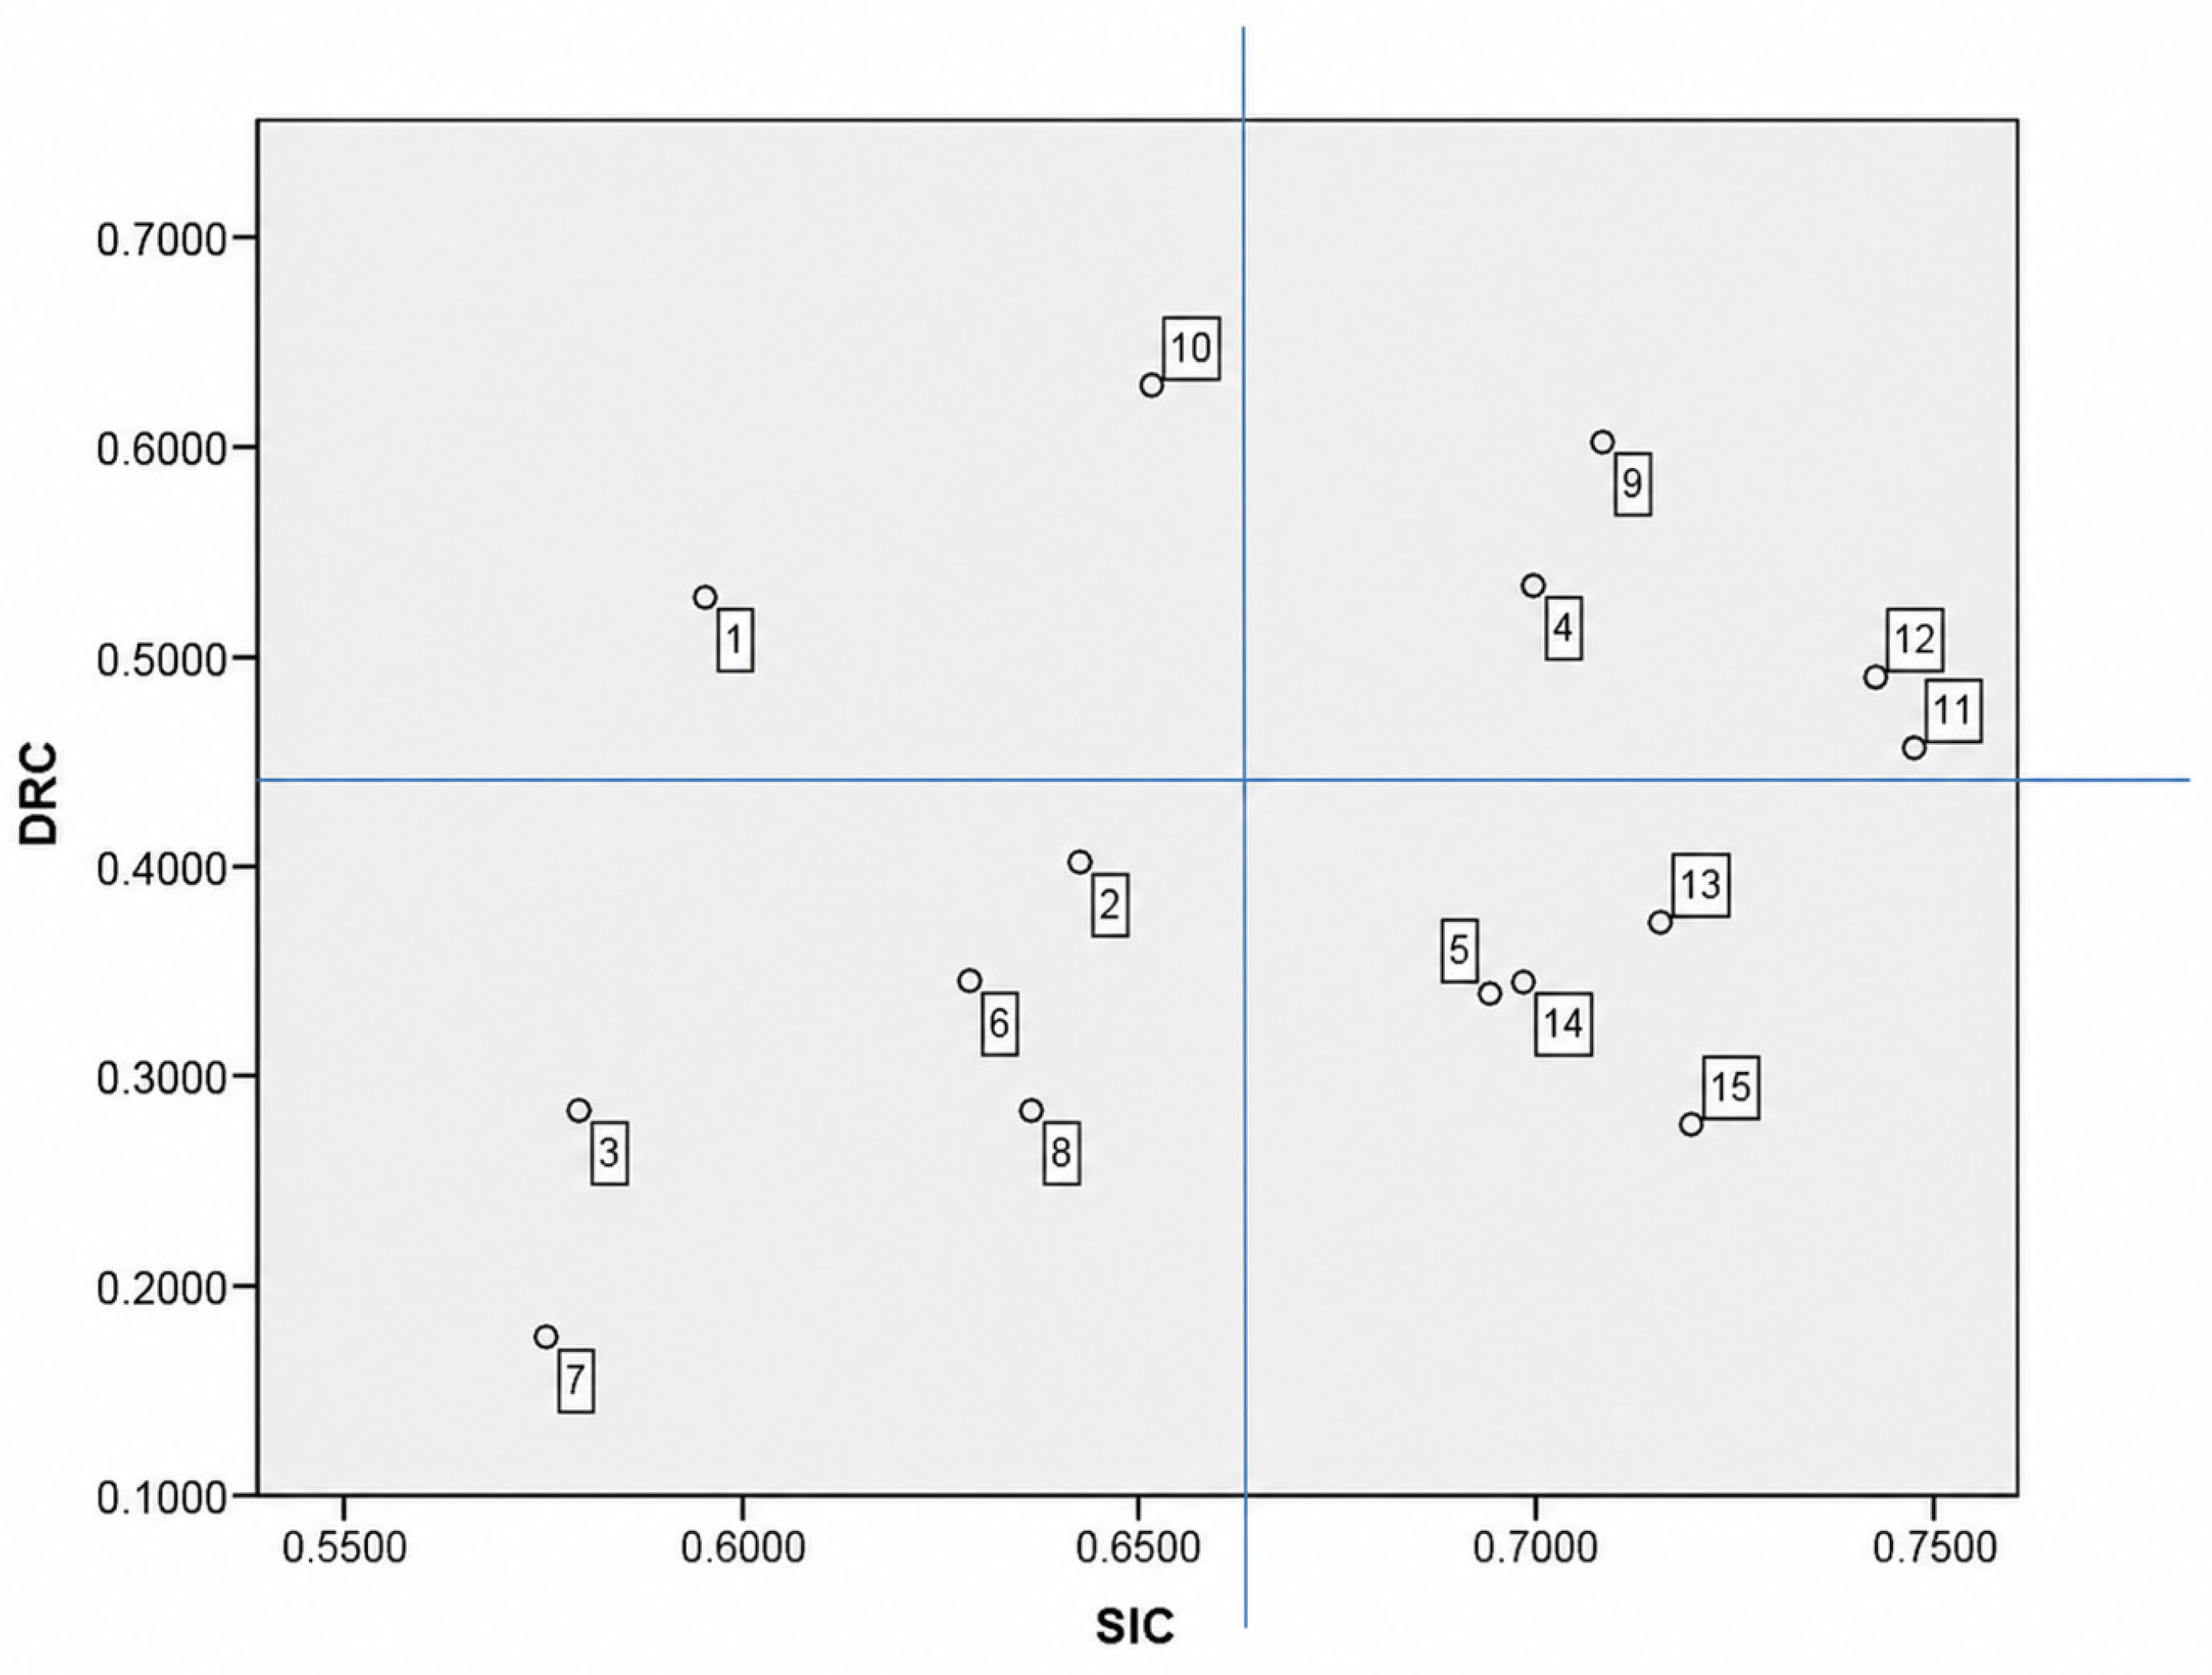
DRC values (negative) indicate the magnitude of dissatisfaction associated with attribute absence. The largest absolute DRC values were observed for safety (Item 10: DRC = −0.636) and shower facilities (Item 9: DRC = −0.607), followed by learning techniques (Item 4: DRC = −0.535) and professional coaching (Item 1: DRC = −0.528) (Table 6). In contrast, music in the preparation area (Item 7: DRC = −0.170) showed comparatively smaller absolute DRC values. Figure 2 visualizes the joint SIC–DRC positioning of all items.
Figure 2.
Scatter Plot of Dissatisfaction Reduction and Satisfaction Improvement Coefficients. Note: Item numbers presented in this figure correspond to the items listed in Table 5.
4.4. Subgroup Comparisons
4.4.1. Crescent Bay Versus Hanbi Trail
A site-based comparison was conducted between respondents who selected Crescent Bay as their only SUP launch point (n = 227) and those who selected Hanbi Trail (n = 107), using the same Kano-based indicators (Table 7). Overall, both sites showed broadly similar structural patterns, with most attributes positioned within the Attractive and One-dimensional regions. Descriptively, Crescent Bay showed higher SIC point estimates than Hanbi Trail for nearly all items, suggesting a possible tendency toward greater satisfaction gains when these attributes were provided. Crescent Bay also generally showed larger absolute DRC point estimates, suggesting a potentially stronger dissatisfaction response when attributes were absent. The largest between-site gaps in absolute DRC were observed for relaxation (Item 11: ), happiness (Item 12: ), and photo-taking service (Item 8: ). Bootstrap analyses with 5000 resamples supported a significant difference only for photo-taking service (95% CI [0.009, 0.195]); the differences for relaxation (95% CI [−0.001, 0.231]) and happiness (95% CI [−0.002, 0.232]) remained exploratory because their confidence intervals included zero.
Table 7.
Comparison of SIC and DRC between Crescent Bay and Hanbi Trail.
4.4.2. Family Life-Cycle Segmentation
A family life-cycle analysis compared four groups (single, n = 115; child 0–5, n = 86; child 6–18, n = 113; child ≥19, n = 95) using SIC and absolute DRC values (Table 8). Across segments, SIC values remained consistently high for affective attributes (e.g., item 11 relaxation, item 12 happiness) and several activity and relational items. Descriptively, the child 0–5 group showed absolute DRC values exceeding SIC for shower facilities (Item 9) and safety (Item 10), suggesting greater sensitivity to their absence and a possible baseline role for these attributes among households with young children.
Table 8.
Comparison of SIC and DRC across Family Life-Cycle Segments.
For cultural interpretation (Item 3), the child 6–18 group showed the largest SIC– gap (0.404), while the child ≥19 group showed the largest gap for fun activities (Item 5; 0.458) and the highest SIC for social connection (Item 15; 0.763). Because bootstrap comparisons did not support significant between-group differences for Items 3 and 5, these patterns should be interpreted as exploratory tendencies toward greater satisfaction-enhancing potential among the respective groups. For Item 13 (parent–child activity space), singles showed lower dissatisfaction sensitivity () than respondents with children aged 0–5 years (); a 5000-resample bootstrap confirmed this difference (, 95% CI [0.007, 0.285]). Consistent with nomological validity expectations, the child 6–18 group also recorded the highest SIC (0.774), suggesting greater salience of parent–child space among families with children.
The child ≥19 group also showed the highest SIC point estimates for professional coaching (Item 1; 0.663) and certification (Item 6; 0.700). However, only the certification difference between the child ≥19 and child 0–5 groups was statistically supported (, 95% CI [0.013, 0.312]); the remaining differences were descriptive. Overall, these results suggest that asymmetric attribute evaluations may vary across family life-cycle stages, although most subgroup patterns remain exploratory.
4.5. Behavioural Outcomes: Acceptable Price, Revisit Intention, and Recommendation Intention
Acceptable price was negatively associated with several Kano dysfunctional responses, indicating that respondents accepting higher prices were more sensitive to the absence of professional coaching (item 1), health-related learning (item 2), skill instruction (item 4), fun activities (item 5), certification (item 6), photography services (item 8), and safety (item 10) (Table 8). These attributes may therefore represent stronger quality expectations among participants with higher willingness to pay. All functional responses were positively associated with revisit and recommendation intentions. Revisit intention showed the strongest associations with professional coaching and safety, whereas recommendation intention was most strongly associated with professional coaching and skill instruction (Table 9).
Table 9.
Correlation Coefficients Between Kano Attribute Responses and Acceptable Price, Revisit Intention, and Recommendation Intention.
Exploratory factor analysis of the 15 functional attributes identified two dimensions: experiential and relational enhancement and operational and competence support. After controlling for age, gender, and launch location, both dimensions significantly predicted the combined behavioural-intention measure ( and , respectively), with the model explaining 18.2% of the adjusted variance. Separate regression models produced substantively similar results for revisit intention (experiential–relational enhancement: β = 0.173, p = 0.004; operational–competence support: β = 0.294, p < 0.001; adjusted R2 = 17.6%) and recommendation intention (β = 0.167 and 0.287, respectively; adjusted R2 = 16.9%). In contrast, the multivariate model predicting acceptable price was not statistically significant.
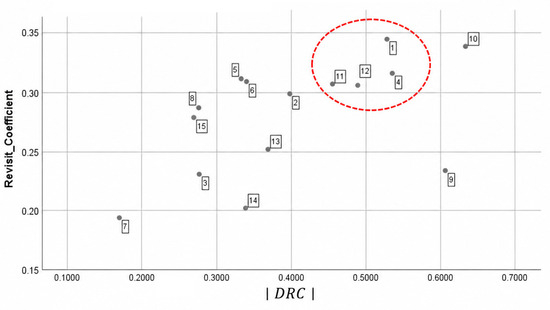
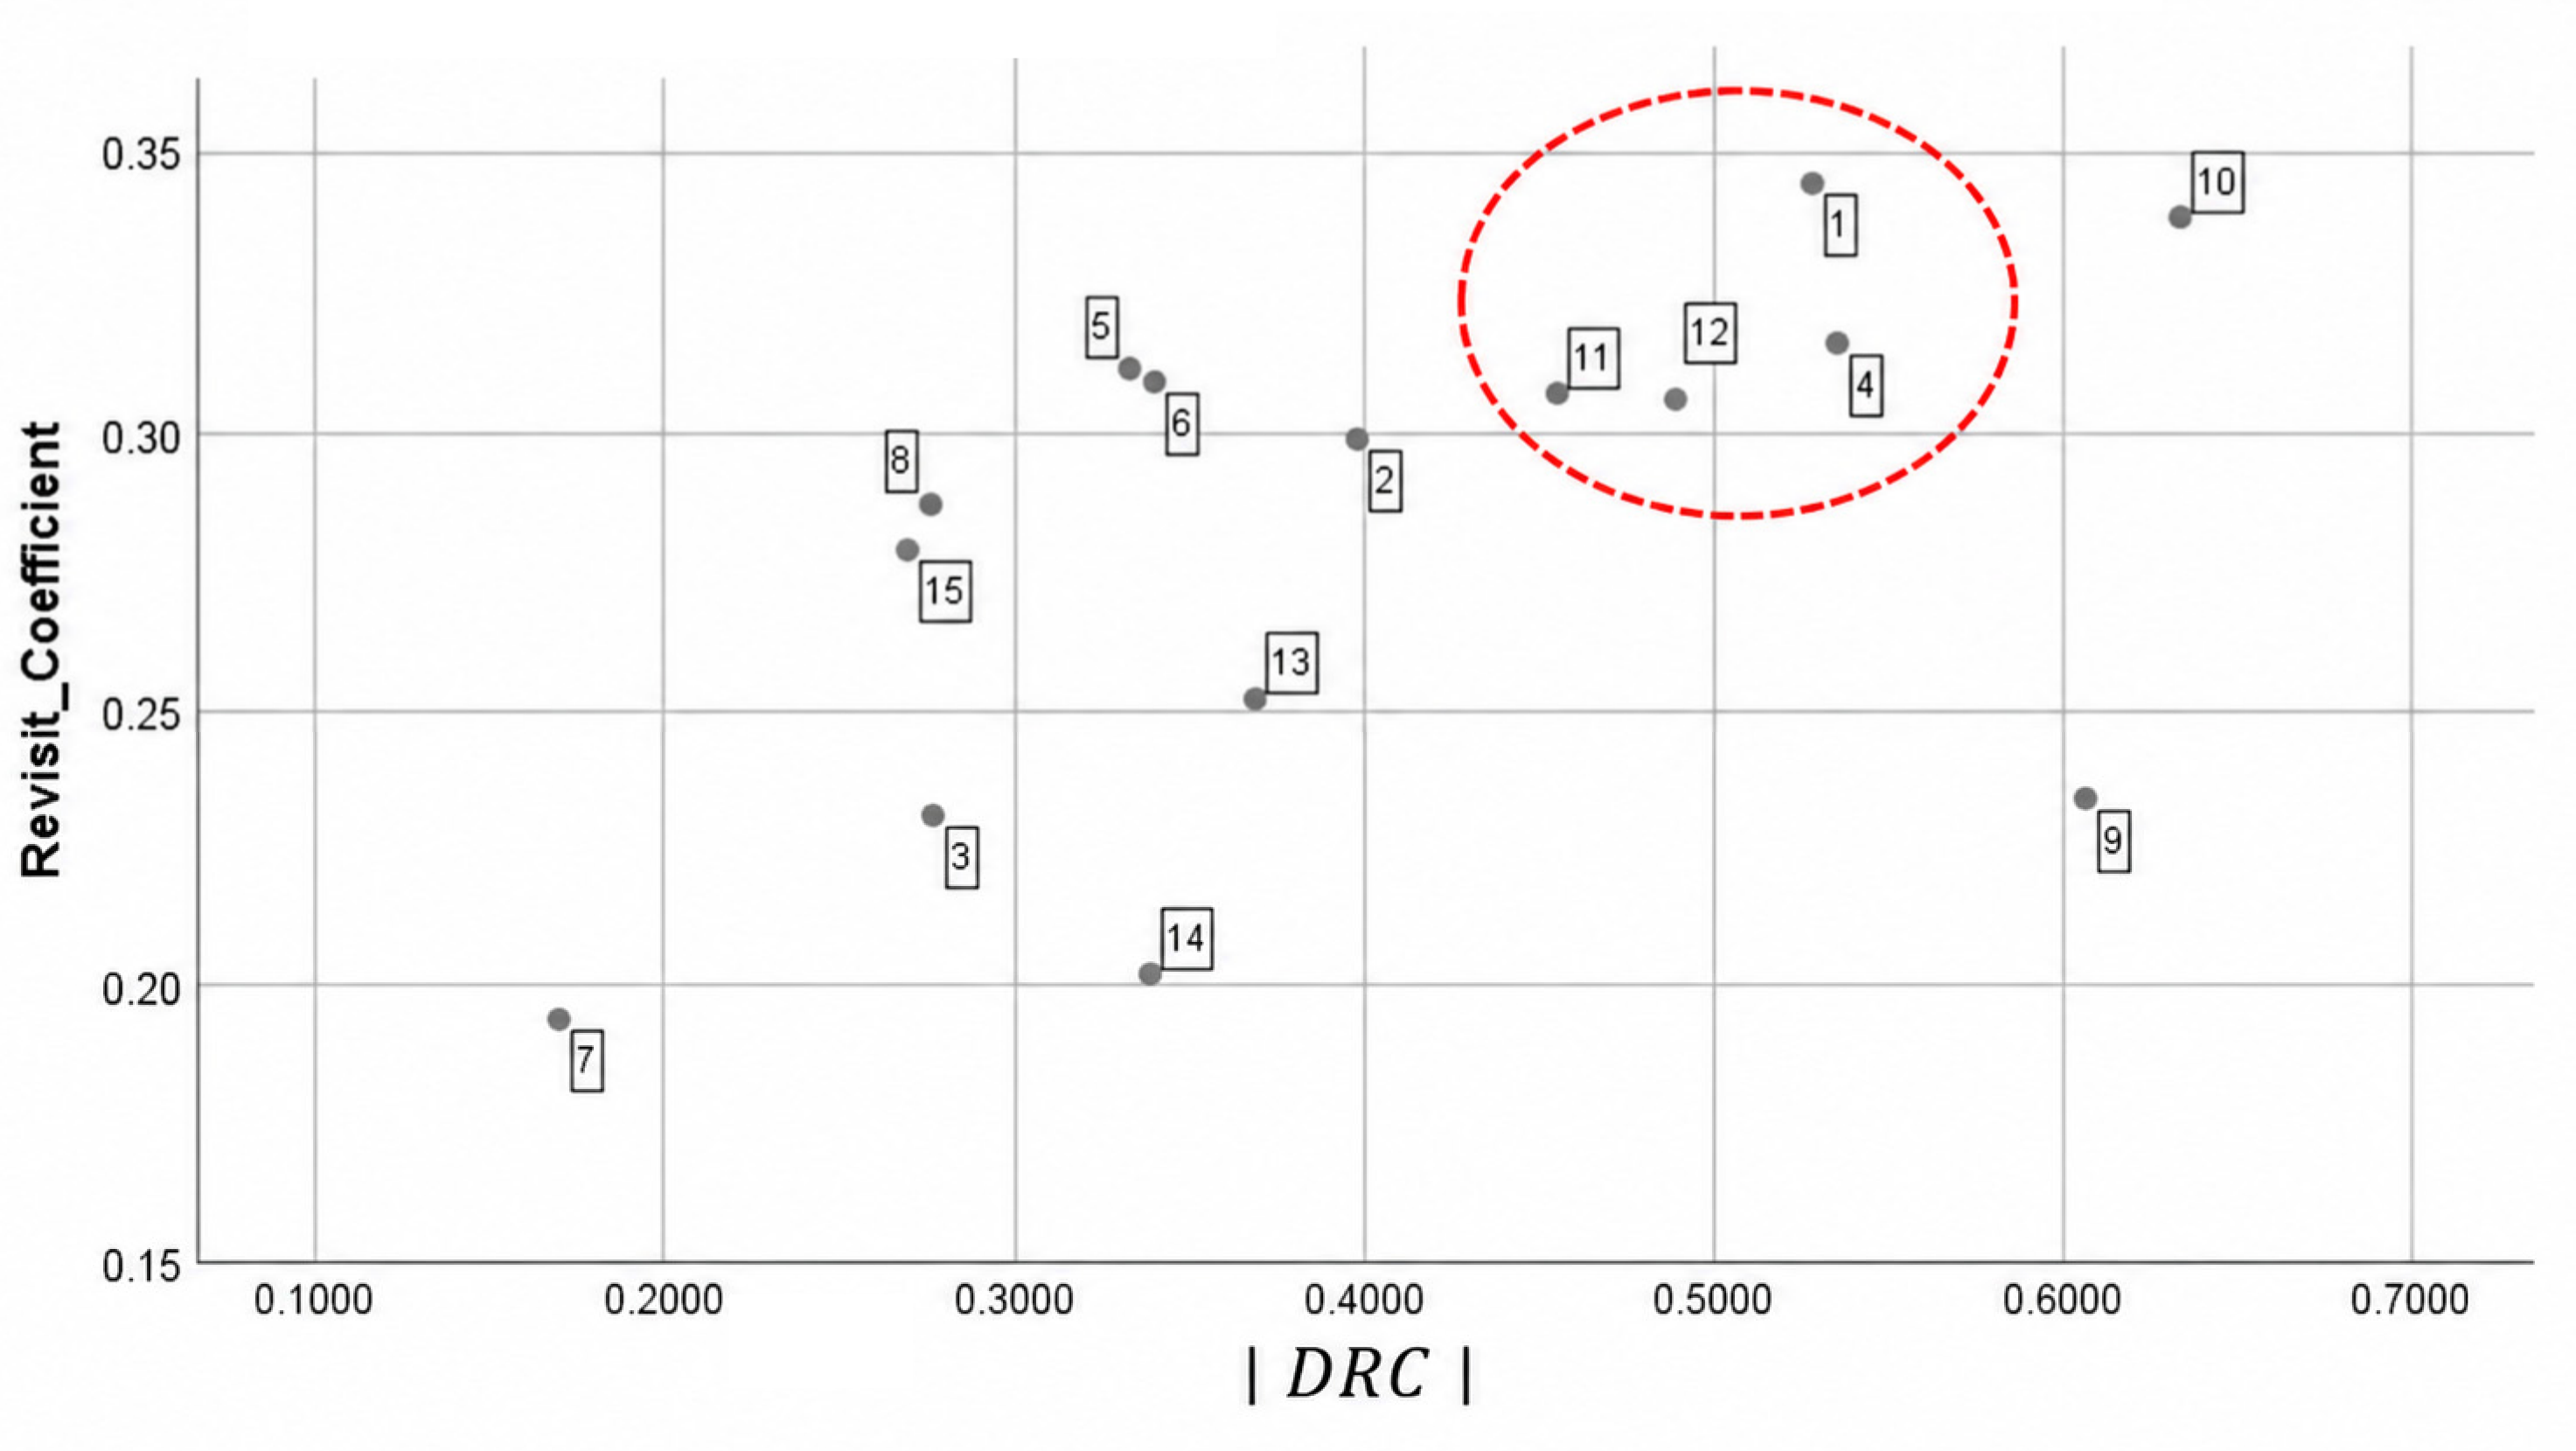
An exploratory attribute-level analysis further showed that absolute DRC values were positively associated with the strength of the functional-response correlations with revisit intention () (Figure 3). Safety (item 10) showed both a high and a relatively strong association with revisit intention, whereas shower facilities (item 9) showed a high but a weaker behavioural association. Professional coaching (item 1), skill instruction (item 4), relaxation (item 11), and happiness (item 12) also combined relatively high values with stronger revisit associations, while music (item 7) showed low values on both indicators. These patterns suggest that dissatisfaction sensitivity and behavioural relevance overlap for some, but not all, SUP attributes.
Figure 3.
Scatter Plot of Values and Correlations Between Kano Functional Responses and Revisit Intention. Note: Item numbers presented in this figure correspond to the items listed in Table 5.
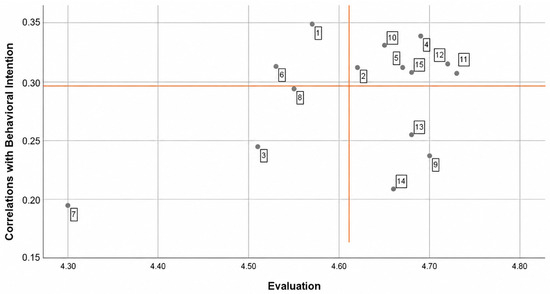
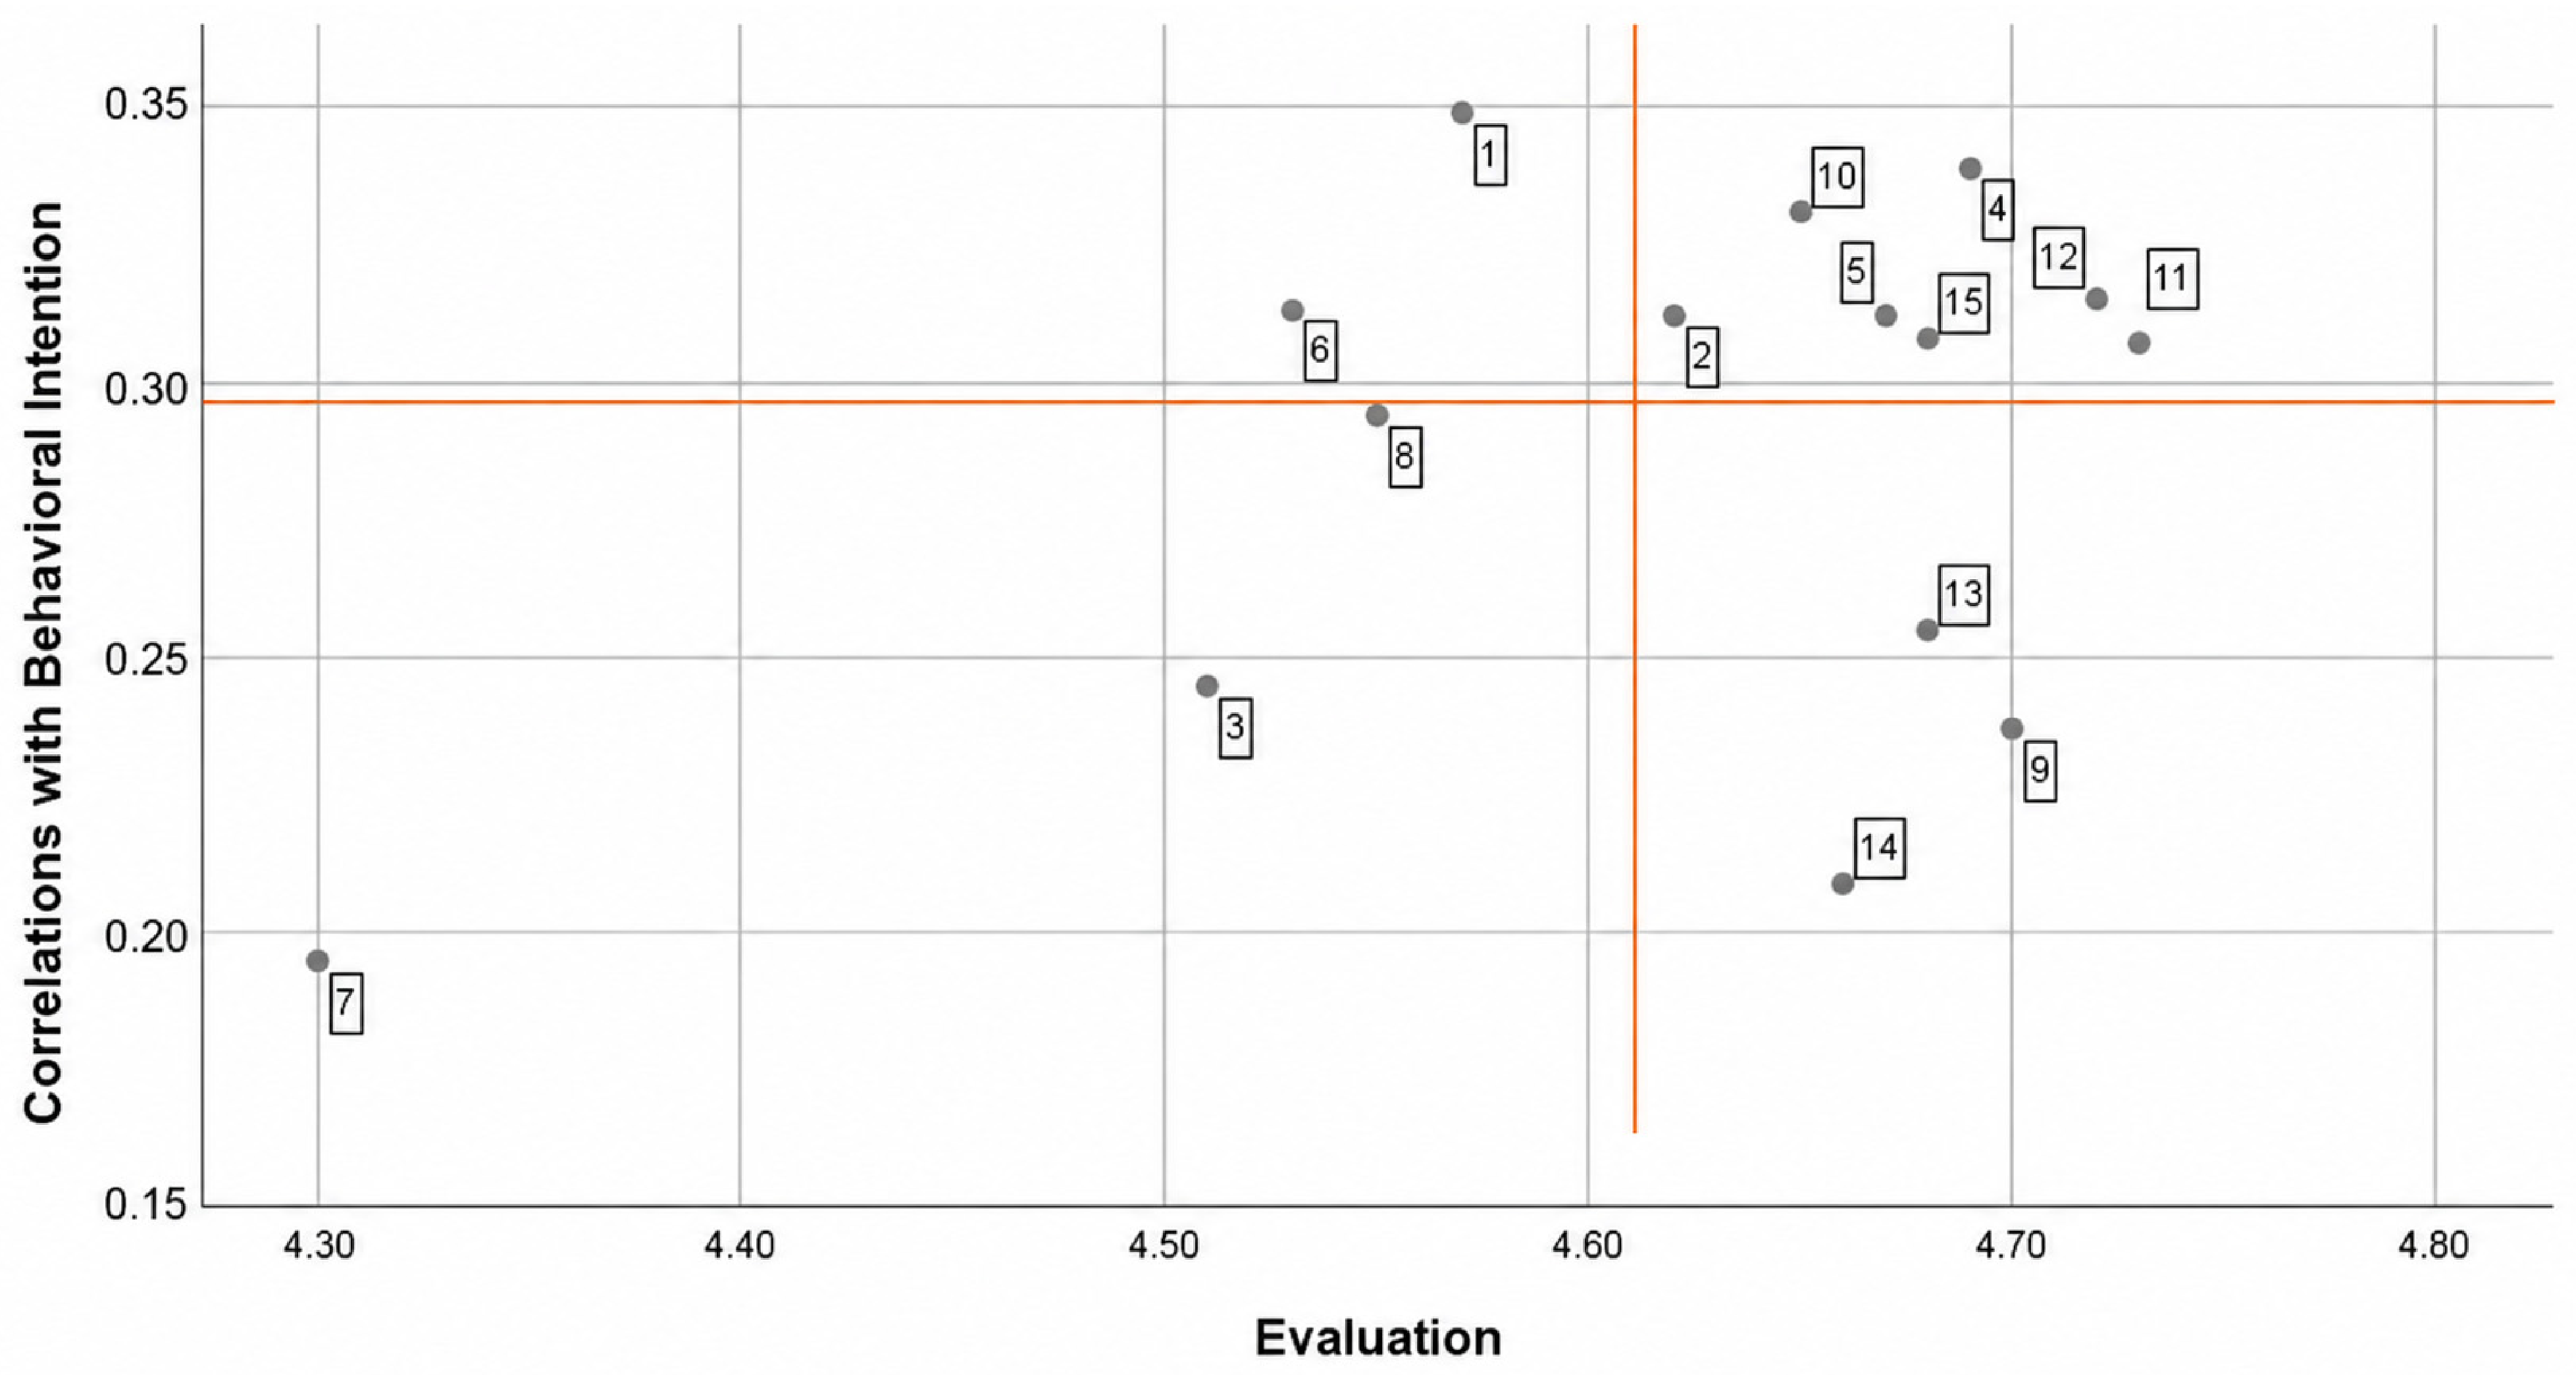
Finally, an exploratory evaluation–outcome priority matrix (EOPM) was constructed using each attribute’s mean evaluation score from Table 3 and its correlation with behavioral intention from Table 9. Behavioral intention was calculated by averaging revisit and recommendation intentions (Cronbach’s α = 0.941). The overall mean evaluation (M = 4.62) and mean correlation (r = 0.288) served as quadrant cutoffs. Strategic strengths included Items 2, 4, 5, 10, 11, 12, and 15; improvement priorities included Items 1, 6, and 8; maintained baselines included Items 9, 13, and 14; and lower-priority attributes included Items 3 and 7 (Figure 4). The matrix therefore identifies attributes that should be strengthened, maintained, or assigned lower managerial priority.
Figure 4.
Scatter Plot of Evaluation and its Correlations with Behavioral Intention. Note: Item numbers presented in this figure correspond to the items listed in Table 5. The intersection of the two red lines represents the mean values of the two axes (4.617, 0.288).
5. Discussion
5.1. Asymmetric Experiential Functions in SUP Participation
The findings extend Kano’s asymmetric quality logic to embodied and risk-sensitive sport tourism. Safety, professional coaching, skill instruction, and shower facilities appear to function as operational foundations because they reduce uncertainty, support physical competence, and maintain minimum service reliability. Their presence may therefore be taken for granted, whereas the observed responses to their absence are consistent with lower perceived control and stronger dissatisfaction (Kano et al., 1984; Matzler & Hinterhuber, 1998). This interpretation is consistent with adventure tourism research identifying risk perception and competence as central to the evaluation of active outdoor experiences (Buckley, 2012; Pomfret & Bramwell, 2016).
Affective and relational attributes perform a different theoretical function. Relaxation, happiness, photography, and social interaction add psychological, symbolic, and interpersonal value beyond adequate service delivery. Because these benefits are not necessarily expected as minimum conditions, their presence can elevate an acceptable activity into a memorable experience, consistent with experiential marketing and leisure satisfaction theory (Schmitt, 1999; Beard & Ragheb, 1980; Hosany & Witham, 2010). Importantly, experiential domains are not inherently attractive or must-be: safety and happiness both belong broadly to the affective domain, yet safety primarily reduces dissatisfaction, whereas happiness amplifies satisfaction. Thus, Kano analysis extends Schmitt’s framework by explaining how, rather than merely what, experiential attributes contribute to participant evaluation.
5.2. Behavioural Relevance and Priority Convergence
The behavioural findings suggest that favourable intentions are associated with three complementary mechanisms: risk reduction, competence support, and experiential reward. Safety and professional guidance may encourage revisit intention by increasing confidence in future participation, whereas skill development, relaxation, and social value may strengthen recommendation by making the experience more meaningful and communicable. These mechanisms extend satisfaction research by showing that operational reliability and experiential enrichment represent complementary pathways to behavioural intention rather than competing explanations.
Acceptable price reflects a different evaluative process. Participants accepting higher prices were more sensitive to the absence of several service and experiential attributes, suggesting that price tolerance may be accompanied by stronger expectations of quality and completeness. This is consistent with perceived-value theory, in which value reflects the balance between received benefits and monetary sacrifice (Zeithaml, 1988; Dodds et al., 1991). However, because the multivariate price model was not significant, the results indicate quality expectations rather than evidence that individual attributes causally increase willingness to pay.
Kano analysis and the EOPM therefore provide complementary forms of explanation. Kano identifies whether an attribute primarily prevents dissatisfaction or enhances satisfaction, whereas the EOPM evaluates whether its current performance and behavioural relevance justify managerial attention. For example, professional coaching emerged as an improvement priority because relatively weaker evaluations coincided with strong dissatisfaction sensitivity and behavioural relevance. In contrast, shower facilities functioned as a maintained baseline: they were necessary for preventing dissatisfaction but were not a major source of behavioural motivation.
5.3. Triangulated and Contextual Interpretation
The qualitative evidence clarifies the mechanisms underlying these asymmetric patterns. Complaints about inadequate supervision, unclear instruction, delays, and insufficient facilities were consistent with negative emotional spillover linked to weakened trust and perceived reliability. Conversely, photography, scenic interpretation, supportive instructor interaction, relaxation, and enjoyment were described mainly as memorable enhancements rather than minimum expectations.
Triangulation does not require exact agreement across methods. Cultural interpretation, for example, occupied a relatively low aggregate EOPM position but appeared positively in qualitative narratives. This divergence suggests that attributes with limited population-level behavioural relevance may still provide substantial value for particular participant segments or participation contexts. The qualitative evidence therefore contextualises, rather than merely confirms, the quantitative classifications.
5.4. Theoretical and Managerial Implications
The central theoretical contribution lies in assigning experiential marketing and Kano theory distinct but connected roles. Schmitt’s framework structures the sensory, affective, cognitive, behavioural, and relational content of SUP participation, while Kano theory explains the asymmetric evaluative function of individual attributes. Linking these functions to behavioural outcomes further extends the framework from a taxonomy of experience to an explanation of how experiential attributes become behaviourally consequential.
Managerially, the findings support a staged allocation strategy. Operators should first establish documented minimum protocols for participant screening, weather and water-condition checks, equipment inspection, pre-activity safety briefings, emergency communication, and instructor-competency verification. Investment should then prioritise equipment reliability, instructional quality, safety management, and essential facilities, followed by improvement of professional coaching and other attributes that combine relatively weaker evaluations with stronger behavioural relevance. Pricing packages may reflect this hierarchy: a standard package should include coaching, equipment, insurance, safety procedures, and essential facilities, whereas optional or premium packages may add photography, small-group instruction, guided interpretation, or social activities. Because the multivariate price model was not significant, these package designs should be treated as managerial options requiring further market testing rather than as evidence that particular attributes causally increase willingness to pay.
Although green marketing was not directly examined in this study, operators may also communicate verified low-impact practices through package descriptions, booking platforms, and pre-activity information. Previous research suggests that green marketing, branding, and sustainability communication may shape consumer attitudes and eco-friendly behavioural responses, particularly when environmental claims are credible and aligned with actual organisational and regulatory practices (Abel & Kenechukwu, 2024; Hwang, 2024; Šagovnović & Stamenković, 2023). Such communication could highlight waste-reduction practices, environmental guidance, appropriate group sizes, and compliance with water-recreation regulations.
6. Conclusions and Future Research
6.1. Conclusions
This study developed a theoretical–procedural approach to sustainable attribute prioritisation by integrating Schmitt’s experiential modules, Kano’s asymmetric quality model, behavioural outcomes, and an evaluation–outcome priority matrix. The findings indicate that safety, coaching, skill instruction, and shower facilities primarily reduce dissatisfaction, whereas relaxation, happiness, and social connection more strongly enhance satisfaction. Both operational–competence support and experiential–relational enhancement were associated with revisit and recommendation intentions, while price-related results primarily reflected stronger expectations among respondents accepting higher prices.
The study’s central contribution lies in connecting experiential content, asymmetric evaluative function, and behavioural relevance within one framework. Kano analysis and the EOPM generated partially convergent but conceptually distinct priority profiles, suggesting that they can jointly support more behaviourally grounded and resource-conscious service decisions. Overall, sustainable SUP management requires securing non-negotiable operational foundations while selectively developing experiential attributes that strengthen participant value and favourable behavioural intentions.
6.2. Limitations and Future Research
Several limitations warrant consideration. The purposive convenience sample was concentrated among public-sector employees and residents of central Taiwan, and the 2023 data may not fully represent more recent or geographically diverse SUP participants. Future studies could employ broader regional and occupational samples, stratified or quota-based recruitment, and updated data collection.
The cross-sectional and self-reported measures also limit conclusions regarding temporal change and actual behaviour. Longitudinal designs, real-time experience assessment, booking or revisit records, online recommendation behaviour, and willingness-to-pay experiments could provide stronger behavioural evidence. Future research should also test the stability of the EOPM cutoffs, compare its classifications with Kano results in other sport and tourism contexts, and examine whether questionable or invalid Kano responses reflect response error, tolerance, involvement, or holistic experience evaluations. Moreover, the single-destination design limits the transferability of the findings to SUP settings with different environmental, regulatory, and service conditions.
Author Contributions
Conceptualization, L.-S.G., J.-L.H., W.-S.L., H.-Y.C. and J.-C.H.; methodology, L.-S.G. and H.-Y.C.; software, L.-S.G. and W.-S.L.; validation, L.-S.G., J.-L.H., H.-Y.C. and J.-C.H.; formal analysis, L.-S.G., J.-L.H. and W.-S.L.; investigation, W.-S.L.; resources, L.-S.G., J.-L.H. and W.-S.L.; data curation, L.-S.G., J.-L.H. and W.-S.L.; writing—original draft preparation, L.-S.G. and W.-S.L.; writing—review and editing, L.-S.G., J.-L.H., H.-Y.C. and J.-C.H.; visualization, L.-S.G. and J.-L.H.; supervision, L.-S.G., H.-Y.C. and J.-C.H.; project administration, L.-S.G., J.-L.H. and W.-S.L.; funding acquisition, L.-S.G. and J.-L.H. All authors have read and agreed to the published version of the manuscript.
Funding
This research received no external funding.
Institutional Review Board Statement
Ethical review and approval were waived for this study because the study involved a minimal-risk, non-interventional anonymous questionnaire survey that collected no directly identifiable personal data, and the data were analyzed only in aggregate form. This treatment is consistent with Article 5 of Taiwan’s Human Subjects Research Act (Ministry of Justice, 2 January 2019) and the Ministry of Health and Welfare notice issued on 5 July 2012 (No. 1010265075), which identify certain categories of human-subject research that may be exempt from formal ethics review (Rootlaw, 2012; Taiwan Centers for Disease Control, 2012).
Informed Consent Statement
Informed consent was obtained from all subjects involved in the study.
Data Availability Statement
The data presented in this study are available on request from the corresponding author due to privacy and ethical restrictions.
Conflicts of Interest
The authors declare no conflict of interest.
References
- Abel, C. E., & Kenechukwu, C. G. (2024). Green marketing and sustainability: A critical review of environmental, consumer, corporate, and regulatory perspectives. Preprints. [Google Scholar] [CrossRef] [Scilit]
- Ahn, B. (2025). Effect of leisure activity participation on leisure attitude, recreational specialization, leisure satisfaction, and intention to re-participate in South Korea. Behavioral Sciences, 15(3), 372. [Google Scholar] [CrossRef] [Scilit] [PubMed]
- Beard, J. G., & Ragheb, M. G. (1980). Measuring leisure satisfaction. Journal of Leisure Research, 12(1), 20–33. [Google Scholar] [CrossRef] [Scilit]
- Biscaia, R., Yoshida, M., & Kim, Y. (2023). Service quality and its effects on consumer outcomes: A meta-analytic review in spectator sport. European Sport Management Quarterly, 23(3), 897–921. [Google Scholar] [CrossRef] [Scilit]
- Buckley, R. (2012). Rush as a key motivation in skilled adventure tourism: Resolving the risk recreation paradox. Tourism Management, 33(4), 961–970. [Google Scholar] [CrossRef] [Scilit]
- Chang, T. Y., & Chiu, Y. C. (2023). Exploiting service design in service quality: Escorting the customer’s experiential value in the journey of a star-rated hotel. Systems, 11(4), 206. [Google Scholar] [CrossRef] [Scilit]
- Chapman, C., & Callegaro, M. (2022). Kano analysis: A critical survey science review. In Proceedings of the 2022 sawtooth software conference (pp. 25–44). Sawtooth Software. Available online: https://research.google/pubs/kano-analysis-a-critical-survey-science-review/ (accessed on 2 August 2026).
- Chen, L. F. (2012). A novel approach to regression analysis for the classification of quality attributes in the Kano model: An empirical test in the food and beverage industry. Omega, 40(5), 651–659. [Google Scholar] [CrossRef] [Scilit]
- Cury, R., Kennelly, M., & Howes, M. (2023). Environmental sustainability in sport: A systematic literature review. European Sport Management Quarterly, 23(1), 13–37. [Google Scholar] [CrossRef] [Scilit]
- Deng, W. (2007). Using a revised importance–performance analysis approach: The case of Taiwanese hot springs tourism. Tourism Management, 28(5), 1274–1284. [Google Scholar] [CrossRef] [Scilit]
- Denzin, N. K. (2017). The research act: A theoretical introduction to sociological methods. Routledge. [Google Scholar]
- Dodds, W. B., Monroe, K. B., & Grewal, D. (1991). Effects of price, brand, and store information on buyers’ product evaluations. Journal of Marketing Research, 28(3), 307–319. [Google Scholar] [CrossRef] [Scilit]
- Dolnicar, S., & Leisch, F. (2008). Selective marketing for environmentally sustainable tourism. Tourism Management, 29(4), 672–680. [Google Scholar] [CrossRef] [Scilit]
- Hong, S., & Lee, Y. (2023). Analysis of the impact of SUP activities on the natural environment and psychological well-being of adolescents. Journal of Korean Leisure Sciences, 14(3), 73–83. [Google Scholar] [CrossRef] [Scilit]
- Hosany, S., & Witham, M. (2010). Dimensions of cruisers’ experiences, satisfaction, and intention to recommend. Journal of Travel Research, 49(3), 351–364. [Google Scholar] [CrossRef] [Scilit]
- Hwang, J. (2024). Green marketing and consumer attitudes. Open Access Research Journal of Multidisciplinary Studies, 8(2), 076–084. [Google Scholar] [CrossRef] [Scilit]
- Ji, G. M., Ng, S. I., Cheah, J. H., & Choo, W. C. (2024). Understanding asymmetric effects of attribute performance on tourist satisfaction with island tourism using user-generated data. Journal of Hospitality and Tourism Insights, 7(5), 2704–2722. [Google Scholar] [CrossRef] [Scilit]
- Jia, H., Kim, D., & Kim, K. (2025). Verification of the impact of sports event service quality and host destination image on sports tourists’ behavioral intentions through meta-analytic structural equation modeling. Behavioral Sciences, 15(8), 1019. [Google Scholar] [CrossRef] [Scilit] [PubMed]
- Jiang, X., Mastromartino, B., Li, X., & Zhang, J. J. (2025). Value co-creation in participatory sports event tourism: A mixed methods study. Behavioral Sciences, 15(3), 368. [Google Scholar] [CrossRef] [Scilit] [PubMed]
- Kano, N., Seraku, N., Takahashi, F., & Tsuji, S. (1984). Attractive quality and must-be quality. The Journal of the Japanese Society for Quality Control, 14(2), 39–48. [Google Scholar]
- Kim, J. H., Ritchie, J. B., & McCormick, B. (2012). Development of a scale to measure memorable tourism experiences. Journal of Travel research, 51(1), 12–25. [Google Scholar] [CrossRef] [Scilit]
- Kim, J. M., Liu, J., & Park, K. K. (2023). The dynamics in asymmetric effects of multi-attributes on customer satisfaction: Evidence from COVID-19. International Journal of Contemporary Hospitality Management, 35(10), 3497–3517. [Google Scholar] [CrossRef] [Scilit]
- Lee, S. Y., Kim, S. M., Lee, R. S., & Park, I. R. (2024). Effect of participation motivation in sports climbing on leisure satisfaction and physical self-efficacy. Behavioral Sciences, 14(1), 76. [Google Scholar] [CrossRef] [Scilit] [PubMed]
- Lee, T. C., & Peng, M. Y. P. (2021). Green experiential marketing, experiential value, relationship quality, and customer loyalty in environmental leisure farm. Frontiers in Environmental Science, 9, 657523. [Google Scholar] [CrossRef] [Scilit]
- Lin, J. S. (2024, February 14). A day of sustainability: Exploring the eco-friendly wonders of Sun Moon Lake. CommonWealth Magazine. Available online: https://english.cw.com.tw/article/article.action?id=3622 (accessed on 2 August 2026).
- Matzler, K., Bailom, F., Hinterhuber, H. H., Renzl, B., & Pichler, J. (2004). The asymmetric relationship between attribute-level performance and overall customer satisfaction: A reconsideration of the importance–performance analysis. Industrial Marketing Management, 33(4), 271–277. [Google Scholar] [CrossRef] [Scilit]
- Matzler, K., & Hinterhuber, H. H. (1998). How to make product development projects more successful by integrating Kano’s model of customer satisfaction into quality function deployment. Technovation, 18(1), 25–38. [Google Scholar] [CrossRef] [Scilit]
- McCullough, B., Orr, M., & Kellison, T. (2020). Sport ecology: Conceptualizing an emerging subdiscipline within sport management. Journal of Sport Management, 34(6), 509–520. [Google Scholar] [CrossRef] [Scilit]
- Mikulić, J., & Prebežac, D. (2011). A critical review of techniques for classifying quality attributes in the Kano model. Managing Service Quality: An International Journal, 21(1), 46–66. [Google Scholar] [CrossRef] [Scilit]
- Ministry of Justice, Taiwan. (2019, January 2). Human subjects research act. Laws & Regulations Database of the Republic of China (Taiwan). Available online: https://law.moj.gov.tw/ENG/LawClass/LawAll.aspx?pcode=L0020176 (accessed on 2 August 2026).
- Ministry of Transportation and Communications. (2024). Regulations governing water recreation activities. Laws & Regulations Database, Ministry of Justice. Available online: https://law.moj.gov.tw/ENG/LawClass/LawAll.aspx?pcode=K0110024 (accessed on 2 August 2026).
- Nantou County Government. (2022, October 17). The 2022 Sun Moon Lake open water swimming championship and the SUP competition were held under perfect weather, September 3. Available online: https://www.nantou.gov.tw/english/news_content.php?cid=519&dptid=376480000&id=144933 (accessed on 2 August 2026).
- Nantou County Government Environmental Protection Bureau. (2022, September 29). Environmental protection Bureau’s response to the renewed discharge of white, turbid wastewater into Sun Moon Lake. Available online: https://www.ntepb.gov.tw/sub/news/Details.aspx?Parser=9,18,288,274,,,14853,,,,6 (accessed on 2 August 2026).
- Pomfret, G., & Bramwell, B. (2016). The characteristics and motivational decisions of outdoor adventure tourists: A review and analysis. Current Issues in Tourism, 19(14), 1447–1478. [Google Scholar] [CrossRef] [Scilit]
- Putri, N. A., & Septiana, M. (2021). Customer experience in call center services ATB based on Kano model. In Proceedings of the 2nd international conference on applied economics and social science (pp. 94–98). Science and Technology Publications. [Google Scholar] [CrossRef] [Scilit]
- Rootlaw. (2012). Scope of human research exempt from ethical review. Available online: https://www.rootlaw.com.tw/LawArticle.aspx?LawID=A040170031035000-1010705 (accessed on 2 August 2026). (In Chinese)
- Rüdiger, J., & Wegener, L. (2023). KANO model for experience quality measurement of wine tourism events. Zeitschrift für Tourismuswissenschaft, 15(3), 276–290. [Google Scholar] [CrossRef] [Scilit]
- Sardar, S., & Islam, M. M. (2025). The impact of recreational activities on ecology: An evidence-based systematic review and bibliometric analysis. Sustainability, 17(1), 74. [Google Scholar] [CrossRef] [Scilit]
- Schmitt, B. H. (1999). Experiential marketing. The Free Press. [Google Scholar]
- Slevitch, L. (2025). Kano model categorization methods: Typology and systematic critical overview for hospitality and tourism academics and practitioners. Journal of Hospitality & Tourism Research, 49(3), 449–479. [Google Scholar] [CrossRef] [Scilit]
- Song, H. (2018). A critical review of Kano’s wording and its impact on attribute classification: A case study of smartphone in Korea. Total Quality Management & Business Excellence, 29(1–2), 1–28. [Google Scholar] [CrossRef] [Scilit]
- Sun Moon Lake. (2022). Application for water-based recreational activity permit. Sun Moon Lake National Scenic Area Administration, Tourism Administration, Ministry of Transportation and Communications. Available online: https://water.sunmoonlake.gov.tw/apply.aspx (accessed on 2 August 2026).
- Sun Moon Lake National Scenic Area Headquarters. (2023, December 15). 日月潭水域從事手划船、獨木舟、風浪板、水上腳踏車及立式划槳等水域遊憩活動注意事項 [Directions governing paddleboats, canoes, windsurfing, pedal boats, and stand-up paddleboarding activities in the waters of Sun Moon Lake]. Ministry of Transportation and Communications Laws and Regulations Retrieving System. Available online: https://motclaw.motc.gov.tw/webMotcLaw2018/Law/Info?LawID=L0442002&stop=0 (accessed on 2 August 2026).
- Šagovnović, I., & Stamenković, I. (2023). Investigating values of green marketing tools in predicting tourists’ eco-friendly attitudes and behavior. Journal of Ecotourism, 22(4), 479–501. [Google Scholar] [CrossRef] [Scilit]
- Taiwan Centers for Disease Control. (2012). Scope of human research exempt from ethical review. In 相關法規—衛生福利部疾病管制署. Taiwan Centers for Disease Control. (In Chinese) [Google Scholar]
- Taiwan Today. (2025, March 6). Sun Moon Lake recognized as green destination at ITB Berlin. Taiwan Today. Ministry of Foreign Affairs, Republic of China (Taiwan). Available online: https://taiwantoday.tw/Society/Top-News/266589/Sun-Moon-Lake-recognized-as-green-destination-at-ITB-Berlin (accessed on 2 August 2026).
- Theodorakis, N. D., Howat, G., Ko, Y. J., & Avourdiadou, S. (2014). A comparison of service evaluation models in the context of sport and fitness centres in Greece. Managing Leisure, 19(1), 18–35. [Google Scholar] [CrossRef] [Scilit]
- Tontini, G., Picolo, J. D., & Silveira, A. (2014). Which incremental innovations should we offer? Comparing importance–performance analysis with improvement-gaps analysis. Total Quality Management & Business Excellence, 25(7–8), 705–719. [Google Scholar] [CrossRef] [Scilit]
- Trendafilova, S., McCullough, B., Pfahl, M., Nguyen, S. N., Casper, J., & Picariello, M. (2014). Environmental sustainability in sport: Current state and future trends. Global Journal on Advances Pure and Applied Sciences, 3(1), 9–14. [Google Scholar]
- Tu, J. C., & Yang, C. H. (2019). Consumer needs for hand-touch product designs based on the experience economy. Sustainability, 11(7), 2064. [Google Scholar] [CrossRef] [Scilit]
- Yi, R., & Glauert, R. (2022, September 27). Pollution investigation at Sun Moon Lake tourist hot spot. Taiwan Plus. Available online: https://www.taiwanplus.com/news/taiwan-news/environment/220927010/pollution-investigation-at-sun-moon-lake-tourist-hot-spot? (accessed on 2 August 2026).
- Yoshida, M., & James, J. D. (2010). Customer satisfaction with game and service experiences: Antecedents and consequences. Journal of Sport Management, 24(3), 338–361. [Google Scholar] [CrossRef] [Scilit]
- Yu, H., & Ko, H.-T. (2012). Integrating Kano model with strategic experiential modules in developing ICT-enabled services: An empirical study. Management Decision, 50(1), 7–20. [Google Scholar] [CrossRef] [Scilit]
- Zeithaml, V. A. (1988). Consumer perceptions of price, quality, and value: A means-end model and synthesis of evidence. Journal of Marketing, 52(3), 2–22. [Google Scholar] [CrossRef] [Scilit]
- Zeithaml, V. A., Berry, L. L., & Parasuraman, A. (1996). The behavioral consequences of service quality. Journal of Marketing, 60(2), 31–46. [Google Scholar] [CrossRef] [Scilit]

Disclaimer/Publisher’s Note: The statements, opinions and data contained in all publications are solely those of the individual author(s) and contributor(s) and not of MDPI and/or the editor(s). MDPI and/or the editor(s) disclaim responsibility for any injury to people or property resulting from any ideas, methods, instructions or products referred to in the content. |
© 2026 by the authors. Licensee MDPI, Basel, Switzerland. This article is an open access article distributed under the terms and conditions of the Creative Commons Attribution (CC BY) license.