


Abstract
This study assesses spatiotemporal variation in surface water quality in the Tien–Hau river system, Mekong Delta, Vietnam, using data from four monitoring stations (Tan Chau, Chau Doc, My Thuan, and Can Tho) during 2013–2024. Twelve physicochemical parameters were analysed monthly. Kruskal–Wallis tests showed significant spatial differences in DO, pH, PO43−, NO2−, and NO3−, while Dunn’s test indicated generally better water quality at the upstream station Tan Chau. PCA extracted four components explaining 60.5% of total variance, representing organic enrichment, hydrological dynamics, nutrient runoff, and salinity intrusion. A custom Aquaculture Water Suitability Index (AWSI) based on eight key parameters classified water quality into five suitability levels. Dry season conditions were generally more favourable than rainy-season conditions. Tan Chau in the dry season reached the Excellent class (96.1), whereas rainy-season conditions were less suitable because of high suspended solids. The results support seasonal aquaculture planning in the Mekong Delta.
1. Introduction
The Mekong Delta is Vietnam’s main agricultural and aquaculture region. The Tien and Hau rivers supply water for irrigation and aquaculture and therefore strongly influence regional livelihoods and food production.
Surface water quality in the delta is under pressure from agriculture, aquaculture effluents, domestic and industrial discharge, urbanisation, and climate-driven hydrological change. These pressures are commonly expressed through nutrient enrichment, organic loading, suspended solids, and increasing salinity intrusion.
Long-term monitoring is needed to detect trends and support management, but multi-parameter datasets require methods that can handle non-normal environmental data [1]. Kruskal–Wallis and Dunn’s tests are suitable for spatial comparison, while PCA helps identify dominant pollution patterns and likely source groups [2,3,4].
Although previous studies have reported water-quality variation in the Mekong Delta [5,6,7], fewer studies have combined long-term spatial analysis, multivariate source interpretation, and aquaculture-oriented assessment in a single framework.
Therefore, this study aims to: (i) describe spatiotemporal variability of twelve parameters at four stations from 2013 to 2024; (ii) test spatial and seasonal differences; (iii) identify dominant pollution patterns using PCA; and (iv) evaluate aquaculture suitability using AWSI with reference to QCVN 08:2023/BTNMT [8] and aquaculture standards [9,10].
2. Materials and Methods
2.1. Study Area and Monitoring Network
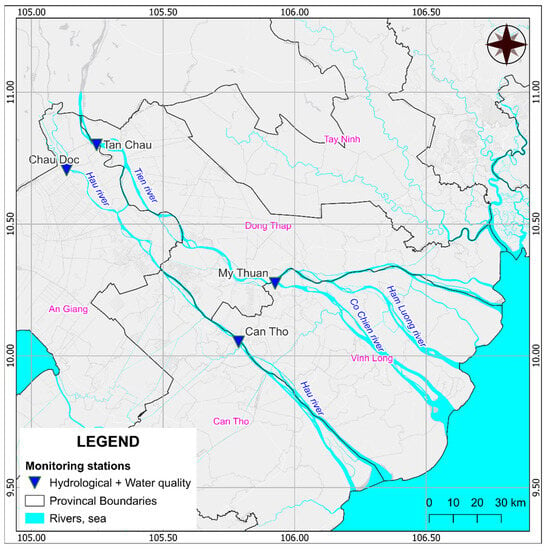
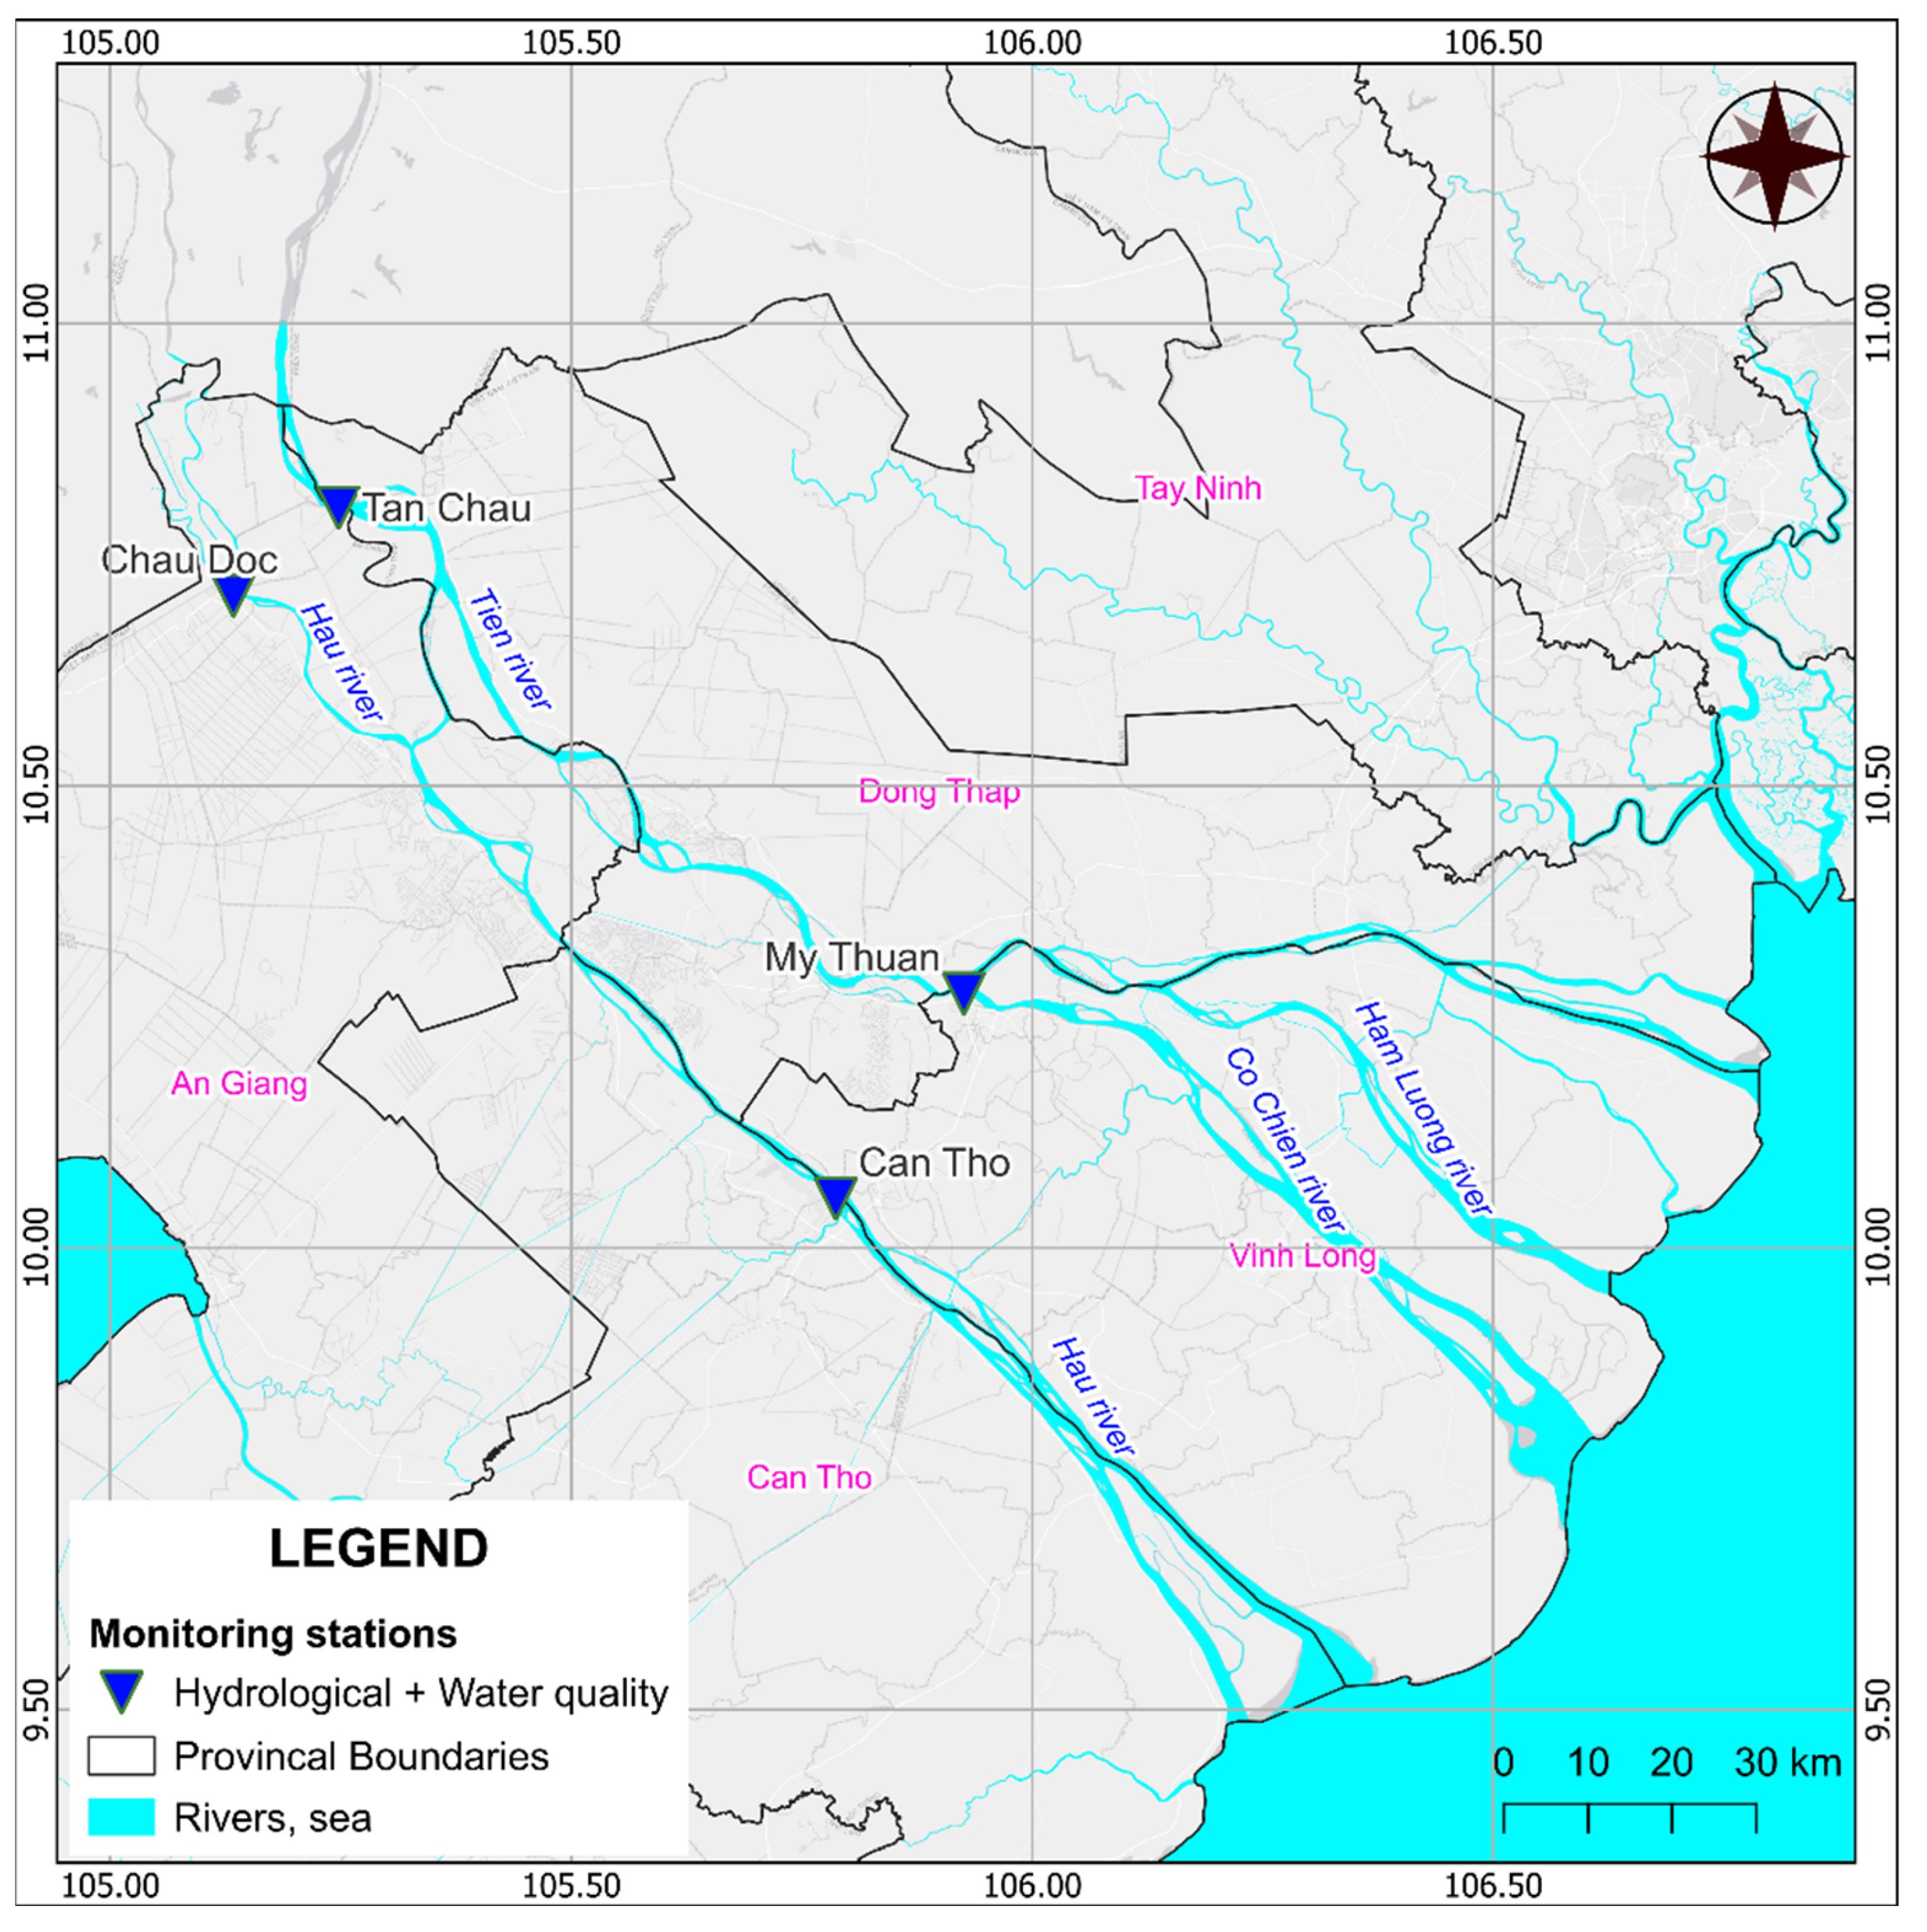
The study covered the Tien and Hau rivers in the Mekong Delta, Vietnam. Four stations were selected along an upstream–downstream gradient (Figure 1): Tan Chau near the Cambodian border, Chau Doc, My Thuan in the mid-delta, and Can Tho in the lower delta.
Figure 1.
Location of water quality monitoring stations along the Tien–Hau river system, Mekong Delta, Vietnam. Stations represent an upstream–downstream spatial gradient from the Cambodian border (Tan Chau) to the lower delta (Can Tho).
2.2. Data Collection
Water quality was sampled monthly on the 15th day of each month at 07:00 local time, at 50 cm below the surface. Twelve parameters were measured: DO, pH, temperature, EC, TSS, BOD5, COD, NH4+, NO2−, NO3−, PO43−, and Cl−. Supplementary spring- and neap-tide samples were collected to capture tidal effects. The dataset spans January 2013 to December 2024, with 135–152 observations per parameter per station. No data were available for 2019. The dry season was defined as December–May and the rainy season as June–November.
2.3. Statistical Methods
2.3.1. Kruskal–Wallis Test
Spatial differences among the four stations were assessed using the Kruskal–Wallis H test [3], a non-parametric alternative to one-way ANOVA. Significance was set at α = 0.05, with Bonferroni correction across the twelve parameters. Seasonal differences (dry & rainy) at each station were tested with the two-sided Mann-Whitney U test, and within-season variability was expressed as the coefficient of variation (CV, %).
2.3.2. Dunn’s Post Hoc Test
For parameters with significant Kruskal–Wallis results, pairwise station differences were evaluated using Dunn’s test [2] with Bonferroni correction.
2.3.3. Principal Component Analysis
PCA was applied to the standardised dataset to identify latent pollution factors. All twelve parameters were included, and samples with missing values were removed (list-wise deletion, n = 558 of 594). Components with eigenvalues > 1 were retained, and loadings ≥ |0.60| were used for interpretation [11].
2.3.4. Aquaculture Water Suitability Index (AWSI)
The Aquaculture Water Suitability Index (AWSI) is a custom composite index developed to evaluate surface-water suitability for aquaculture. Eight parameters (DO, pH, BOD5, COD, TSS, NH4+, NO2−, and PO43−) were converted to sub-index scores (qi) by linear interpolation between breakpoints based on QCVN 08-MT:2023/BTNMT (level B) [8] and international aquaculture standards [9,10].
where wi is the weight assigned to parameter i. Higher weights were assigned to DO(4) and to pH NH4+ and NO2− (3 each). AWSI was calculated when at least four valid values were available and classified as Excellent (≥91), Good (76–90), Fair (51–75), Poor (26–50), or Very Poor (<26).
3. Results
3.1. Descriptive Statistics
Table 1 and Table 2 summarise overall and seasonal statistics for the twelve parameters. DO decreased from upstream to downstream, from 6.60 ± 0.83 mg/L at Tan Chau to 5.74 ± 0.98 mg/L at Can Tho, indicating stronger downstream organic pressure. pH was highest at Tan Chau (7.37 ± 0.33) and lowest at My Thuan (7.07 ± 0.34).
Table 1.
Overall statistics (mean ± SD) of twelve water quality parameters at four monitoring stations (2013–2024).
Table 2.
Seasonal statistics (mean ± SD) of twelve water quality parameters at four monitoring stations (dry: December–May; rainy: June–November).
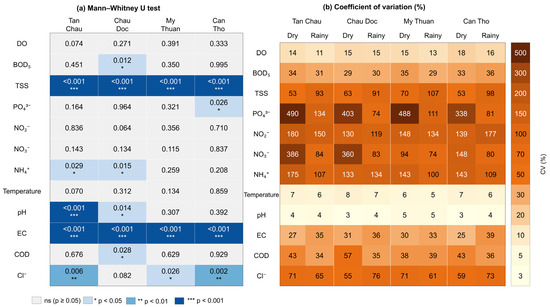
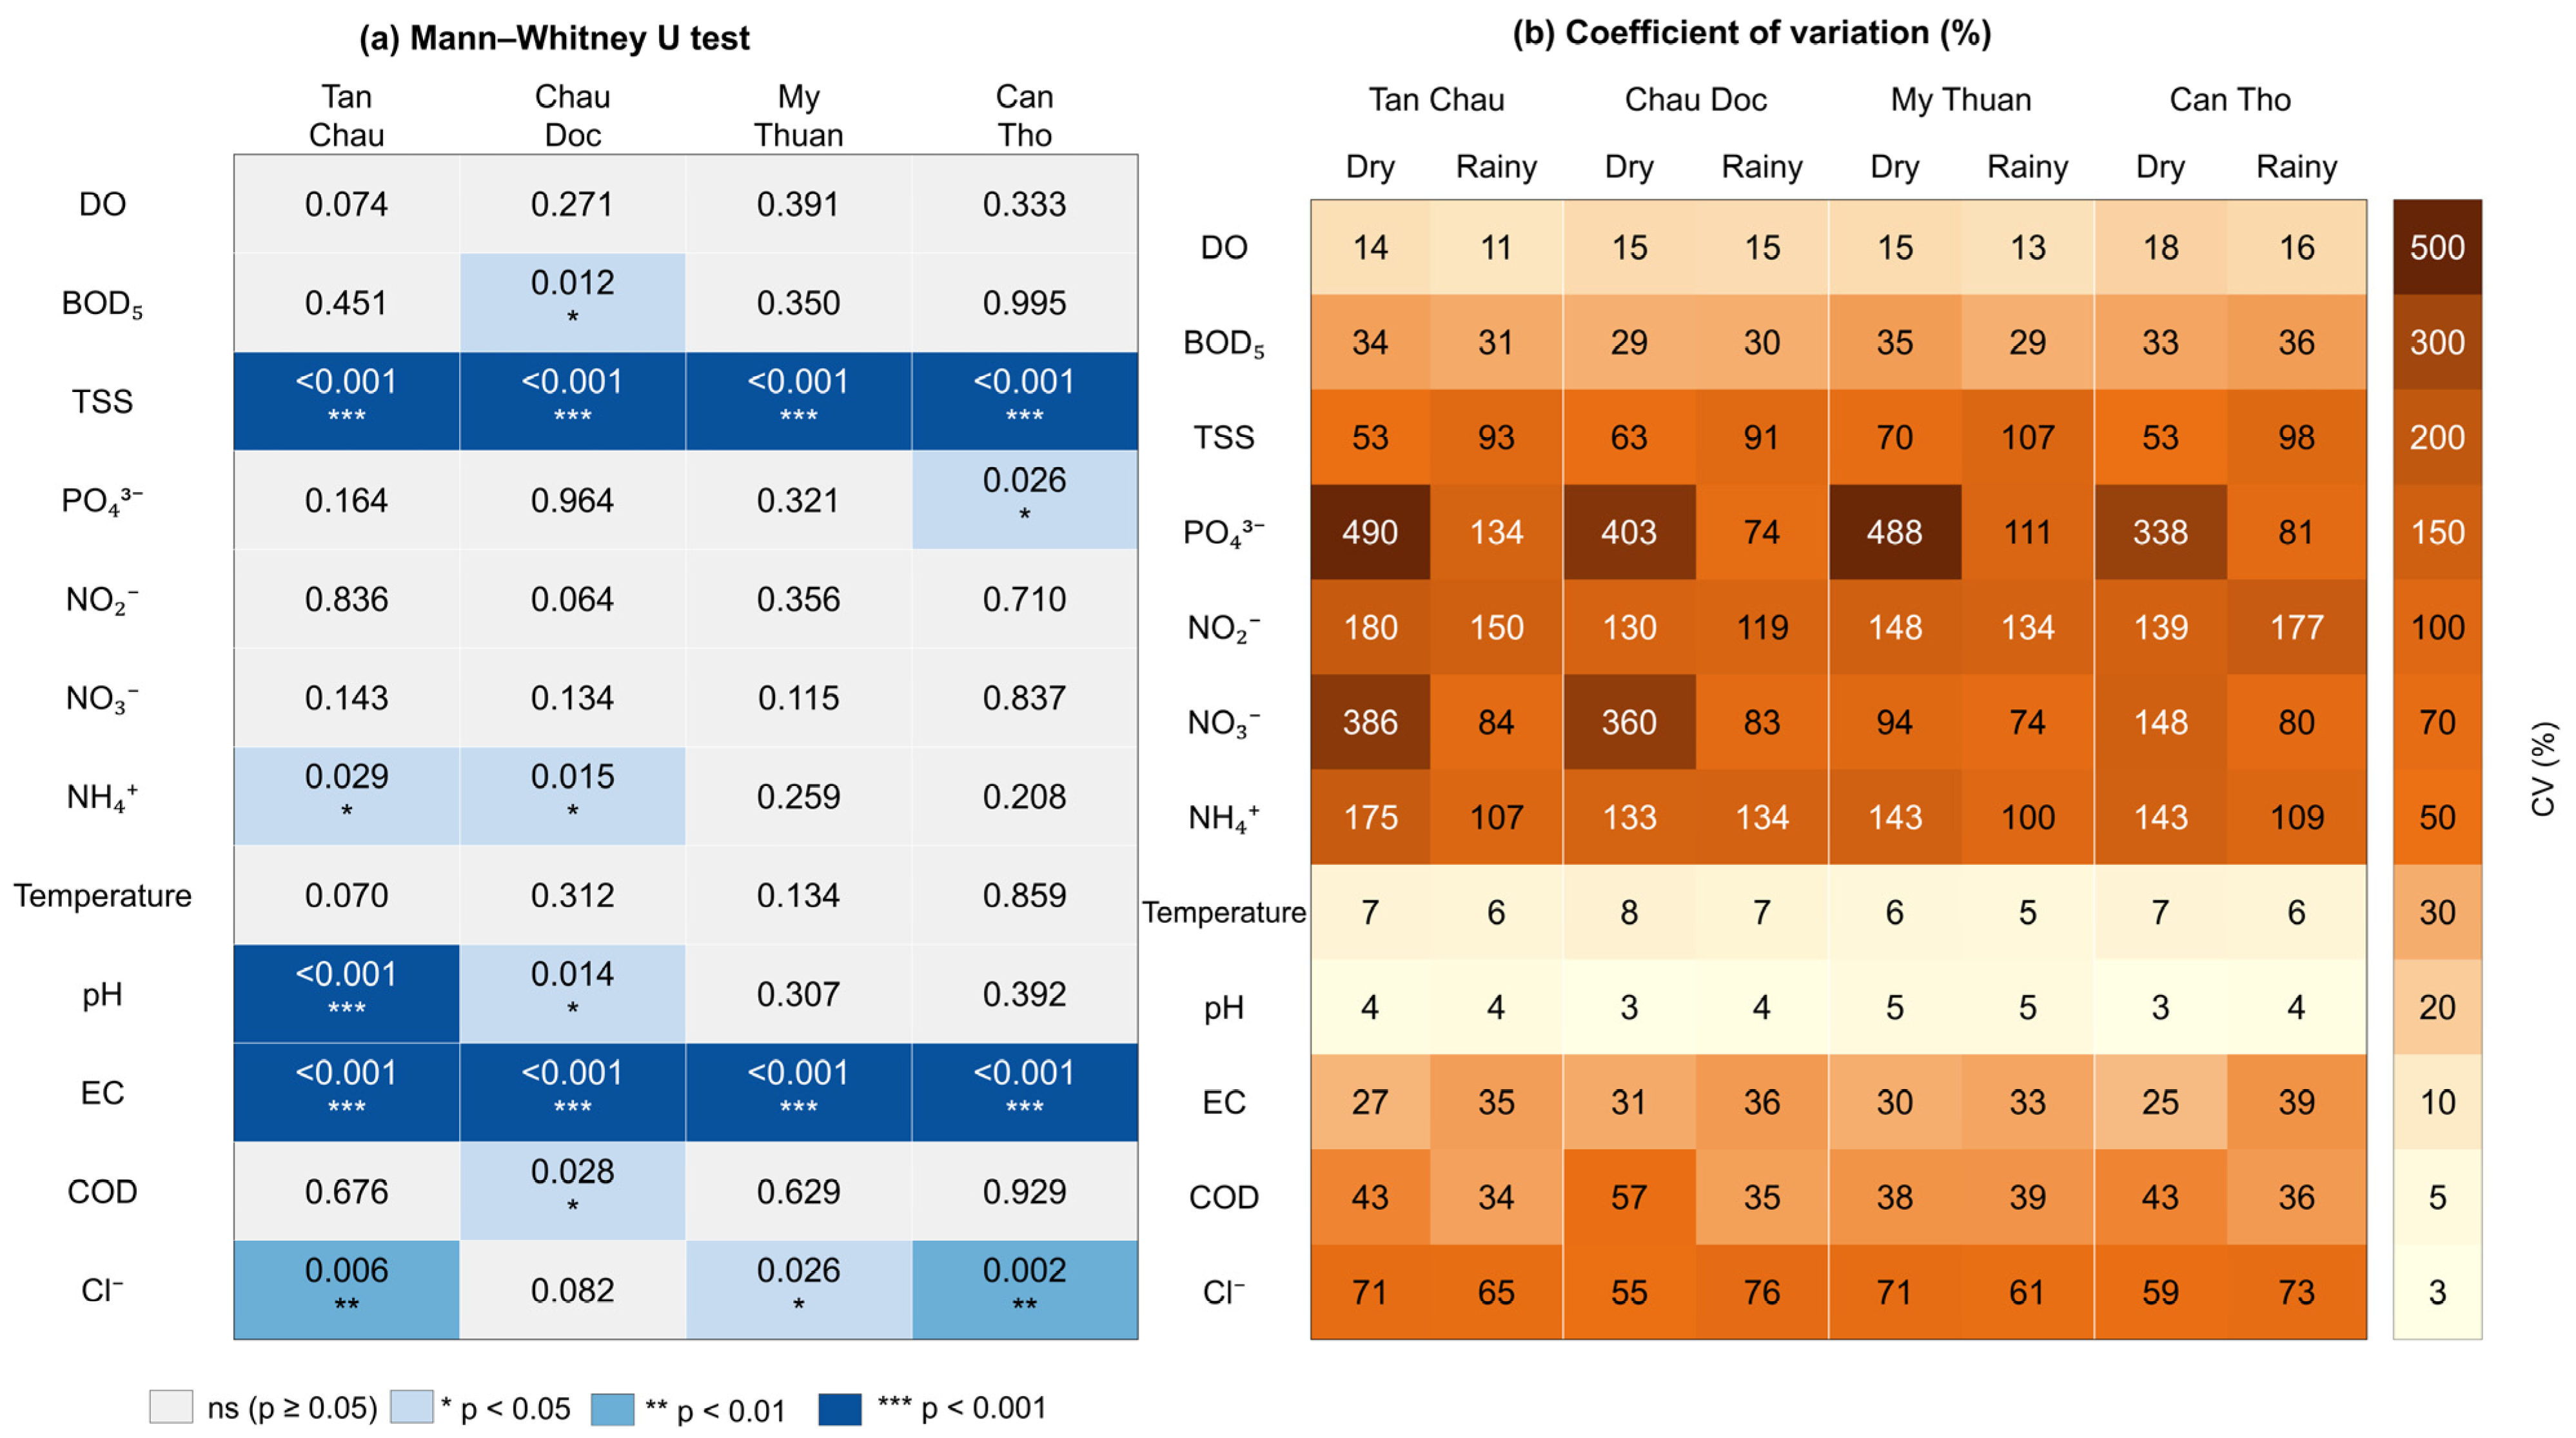
TSS was higher in the rainy season (32.67–52.52 mg/L) than in the dry season (10.46–13.91 mg/L) at all stations (Mann-Whitney ρ < 0.001, Figure 2a), reflecting flood-driven sediment mobilisation. NH4+ and PO43− tended to increase in the dry season, likely because of reduced dilution, with much higher dry-season variability (CV up to 490%, Figure 2b) (Figure 2). EC, Cl− were also higher in the dry season.
Figure 2.
Seasonal variability of water quality parameters across four monitoring stations and two seasons (dry: December–May; rainy: June–November). (a) ρ − values of the two-sided Mann-Whitney U test between seasons; (b) coefficient of variation (CV,%) by station and season (logarithmic colour scale). Shading in (a) ns = no significant. ρ > 0.05; * ρ < 0.05; ** ρ < 0.01, *** ρ < 0.001).
3.2. Spatial Variation: Kruskal–Wallis Test
Table 3 shows the Kruskal–Wallis results. Significant spatial differences were detected for DO (H = 62.19, p < 0.001), pH (H = 72.06, p < 0.001), PO43− (H = 35.02, p < 0.001), NO3− (H = 11.72, p = 0.008), and NO2− (H = 9.40, p = 0.024). BOD5, TSS, NH4+, temperature, EC, COD, and Cl− were not significantly different among stations.
Table 3.
Results of the Kruskal–Wallis test for twelve water quality parameters across four monitoring stations (df = 3 for all parameters).
3.3. Post Hoc Pairwise Comparisons: Dunn’s Test
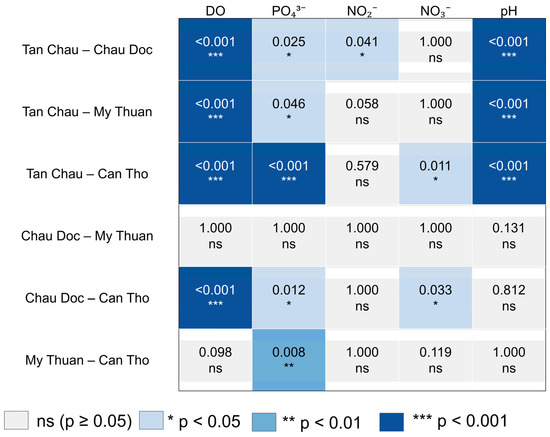
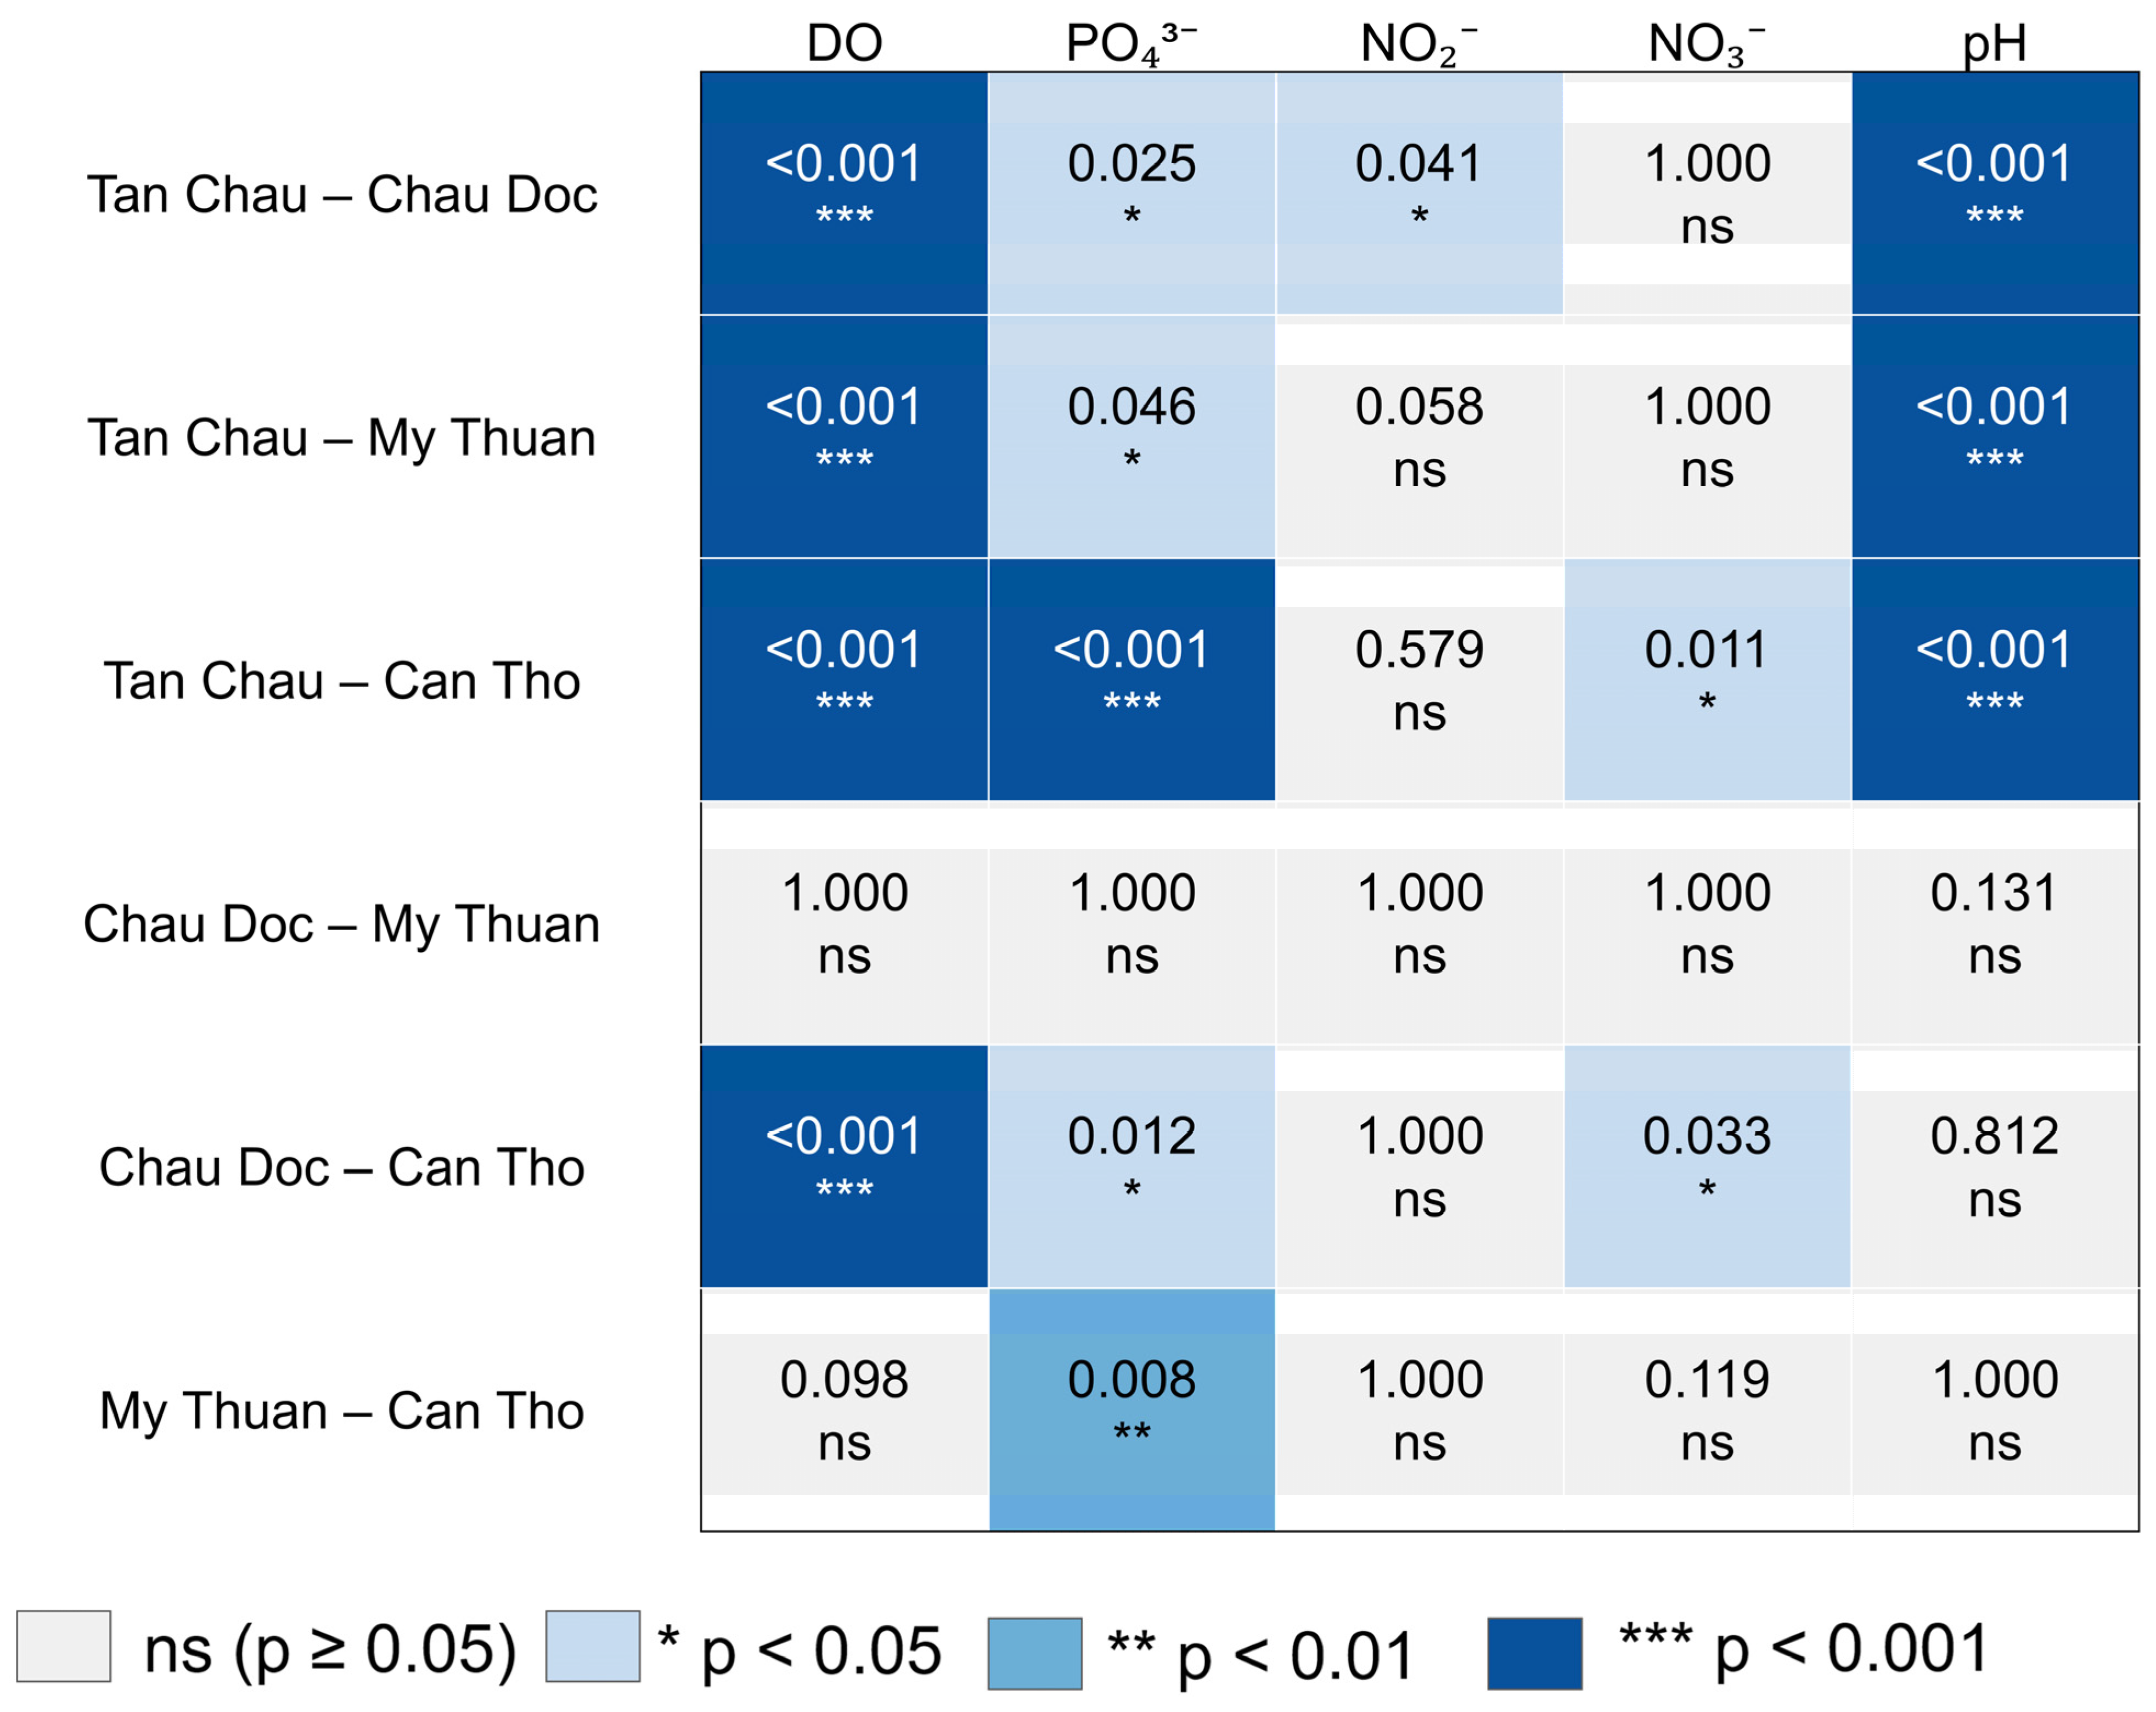
Figure 3 presents Dunn’s test for the five significant parameters with significant Kruskal—Wallis results. DO at Tan Chau differed significantly from all other stations (ρ < 0.001) (Chau Doc, My Thuan and Can Tho (p < 0.001), confirming declining oxygen availability downstream. Tan Chau also showed significantly higher pH than the other stations. Can Tho had significantly higher PO43− than upstream sites (p < 0.012), and Tan Chau also differed from Chau Doc (p < 0.025), My Thuan (p < 0.045). NO3− differed only between Can Tho and Tan Chau (p < 0.011) and Chau Doc (p < 0.033) (and NO2− only between Tan Chau and Chau Doc (p < 0.041).
Figure 3.
Dunn’s post hoc test heatmap showing pairwise comparisons between monitoring stations. Shaded cells indicate statistically significant differences (p < 0.05, Bonferroni-corrected). ns = not significant ((ρ > 0.05; * ρ < 0.05; ** ρ < 0.01, *** ρ < 0.001).
3.4. Source Apportionment: Principal Component Analysis
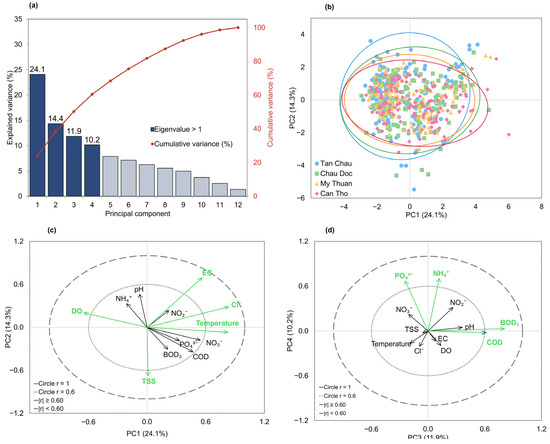
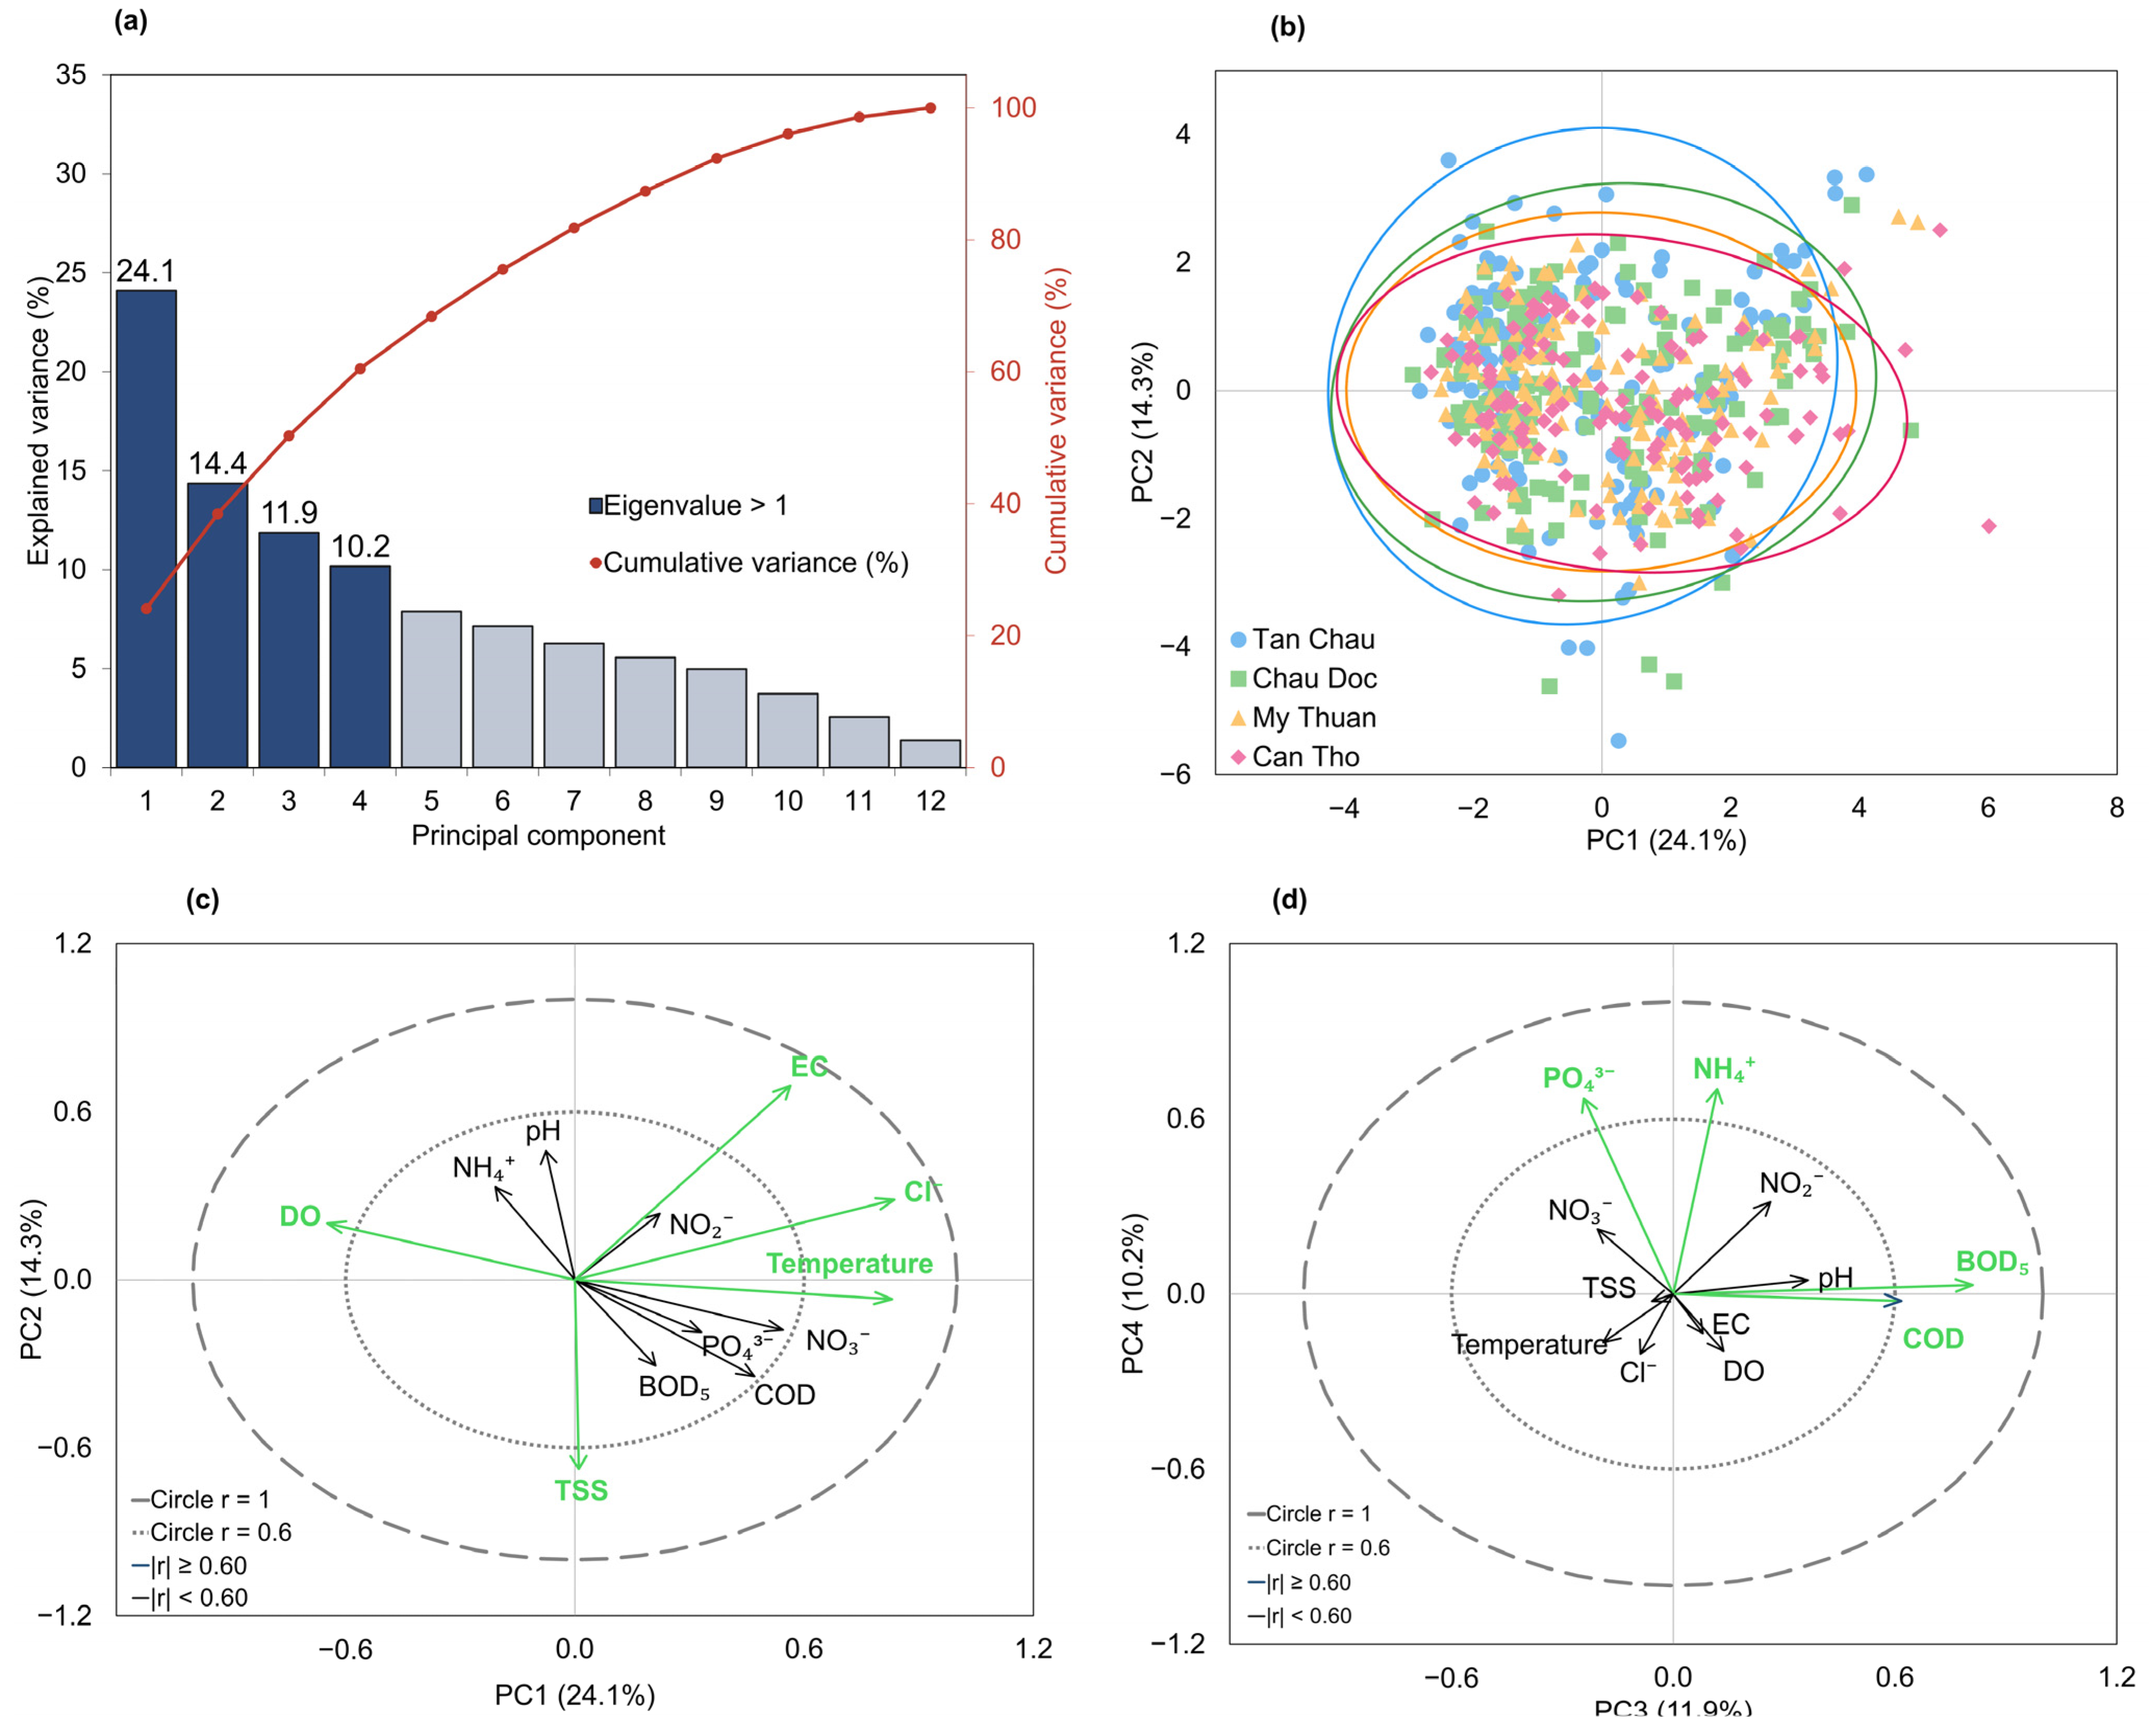
PCA retained four components with eigenvalues > 1 (2.89, 1.73, 1.43 and 1.22), 60.5% of total variance (Figure 4a). PC1 (24.1%) had strong positive loadings for temperature, Cl− (0.83), negative DO (−0.64), with moderate loadings EC (0.56), NO3− (0.55) reflecting dry-season low-flow conditions with higher temperature and ion concentration, lower oxygen (Figure 4b). PC2 (14.3%) contrasted EC (0.70) with TSS (−0.67), representing flood-pulse dilution and sediment input (Figure 4c). The PCA score plot showed only a weak upstream-downstream separation, with Tan Chau associated more higher DO (Figure 4b).
Figure 4.
PCA results: (a) scree plot showing the percentage of variance explained by each principal component dark bars: eigenvalue > 1 and cumulative variance (line); (b) PCA biplot (PC1 vs. PC2) with 95% confiden ellipses for each station; (c) loadings correlations between parameters and components ong PC1–PC2; (d) loadings ong PC3 and PC4. Dark circles mark |r| = 1 and dotted circles |r| = 0.6 with |r| ≥ 0.6 are shown in bold.
PC3 (11.9%) was associated with BOD5 (0.81) and COD (0.62), indicating organic enrichment, whereas PC4 (10.2%) was linked to NH4+ (0.69) PO43− (0.68) (Figure 4c). PC4 was driven largely by a few early—2013 samples with exceptionally high concentrations and should be interpreted with caution. Station score distributions overlapped strongly (Figure 4b), with only a slight shift along PC1 from Tan Chau (mean −0.28) to Can Tho (0.28).
3.5. Aquaculture Water Suitability Assessment (AWSI)
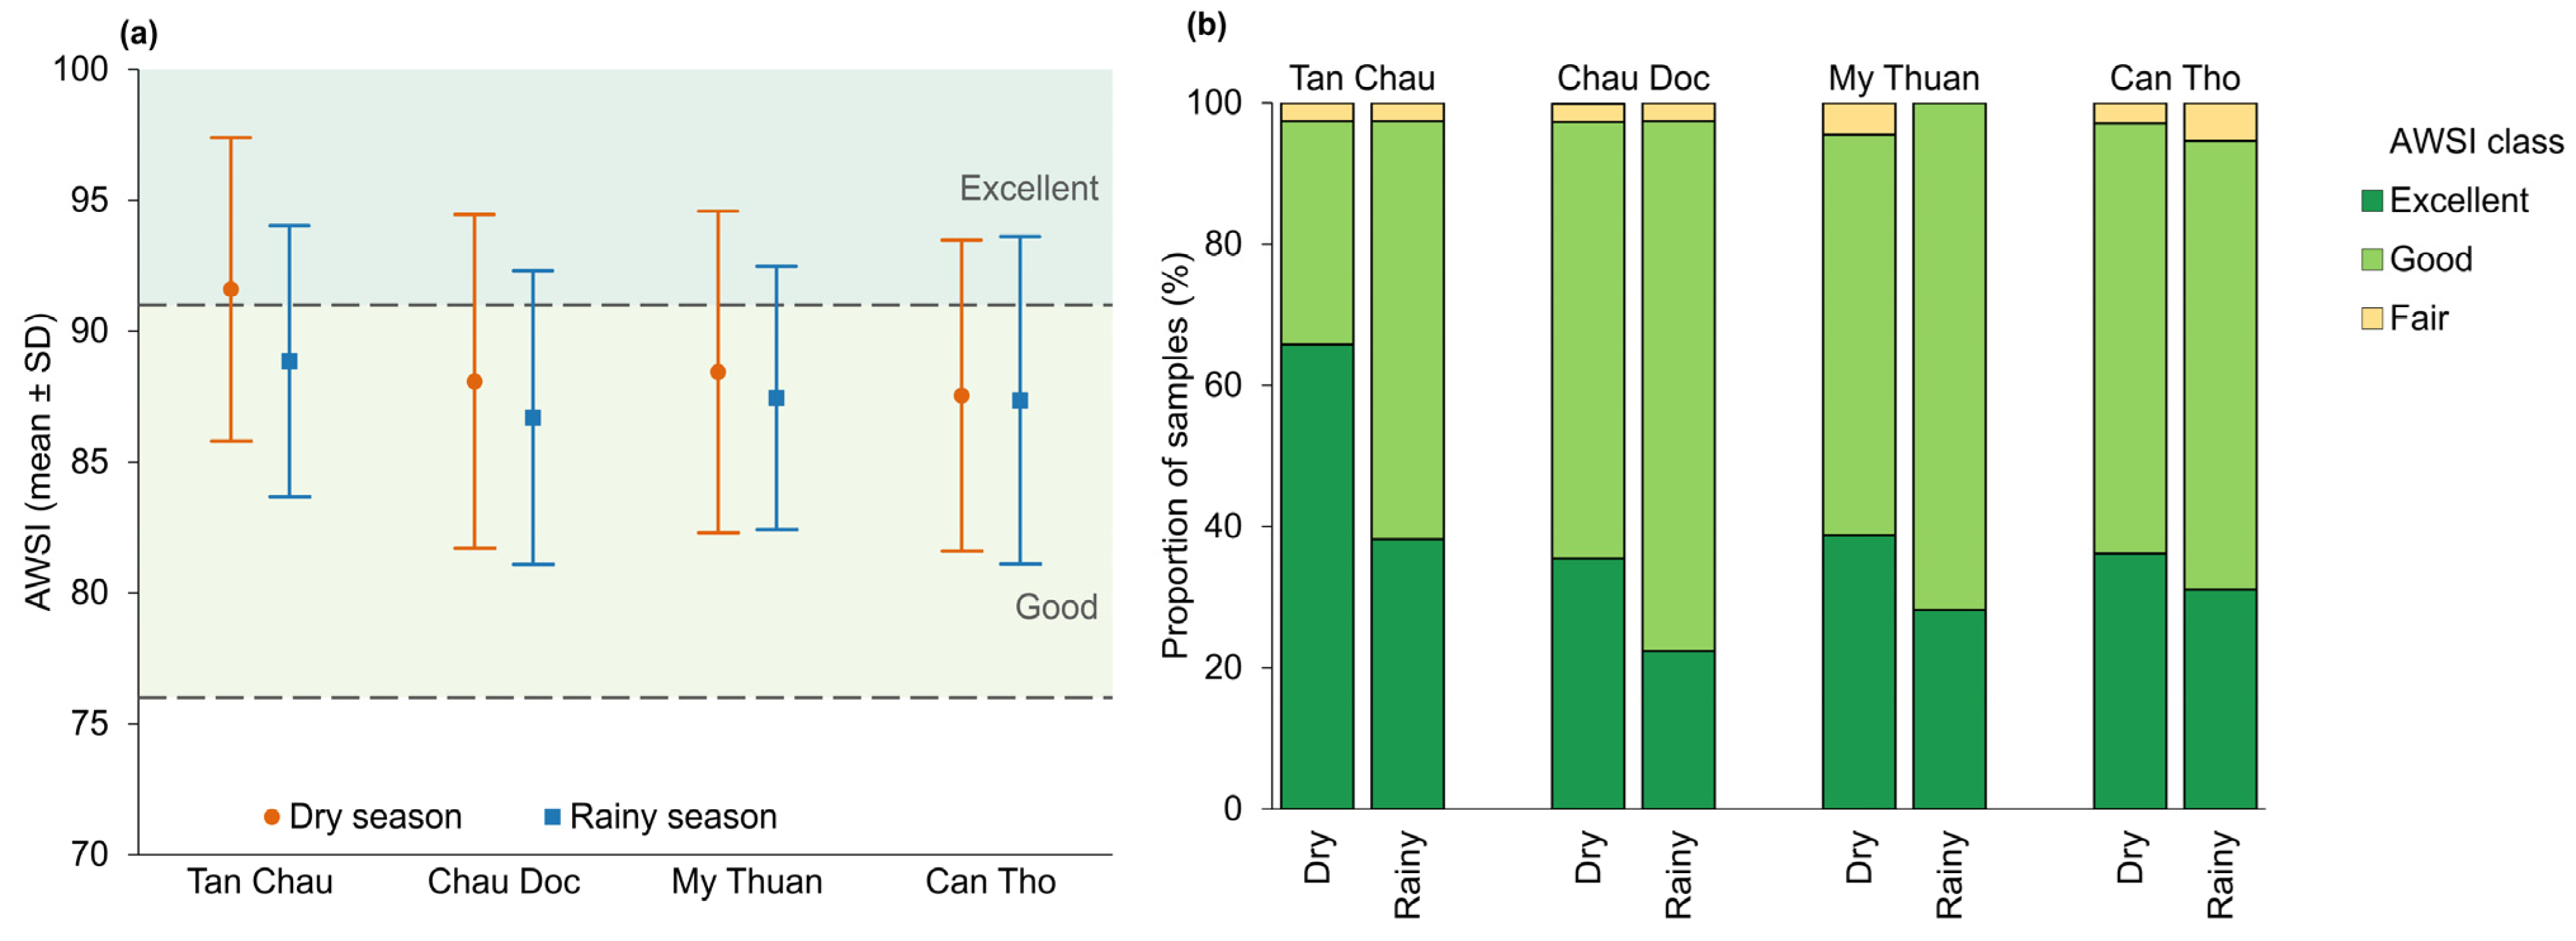
AWSI scores for all station–season combinations fell within the Good to Excellent classes (Table 4; Figure 5) and differed significantly among stations (Kruskal—Wallis ρ < 0.01). Most samples were classified as Good or Excellent; only 2–4% of samples per station were Fair, and none fell below the Fair class. The highest score was recorded at Tan Chau in the dry season (91.6 ± 5.8, Excellent), whereas the lowest occurred at Chau Doc in the rainy season (86.7 ± 5.6, Good). Dry season AWSI values were consistently higher than rainy-season values at all stations. Rainy-season scores were lowered mainly by high TSS, whereas dry-season scores were reduced by higher NH4+, NO2− at Can Tho by lower DO. COD sub-indices were moderate in both seasons.
Table 4.
Aquaculture Water Suitability Index (AWSI) scores by station and season, with suitability classification and management implications.
Figure 5.
Seasonal AWSI scores at four monitoring stations (2013–2024). (a) mean AWSI; error bars represent ± 1 standard deviation; horizontal dashed lines indicate class boundaries (76 = Good; 91 = Excellent); (b) proportion of samples in each AWSI data.
4. Discussion
4.1. Spatial Patterns and Drivers of Water Quality Degradation
The upstream-to-downstream decline in DO and pH is consistent with increasing organic pressure along the river system [12]. Although annual mean DO remained above 4 mg/L at all stations, minimum values at Can Tho dropped to 3.0 mg/L, indicating short-term stress that may affect cultured species [9,10].
The lack of significant spatial differences in BOD5, TSS, NH4+, temperature, EC, and COD may reflect strong hydrological connectivity and diffuse inputs across the delta [13]. In contrast, elevated PO43− at Can Tho is consistent with stronger urban and domestic inputs in the lower delta [6].
4.2. Seasonal Dynamics and Tidal Influences
Higher rainy-season TSS confirms the importance of the Mekong flood pulse for sediment transport [14]. Dry-season increases in NH4+ and PO43− indicate lower dilution capacity and greater eutrophication risk when river water is used for aquaculture supply.
4.3. PCA Source Attribution
The PCA results indicate that seasonal hydrology is the dominant source of water-quality variation in the Tien–Hau system: PC1 and PC2 together (38.4%) describe dry-season low-flow conditions and flood-pulse dilution [15]. Organic enrichment (PC3, 11.9%) explains a smaller share but is consistent with previous studies identifying aquaculture effluent, wastewater and agricultural residues as important pressures in the Mekong Delta [5,7,16].
Becauce Cl− and EC did not differ among stations (Table 3) but were higher in the dry season (Figure 2), their association with PC1 more likely reflects ionic concentration under low discharge than direct seawater intrusion at the land stations. Nevertheless, reduced dry-season discharge coincides with high water demand and remains an important constraint for aquaculture water supply in downstream areas [14,17].
4.4. Aquaculture Suitability: Station–Season–Species Recommendations
AWSI converts the multi-parameter dataset into practical guidance for aquaculture management [18]. The main station–season implications are summarised below.
Tan Chau, dry season (AWSI: Excellent, 91.6): Most favourable conditions in the dataset and suitable for pangasius culture (Pangasianodon hypophthalmus) with minimal pre-treatment requirements [16].
Tan Chau, rainy season (AWSI: Good, 88.9): Suitable for pangasius, but elevated TSS requires setting before water intake. Chau Doc and My Thuan, both seasons (AWSI: Good, 86.7-88.4): Generally acceptable for catfish with routine management, but less suitable for black tiger shrimp (Penaeus monodon) because of stricter DO, pH, NH4+, and NO2− requirements [9].
Can Tho, dry season (AWSI: Good, 87.5): lowest DO in the dataset. Direct intake should be avoided during low-flow periods unless pre-treatment such as settling, filtration, or aeration is applied [8,9].
4.5. Regulatory Compliance and Management Implications
Most annual mean values complied with QCVN 08:2023/BTNMT level B [8], but intermittent exceedances were still important for production risk. In the dry season, DO fell below 5 mg/L at Can Tho and NH4+ exceeded 0.5 mg/L at Chau Doc and Can Tho during some observations, indicating potential constraints during stocking and early grow-out.
These findings support season-specific timing of water abstraction and stronger dry-season buffering measures, especially at downstream stations [18].
5. Conclusions
This study provides a long-term assessment of Tien–Hau river surface water quality for aquaculture suitability during 2013–2024. Significant spatial gradients were found for DO, pH, PO43−, and inorganic nitrogen, with Tan Chau generally showing the best water quality. PCA identified four main drivers of variation: organic enrichment, hydrological dynamics, nutrient runoff, and salinity intrusion, while AWSI highlighted staion-season differnces, with dry-season Tan Chau as the most suitable and rainy-season Chau Doc as the least suitable.
Overall, the results indicate that aquaculture water intake should be seasonally adjusted: upstream dry-season water is the most favourable, whereas rainy-season water requires closer quality control and, in some cases, pre-treatment before use.
Author Contributions
Conceptualization, T.P.T.B., P.T.D., T.T.N., N.V.N. and T.N.T.; methodology, T.P.T.B., T.T.N., N.V.N., T.N.T. and P.T.D.; formal analysis, T.P.T.B.; investigation, T.P.T.B. and T.N.T.; data curation, T.P.T.B.; writing—original draft preparation, T.P.T.B.; writing—review and editing, T.N.T., T.T.N., N.V.N. and T.P.T.B.; supervision, T.N.T. All authors have read and agreed to the published version of the manuscript.
Funding
This research was funded by Vietnam Academy of Science and Technology, grant number VAST06.05/25-26. The funder had no role in the study design, data collection and analysis, decision to publish, or preparation of the manuscript.
Institutional Review Board Statement
Not applicable.
Informed Consent Statement
Not applicable.
Data Availability Statement
Surface-water quality data may be requested from the Southern Regional Hydrometeorological Centre of Vietnam.
Acknowledgments
The authors gratefully acknowledge the Vietnam Academy of Science and Technology for funding this research under grant VAST06.05/25-26. We thank the Southern Regional Hydrometeorological Centre for providing the surface-water quality records used in this study.
Conflicts of Interest
The authors declare no conflicts of interest.
Abbreviations
The following abbreviations are used in this manuscript:
| AWSI | Aquaculture Water Suitability Index |
| BOD | Biochemical Oxygen Demand |
| COD | Chemical Oxygen Demand |
| DO | Dissolved Oxygen |
| EC | Electrical Conductivity |
| PCA | Principal Component Analysis |
| QCVN | Quy Chuẩn Kỹ thuật Quốc gia (Vietnamese National Technical Regulation) |
| TSS | Total Suspended Solids |
References
- Nguyen, T.G.; Huynh, T.H.N. Assessment of surface water quality and monitoring in southern Vietnam using multicriteria statistical approaches. Sustain. Environ. Res. 2022, 32, 20. [Google Scholar] [CrossRef] [Scilit]
- Dunn, O.J. Multiple Comparisons Using Rank Sums. Technometrics 1964, 6, 241–252. [Google Scholar] [CrossRef]
- Kruskal, W.H.; Wallis, W.A. Use of Ranks in One-Criterion Variance Analysis. J. Am. Stat. Assoc. 1952, 47, 583–621. [Google Scholar] [CrossRef] [Scilit]
- Statham, P.J. Nutrients in estuaries—An overview and the potential impacts of climate change. Sci. Total Environ. 2012, 434, 213–227. [Google Scholar] [CrossRef] [Scilit]
- Da, C.T.; Phuoc, L.H.; Duc, H.N.; Troell, M.; Berg, H. Use of Wastewater from Striped Catfish (Pangasianodon hypophthalmus) Pond Culture for Integrated Rice–Fish–Vegetable Farming Systems in the Mekong Delta, Vietnam. Agroecol. Sustain. Food Syst. 2015, 39, 580–597. [Google Scholar] [CrossRef] [Scilit]
- Tran, T.T.; Liem, N.D.; Hieu, H.H.; Tam, H.T.; Mong, N.V.; Yen, N.T.M.; Luu, P.T. Assessment of Long-Term Surface Water Quality in Mekong River Estuaries Using A Comprehensive Water Pollution Index. Environ. Nat. Resour. J. 2023, 21, 524–533. [Google Scholar] [CrossRef] [Scilit]
- Hong, T.T.K.; Viet, L.H.; Giao, N.T. Analysis of Spatial-Temporal Variations of Surface Water Quality in the Southern Province of Vietnamese Mekong Delta Using Multivariate Statistical Analysis. J. Ecol. Eng. 2022, 23, 1–9. [Google Scholar] [CrossRef] [Scilit]
- Ministry of Natural Resources and Environment (MONRE). QCVN 08:2023/BTNMT—National Technical Regulation on Surface Water Quality; Issued with Circular No. 01/2023/TT-BTNMT of 13 March 2023; MONRE: Hanoi, Vietnam, 2023.
- Boyd, C.E. Water Quality: An Introduction, 2nd ed.; Springer: Berlin, Germany, 2015. [Google Scholar] [CrossRef] [Scilit]
- Boyd, C.E. Water Quality; Springer US: New York, NY, USA, 2000. [Google Scholar] [CrossRef] [Scilit]
- Wang, J.; Da, L.; Song, K.; Li, B.L. Temporal variations of surface water quality in urban, suburban and rural areas during rapid urbanization in Shanghai, China. Environ. Pollut. 2008, 152, 387–393. [Google Scholar] [CrossRef] [Scilit]
- Bianchi, T.S. Biogeochemistry of Estuaries, Online ed.; Oxford University Press: Oxford, UK, 2006. [Google Scholar] [CrossRef] [Scilit]
- Wilbers, G.J.; Becker, M.; Nga, L.T.; Sebesvari, Z.; Renaud, F.G. Spatial and temporal variability of surface water pollution in the Mekong Delta, Vietnam. Sci. Total Environ. 2014, 485–486, 653–665. [Google Scholar] [CrossRef] [Scilit]
- MRC. MEKONG RIVER BASIN 2023 STATE OF THE BASIN REPORT. 2024. Available online: www.mrcmekong.org (accessed on 26 June 2024).
- Mutea, F.G.; Nelson, H.K.; Van Au, H.; Huynh, T.G.; Vu, U.N. Assessment of water quality for aquaculture in hau river, Mekong Delta, Vietnam using multivariate statistical analysis. Water 2021, 13, 3307. [Google Scholar] [CrossRef] [Scilit]
- General Statistics Office of Vietnam (GSO). Statistical Yearbook of Vietnam 2023; Statistical Publishing House: Hanoi, Vietnam, 2024.
- World Bank. Vietnam: Toward a Safe, Clean, and Resilient Water System; World Bank: Washington, DC, USA, 2019. [Google Scholar]
- Van Viet, T.; Van Hoa, A.; Giang, H.T.; Ut, V.N. Variation of Water Quality in Intensive Aquaculture Areas of the Mekong Delta, Vietnam. Asian Fish. Sci. 2023, 36, 100–114. [Google Scholar] [CrossRef] [Scilit]

Disclaimer/Publisher’s Note: The statements, opinions and data contained in all publications are solely those of the individual author(s) and contributor(s) and not of MDPI and/or the editor(s). MDPI and/or the editor(s) disclaim responsibility for any injury to people or property resulting from any ideas, methods, instructions or products referred to in the content. |
© 2026 by the authors. Licensee MDPI, Basel, Switzerland. This article is an open access article distributed under the terms and conditions of the Creative Commons Attribution (CC BY) license.